active equity portfolio allocation sensitivity and modern ... · sjk 3/27/2008 active equity...
TRANSCRIPT

SJK 3/27/2008
Active Equity Portfolio AllocationSensitivity and Modern Robust
Risk ModelsSteven J. Kusiak, Ph.D.
21st Annual Northfield Research Conference OlympicValley, CA
27 March 2008

SJK 3/27/2008
Plan of the Talk
1. Provide sharp error analysis (performance bounds)of the fundamental mean-variance efficient portfolioselection problem, exhibit/explain uncertaintyamplification
(10 slides)
2. Introduction to a new (non-stochastic) risk modeland numerical simulation (out of sample) resultscomparing many contemporary methods
(14 slides -- the good stuff!)
1

SJK 3/27/2008
Some Background Material
• Jobson and Korkie (1980) -- Approximate asymptotic series
• Michaud (1989) -- Economic/technical treatment
• Best and Grauer (1991) -- Sensitivity analysis for quad. MV optimization
• Chopra and Ziemba (1993) -- Empirical studies
• Britten-Jones (1999) -- Technical analysis
• Kritzman (2006) -- Empirical studies
2

SJK 3/27/2008
First Motivating ExampleExhibit 1 a(Kritzman, 2006, Historical Data)
Asset AverageHistoricalReturn
HistoricalStandardDeviation
ExpectedReturn
CorrectPortfolioWeights
IncorrectPortfolioWeights
RelativeError
Australia 5.97% 26.55% 6.79%(+1%)
2.46% 11.44% 8.98%
Canada 5.94% 21.81% 4.94% (-1%)
0.74% 0.00% 0.74%
France 6.11% 24.54% 7.11%(+1%)
0.45% 17.72% 17.27%
Germany 6.06% 25.43% 5.06% (-1%)
2.42% 0.00% 2.42%
Japan 6.28% 26.26% 7.28%(+1%)
19.42% 25.19% 5.77%
Switzerland 5.61% 20.47% 4.61% (-1%)
13.40% 0.00% 13.40%
UK 5.92% 21.13% 6.92%(+1%)
8.27% 32.56% 24.29%
US 5.70% 17.21% 4.70% (-1%)
52.85% 13.09% 39.76%
Totalmisallocation 56.32%
3
SJK 3/27/2008
Motivation Continued
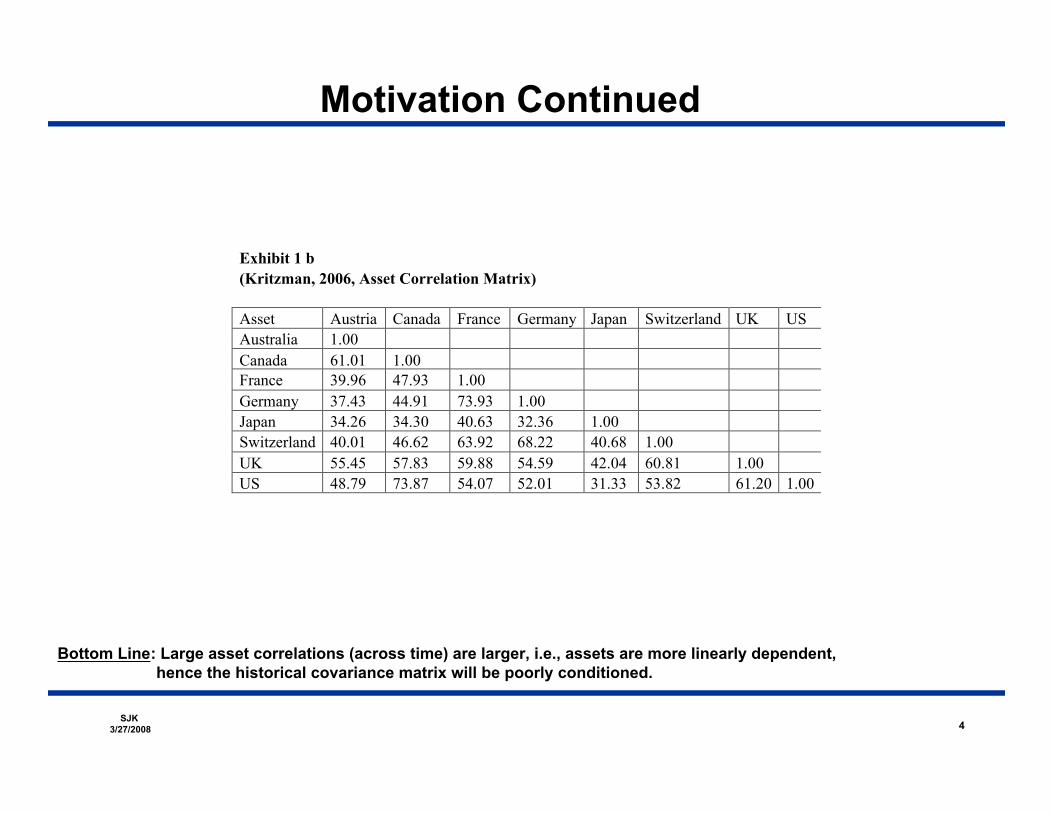
Exhibit 1 b(Kritzman, 2006, Asset Correlation Matrix)
Asset Austria Canada France Germany Japan Switzerland UK USAustralia 1.00Canada 61.01 1.00France 39.96 47.93 1.00Germany 37.43 44.91 73.93 1.00Japan 34.26 34.30 40.63 32.36 1.00Switzerland 40.01 46.62 63.92 68.22 40.68 1.00UK 55.45 57.83 59.88 54.59 42.04 60.81 1.00US 48.79 73.87 54.07 52.01 31.33 53.82 61.20 1.00
4
Bottom Line: Large asset correlations (across time) are larger, i.e., assets are more linearly dependent, hence the historical covariance matrix will be poorly conditioned.
SJK 3/27/2008
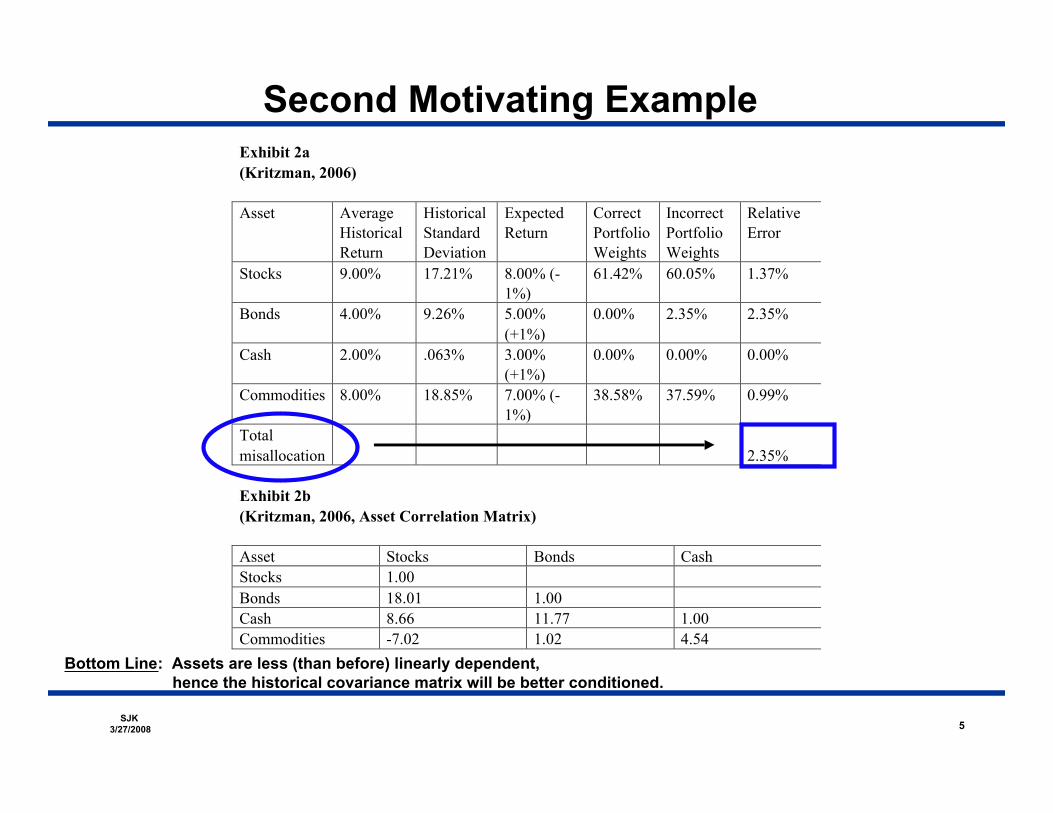
Second Motivating ExampleExhibit 2a(Kritzman, 2006)
Asset AverageHistoricalReturn
HistoricalStandardDeviation
ExpectedReturn
CorrectPortfolioWeights
IncorrectPortfolioWeights
RelativeError
Stocks 9.00% 17.21% 8.00% (-1%)
61.42% 60.05% 1.37%
Bonds 4.00% 9.26% 5.00%(+1%)
0.00% 2.35% 2.35%
Cash 2.00% .063% 3.00%(+1%)
0.00% 0.00% 0.00%
Commodities 8.00% 18.85% 7.00% (-1%)
38.58% 37.59% 0.99%
Totalmisallocation 2.35%
Exhibit 2b(Kritzman, 2006, Asset Correlation Matrix)
Asset Stocks Bonds CashStocks 1.00Bonds 18.01 1.00Cash 8.66 11.77 1.00Commodities -7.02 1.02 4.54
5
Bottom Line: Assets are less (than before) linearly dependent, hence the historical covariance matrix will be better conditioned.

SJK 3/27/2008
Markowitz Mean-Variance Portfolio Selection
6
Goal:
What happens when the return data are “inexact?”
• Statistical Outliers (return = true_data + “market exaggeration”)• Interpolation/Extrapolation Errors• Improper Accounting/Reporting
SJK 3/27/2008
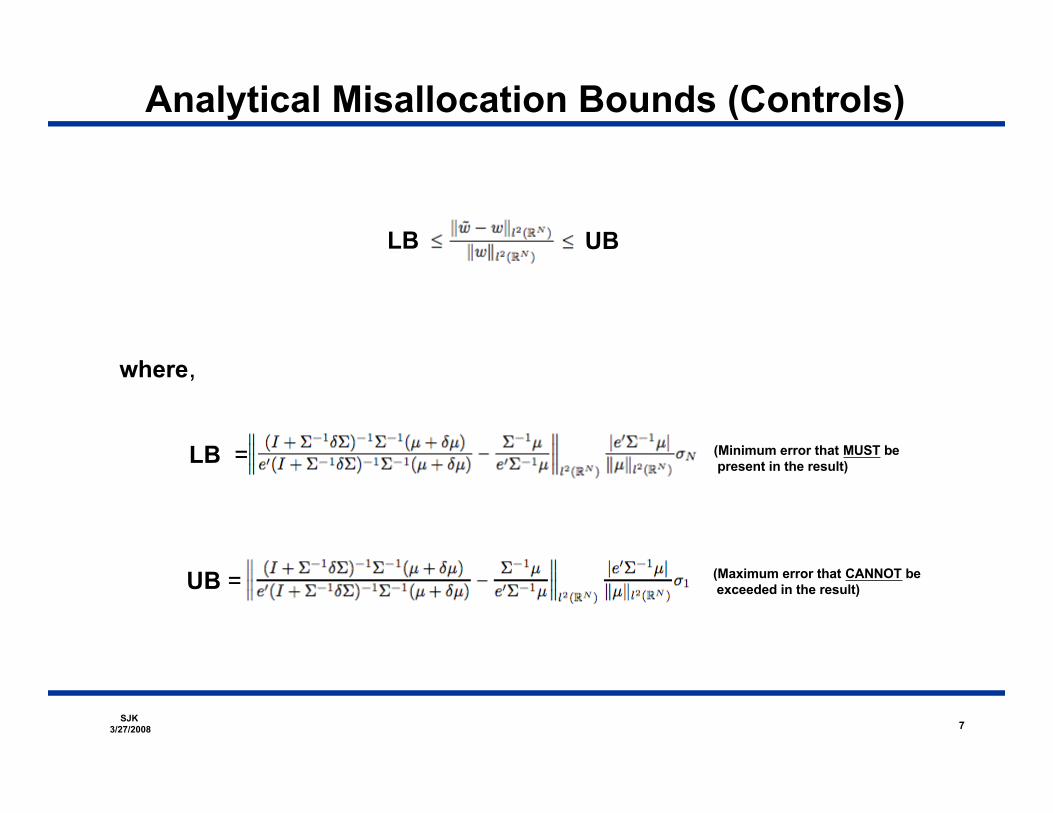
Analytical Misallocation Bounds (Controls)
7
LB UB
where,
LB =
UB =
(Minimum error that MUST be present in the result)
(Maximum error that CANNOT be exceeded in the result)
SJK 3/27/2008
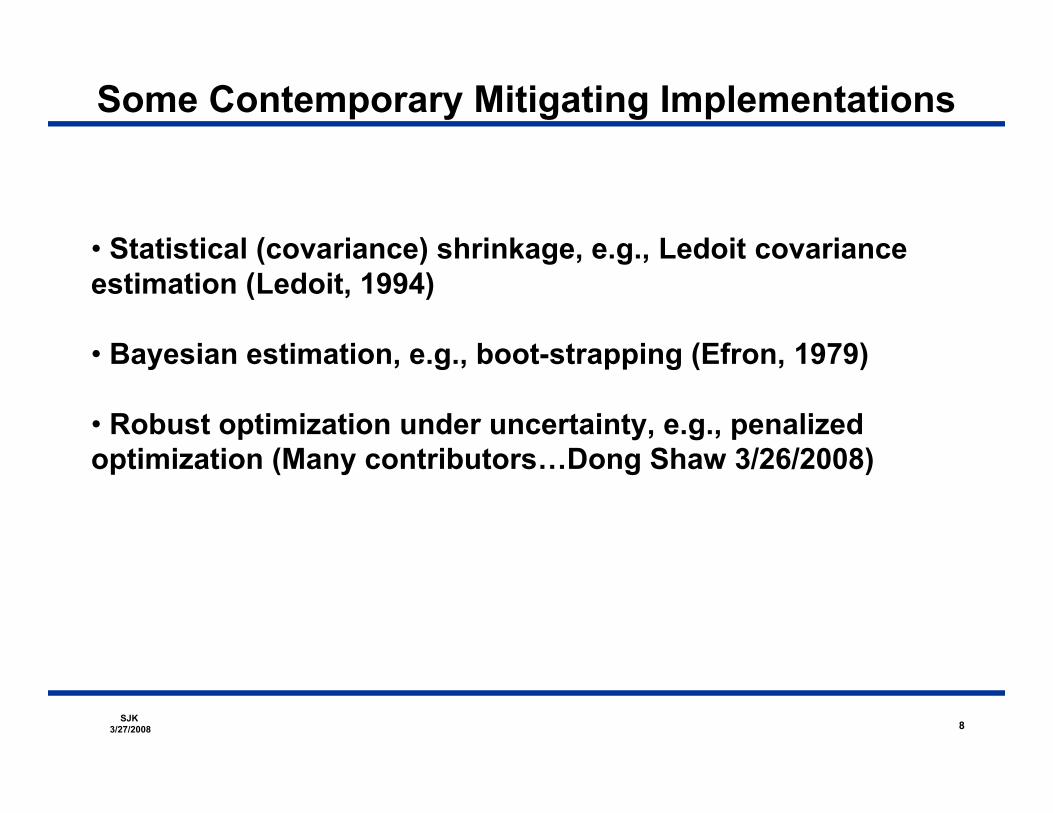
Some Contemporary Mitigating Implementations
• Statistical (covariance) shrinkage, e.g., Ledoit covarianceestimation (Ledoit, 1994)
• Bayesian estimation, e.g., boot-strapping (Efron, 1979)
• Robust optimization under uncertainty, e.g., penalizedoptimization (Many contributors…Dong Shaw 3/26/2008)
8

SJK 3/27/2008 9
Realized and Bounding Errors (5% Additive Noise)*
* Data Source: Dow 30, 8/1996-8/2006 (Sampled Monthly)
Computed Lower Bounds
Computed (Euclidean) Errors
Computed Upper Bounds
Security Information

SJK 3/27/2008
Misallocation Sample Statistics (5% Additive Noise)*
10
50% (2/30)
25% (6/30)
10% (22/30)
* Data Source: Dow 30, 8/1996-8/2006 (Sampled Monthly)
Rel
ativ
e Er
ror (
%)
Security Number Security Number
STDEV of Relative Error (%) Mean Relative Error (%)

SJK 3/27/2008
Generalization: Constrained Misallocation Bounds
11
1) Solve,
2) Solve,
3) Sensitivity analysis (Best and Grauer),

SJK 3/27/2008
Alternative Risk Assessment
Variance (Traditional, Industry Standard)
Total Variation (Robust Alternative)
12
SJK 3/27/2008
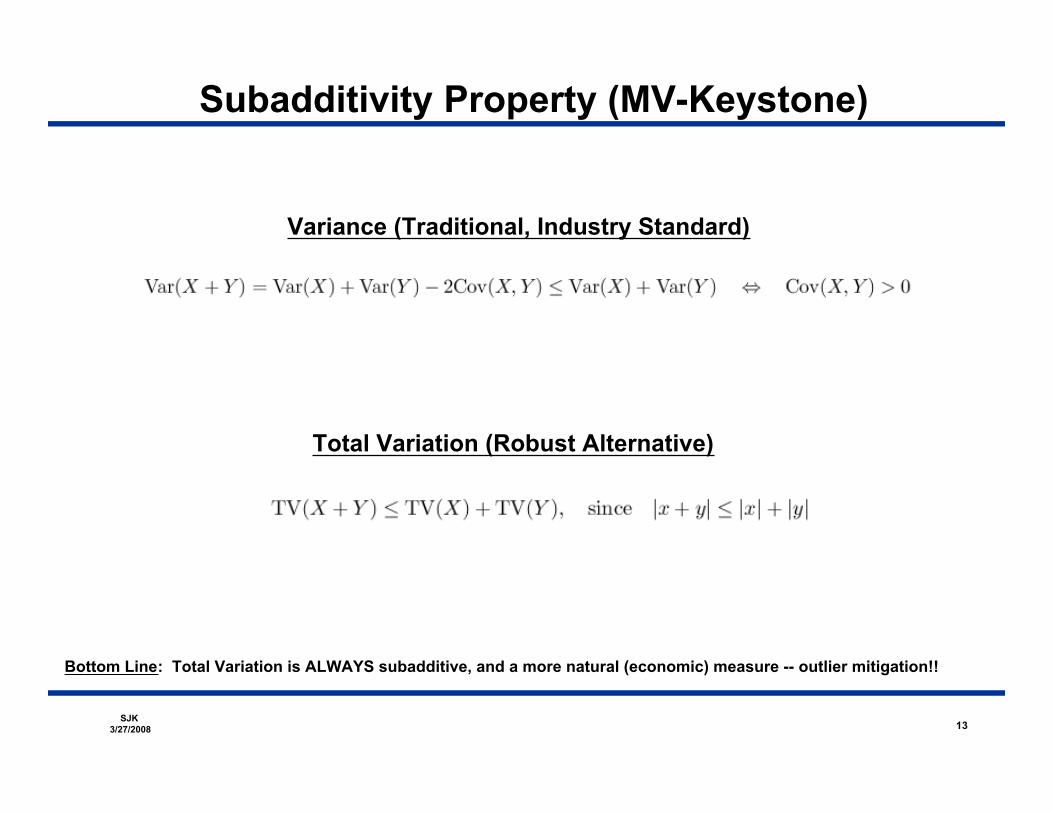
Subadditivity Property (MV-Keystone)
Variance (Traditional, Industry Standard)
Total Variation (Robust Alternative)
13
Bottom Line: Total Variation is ALWAYS subadditive, and a more natural (economic) measure -- outlier mitigation!!

SJK 3/27/2008
Dow 30 Performance Spanning 8/96-8/06*
9/11
Historical (Sample) Window = 60 months
Rebalance Period = 3 Months
14
* Data Source: Google Finance
SJK 3/27/2008
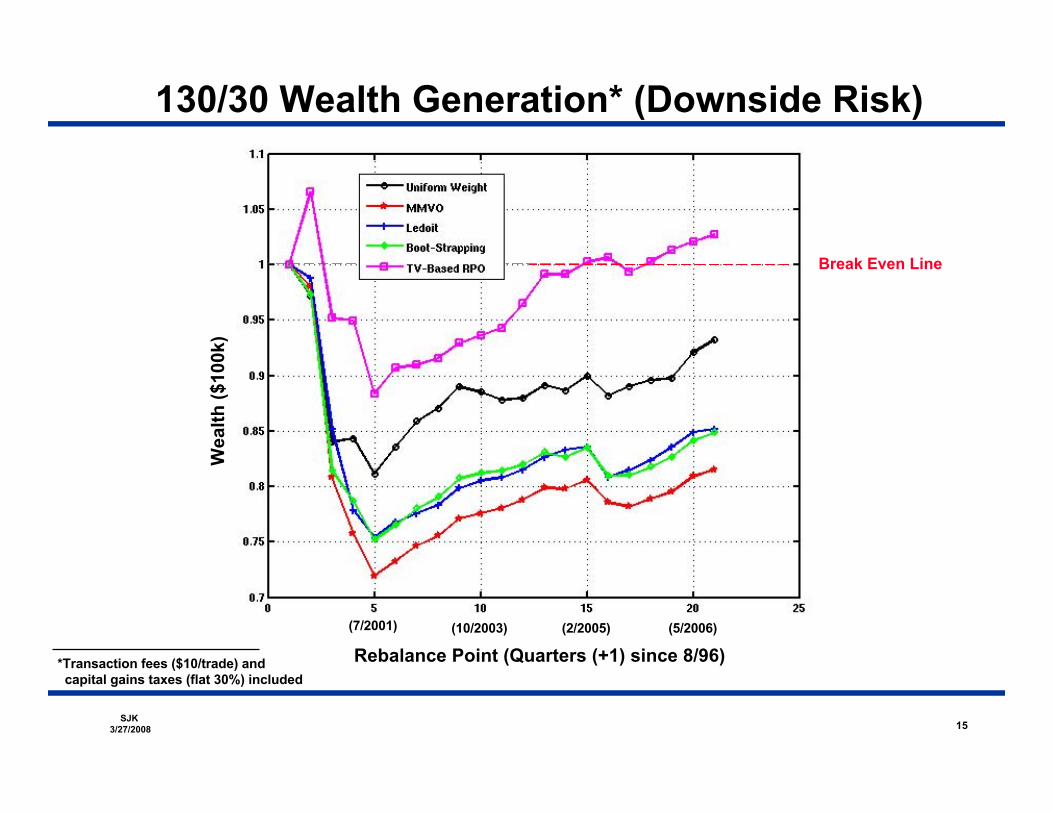
130/30 Wealth Generation* (Downside Risk)
Wea
lth ($
100k
)
Break Even Line
15
*Transaction fees ($10/trade) and capital gains taxes (flat 30%) included
Rebalance Point (Quarters (+1) since 8/96)(7/2001) (10/2003) (2/2005) (5/2006)

SJK 3/27/2008
130/30 Wealth Generation Portfolios
Rebalance Point (Quarters (+1) since 8/96)
Secu
rity
Num
ber
16
Bud
gete
d A
lloca
tion
(%)
SJK 3/27/2008
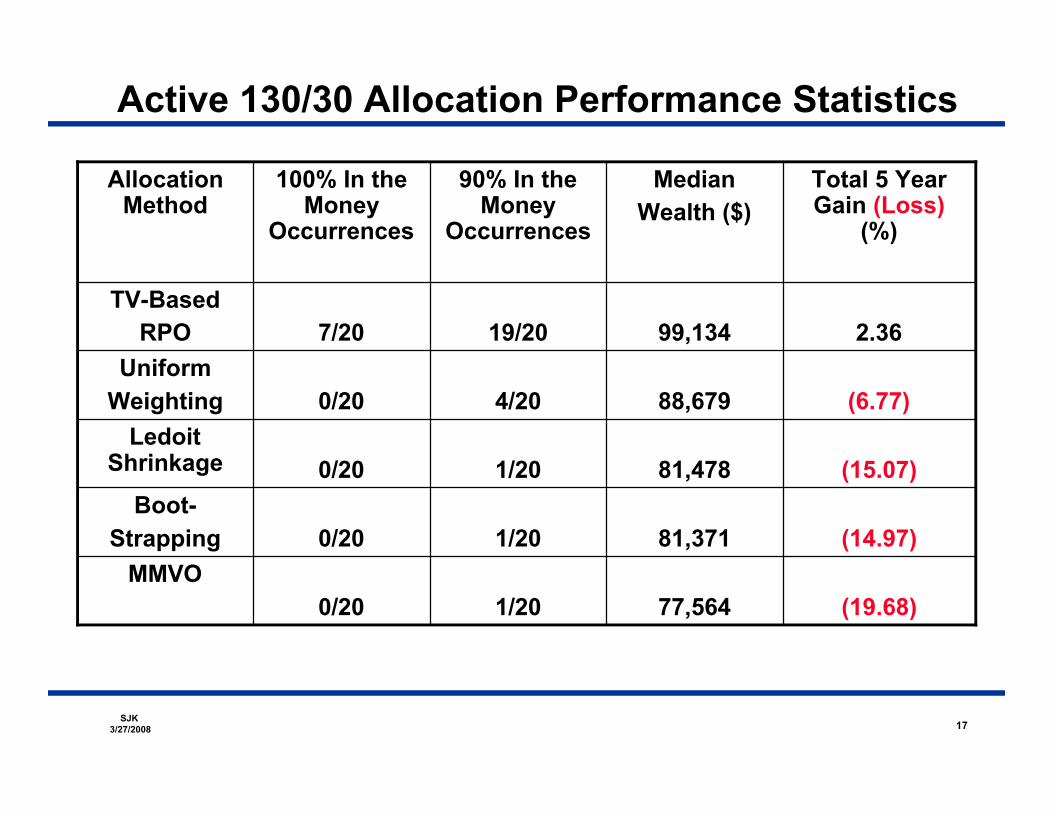
Active 130/30 Allocation Performance Statistics
1/20
1/20
1/20
4/20
19/20
90% In theMoney
Occurrences
77,564
81,371
81,478
88,679
99,134
MedianWealth ($)
(19.68)0/20MMVO
(14.97)0/20Boot-
Strapping
(15.07)0/20Ledoit
Shrinkage
(6.77)0/20Uniform
Weighting
2.367/20TV-Based
RPO
Total 5 YearGain (Loss)
(%)
100% In theMoney
Occurrences
AllocationMethod
17
SJK 3/27/2008
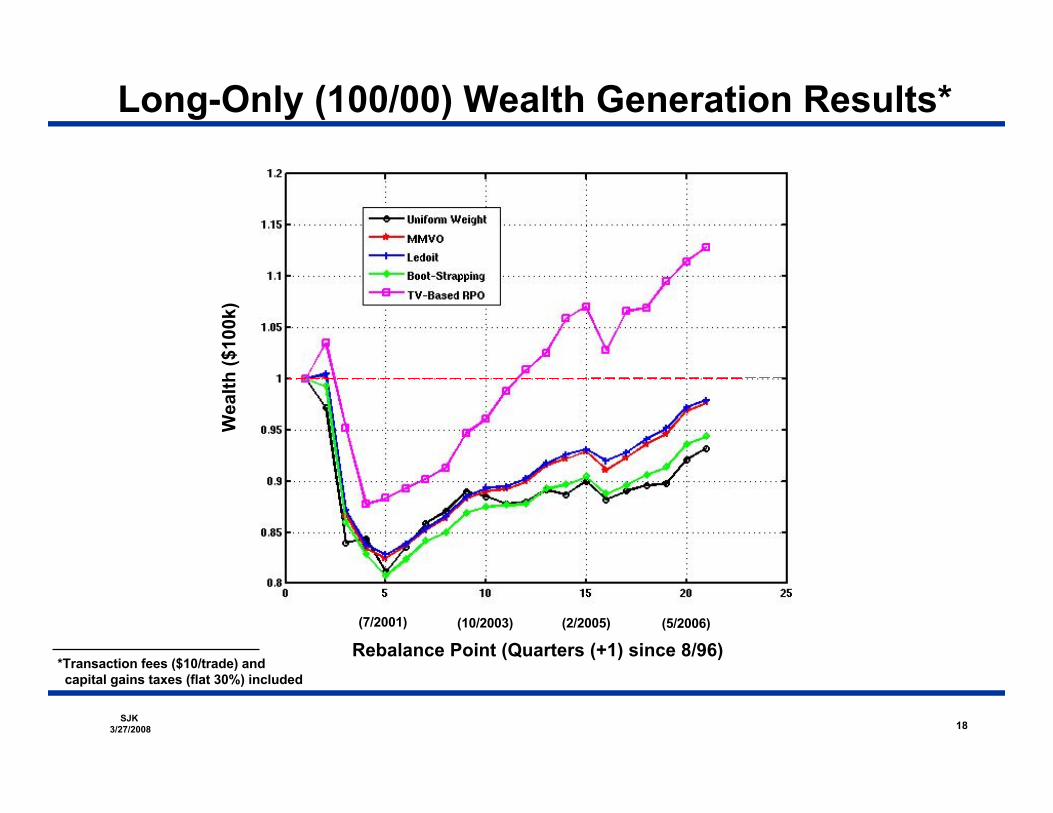
Long-Only (100/00) Wealth Generation Results*
Rebalance Point (Quarters (+1) since 8/96)
Wea
lth ($
100k
)
18
*Transaction fees ($10/trade) and capital gains taxes (flat 30%) included
(7/2001) (10/2003) (2/2005) (5/2006)

SJK 3/27/2008
100/00 Allocation Performance Statistics
13/20
12/20
13/20
2/20
17/20
90% In theMoney
Occurrences
91,069
89,882
91,768
88,679
100,872
MedianWealth ($)
(2.35)1/20MMVO
(5.10)1/20Boot-
Strapping
(2.06)1/20Ledoit
Shrinkage
(6.77)0/20Uniform
Weighting
12.8311/20TV-Based
RPO
Total 5 YearGain (Loss)
(%)
100% In theMoney
Occurrences
AllocationMethod
19

SJK 3/27/2008
100/00 Allocation Performance Statistics(300 Random Back-Tests: 30 Equity Assets Drawn From the S&P 500)*
94,734 (5,266)
95,108 (4,892)
94,213 (5,787)
93,091 (6,909)
101,725 (1,725)
Mean SampleWealth ($)
Initial Investment$100,000
737MMVO
695Boot-
Strapping
797Ledoit
Shrinkage
927Uniform
Weighting
N/ATV-Based
RPO
Relative TV-BasedRPO Gain
(Basis Points)
Allocation Method
20
*Transaction fees ($10/trade) and capital gains taxes (flat 30%) included, 60 month window, quarterly rebalancing, dates: 08/96-08/06

SJK 3/27/2008
Long-Only (100/00) 100 Assets (1st 100 S&P500)
Rebalance Point (Quarters since 8/96)
21
*Transaction fees ($10/trade) and capital gains taxes (flat 30%) included
20/20
15/20
18/20
17/20
20/20
90% In theMoney
Occurrences
98,815
93,010
96,150
98,764
99,774
MedianWealth ($)
4.9812/20MMVO
(2.90)2/20Boot-
Strapping
0.973/20Ledoit
Shrinkage
3.899/20Uniform
Weighting
5.6412/20TV-Based
RPO
Total 5 YearGain (Loss)
(%)
100% In theMoney
Occurrences
AllocationMethod
Wea
lth ($
100k
)
(7/2001) (10/2003) (2/2005) (5/2006)
TV-Based Traded Active Portfolio Uniform Portfolio
Rebalance PointRebalance Point
Port
folio
Com
posi
tion
SJK 3/27/2008
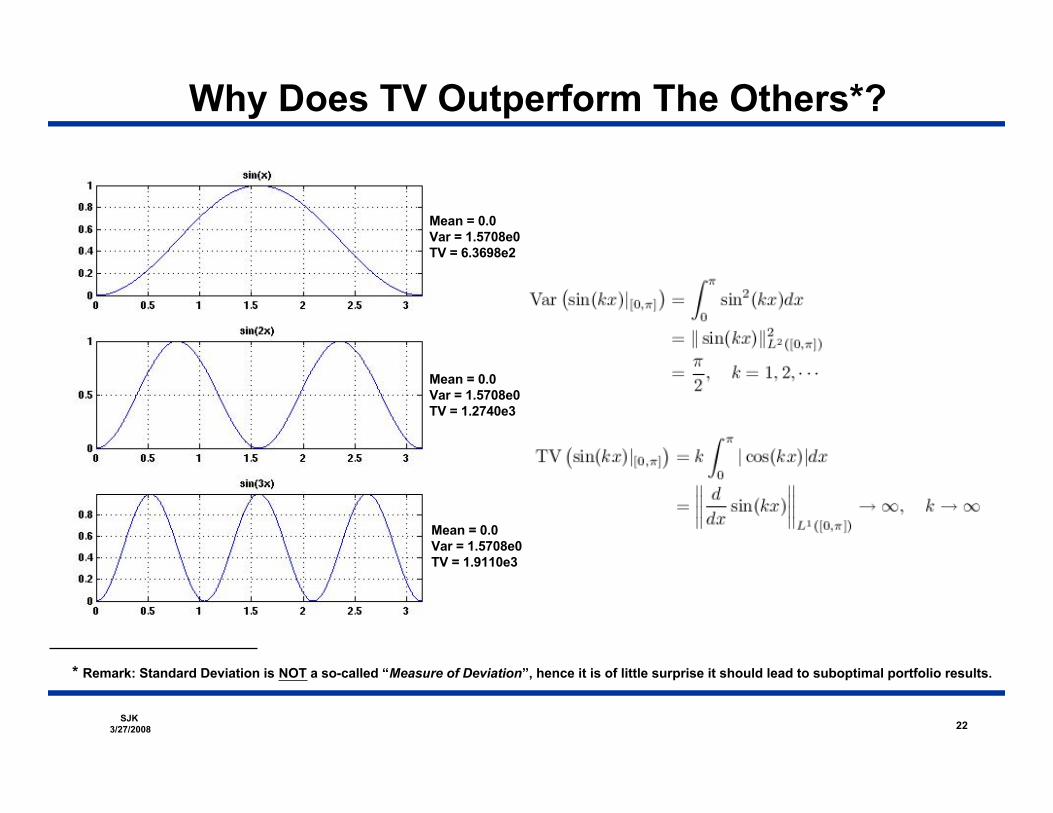
Why Does TV Outperform The Others*?
22
Mean = 0.0Var = 1.5708e0TV = 6.3698e2
Mean = 0.0Var = 1.5708e0TV = 1.2740e3
Mean = 0.0Var = 1.5708e0TV = 1.9110e3
* Remark: Standard Deviation is NOT a so-called “Measure of Deviation”, hence it is of little surprise it should lead to suboptimal portfolio results.

SJK 3/27/2008
Running Dow 30 Statistics*
*Rebalance Point (Quarters (+1) since 08/1996)
23
Historical Moving Mean Historical Moving STDEV
Historical Moving Skewness Historical Moving Kurtosis
Secu
rity
Num
ber
Rebalance Point Rebalance Point
Secu
rity
Num
ber

SJK 3/27/2008
Historical Dow 30 Statistics*
*Rebalance Point (Quarters (+1) since 08/1996)
Mean: 0.0075 Mean: 0.0914
Mean: 0.1455 Mean: 4.0340 =14 x (3 x mean STDEV )
24
Historical Sample Skewness
Historical Sample Mean Historical Sample STDEV
Historical Sample Kurtosis

SJK 3/27/2008
Summary• MMVO performance under uncertainty can be analytically
characterized and sharply controlled -- the theory of ill-posed inverse problems brings much to bear on modernquantitative finance
• Many current regularization (stabilization) techniques canimprove the (highly variable) performance of MMVO withimperfect data
• MMVO, and stabilized versions of it, can be surpassed inperformance in large measure (>600 basis points on 10year SP500 average) with insightful novel techniques suchas those (risk-) based on Total Variation (non-stochastic)
• Equity security data are often not normally distributed, norstationary in time
25
SJK 3/27/2008
References
26
[1] Grinold, R., and Kahn, R., Active Portfolio Management, 2nd ed. New York:MacGraw-Hill, 2000.
[2] Jobson, J.D., and Korkie, B., Estimation for Markowitz efficient portfolios, Journal ofthe American Statistical Association, Vol. 75, No. 371. (scp., 1980), pp. 544-554.
[3] Meucci, A., Risk and asset allocation, Springer Finance, Springer-Verlag, 2005.
[4] Kress, R., Numerical Analysis, Graduate Texts in Mathematics, 181, Springer-Verlag,1998.
[5] Kritzman, M., Are optimizers error maximizers? , The Journal of PortfolioManagement, Summer 2006, pp. 66-69.
[6] Kusiak, S., Sharp error analysis in unconstrained Markowitz mean-variance efficientportfolio selection, In review