active distribution network (adine) - epri | smartgrid ...smartgrid.epri.com/doc/11_sg post...
TRANSCRIPT
Active Distribution Network Active Distribution Network (ADINE) (ADINE) Modeling and realModeling and real‐‐time simulationtime simulation
Sami RepoDr.Tech., Associate professorTampere University of Technology, [email protected]
4th International Conference on Integration of Renewable and Distributed Energy ResourcesDecember 6-10, 2010Albuquerque, NM, USA
Conference Sponsors Associate Sponsors

4th International Conference on Integration of Renewable and Distributed Energy Resources
ContentsContents
• Real‐time digital simulations with RTDS
• Combination of RTDS and dSPACE simulations
• Example of “ideal” simulation sequence
• Interaction simulation
22

4th International Conference on Integration of Renewable and Distributed Energy Resources
Hardware in loop testingHardware in loop testing
33
4th International Conference on Integration of Renewable and Distributed Energy Resources
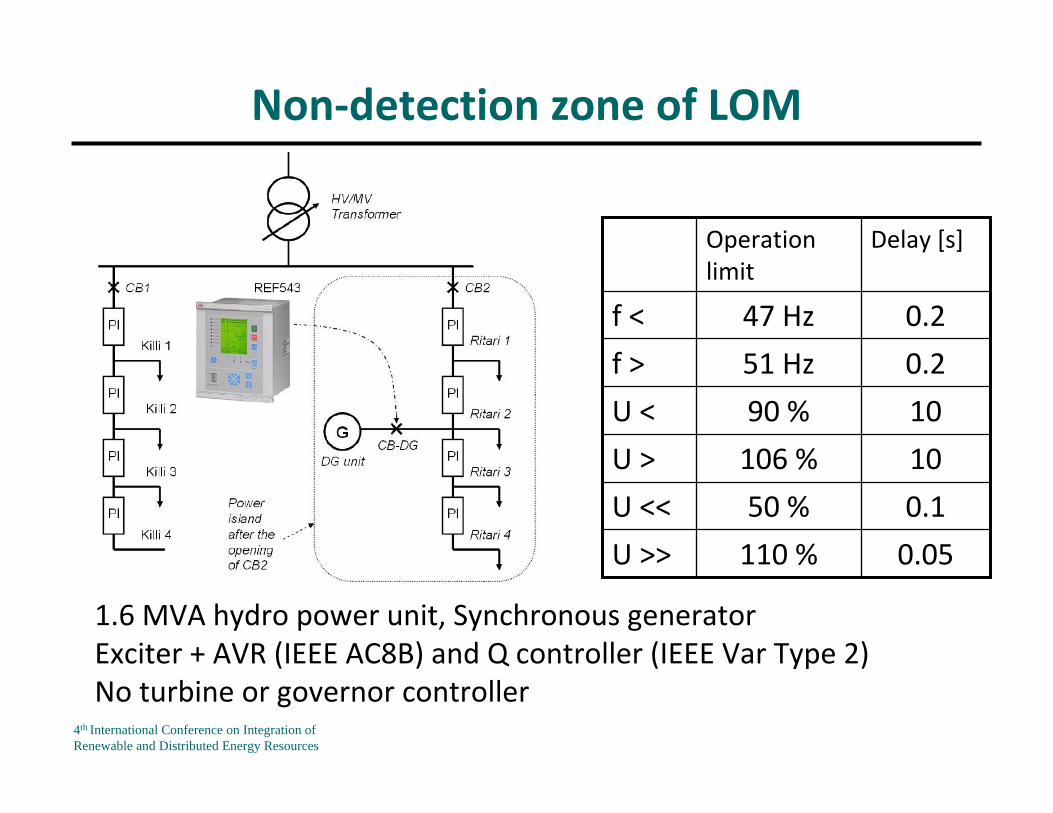
Non‐detection zone of LOM
0.05110 %U >>
0.150 %U <<
10106 %U >
1090 %U <
0.251 Hzf >
0.247 Hzf <
Delay [s]Operation limit
1.6 MVA hydro power unit, Synchronous generatorExciter + AVR (IEEE AC8B) and Q controller (IEEE Var Type 2)No turbine or governor controller
4th International Conference on Integration of Renewable and Distributed Energy Resources
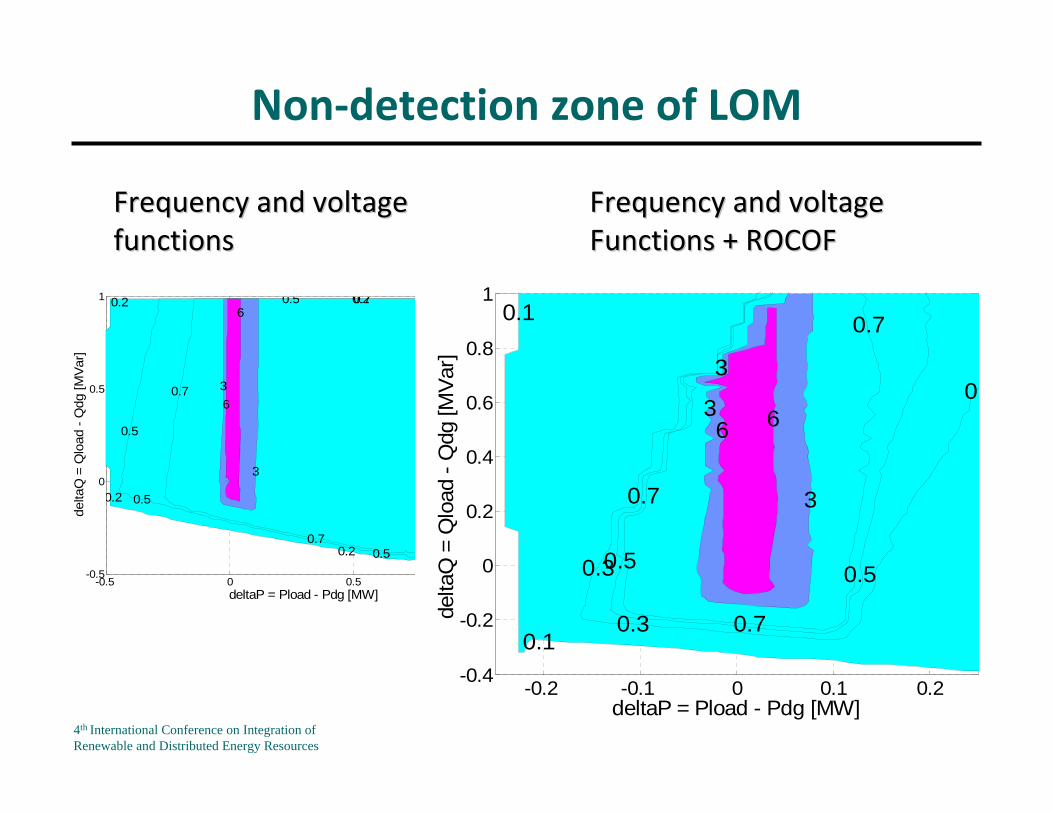
Non‐detection zone of LOM
-0.5 0 0.5 1-0.5
0
0.5
1
deltaP = Pload - Pdg [MW]
delta
Q =
Qlo
ad -
Qdg
[MVa
r]
0.2 0.2
0.2
0.2
0.2
0.5
0.5
0.5
0.5
0.5
0.7
0.7
0.7
0.7
3
3
6
6
-0.2 -0.1 0 0.1 0.2-0.4
-0.2
0
0.2
0.4
0.6
0.8
1
deltaP = Pload - Pdg [MW]
delta
Q =
Qlo
ad -
Qdg
[MVa
r]
0.1
0.1
0.3
0
0.3
0.5 0.5
0.7
0.7
0.7
3
3
3 66
Frequency and voltageFrequency and voltagefunctionsfunctions
Frequency and voltageFrequency and voltageFunctions + ROCOFFunctions + ROCOF
4th International Conference on Integration of Renewable and Distributed Energy Resources
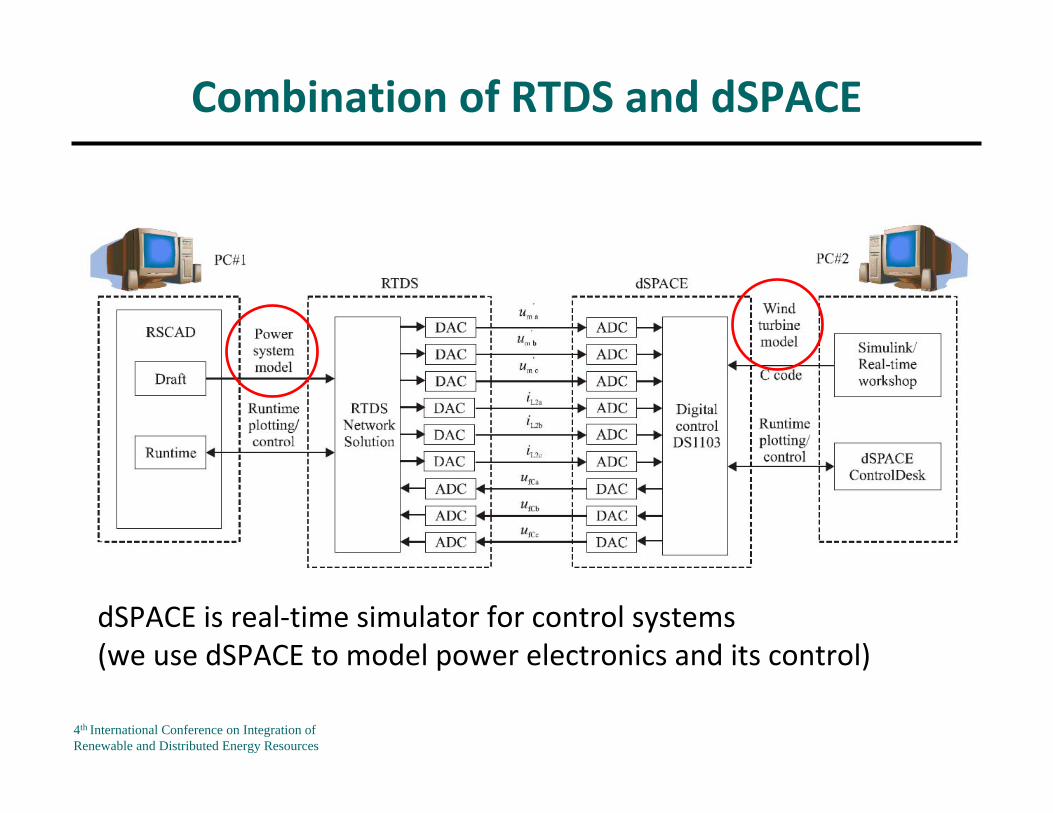
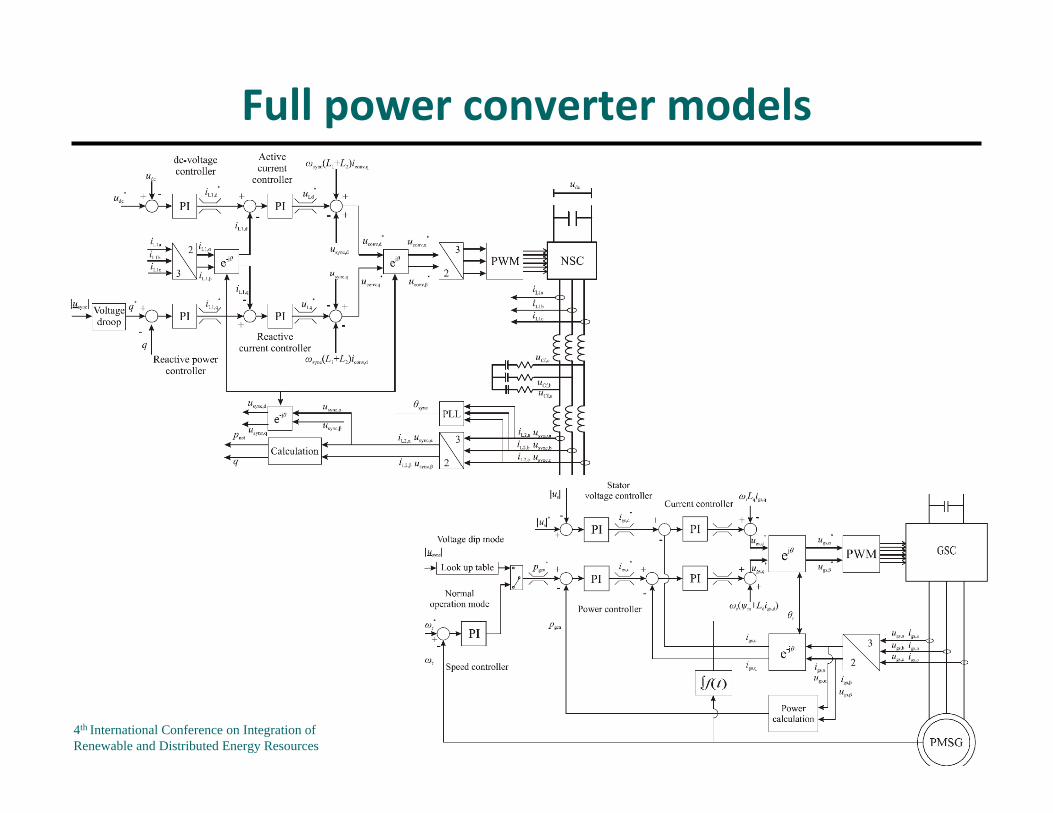
Combination of RTDS and dSPACE
dSPACE is real‐time simulator for control systems (we use dSPACE to model power electronics and its control)
4th International Conference on Integration of Renewable and Distributed Energy Resources
Full power converter models
4th International Conference on Integration of Renewable and Distributed Energy Resources
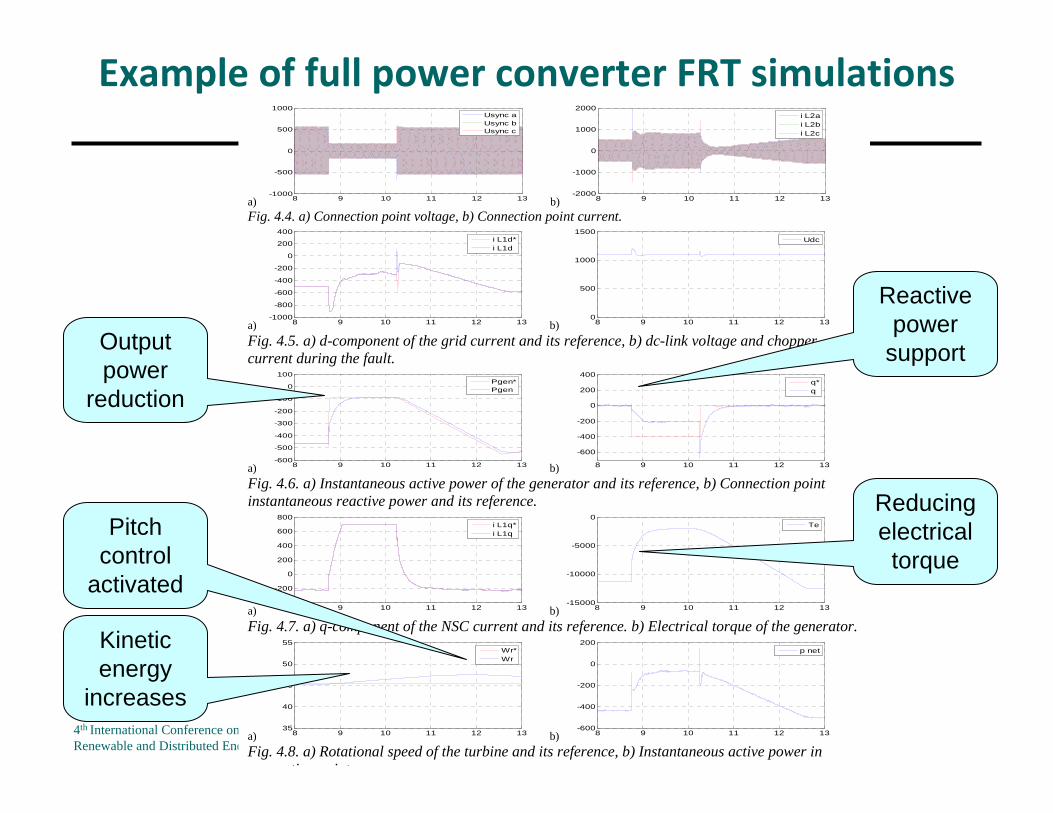
Example of full power converter FRT simulations
a) 8 9 10 11 12 13-1000
-500
0
500
1000
Usync aUsync bUsync c
b) 8 9 10 11 12 13-2000
-1000
0
1000
2000
i L2ai L2bi L2c
Fig. 4.4. a) Connection point voltage, b) Connection point current.
a) 8 9 10 11 12 13-1000
-800
-600
-400
-200
0
200
400
i L1d*i L1d
b) 8 9 10 11 12 130
500
1000
1500
Udc
Fig. 4.5. a) d-component of the grid current and its reference, b) dc-link voltage and chopper current during the fault.
a) 8 9 10 11 12 13-600
-500
-400
-300
-200
-100
0
100
Pgen*Pgen
b) 8 9 10 11 12 13
-600
-400
-200
0
200
400
q*q
Fig. 4.6. a) Instantaneous active power of the generator and its reference, b) Connection point instantaneous reactive power and its reference.
a) 8 9 10 11 12 13-400
-200
0
200
400
600
800
i L1q*i L1q
b) 8 9 10 11 12 13-15000
-10000
-5000
0
Te
Fig. 4.7. a) q-component of the NSC current and its reference. b) Electrical torque of the generator.
a) 8 9 10 11 12 1335
40
45
50
55
Wr*Wr
b) 8 9 10 11 12 13-600
-400
-200
0
200
p net
Fig. 4.8. a) Rotational speed of the turbine and its reference, b) Instantaneous active power in
ti i t
Output power
reduction
Reactive power
support
Reducing electrical
torque
Kinetic energy
increases
Pitch control
activated
4th International Conference on Integration of Renewable and Distributed Energy Resources
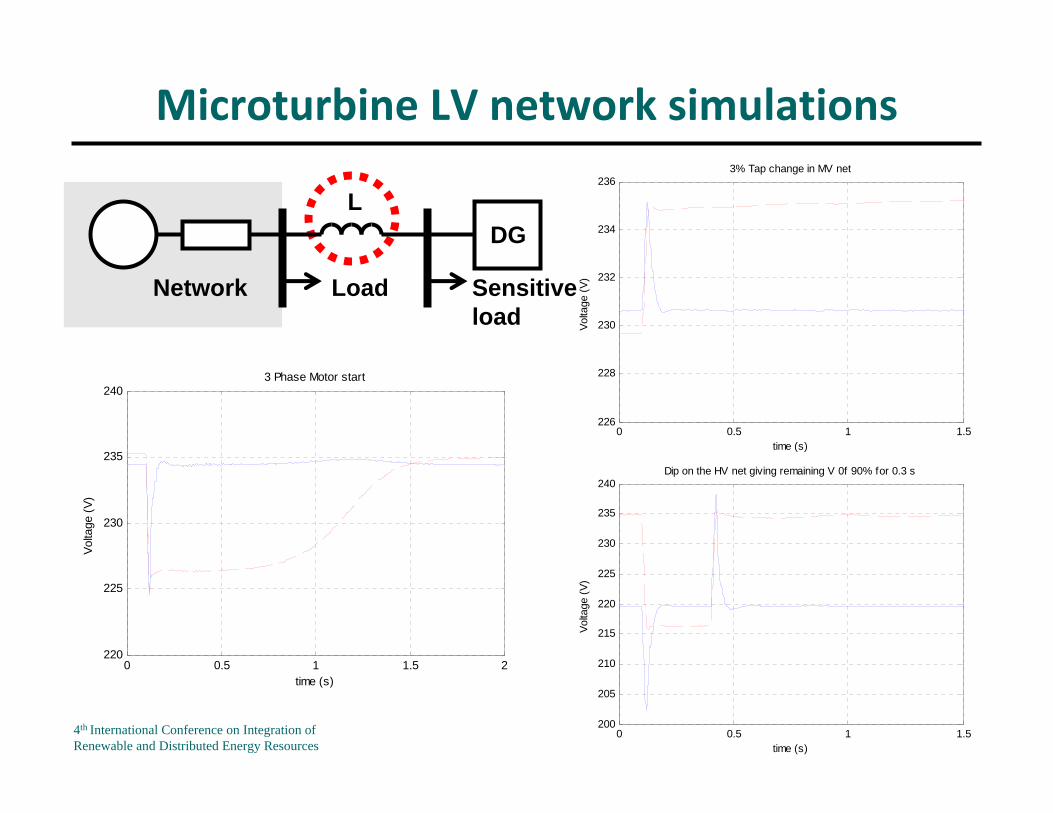
Microturbine LV network simulations
0 0.5 1 1.5 2220
225
230
235
240
time (s)
Volta
ge (V
)
3 Phase Motor start
0 0.5 1 1.5226
228
230
232
234
2363% Tap change in MV net
time (s)
Volta
ge (V
)Network
DGL
Load Sensitiveload
0 0.5 1 1.5200
205
210
215
220
225
230
235
240Dip on the HV net giving remaining V 0f 90% for 0.3 s
time (s)
Volta
ge (V
)

4th International Conference on Integration of Renewable and Distributed Energy Resources
CoCo‐‐ordinatedordinated voltage controlvoltage control
1010
Hydro power plant
OPC: Measurements
SCADA DMSCommands
Matlab
State estimation
Coordinatedvoltage control Operator
AVR
AVC relay
Setting values
110 / 20 kV substation

4th International Conference on Integration of Renewable and Distributed Energy Resources
Loadflow studies
20 40 60 80 100 120 140 1600
500
1000
1500
2000
2500
3000
Time [h]P
ower
[kW
]
Wind, no controlWind, control 3 MW, no control
20 40 60 80 100 120 140 16020
20.2
20.4
20.6
20.8
21
21.2
21.4
21.6
21.8
22
Time [h]
Vol
tage
[kV
]
No production Wind, no controlWind, control 3 MW, no control
Voltage at wind farmconnection point
Wind power production

4th International Conference on Integration of Renewable and Distributed Energy Resources
Benefits of co‐ordination
0
500
1000
1500
2000
2500
3000
364 473 572 690 825 992 1174
Loading of Kasnäs feeder [kW]
Net
wor
k tra
nsfe
r cap
abilit
y [k
W]
Unity power factor, FlexibleLocal voltage control, FlexibleCo-ordinated control, FlexibleUnity power factor, FixedLocal voltage control, FixedCo-ordinated control, Fixed
4th International Conference on Integration of Renewable and Distributed Energy Resources
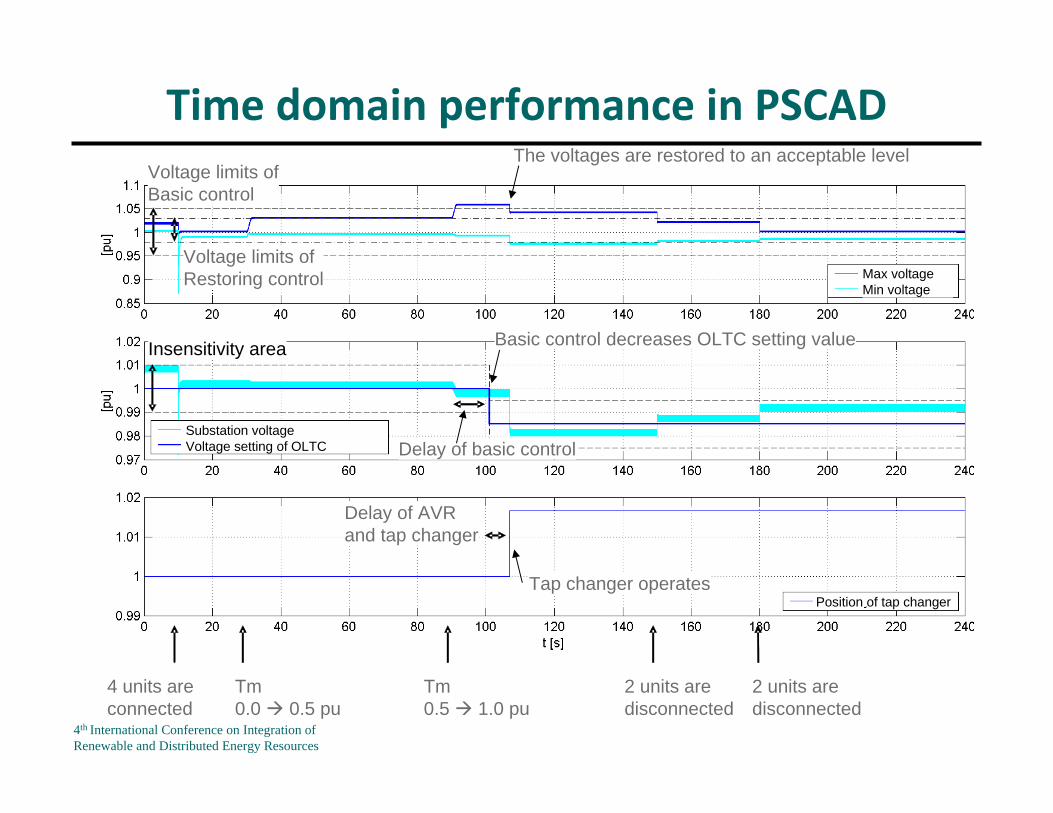
Time domain performance in PSCAD
4 units areconnected
Tm0.0 0.5 pu
2 units aredisconnected
2 units aredisconnected
Voltage limits ofBasic control
Voltage limits ofRestoring control
Insensitivity area
The voltages are restored to an acceptable level
Basic control decreases OLTC setting value
Delay of basic control
Position of tap changer
Substation voltageVoltage setting of OLTC
Max voltageMin voltage
Tm0.5 1.0 pu
Delay of AVR and tap changer
Tap changer operates

4th International Conference on Integration of Renewable and Distributed Energy Resources
RTDS testing of control algorithm
0 20 40 60 80 100 120 140 160 180 200 220 240 260 280 300 320 340 360 3800.95
1.0
1.05
1.1
[pu]
Maximum voltage Minimum voltage Generator voltage
0 20 40 60 80 100 120 140 160 180 200 220 240 260 280 300 320 340 360 3800.95
1
1.05
[pu]
Substation voltage Voltage set point of OLTC
Voltage limits ofrestoring control
Voltage limits of basic control
AVC relaydeadband Basic control decreases
AVC set point
Network voltages are restoredto an acceptable level
Tap changer operatesRestoring control increasesAVC set point

4th International Conference on Integration of Renewable and Distributed Energy Resources
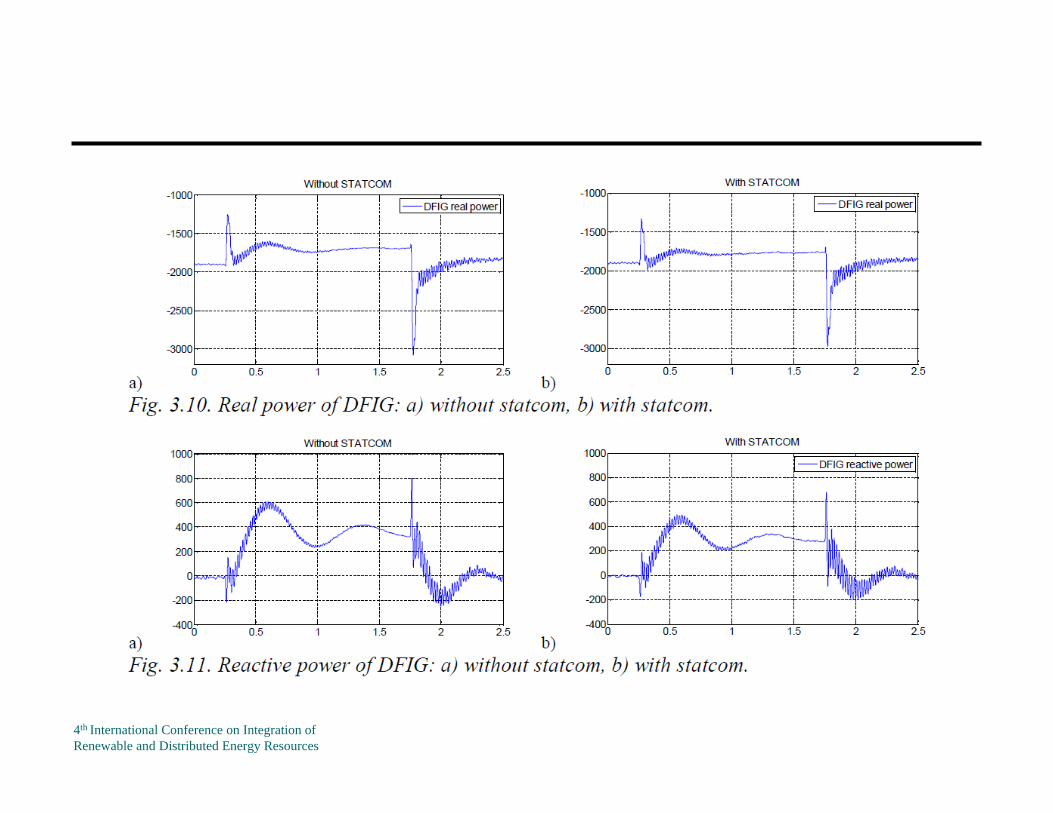
Interactions of STATCOM and DFIG wind turbine
4th International Conference on Integration of Renewable and Distributed Energy Resources

4th International Conference on Integration of Renewable and Distributed Energy Resources
4th International Conference on Integration of Renewable and Distributed Energy Resources
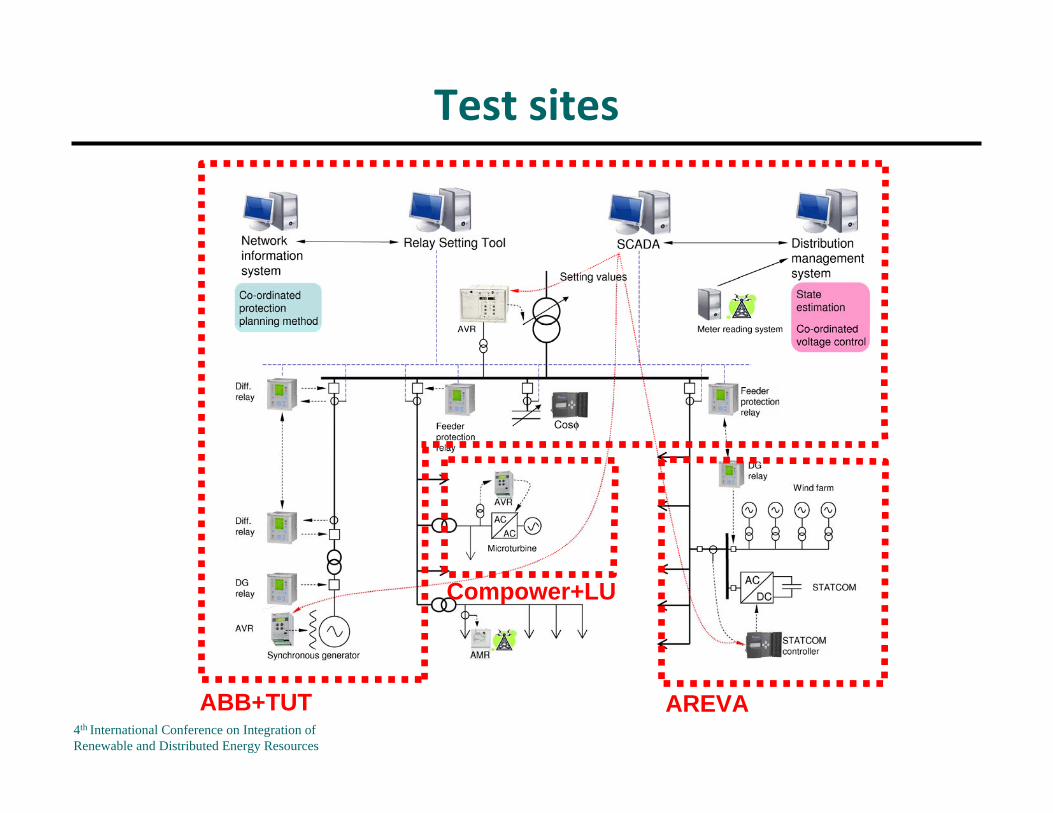
Test sites
ABB+TUT AREVA
Compower+LU
4th International Conference on Integration of Renewable and Distributed Energy Resources
Thank you!
www.adine.fi
1919
ADINE is a project co‐funded by the European Commission