active ageing and solidarity between generations 2012 edition a statistical portrait of the...
TRANSCRIPT
7/31/2019 Active ageing and solidarity between generations 2012 edition A statistical portrait of the European Union 2012
http://slidepdf.com/reader/full/active-ageing-and-solidarity-between-generations-2012-edition-a-statistical 1/147
Statistical books
Active ageing andsolidarity between generations
2012 edition
A statistical portrait of the European Union 2012
ISSN 1830-7906

7/31/2019 Active ageing and solidarity between generations 2012 edition A statistical portrait of the European Union 2012
http://slidepdf.com/reader/full/active-ageing-and-solidarity-between-generations-2012-edition-a-statistical 2/147

7/31/2019 Active ageing and solidarity between generations 2012 edition A statistical portrait of the European Union 2012
http://slidepdf.com/reader/full/active-ageing-and-solidarity-between-generations-2012-edition-a-statistical 3/147
Statistical books
Active ageing andsolidarity between generations
A statistical portrait of the European Union 2012
2012 edition
7/31/2019 Active ageing and solidarity between generations 2012 edition A statistical portrait of the European Union 2012
http://slidepdf.com/reader/full/active-ageing-and-solidarity-between-generations-2012-edition-a-statistical 4/147
Europe Direct is a service to help you fnd answers
to your questions about the European Union.
Freephone number (*):
00 800 6 7 8 9 10 11(*) Certain mobile telephone operators do not allow access to 00 800 numbers or these calls may be
billed.
More inormation on the European Union is available on the Internet (http://europa.eu).
Cataloguing data can be ound at the end o this publication.
Luxembourg: Publications Ofce o the European Union, 2011
ISBN 978-92-79-21507-0ISSN 1830-7906
doi:10.2785/17758
Cat. No KS-EP-11-001-EN-C
Theme: Population and social conditions
Collection: Statistical books
© European Union, 2011
Reproduction o content other than photos is authorised, provided that the source is acknowledged.
Photo credits: © Shutterstock
Reproduction o photos is allowed or non-commercial purposes and within the sole context o this publication.
Printed in Belgium
Printed on elemental chlorine-free bleached PaPer (ecf)

7/31/2019 Active ageing and solidarity between generations 2012 edition A statistical portrait of the European Union 2012
http://slidepdf.com/reader/full/active-ageing-and-solidarity-between-generations-2012-edition-a-statistical 5/147
3 Active ageing and solidarity between generations — a statistical portrait of the European Union 2012
Foreword
Foreword
In response to the demographicchallenge which all EU Member
States are acing, the EuropeanUnion has designated 2012 as theEuropean Year or Active Ageingand Solidarity between Generations.Active ageing is dened by the WorldHealth Organisation as the process o optimising opportunities or health,participation and security in order toenhance quality o lie as people age.
Eurostat is marking the EuropeanYear 2012 by presenting in this book statistics on topics related to Active Ageing and Solidarity between Generations, such asdemography, healthcare, pensions, volunteering and adult learning.
Tis publication has been produced in collaboration with the Directorate-General orEmployment, Social Aairs and Inclusion and Euroound, the European Foundation or theImprovement o Living and Working Conditions.
I hope that you will nd inormation o interest both or your work and or your daily lie.
I wish you an enjoyable reading experience!
Walter Radermacher
Director-General, Eurostat
Chie Statistician o the European Union
7/31/2019 Active ageing and solidarity between generations 2012 edition A statistical portrait of the European Union 2012
http://slidepdf.com/reader/full/active-ageing-and-solidarity-between-generations-2012-edition-a-statistical 6/147
4 Active ageing and solidarity between generations — a statistical portrait of the European Union 2012
ACTIVE AGEING AND SOLIDARITY BETWEEN GENERATIONS –
A STATISTICAL PORTRAIT OF THE EUROPEAN UNION 2012
Editorial team Peter Paul Borg, Hartmut Buchow, Elodie Cayotte, Arturo de la Fuente Nuño, Bart de Norre,Gerard Hanney-Labastille, Diana Ivan, Annika Johansson, Dorota Kawiorska, Denis Leythienne,Monica Marcu, Jukka Piirto, Anna Rybowska, Fabio Sartori, Heidi Seybert, Ceri Tompson,Ulrich Wieland.
It would not have been possible to produce the publication without editorial assistance romother European Commission Directorate-Generals and EU agencies, and in particular: Heli Saijets, Monika Federowicz, Detle Gerhardt, Ral Jacob, Ettore Marchetti, Sven Matzke, Eric Meyermans,Andreas Schweitzer, Céline Tevenot (all Directorate-General or Employment, Social Aairs andInclusion), Hans Dubois (Euroound, the European Foundation or the Improvement o Livingand Working Conditions), Dominik Sobczak (Directorate-General or Research and Innovation),
Michele Zagordo (Directorate-General or Health and Consumers), Peter Wintlev-Jensen(Directorate-General or Inormation Society and Media), Ana Xavier, Per Eckeeldt,Robert Voelter (all Directorate-General or Economic and Financial Aairs).
Production
INFORMA sàrl ([email protected]): Giovanni Albertone, Simon Allen, Andrew Redpath
Data coverage, symbols and direct links to Eurostat’s database
Te data presented within this publication were largely extracted during July / August 2011;a small amount o data was updated/revised during the autumn o 2011.An italic ont has been used in statistical tables to denote any data that may change in the uture
(estimates, provisional data or orecasts).Te colon (:) is used to denote inormation that is not available.A dash (-) is used to denote inormation that is not applicable.An online data code available under each table/gure can be used to directly access the most recentdata on Eurostat’s website, at:http://epp.eurostat.ec.europa.eu/portal/page/portal/statistics/search_database
For more informationEurostat,Bâtiment Joseph Bech,
5 rue Alphonse Weicker2721 Luxembourghttp://ec.europa.eu/eurostatE-mail: [email protected]
All statements on policies within this publication are given or inormation purposes only. Tey donot constitute an ocial policy position o the European Commission and are not legally binding.
o know more about such policies, please consult the European Commission’s website at: http://ec.europa.eu

7/31/2019 Active ageing and solidarity between generations 2012 edition A statistical portrait of the European Union 2012
http://slidepdf.com/reader/full/active-ageing-and-solidarity-between-generations-2012-edition-a-statistical 7/147
5 Active ageing and solidarity between generations — a statistical portrait of the European Union 2012
Contents
Contents
Foreword 3
Introduction 7
An ageing population: issues and challenges 7
European Year for Active Ageing andSolidarity between Generations 9
Active ageing policies in the European Union 9
Statistics on ageing and the structure of this publication 12
1. Demographics 15
1.1 The population of older people in the European Union 16
1.2 Wider societal trends that impact upon population ageing 25
1.3 Future trends in ageing 32
2. Older people and the labour market 37
2.1 Persons in employment 38
2.2 Jobless persons 47
2.3 Views of the population concerning older peopleand the labour market 52
3. Transition from work to retirement 55
3.1 From the individual’s perspective 56
3.2 From the macro-economic perspective 64
3.3 Views of the population concerning retirement 69
7/31/2019 Active ageing and solidarity between generations 2012 edition A statistical portrait of the European Union 2012
http://slidepdf.com/reader/full/active-ageing-and-solidarity-between-generations-2012-edition-a-statistical 8/147
6 Active ageing and solidarity between generations — a statistical portrait of the European Union 2012
Contents
4. Well-being, health and healthcare 73
4.1 Health, disability and mortality 74
4.2 Healthcare expenditure and healthcare services 82
4.3 Views of the population concerning health and healthcare 90
5. Living conditions and consumption expenditure 93
5.1 Living arrangements 94
5.2 Housing conditions 96
5.3 Consumption within the silver economy 100
5.4 Income of older people and monetary poverty 102
5.5 Material deprivation 106
6. Participation in society 111
6.1 Inter-generational solidarity 112
6.2 Social contacts 118
6.3 Education 128
6.4 Transport 133
6.5 Silver surfers: the information society 135
6.6 Voting and representation 138
Symbols, abbreviations and acronyms 140
7/31/2019 Active ageing and solidarity between generations 2012 edition A statistical portrait of the European Union 2012
http://slidepdf.com/reader/full/active-ageing-and-solidarity-between-generations-2012-edition-a-statistical 9/147
7 Active ageing and solidarity between generations — a statistical portrait of the European Union 2012
Introduction
Introduction
An ageing population: issues and challenges
Te European Union’s (EU’s) population structure is changing and becoming progressively older – there were slightly more than 87 million persons aged 65 and over on 1 January 2010in the EU-27, some 17.4 % o the total population. Tese latest gures can be compared withdata rom 1 January 1985, when there were 59.3 million persons aged 65 and over in the EU-27(12.8 % o the total population).
A steady increase in lie expectancy across the EU during the last century led to increased longevity,while in more recent decades – rom the 1970s onwards – the EU has experienced alling ertility rates. Tese two developments impact upon demographic ageing, a process that has becomeestablished in the EU in the last 30 or 40 years and which is expected, by many, to become urther
entrenched during the next hal century, as the absolute number and the relative importance o thepopulation o older persons continues to grow. Tese demographic changes will lead to signicantchallenges or amilies and individuals – or example, it could become commonplace or people tomove into retirement while still having one or both o their parents alive.
Tese proound changes present a key challenge to society, with the ageing o the populationhaving serious implications or public policies and budgets. At the current moment in time,there are severe constraints on scal policies and a strong need or scal consolidation over anumber o years in the EU, aggravating adverse budgetary developments arising rom ageing.At the same time, changes in the demographic prole o the EU will also impact on labour
and product markets, amilies and individuals. In order to tackle the challenges posed by population ageing, a long-term view seems necessary, well beyond the horizon o electoralcycles. Many o the challenges that arise rom population ageing are universal and include:
• pressure on public budgets and scal systems;• strains on pension and social security systems;• adjusting the economy and in particular workplaces to an ageing labour orce;• possible labour market shortages as the number o working age persons decreases;• the likely need or increased numbers o trained healthcare proessionals;• higher demand or healthcare services and long-term (institutionalised) care;• potential conict between generations over the distribution o resources.
7/31/2019 Active ageing and solidarity between generations 2012 edition A statistical portrait of the European Union 2012
http://slidepdf.com/reader/full/active-ageing-and-solidarity-between-generations-2012-edition-a-statistical 10/147
8 Active ageing and solidarity between generations — a statistical portrait of the European Union 2012
Introduction
While many older Europeans lead active, healthy and participative lives well beyond theirretirement into what is ofen reerred to as the ‘third age’, others are aced with problems, suchas poverty, illness or disability, that can potentially conne or restrict their liestyles. Variousmeasures seek to address these challenges, including eorts to:
• promote the active participation o older persons; or example, the European Commission’s2011 annual growth survey recalled that pension ages should be increased and linked tolie expectancy, while early retirement schemes should be reduced;
• provide accessible and eective healthcare services that promote early detection o diseasesand help older people to maintain their health and capacity to live independently, whileensuring that healthcare spending remains under control;
• ensure that older persons have adequate incomes generally through pensions systems andsupport mechanisms that seek to reduce the proportion o older persons that are at-risk-o-poverty.
László Andor, Commissioner or Employment, Social Aairs and Inclusion has noted that ‘thekey to tackling the challenges o an increasing proportion o older people in our societies is“active aging”: encouraging older people to remain active by working longer and retiring later, by engaging in volunteer work afer retirement, and by leading healthy and autonomous lives.’
Active ageing is dened by the World Health Organisation (WHO) as ‘the process o optimizingopportunities or health, participation and security in order to enhance quality o lie as peopleage’. Te denition thereore includes the notion o extending the activity o older persons,both:
•
within the labour orce, through delaying their retirement, and;• within society, through participation in a range o social, economic, civic or cultural
activities.
Within this context, it is perhaps revealing to look beyond basic measures o demographicchange, such as the rising proportion o older persons in the total population or gains in lieexpectancy and to supplement this with a ocus on indicators that measure the propensity o older people to continue in work, to participate in society and to lead an active retirementwith a high quality o lie – this is the goal o this publication which seeks to celebrate theincreasingly important role that older persons will occupy in society in the coming decades,through a portrayal o their liestyles.
7/31/2019 Active ageing and solidarity between generations 2012 edition A statistical portrait of the European Union 2012
http://slidepdf.com/reader/full/active-ageing-and-solidarity-between-generations-2012-edition-a-statistical 11/147
9 Active ageing and solidarity between generations — a statistical portrait of the European Union 2012
Introduction
European Year or Active Ageing and Solidarity between Generations
Te European Union designated 2012 as the European Year or Active Ageing and Solidarity between Generations on 23 September 2011 (1). Tis initiative aims to:
• help create better job opportunities and working conditions or the growing numbers o older people in Europe;
• help them play an active role in society, and;• encourage healthy ageing and independent living.
One o the main goals o the European Year 2012 is to reverse the idea that older persons area burden on society. As Europeans live longer and healthier lives, governments are lookingor ways to involve older persons more in society and to keep them active; these changescould result in economic benets or society as a whole, while at the same time promoting thephysical, mental, and social well-being o older members o society.
Te demographic changes that are likely to be experienced across the EU in the coming decadesalso present an opportunity or the development o new products and services that are gearedto the needs o older people. Tere is the potential or a wide range o new technologies to bedeveloped that could allow older people to stay autonomous and live longer in their own homes,to transorm the delivery o care, or to personalise services in response to patients’ needs.
Te European Year 2012 is designed to raise awareness o these issues, identiy and publicisegood practices, while encouraging policymakers and stakeholders (at all levels o governance)to promote active ageing. Without urther institutional and policy changes, demographic
change could potentially impinge on inter-generational solidarity, as working populations areincreasingly asked to pay or the needs o an expanding group o older persons.
Active ageing policies in the European Union
Te EU has recognised the importance o the ageing challenge or many years and hasdeveloped policy in several areas.
Te Stockholm European Council meeting in 2001 laid the groundwork or a strategy to copewith the principal economic and budgetary challenges linked to an ageing population (2),namely to encourage Member States to:
• reduce debt at a ast pace;• raise employment rates and productivity, and;• reorm pensions, healthcare and long-term care systems.
(1) Decision 940/2011/EU, available at: http://eur-lex.europa.eu/LexUriServ/LexUriServ.do?uri=CELEX:32011D0940:EN:NOT .
(2) Conclusions available at: http://www.consilium.europa.eu/uedocs/cms_data/docs/pressdata/en/ ec/00100-r1. ann-r1.en1.html.
7/31/2019 Active ageing and solidarity between generations 2012 edition A statistical portrait of the European Union 2012
http://slidepdf.com/reader/full/active-ageing-and-solidarity-between-generations-2012-edition-a-statistical 12/147
10 Active ageing and solidarity between generations — a statistical portrait of the European Union 2012
Introduction
At an inormal summit held at Hampton Court in 2005, heads o state and o governmentrecognised that demographic ageing would be one o the main challenges the EU will have toace in the years to come. As a result, in October 2006, the European Commission presented its
views on demographic challenges that would need to be aced in a Communication titled ‘Te
demographic uture o Europe – rom challenge to opportunity’ (3
). It identied ve policy responses through which Member States could respond to demographic change and makepopulation ageing manageable, promoting:
• demographic renewal through better support or amilies;• employment – especially through more jobs and longer working lives o better quality;• a more productive and competitive Europe;• the receiving and integrating o immigrants in Europe;• sustainable public nances in Europe – guaranteeing adequate social security and equity
between generations.
On 29 April 2009, the European Commission issued a Communication on dealing with theimpact o an ageing population in the EU (4). It presented age-related expenditure projectionsin the light o the nancial and economic crisis. It stressed the need to introduce urtherreorms to counter ageing-induced budgetary costs in the uture, notably or pension andhealthcare spending programmes and encouraging people to stay in the labour market ratherthan retire early.
Active ageing eatures as part o the agship policy – Europe 2020 – a strategy or smart,sustainable and inclusive growth, as announced on 3 March 2010 (5). Tis growth strategy or the coming decade stressed the ‘importance o the European Union’s ability to meet the
challenge o promoting a healthy and active ageing population to allow or social cohesionand higher productivity’. Indeed, one o the ve headline Europe 2020 indicators is to reach anEU-27 employment rate o 75 % or those aged 20-64 by 2020. I this target is to be achievedthen a higher proportion o the population needs to remain in employment up to a later age.Tis will be particularly important given, that as o 2012, the size o the working age populationin the EU is projected to start shrinking.
Te European Employment Strategy (EES) has a range o actions and guidelines targeted at olderpeople, including measures calling or improved (occupational) health status and incentives toremain in work and discourage early retirement. Te guidelines also promote social protection
systems that are based on nancial sustainability, so as to support participation and retentionwithin the labour market and longer working lives.
(3) COM(2006) 571, available at: http://eur-lex.europa.eu/LexUriServ/LexUriServ.do?uri=COM:2006:0571:FIN:EN:PDF .
(4) COM(2009) 180, available at: http://eur-lex.europa.eu/LexUriServ/LexUriServ.do?uri=COM:2009:0180:FIN:EN:PDF.
(5) COM(2010) 2020, available at: http://eur-lex.europa.eu/LexUriServ/LexUriServ.do?uri=COM:2010:2020:FIN:EN:PDF .
7/31/2019 Active ageing and solidarity between generations 2012 edition A statistical portrait of the European Union 2012
http://slidepdf.com/reader/full/active-ageing-and-solidarity-between-generations-2012-edition-a-statistical 13/147
11 Active ageing and solidarity between generations — a statistical portrait of the European Union 2012
Introduction
Employment policy also seeks to improve human capital through better education and skills.As such, ecient lielong learning strategies including workplace training may enhance theprospects o older workers to remain in the workorce. Indeed, the EU’s employment strategy seeks to establish a liecycle approach, putting in place conditions that allow people to prolong
their working lives, such that employment rates or older workers and average exit ages areraised.
Te European Social Fund (ESF) has, since 1957, helped millions o Europeans to get (better) jobs and acquire skills or work. It is one o the EU’s structural unds, which was set-up toreduce dierences in the prosperity and living standards that are experienced between MemberStates and regions o the EU. On 6 October 2011, the European Commission proposed a new set o rules relating to how the ESF might work during the period 2014 to 2020 (6). Te goalso the ESF during this programming period – namely, to improve employment opportunities,promote education and lielong learning, enhance social inclusion and contribute to combating
poverty – are closely aligned with the Europe 2020 initiative. In order to achieve these goals,greater emphasis will be placed, among others, on promoting active and healthy ageing andsupporting the most disadvantaged groups and marginalised communities.
Te open method o coordination (OMC) on social protection and social inclusion isa ramework or political cooperation which aims to spread best practices and achieveconvergence towards the EU’s main goals, including among others: to combat poverty andsocial exclusion, reorm welare systems and tackle the challenges posed by demographicchange.
On 7 July 2010, the European Commission launched a debate on the uture provision o
pensions through a green paper, titled ‘owards adequate, sustainable and sae Europeanpension systems’ (7). Tis aimed to stimulate a debate in relation to:
• achieving the right balance between work and retirement, acilitating a longer active lie;• reorming pension systems, which is one o ten actions identied as part o the annual
growth survey (part o the monitoring process or the Europe 2020 strategy);• making pensions saer in the wake o the recent economic crisis;• ensuring adequate incomes in retirement and making sure pension systems are sustainable
in the long-term;• making sure pensions are more transparent so that people can take inormed decisions
about their own retirement income.
(6) COM(2011) 607, available at: http://eur-lex.europa.eu/LexUriServ/LexUriServ.do?uri=COM:2011:0607:FIN:EN:PDF .
(7) COM(2010) 365, available at: http://eur-lex.europa.eu/LexUriServ/LexUriServ.do?uri=COM:2010:0365:FIN:EN:PDF .
7/31/2019 Active ageing and solidarity between generations 2012 edition A statistical portrait of the European Union 2012
http://slidepdf.com/reader/full/active-ageing-and-solidarity-between-generations-2012-edition-a-statistical 14/147
12 Active ageing and solidarity between generations — a statistical portrait of the European Union 2012
Introduction
Active ageing, both in employment and afer retirement, will only happen i people age in goodhealth. Te Innovation Union is one o seven agship policies revealed in October 2010 as parto the broader Europe 2020 strategy. European innovation partnerships (EIPs) orm part o the Innovation Union and are designed to provide a ramework to bring together all relevant
stakeholders across policies, across sectors and across borders to speed up innovations thataddress a major societal challenge, and gain competitive advantages or growth and job creationin Europe. Te rst EIP was announced on 4 February 2011 as a joint initiative between NeelieKroes, Commission Vice-president or the Digital Agenda and John Dalli, Commissioner orHealth and Consumer Policy and is a partnership or active and healthy ageing. It has threemain objectives, namely to:
• enable EU citizens to lead healthy, active and independent lives while ageing;• improve the sustainability and eciency o social and healthcare systems;• boost the competitiveness and markets or innovative products and services that respond
to the ageing challenge.Te partnership or active and healthy ageing is ocused on prevention and health promotion,integrated care as well as active and independent living or older persons. Its overarching targetis to increase by two years the average number o healthy lie years at birth within the EU-27population by 2020.
Statistics on ageing and the structure o this publication
Most people tend to associate the term ‘old’ with the generation(s) beore their own, orthey choose to use this adjective as a relative term to categorise a particular subset o the
population – or example, older students, older workers, or older pensioners. A Eurobarometersurvey (Special Eurobarometer No. 378) conducted in September and October 2011 askedinterviewees (aged 15 and above within the EU-27) at what age people can be considered‘old’ – the average o the answers given was 63.9 years. Only one in six (16 %) o the personsinterviewed described themselves as being ‘old’.
In a similar vein, there is no recognised statistical denition o ‘old’ or ‘older’ upon which tobase the analysis presented within this publication. Rather, the picture o ageing across the EUis complicated by issues, such as:
• administrative dierences: or example, a variety o retirement ages across the EU;• demographic dierences: or example, dierent observed patterns in lie expectancy
between countries;• subjective variations: or example, dierences o opinion with respect to the quality o lie
experienced by older persons.
7/31/2019 Active ageing and solidarity between generations 2012 edition A statistical portrait of the European Union 2012
http://slidepdf.com/reader/full/active-ageing-and-solidarity-between-generations-2012-edition-a-statistical 15/147
13 Active ageing and solidarity between generations — a statistical portrait of the European Union 2012
Introduction
Most statistics do not concern the process o ageing, per se, but rather they may be analysed by age classes, thereby showing dierences between younger and older people. Te age classes thatare used can vary rom one statistical survey to another, and it is common or the boundariesbetween the young, middle-aged, and older populations to be urther blurred by this lack o
consistency. Nevertheless, a wide range o statistical domains do provide data analysed by ageclasses. Ocial statistics can provide long time-series or a range o basic demographic events,as well as more detailed inormation in areas such as the labour orce, health, education or theinormation society.
Tis publication is divided into six chapters that draw on a wide selection o ocial statistics;supplemented by opinion surveys and other sources. Most o the data were extracted romEurostat’s online database that may be accessed at the ollowing address: http://ec.europa.eu/eurostat.
Te rst chapter provides details in relation to population ageing: setting the scene as regards the
dynamics o demographic change, detailing the past, present and (projected) uture structure o the EU’s population. Te remaining chapters depict dierent stages and generations, as peoplemove rom the age groups in which employment is common (see Chapter 2) towards retirementand receiving a pension (see Chapter 3). One o the main concerns o many older persons isthe increased possibility o becoming sick or rail in older age: Chapter 4 presents inormationin relation to the demand or healthcare services, as well as the budgetary implications acinggovernments as their populations continue to age. Once retired the spending patterns o olderpersons ofen change, both in terms o their levels o spending, as well as the types o goodsand services that they purchase; the consumption patterns o the ‘silver economy’ are covered
as part o Chapter 5, alongside aspects such as housing and living conditions. Te publicationcloses with inormation relating to the active participation o older generations within society,with a particular ocus on inter-generational issues; it also includes inormation on the leisurepursuits and social activities undertaken by older persons (see Chapter 6).
7/31/2019 Active ageing and solidarity between generations 2012 edition A statistical portrait of the European Union 2012
http://slidepdf.com/reader/full/active-ageing-and-solidarity-between-generations-2012-edition-a-statistical 16/147
7/31/2019 Active ageing and solidarity between generations 2012 edition A statistical portrait of the European Union 2012
http://slidepdf.com/reader/full/active-ageing-and-solidarity-between-generations-2012-edition-a-statistical 17/147
15 Active ageing and solidarity between generations — a statistical portrait of the European Union 2012
Demographics
Ageing is a process which no individual can escape. However, the impact o ageing can vary depending not only on genetic actors but also reecting a range o characteristics, such asproession, income, liestyle or quality o lie. Viewed rom a societal perspective, the structureo the population can deviate considerably between countries, as a result o the interactiono demographic events – such as ertility rates or migration rates – and other actors, such asliestyle choices or the provision and eciency o healthcare services.
Te EU’s current population structure is characterised by a particularly high number o peoplewho were born in the two decades ollowing the end o the Second World War, although whenthis increase in births took place varies greatly between Member States; this generation is ofenreerred to as the baby-boom generation and comprises the population cohorts that were bornbetween the mid-late 1940s and the late 1960s. Te rst o the baby-boom cohorts have now entered retirement. Eurostat population projections oresee that the number o people aged over60 years will increase by about two million persons per annum in the coming decades, while theworking age population will start to shrink (as a result o lower ertility rates among post baby-boom generations). Tis will result in an increasing number o very old persons (aged 80 or over)and ewer young persons to care or them (amily members or healthcare proessionals).
Tis chapter begins by providing a range o demographic indicators that depict the current
structure o the EU’s population. Tese include a set o demographic dependency ratios, whichmeasure the potential level o support received by young (aged 0 to 14) and old people (agedover 65) rom the population o working age (conventionally considered as those aged rom 15to 64). Concerns have been expressed that accelerated ageing across the EU could lead to oldergenerations becoming too heavy a burden on younger, working age people.
While the ocus o this chapter is restricted to demographic aspects o ageing, it is interesting toconsider that economic dependency ratios (as opposed to demographic dependency ratios) may have a greater relevance in the current economic climate, given they ocus on comparing thepopulation actually in work with the number o dependents (hence, not just the elderly, but also
those who are underemployed, unemployed or inactive). Economic dependency ratios thereoreprovide greater clarity with respect to the relative burden that is aced by those in employment.
7/31/2019 Active ageing and solidarity between generations 2012 edition A statistical portrait of the European Union 2012
http://slidepdf.com/reader/full/active-ageing-and-solidarity-between-generations-2012-edition-a-statistical 18/147
16 Active ageing and solidarity between generations — a statistical portrait of the European Union 2012
1 Demographics
1.1 The population o older people in the European Union
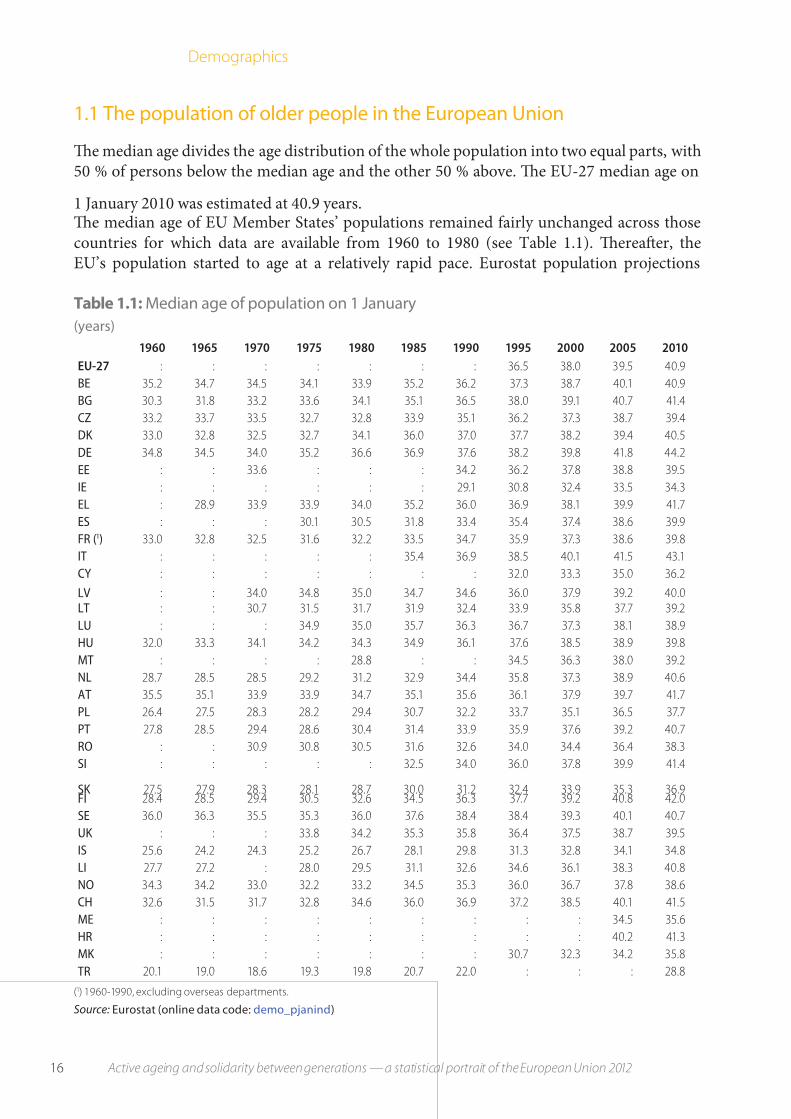
Te median age divides the age distribution o the whole population into two equal parts, with50 % o persons below the median age and the other 50 % above. Te EU-27 median age on
1 January 2010 was estimated at 40.9 years.Te median age o EU Member States’ populations remained airly unchanged across thosecountries or which data are available rom 1960 to 1980 (see able 1.1). Tereafer, theEU’s population started to age at a relatively rapid pace. Eurostat population projections
Table 1.1: Median age o population on 1 January
(years)
1960 1965 1970 1975 1980 1985 1990 1995 2000 2005 2010
EU-27 : : : : : : : 36.5 38.0 39.5 40.9
BE 35.2 34.7 34.5 34.1 33.9 35.2 36.2 37.3 38.7 40.1 40.9
BG 30.3 31.8 33.2 33.6 34.1 35.1 36.5 38.0 39.1 40.7 41.4
CZ 33.2 33.7 33.5 32.7 32.8 33.9 35.1 36.2 37.3 38.7 39.4
DK 33.0 32.8 32.5 32.7 34.1 36.0 37.0 37.7 38.2 39.4 40.5
DE 34.8 34.5 34.0 35.2 36.6 36.9 37.6 38.2 39.8 41.8 44.2
EE : : 33.6 : : : 34.2 36.2 37.8 38.8 39.5
IE : : : : : : 29.1 30.8 32.4 33.5 34.3
EL : 28.9 33.9 33.9 34.0 35.2 36.0 36.9 38.1 39.9 41.7
ES : : : 30.1 30.5 31.8 33.4 35.4 37.4 38.6 39.9
FR (1) 33.0 32.8 32.5 31.6 32.2 33.5 34.7 35.9 37.3 38.6 39.8
IT : : : : : 35.4 36.9 38.5 40.1 41.5 43.1
CY : : : : : : : 32.0 33.3 35.0 36.2
LV : : 34.0 34.8 35.0 34.7 34.6 36.0 37.9 39.2 40.0
LT : : 30.7 31.5 31.7 31.9 32.4 33.9 35.8 37.7 39.2
LU : : : 34.9 35.0 35.7 36.3 36.7 37.3 38.1 38.9
HU 32.0 33.3 34.1 34.2 34.3 34.9 36.1 37.6 38.5 38.9 39.8
MT : : : : 28.8 : : 34.5 36.3 38.0 39.2
NL 28.7 28.5 28.5 29.2 31.2 32.9 34.4 35.8 37.3 38.9 40.6
AT 35.5 35.1 33.9 33.9 34.7 35.1 35.6 36.1 37.9 39.7 41.7
PL 26.4 27.5 28.3 28.2 29.4 30.7 32.2 33.7 35.1 36.5 37.7
PT 27.8 28.5 29.4 28.6 30.4 31.4 33.9 35.9 37.6 39.2 40.7
RO : : 30.9 30.8 30.5 31.6 32.6 34.0 34.4 36.4 38.3
SI : : : : : 32.5 34.0 36.0 37.8 39.9 41.4
SK 27.5 27.9 28.3 28.1 28.7 30.0 31.2 32.4 33.9 35.3 36.9FI 28.4 28.5 29.4 30.5 32.6 34.5 36.3 37.7 39.2 40.8 42.0
SE 36.0 36.3 35.5 35.3 36.0 37.6 38.4 38.4 39.3 40.1 40.7
UK : : : 33.8 34.2 35.3 35.8 36.4 37.5 38.7 39.5
IS 25.6 24.2 24.3 25.2 26.7 28.1 29.8 31.3 32.8 34.1 34.8
LI 27.7 27.2 : 28.0 29.5 31.1 32.6 34.6 36.1 38.3 40.8
NO 34.3 34.2 33.0 32.2 33.2 34.5 35.3 36.0 36.7 37.8 38.6
CH 32.6 31.5 31.7 32.8 34.6 36.0 36.9 37.2 38.5 40.1 41.5
ME : : : : : : : : : 34.5 35.6
HR : : : : : : : : : 40.2 41.3
MK : : : : : : : 30.7 32.3 34.2 35.8
TR 20.1 19.0 18.6 19.3 19.8 20.7 22.0 : : : 28.8
(1) 1960-1990, excluding overseas departments.
Source: Eurostat (online data code: demo_pjanind)
7/31/2019 Active ageing and solidarity between generations 2012 edition A statistical portrait of the European Union 2012
http://slidepdf.com/reader/full/active-ageing-and-solidarity-between-generations-2012-edition-a-statistical 19/147
17 Active ageing and solidarity between generations — a statistical portrait of the European Union 2012
1Demographics
Table 1.2: Population on 1 January 2010
Totalpopulation
(1 000)
Aged 50-64(% o total population)
Aged 65-79(% o total population)
Aged 80+(% o total population)
Total Male Female Total Male Female Total Male Female
EU-27 501 101.8 19.1 9.3 9.8 12.7 5.7 7.0 4.7 1.6 3.1
BE 10 839.9 19.3 9.6 9.7 12.2 5.6 6.7 4.9 1.7 3.2
BG 7 563.7 20.8 9.8 11.0 13.7 5.7 8.0 3.8 1.4 2.4
CZ 10 506.8 20.8 10.1 10.7 11.7 5.0 6.7 3.6 1.1 2.4DK 5 529.4 19.7 9.8 9.8 12.2 5.8 6.4 4.1 1.5 2.7
DE 81 802.3 19.3 9.6 9.7 15.6 7.2 8.4 5.1 1.6 3.5
EE 1 340.1 18.8 8.3 10.5 13.0 4.6 8.3 4.1 1.0 3.1
IE 4 467.9 16.0 8.0 8.0 8.5 4.1 4.5 2.8 1.0 1.8
EL 11 305.1 18.9 9.2 9.7 14.3 6.4 8.0 4.6 2.0 2.6
ES 45 989.0 17.4 8.5 8.9 12.0 5.4 6.6 4.9 1.7 3.1
FR 64 716.3 19.2 9.3 9.8 11.4 5.1 6.3 5.2 1.8 3.5
IT 60 340.3 19.0 9.2 9.7 14.5 6.5 7.9 5.8 2.0 3.8
CY 803.1 18.0 8.9 9.1 10.1 4.7 5.4 2.9 1.2 1.7
LV 2 248.4 18.5 8.2 10.3 13.4 4.8 8.7 3.9 0.9 3.0
LT 3 329.0 17.7 7.8 9.9 12.4 4.5 7.9 3.6 0.9 2.7LU 502.1 17.8 9.1 8.7 10.3 4.7 5.6 3.6 1.2 2.5
HU 10 014.3 20.3 9.4 11.0 12.7 4.9 7.8 3.9 1.2 2.8
MT 414.4 21.3 10.6 10.7 11.5 5.1 6.3 3.3 1.2 2.1
NL 16 575.0 20.1 10.1 10.0 11.4 5.4 6.0 3.9 1.3 2.6
AT 8 375.3 18.4 9.0 9.3 12.8 5.8 7.0 4.8 1.5 3.3
PL 38 167.3 20.8 9.8 10.9 10.2 4.1 6.1 3.3 1.0 2.3
PT 10 637.7 18.6 8.9 9.7 13.4 5.9 7.5 4.5 1.6 2.9
RO 21 462.2 18.8 8.9 9.9 11.9 4.9 6.9 3.1 1.1 2.0
SI 2 047.0 20.3 10.3 10.1 12.6 5.4 7.2 3.9 1.1 2.8
SK 5 424.9 19.5 9.3 10.2 9.5 3.8 5.8 2.7 0.8 1.9
FI 5 351.4 21.7 10.8 11.0 12.4 5.6 6.8 4.6 1.4 3.2
SE 9 340.7 19.1 9.6 9.5 12.8 6.1 6.7 5.3 2.0 3.3
UK 62 008.0 18.1 8.9 9.2 11.8 5.5 6.3 4.6 1.7 2.9
IS 317.6 17.1 8.7 8.4 8.7 4.2 4.5 3.3 1.3 2.0
LI 35.9 20.5 10.4 10.1 10.3 4.8 5.4 3.2 1.1 2.2
NO 4 858.2 18.6 9.4 9.2 10.3 4.9 5.5 4.5 1.6 2.9
CH 7 785.8 19.1 9.6 9.6 12.0 5.5 6.5 4.8 1.6 3.1
ME 632.9 17.9 8.7 9.2 10.6 4.6 6.0 2.3 0.9 1.4
HR 4 425.7 20.2 9.8 10.4 13.7 5.7 8.0 3.5 1.1 2.5
MK 2 052.7 18.0 8.9 9.1 9.8 4.5 5.4 1.8 0.7 1.1
TR 72 561.3 12.4 6.2 6.3 5.8 2.6 3.2 1.2 0.4 0.8
Source: Eurostat (online data codes: demo_gind and demo_pjangroup)
(Europop2010) suggest that the pace at which the median age is growing will abate somewhatin the coming decades. By 2060 the median age o the EU-27 population is projected to stabiliseat 47.6 years, around 15 years higher than a century beore.
Among the EU Member States, Sweden reported the highest median age as o 1 January 1960at 36.0 years. In the mid-1990’s its position was supplanted by Italy (38.5 years in 1995), whichin turn was overtaken by Germany a decade later (41.8 in 2005, rising to 44.2 in 2010).
7/31/2019 Active ageing and solidarity between generations 2012 edition A statistical portrait of the European Union 2012
http://slidepdf.com/reader/full/active-ageing-and-solidarity-between-generations-2012-edition-a-statistical 20/147
18 Active ageing and solidarity between generations — a statistical portrait of the European Union 2012
1 Demographics
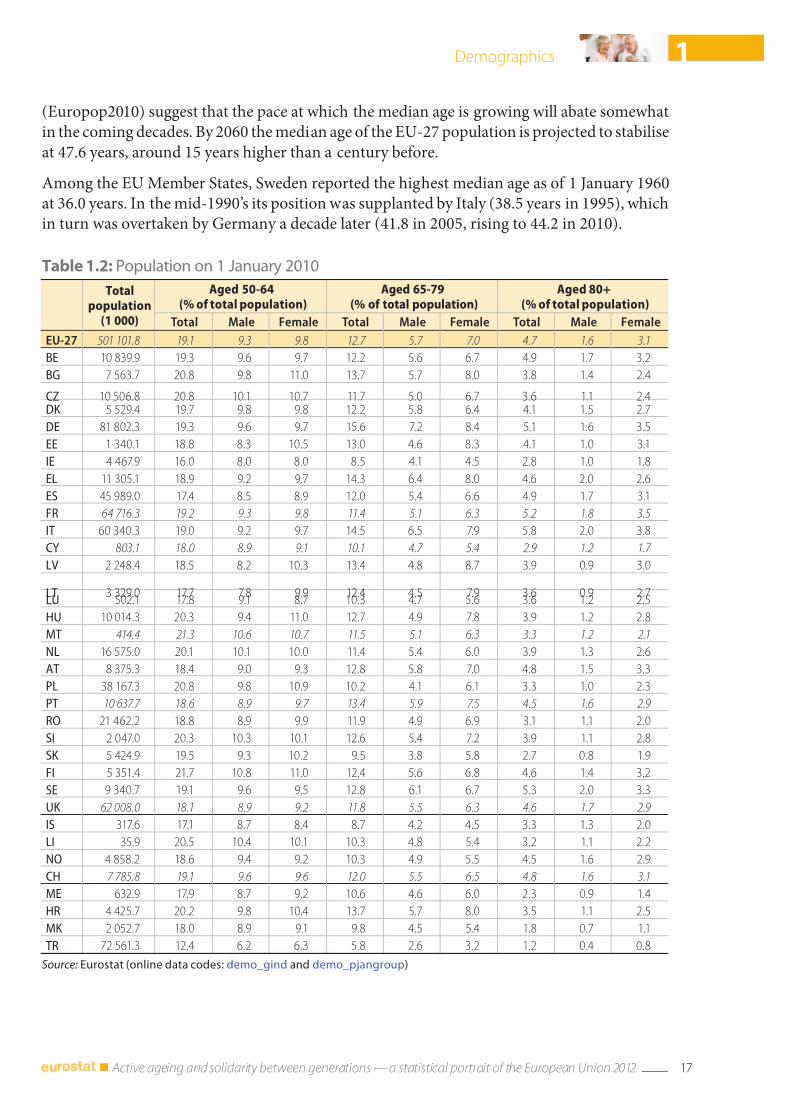
Te EU, in common with most other regions o the world, is undergoing a signicant changein its population structure. Europeans are living longer and healthier lives than ever beoreand this pattern is expected to continue on the back o continued medical breakthroughs andimproved standards o living (see Section 1.3 or more details o population projections).
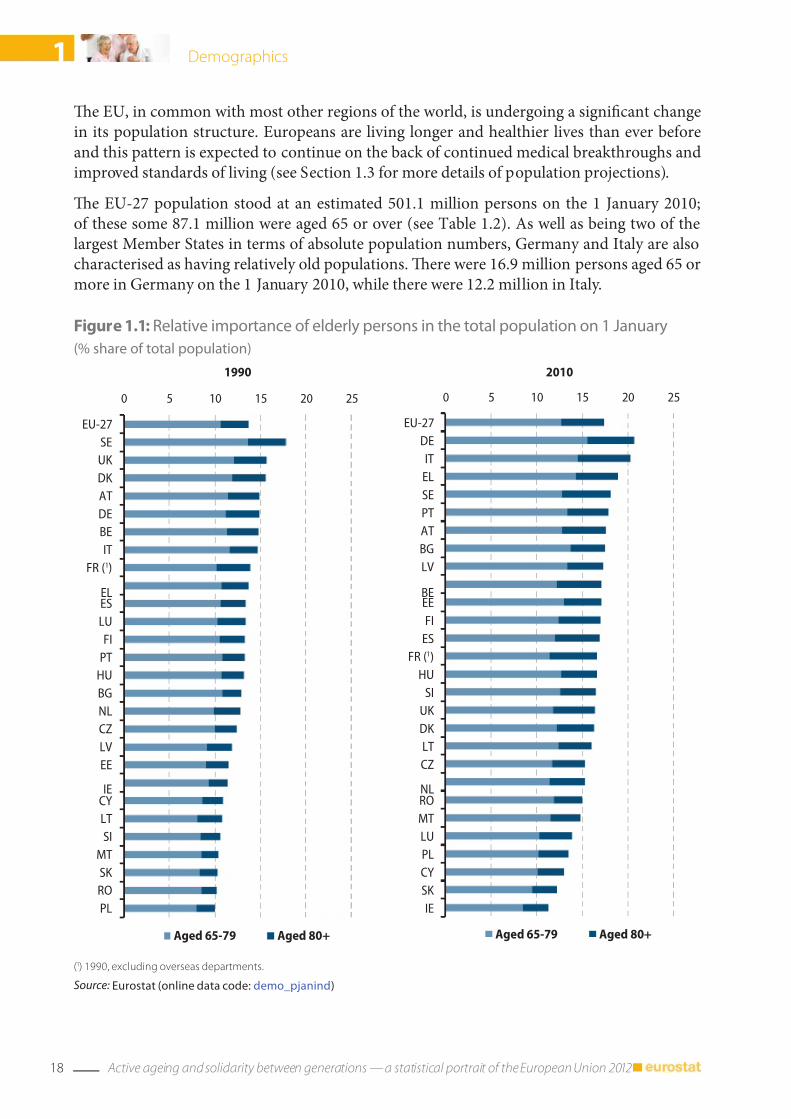
Te EU-27 population stood at an estimated 501.1 million persons on the 1 January 2010;o these some 87.1 million were aged 65 or over (see able 1.2). As well as being two o thelargest Member States in terms o absolute population numbers, Germany and Italy are alsocharacterised as having relatively old populations. Tere were 16.9 million persons aged 65 ormore in Germany on the 1 January 2010, while there were 12.2 million in Italy.
Figure 1.1: Relative importance o elderly persons in the total population on 1 January
(% share o total population)
0 5 10 15 20 25
EU-27
SE
UK
DK
AT
DE
BE
IT
FR (1)
ELES
LU
FI
PT
HU
BG
NL
CZ
LV
EE
IECY
LT
SI
MT
SK
RO
PL
1990
Aged 65-79 Aged 80+
(1) 1990, excluding overseas departments.
Source: Eurostat (online data code: demo_pjanind)
0 5 10 15 20 25
EU-27
DE
IT
EL
SE
PT
AT
BG
LV
BEEE
FI
ES
FR (1)
HU
SI
UK
DK
LT
CZ
NLRO
MT
LU
PL
CY
SK
IE
2010
Aged 65-79 Aged 80+
7/31/2019 Active ageing and solidarity between generations 2012 edition A statistical portrait of the European Union 2012
http://slidepdf.com/reader/full/active-ageing-and-solidarity-between-generations-2012-edition-a-statistical 21/147
19 Active ageing and solidarity between generations — a statistical portrait of the European Union 2012
1Demographics
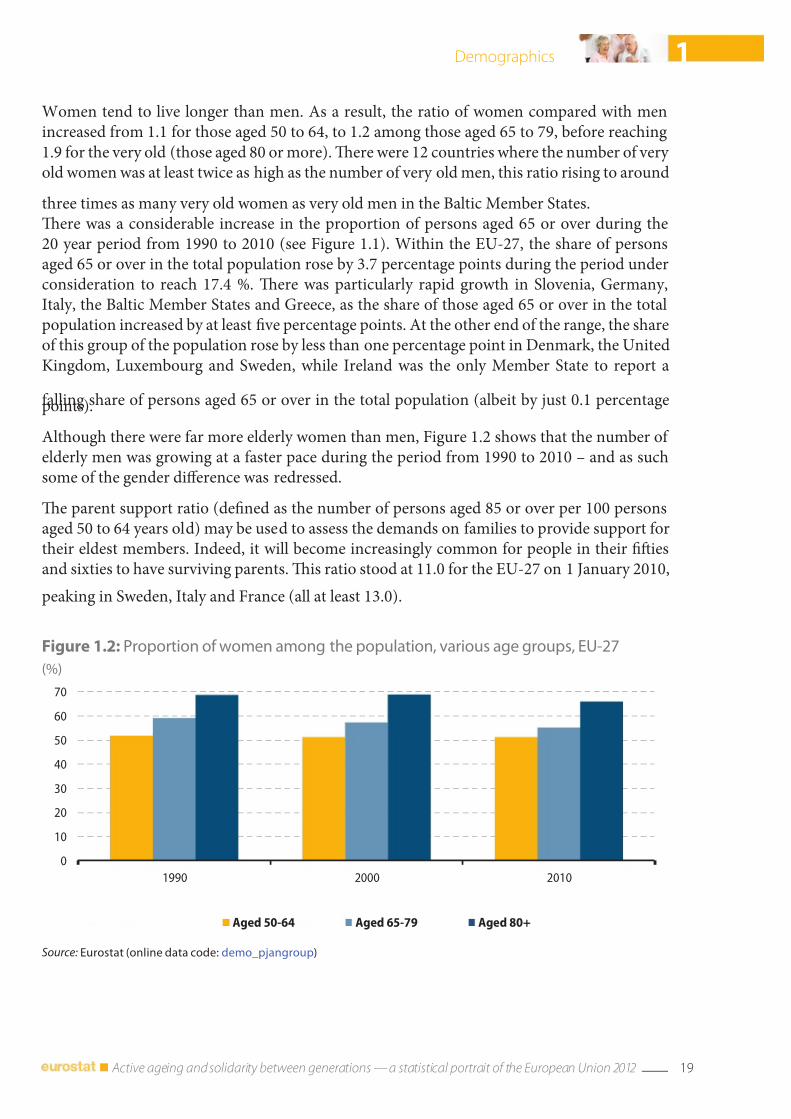
Women tend to live longer than men. As a result, the ratio o women compared with menincreased rom 1.1 or those aged 50 to 64, to 1.2 among those aged 65 to 79, beore reaching1.9 or the very old (those aged 80 or more). Tere were 12 countries where the number o very old women was at least twice as high as the number o very old men, this ratio rising to around
three times as many very old women as very old men in the Baltic Member States.Tere was a considerable increase in the proportion o persons aged 65 or over during the20 year period rom 1990 to 2010 (see Figure 1.1). Within the EU-27, the share o personsaged 65 or over in the total population rose by 3.7 percentage points during the period underconsideration to reach 17.4 %. Tere was particularly rapid growth in Slovenia, Germany,Italy, the Baltic Member States and Greece, as the share o those aged 65 or over in the totalpopulation increased by at least ve percentage points. At the other end o the range, the shareo this group o the population rose by less than one percentage point in Denmark, the UnitedKingdom, Luxembourg and Sweden, while Ireland was the only Member State to report a
alling share o persons aged 65 or over in the total population (albeit by just 0.1 percentagepoints).
Although there were ar more elderly women than men, Figure 1.2 shows that the number o elderly men was growing at a aster pace during the period rom 1990 to 2010 – and as suchsome o the gender dierence was redressed.
Te parent support ratio (dened as the number o persons aged 85 or over per 100 personsaged 50 to 64 years old) may be used to assess the demands on amilies to provide support ortheir eldest members. Indeed, it will become increasingly common or people in their fiesand sixties to have surviving parents. Tis ratio stood at 11.0 or the EU-27 on 1 January 2010,
peaking in Sweden, Italy and France (all at least 13.0).
Figure 1.2: Proportion o women among the population, various age groups, EU‑27
(%)
0
10
20
30
40
50
60
70
1990 2000 2010
Aged 50-64 Aged 65-79 Aged 80+
Source: Eurostat (online data code: demo_pjangroup)
7/31/2019 Active ageing and solidarity between generations 2012 edition A statistical portrait of the European Union 2012
http://slidepdf.com/reader/full/active-ageing-and-solidarity-between-generations-2012-edition-a-statistical 22/147
20 Active ageing and solidarity between generations — a statistical portrait of the European Union 2012
1 Demographics
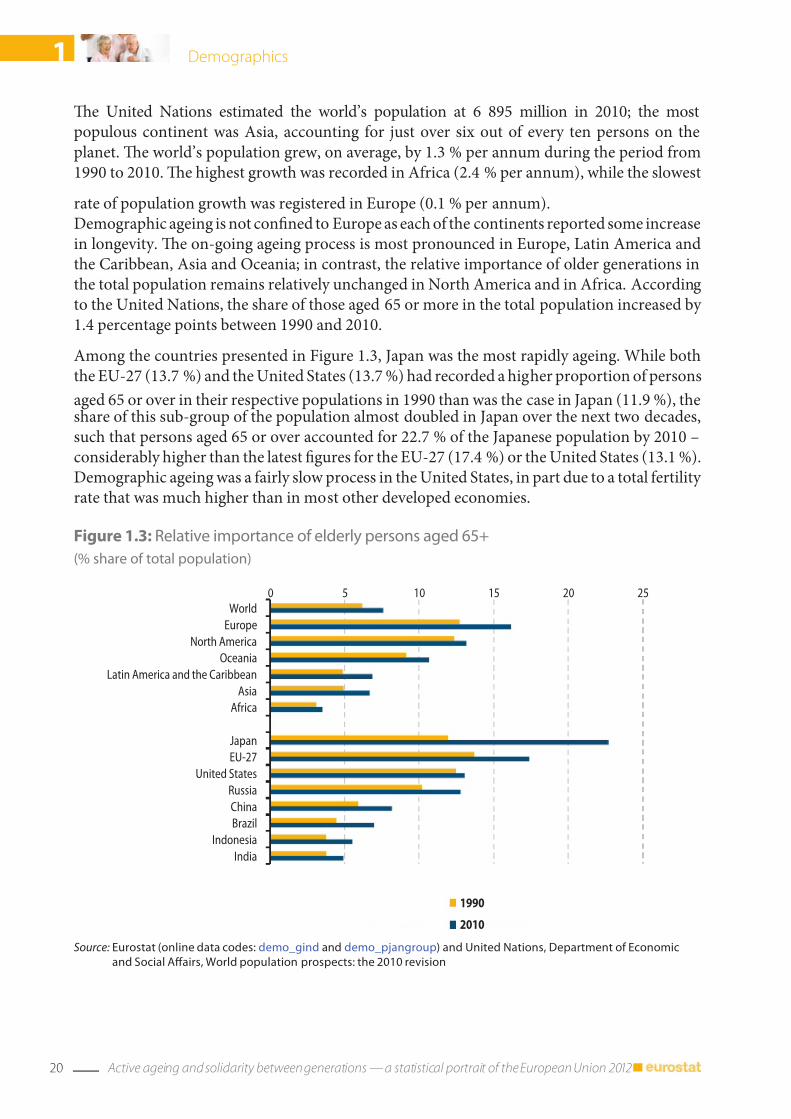
Figure 1.3: Relative importance o elderly persons aged 65+
(% share o total population)
0 5 10 15 20 25
World
Europe
North America
Oceania
Latin America and the Caribbean
Asia
Africa
Japan
EU-27
United States
Russia
China
Brazil
Indonesia
India
1990
2010
Source: Eurostat (online data codes: demo_gind and demo_pjangroup) and United Nations, Department o Economic
and Social Aairs, World population prospects: the 2010 revision
Te United Nations estimated the world’s population at 6 895 million in 2010; the mostpopulous continent was Asia, accounting or just over six out o every ten persons on theplanet. Te world’s population grew, on average, by 1.3 % per annum during the period rom1990 to 2010. Te highest growth was recorded in Arica (2.4 % per annum), while the slowest
rate o population growth was registered in Europe (0.1 % per annum).Demographic ageing is not conned to Europe as each o the continents reported some increasein longevity. Te on-going ageing process is most pronounced in Europe, Latin America andthe Caribbean, Asia and Oceania; in contrast, the relative importance o older generations inthe total population remains relatively unchanged in North America and in Arica. Accordingto the United Nations, the share o those aged 65 or more in the total population increased by 1.4 percentage points between 1990 and 2010.
Among the countries presented in Figure 1.3, Japan was the most rapidly ageing. While boththe EU-27 (13.7 %) and the United States (13.7 %) had recorded a higher proportion o persons
aged 65 or over in their respective populations in 1990 than was the case in Japan (11.9 %), theshare o this sub-group o the population almost doubled in Japan over the next two decades,such that persons aged 65 or over accounted or 22.7 % o the Japanese population by 2010 –considerably higher than the latest gures or the EU-27 (17.4 %) or the United States (13.1 %).Demographic ageing was a airly slow process in the United States, in part due to a total ertility rate that was much higher than in most other developed economies.
7/31/2019 Active ageing and solidarity between generations 2012 edition A statistical portrait of the European Union 2012
http://slidepdf.com/reader/full/active-ageing-and-solidarity-between-generations-2012-edition-a-statistical 23/147
21 Active ageing and solidarity between generations — a statistical portrait of the European Union 2012
1Demographics
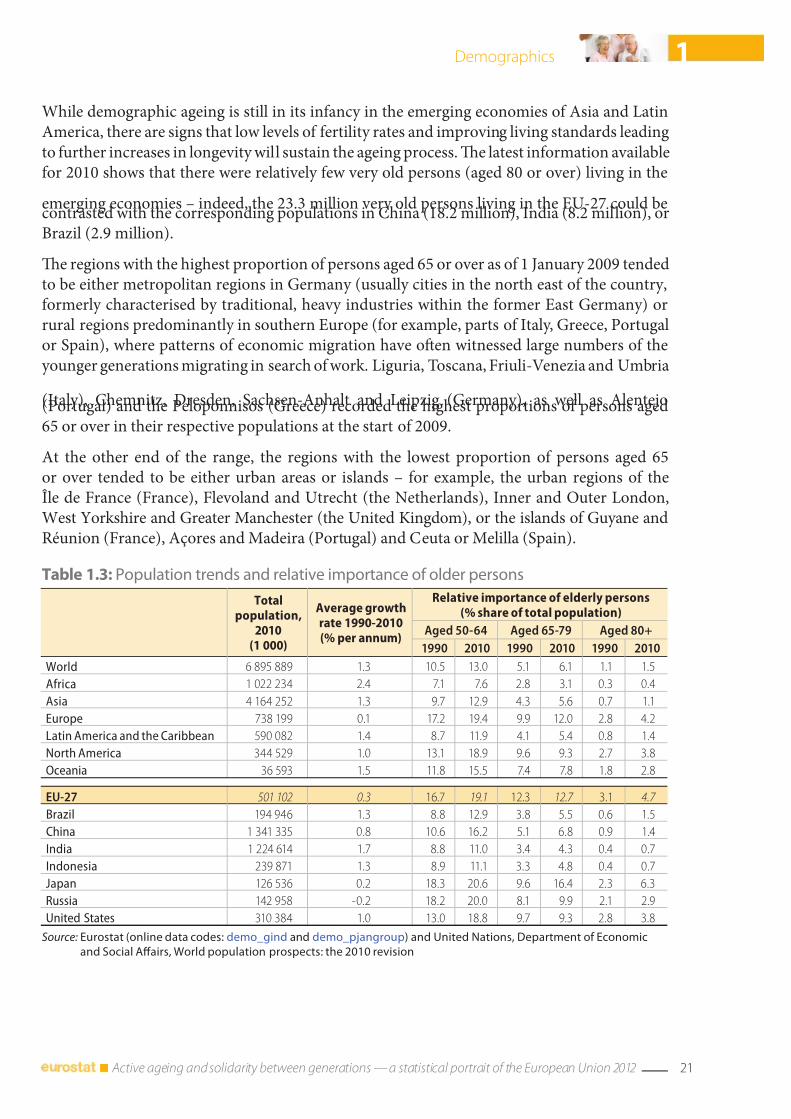
Table 1.3: Population trends and relative importance o older persons
Totalpopulation,
2010(1 000)
Average growthrate 1990-2010(% per annum)
Relative importance o elderly persons(% share o total population)
Aged 50-64 Aged 65-79 Aged 80+
1990 2010 1990 2010 1990 2010
World 6 895 889 1.3 10.5 13.0 5.1 6.1 1.1 1.5
Arica 1 022 234 2.4 7.1 7.6 2.8 3.1 0.3 0.4
Asia 4 164 252 1.3 9.7 12.9 4.3 5.6 0.7 1.1
Europe 738 199 0.1 17.2 19.4 9.9 12.0 2.8 4.2
Latin America and the Caribbean 590 082 1.4 8.7 11.9 4.1 5.4 0.8 1.4
North America 344 529 1.0 13.1 18.9 9.6 9.3 2.7 3.8
Oceania 36 593 1.5 11.8 15.5 7.4 7.8 1.8 2.8
EU-27 501 102 0.3 16.7 19.1 12.3 12.7 3.1 4.7
Brazil 194 946 1.3 8.8 12.9 3.8 5.5 0.6 1.5
China 1 341 335 0.8 10.6 16.2 5.1 6.8 0.9 1.4
India 1 224 614 1.7 8.8 11.0 3.4 4.3 0.4 0.7
Indonesia 239 871 1.3 8.9 11.1 3.3 4.8 0.4 0.7
Japan 126 536 0.2 18.3 20.6 9.6 16.4 2.3 6.3
Russia 142 958 -0.2 18.2 20.0 8.1 9.9 2.1 2.9
United States 310 384 1.0 13.0 18.8 9.7 9.3 2.8 3.8
Source: Eurostat (online data codes: demo_gind and demo_pjangroup) and United Nations, Department o Economic
and Social Aairs, World population prospects: the 2010 revision
While demographic ageing is still in its inancy in the emerging economies o Asia and LatinAmerica, there are signs that low levels o ertility rates and improving living standards leadingto urther increases in longevity will sustain the ageing process. Te latest inormation availableor 2010 shows that there were relatively ew very old persons (aged 80 or over) living in the
emerging economies – indeed, the 23.3 million very old persons living in the EU-27 could becontrasted with the corresponding populations in China (18.2 million), India (8.2 million), orBrazil (2.9 million).
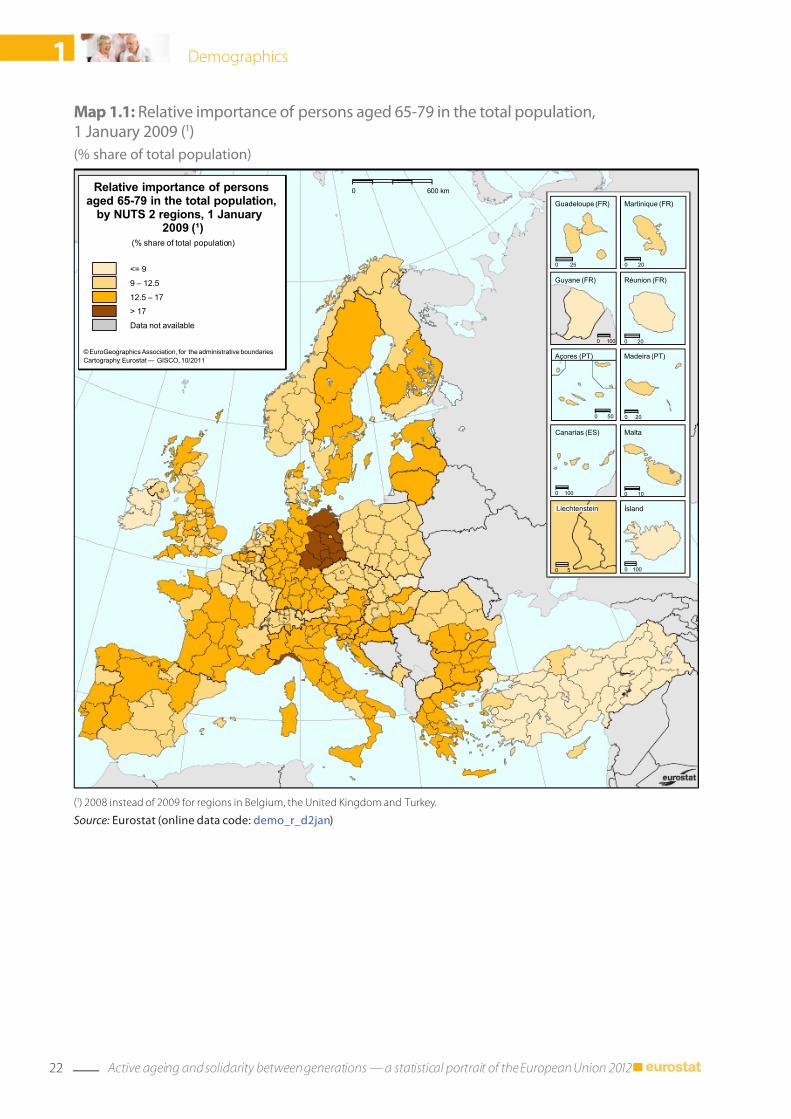
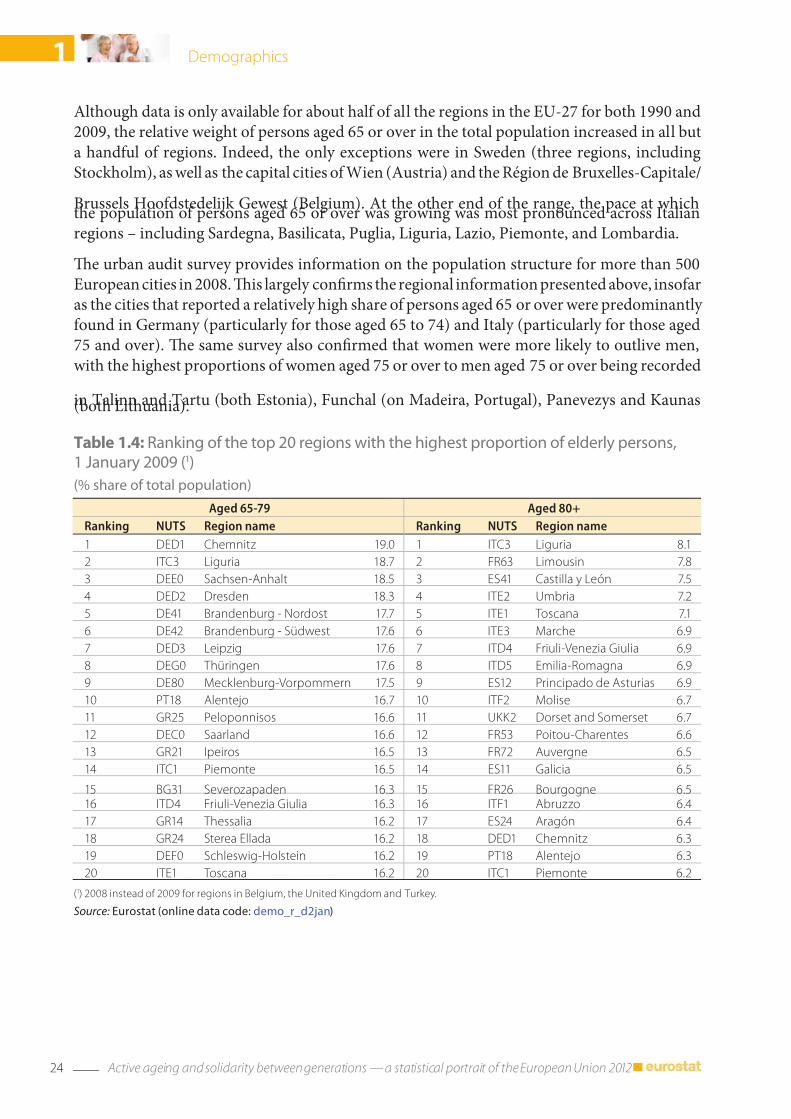
Te regions with the highest proportion o persons aged 65 or over as o 1 January 2009 tendedto be either metropolitan regions in Germany (usually cities in the north east o the country,ormerly characterised by traditional, heavy industries within the ormer East Germany) orrural regions predominantly in southern Europe (or example, parts o Italy, Greece, Portugalor Spain), where patterns o economic migration have ofen witnessed large numbers o theyounger generations migrating in search o work. Liguria, oscana, Friuli-Venezia and Umbria
(Italy), Chemnitz, Dresden, Sachsen-Anhalt and Leipzig (Germany), as well as Alentejo(Portugal) and the Peloponnisos (Greece) recorded the highest proportions o persons aged65 or over in their respective populations at the start o 2009.
At the other end o the range, the regions with the lowest proportion o persons aged 65or over tended to be either urban areas or islands – or example, the urban regions o theÎle de France (France), Flevoland and Utrecht (the Netherlands), Inner and Outer London,West Yorkshire and Greater Manchester (the United Kingdom), or the islands o Guyane andRéunion (France), Açores and Madeira (Portugal) and Ceuta or Melilla (Spain).
7/31/2019 Active ageing and solidarity between generations 2012 edition A statistical portrait of the European Union 2012
http://slidepdf.com/reader/full/active-ageing-and-solidarity-between-generations-2012-edition-a-statistical 24/147
22 Active ageing and solidarity between generations — a statistical portrait of the European Union 2012
1 Demographics
Map 1.1: Relative importance o persons aged 65‑79 in the total population,1 January 2009 (1)
(% share o total population)
0 600 kmRelative importance of personsaged 65-79 in the total population,
by NUTS 2 regions, 1 January2009 (¹)
Cartography: Eurostat — GISCO, 10/2011© EuroGeographics Association, for the administrative boundaries
(% share of total population)
Guadeloupe (FR)
0 25
Martinique (FR)
0 20
Guyane (FR)
0 100
Réunion (FR)
0 20
Açores (PT)
0 50
Madeira (PT)
0 20
Canarias (ES)
0 100
Malta
0 10
0 100
ÍslandLiechtenstein
0 5
<= 9
9 – 12.5
12.5 – 17
> 17
Data not available
(1) 2008 instead o 2009 or regions in Belgium, the United Kingdom and Turkey.
Source: Eurostat (online data code: demo_r_d2jan)
7/31/2019 Active ageing and solidarity between generations 2012 edition A statistical portrait of the European Union 2012
http://slidepdf.com/reader/full/active-ageing-and-solidarity-between-generations-2012-edition-a-statistical 25/147
23 Active ageing and solidarity between generations — a statistical portrait of the European Union 2012
1Demographics
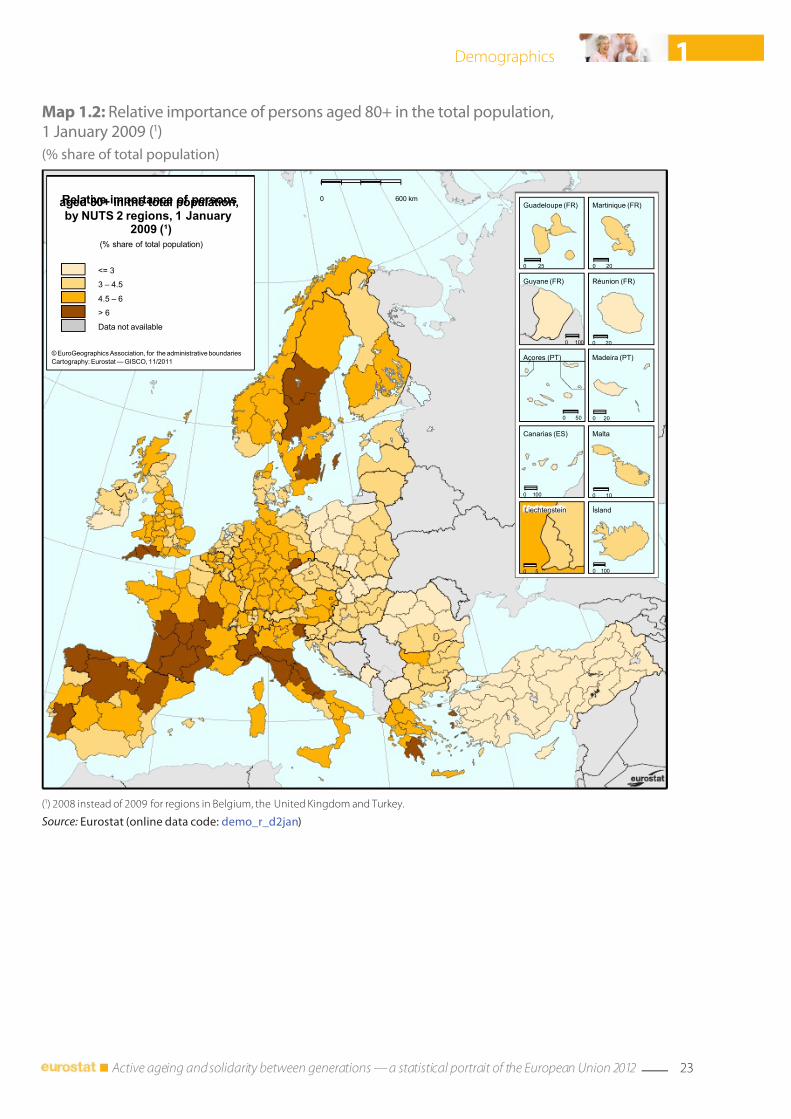
Map 1.2: Relative importance o persons aged 80+ in the total population,1 January 2009 (1)
(% share o total population)
(1) 2008 instead o 2009 or regions in Belgium, the United Kingdom and Turkey.
Source: Eurostat (online data code: demo_r_d2jan)
0 600 kmRelative importance of personsaged 80+ in the total population,by NUTS 2 regions, 1 January
2009 (¹)
Cartography: Eurostat — GISCO, 11/2011© EuroGeographics Association, for the administrative boundaries
(% share of total population)
Guadeloupe (FR)
0 25
Martinique (FR)
0 20
Guyane (FR)
0 100
Réunion (FR)
0 20
Açores (PT)
0 50
Madeira (PT)
0 20
Canarias (ES)
0 100
Malta
0 10
0 100
ÍslandLiechtenstein
0 5
<= 3
3 – 4.5
4.5 – 6
> 6
Data not available
7/31/2019 Active ageing and solidarity between generations 2012 edition A statistical portrait of the European Union 2012
http://slidepdf.com/reader/full/active-ageing-and-solidarity-between-generations-2012-edition-a-statistical 26/147
24 Active ageing and solidarity between generations — a statistical portrait of the European Union 2012
1 Demographics
Although data is only available or about hal o all the regions in the EU-27 or both 1990 and2009, the relative weight o persons aged 65 or over in the total population increased in all buta handul o regions. Indeed, the only exceptions were in Sweden (three regions, includingStockholm), as well as the capital cities o Wien (Austria) and the Région de Bruxelles-Capitale/
Brussels Hoodstedelijk Gewest (Belgium). At the other end o the range, the pace at whichthe population o persons aged 65 or over was growing was most pronounced across Italianregions – including Sardegna, Basilicata, Puglia, Liguria, Lazio, Piemonte, and Lombardia.
Te urban audit survey provides inormation on the population structure or more than 500European cities in 2008. Tis largely conrms the regional inormation presented above, insoaras the cities that reported a relatively high share o persons aged 65 or over were predominantly ound in Germany (particularly or those aged 65 to 74) and Italy (particularly or those aged75 and over). Te same survey also conrmed that women were more likely to outlive men,with the highest proportions o women aged 75 or over to men aged 75 or over being recorded
in alinn and artu (both Estonia), Funchal (on Madeira, Portugal), Panevezys and Kaunas(both Lithuania).
Table 1.4: Ranking o the top 20 regions with the highest proportion o elderly persons,1 January 2009 (1)
(% share o total population)
Aged 65-79 Aged 80+
Ranking NUTS Region name Ranking NUTS Region name
1 DED1 Chemnitz 19.0 1 ITC3 Liguria 8.1
2 ITC3 Liguria 18.7 2 FR63 Limousin 7.8
3 DEE0 Sachsen-Anhalt 18.5 3 ES41 Castilla y León 7.5
4 DED2 Dresden 18.3 4 ITE2 Umbria 7.2
5 DE41 Brandenburg - Nordost 17.7 5 ITE1 Toscana 7.1
6 DE42 Brandenburg - Südwest 17.6 6 ITE3 Marche 6.9
7 DED3 Leipzig 17.6 7 ITD4 Friuli-Venezia Giulia 6.9
8 DEG0 Thüringen 17.6 8 ITD5 Emilia-Romagna 6.9
9 DE80 Mecklenburg-Vorpommern 17.5 9 ES12 Principado de Asturias 6.9
10 PT18 Alentejo 16.7 10 ITF2 Molise 6.7
11 GR25 Peloponnisos 16.6 11 UKK2 Dorset and Somerset 6.7
12 DEC0 Saarland 16.6 12 FR53 Poitou-Charentes 6.6
13 GR21 Ipeiros 16.5 13 FR72 Auvergne 6.5
14 ITC1 Piemonte 16.5 14 ES11 Galicia 6.5
15 BG31 Severozapaden 16.3 15 FR26 Bourgogne 6.516 ITD4 Friuli-Venezia Giulia 16.3 16 ITF1 Abruzzo 6.4
17 GR14 Thessalia 16.2 17 ES24 Aragón 6.4
18 GR24 Sterea Ellada 16.2 18 DED1 Chemnitz 6.3
19 DEF0 Schleswig-Holstein 16.2 19 PT18 Alentejo 6.3
20 ITE1 Toscana 16.2 20 ITC1 Piemonte 6.2
(1) 2008 instead o 2009 or regions in Belgium, the United Kingdom and Turkey.
Source: Eurostat (online data code: demo_r_d2jan)

7/31/2019 Active ageing and solidarity between generations 2012 edition A statistical portrait of the European Union 2012
http://slidepdf.com/reader/full/active-ageing-and-solidarity-between-generations-2012-edition-a-statistical 27/147
25 Active ageing and solidarity between generations — a statistical portrait of the European Union 2012
1Demographics
Figure 1.4: Demographic balance, EU‑27 (1)
(millions)
-1
0
1
2
3
4
5
1961 1967 1973 1979 1985 1991 1997 2003 2009
Natural change
Net migration including statistical adjustment (2)
Total population change (2)
(1) Break in series, 1998.(2) Provisional, 2008 and 2009.
Source: Eurostat (online data code: demo_gind)
1.2 Wider societal trends that impact upon population ageing
Changes in population levels can be attributed to two distinct actors: natural change (thedierence between the number o births and the number o deaths) and net migration (the
dierence between immigration and emigration). In the 1960s the overwhelming share o EU-27 population growth could be attributed to natural change, as the number o birthsconsiderably outweighed the number o deaths. However, the relatively high ertility ratesthat were experienced in the post-war decades slowly came to an end, while lie expectancy increased – such that by the end o the 1990s there was almost no net eect rom naturalchange, as the number o births and deaths were almost balanced. From the mid-2000sonwards there was some evidence to suggest that ertility rates were starting to climb againin several o the EU Member States, and that as a result natural change in the EU-27 had alsostarted to increase somewhat.
Immigration policy has the potential to play an important role in lling labour marketshortages, although the integration o immigrants may pose a challenge to social cohesion.Net migration gures generally uctuate more rom one year to the next than natural changes.During the period rom 1960 to the mid-1980s, the overall eect o net migration on totalpopulation change was limited. From this date onwards there was an increase in net migration,peaking in the period rom 2003 to 2007 when migration contributed an average o almost twomillion persons per annum to the EU-27’s total population change. Te last couple o yearshave seen net migration gures all somewhat, such that migrants contributed an additional875 500 persons to the EU-27’s population in 2009.
7/31/2019 Active ageing and solidarity between generations 2012 edition A statistical portrait of the European Union 2012
http://slidepdf.com/reader/full/active-ageing-and-solidarity-between-generations-2012-edition-a-statistical 28/147
26 Active ageing and solidarity between generations — a statistical portrait of the European Union 2012
1 Demographics
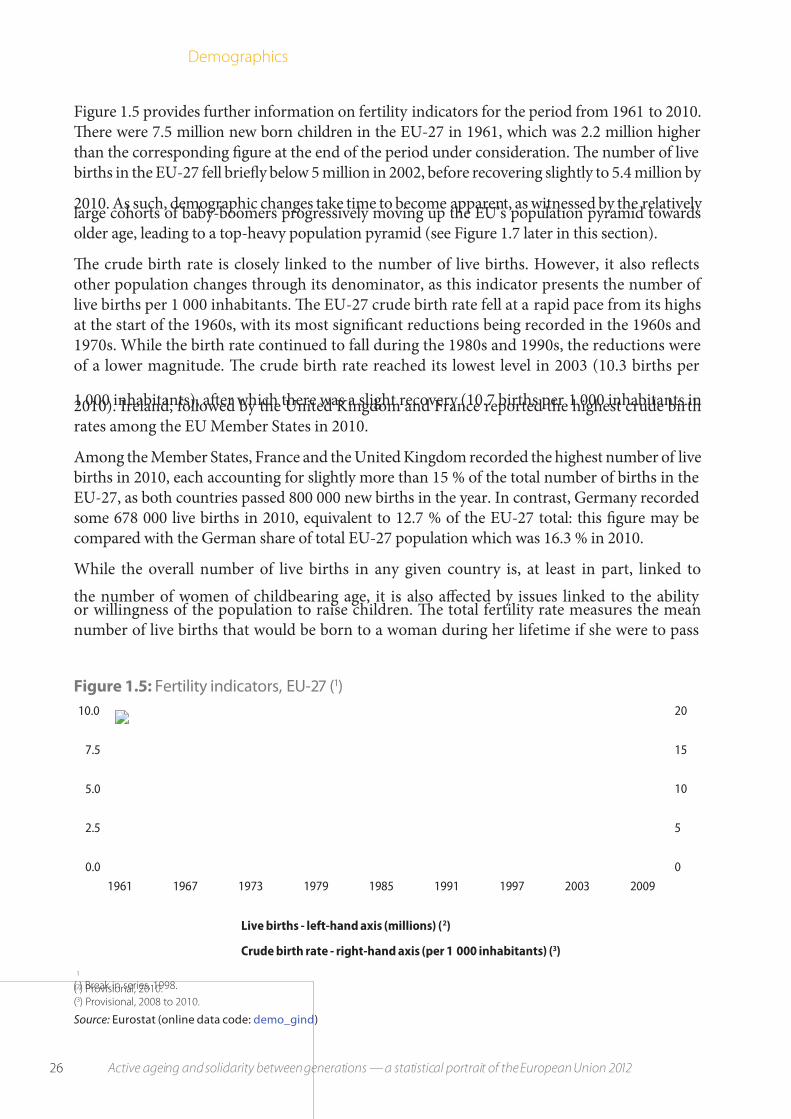
Figure 1.5: Fertility indicators, EU‑27 (1)
0
5
10
15
20
0.0
2.5
5.0
7.5
10.0
1961 1967 1973 1979 1985 1991 1997 2003 2009
Live births - left-hand axis (millions) (2)
Crude birth rate - right-hand axis (per 1 000 inhabitants) (3)
(
1
) Break in series, 1998.(2) Provisional, 2010.(3) Provisional, 2008 to 2010.
Source: Eurostat (online data code: demo_gind)
Figure 1.5 provides urther inormation on ertility indicators or the period rom 1961 to 2010.Tere were 7.5 million new born children in the EU-27 in 1961, which was 2.2 million higherthan the corresponding gure at the end o the period under consideration. Te number o livebirths in the EU-27 ell briey below 5 million in 2002, beore recovering slightly to 5.4 million by
2010. As such, demographic changes take time to become apparent, as witnessed by the relatively large cohorts o baby-boomers progressively moving up the EU’s population pyramid towardsolder age, leading to a top-heavy population pyramid (see Figure 1.7 later in this section).
Te crude birth rate is closely linked to the number o live births. However, it also reectsother population changes through its denominator, as this indicator presents the number o live births per 1 000 inhabitants. Te EU-27 crude birth rate ell at a rapid pace rom its highsat the start o the 1960s, with its most signicant reductions being recorded in the 1960s and1970s. While the birth rate continued to all during the 1980s and 1990s, the reductions wereo a lower magnitude. Te crude birth rate reached its lowest level in 2003 (10.3 births per
1 000 inhabitants), afer which there was a slight recovery (10.7 births per 1 000 inhabitants in2010). Ireland, ollowed by the United Kingdom and France reported the highest crude birthrates among the EU Member States in 2010.
Among the Member States, France and the United Kingdom recorded the highest number o livebirths in 2010, each accounting or slightly more than 15 % o the total number o births in theEU-27, as both countries passed 800 000 new births in the year. In contrast, Germany recordedsome 678 000 live births in 2010, equivalent to 12.7 % o the EU-27 total: this gure may becompared with the German share o total EU-27 population which was 16.3 % in 2010.
While the overall number o live births in any given country is, at least in part, linked to
the number o women o childbearing age, it is also aected by issues linked to the ability or willingness o the population to raise children. Te total ertility rate measures the meannumber o live births that would be born to a woman during her lietime i she were to pass
7/31/2019 Active ageing and solidarity between generations 2012 edition A statistical portrait of the European Union 2012
http://slidepdf.com/reader/full/active-ageing-and-solidarity-between-generations-2012-edition-a-statistical 29/147
27 Active ageing and solidarity between generations — a statistical portrait of the European Union 2012
1Demographics
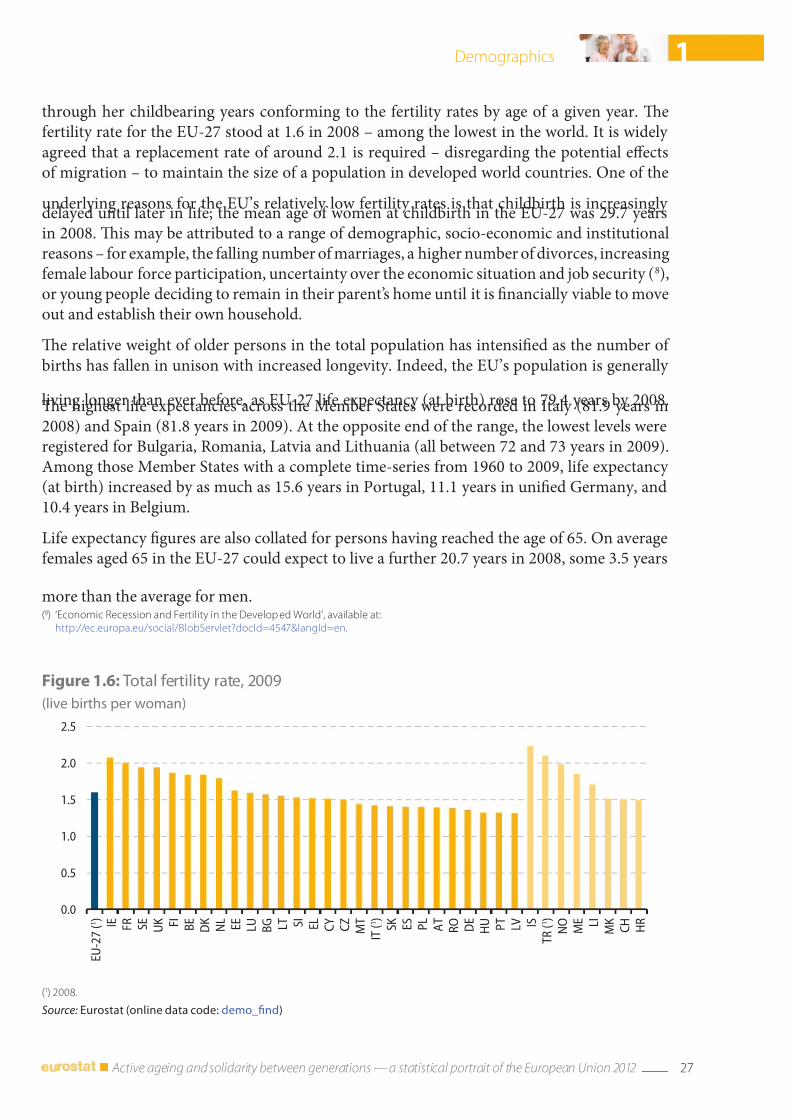
Figure 1.6: Total ertility rate, 2009
(live births per woman)
0.0
0.5
1.0
1.5
2.0
2.5
E U - 2 7 ( 1 )
I E F R
S E
U K F
I B E
D K
N L
E E
L U
B G L
T S I
E L
C Y
C Z
M T
I T ( 1 )
S K
E S
P L
A T
R O
D E
H U
P T
L V I S
T R ( 1 )
N O
M E L
I
M K
C H
H R
(1) 2008.
Source: Eurostat (online data code: demo_nd)
through her childbearing years conorming to the ertility rates by age o a given year. Teertility rate or the EU-27 stood at 1.6 in 2008 – among the lowest in the world. It is widely agreed that a replacement rate o around 2.1 is required – disregarding the potential eectso migration – to maintain the size o a population in developed world countries. One o the
underlying reasons or the EU’s relatively low ertility rates is that childbirth is increasingly delayed until later in lie; the mean age o women at childbirth in the EU-27 was 29.7 yearsin 2008. Tis may be attributed to a range o demographic, socio-economic and institutionalreasons – or example, the alling number o marriages, a higher number o divorces, increasingemale labour orce participation, uncertainty over the economic situation and job security (8),or young people deciding to remain in their parent’s home until it is nancially viable to moveout and establish their own household.
Te relative weight o older persons in the total population has intensied as the number o births has allen in unison with increased longevity. Indeed, the EU’s population is generally
living longer than ever beore, as EU-27 lie expectancy (at birth) rose to 79.4 years by 2008.Te highest lie expectancies across the Member States were recorded in Italy (81.9 years in2008) and Spain (81.8 years in 2009). At the opposite end o the range, the lowest levels wereregistered or Bulgaria, Romania, Latvia and Lithuania (all between 72 and 73 years in 2009).Among those Member States with a complete time-series rom 1960 to 2009, lie expectancy (at birth) increased by as much as 15.6 years in Portugal, 11.1 years in unied Germany, and10.4 years in Belgium.
Lie expectancy gures are also collated or persons having reached the age o 65. On averageemales aged 65 in the EU-27 could expect to live a urther 20.7 years in 2008, some 3.5 years
more than the average or men.(8) ‘Economic Recession and Fertility in the Develop ed World’, available at:
http://ec.europa.eu/social/BlobServlet?docId=4547&langId=en.
7/31/2019 Active ageing and solidarity between generations 2012 edition A statistical portrait of the European Union 2012
http://slidepdf.com/reader/full/active-ageing-and-solidarity-between-generations-2012-edition-a-statistical 30/147
28 Active ageing and solidarity between generations — a statistical portrait of the European Union 2012
1 Demographics
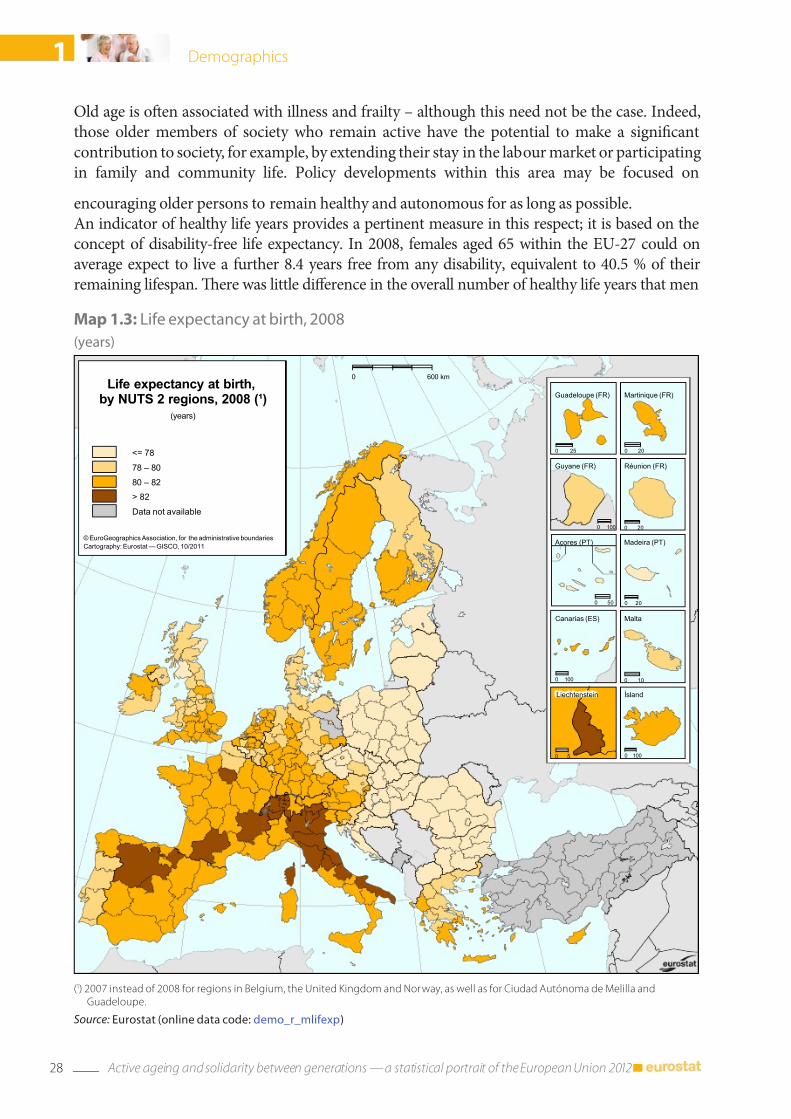
Old age is ofen associated with illness and railty – although this need not be the case. Indeed,those older members o society who remain active have the potential to make a signicantcontribution to society, or example, by extending their stay in the labour market or participatingin amily and community lie. Policy developments within this area may be ocused on
encouraging older persons to remain healthy and autonomous or as long as possible.An indicator o healthy lie years provides a pertinent measure in this respect; it is based on theconcept o disability-ree lie expectancy. In 2008, emales aged 65 within the EU-27 could onaverage expect to live a urther 8.4 years ree rom any disability, equivalent to 40.5 % o theirremaining liespan. Tere was little dierence in the overall number o healthy lie years that men
Map 1.3: Lie expectancy at birth, 2008
(years)
(1) 2007 instead o 2008 or regions in Belgium, the United Kingdom and Nor way, as well as or Ciudad Autónoma de Melilla andGuadeloupe.
Source: Eurostat (online data code: demo_r_mliexp)
0 600 kmLife expectancy at birth,
by NUTS 2 regions, 2008 (¹)
Cartography: Eurostat — GISCO, 10/2011© EuroGeographics Association, for the administrative boundaries
(years)
Guadeloupe (FR)
0 25
Martinique (FR)
0 20
Guyane (FR)
0 100
Réunion (FR)
0 20
Açores (PT)
0 50
Madeira (PT)
0 20
Canarias (ES)
0 100
Malta
0 10
0 100
ÍslandLiechtenstein
0 5
<= 78
78 – 80
80 – 82
> 82
Data not available
7/31/2019 Active ageing and solidarity between generations 2012 edition A statistical portrait of the European Union 2012
http://slidepdf.com/reader/full/active-ageing-and-solidarity-between-generations-2012-edition-a-statistical 31/147
29 Active ageing and solidarity between generations — a statistical portrait of the European Union 2012
1Demographics
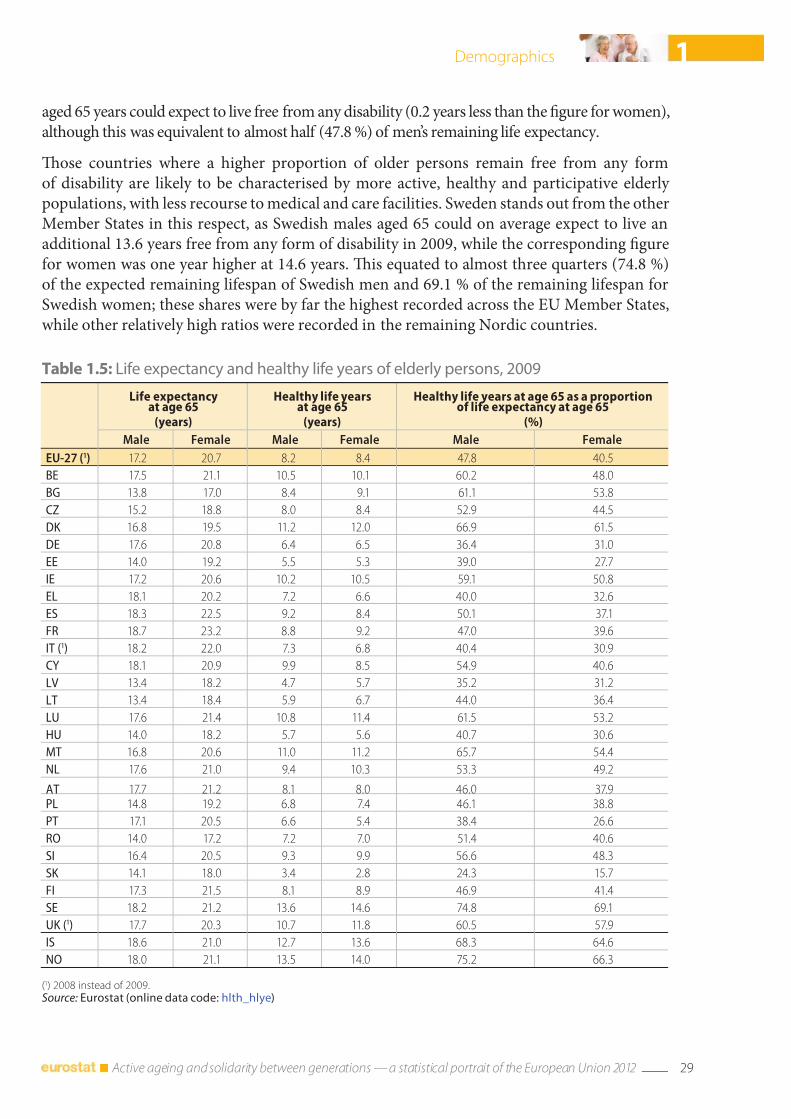
Table 1.5: Lie expectancy and healthy lie years o elderly persons, 2009
Lie expectancyat age 65
(years)
Healthy lie yearsat age 65
(years)
Healthy lie years at age 65 as a proportiono lie expectancy at age 65
(%)
Male Female Male Female Male Female
EU-27 (1) 17.2 20.7 8.2 8.4 47.8 40.5
BE 17.5 21.1 10.5 10.1 60.2 48.0
BG 13.8 17.0 8.4 9.1 61.1 53.8
CZ 15.2 18.8 8.0 8.4 52.9 44.5
DK 16.8 19.5 11.2 12.0 66.9 61.5
DE 17.6 20.8 6.4 6.5 36.4 31.0
EE 14.0 19.2 5.5 5.3 39.0 27.7
IE 17.2 20.6 10.2 10.5 59.1 50.8
EL 18.1 20.2 7.2 6.6 40.0 32.6
ES 18.3 22.5 9.2 8.4 50.1 37.1
FR 18.7 23.2 8.8 9.2 47.0 39.6
IT (1) 18.2 22.0 7.3 6.8 40.4 30.9
CY 18.1 20.9 9.9 8.5 54.9 40.6
LV 13.4 18.2 4.7 5.7 35.2 31.2
LT 13.4 18.4 5.9 6.7 44.0 36.4
LU 17.6 21.4 10.8 11.4 61.5 53.2
HU 14.0 18.2 5.7 5.6 40.7 30.6
MT 16.8 20.6 11.0 11.2 65.7 54.4
NL 17.6 21.0 9.4 10.3 53.3 49.2
AT 17.7 21.2 8.1 8.0 46.0 37.9PL 14.8 19.2 6.8 7.4 46.1 38.8
PT 17.1 20.5 6.6 5.4 38.4 26.6
RO 14.0 17.2 7.2 7.0 51.4 40.6
SI 16.4 20.5 9.3 9.9 56.6 48.3
SK 14.1 18.0 3.4 2.8 24.3 15.7
FI 17.3 21.5 8.1 8.9 46.9 41.4
SE 18.2 21.2 13.6 14.6 74.8 69.1
UK (1) 17.7 20.3 10.7 11.8 60.5 57.9
IS 18.6 21.0 12.7 13.6 68.3 64.6
NO 18.0 21.1 13.5 14.0 75.2 66.3
(1) 2008 instead o 2009.Source: Eurostat (online data code: hlth_hlye)
aged 65 years could expect to live ree rom any disability (0.2 years less than the gure or women),although this was equivalent to almost hal (47.8 %) o men’s remaining lie expectancy.
Tose countries where a higher proportion o older persons remain ree rom any ormo disability are likely to be characterised by more active, healthy and participative elderly populations, with less recourse to medical and care acilities. Sweden stands out rom the otherMember States in this respect, as Swedish males aged 65 could on average expect to live anadditional 13.6 years ree rom any orm o disability in 2009, while the corresponding gureor women was one year higher at 14.6 years. Tis equated to almost three quarters (74.8 %)o the expected remaining liespan o Swedish men and 69.1 % o the remaining liespan orSwedish women; these shares were by ar the highest recorded across the EU Member States,while other relatively high ratios were recorded in the remaining Nordic countries.

7/31/2019 Active ageing and solidarity between generations 2012 edition A statistical portrait of the European Union 2012
http://slidepdf.com/reader/full/active-ageing-and-solidarity-between-generations-2012-edition-a-statistical 32/147

7/31/2019 Active ageing and solidarity between generations 2012 edition A statistical portrait of the European Union 2012
http://slidepdf.com/reader/full/active-ageing-and-solidarity-between-generations-2012-edition-a-statistical 33/147

7/31/2019 Active ageing and solidarity between generations 2012 edition A statistical portrait of the European Union 2012
http://slidepdf.com/reader/full/active-ageing-and-solidarity-between-generations-2012-edition-a-statistical 34/147
7/31/2019 Active ageing and solidarity between generations 2012 edition A statistical portrait of the European Union 2012
http://slidepdf.com/reader/full/active-ageing-and-solidarity-between-generations-2012-edition-a-statistical 35/147
33 Active ageing and solidarity between generations — a statistical portrait of the European Union 2012
1Demographics
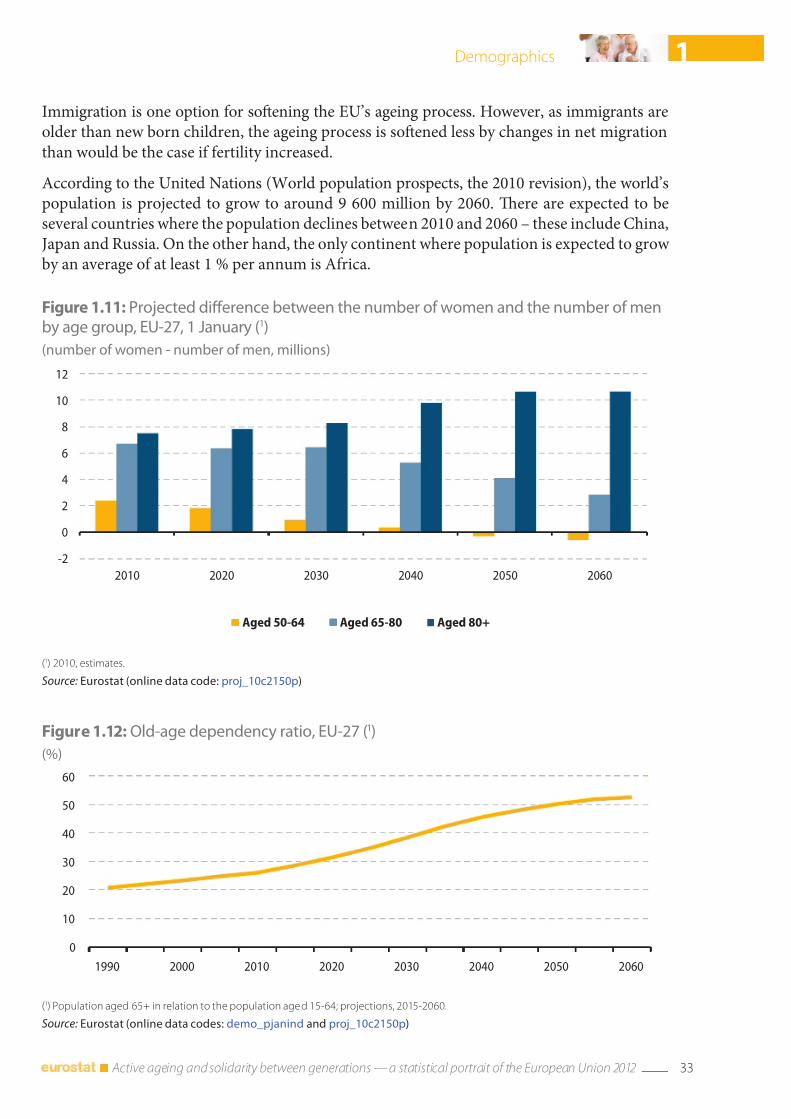
Figure 1.11: Projected dierence between the number o women and the number o menby age group, EU‑27, 1 January (1)
(number o women ‑ number o men, millions)
-2
0
2
4
6
8
10
12
2010 2020 2030 2040 2050 2060
Aged 50-64 Aged 65-80 Aged 80+
(1) 2010, estimates.
Source: Eurostat (online data code: proj_10c2150p)
Figure 1.12: Old‑age dependency ratio, EU‑27 (1)
(%)
0
10
20
30
40
50
60
1990 2000 2010 2020 2030 2040 2050 2060
(1) Population aged 65+ in relation to the population aged 15-64; projections, 2015-2060.
Source: Eurostat (online data codes: demo_pjanind and proj_10c2150p)
Immigration is one option or sofening the EU’s ageing process. However, as immigrants areolder than new born children, the ageing process is sofened less by changes in net migrationthan would be the case i ertility increased.
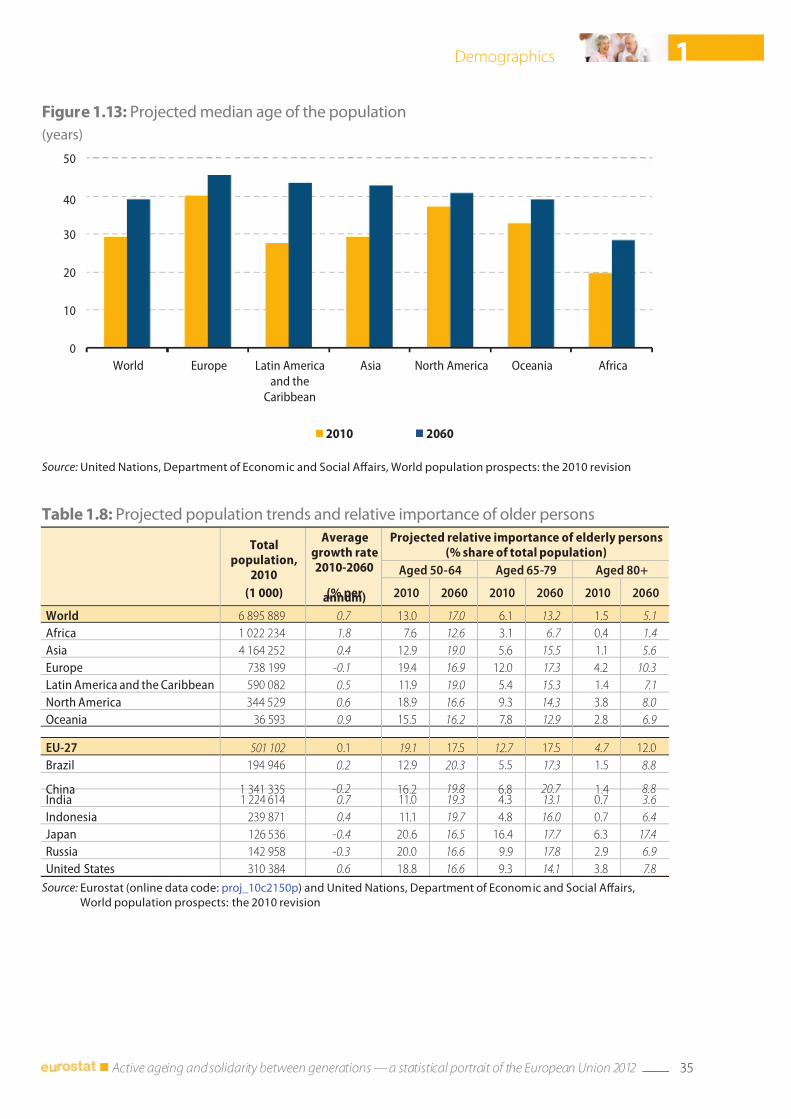
According to the United Nations (World population prospects, the 2010 revision), the world’spopulation is projected to grow to around 9 600 million by 2060. Tere are expected to beseveral countries where the population declines between 2010 and 2060 – these include China,Japan and Russia. On the other hand, the only continent where population is expected to grow by an average o at least 1 % per annum is Arica.

7/31/2019 Active ageing and solidarity between generations 2012 edition A statistical portrait of the European Union 2012
http://slidepdf.com/reader/full/active-ageing-and-solidarity-between-generations-2012-edition-a-statistical 36/147
7/31/2019 Active ageing and solidarity between generations 2012 edition A statistical portrait of the European Union 2012
http://slidepdf.com/reader/full/active-ageing-and-solidarity-between-generations-2012-edition-a-statistical 37/147
35 Active ageing and solidarity between generations — a statistical portrait of the European Union 2012
1Demographics
Figure 1.13: Projected median age o the population
(years)
0
10
20
30
40
50
World Europe Latin America
and the
Caribbean
Asia North America Oceania Africa
2010 2060
Source: United Nations, Department o Economic and Social Aairs, World population prospects: the 2010 revision
Table 1.8: Projected population trends and relative importance o older persons
Totalpopulation,
2010
(1 000)
Averagegrowth rate2010-2060
(% perannum)
Projected relative importance o elderly persons(% share o total population)
Aged 50-64 Aged 65-79 Aged 80+
2010 2060 2010 2060 2010 2060
World 6 895 889 0.7 13.0 17.0 6.1 13.2 1.5 5.1
Arica 1 022 234 1.8 7.6 12.6 3.1 6.7 0.4 1.4
Asia 4 164 252 0.4 12.9 19.0 5.6 15.5 1.1 5.6
Europe 738 199 -0.1 19.4 16.9 12.0 17.3 4.2 10.3
Latin America and the Caribbean 590 082 0.5 11.9 19.0 5.4 15.3 1.4 7.1
North America 344 529 0.6 18.9 16.6 9.3 14.3 3.8 8.0
Oceania 36 593 0.9 15.5 16.2 7.8 12.9 2.8 6.9
EU-27 501 102 0.1 19.1 17.5 12.7 17.5 4.7 12.0
Brazil 194 946 0.2 12.9 20.3 5.5 17.3 1.5 8.8
China 1 341 335 -0.2 16.2 19.8 6.8 20.7 1.4 8.8India 1 224 614 0.7 11.0 19.3 4.3 13.1 0.7 3.6
Indonesia 239 871 0.4 11.1 19.7 4.8 16.0 0.7 6.4
Japan 126 536 -0.4 20.6 16.5 16.4 17.7 6.3 17.4
Russia 142 958 -0.3 20.0 16.6 9.9 17.8 2.9 6.9
United States 310 384 0.6 18.8 16.6 9.3 14.1 3.8 7.8
Source: Eurostat (online data code: proj_10c2150p) and United Nations, Department o Economic and Social Aairs,
World population prospects: the 2010 revision

7/31/2019 Active ageing and solidarity between generations 2012 edition A statistical portrait of the European Union 2012
http://slidepdf.com/reader/full/active-ageing-and-solidarity-between-generations-2012-edition-a-statistical 38/147
7/31/2019 Active ageing and solidarity between generations 2012 edition A statistical portrait of the European Union 2012
http://slidepdf.com/reader/full/active-ageing-and-solidarity-between-generations-2012-edition-a-statistical 39/147
37 Active ageing and solidarity between generations — a statistical portrait of the European Union 2012
Older people andthe labour market
Governments are likely to ace a signicant challenge in trying to encourage the baby-boomgeneration to stay in the labour market rather than retire early, as previous generations havetended to do. A shrinking working age population risks acting as a drag on economic growththrough labour and skills shortages. In response, the EU has sought to promote increased
labour orce participation and participation over the whole lie cycle (although it is the MemberStates themselves that dene the most appropriate strategies to achieve these goals). Activeageing recognises that i people are to work or a longer period o time, then they will needto be in good physical and mental health, with access to more exible working arrangements,healthy workplaces, lielong learning and retirement schemes. In the ace o historically low ertility rates, it has been argued that demographic renewal requires actions to promote amily-lie and encourage a better work-lie balance. Incentives such as parental leave, the provisiono childcare and reducing taxes on second earners have the potential to increase labour marketparticipation – particularly amongst women.
While there has been considerable progress to increase participation rates in the labour market– especially among older workers and women – the prospect o longer average careers and theast pace o the modern, inormation-based society, mean that retraining is expected to becomean important tool to avoid obsolete skills, and indirectly prevent premature retirement. TeEU supports various initiatives in this domain such as promoting lielong learning strategies.In a Communication titled ‘New skills or new jobs – anticipating and matching labour marketand skills needs’ (9), the European Commission seeks to present an assessment o the skillsrequirements in Europe up to 2020, taking account o the impacts o technological change andageing populations.
(9) COM(2008) 868, available at: http://eur-lex.europa.eu/LexUriServ/LexUriServ.do?uri=COM:2008:0868:FIN:EN:PDF.

7/31/2019 Active ageing and solidarity between generations 2012 edition A statistical portrait of the European Union 2012
http://slidepdf.com/reader/full/active-ageing-and-solidarity-between-generations-2012-edition-a-statistical 40/147
38 Active ageing and solidarity between generations — a statistical portrait of the European Union 2012
2 Older people and the labour market
2.1 Persons in employment
Te EU-27’s labour orce had 58.1 million persons aged 50 to 64 and a urther 4.1 million aged65 or over in 2010. Tose aged 50 to 64 accounted or just less than one quarter (24.7 %) o
all economically active persons (those in employment and those unemployed) in the EU-27in 2010. In contrast, there were 37.2 million persons aged 50 to 64 across the EU-27 whowere economically inactive in 2010 – composed o people who have taken (early) retirement,people who were not seeking employment and others who have never worked; there were anadditional 81.2 million inactive persons aged 65 or over.
Table 2.1: Main labour orce indicators or those aged 50‑64
Active personsInactivepersons(1 000)
Employed(1 000)
Unemployed(1 000)
Share in total number o active persons aged
15-64 (%)2000 2010 2000 2010 2000 2010 2000 2010
EU-27 40 988 54 080 3 100 4 017 20.1 24.7 39 483 37 240
BE 671 1 076 32 61 16.0 23.4 1 011 976
BG 584 738 91 75 19.9 24.2 831 592
CZ 1 034 1 273 67 89 21.7 26.2 784 816
DK 646 707 25 45 23.8 26.1 318 319
DE 7 931 10 640 975 813 22.8 27.9 7 417 4 594
EE 132 154 16 28 23.1 27.3 96 70
IE 291 410 10 41 17.6 21.6 248 271
EL 875 1 083 39 86 20.2 23.7 926 941
ES 2 872 4 202 288 708 17.8 21.4 3 214 3 159
FR 4 571 6 494 374 444 19.3 24.6 4 436 5 120
IT 4 052 5 525 194 230 18.3 23.4 6 318 5 667
CY 61 91 2 4 21.0 24.0 42 47
LV 200 236 27 47 21.1 25.0 202 133
LT 292 339 42 59 20.2 24.7 231 188
LU 30 47 : 1 16.3 21.0 40 39
HU 678 963 27 88 17.4 24.9 1 032 1 008
MT 28 37 : 2 18.8 22.1 41 53
NL (1) 1 424 2 106 30 82 18.1 25.4 1 286 1 143
AT 611 882 42 27 17.1 21.6 731 638
PL 2 572 3 730 275 307 16.8 23.2 3 090 3 908
PT 1 019 1 167 37 110 21.5 24.3 680 716RO 2 098 2 042 52 96 20.3 22.4 1 438 1 913
SI 128 212 10 11 14.7 21.9 200 197
SK 318 563 48 71 14.3 23.5 419 419
FI 572 752 50 53 23.5 30.5 359 363
SE 1 186 1 341 67 73 29.2 29.1 393 364
UK 6 112 7 270 279 367 22.5 25.0 3 699 3 588
IS 33 45 : 2 21.8 27.4 4 8
NO 533 673 6 11 23.3 27.1 192 225
CH (1) 884 1 118 19 39 23.3 26.5 342 337
HR : 494 : 38 : 31.4 : 511
MK : 156 : 55 : 22.7 : 156TR : 3 144 : 207 : 13.6 : 5 799
(1) Break in series, 2010.
Source: Eurostat (online data code: lsa_pganws)
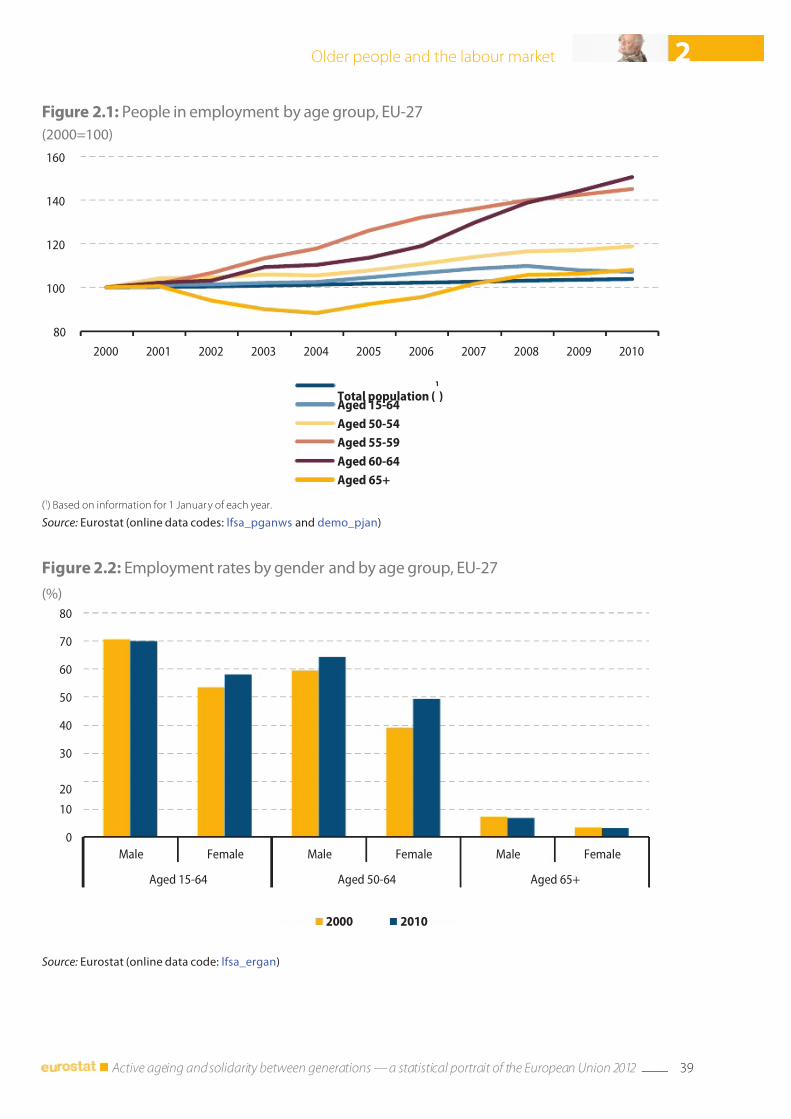
7/31/2019 Active ageing and solidarity between generations 2012 edition A statistical portrait of the European Union 2012
http://slidepdf.com/reader/full/active-ageing-and-solidarity-between-generations-2012-edition-a-statistical 41/147
39 Active ageing and solidarity between generations — a statistical portrait of the European Union 2012
2Older people and the labour market
Figure 2.1: People in employment by age group, EU‑27
(2000=100)
80
100
120
140
160
2000 2001 2002 2003 2004 2005 2006 2007 2008 2009 2010
Total population (1
)Aged 15-64
Aged 50-54
Aged 55-59
Aged 60-64
Aged 65+
(1) Based on inormation or 1 January o each year.
Source: Eurostat (online data codes: lsa_pganws and demo_pjan)
Figure 2.2: Employment rates by gender and by age group, EU‑27
(%)
0
10
20
30
40
50
60
70
80
Male Female Male Female Male Female
Aged 15-64 Aged 50-64 Aged 65+
2000 2010
Source: Eurostat (online data code: lsa_ergan)
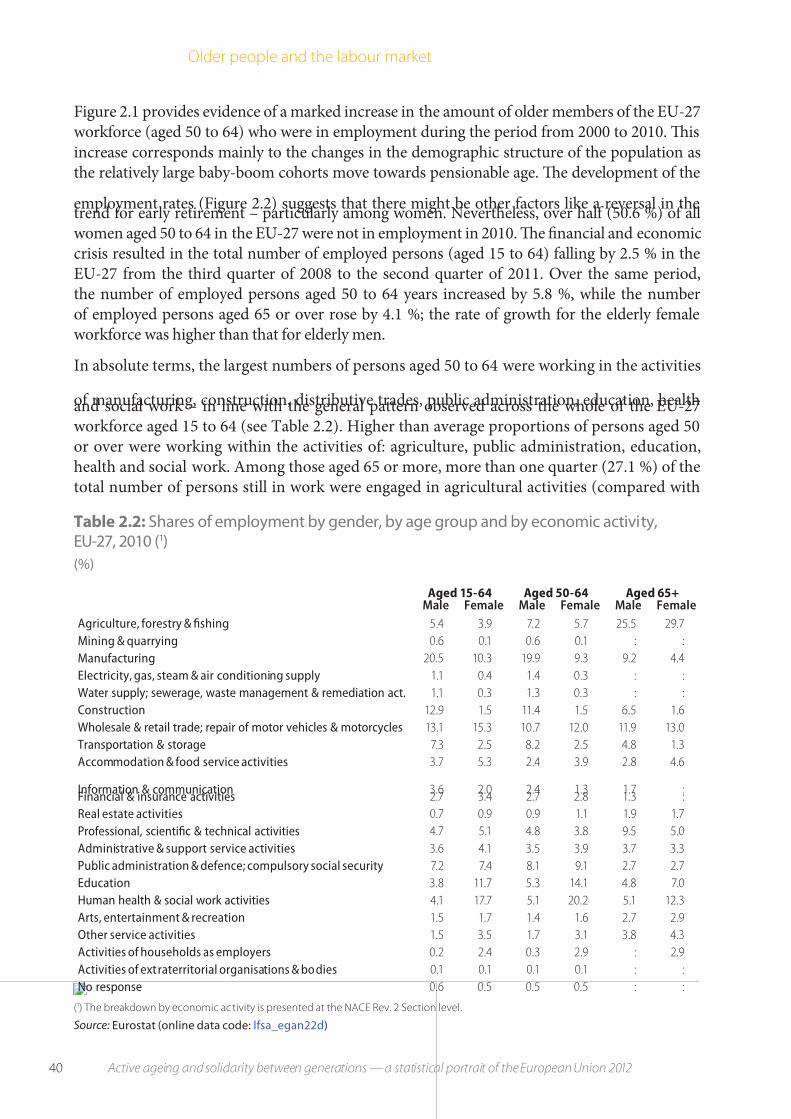
7/31/2019 Active ageing and solidarity between generations 2012 edition A statistical portrait of the European Union 2012
http://slidepdf.com/reader/full/active-ageing-and-solidarity-between-generations-2012-edition-a-statistical 42/147
40 Active ageing and solidarity between generations — a statistical portrait of the European Union 2012
2 Older people and the labour market
Figure 2.1 provides evidence o a marked increase in the amount o older members o the EU-27workorce (aged 50 to 64) who were in employment during the period rom 2000 to 2010. Tisincrease corresponds mainly to the changes in the demographic structure o the population asthe relatively large baby-boom cohorts move towards pensionable age. Te development o the
employment rates (Figure 2.2) suggests that there might be other actors like a reversal in thetrend or early retirement – particularly among women. Nevertheless, over hal (50.6 %) o allwomen aged 50 to 64 in the EU-27 were not in employment in 2010. Te nancial and economiccrisis resulted in the total number o employed persons (aged 15 to 64) alling by 2.5 % in theEU-27 rom the third quarter o 2008 to the second quarter o 2011. Over the same period,the number o employed persons aged 50 to 64 years increased by 5.8 %, while the numbero employed persons aged 65 or over rose by 4.1 %; the rate o growth or the elderly emaleworkorce was higher than that or elderly men.
In absolute terms, the largest numbers o persons aged 50 to 64 were working in the activities
o manuacturing, construction, distributive trades, public administration, education, healthand social work – in line with the general pattern observed across the whole o the EU-27workorce aged 15 to 64 (see able 2.2). Higher than average proportions o persons aged 50or over were working within the activities o: agriculture, public administration, education,health and social work. Among those aged 65 or more, more than one quarter (27.1 %) o thetotal number o persons still in work were engaged in agricultural activities (compared with
Table 2.2: Shares o employment by gender, by age group and by economic activity,EU‑27, 2010 (1)
(%)
Aged 15-64 Aged 50-64 Aged 65+Male Female Male Female Male Female
Agriculture, orestry & shing 5.4 3.9 7.2 5.7 25.5 29.7
Mining & quarrying 0.6 0.1 0.6 0.1 : :
Manuacturing 20.5 10.3 19.9 9.3 9.2 4.4
Electricity, gas, steam & air conditioning supply 1.1 0.4 1.4 0.3 : :
Water supply; sewerage, waste management & remediation act. 1.1 0.3 1.3 0.3 : :
Construction 12.9 1.5 11.4 1.5 6.5 1.6
Wholesale & retail trade; repair o motor vehicles & motorcycles 13.1 15.3 10.7 12.0 11.9 13.0
Transportation & storage 7.3 2.5 8.2 2.5 4.8 1.3
Accommodation & ood service activities 3.7 5.3 2.4 3.9 2.8 4.6
Inormation & communication 3.6 2.0 2.4 1.3 1.7 :Financial & insurance activities 2.7 3.4 2.7 2.8 1.3 :
Real estate activities 0.7 0.9 0.9 1.1 1.9 1.7
Proessional, scientic & technical activities 4.7 5.1 4.8 3.8 9.5 5.0
Administrative & support service activities 3.6 4.1 3.5 3.9 3.7 3.3
Public administration & deence; compulsory social security 7.2 7.4 8.1 9.1 2.7 2.7
Education 3.8 11.7 5.3 14.1 4.8 7.0
Human health & social work activities 4.1 17.7 5.1 20.2 5.1 12.3
Arts, entertainment & recreation 1.5 1.7 1.4 1.6 2.7 2.9
Other service activities 1.5 3.5 1.7 3.1 3.8 4.3
Activities o households as employers 0.2 2.4 0.3 2.9 : 2.9
Activities o extraterritorial organisations & bodies 0.1 0.1 0.1 0.1 : :
No response 0.6 0.5 0.5 0.5 : :
(1) The breakdown by economic ac tivity is presented at the NACE Rev. 2 Section level.
Source: Eurostat (online data code: lsa_egan22d)
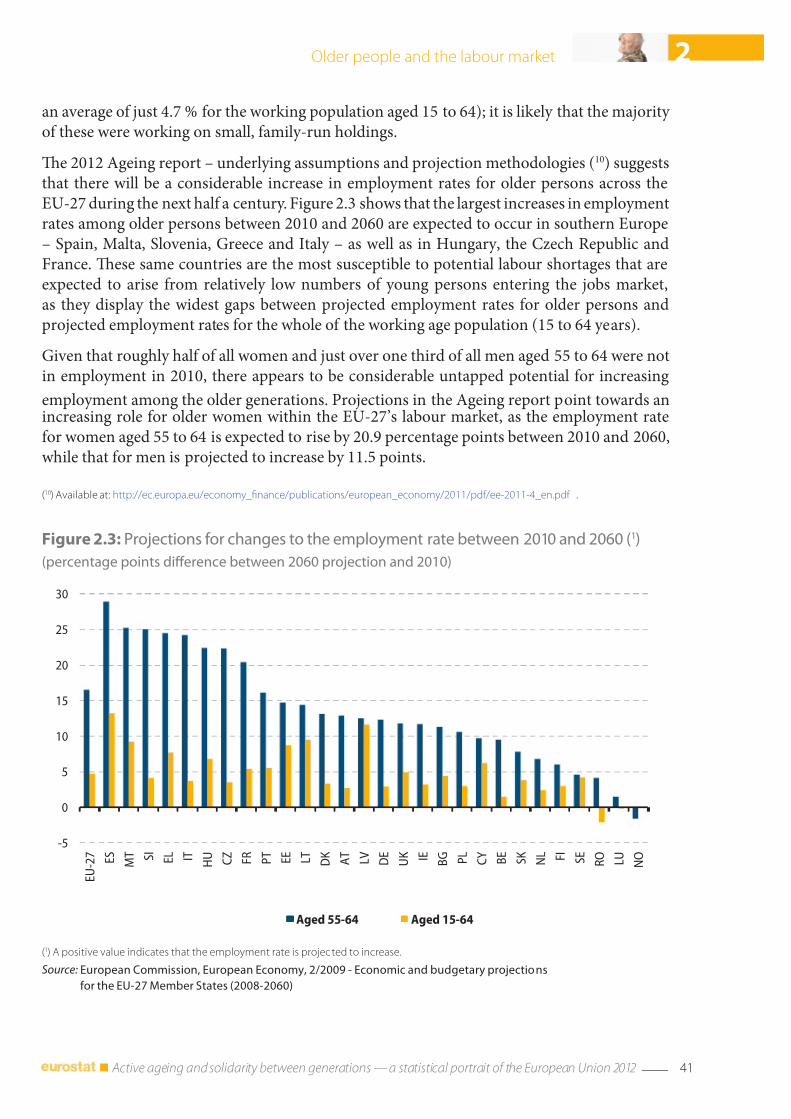
7/31/2019 Active ageing and solidarity between generations 2012 edition A statistical portrait of the European Union 2012
http://slidepdf.com/reader/full/active-ageing-and-solidarity-between-generations-2012-edition-a-statistical 43/147
41 Active ageing and solidarity between generations — a statistical portrait of the European Union 2012
2Older people and the labour market
Figure 2.3: Projections or changes to the employment rate between 2010 and 2060 (1)
(percentage points dierence between 2060 projection and 2010)
-5
0
5
10
15
20
25
30
E U - 2 7
E S
M T S
I E L I T
H U
C Z
F R
P T
E E
L T
D K
A T
L V
D E
U K I E
B G P
L C Y
B E
S K
N L F
I S E
R O
L U
N O
Aged 55-64 Aged 15-64
(1) A positive value indicates that the employment rate is projec ted to increase.
Source: European Commission, European Economy, 2/2009 ‑ Economic and budgetary projections
or the EU‑27 Member States (2008‑2060)
an average o just 4.7 % or the working population aged 15 to 64); it is likely that the majority o these were working on small, amily-run holdings.
Te 2012 Ageing report – underlying assumptions and projection methodologies (10) suggeststhat there will be a considerable increase in employment rates or older persons across theEU-27 during the next hal a century. Figure 2.3 shows that the largest increases in employmentrates among older persons between 2010 and 2060 are expected to occur in southern Europe– Spain, Malta, Slovenia, Greece and Italy – as well as in Hungary, the Czech Republic andFrance. Tese same countries are the most susceptible to potential labour shortages that areexpected to arise rom relatively low numbers o young persons entering the jobs market,as they display the widest gaps between projected employment rates or older persons andprojected employment rates or the whole o the working age population (15 to 64 years).
Given that roughly hal o all women and just over one third o all men aged 55 to 64 were notin employment in 2010, there appears to be considerable untapped potential or increasing
employment among the older generations. Projections in the Ageing report point towards anincreasing role or older women within the EU-27’s labour market, as the employment rateor women aged 55 to 64 is expected to rise by 20.9 percentage points between 2010 and 2060,while that or men is projected to increase by 11.5 points.
(10) Available at: http://ec.europa.eu/economy_nance/publications/european_economy/2011/pd/ee-2011-4_en.pd .
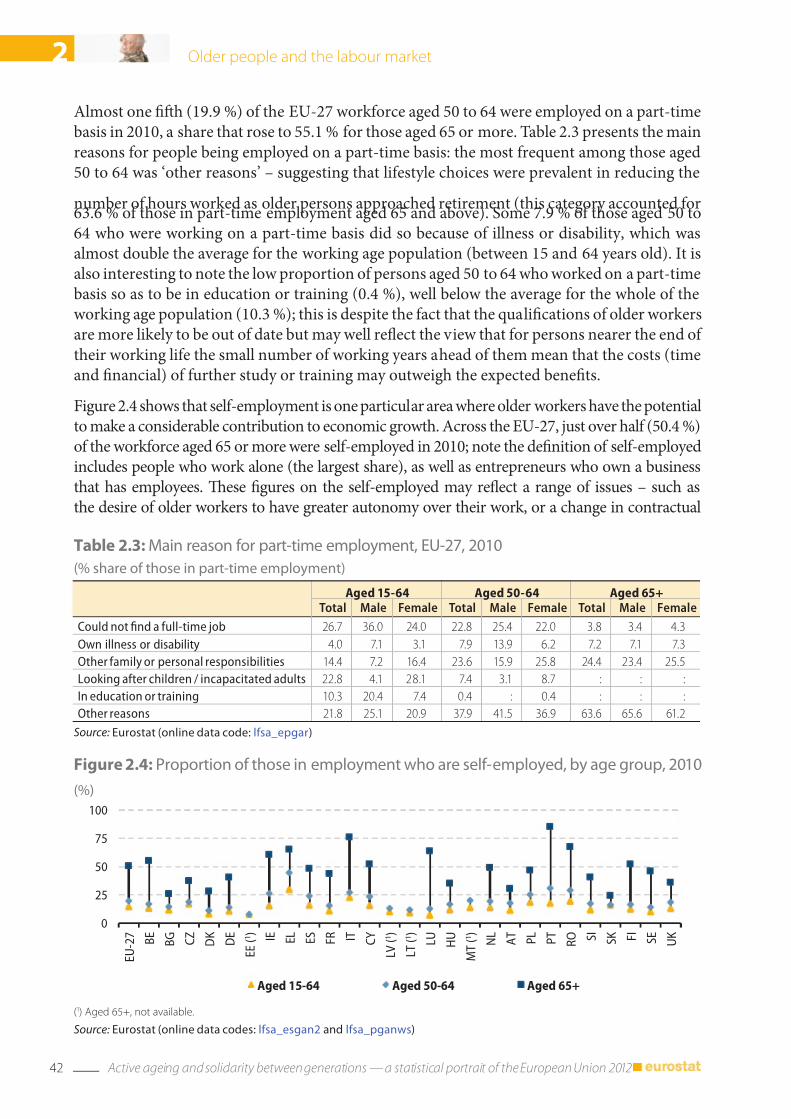
7/31/2019 Active ageing and solidarity between generations 2012 edition A statistical portrait of the European Union 2012
http://slidepdf.com/reader/full/active-ageing-and-solidarity-between-generations-2012-edition-a-statistical 44/147
42 Active ageing and solidarity between generations — a statistical portrait of the European Union 2012
2 Older people and the labour market
Figure 2.4: Proportion o those in employment who are sel‑employed, by age group, 2010
(%)
0
25
50
75
100
E U - 2 7
B E
B G
C Z
D K
D E
E E ( 1 )
I E E L
E S
F R I T
C Y
L V ( 1 )
L T ( 1 )
L U
H U
M T ( 1 )
N L
A T
P L
P T
R O S
I S K F
I S E
U K
Aged 15-64 Aged 50-64 Aged 65+
(1) Aged 65+, not available.
Source: Eurostat (online data codes: lsa_esgan2 and lsa_pganws)
Almost one fh (19.9 %) o the EU-27 workorce aged 50 to 64 were employed on a part-timebasis in 2010, a share that rose to 55.1 % or those aged 65 or more. able 2.3 presents the mainreasons or people being employed on a part-time basis: the most requent among those aged50 to 64 was ‘other reasons’ – suggesting that liestyle choices were prevalent in reducing the
number o hours worked as older persons approached retirement (this category accounted or63.6 % o those in part-time employment aged 65 and above). Some 7.9 % o those aged 50 to64 who were working on a part-time basis did so because o illness or disability, which wasalmost double the average or the working age population (between 15 and 64 years old). It isalso interesting to note the low proportion o persons aged 50 to 64 who worked on a part-timebasis so as to be in education or training (0.4 %), well below the average or the whole o theworking age population (10.3 %); this is despite the act that the qualications o older workersare more likely to be out o date but may well reect the view that or persons nearer the end o their working lie the small number o working years ahead o them mean that the costs (timeand nancial) o urther study or training may outweigh the expected benets.
Figure 2.4 shows that sel-employment is one particular area where older workers have the potentialto make a considerable contribution to economic growth. Across the EU-27, just over hal (50.4 %)o the workorce aged 65 or more were sel-employed in 2010; note the denition o sel-employedincludes people who work alone (the largest share), as well as entrepreneurs who own a businessthat has employees. Tese gures on the sel-employed may reect a range o issues – such asthe desire o older workers to have greater autonomy over their work, or a change in contractual
Table 2.3: Main reason or part‑time employment, EU‑27, 2010
(% share o those in part‑time employment)
Aged 15-64 Aged 50-64 Aged 65+Total Male Female Total Male Female Total Male Female
Could not nd a ull-time job 26.7 36.0 24.0 22.8 25.4 22.0 3.8 3.4 4.3
Own illness or disability 4.0 7.1 3.1 7.9 13.9 6.2 7.2 7.1 7.3
Other amily or personal responsibilities 14.4 7.2 16.4 23.6 15.9 25.8 24.4 23.4 25.5
Looking ater children / incapacitated adults 22.8 4.1 28.1 7.4 3.1 8.7 : : :
In education or training 10.3 20.4 7.4 0.4 : 0.4 : : :
Other reasons 21.8 25.1 20.9 37.9 41.5 36.9 63.6 65.6 61.2
Source: Eurostat (online data code: lsa_epgar)
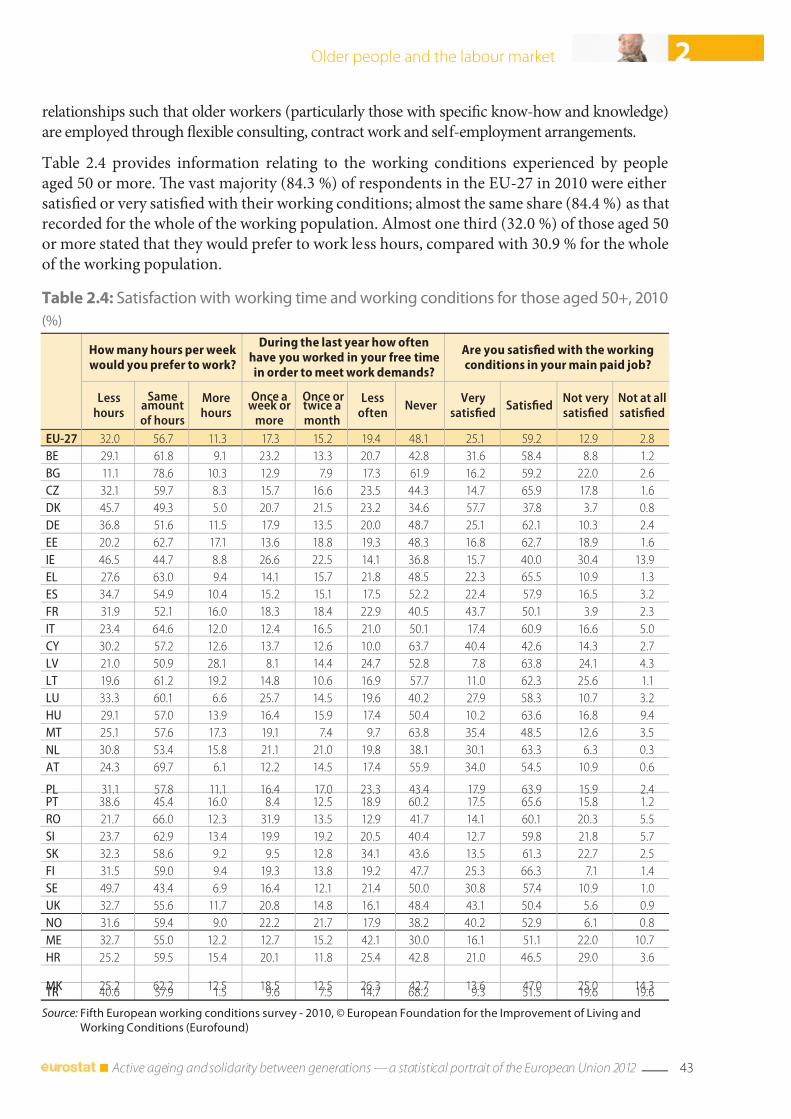
7/31/2019 Active ageing and solidarity between generations 2012 edition A statistical portrait of the European Union 2012
http://slidepdf.com/reader/full/active-ageing-and-solidarity-between-generations-2012-edition-a-statistical 45/147
43 Active ageing and solidarity between generations — a statistical portrait of the European Union 2012
2Older people and the labour market
Table 2.4: Satisaction with working time and working conditions or those aged 50+, 2010
(%)
How many hours per week would you preer to work?
During the last year how otenhave you worked in your ree timein order to meet work demands?
Are you satisfed with the workingconditions in your main paid job?
Lesshours
Sameamounto hours
Morehours
Once aweek or
more
Once ortwice amonth
Lessoten
NeverVery
satisedSatised
Not verysatised
Not at allsatised
EU-27 32.0 56.7 11.3 17.3 15.2 19.4 48.1 25.1 59.2 12.9 2.8
BE 29.1 61.8 9.1 23.2 13.3 20.7 42.8 31.6 58.4 8.8 1.2
BG 11.1 78.6 10.3 12.9 7.9 17.3 61.9 16.2 59.2 22.0 2.6
CZ 32.1 59.7 8.3 15.7 16.6 23.5 44.3 14.7 65.9 17.8 1.6
DK 45.7 49.3 5.0 20.7 21.5 23.2 34.6 57.7 37.8 3.7 0.8
DE 36.8 51.6 11.5 17.9 13.5 20.0 48.7 25.1 62.1 10.3 2.4
EE 20.2 62.7 17.1 13.6 18.8 19.3 48.3 16.8 62.7 18.9 1.6
IE 46.5 44.7 8.8 26.6 22.5 14.1 36.8 15.7 40.0 30.4 13.9
EL 27.6 63.0 9.4 14.1 15.7 21.8 48.5 22.3 65.5 10.9 1.3
ES 34.7 54.9 10.4 15.2 15.1 17.5 52.2 22.4 57.9 16.5 3.2
FR 31.9 52.1 16.0 18.3 18.4 22.9 40.5 43.7 50.1 3.9 2.3
IT 23.4 64.6 12.0 12.4 16.5 21.0 50.1 17.4 60.9 16.6 5.0
CY 30.2 57.2 12.6 13.7 12.6 10.0 63.7 40.4 42.6 14.3 2.7
LV 21.0 50.9 28.1 8.1 14.4 24.7 52.8 7.8 63.8 24.1 4.3
LT 19.6 61.2 19.2 14.8 10.6 16.9 57.7 11.0 62.3 25.6 1.1
LU 33.3 60.1 6.6 25.7 14.5 19.6 40.2 27.9 58.3 10.7 3.2
HU 29.1 57.0 13.9 16.4 15.9 17.4 50.4 10.2 63.6 16.8 9.4
MT 25.1 57.6 17.3 19.1 7.4 9.7 63.8 35.4 48.5 12.6 3.5
NL 30.8 53.4 15.8 21.1 21.0 19.8 38.1 30.1 63.3 6.3 0.3
AT 24.3 69.7 6.1 12.2 14.5 17.4 55.9 34.0 54.5 10.9 0.6
PL 31.1 57.8 11.1 16.4 17.0 23.3 43.4 17.9 63.9 15.9 2.4PT 38.6 45.4 16.0 8.4 12.5 18.9 60.2 17.5 65.6 15.8 1.2
RO 21.7 66.0 12.3 31.9 13.5 12.9 41.7 14.1 60.1 20.3 5.5
SI 23.7 62.9 13.4 19.9 19.2 20.5 40.4 12.7 59.8 21.8 5.7
SK 32.3 58.6 9.2 9.5 12.8 34.1 43.6 13.5 61.3 22.7 2.5
FI 31.5 59.0 9.4 19.3 13.8 19.2 47.7 25.3 66.3 7.1 1.4
SE 49.7 43.4 6.9 16.4 12.1 21.4 50.0 30.8 57.4 10.9 1.0
UK 32.7 55.6 11.7 20.8 14.8 16.1 48.4 43.1 50.4 5.6 0.9
NO 31.6 59.4 9.0 22.2 21.7 17.9 38.2 40.2 52.9 6.1 0.8
ME 32.7 55.0 12.2 12.7 15.2 42.1 30.0 16.1 51.1 22.0 10.7
HR 25.2 59.5 15.4 20.1 11.8 25.4 42.8 21.0 46.5 29.0 3.6
MK 25.2 62.2 12.5 18.5 12.5 26.3 42.7 13.6 47.0 25.0 14.3TR 40.6 57.9 1.5 9.6 7.5 14.7 68.2 9.3 51.5 19.6 19.6
Source: Fith European working conditions survey ‑ 2010, © European Foundation or the Improvement o Living and
Working Conditions (Euroound)
relationships such that older workers (particularly those with specic know-how and knowledge)are employed through exible consulting, contract work and sel-employment arrangements.
able 2.4 provides inormation relating to the working conditions experienced by peopleaged 50 or more. Te vast majority (84.3 %) o respondents in the EU-27 in 2010 were eithersatised or very satised with their working conditions; almost the same share (84.4 %) as thatrecorded or the whole o the working population. Almost one third (32.0 %) o those aged 50or more stated that they would preer to work less hours, compared with 30.9 % or the wholeo the working population.
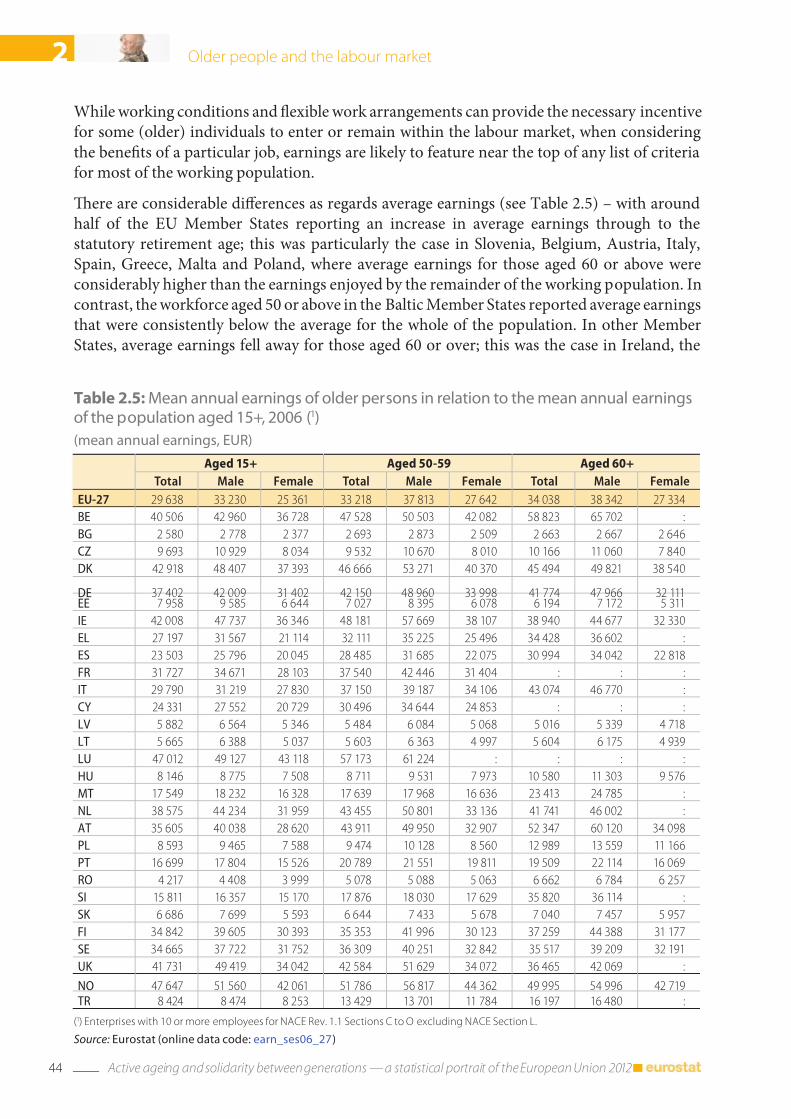
7/31/2019 Active ageing and solidarity between generations 2012 edition A statistical portrait of the European Union 2012
http://slidepdf.com/reader/full/active-ageing-and-solidarity-between-generations-2012-edition-a-statistical 46/147
44 Active ageing and solidarity between generations — a statistical portrait of the European Union 2012
2 Older people and the labour market
Table 2.5: Mean annual earnings o older persons in relation to the mean annual earningso the population aged 15+, 2006 (1)
(mean annual earnings, EUR)
Aged 15+ Aged 50-59 Aged 60+
Total Male Female Total Male Female Total Male Female
EU-27 29 638 33 230 25 361 33 218 37 813 27 642 34 038 38 342 27 334
BE 40 506 42 960 36 728 47 528 50 503 42 082 58 823 65 702 :
BG 2 580 2 778 2 377 2 693 2 873 2 509 2 663 2 667 2 646
CZ 9 693 10 929 8 034 9 532 10 670 8 010 10 166 11 060 7 840
DK 42 918 48 407 37 393 46 666 53 271 40 370 45 494 49 821 38 540
DE 37 402 42 009 31 402 42 150 48 960 33 998 41 774 47 966 32 111EE 7 958 9 585 6 644 7 027 8 395 6 078 6 194 7 172 5 311
IE 42 008 47 737 36 346 48 181 57 669 38 107 38 940 44 677 32 330
EL 27 197 31 567 21 114 32 111 35 225 25 496 34 428 36 602 :
ES 23 503 25 796 20 045 28 485 31 685 22 075 30 994 34 042 22 818
FR 31 727 34 671 28 103 37 540 42 446 31 404 : : :
IT 29 790 31 219 27 830 37 150 39 187 34 106 43 074 46 770 :
CY 24 331 27 552 20 729 30 496 34 644 24 853 : : :
LV 5 882 6 564 5 346 5 484 6 084 5 068 5 016 5 339 4 718
LT 5 665 6 388 5 037 5 603 6 363 4 997 5 604 6 175 4 939
LU 47 012 49 127 43 118 57 173 61 224 : : : :
HU 8 146 8 775 7 508 8 711 9 531 7 973 10 580 11 303 9 576
MT 17 549 18 232 16 328 17 639 17 968 16 636 23 413 24 785 :
NL 38 575 44 234 31 959 43 455 50 801 33 136 41 741 46 002 :
AT 35 605 40 038 28 620 43 911 49 950 32 907 52 347 60 120 34 098
PL 8 593 9 465 7 588 9 474 10 128 8 560 12 989 13 559 11 166
PT 16 699 17 804 15 526 20 789 21 551 19 811 19 509 22 114 16 069
RO 4 217 4 408 3 999 5 078 5 088 5 063 6 662 6 784 6 257
SI 15 811 16 357 15 170 17 876 18 030 17 629 35 820 36 114 :
SK 6 686 7 699 5 593 6 644 7 433 5 678 7 040 7 457 5 957
FI 34 842 39 605 30 393 35 353 41 996 30 123 37 259 44 388 31 177
SE 34 665 37 722 31 752 36 309 40 251 32 842 35 517 39 209 32 191
UK 41 731 49 419 34 042 42 584 51 629 34 072 36 465 42 069 :
NO 47 647 51 560 42 061 51 786 56 817 44 362 49 995 54 996 42 719
TR 8 424 8 474 8 253 13 429 13 701 11 784 16 197 16 480 :
(1) Enterprises with 10 or more employees or NACE Rev. 1.1 Sections C to O excluding NACE Section L.
Source: Eurostat (online data code: earn_ses06_27)
While working conditions and exible work arrangements can provide the necessary incentiveor some (older) individuals to enter or remain within the labour market, when consideringthe benets o a particular job, earnings are likely to eature near the top o any list o criteriaor most o the working population.
Tere are considerable dierences as regards average earnings (see able 2.5) – with aroundhal o the EU Member States reporting an increase in average earnings through to thestatutory retirement age; this was particularly the case in Slovenia, Belgium, Austria, Italy,Spain, Greece, Malta and Poland, where average earnings or those aged 60 or above wereconsiderably higher than the earnings enjoyed by the remainder o the working population. Incontrast, the workorce aged 50 or above in the Baltic Member States reported average earningsthat were consistently below the average or the whole o the population. In other MemberStates, average earnings ell away or those aged 60 or over; this was the case in Ireland, the
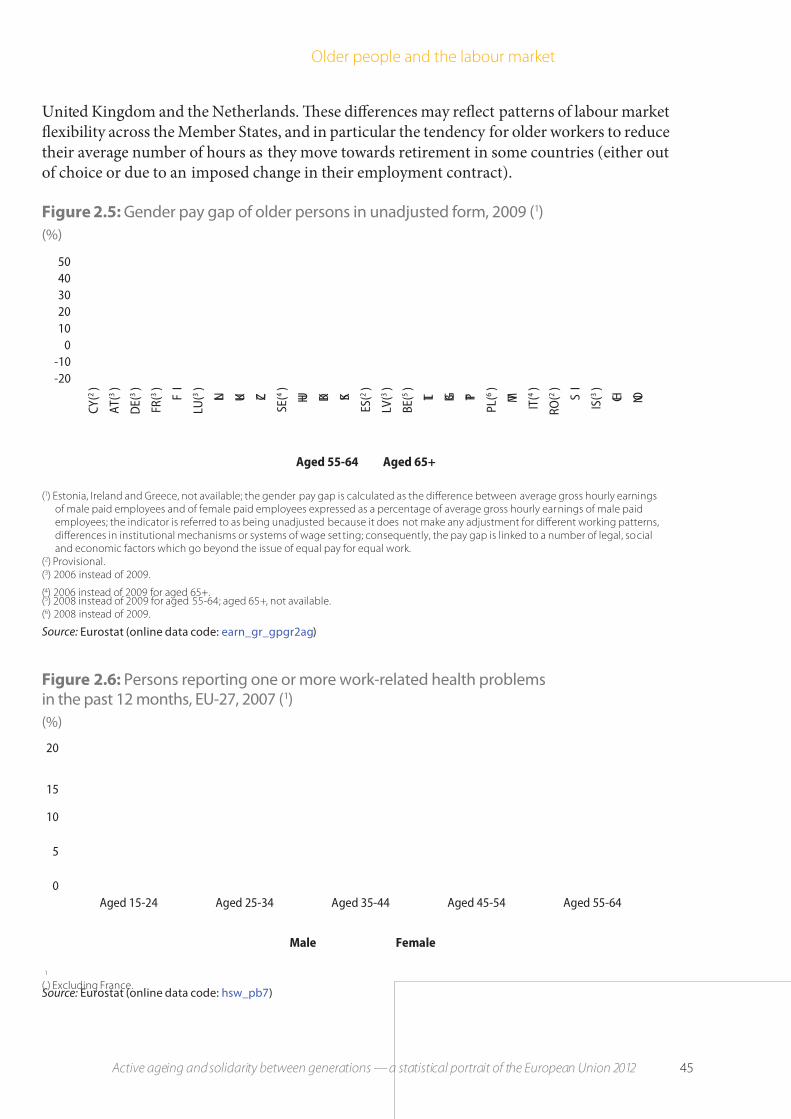
7/31/2019 Active ageing and solidarity between generations 2012 edition A statistical portrait of the European Union 2012
http://slidepdf.com/reader/full/active-ageing-and-solidarity-between-generations-2012-edition-a-statistical 47/147
45 Active ageing and solidarity between generations — a statistical portrait of the European Union 2012
2Older people and the labour market
Figure 2.5: Gender pay gap o older persons in unadjusted orm, 2009 (1)
(%)
-20
-10
0
10
20
30
40
50
C Y ( 2 )
A T ( 3 )
D E ( 3 )
F R ( 3 ) F I
L U ( 3 ) N L U K C Z
S E ( 4 )
H U D K S K
E S ( 2 )
L V ( 3 )
B E ( 5 ) L T B G P T
P L ( 6 )
M T I T ( 4 )
R O ( 2 ) S I
I S ( 3 ) C H N O
Aged 55-64 Aged 65+
(1) Estonia, Ireland and Greece, not available; the gender pay gap is calculated as the diference between average gross hourly earningso male paid employees and o emale paid employees expressed as a percentage o average gross hourly earnings o male paidemployees; the indicator is reerred to as being unadjusted because it does not make any adjustment or diferent working patterns,diferences in institutional mechanisms or systems o wage set ting; consequently, the pay gap is linked to a number o legal, socialand economic actors which go beyond the issue o equal pay or equal work.
(2) Provisional.(3) 2006 instead o 2009.
(4) 2006 instead o 2009 or aged 65+.(5) 2008 instead o 2009 or aged 55-64; aged 65+, not available.(6) 2008 instead o 2009.
Source: Eurostat (online data code: earn_gr_gpgr2ag)
United Kingdom and the Netherlands. Tese dierences may reect patterns o labour marketexibility across the Member States, and in particular the tendency or older workers to reducetheir average number o hours as they move towards retirement in some countries (either outo choice or due to an imposed change in their employment contract).
Figure 2.6: Persons reporting one or more work‑related health problemsin the past 12 months, EU‑27, 2007 (1)
(%)
0
5
10
15
20
Aged 15-24 Aged 25-34 Aged 35-44 Aged 45-54 Aged 55-64
Male Female
(
1
) Excluding France.Source: Eurostat (online data code: hsw_pb7)
7/31/2019 Active ageing and solidarity between generations 2012 edition A statistical portrait of the European Union 2012
http://slidepdf.com/reader/full/active-ageing-and-solidarity-between-generations-2012-edition-a-statistical 48/147
46 Active ageing and solidarity between generations — a statistical portrait of the European Union 2012
2 Older people and the labour market
Tere remains a relatively wide gap between the average earnings o men and women acrossmost o the EU Member States. Figure 2.5 shows this was particularly the case in Cyprus,Austria, Germany, France and Finland; note the dierent reerence periods. Te disparity inearnings by gender was generally even wider among those aged 65 or more.
While pecuniary rewards (earnings) are an important element o job satisaction or many,other people place emphasis on non-pecuniary aspects; or example, health and saety in theworkplace. Older workers tended to report considerably more work-related health problems.Across the EU (excluding France), one in six (16.8 %) persons aged 45 to 54 years reported atleast one work-related health problem in 2007, a share that ell to 15.8 % among those aged55 to 64. Tese gures suggest that policymakers might consider health promotion campaignsin the workplace in order to improve the general health o older persons, reduce absenteeismassociated with such problems, and prolong potential working lives.
Te likelihood o having an accident at work is closely linked to the activities in which people
work – or example, accidents are ar more likely in the mining and quarrying, constructionor transport sectors. Across the EU, just over one fh (21.1 %) o all accidents at work thatresulted in our or more days absence involved persons aged 45 to 54 years, while a urther9.3 % involved persons aged 55 to 64 and 1.6 % involved those over 65. Figure 2.7 shows thatcompared with accidents that result in at least our days absence, atal accidents are relatively prevalent among older members o the workorce. Te highest proportion (30.1 %) o atalaccidents at work in the EU in 2008 took place among those aged 45 to 54 years; a urther15.8 % o atal accidents involved those aged 55 to 64 and 4.9 % involved those aged 65 orover. Note that all o these shares depend upon the number o persons in employment within a
particular age group, and that there were ar ewer persons aged 55 or above still in employmentdue to early retirement and other reasons or leaving the workorce.
Figure 2.7: Accidents at work by age, EU average, 2008 (1)
(% share o accidents)
0
5
10
15
20
25
30
35
Aged 18-24 Aged 25-34 Aged 35-44 Aged 45-54 Aged 55-64 Aged 65+
Resulting in four days absence or more Fatal accidents
(1) Accidents within NACE Rev. 2 Sections A, and C to N; average based upon those Member States or which data are available; excludingGreece, Latvia, Poland, Por tugal and Romania or accidents resulting in our days absence or more; excluding Estonia, Ireland, Greece,Cyprus, Luxembourg, Malta, the Netherlands, Portugal, Slovenia and Finland or atal accidents.
Source: Eurostat (online data code: hsw_mi01)
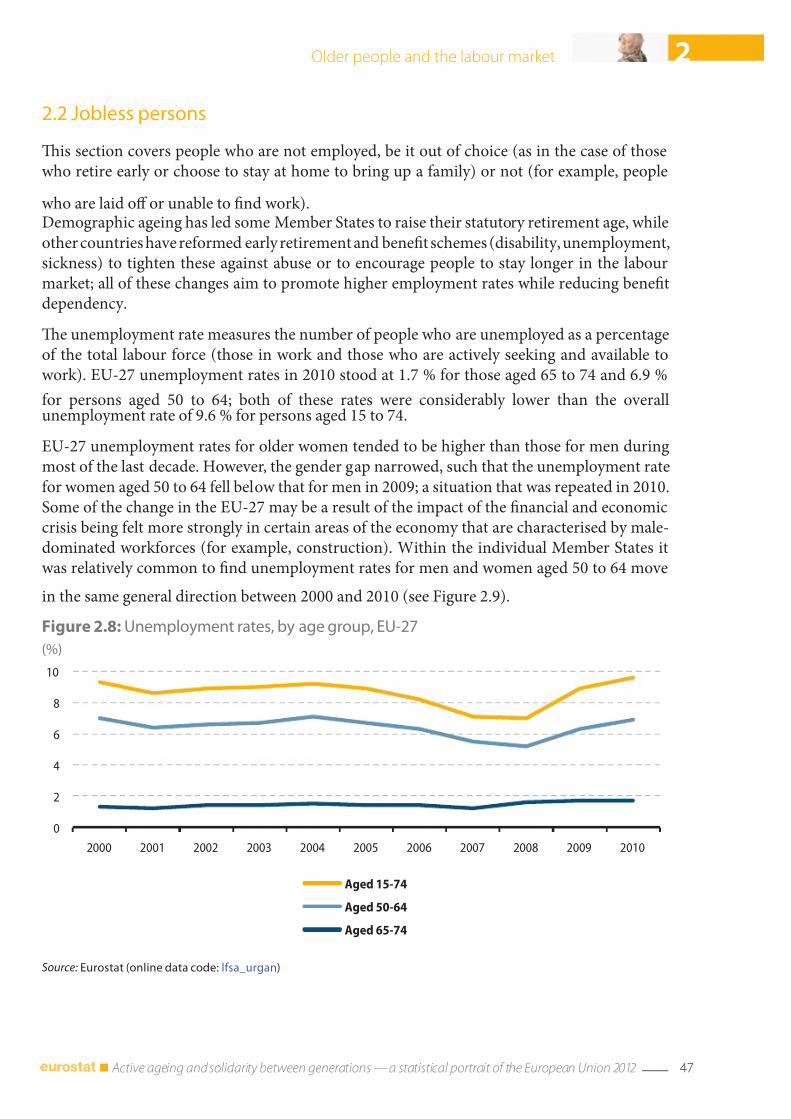
7/31/2019 Active ageing and solidarity between generations 2012 edition A statistical portrait of the European Union 2012
http://slidepdf.com/reader/full/active-ageing-and-solidarity-between-generations-2012-edition-a-statistical 49/147
47 Active ageing and solidarity between generations — a statistical portrait of the European Union 2012
2Older people and the labour market
Figure 2.8: Unemployment rates, by age group, EU‑27
(%)
0
2
4
6
8
10
2000 2001 2002 2003 2004 2005 2006 2007 2008 2009 2010
Aged 15-74
Aged 50-64
Aged 65-74
Source: Eurostat (online data code: lsa_urgan)
2.2 Jobless persons
Tis section covers people who are not employed, be it out o choice (as in the case o thosewho retire early or choose to stay at home to bring up a amily) or not (or example, people
who are laid o or unable to nd work).Demographic ageing has led some Member States to raise their statutory retirement age, whileother countries have reormed early retirement and benet schemes (disability, unemployment,sickness) to tighten these against abuse or to encourage people to stay longer in the labourmarket; all o these changes aim to promote higher employment rates while reducing benetdependency.
Te unemployment rate measures the number o people who are unemployed as a percentageo the total labour orce (those in work and those who are actively seeking and available towork). EU-27 unemployment rates in 2010 stood at 1.7 % or those aged 65 to 74 and 6.9 %
or persons aged 50 to 64; both o these rates were considerably lower than the overallunemployment rate o 9.6 % or persons aged 15 to 74.
EU-27 unemployment rates or older women tended to be higher than those or men duringmost o the last decade. However, the gender gap narrowed, such that the unemployment rateor women aged 50 to 64 ell below that or men in 2009; a situation that was repeated in 2010.Some o the change in the EU-27 may be a result o the impact o the nancial and economiccrisis being elt more strongly in certain areas o the economy that are characterised by male-dominated workorces (or example, construction). Within the individual Member States itwas relatively common to nd unemployment rates or men and women aged 50 to 64 move
in the same general direction between 2000 and 2010 (see Figure 2.9).
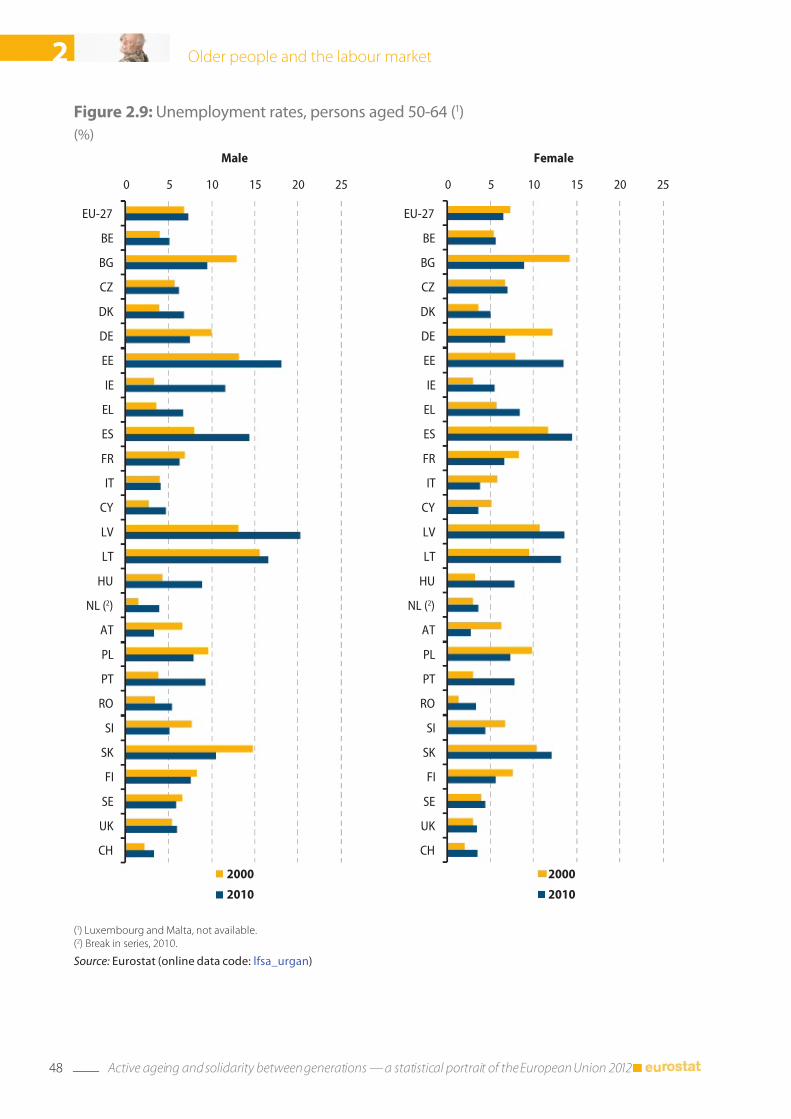
7/31/2019 Active ageing and solidarity between generations 2012 edition A statistical portrait of the European Union 2012
http://slidepdf.com/reader/full/active-ageing-and-solidarity-between-generations-2012-edition-a-statistical 50/147
48 Active ageing and solidarity between generations — a statistical portrait of the European Union 2012
2 Older people and the labour market
Figure 2.9: Unemployment rates, persons aged 50‑64 (1)
(%)
0 5 10 15 20 25
EU-27
BE
BG
CZ
DK
DE
EE
IE
EL
ES
FR
IT
CY
LV
LT
HU
NL (2)
AT
PL
PT
RO
SI
SK
FI
SE
UK
CH
Male
2000
2010
(1) Luxembourg and Malta, not available.(2) Break in series, 2010.
Source: Eurostat (online data code: lsa_urgan)
0 5 10 15 20 25
EU-27
BE
BG
CZ
DK
DE
EE
IE
EL
ES
FR
IT
CY
LV
LT
HU
NL (2)
AT
PL
PT
RO
SI
SK
FI
SE
UK
CH
Female
2000
2010
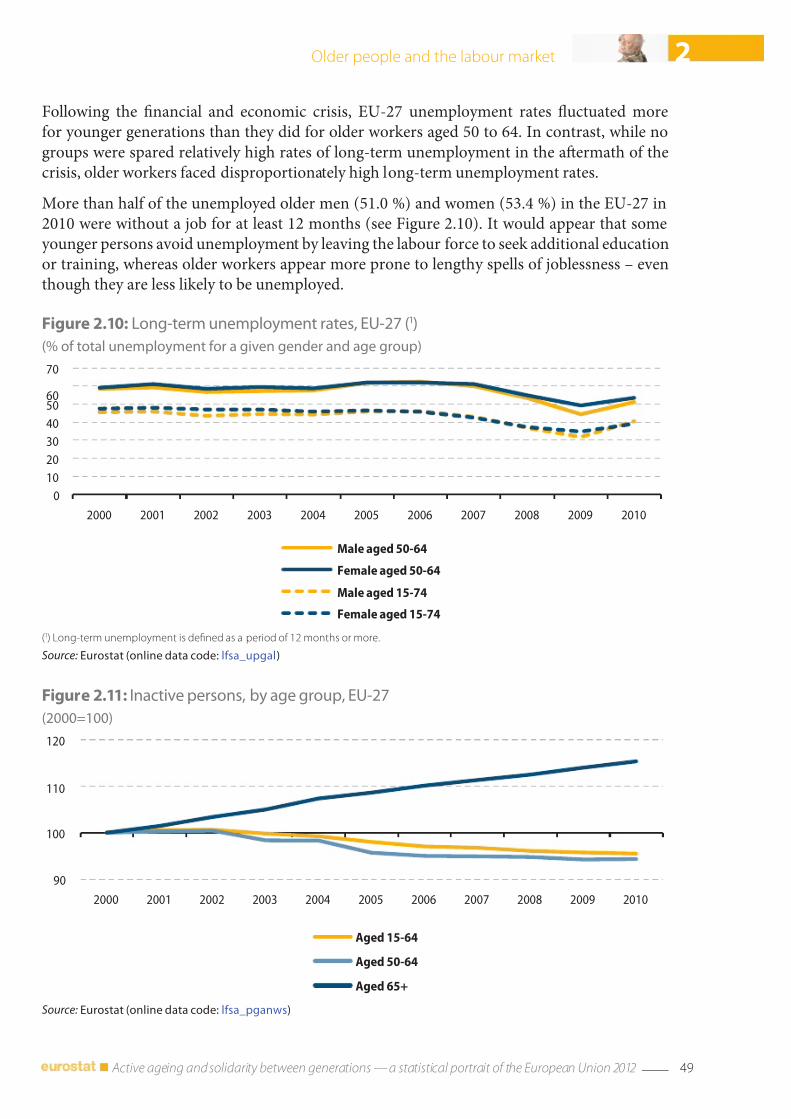
7/31/2019 Active ageing and solidarity between generations 2012 edition A statistical portrait of the European Union 2012
http://slidepdf.com/reader/full/active-ageing-and-solidarity-between-generations-2012-edition-a-statistical 51/147
49 Active ageing and solidarity between generations — a statistical portrait of the European Union 2012
2Older people and the labour market
Figure 2.10: Long‑term unemployment rates, EU‑27 (1)
(% o total unemployment or a given gender and age group)
0
10
20
30
40
5060
70
2000 2001 2002 2003 2004 2005 2006 2007 2008 2009 2010
Male aged 50-64
Female aged 50-64
Male aged 15-74
Female aged 15-74
(1) Long-term unemployment is dened as a period o 12 months or more.
Source: Eurostat (online data code: lsa_upgal)
Figure 2.11: Inactive persons, by age group, EU‑27
(2000=100)
90
100
110
120
2000 2001 2002 2003 2004 2005 2006 2007 2008 2009 2010
Aged 15-64
Aged 50-64
Aged 65+
Source: Eurostat (online data code: lsa_pganws)
Following the nancial and economic crisis, EU-27 unemployment rates uctuated moreor younger generations than they did or older workers aged 50 to 64. In contrast, while nogroups were spared relatively high rates o long-term unemployment in the afermath o thecrisis, older workers aced disproportionately high long-term unemployment rates.
More than hal o the unemployed older men (51.0 %) and women (53.4 %) in the EU-27 in2010 were without a job or at least 12 months (see Figure 2.10). It would appear that someyounger persons avoid unemployment by leaving the labour orce to seek additional educationor training, whereas older workers appear more prone to lengthy spells o joblessness – eventhough they are less likely to be unemployed.

7/31/2019 Active ageing and solidarity between generations 2012 edition A statistical portrait of the European Union 2012
http://slidepdf.com/reader/full/active-ageing-and-solidarity-between-generations-2012-edition-a-statistical 52/147
50 Active ageing and solidarity between generations — a statistical portrait of the European Union 2012
2 Older people and the labour market
Figure 2.12: Inactive persons, by gender and by age group, EU‑27
(% share o the total population or a given gender and age group)
0
25
50
75100
Aged
15-64
Aged
50-54
Aged
55-59
Aged
60-64
Aged
65-69
Aged
70-74
Aged
75+
Male
Source: Eurostat (online data code: lsa_ipga)
0
25
50
75
100
Aged
15-64
Aged
50-54
Aged
55-59
Aged
60-64
Aged
65-69
Aged
70-74
Aged
75+
Female
2000 2010
For some people long-term unemployment provides a de acto route to early retirement –dependent upon labour market policy measures – this is more common in some countries.Tere were particularly high long-term unemployment rates among those aged 50 to 64 inBelgium, Portugal and Slovakia in 2010, where more than seven out o ten unemployed persons
spent at least the previous 12 months without work. Early, progressive or phased retirementare more common within a range o service sectors according to a Euroound study conductedin 2006 (11). Tis showed that a high proportion o employers within education, nancialintermediation and health and social work activities oered early retirement to their sta.
Among the population aged 50 to 64 years, (early) retirement was the most ofen cited reasonor inactivity within the EU-27 in 2010, ollowed by illness or disability, and amily or personalresponsibilities. able 2.6 presents some o the main reasons why persons aged 50 to 64 didnot seek employment in 2010. Just over hal (50.8 %) o those not seeking employment in theEU-27 had already retired; among the remainder, the main reasons included illness or disability
(19.8 %) and other amily or personal responsibilities (8.1 %) – the latter was relatively moreimportant among women (12.3 %) than men (1.5 %). Economic inactivity among such olderpersons (aged 50 to 64) was reduced over the last decade (see Figure 2.11), reecting increased
(11) Available at: http://www.euroound.europa.eu/pubdocs/2006/88/en/1/e0688en.pd .

7/31/2019 Active ageing and solidarity between generations 2012 edition A statistical portrait of the European Union 2012
http://slidepdf.com/reader/full/active-ageing-and-solidarity-between-generations-2012-edition-a-statistical 53/147
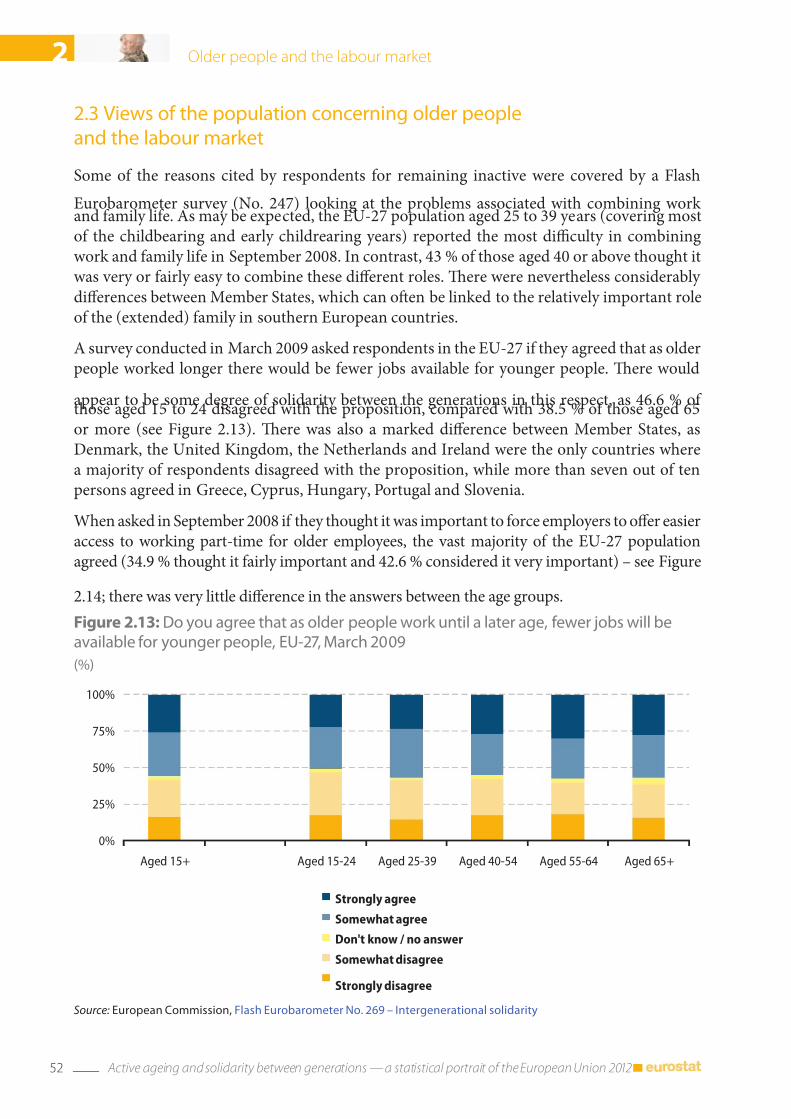
7/31/2019 Active ageing and solidarity between generations 2012 edition A statistical portrait of the European Union 2012
http://slidepdf.com/reader/full/active-ageing-and-solidarity-between-generations-2012-edition-a-statistical 54/147
52 Active ageing and solidarity between generations — a statistical portrait of the European Union 2012
2 Older people and the labour market
2.3 Views o the population concerning older people
and the labour market
Some o the reasons cited by respondents or remaining inactive were covered by a Flash
Eurobarometer survey (No. 247) looking at the problems associated with combining work and amily lie. As may be expected, the EU-27 population aged 25 to 39 years (covering mosto the childbearing and early childrearing years) reported the most diculty in combiningwork and amily lie in September 2008. In contrast, 43 % o those aged 40 or above thought itwas very or airly easy to combine these dierent roles. Tere were nevertheless considerably dierences between Member States, which can ofen be linked to the relatively important roleo the (extended) amily in southern European countries.
A survey conducted in March 2009 asked respondents in the EU-27 i they agreed that as olderpeople worked longer there would be ewer jobs available or younger people. Tere would
appear to be some degree o solidarity between the generations in this respect, as 46.6 % o those aged 15 to 24 disagreed with the proposition, compared with 38.5 % o those aged 65or more (see Figure 2.13). Tere was also a marked dierence between Member States, asDenmark, the United Kingdom, the Netherlands and Ireland were the only countries wherea majority o respondents disagreed with the proposition, while more than seven out o tenpersons agreed in Greece, Cyprus, Hungary, Portugal and Slovenia.
When asked in September 2008 i they thought it was important to orce employers to oer easieraccess to working part-time or older employees, the vast majority o the EU-27 populationagreed (34.9 % thought it airly important and 42.6 % considered it very important) – see Figure
2.14; there was very little dierence in the answers between the age groups.
Figure 2.13: Do you agree that as older people work until a later age, ewer jobs will beavailable or younger people, EU‑27, March 2009
(%)
0%
25%
50%
75%
100%
Aged 15+ Aged 15-24 Aged 25-39 Aged 40-54 Aged 55-64 Aged 65+
Strongly agree
Somewhat agree
Don't know / no answer
Somewhat disagree
Strongly disagree
Source: European Commission, Flash Eurobarometer No. 269 – Intergenerational solidarity

7/31/2019 Active ageing and solidarity between generations 2012 edition A statistical portrait of the European Union 2012
http://slidepdf.com/reader/full/active-ageing-and-solidarity-between-generations-2012-edition-a-statistical 55/147

7/31/2019 Active ageing and solidarity between generations 2012 edition A statistical portrait of the European Union 2012
http://slidepdf.com/reader/full/active-ageing-and-solidarity-between-generations-2012-edition-a-statistical 56/147
7/31/2019 Active ageing and solidarity between generations 2012 edition A statistical portrait of the European Union 2012
http://slidepdf.com/reader/full/active-ageing-and-solidarity-between-generations-2012-edition-a-statistical 57/147
55 Active ageing and solidarity between generations — a statistical portrait of the European Union 2012
Transition from work to retirement
Each Member State has responsibility or its own retirement systems, and these are underpinnedacross the EU by a ramework o activities spanning rom policy coordination to regulation –or example:
• the stability and growth pact (SGP) which provides or the monitoring and sustainability o public nances – including pension systems;
• the open method o coordination on social protection and inclusion;• the consistency o any pension reorm with the Europe 2020 strategy;•
the unctioning o the internal market – especially with respect to nancial services.Tese dierent policy areas can be mutually benecial to each other: or example, the Europe2020 strategy emphasises higher employment rates, which would increase social security contributions and help generate adequate and sustainable retirement incomes. Conversely,addressing gaps in pension adequacy could result in an overall reduction in poverty – a Europe2020 target.
In general, one o the main policy concerns in relation to pensions relates to the ability o systems to provide adequate and sustainable retirement. Tis implies the provision o pensionsthat nd a balance between the living standards o pensioners and the issue o who is going to
pay or the retirement o uture generations. Tese concerns are maniest at several dierentlevels, including:
• governments – who need to balance budgets, while ensuring an adequate pensionprovision;
• generations – where there is potential or conict as younger working-age populations arelikely to ace dierent conditions compared with existing pensioners;
• individuals – who may be concerned about their own security during retirement.
In order to address these challenges, the European Commission has launched a discussion onthe uture o pension provisions in the EU by releasing a green paper titled ‘owards adequate,sustainable and sae European pension systems’ (12).
(12) COM(2010) 365, available at: http://eur-lex.europa.eu/LexUriServ/LexUriServ.do?uri=COM:2010:0365:FIN:EN:PDF .

7/31/2019 Active ageing and solidarity between generations 2012 edition A statistical portrait of the European Union 2012
http://slidepdf.com/reader/full/active-ageing-and-solidarity-between-generations-2012-edition-a-statistical 58/147

7/31/2019 Active ageing and solidarity between generations 2012 edition A statistical portrait of the European Union 2012
http://slidepdf.com/reader/full/active-ageing-and-solidarity-between-generations-2012-edition-a-statistical 59/147
57 Active ageing and solidarity between generations — a statistical portrait of the European Union 2012
3 Transition rom work to retirement
Figure 3.2: Employed persons who would stay longer at work i more exible workingtime arrangements were available, EU‑27, 2006 (1)
(% share o those employed aged 50‑69)
0
5
10
15
20
25
Total Managers,
professionals,
technicians and
associate
professionals
Service workers
and shop and
market sales
workers
Clerks Skilled manual
workers
Elementary
occupations
(1) Survey conducted among persons who were aged 50 -69 (and who had worked at least up to the age o 50).
Source: Eurostat (online data code: lso_06exisco)
Figure 3.3: Planned age or stopping work, 2006 (1)(% share o those employed aged 50‑69)
0%
25%
50%
75%
100%
E U - 2 7
R O I T E
E S E I E
C Y
U K
P T
E S
N L
D E
S K
E L
D K
B G
B E F
I
H U
F R
C Z S
I P L
A T
L U
L V
L T
N O
At age 50-59
At age 60-64
Don't know / no response
At age 65+ or as long as possible
(1) Survey conducted among persons who were aged 50 -69 (and who had worked at least up to the age o 50); Malta, incomplete.
Source: Eurostat (online data code: lso_06plagtpt)

7/31/2019 Active ageing and solidarity between generations 2012 edition A statistical portrait of the European Union 2012
http://slidepdf.com/reader/full/active-ageing-and-solidarity-between-generations-2012-edition-a-statistical 60/147

7/31/2019 Active ageing and solidarity between generations 2012 edition A statistical portrait of the European Union 2012
http://slidepdf.com/reader/full/active-ageing-and-solidarity-between-generations-2012-edition-a-statistical 61/147

7/31/2019 Active ageing and solidarity between generations 2012 edition A statistical portrait of the European Union 2012
http://slidepdf.com/reader/full/active-ageing-and-solidarity-between-generations-2012-edition-a-statistical 62/147
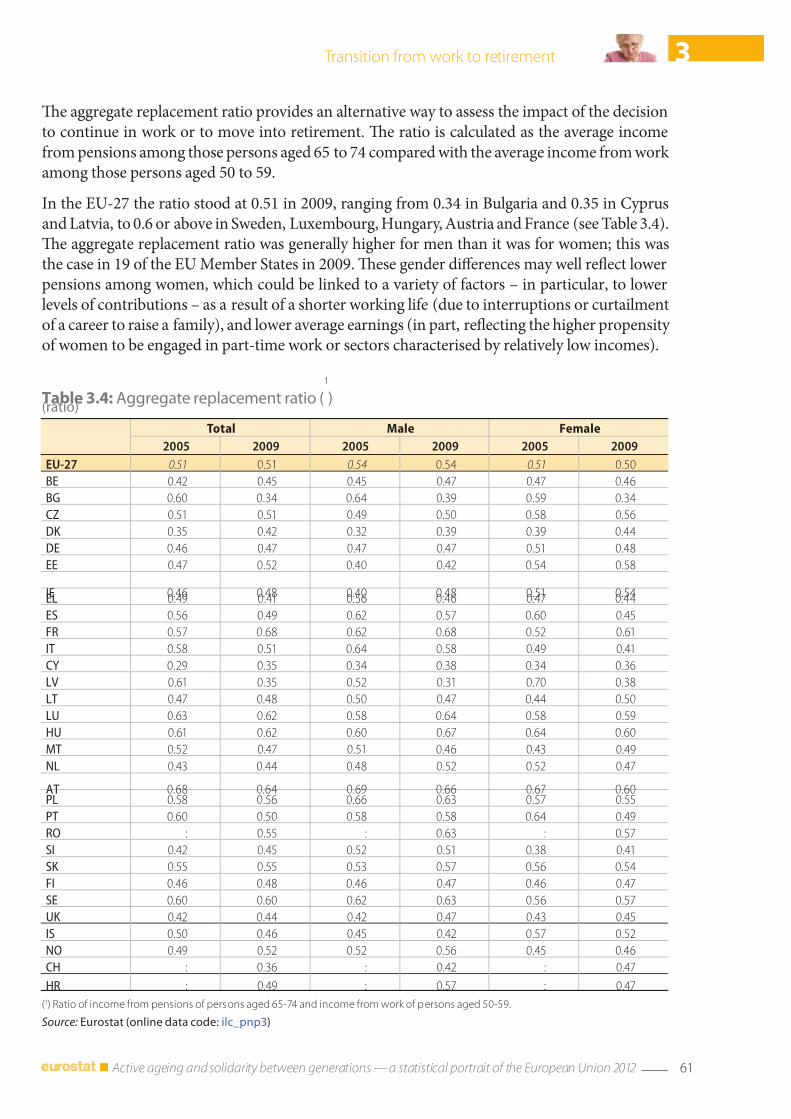
7/31/2019 Active ageing and solidarity between generations 2012 edition A statistical portrait of the European Union 2012
http://slidepdf.com/reader/full/active-ageing-and-solidarity-between-generations-2012-edition-a-statistical 63/147
61 Active ageing and solidarity between generations — a statistical portrait of the European Union 2012
3 Transition rom work to retirement
Table 3.4: Aggregate replacement ratio (1
)(ratio)
Total Male Female
2005 2009 2005 2009 2005 2009
EU-27 0.51 0.51 0.54 0.54 0.51 0.50
BE 0.42 0.45 0.45 0.47 0.47 0.46
BG 0.60 0.34 0.64 0.39 0.59 0.34
CZ 0.51 0.51 0.49 0.50 0.58 0.56
DK 0.35 0.42 0.32 0.39 0.39 0.44
DE 0.46 0.47 0.47 0.47 0.51 0.48
EE 0.47 0.52 0.40 0.42 0.54 0.58
IE 0.46 0.48 0.40 0.48 0.51 0.54EL 0.49 0.41 0.56 0.46 0.47 0.44
ES 0.56 0.49 0.62 0.57 0.60 0.45
FR 0.57 0.68 0.62 0.68 0.52 0.61
IT 0.58 0.51 0.64 0.58 0.49 0.41
CY 0.29 0.35 0.34 0.38 0.34 0.36
LV 0.61 0.35 0.52 0.31 0.70 0.38
LT 0.47 0.48 0.50 0.47 0.44 0.50
LU 0.63 0.62 0.58 0.64 0.58 0.59
HU 0.61 0.62 0.60 0.67 0.64 0.60
MT 0.52 0.47 0.51 0.46 0.43 0.49
NL 0.43 0.44 0.48 0.52 0.52 0.47
AT 0.68 0.64 0.69 0.66 0.67 0.60PL 0.58 0.56 0.66 0.63 0.57 0.55
PT 0.60 0.50 0.58 0.58 0.64 0.49
RO : 0.55 : 0.63 : 0.57
SI 0.42 0.45 0.52 0.51 0.38 0.41
SK 0.55 0.55 0.53 0.57 0.56 0.54
FI 0.46 0.48 0.46 0.47 0.46 0.47
SE 0.60 0.60 0.62 0.63 0.56 0.57
UK 0.42 0.44 0.42 0.47 0.43 0.45
IS 0.50 0.46 0.45 0.42 0.57 0.52
NO 0.49 0.52 0.52 0.56 0.45 0.46
CH : 0.36 : 0.42 : 0.47
HR : 0.49 : 0.57 : 0.47
(1) Ratio o income rom pensions o persons aged 65-74 and income rom work o p ersons aged 50-59.
Source: Eurostat (online data code: ilc_pnp3)
Te aggregate replacement ratio provides an alternative way to assess the impact o the decisionto continue in work or to move into retirement. Te ratio is calculated as the average incomerom pensions among those persons aged 65 to 74 compared with the average income rom work among those persons aged 50 to 59.
In the EU-27 the ratio stood at 0.51 in 2009, ranging rom 0.34 in Bulgaria and 0.35 in Cyprusand Latvia, to 0.6 or above in Sweden, Luxembourg, Hungary, Austria and France (see able 3.4).Te aggregate replacement ratio was generally higher or men than it was or women; this wasthe case in 19 o the EU Member States in 2009. Tese gender dierences may well reect lowerpensions among women, which could be linked to a variety o actors – in particular, to lowerlevels o contributions – as a result o a shorter working lie (due to interruptions or curtailmento a career to raise a amily), and lower average earnings (in part, reecting the higher propensity o women to be engaged in part-time work or sectors characterised by relatively low incomes).
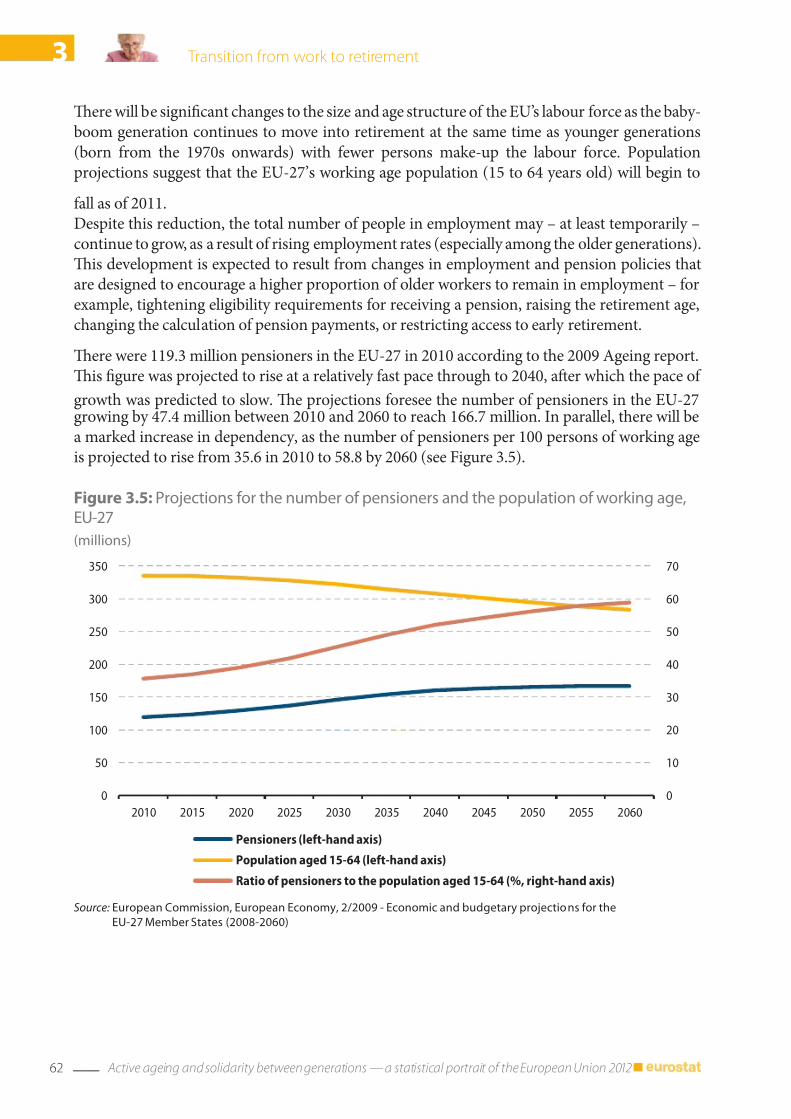
7/31/2019 Active ageing and solidarity between generations 2012 edition A statistical portrait of the European Union 2012
http://slidepdf.com/reader/full/active-ageing-and-solidarity-between-generations-2012-edition-a-statistical 64/147
62 Active ageing and solidarity between generations — a statistical portrait of the European Union 2012
3 Transition rom work to retirement
Figure 3.5: Projections or the number o pensioners and the population o working age,EU‑27
(millions)
0
10
20
30
40
50
60
70
0
50
100
150
200
250
300
350
2010 2015 2020 2025 2030 2035 2040 2045 2050 2055 2060
Pensioners (left-hand axis)
Population aged 15-64 (left-hand axis)
Ratio of pensioners to the population aged 15-64 (%, right-hand axis)
Source: European Commission, European Economy, 2/2009 ‑ Economic and budgetary projections or the
EU‑27 Member States (2008‑2060)
Tere will be signicant changes to the size and age structure o the EU’s labour orce as the baby-boom generation continues to move into retirement at the same time as younger generations(born rom the 1970s onwards) with ewer persons make-up the labour orce. Populationprojections suggest that the EU-27’s working age population (15 to 64 years old) will begin to
all as o 2011.Despite this reduction, the total number o people in employment may – at least temporarily –continue to grow, as a result o rising employment rates (especially among the older generations).Tis development is expected to result rom changes in employment and pension policies thatare designed to encourage a higher proportion o older workers to remain in employment – orexample, tightening eligibility requirements or receiving a pension, raising the retirement age,changing the calculation o pension payments, or restricting access to early retirement.
Tere were 119.3 million pensioners in the EU-27 in 2010 according to the 2009 Ageing report.Tis gure was projected to rise at a relatively ast pace through to 2040, afer which the pace o
growth was predicted to slow. Te projections oresee the number o pensioners in the EU-27growing by 47.4 million between 2010 and 2060 to reach 166.7 million. In parallel, there will bea marked increase in dependency, as the number o pensioners per 100 persons o working ageis projected to rise rom 35.6 in 2010 to 58.8 by 2060 (see Figure 3.5).

7/31/2019 Active ageing and solidarity between generations 2012 edition A statistical portrait of the European Union 2012
http://slidepdf.com/reader/full/active-ageing-and-solidarity-between-generations-2012-edition-a-statistical 65/147

7/31/2019 Active ageing and solidarity between generations 2012 edition A statistical portrait of the European Union 2012
http://slidepdf.com/reader/full/active-ageing-and-solidarity-between-generations-2012-edition-a-statistical 66/147

7/31/2019 Active ageing and solidarity between generations 2012 edition A statistical portrait of the European Union 2012
http://slidepdf.com/reader/full/active-ageing-and-solidarity-between-generations-2012-edition-a-statistical 67/147

7/31/2019 Active ageing and solidarity between generations 2012 edition A statistical portrait of the European Union 2012
http://slidepdf.com/reader/full/active-ageing-and-solidarity-between-generations-2012-edition-a-statistical 68/147

7/31/2019 Active ageing and solidarity between generations 2012 edition A statistical portrait of the European Union 2012
http://slidepdf.com/reader/full/active-ageing-and-solidarity-between-generations-2012-edition-a-statistical 69/147
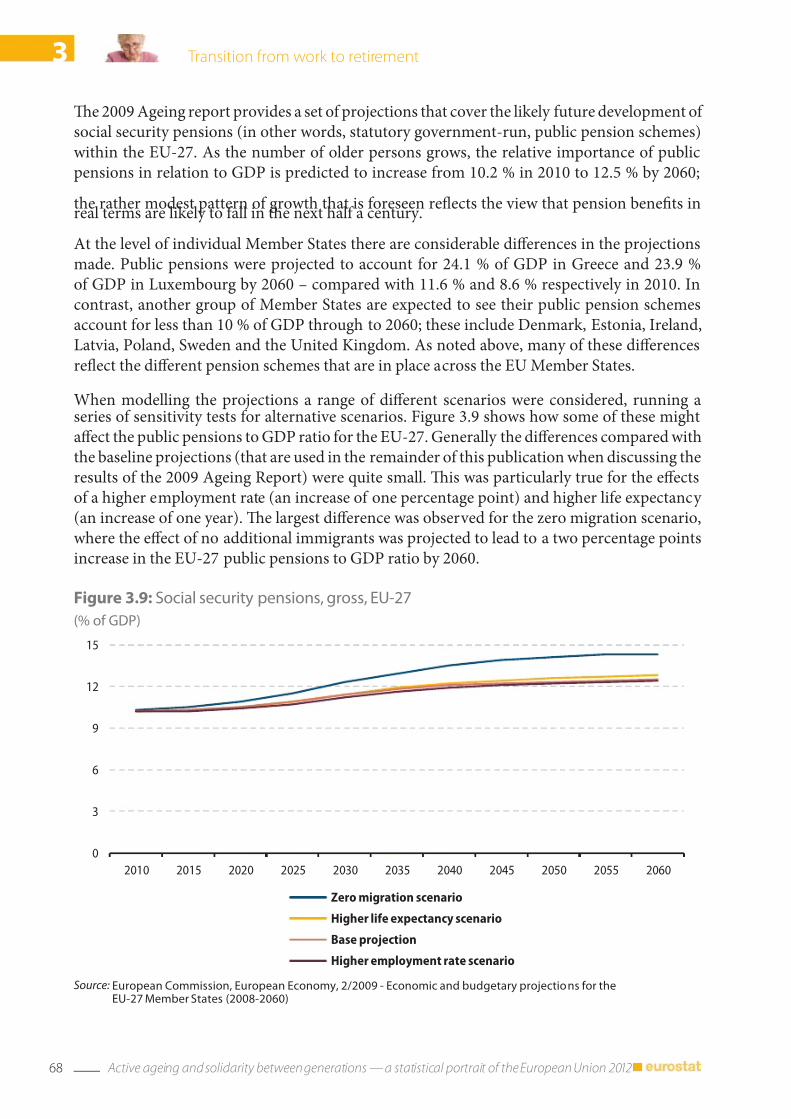
7/31/2019 Active ageing and solidarity between generations 2012 edition A statistical portrait of the European Union 2012
http://slidepdf.com/reader/full/active-ageing-and-solidarity-between-generations-2012-edition-a-statistical 70/147
68 Active ageing and solidarity between generations — a statistical portrait of the European Union 2012
3 Transition rom work to retirement
Figure 3.9: Social security pensions, gross, EU‑27
(% o GDP)
0
3
6
9
12
15
2010 2015 2020 2025 2030 2035 2040 2045 2050 2055 2060
Zero migration scenario
Higher life expectancy scenario
Base projection
Higher employment rate scenario
Source: European Commission, European Economy, 2/2009 ‑ Economic and budgetary projections or theEU‑27 Member States (2008‑2060)
Te 2009 Ageing report provides a set o projections that cover the likely uture development o social security pensions (in other words, statutory government-run, public pension schemes)within the EU-27. As the number o older persons grows, the relative importance o publicpensions in relation to GDP is predicted to increase rom 10.2 % in 2010 to 12.5 % by 2060;
the rather modest pattern o growth that is oreseen reects the view that pension benets inreal terms are likely to all in the next hal a century.
At the level o individual Member States there are considerable dierences in the projectionsmade. Public pensions were projected to account or 24.1 % o GDP in Greece and 23.9 %o GDP in Luxembourg by 2060 – compared with 11.6 % and 8.6 % respectively in 2010. Incontrast, another group o Member States are expected to see their public pension schemesaccount or less than 10 % o GDP through to 2060; these include Denmark, Estonia, Ireland,Latvia, Poland, Sweden and the United Kingdom. As noted above, many o these dierencesreect the dierent pension schemes that are in place across the EU Member States.
When modelling the projections a range o dierent scenarios were considered, running aseries o sensitivity tests or alternative scenarios. Figure 3.9 shows how some o these mightaect the public pensions to GDP ratio or the EU-27. Generally the dierences compared withthe baseline projections (that are used in the remainder o this publication when discussing theresults o the 2009 Ageing Report) were quite small. Tis was particularly true or the eectso a higher employment rate (an increase o one percentage point) and higher lie expectancy (an increase o one year). Te largest dierence was observed or the zero migration scenario,where the eect o no additional immigrants was projected to lead to a two percentage pointsincrease in the EU-27 public pensions to GDP ratio by 2060.
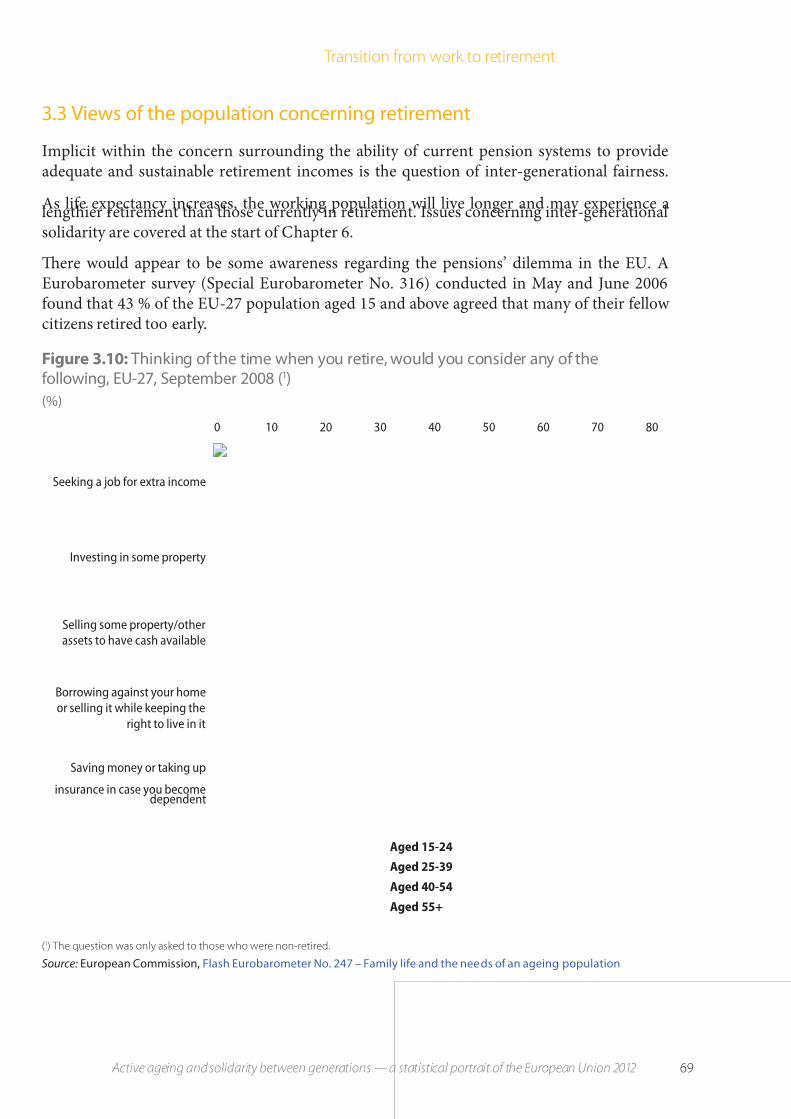
7/31/2019 Active ageing and solidarity between generations 2012 edition A statistical portrait of the European Union 2012
http://slidepdf.com/reader/full/active-ageing-and-solidarity-between-generations-2012-edition-a-statistical 71/147
69 Active ageing and solidarity between generations — a statistical portrait of the European Union 2012
3 Transition rom work to retirement
Figure 3.10: Thinking o the time when you retire, would you consider any o theollowing, EU‑27, September 2008 (1)
(%)
0 10 20 30 40 50 60 70 80
Seeking a job for extra income
Investing in some property
Selling some property/other
assets to have cash available
Borrowing against your home
or selling it while keeping the
right to live in it
Saving money or taking up
insurance in case you becomedependent
Aged 15-24
Aged 25-39
Aged 40-54
Aged 55+
(1) The question was only asked to those who were non-retired.
Source: European Commission, Flash Eurobarometer No. 247 – Family lie and the needs o an ageing population
3.3 Views o the population concerning retirement
Implicit within the concern surrounding the ability o current pension systems to provideadequate and sustainable retirement incomes is the question o inter-generational airness.
As lie expectancy increases, the working population will live longer and may experience alengthier retirement than those currently in retirement. Issues concerning inter-generationalsolidarity are covered at the start o Chapter 6.
Tere would appear to be some awareness regarding the pensions’ dilemma in the EU. AEurobarometer survey (Special Eurobarometer No. 316) conducted in May and June 2006ound that 43 % o the EU-27 population aged 15 and above agreed that many o their ellow citizens retired too early.

7/31/2019 Active ageing and solidarity between generations 2012 edition A statistical portrait of the European Union 2012
http://slidepdf.com/reader/full/active-ageing-and-solidarity-between-generations-2012-edition-a-statistical 72/147

7/31/2019 Active ageing and solidarity between generations 2012 edition A statistical portrait of the European Union 2012
http://slidepdf.com/reader/full/active-ageing-and-solidarity-between-generations-2012-edition-a-statistical 73/147

7/31/2019 Active ageing and solidarity between generations 2012 edition A statistical portrait of the European Union 2012
http://slidepdf.com/reader/full/active-ageing-and-solidarity-between-generations-2012-edition-a-statistical 74/147
7/31/2019 Active ageing and solidarity between generations 2012 edition A statistical portrait of the European Union 2012
http://slidepdf.com/reader/full/active-ageing-and-solidarity-between-generations-2012-edition-a-statistical 75/147
73 Active ageing and solidarity between generations — a statistical portrait of the European Union 2012
Well-being, healthand healthcare
Te WHO denes health by reerring to the ‘physical, mental and social well-being’ o individuals.A comprehensive understanding o health implies that all systems and structures which governphysical, social and economic conditions should permit individuals to lead a productive lie,irrespective o their bodily or unctional limitations (or example, by enhancing the participation o disabled persons). Active ageing policies, together with health-related technological advances andimproving living conditions have led to increased lie expectancy or the EU’s elderly population.
Tere is no doubt that poor health is perceived as a key driver o early retirement. As such,maintaining the autonomy and independence o the elderly generations has become a goal orsome policymakers, as better health has the potential to:
• improve the well-being o individuals;• extend their working lives – providing a stimulus or economic growth;• reduce the overall strain on health and social care systems.
Te EU supports healthy ageing as part o its health strategy ‘ogether or health: a strategicapproach or the EU, 2008-13’ and through the open method o coordination on social protectionand social inclusion. Healthy ageing is based on a two-old approach:
• the promotion o health over the whole o an individual’s lie, aiming to prevent healthproblems and disabilities rom an early age (promoting a healthy liestyle through actionsthat seek to increase levels o physical activity, encourage the adoption o a healthy diet, or
reduce individual’s dependence on the use o tobacco, alcohol or illicit substances);• a commitment to tackle health inequalities that are linked to social, economic and
environmental actors.
An ageing population is expected to result in additional demands or a range o health and health-related products and services. For example, as people live longer, a larger number will become very old (aged 80 or over) and thereore it is likely that many will become rail and require more socialcare services in the orm o support at home or in long-term residential centres. Tis developmentis likely to be intensied in the uture, with a higher proportion o very old persons projected tolive alone, reecting the break-up o amily units and a reduction in the willingness/possibility oramily members to provide care to their older relatives. With no change in the overall health status
o the EU population and without any uture reorm o social security systems and labour marketsto promote healthy and active ageing, demographic developments will likely result in increasedpressure on public budgets or health and long-term care.

7/31/2019 Active ageing and solidarity between generations 2012 edition A statistical portrait of the European Union 2012
http://slidepdf.com/reader/full/active-ageing-and-solidarity-between-generations-2012-edition-a-statistical 76/147
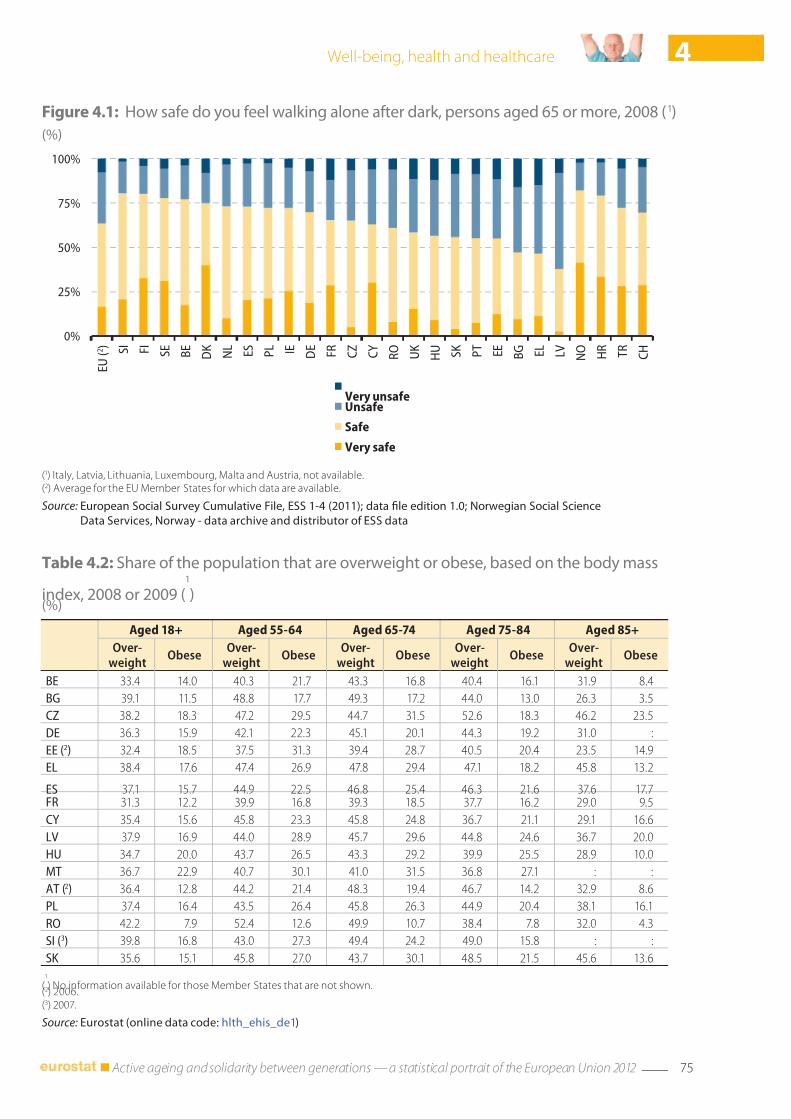
7/31/2019 Active ageing and solidarity between generations 2012 edition A statistical portrait of the European Union 2012
http://slidepdf.com/reader/full/active-ageing-and-solidarity-between-generations-2012-edition-a-statistical 77/147
75 Active ageing and solidarity between generations — a statistical portrait of the European Union 2012
4Well-being, health and healthcare
Figure 4.1: How sae do you eel walking alone ater dark, persons aged 65 or more, 2008 (1)
(%)
0%
25%
50%
75%
100%
E U ( 2
) S I
F I
S E
B E
D K
N L
E S
P L I E
D E
F R
C Z
C Y
R O
U K
H U
S K
P T
E E
B G
E L
L V
N O
H R
T R
C H
Very unsafeUnsafe
Safe
Very safe
(1) Italy, Latvia, Lithuania, Luxembourg, Malta and Austria, not available.(2) Average or the EU Member States or which data are available.
Source: European Social Survey Cumulative File, ESS 1‑4 (2011); data le edition 1.0; Norwegian Social Science
Data Services, Norway ‑ data archive and distributor o ESS data
Table 4.2: Share o the population that are overweight or obese, based on the body mass
index, 2008 or 2009 (1
)(%)
Aged 18+ Aged 55-64 Aged 65-74 Aged 75-84 Aged 85+
Over-weight
ObeseOver-
weightObese
Over-weight
ObeseOver-
weightObese
Over-weight
Obese
BE 33.4 14.0 40.3 21.7 43.3 16.8 40.4 16.1 31.9 8.4
BG 39.1 11.5 48.8 17.7 49.3 17.2 44.0 13.0 26.3 3.5
CZ 38.2 18.3 47.2 29.5 44.7 31.5 52.6 18.3 46.2 23.5
DE 36.3 15.9 42.1 22.3 45.1 20.1 44.3 19.2 31.0 :
EE (2) 32.4 18.5 37.5 31.3 39.4 28.7 40.5 20.4 23.5 14.9
EL 38.4 17.6 47.4 26.9 47.8 29.4 47.1 18.2 45.8 13.2
ES 37.1 15.7 44.9 22.5 46.8 25.4 46.3 21.6 37.6 17.7FR 31.3 12.2 39.9 16.8 39.3 18.5 37.7 16.2 29.0 9.5
CY 35.4 15.6 45.8 23.3 45.8 24.8 36.7 21.1 29.1 16.6
LV 37.9 16.9 44.0 28.9 45.7 29.6 44.8 24.6 36.7 20.0
HU 34.7 20.0 43.7 26.5 43.3 29.2 39.9 25.5 28.9 10.0
MT 36.7 22.9 40.7 30.1 41.0 31.5 36.8 27.1 : :
AT (2) 36.4 12.8 44.2 21.4 48.3 19.4 46.7 14.2 32.9 8.6
PL 37.4 16.4 43.5 26.4 45.8 26.3 44.9 20.4 38.1 16.1
RO 42.2 7.9 52.4 12.6 49.9 10.7 38.4 7.8 32.0 4.3
SI (3) 39.8 16.8 43.0 27.3 49.4 24.2 49.0 15.8 : :
SK 35.6 15.1 45.8 27.0 43.7 30.1 48.5 21.5 45.6 13.6
(1
) No inormation available or those Member States that are not shown.(2) 2006.(3) 2007.
Source: Eurostat (online data code: hlth_ehis_de1)

7/31/2019 Active ageing and solidarity between generations 2012 edition A statistical portrait of the European Union 2012
http://slidepdf.com/reader/full/active-ageing-and-solidarity-between-generations-2012-edition-a-statistical 78/147

7/31/2019 Active ageing and solidarity between generations 2012 edition A statistical portrait of the European Union 2012
http://slidepdf.com/reader/full/active-ageing-and-solidarity-between-generations-2012-edition-a-statistical 79/147
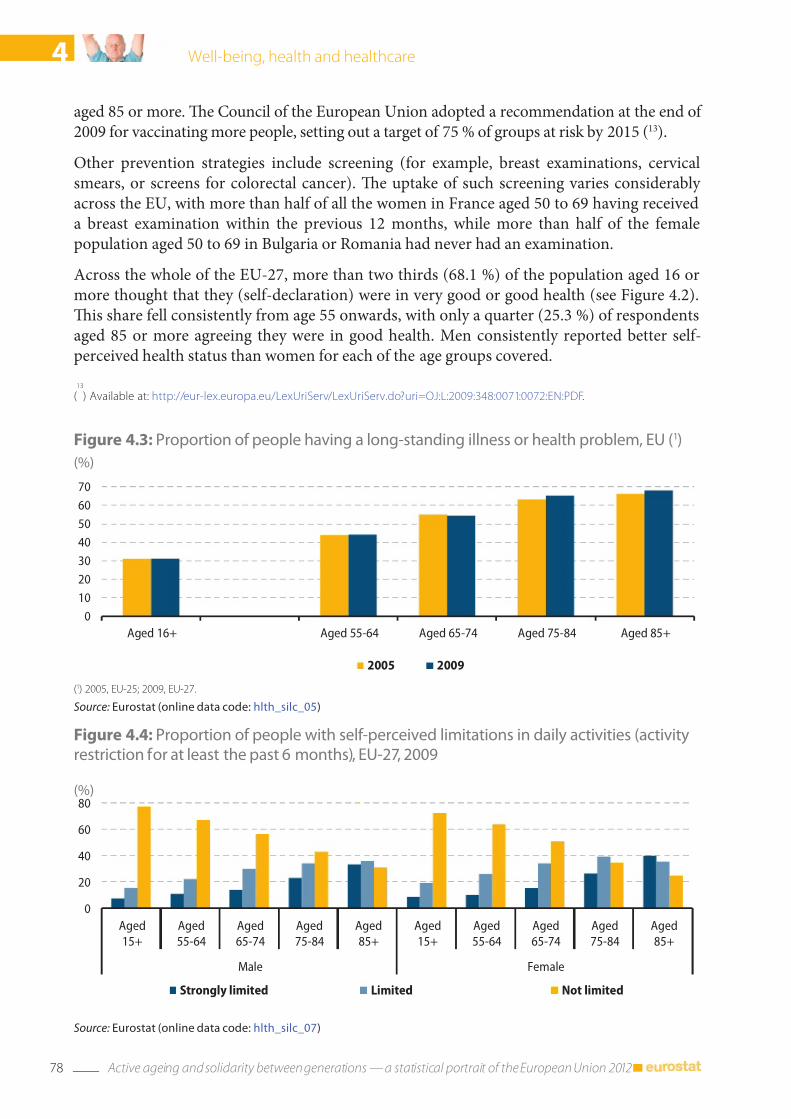
7/31/2019 Active ageing and solidarity between generations 2012 edition A statistical portrait of the European Union 2012
http://slidepdf.com/reader/full/active-ageing-and-solidarity-between-generations-2012-edition-a-statistical 80/147
78 Active ageing and solidarity between generations — a statistical portrait of the European Union 2012
4 Well-being, health and healthcare
Figure 4.4: Proportion o people with sel‑perceived limitations in daily activities (activityrestriction or at least the past 6 months), EU‑27, 2009
(%)
0
20
40
60
80
Aged
15+
Aged
55-64
Aged
65-74
Aged
75-84
Aged
85+
Aged
15+
Aged
55-64
Aged
65-74
Aged
75-84
Aged
85+
Male Female
Strongly limited Limited Not limited
Source: Eurostat (online data code: hlth_silc_07)
aged 85 or more. Te Council o the European Union adopted a recommendation at the end o 2009 or vaccinating more people, setting out a target o 75 % o groups at risk by 2015 (13).
Other prevention strategies include screening (or example, breast examinations, cervicalsmears, or screens or colorectal cancer). Te uptake o such screening varies considerably across the EU, with more than hal o all the women in France aged 50 to 69 having receiveda breast examination within the previous 12 months, while more than hal o the emalepopulation aged 50 to 69 in Bulgaria or Romania had never had an examination.
Across the whole o the EU-27, more than two thirds (68.1 %) o the population aged 16 ormore thought that they (sel-declaration) were in very good or good health (see Figure 4.2).Tis share ell consistently rom age 55 onwards, with only a quarter (25.3 %) o respondentsaged 85 or more agreeing they were in good health. Men consistently reported better sel-perceived health status than women or each o the age groups covered.
Figure 4.3: Proportion o people having a long‑standing illness or health problem, EU (1)
(%)
0
10
20
30
40
50
60
70
Aged 16+ Aged 55-64 Aged 65-74 Aged 75-84 Aged 85+
2005 2009
(1) 2005, EU-25; 2009, EU-27.
Source: Eurostat (online data code: hlth_silc_05)
(13
) Available at: http://eur-lex.europa.eu/LexUriServ/LexUriServ.do?uri=OJ:L:2009:348:0071:0072:EN:PDF.

7/31/2019 Active ageing and solidarity between generations 2012 edition A statistical portrait of the European Union 2012
http://slidepdf.com/reader/full/active-ageing-and-solidarity-between-generations-2012-edition-a-statistical 81/147
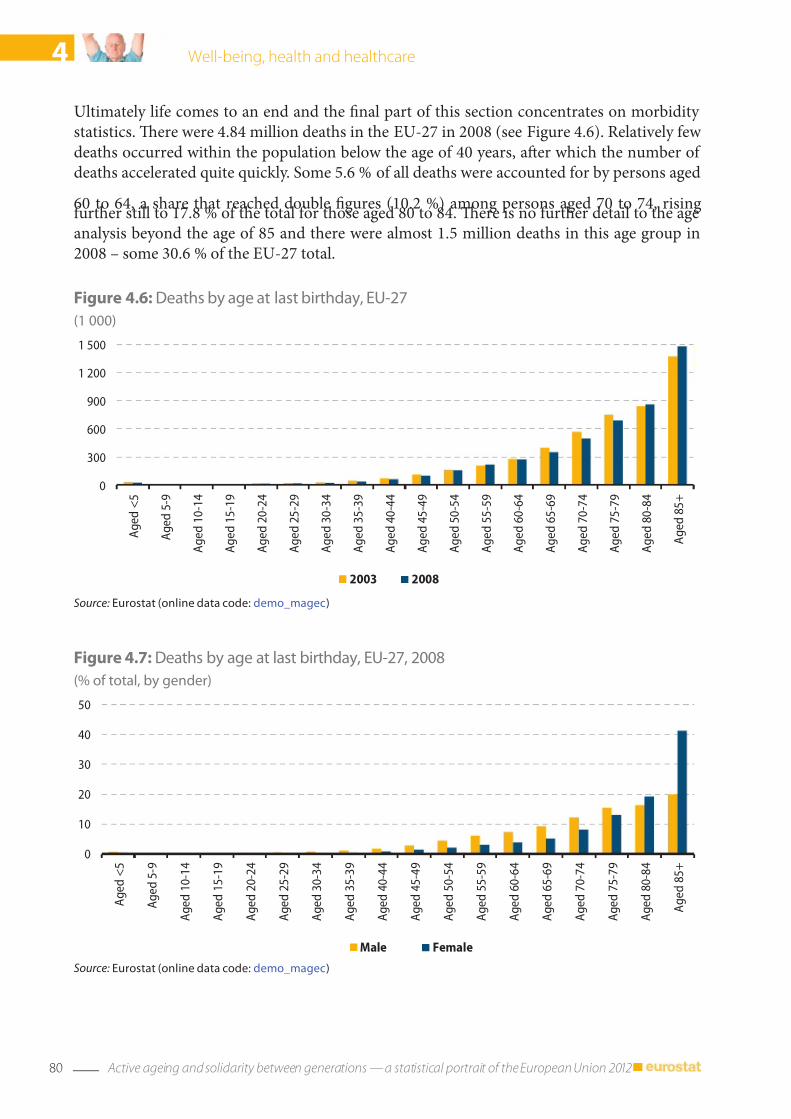
7/31/2019 Active ageing and solidarity between generations 2012 edition A statistical portrait of the European Union 2012
http://slidepdf.com/reader/full/active-ageing-and-solidarity-between-generations-2012-edition-a-statistical 82/147
80 Active ageing and solidarity between generations — a statistical portrait of the European Union 2012
4 Well-being, health and healthcare
Figure 4.7: Deaths by age at last birthday, EU‑27, 2008
(% o total, by gender)
0
10
20
30
40
50
A g e d
< 5
A g e d
5 - 9
A g e d
1 0 - 1 4
A g e d
1 5 - 1 9
A g e d
2 0 - 2 4
A g e d
2 5 - 2 9
A g e d
3 0 - 3 4
A g e d
3 5 - 3 9
A g e d
4 0 - 4 4
A g e d
4 5 - 4 9
A g e d
5 0 - 5 4
A g e d
5 5 - 5 9
A g e d
6 0 - 6 4
A g e d
6 5 - 6 9
A g e d
7 0 - 7 4
A g e d
7 5 - 7 9
A g e d
8 0 - 8 4
A g e d
8 5 +
Male Female
Source: Eurostat (online data code: demo_magec)
Ultimately lie comes to an end and the nal part o this section concentrates on morbidity statistics. Tere were 4.84 million deaths in the EU-27 in 2008 (see Figure 4.6). Relatively ew deaths occurred within the population below the age o 40 years, afer which the number o deaths accelerated quite quickly. Some 5.6 % o all deaths were accounted or by persons aged
60 to 64, a share that reached double gures (10.2 %) among persons aged 70 to 74, risingurther still to 17.8 % o the total or those aged 80 to 84. Tere is no urther detail to the ageanalysis beyond the age o 85 and there were almost 1.5 million deaths in this age group in2008 – some 30.6 % o the EU-27 total.
Figure 4.6: Deaths by age at last birthday, EU‑27
(1 000)
0
300
600
900
1 200
1 500
A g e d
< 5
A g e d
5 - 9
A g e d
1 0 - 1 4
A g e d
1 5 - 1 9
A g e d
2 0 - 2 4
A g e d
2 5 - 2 9
A g e d
3 0 - 3 4
A g e d
3 5 - 3 9
A g e d
4 0 - 4 4
A g e d
4 5 - 4 9
A g e d
5 0 - 5 4
A g e d
5 5 - 5 9
A g e d
6 0 - 6 4
A g e d
6 5 - 6 9
A g e d
7 0 - 7 4
A g e d
7 5 - 7 9
A g e d
8 0 - 8 4
A g e d
8 5 +
2003 2008
Source: Eurostat (online data code: demo_magec)
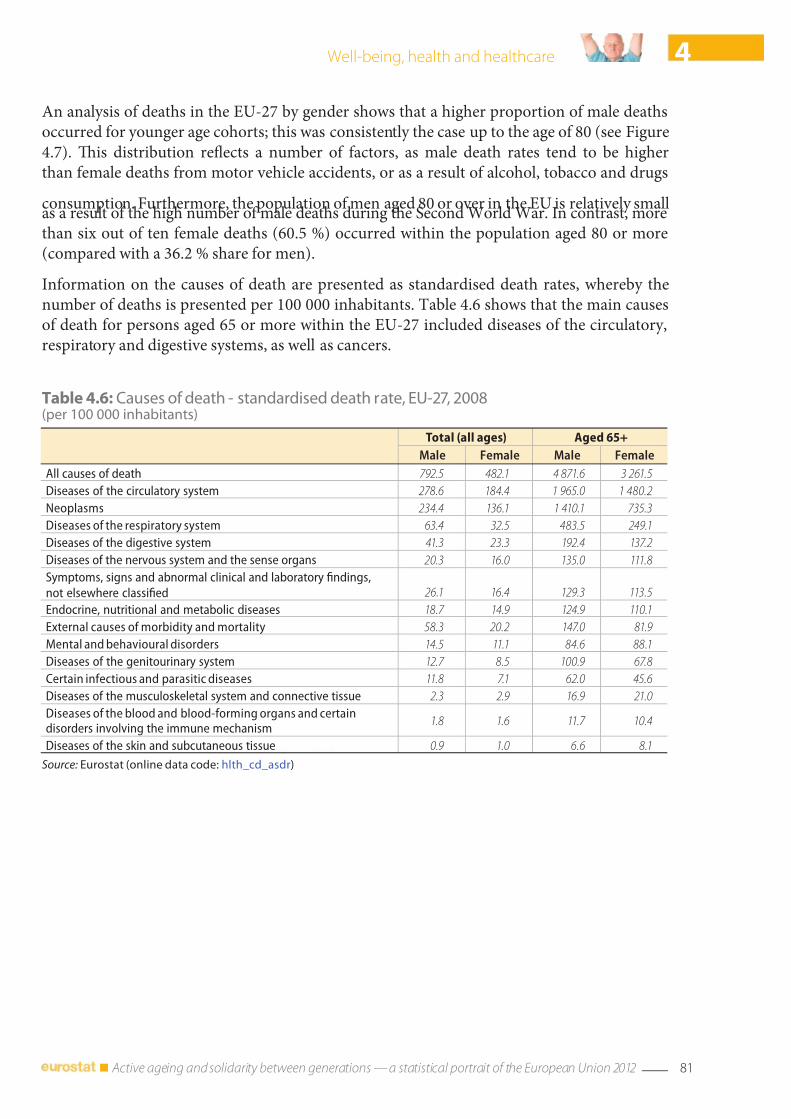
7/31/2019 Active ageing and solidarity between generations 2012 edition A statistical portrait of the European Union 2012
http://slidepdf.com/reader/full/active-ageing-and-solidarity-between-generations-2012-edition-a-statistical 83/147
81 Active ageing and solidarity between generations — a statistical portrait of the European Union 2012
4Well-being, health and healthcare
Table 4.6: Causes o death ‑ standardised death rate, EU‑27, 2008(per 100 000 inhabitants)
Total (all ages) Aged 65+
Male Female Male Female
All causes o death 792.5 482.1 4 871.6 3 261.5
Diseases o the circulatory system 278.6 184.4 1 965.0 1 480.2
Neoplasms 234.4 136.1 1 410.1 735.3
Diseases o the respiratory system 63.4 32.5 483.5 249.1
Diseases o the digestive system 41.3 23.3 192.4 137.2
Diseases o the nervous system and the sense organs 20.3 16.0 135.0 111.8
Symptoms, signs and abnormal clinical and laboratory ndings,
not elsewhere classied 26.1 16.4 129.3 113.5
Endocrine, nutritional and metabolic diseases 18.7 14.9 124.9 110.1
External causes o morbidity and mortality 58.3 20.2 147.0 81.9
Mental and behavioural disorders 14.5 11.1 84.6 88.1
Diseases o the genitourinary system 12.7 8.5 100.9 67.8
Certain inectious and parasitic diseases 11.8 7.1 62.0 45.6
Diseases o the musculoskeletal system and connective tissue 2.3 2.9 16.9 21.0
Diseases o the blood and blood-orming organs and certaindisorders involving the immune mechanism
1.8 1.6 11.7 10.4
Diseases o the skin and subcutaneous tissue 0.9 1.0 6.6 8.1
Source: Eurostat (online data code: hlth_cd_asdr)
An analysis o deaths in the EU-27 by gender shows that a higher proportion o male deathsoccurred or younger age cohorts; this was consistently the case up to the age o 80 (see Figure4.7). Tis distribution reects a number o actors, as male death rates tend to be higherthan emale deaths rom motor vehicle accidents, or as a result o alcohol, tobacco and drugs
consumption. Furthermore, the population o men aged 80 or over in the EU is relatively smallas a result o the high number o male deaths during the Second World War. In contrast, morethan six out o ten emale deaths (60.5 %) occurred within the population aged 80 or more(compared with a 36.2 % share or men).
Inormation on the causes o death are presented as standardised death rates, whereby thenumber o deaths is presented per 100 000 inhabitants. able 4.6 shows that the main causeso death or persons aged 65 or more within the EU-27 included diseases o the circulatory,respiratory and digestive systems, as well as cancers.

7/31/2019 Active ageing and solidarity between generations 2012 edition A statistical portrait of the European Union 2012
http://slidepdf.com/reader/full/active-ageing-and-solidarity-between-generations-2012-edition-a-statistical 84/147
82 Active ageing and solidarity between generations — a statistical portrait of the European Union 2012
4 Well-being, health and healthcare
Figure 4.8: Practising physicians or doctors, 2008 (1)
(per 100 000 inhabitants)
0
100
200
300
400
500
600
700
I T ( 2 )
E L
A T ( 2 )
P T ( 2 )
L T
N L ( 3 )
B G
S E ( 4 )
D E
E S ( 2 )
C Z
D K ( 3 )
E E
F R I E
H U
M T ( 2 )
S K ( 3 )
L V ( 2 )
B E
C Y
L U ( 3 )
F I
U K ( 2 ) ( 4 )
S I
R O P
L N O
C H ( 2 )
I S H R
M K ( 5 )
T R
(1) Ireland, Italy, Portugal and the Netherlands, licensed physicians or doc tors; Greece, France, the ormer Yugoslav Republic o Macedoniaand Turkey, proessionally active physicians or doctors.
(2) 2009.(3) 2007.(4) Estimate.(5) 2006.
Source: Eurostat (online data code: hlth_rs_prs)
4.2 Healthcare expenditure and healthcare services
Tis section looks at healthcare rom a monetary perspective, assessing health and long-termcare expenditure. As mentioned, the consumption o various medical goods and services is
expected to rise as the EU’s population ages in the coming decades. Whether this is nancedprivately or rom the public purse, the expanding number o older persons in the populationmay have signicant consequences on the number o healthcare proessionals that are requiredto care or the elderly – and this during a period when the overall size o the EU’s workorceis expected to contract.
One measure o the supply o healthcare services is the number o practising physicians ordoctors per 100 000 inhabitants (see Figure 4.8), which generally ranged rom 270 to 380 inthe majority o the Member States; see ootnote 1 or details o those countries that use adierent measure. Inormation on the number o nursing and caring proessionals per 100 000
inhabitants is available or a smaller number o countries, with a much wider variation in sta numbers.
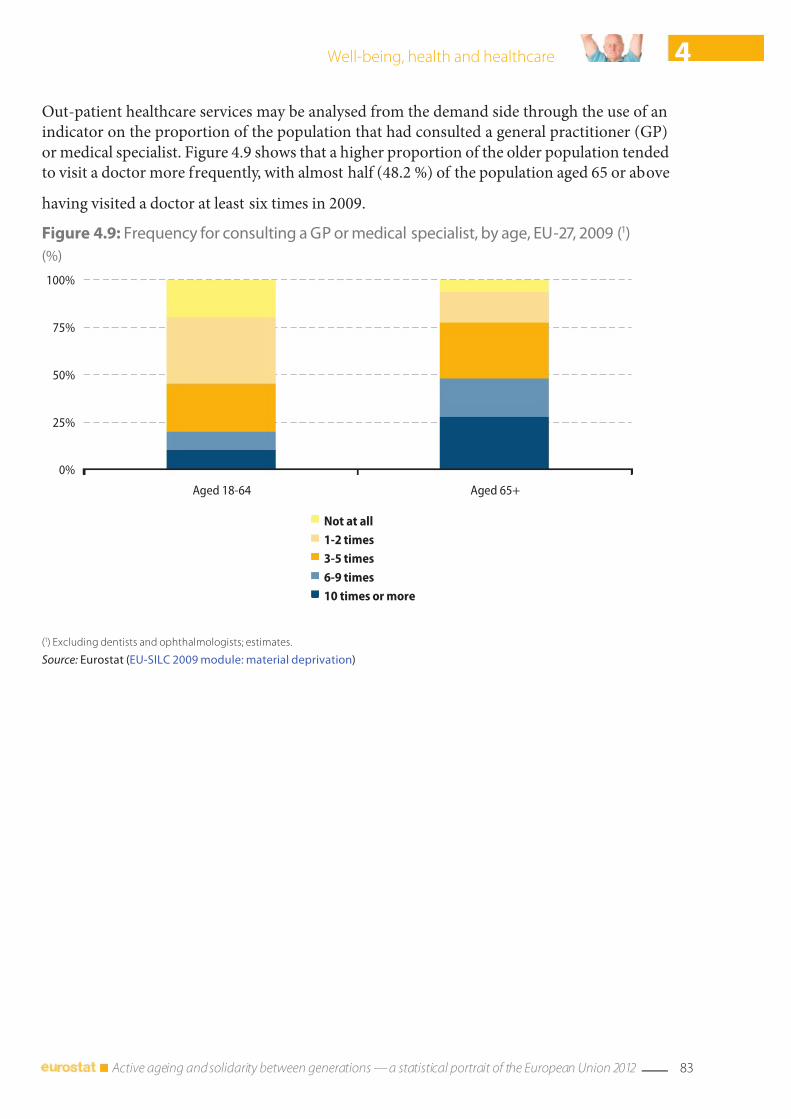
7/31/2019 Active ageing and solidarity between generations 2012 edition A statistical portrait of the European Union 2012
http://slidepdf.com/reader/full/active-ageing-and-solidarity-between-generations-2012-edition-a-statistical 85/147
83 Active ageing and solidarity between generations — a statistical portrait of the European Union 2012
4Well-being, health and healthcare
Figure 4.9: Frequency or consulting a GP or medical specialist, by age, EU‑27, 2009 (1)
(%)
0%
25%
50%
75%
100%
Aged 18-64 Aged 65+
Not at all
1-2 times
3-5 times
6-9 times
10 times or more
(1) Excluding dentists and ophthalmologists; estimates.
Source: Eurostat (EU‑SILC 2009 module: material deprivation)
Out-patient healthcare services may be analysed rom the demand side through the use o anindicator on the proportion o the population that had consulted a general practitioner (GP)or medical specialist. Figure 4.9 shows that a higher proportion o the older population tendedto visit a doctor more requently, with almost hal (48.2 %) o the population aged 65 or above
having visited a doctor at least six times in 2009.

7/31/2019 Active ageing and solidarity between generations 2012 edition A statistical portrait of the European Union 2012
http://slidepdf.com/reader/full/active-ageing-and-solidarity-between-generations-2012-edition-a-statistical 86/147
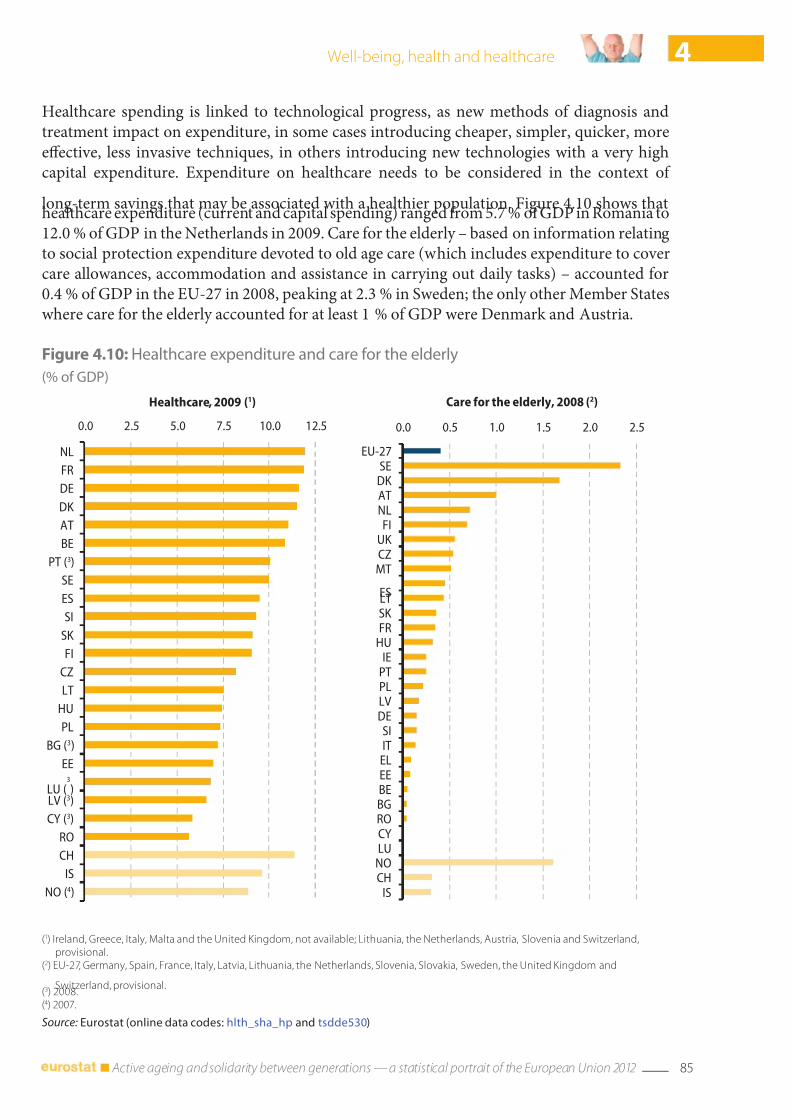
7/31/2019 Active ageing and solidarity between generations 2012 edition A statistical portrait of the European Union 2012
http://slidepdf.com/reader/full/active-ageing-and-solidarity-between-generations-2012-edition-a-statistical 87/147
85 Active ageing and solidarity between generations — a statistical portrait of the European Union 2012
4Well-being, health and healthcare
Figure 4.10: Healthcare expenditure and care or the elderly
(% o GDP)
0.0 2.5 5.0 7.5 10.0 12.5
NL
FR
DE
DK
AT
BE
PT (3)
SE
ES
SI
SK
FI
CZ
LT
HU
PL
BG (3)
EE
LU (3
)LV (3)
CY (3)
RO
CH
IS
NO (4)
Healthcare, 2009 (1)
(1) Ireland, Greece, Italy, Malta and the United Kingdom, not available; Lithuania, the Netherlands, Austria, Slovenia and Switzerland,provisional.
(2) EU-27, Germany, Spain, France, Italy, Latvia, Lithuania, the Netherlands, Slovenia, Slovakia, Sweden, the United Kingdom and
Switzerland, provisional.(3) 2008.(4) 2007.
Source: Eurostat (online data codes: hlth_sha_hp and tsdde530)
0.0 0.5 1.0 1.5 2.0 2.5
EU-27
SE
DK
AT
NL
FI
UK
CZ
MT
ESLT
SK
FR
HU
IE
PT
PL
LV
DE
SI
IT
EL
EE
BE
BG
RO
CY
LU
NO
CH
IS
Care for the elderly, 2008 (2)
Healthcare spending is linked to technological progress, as new methods o diagnosis andtreatment impact on expenditure, in some cases introducing cheaper, simpler, quicker, moreeective, less invasive techniques, in others introducing new technologies with a very highcapital expenditure. Expenditure on healthcare needs to be considered in the context o
long-term savings that may be associated with a healthier population. Figure 4.10 shows thathealthcare expenditure (current and capital spending) ranged rom 5.7 % o GDP in Romania to12.0 % o GDP in the Netherlands in 2009. Care or the elderly – based on inormation relatingto social protection expenditure devoted to old age care (which includes expenditure to covercare allowances, accommodation and assistance in carrying out daily tasks) – accounted or0.4 % o GDP in the EU-27 in 2008, peaking at 2.3 % in Sweden; the only other Member Stateswhere care or the elderly accounted or at least 1 % o GDP were Denmark and Austria.
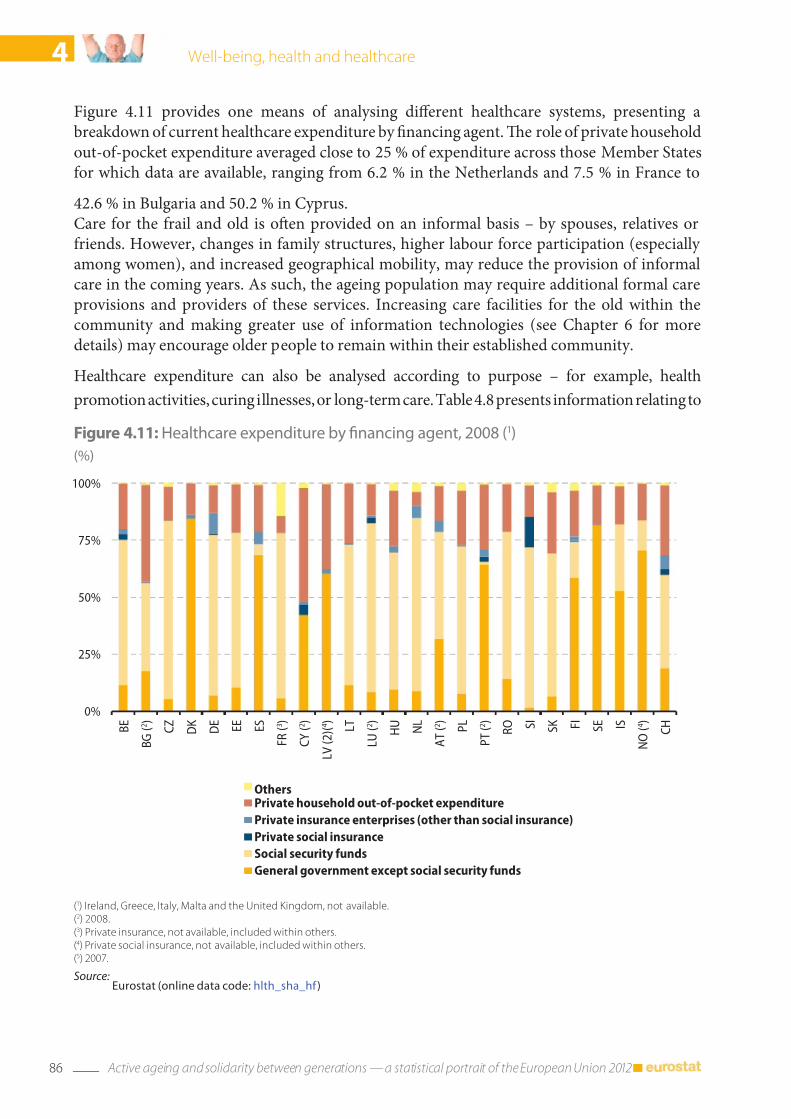
7/31/2019 Active ageing and solidarity between generations 2012 edition A statistical portrait of the European Union 2012
http://slidepdf.com/reader/full/active-ageing-and-solidarity-between-generations-2012-edition-a-statistical 88/147
86 Active ageing and solidarity between generations — a statistical portrait of the European Union 2012
4 Well-being, health and healthcare
Figure 4.11: Healthcare expenditure by nancing agent, 2008 (1)
(%)
0%
25%
50%
75%
100%
B E
B G ( 2
) C Z
D K
D E
E E
E S
F R ( 3 )
C Y ( 2 )
L V ( 2 ) ( 4 )
L T
L U ( 2
)
H U
N L
A T ( 2 )
P L
P T ( 2 )
R O S
I S K F
I S E I S
N O ( 4
)
C H
OthersPrivate household out-of-pocket expenditure
Private insurance enterprises (other than social insurance)
Private social insurance
Social security funds
General government except social security funds
(1) Ireland, Greece, Italy, Malta and the United Kingdom, not available.(2) 2008.(3) Private insurance, not available, included within others.(4) Private social insurance, not available, included within others.(5) 2007.
Source:Eurostat (online data code: hlth_sha_h )
Figure 4.11 provides one means o analysing dierent healthcare systems, presenting abreakdown o current healthcare expenditure by nancing agent. Te role o private householdout-o-pocket expenditure averaged close to 25 % o expenditure across those Member Statesor which data are available, ranging rom 6.2 % in the Netherlands and 7.5 % in France to
42.6 % in Bulgaria and 50.2 % in Cyprus.Care or the rail and old is ofen provided on an inormal basis – by spouses, relatives orriends. However, changes in amily structures, higher labour orce participation (especially among women), and increased geographical mobility, may reduce the provision o inormalcare in the coming years. As such, the ageing population may require additional ormal careprovisions and providers o these services. Increasing care acilities or the old within thecommunity and making greater use o inormation technologies (see Chapter 6 or moredetails) may encourage older people to remain within their established community.
Healthcare expenditure can also be analysed according to purpose – or example, health
promotion activities, curing illnesses, or long-term care. able 4.8 presents inormation relating to
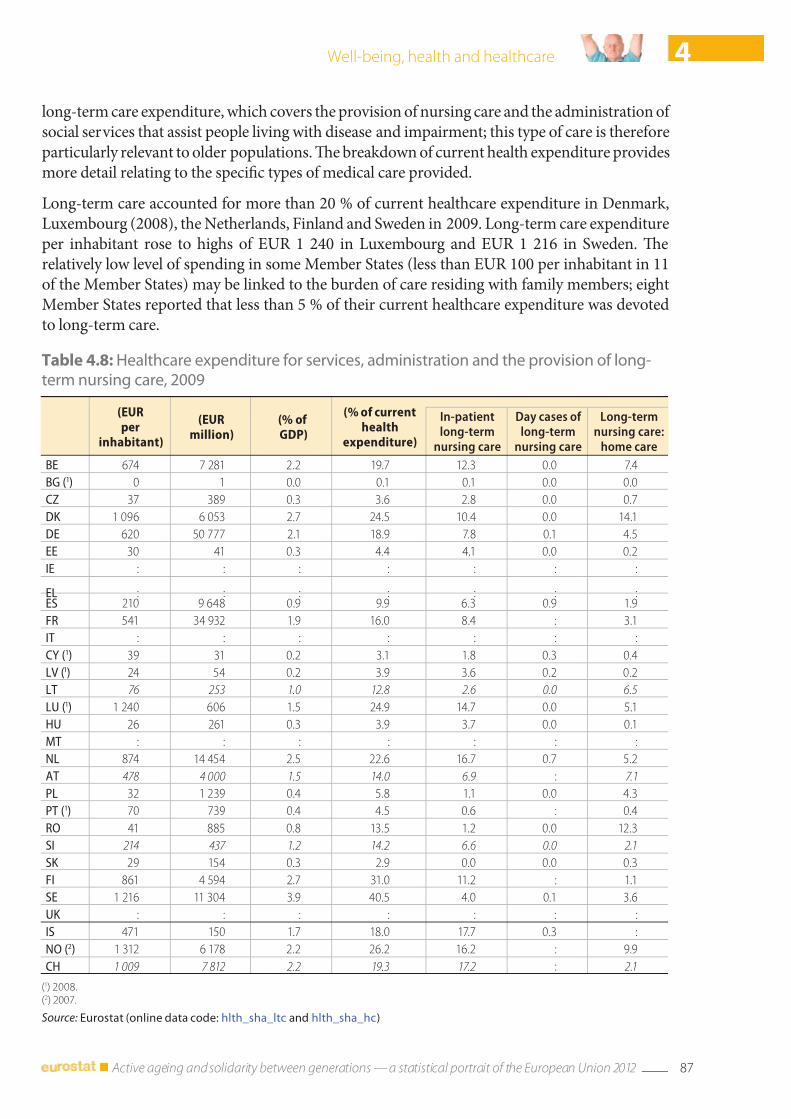
7/31/2019 Active ageing and solidarity between generations 2012 edition A statistical portrait of the European Union 2012
http://slidepdf.com/reader/full/active-ageing-and-solidarity-between-generations-2012-edition-a-statistical 89/147
87 Active ageing and solidarity between generations — a statistical portrait of the European Union 2012
4Well-being, health and healthcare
Table 4.8: Healthcare expenditure or services, administration and the provision o long‑term nursing care, 2009
(EURper
inhabitant)
(EURmillion)
(% o GDP)
(% o currenthealth
expenditure)
In-patientlong-term
nursing care
Day cases o long-term
nursing care
Long-termnursing care:
home care
BE 674 7 281 2.2 19.7 12.3 0.0 7.4
BG (1) 0 1 0.0 0.1 0.1 0.0 0.0
CZ 37 389 0.3 3.6 2.8 0.0 0.7
DK 1 096 6 053 2.7 24.5 10.4 0.0 14.1
DE 620 50 777 2.1 18.9 7.8 0.1 4.5
EE 30 41 0.3 4.4 4.1 0.0 0.2
IE : : : : : : :
EL : : : : : : :ES 210 9 648 0.9 9.9 6.3 0.9 1.9
FR 541 34 932 1.9 16.0 8.4 : 3.1
IT : : : : : : :
CY (1) 39 31 0.2 3.1 1.8 0.3 0.4
LV (1) 24 54 0.2 3.9 3.6 0.2 0.2
LT 76 253 1.0 12.8 2.6 0.0 6.5
LU (1) 1 240 606 1.5 24.9 14.7 0.0 5.1
HU 26 261 0.3 3.9 3.7 0.0 0.1
MT : : : : : : :
NL 874 14 454 2.5 22.6 16.7 0.7 5.2
AT 478 4 000 1.5 14.0 6.9 : 7.1
PL 32 1 239 0.4 5.8 1.1 0.0 4.3
PT (1) 70 739 0.4 4.5 0.6 : 0.4
RO 41 885 0.8 13.5 1.2 0.0 12.3
SI 214 437 1.2 14.2 6.6 0.0 2.1
SK 29 154 0.3 2.9 0.0 0.0 0.3
FI 861 4 594 2.7 31.0 11.2 : 1.1
SE 1 216 11 304 3.9 40.5 4.0 0.1 3.6
UK : : : : : : :
IS 471 150 1.7 18.0 17.7 0.3 :
NO (2) 1 312 6 178 2.2 26.2 16.2 : 9.9
CH 1 009 7 812 2.2 19.3 17.2 : 2.1
(1) 2008.(2) 2007.
Source: Eurostat (online data code: hlth_sha_ltc and hlth_sha_hc)
long-term care expenditure, which covers the provision o nursing care and the administration o social services that assist people living with disease and impairment; this type o care is thereoreparticularly relevant to older populations. Te breakdown o current health expenditure providesmore detail relating to the specic types o medical care provided.
Long-term care accounted or more than 20 % o current healthcare expenditure in Denmark,Luxembourg (2008), the Netherlands, Finland and Sweden in 2009. Long-term care expenditureper inhabitant rose to highs o EUR 1 240 in Luxembourg and EUR 1 216 in Sweden. Terelatively low level o spending in some Member States (less than EUR 100 per inhabitant in 11o the Member States) may be linked to the burden o care residing with amily members; eightMember States reported that less than 5 % o their current healthcare expenditure was devotedto long-term care.
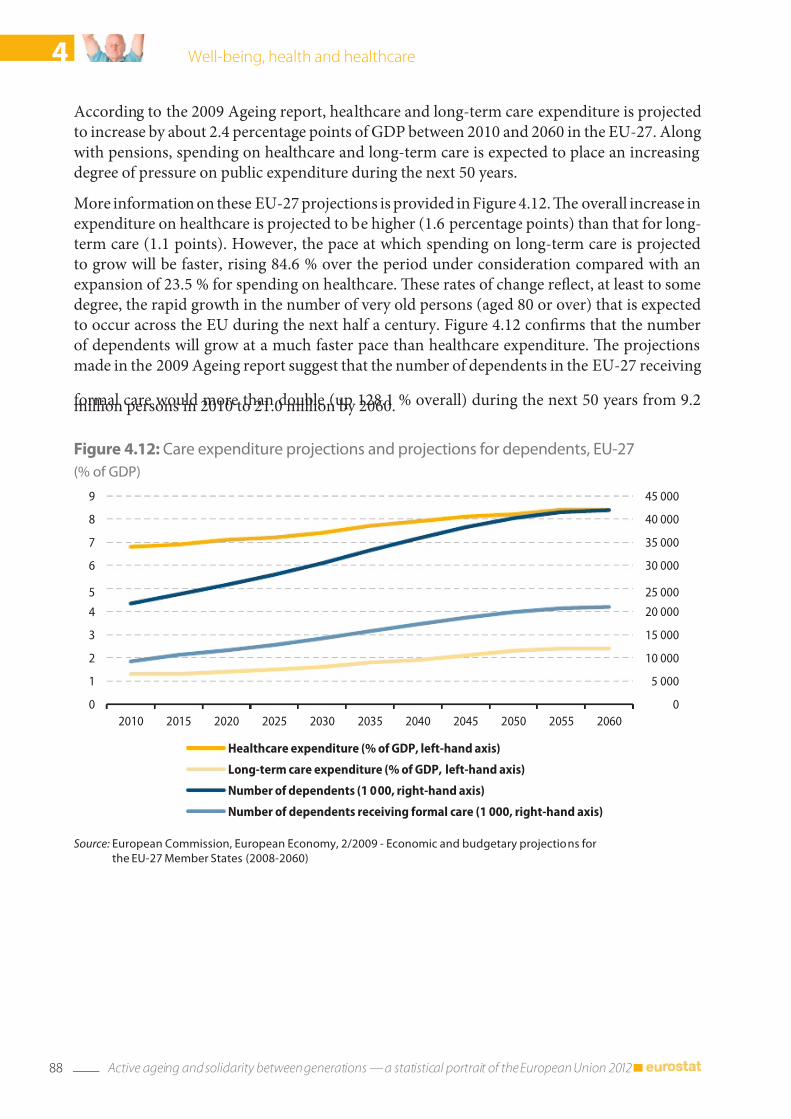
7/31/2019 Active ageing and solidarity between generations 2012 edition A statistical portrait of the European Union 2012
http://slidepdf.com/reader/full/active-ageing-and-solidarity-between-generations-2012-edition-a-statistical 90/147
88 Active ageing and solidarity between generations — a statistical portrait of the European Union 2012
4 Well-being, health and healthcare
According to the 2009 Ageing report, healthcare and long-term care expenditure is projectedto increase by about 2.4 percentage points o GDP between 2010 and 2060 in the EU-27. Alongwith pensions, spending on healthcare and long-term care is expected to place an increasingdegree o pressure on public expenditure during the next 50 years.
More inormation on these EU-27 projections is provided in Figure 4.12. Te overall increase inexpenditure on healthcare is projected to be higher (1.6 percentage points) than that or long-term care (1.1 points). However, the pace at which spending on long-term care is projectedto grow will be aster, rising 84.6 % over the period under consideration compared with anexpansion o 23.5 % or spending on healthcare. Tese rates o change reect, at least to somedegree, the rapid growth in the number o very old persons (aged 80 or over) that is expectedto occur across the EU during the next hal a century. Figure 4.12 conrms that the numbero dependents will grow at a much aster pace than healthcare expenditure. Te projectionsmade in the 2009 Ageing report suggest that the number o dependents in the EU-27 receiving
ormal care would more than double (up 128.1 % overall) during the next 50 years rom 9.2million persons in 2010 to 21.0 million by 2060.
Figure 4.12: Care expenditure projections and projections or dependents, EU‑27
(% o GDP)
0
5 000
10 000
15 000
20 000
25 000
30 000
35 000
40 000
45 000
0
1
2
3
4
5
6
7
8
9
2010 2015 2020 2025 2030 2035 2040 2045 2050 2055 2060
Healthcare expenditure (% of GDP, left-hand axis)
Long-term care expenditure (% of GDP, left-hand axis)
Number of dependents (1 000, right-hand axis)
Number of dependents receiving formal care (1 000, right-hand axis)
Source: European Commission, European Economy, 2/2009 ‑ Economic and budgetary projections or
the EU‑27 Member States (2008‑2060)

7/31/2019 Active ageing and solidarity between generations 2012 edition A statistical portrait of the European Union 2012
http://slidepdf.com/reader/full/active-ageing-and-solidarity-between-generations-2012-edition-a-statistical 91/147

7/31/2019 Active ageing and solidarity between generations 2012 edition A statistical portrait of the European Union 2012
http://slidepdf.com/reader/full/active-ageing-and-solidarity-between-generations-2012-edition-a-statistical 92/147
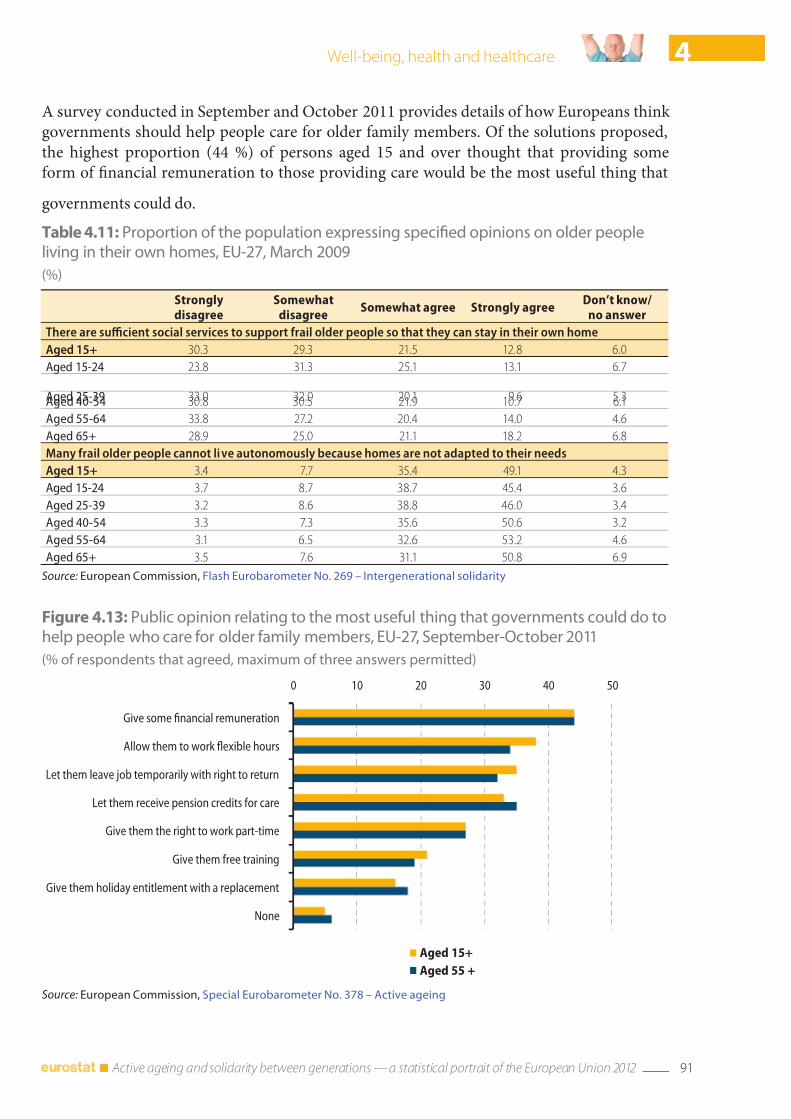
7/31/2019 Active ageing and solidarity between generations 2012 edition A statistical portrait of the European Union 2012
http://slidepdf.com/reader/full/active-ageing-and-solidarity-between-generations-2012-edition-a-statistical 93/147
91 Active ageing and solidarity between generations — a statistical portrait of the European Union 2012
4Well-being, health and healthcare
Figure 4.13: Public opinion relating to the most useul thing that governments could do tohelp people who care or older amily members, EU‑27, September‑October 2011
(% o respondents that agreed, maximum o three answers permitted)
0 10 20 30 40 50
Give some nancial remuneration
Allow them to work exible hours
Let them leave job temporarily with right to return
Let them receive pension credits for care
Give them the right to work part-time
Give them free training
Give them holiday entitlement with a replacement
None
Aged 15+
Aged 55 +
Source: European Commission, Special Eurobarometer No. 378 – Active ageing
Table 4.11: Proportion o the population expressing specied opinions on older peopleliving in their own homes, EU‑27, March 2009
(%)
Stronglydisagree
Somewhatdisagree
Somewhat agree Strongly agreeDon’t know/
no answer
There are sufcient social services to support rail older people so that they can stay in their own home
Aged 15+ 30.3 29.3 21.5 12.8 6.0
Aged 15-24 23.8 31.3 25.1 13.1 6.7
Aged 25-39 33.0 32.0 20.1 9.6 5.3Aged 40-54 30.8 30.5 21.9 10.7 6.1
Aged 55-64 33.8 27.2 20.4 14.0 4.6
Aged 65+ 28.9 25.0 21.1 18.2 6.8
Many rail older people cannot live autonomously because homes are not adapted to their needs
Aged 15+ 3.4 7.7 35.4 49.1 4.3
Aged 15-24 3.7 8.7 38.7 45.4 3.6
Aged 25-39 3.2 8.6 38.8 46.0 3.4
Aged 40-54 3.3 7.3 35.6 50.6 3.2
Aged 55-64 3.1 6.5 32.6 53.2 4.6
Aged 65+ 3.5 7.6 31.1 50.8 6.9
Source: European Commission, Flash Eurobarometer No. 269 – Intergenerational solidarity
A survey conducted in September and October 2011 provides details o how Europeans think governments should help people care or older amily members. O the solutions proposed,the highest proportion (44 %) o persons aged 15 and over thought that providing someorm o nancial remuneration to those providing care would be the most useul thing that
governments could do.

7/31/2019 Active ageing and solidarity between generations 2012 edition A statistical portrait of the European Union 2012
http://slidepdf.com/reader/full/active-ageing-and-solidarity-between-generations-2012-edition-a-statistical 94/147
7/31/2019 Active ageing and solidarity between generations 2012 edition A statistical portrait of the European Union 2012
http://slidepdf.com/reader/full/active-ageing-and-solidarity-between-generations-2012-edition-a-statistical 95/147
93 Active ageing and solidarity between generations — a statistical portrait of the European Union 2012
Living conditions andconsumption expenditure
Quality o lie has already been touched upon to some degree through the well-being indicatorsthat were presented in Chapter 4. Aside rom physical health, an individual’s perception o theirlie is also linked to psychological actors. Tese may be shaped through social relationships,personal belies, eelings o isolation/loneliness, or concerns over security/saety and nance.Many o the challenges that older people ace in their day-to-day lives are linked to theautonomy and independence o their living conditions – in other words, whether or not they are able to cope with and make personal decisions on a daily basis, while living independently
with little or no help rom others.An individual’s quality o lie is also aected by monetary issues and material deprivation; botho these issues are covered within this chapter. Among the ve headline targets introducedwithin the Europe 2020 strategy one aims to ensure that at least 20 million ewer people withinthe EU are in or at-risk-o-poverty or social exclusion by 2020.
Te opening chapters o this publication have ocused largely on the costs that may beassociated with demographic ageing – or example, increasing pension or healthcare budgets.An alternative vision is to consider the changes that will be necessary in the uture in order toacilitate the lives o the growing numbers o older persons, encouraging them to remain active
within the community. Within this scenario, active ageing policies might be able to providea stimulus or economic growth, transorming various aspects o society and promotingthe development o new goods and services that are tailored to the specic needs o oldergenerations. New products could be developed in order to help adapt homes so these becomesaer and more comortable or older persons (current examples include the installation o panic buttons in the event that a person alls, or chairlifs that provide access to upstairs roomsor those who ace mobility issues).
More inclusive local services may improve the lives o older persons outside o their homes, orexample, through easier access to public buildings (or wheelchairs or the visually impaired),
the provision o appropriate leisure and community acilities, or public transport systems thatare more accessible or older persons.
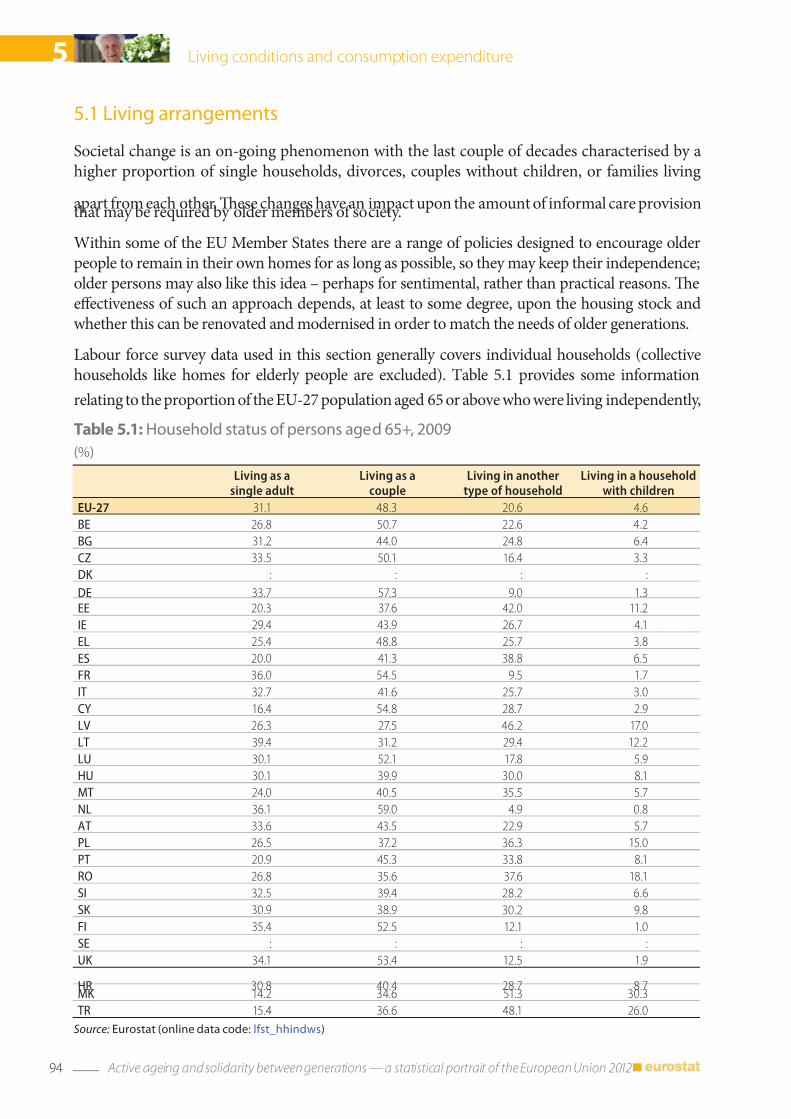
7/31/2019 Active ageing and solidarity between generations 2012 edition A statistical portrait of the European Union 2012
http://slidepdf.com/reader/full/active-ageing-and-solidarity-between-generations-2012-edition-a-statistical 96/147
94 Active ageing and solidarity between generations — a statistical portrait of the European Union 2012
5 Living conditions and consumption expenditure
5.1 Living arrangements
Societal change is an on-going phenomenon with the last couple o decades characterised by ahigher proportion o single households, divorces, couples without children, or amilies living
apart rom each other. Tese changes have an impact upon the amount o inormal care provisionthat may be required by older members o society.
Within some o the EU Member States there are a range o policies designed to encourage olderpeople to remain in their own homes or as long as possible, so they may keep their independence;older persons may also like this idea – perhaps or sentimental, rather than practical reasons. Teeectiveness o such an approach depends, at least to some degree, upon the housing stock andwhether this can be renovated and modernised in order to match the needs o older generations.
Labour orce survey data used in this section generally covers individual households (collectivehouseholds like homes or elderly people are excluded). able 5.1 provides some inormation
relating to the proportion o the EU-27 population aged 65 or above who were living independently,
Table 5.1: Household status o persons aged 65+, 2009
(%)
Living as asingle adult
Living as acouple
Living in anothertype o household
Living in a householdwith children
EU-27 31.1 48.3 20.6 4.6
BE 26.8 50.7 22.6 4.2
BG 31.2 44.0 24.8 6.4
CZ 33.5 50.1 16.4 3.3
DK : : : :
DE 33.7 57.3 9.0 1.3
EE 20.3 37.6 42.0 11.2
IE 29.4 43.9 26.7 4.1
EL 25.4 48.8 25.7 3.8
ES 20.0 41.3 38.8 6.5
FR 36.0 54.5 9.5 1.7
IT 32.7 41.6 25.7 3.0
CY 16.4 54.8 28.7 2.9
LV 26.3 27.5 46.2 17.0
LT 39.4 31.2 29.4 12.2
LU 30.1 52.1 17.8 5.9
HU 30.1 39.9 30.0 8.1
MT 24.0 40.5 35.5 5.7
NL 36.1 59.0 4.9 0.8
AT 33.6 43.5 22.9 5.7
PL 26.5 37.2 36.3 15.0
PT 20.9 45.3 33.8 8.1
RO 26.8 35.6 37.6 18.1
SI 32.5 39.4 28.2 6.6
SK 30.9 38.9 30.2 9.8
FI 35.4 52.5 12.1 1.0
SE : : : :
UK 34.1 53.4 12.5 1.9
HR 30.8 40.4 28.7 8.7MK 14.2 34.6 51.3 30.3
TR 15.4 36.6 48.1 26.0
Source: Eurostat (online data code: lst_hhindws)
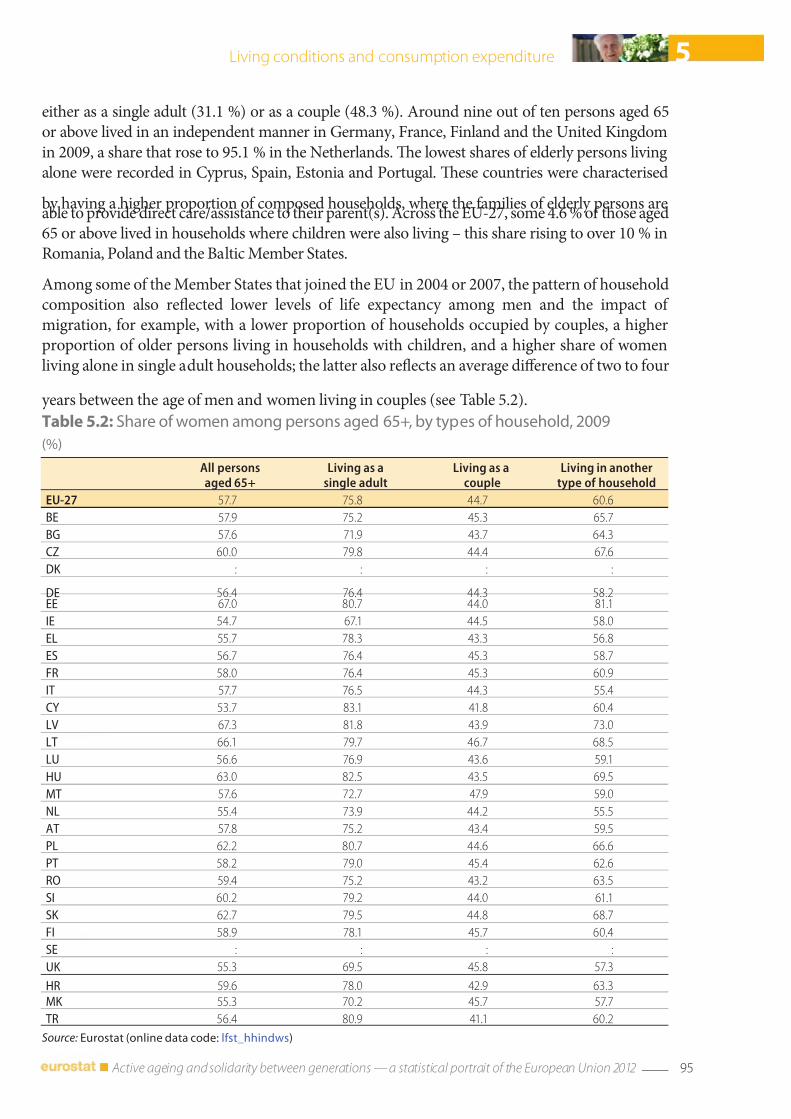
7/31/2019 Active ageing and solidarity between generations 2012 edition A statistical portrait of the European Union 2012
http://slidepdf.com/reader/full/active-ageing-and-solidarity-between-generations-2012-edition-a-statistical 97/147
95 Active ageing and solidarity between generations — a statistical portrait of the European Union 2012
5Living conditions and consumption expenditure
either as a single adult (31.1 %) or as a couple (48.3 %). Around nine out o ten persons aged 65or above lived in an independent manner in Germany, France, Finland and the United Kingdomin 2009, a share that rose to 95.1 % in the Netherlands. Te lowest shares o elderly persons livingalone were recorded in Cyprus, Spain, Estonia and Portugal. Tese countries were characterised
by having a higher proportion o composed households, where the amilies o elderly persons areable to provide direct care/assistance to their parent(s). Across the EU-27, some 4.6 % o those aged65 or above lived in households where children were also living – this share rising to over 10 % inRomania, Poland and the Baltic Member States.
Among some o the Member States that joined the EU in 2004 or 2007, the pattern o householdcomposition also reected lower levels o lie expectancy among men and the impact o migration, or example, with a lower proportion o households occupied by couples, a higherproportion o older persons living in households with children, and a higher share o womenliving alone in single adult households; the latter also reects an average dierence o two to our
years between the age o men and women living in couples (see able 5.2).Table 5.2: Share o women among persons aged 65+, by types o household, 2009
(%)
All personsaged 65+
Living as asingle adult
Living as acouple
Living in anothertype o household
EU-27 57.7 75.8 44.7 60.6
BE 57.9 75.2 45.3 65.7
BG 57.6 71.9 43.7 64.3
CZ 60.0 79.8 44.4 67.6
DK : : : :
DE 56.4 76.4 44.3 58.2EE 67.0 80.7 44.0 81.1
IE 54.7 67.1 44.5 58.0
EL 55.7 78.3 43.3 56.8
ES 56.7 76.4 45.3 58.7
FR 58.0 76.4 45.3 60.9
IT 57.7 76.5 44.3 55.4
CY 53.7 83.1 41.8 60.4
LV 67.3 81.8 43.9 73.0
LT 66.1 79.7 46.7 68.5
LU 56.6 76.9 43.6 59.1
HU 63.0 82.5 43.5 69.5
MT 57.6 72.7 47.9 59.0
NL 55.4 73.9 44.2 55.5
AT 57.8 75.2 43.4 59.5
PL 62.2 80.7 44.6 66.6
PT 58.2 79.0 45.4 62.6
RO 59.4 75.2 43.2 63.5
SI 60.2 79.2 44.0 61.1
SK 62.7 79.5 44.8 68.7
FI 58.9 78.1 45.7 60.4
SE : : : :
UK 55.3 69.5 45.8 57.3
HR 59.6 78.0 42.9 63.3
MK 55.3 70.2 45.7 57.7
TR 56.4 80.9 41.1 60.2
Source: Eurostat (online data code: lst_hhindws)
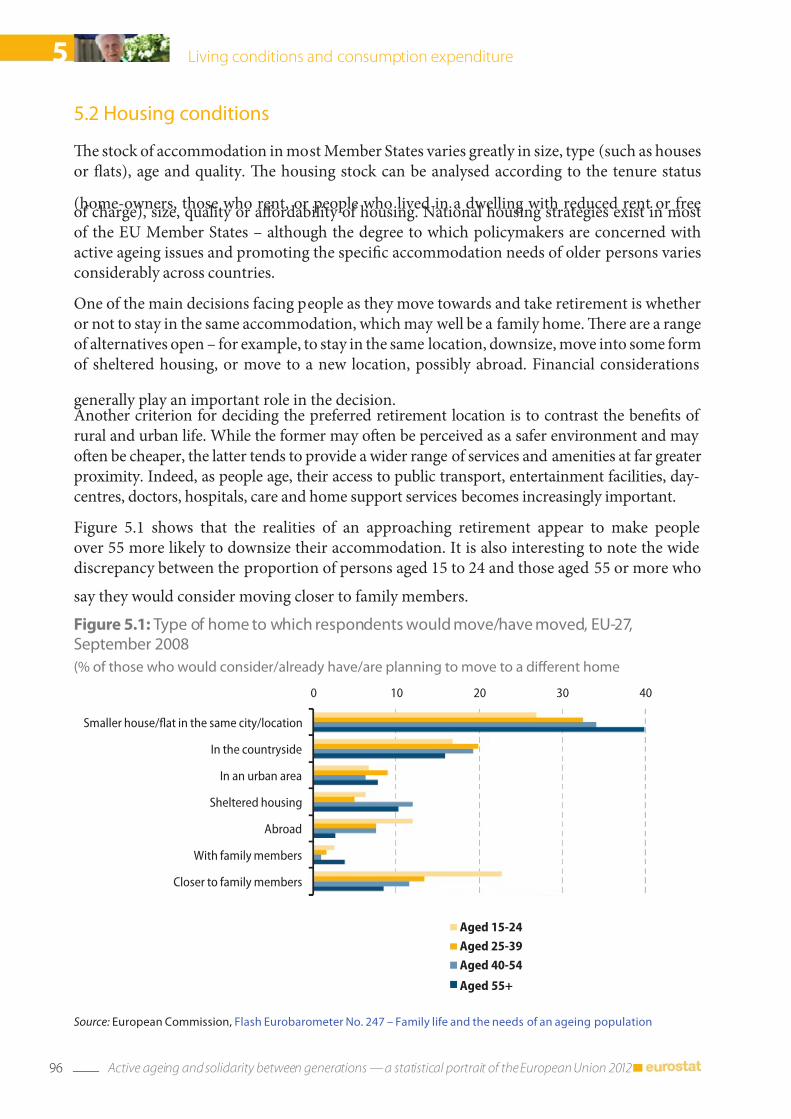
7/31/2019 Active ageing and solidarity between generations 2012 edition A statistical portrait of the European Union 2012
http://slidepdf.com/reader/full/active-ageing-and-solidarity-between-generations-2012-edition-a-statistical 98/147
96 Active ageing and solidarity between generations — a statistical portrait of the European Union 2012
5 Living conditions and consumption expenditure
5.2 Housing conditions
Te stock o accommodation in most Member States varies greatly in size, type (such as housesor ats), age and quality. Te housing stock can be analysed according to the tenure status
(home-owners, those who rent, or people who lived in a dwelling with reduced rent or reeo charge), size, quality or aordability o housing. National housing strategies exist in mosto the EU Member States – although the degree to which policymakers are concerned withactive ageing issues and promoting the specic accommodation needs o older persons variesconsiderably across countries.
One o the main decisions acing people as they move towards and take retirement is whetheror not to stay in the same accommodation, which may well be a amily home. Tere are a rangeo alternatives open – or example, to stay in the same location, downsize, move into some ormo sheltered housing, or move to a new location, possibly abroad. Financial considerations
generally play an important role in the decision.Another criterion or deciding the preerred retirement location is to contrast the benets o rural and urban lie. While the ormer may ofen be perceived as a saer environment and may ofen be cheaper, the latter tends to provide a wider range o services and amenities at ar greaterproximity. Indeed, as people age, their access to public transport, entertainment acilities, day-centres, doctors, hospitals, care and home support services becomes increasingly important.
Figure 5.1 shows that the realities o an approaching retirement appear to make peopleover 55 more likely to downsize their accommodation. It is also interesting to note the widediscrepancy between the proportion o persons aged 15 to 24 and those aged 55 or more who
say they would consider moving closer to amily members.
Figure 5.1: Type o home to which respondents would move/have moved, EU‑27,September 2008
(% o those who would consider/already have/are planning to move to a dierent home
0 10 20 30 40
Smaller house/at in the same city/location
In the countryside
In an urban area
Sheltered housing
Abroad
With family members
Closer to family members
Aged 15-24
Aged 25-39
Aged 40-54
Aged 55+
Source: European Commission, Flash Eurobarometer No. 247 – Family lie and the needs o an ageing population

7/31/2019 Active ageing and solidarity between generations 2012 edition A statistical portrait of the European Union 2012
http://slidepdf.com/reader/full/active-ageing-and-solidarity-between-generations-2012-edition-a-statistical 99/147
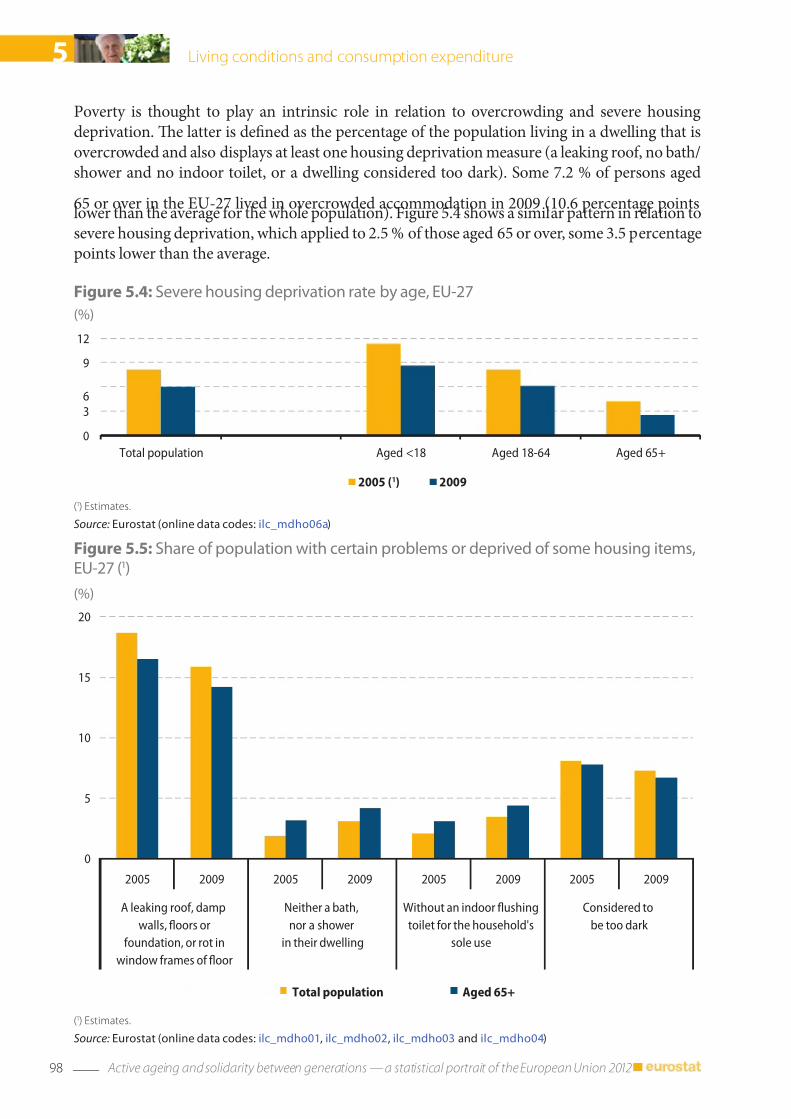
7/31/2019 Active ageing and solidarity between generations 2012 edition A statistical portrait of the European Union 2012
http://slidepdf.com/reader/full/active-ageing-and-solidarity-between-generations-2012-edition-a-statistical 100/147
98 Active ageing and solidarity between generations — a statistical portrait of the European Union 2012
5 Living conditions and consumption expenditure
Figure 5.4: Severe housing deprivation rate by age, EU‑27
(%)
0
3
6
9
12
Total population Aged <18 Aged 18-64 Aged 65+
2005 (1) 2009
(1) Estimates.
Source: Eurostat (online data codes: ilc_mdho06a)
Figure 5.5: Share o population with certain problems or deprived o some housing items,EU‑27 (1)
(%)
0
5
10
15
20
2005 2009 2005 2009 2005 2009 2005 2009
A leaking roof, damp
walls, oors or
foundation, or rot in
window frames of oor
Neither a bath,
nor a shower
in their dwelling
Without an indoor ushing
toilet for the household's
sole use
Considered to
be too dark
Total population Aged 65+
(1) Estimates.
Source: Eurostat (online data codes: ilc_mdho01, ilc_mdho02, ilc_mdho03 and ilc_mdho04)
Poverty is thought to play an intrinsic role in relation to overcrowding and severe housingdeprivation. Te latter is dened as the percentage o the population living in a dwelling that isovercrowded and also displays at least one housing deprivation measure (a leaking roo, no bath/shower and no indoor toilet, or a dwelling considered too dark). Some 7.2 % o persons aged
65 or over in the EU-27 lived in overcrowded accommodation in 2009 (10.6 percentage pointslower than the average or the whole population). Figure 5.4 shows a similar pattern in relation tosevere housing deprivation, which applied to 2.5 % o those aged 65 or over, some 3.5 percentagepoints lower than the average.
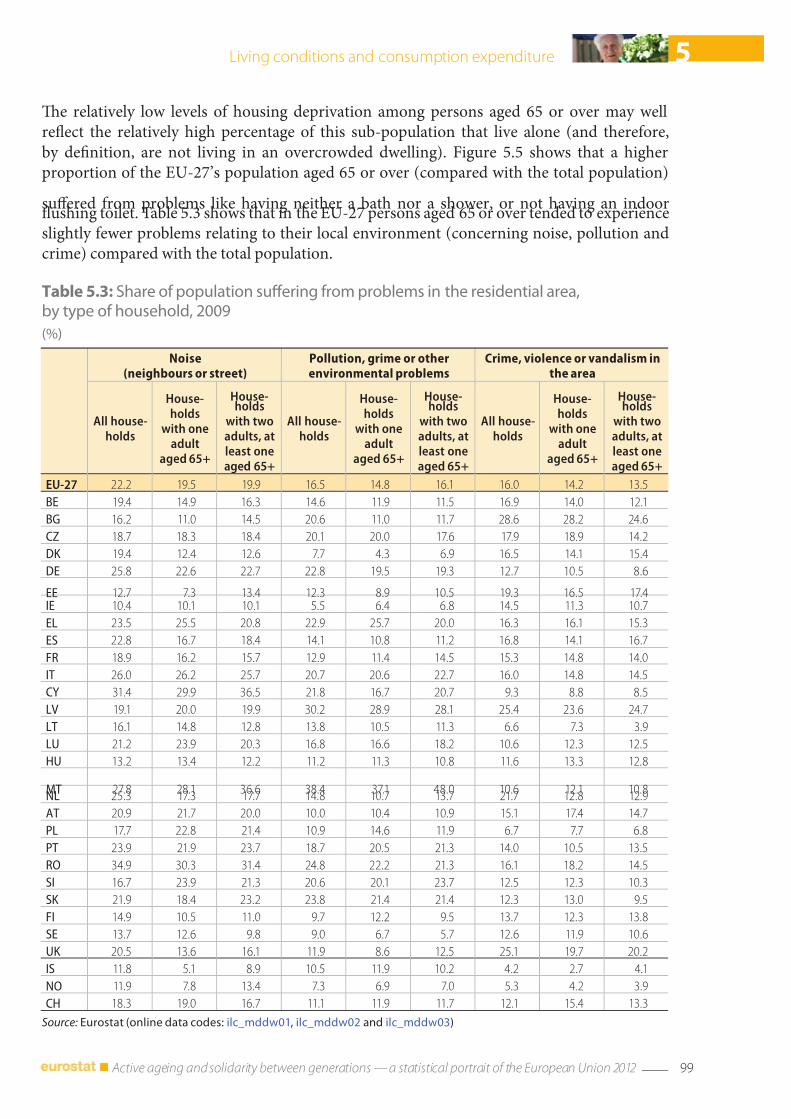
7/31/2019 Active ageing and solidarity between generations 2012 edition A statistical portrait of the European Union 2012
http://slidepdf.com/reader/full/active-ageing-and-solidarity-between-generations-2012-edition-a-statistical 101/147
99 Active ageing and solidarity between generations — a statistical portrait of the European Union 2012
5Living conditions and consumption expenditure
Table 5.3: Share o population suering rom problems in the residential area,by type o household, 2009
(%)
Noise(neighbours or street)
Pollution, grime or otherenvironmental problems
Crime, violence or vandalism inthe area
All house-holds
House-holds
with oneadult
aged 65+
House-holds
with twoadults, atleast oneaged 65+
All house-holds
House-holds
with oneadult
aged 65+
House-holds
with twoadults, atleast oneaged 65+
All house-holds
House-holds
with oneadult
aged 65+
House-holds
with twoadults, atleast oneaged 65+
EU-27 22.2 19.5 19.9 16.5 14.8 16.1 16.0 14.2 13.5
BE 19.4 14.9 16.3 14.6 11.9 11.5 16.9 14.0 12.1
BG 16.2 11.0 14.5 20.6 11.0 11.7 28.6 28.2 24.6
CZ 18.7 18.3 18.4 20.1 20.0 17.6 17.9 18.9 14.2
DK 19.4 12.4 12.6 7.7 4.3 6.9 16.5 14.1 15.4
DE 25.8 22.6 22.7 22.8 19.5 19.3 12.7 10.5 8.6
EE 12.7 7.3 13.4 12.3 8.9 10.5 19.3 16.5 17.4IE 10.4 10.1 10.1 5.5 6.4 6.8 14.5 11.3 10.7
EL 23.5 25.5 20.8 22.9 25.7 20.0 16.3 16.1 15.3
ES 22.8 16.7 18.4 14.1 10.8 11.2 16.8 14.1 16.7
FR 18.9 16.2 15.7 12.9 11.4 14.5 15.3 14.8 14.0
IT 26.0 26.2 25.7 20.7 20.6 22.7 16.0 14.8 14.5
CY 31.4 29.9 36.5 21.8 16.7 20.7 9.3 8.8 8.5
LV 19.1 20.0 19.9 30.2 28.9 28.1 25.4 23.6 24.7
LT 16.1 14.8 12.8 13.8 10.5 11.3 6.6 7.3 3.9
LU 21.2 23.9 20.3 16.8 16.6 18.2 10.6 12.3 12.5
HU 13.2 13.4 12.2 11.2 11.3 10.8 11.6 13.3 12.8
MT 27.8 28.1 36.6 38.4 37.1 48.0 10.6 12.1 10.8NL 25.3 17.3 17.7 14.8 10.7 13.7 21.7 12.8 12.9
AT 20.9 21.7 20.0 10.0 10.4 10.9 15.1 17.4 14.7
PL 17.7 22.8 21.4 10.9 14.6 11.9 6.7 7.7 6.8
PT 23.9 21.9 23.7 18.7 20.5 21.3 14.0 10.5 13.5
RO 34.9 30.3 31.4 24.8 22.2 21.3 16.1 18.2 14.5
SI 16.7 23.9 21.3 20.6 20.1 23.7 12.5 12.3 10.3
SK 21.9 18.4 23.2 23.8 21.4 21.4 12.3 13.0 9.5
FI 14.9 10.5 11.0 9.7 12.2 9.5 13.7 12.3 13.8
SE 13.7 12.6 9.8 9.0 6.7 5.7 12.6 11.9 10.6
UK 20.5 13.6 16.1 11.9 8.6 12.5 25.1 19.7 20.2
IS 11.8 5.1 8.9 10.5 11.9 10.2 4.2 2.7 4.1
NO 11.9 7.8 13.4 7.3 6.9 7.0 5.3 4.2 3.9
CH 18.3 19.0 16.7 11.1 11.9 11.7 12.1 15.4 13.3
Source: Eurostat (online data codes: ilc_mddw01, ilc_mddw02 and ilc_mddw03)
Te relatively low levels o housing deprivation among persons aged 65 or over may wellreect the relatively high percentage o this sub-population that live alone (and thereore,by denition, are not living in an overcrowded dwelling). Figure 5.5 shows that a higherproportion o the EU-27’s population aged 65 or over (compared with the total population)
suered rom problems like having neither a bath nor a shower, or not having an indoorushing toilet. able 5.3 shows that in the EU-27 persons aged 65 or over tended to experienceslightly ewer problems relating to their local environment (concerning noise, pollution andcrime) compared with the total population.
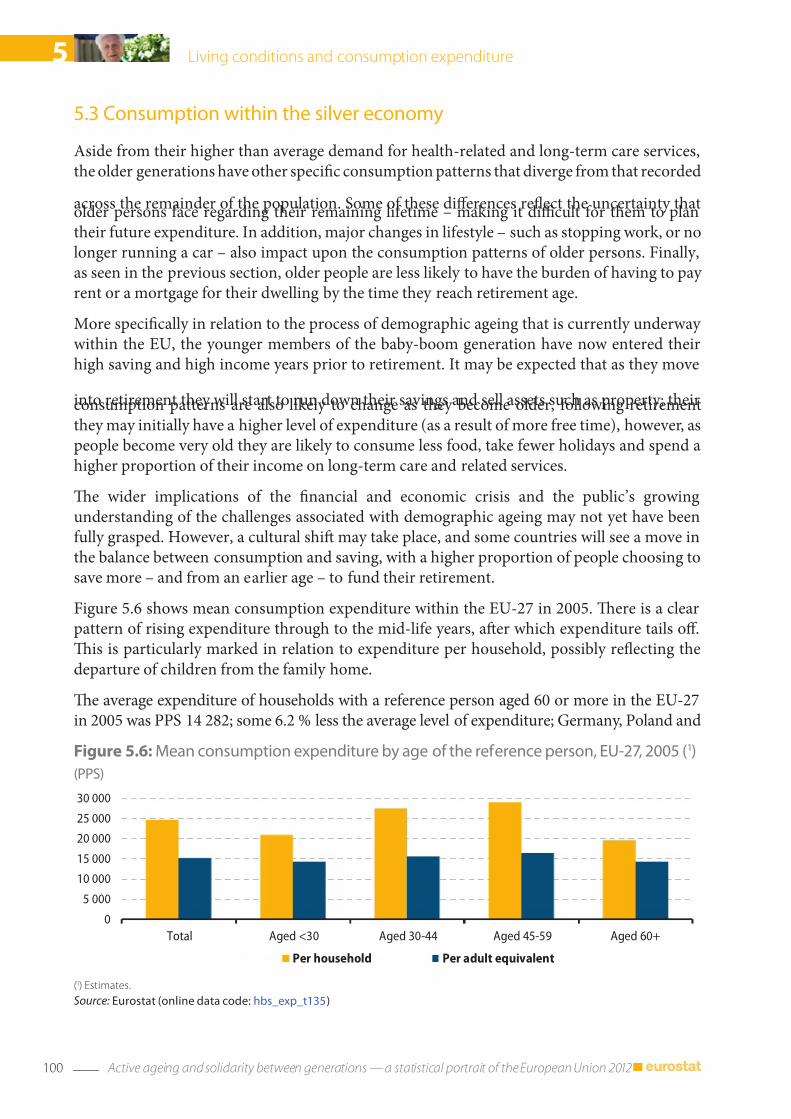
7/31/2019 Active ageing and solidarity between generations 2012 edition A statistical portrait of the European Union 2012
http://slidepdf.com/reader/full/active-ageing-and-solidarity-between-generations-2012-edition-a-statistical 102/147
100 Active ageing and solidarity between generations — a statistical portrait of the European Union 2012
5 Living conditions and consumption expenditure
5.3 Consumption within the silver economy
Aside rom their higher than average demand or health-related and long-term care services,the older generations have other specic consumption patterns that diverge rom that recorded
across the remainder o the population. Some o these dierences reect the uncertainty thatolder persons ace regarding their remaining lietime – making it dicult or them to plantheir uture expenditure. In addition, major changes in liestyle – such as stopping work, or nolonger running a car – also impact upon the consumption patterns o older persons. Finally,as seen in the previous section, older people are less likely to have the burden o having to pay rent or a mortgage or their dwelling by the time they reach retirement age.
More specically in relation to the process o demographic ageing that is currently underway within the EU, the younger members o the baby-boom generation have now entered theirhigh saving and high income years prior to retirement. It may be expected that as they move
into retirement they will start to run down their savings and sell assets such as property; theirconsumption patterns are also likely to change as they become older, ollowing retirementthey may initially have a higher level o expenditure (as a result o more ree time), however, aspeople become very old they are likely to consume less ood, take ewer holidays and spend ahigher proportion o their income on long-term care and related services.
Te wider implications o the nancial and economic crisis and the public’s growingunderstanding o the challenges associated with demographic ageing may not yet have beenully grasped. However, a cultural shif may take place, and some countries will see a move inthe balance between consumption and saving, with a higher proportion o people choosing tosave more – and rom an earlier age – to und their retirement.
Figure 5.6 shows mean consumption expenditure within the EU-27 in 2005. Tere is a clearpattern o rising expenditure through to the mid-lie years, afer which expenditure tails o.Tis is particularly marked in relation to expenditure per household, possibly reecting thedeparture o children rom the amily home.
Te average expenditure o households with a reerence person aged 60 or more in the EU-27in 2005 was PPS 14 282; some 6.2 % less the average level o expenditure; Germany, Poland and
Figure 5.6: Mean consumption expenditure by age o the reerence person, EU‑27, 2005 (1)
(PPS)
0
5 000
10 000
15 000
20 000
25 000
30 000
Total Aged <30 Aged 30-44 Aged 45-59 Aged 60+
Per household Per adult equivalent
(1) Estimates.
Source: Eurostat (online data code: hbs_exp_t135)
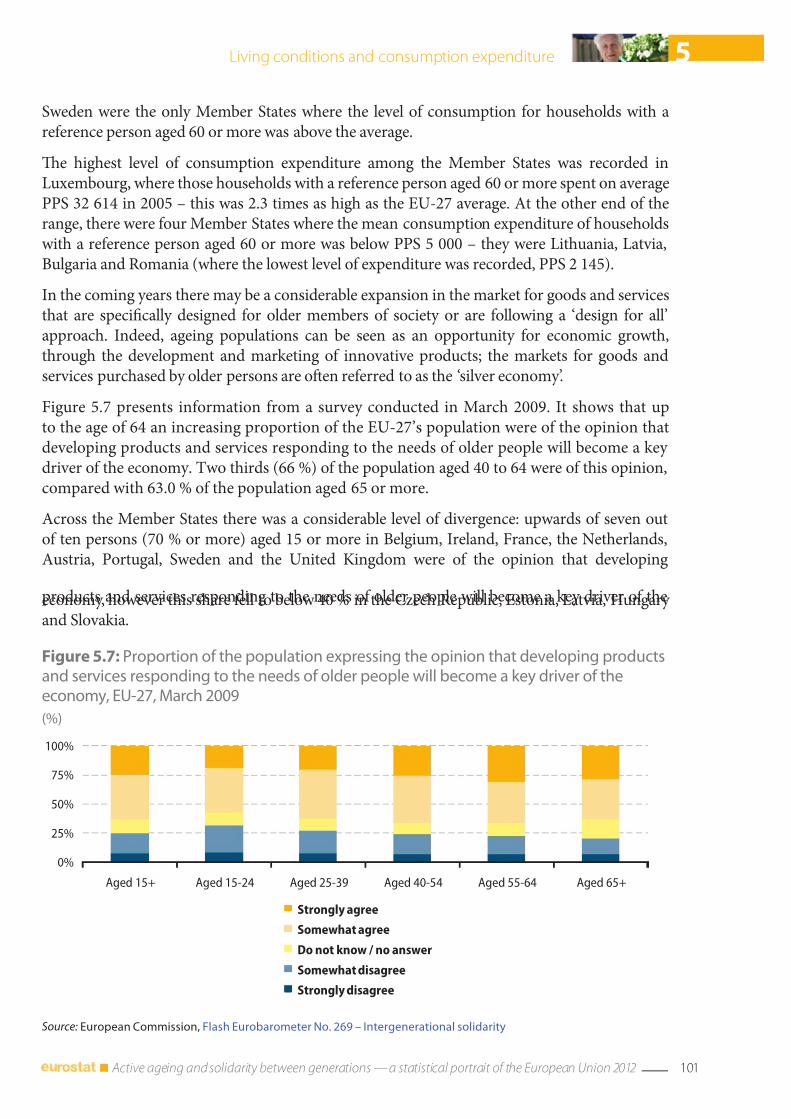
7/31/2019 Active ageing and solidarity between generations 2012 edition A statistical portrait of the European Union 2012
http://slidepdf.com/reader/full/active-ageing-and-solidarity-between-generations-2012-edition-a-statistical 103/147
101 Active ageing and solidarity between generations — a statistical portrait of the European Union 2012
5Living conditions and consumption expenditure
Sweden were the only Member States where the level o consumption or households with areerence person aged 60 or more was above the average.
Te highest level o consumption expenditure among the Member States was recorded inLuxembourg, where those households with a reerence person aged 60 or more spent on averagePPS 32 614 in 2005 – this was 2.3 times as high as the EU-27 average. At the other end o therange, there were our Member States where the mean consumption expenditure o householdswith a reerence person aged 60 or more was below PPS 5 000 – they were Lithuania, Latvia,Bulgaria and Romania (where the lowest level o expenditure was recorded, PPS 2 145).
In the coming years there may be a considerable expansion in the market or goods and servicesthat are specically designed or older members o society or are ollowing a ‘design or all’approach. Indeed, ageing populations can be seen as an opportunity or economic growth,through the development and marketing o innovative products; the markets or goods andservices purchased by older persons are ofen reerred to as the ‘silver economy’.
Figure 5.7 presents inormation rom a survey conducted in March 2009. It shows that upto the age o 64 an increasing proportion o the EU-27’s population were o the opinion thatdeveloping products and services responding to the needs o older people will become a key driver o the economy. wo thirds (66 %) o the population aged 40 to 64 were o this opinion,compared with 63.0 % o the population aged 65 or more.
Across the Member States there was a considerable level o divergence: upwards o seven outo ten persons (70 % or more) aged 15 or more in Belgium, Ireland, France, the Netherlands,Austria, Portugal, Sweden and the United Kingdom were o the opinion that developing
products and services responding to the needs o older people will become a key driver o theeconomy, however this share ell to below 40 % in the Czech Republic, Estonia, Latvia, Hungary and Slovakia.
Figure 5.7: Proportion o the population expressing the opinion that developing productsand services responding to the needs o older people will become a key driver o theeconomy, EU‑27, March 2009
(%)
0%
25%
50%
75%
100%
Aged 15+ Aged 15-24 Aged 25-39 Aged 40-54 Aged 55-64 Aged 65+
Strongly agree
Somewhat agree
Do not know / no answer
Somewhat disagree
Strongly disagree
Source: European Commission, Flash Eurobarometer No. 269 – Intergenerational solidarity

7/31/2019 Active ageing and solidarity between generations 2012 edition A statistical portrait of the European Union 2012
http://slidepdf.com/reader/full/active-ageing-and-solidarity-between-generations-2012-edition-a-statistical 104/147
102 Active ageing and solidarity between generations — a statistical portrait of the European Union 2012
5 Living conditions and consumption expenditure
5.4 Income o older people and monetary poverty
Poverty and social exclusion depend on a wide range o actors – these are generally divided orthe purpose o analysis into those that are income-related (the ocus o this section) and those that
are not. Statistics on economic inequality are o particular use or estimating relative poverty, as thedistribution o economic resources has a direct bearing on the extent and depth o poverty.
Te relative median income ratio o elderly people aged 65 or over is dened as the medianequivalised disposable income (14) or persons aged 65 and above compared with the samemeasure or persons aged less than 65. Figure 5.8 shows that the median income o personsaged 65 or more tended, as one may expect given the vast majority o people o this age do notwork, to be below the average or the population aged less than 65 – the EU-27 ratio was 0.86in both 2005 and 2009. Hungary, Luxembourg and France were exceptions to the rule, eachreporting ratios around 1 in 2009 reecting no signicant dierence between the respective
relative median incomes o persons aged 65 or over and those aged less than 65. Older people donot necessarily have lower standards o living just because their incomes are lower. Rather, they may have accrued signicant savings during their working lives and may also own a property (without an outstanding mortgage).
Te stability in the ratio or the EU-27 hides a diverging situation as regards developments inthe Member States. Hal o the Member States reported an increase and the same number areduction in their relative median income ratios or persons aged 65 or over between 2005 and2009; a comparison is not available or Romania.
Figure 5.8: Relative median income ratio o elderly people aged 65+
(ratio between the median equivalised disposable income o persons aged 65 or over andpersons aged less than 65)
0.00
0.25
0.50
0.75
1.00
1.25
E U - 2 7 ( 1 )
H U
L U
F R
R O ( 2 )
P L
A T I T
D E
N L S
I E L
P T
S K
E S
U K
C Z
M T I E
S E
B E
L T F
I
D K
E E
B G
C Y
L V I S
N O
C H ( 2 )
H R
2005 2009
(1
) Estimates.(2) 2005, not available.
Source: Eurostat (online data code: ilc_pnp2)
(14) The disposable income is the total income o a household (ater tax and other deductions) available or spending or saving;the equivalised disposable income is based on dividing the disposable income by the number o household members
- the number household members is equivalised by converting each member using a scale that gives a weight to allmembers o the household using weights o 1.0 to the rst adult, 0.5 to the second and each subsequent person aged 14and over, and 0.3 to each child aged under 14.
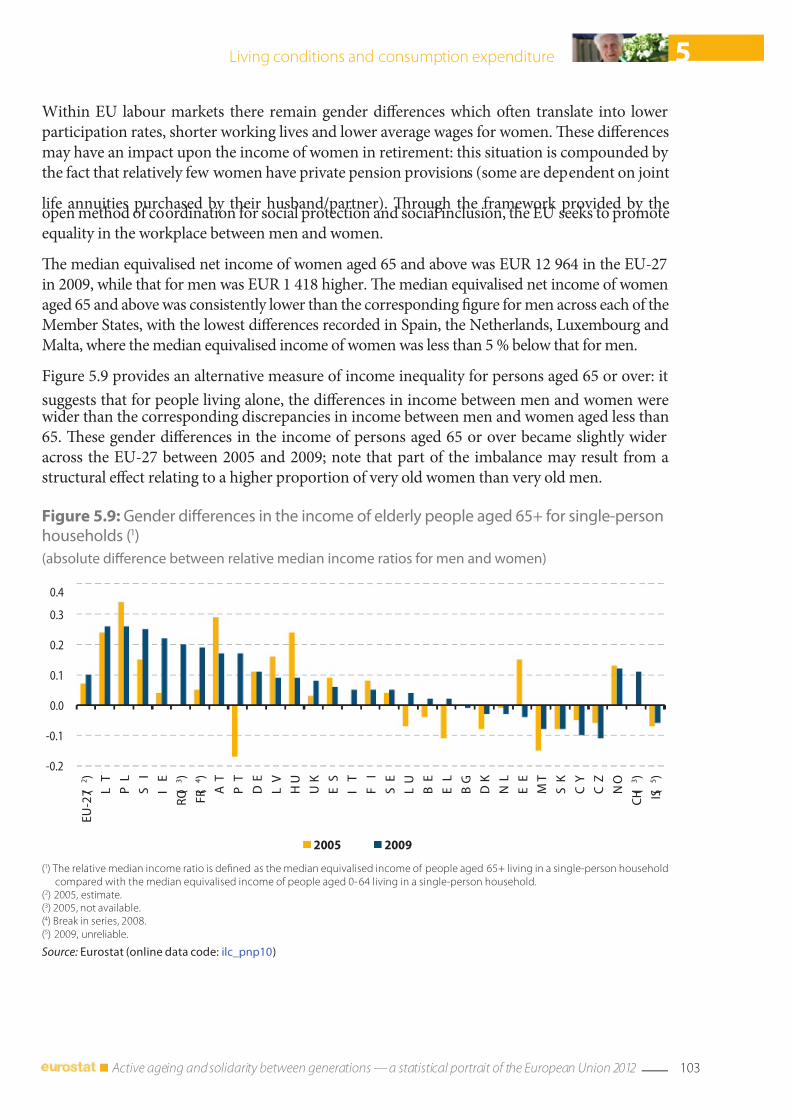
7/31/2019 Active ageing and solidarity between generations 2012 edition A statistical portrait of the European Union 2012
http://slidepdf.com/reader/full/active-ageing-and-solidarity-between-generations-2012-edition-a-statistical 105/147
103 Active ageing and solidarity between generations — a statistical portrait of the European Union 2012
5Living conditions and consumption expenditure
Figure 5.9: Gender dierences in the income o elderly people aged 65+ or single‑personhouseholds (1)
(absolute dierence between relative median income ratios or men and women)
-0.2
-0.1
0.0
0.1
0.2
0.3
0.4
E U - 2
7 ( 2 )
L
T
P
L
S
I
I
E
R O ( 3 )
F R ( 4 )
A
T
P
T
D
E
L V
H U
U K
E
S
I
T
F
I
S
E
L U
B
E
E
L
B G
D K
N
L
E
E
M
T
S K
C Y
C Z
N O
C H ( 3 )
I S ( 5 )
2005 2009
(1) The relative median income ratio is dened as the median equivalised income o people aged 65+ living in a single-person householdcompared with the median equivalised income o people aged 0-64 living in a single-person household.
(2) 2005, estimate.(3) 2005, not available.(4) Break in series, 2008.(5) 2009, unreliable.
Source: Eurostat (online data code: ilc_pnp10)
Within EU labour markets there remain gender dierences which ofen translate into lowerparticipation rates, shorter working lives and lower average wages or women. Tese dierencesmay have an impact upon the income o women in retirement: this situation is compounded by the act that relatively ew women have private pension provisions (some are dependent on joint
lie annuities purchased by their husband/partner). Trough the ramework provided by theopen method o coordination or social protection and social inclusion, the EU seeks to promoteequality in the workplace between men and women.
Te median equivalised net income o women aged 65 and above was EUR 12 964 in the EU-27in 2009, while that or men was EUR 1 418 higher. Te median equivalised net income o womenaged 65 and above was consistently lower than the corresponding gure or men across each o theMember States, with the lowest dierences recorded in Spain, the Netherlands, Luxembourg andMalta, where the median equivalised income o women was less than 5 % below that or men.
Figure 5.9 provides an alternative measure o income inequality or persons aged 65 or over: it
suggests that or people living alone, the dierences in income between men and women werewider than the corresponding discrepancies in income between men and women aged less than65. Tese gender dierences in the income o persons aged 65 or over became slightly wideracross the EU-27 between 2005 and 2009; note that part o the imbalance may result rom astructural eect relating to a higher proportion o very old women than very old men.
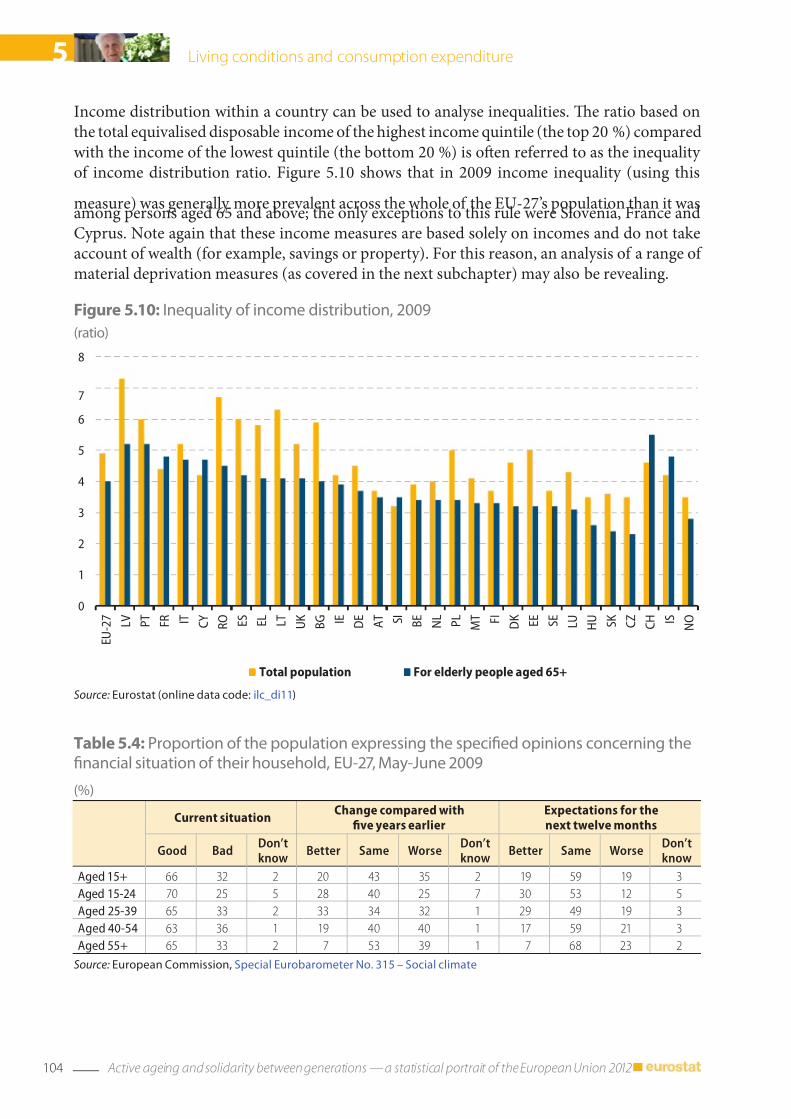
7/31/2019 Active ageing and solidarity between generations 2012 edition A statistical portrait of the European Union 2012
http://slidepdf.com/reader/full/active-ageing-and-solidarity-between-generations-2012-edition-a-statistical 106/147
104 Active ageing and solidarity between generations — a statistical portrait of the European Union 2012
5 Living conditions and consumption expenditure
Table 5.4: Proportion o the population expressing the specied opinions concerning thenancial situation o their household, EU‑27, May‑June 2009
(%)
Current situationChange compared with
fve years earlierExpectations or thenext twelve months
Good BadDon’tknow
Better Same WorseDon’tknow
Better Same WorseDon’tknow
Aged 15+ 66 32 2 20 43 35 2 19 59 19 3
Aged 15-24 70 25 5 28 40 25 7 30 53 12 5
Aged 25-39 65 33 2 33 34 32 1 29 49 19 3
Aged 40-54 63 36 1 19 40 40 1 17 59 21 3
Aged 55+ 65 33 2 7 53 39 1 7 68 23 2
Source: European Commission, Special Eurobarometer No. 315 – Social climate
Figure 5.10: Inequality o income distribution, 2009
(ratio)
0
1
2
3
4
5
6
7
8
E U - 2 7
L V
P T
F R I T C
Y R O E
S E L
L T
U K
B G I E
D E
A T S
I B E
N L
P L
M T F
I
D K
E E
S E
L U
H U
S K
C Z
C H I S
N O
Total population For elderly people aged 65+
Source: Eurostat (online data code: ilc_di11)
Income distribution within a country can be used to analyse inequalities. Te ratio based onthe total equivalised disposable income o the highest income quintile (the top 20 %) comparedwith the income o the lowest quintile (the bottom 20 %) is ofen reerred to as the inequality o income distribution ratio. Figure 5.10 shows that in 2009 income inequality (using this
measure) was generally more prevalent across the whole o the EU-27’s population than it wasamong persons aged 65 and above; the only exceptions to this rule were Slovenia, France andCyprus. Note again that these income measures are based solely on incomes and do not takeaccount o wealth (or example, savings or property). For this reason, an analysis o a range o material deprivation measures (as covered in the next subchapter) may also be revealing.
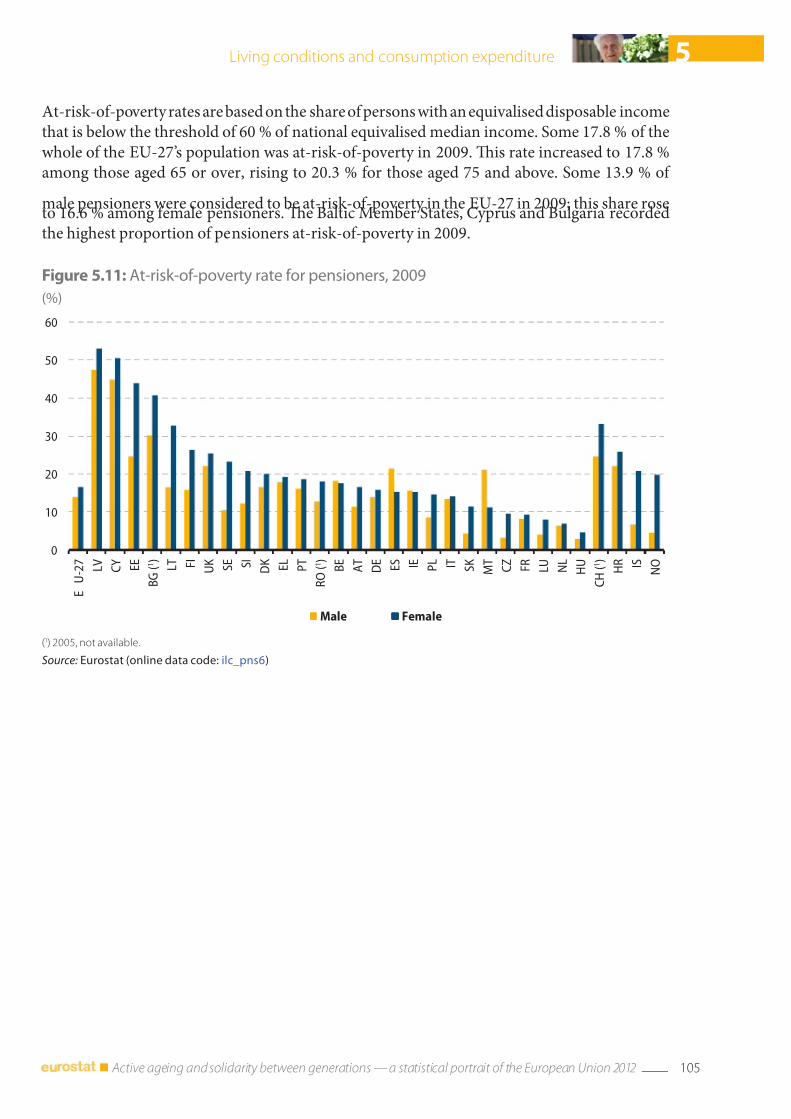
7/31/2019 Active ageing and solidarity between generations 2012 edition A statistical portrait of the European Union 2012
http://slidepdf.com/reader/full/active-ageing-and-solidarity-between-generations-2012-edition-a-statistical 107/147
105 Active ageing and solidarity between generations — a statistical portrait of the European Union 2012
5Living conditions and consumption expenditure
Figure 5.11: At‑risk‑o‑poverty rate or pensioners, 2009
(%)
0
10
20
30
40
50
60
E
U - 2 7
L V
C Y
E E
B G ( 1 )
L T F
I U K
S E S
I D K
E L
P T
R O ( 1 )
B E
A T
D E
E S I E
P L I T
S K
M T
C Z
F R
L U
N L
H U
C H ( 1 )
H R I S
N O
Male Female
(1) 2005, not available.
Source: Eurostat (online data code: ilc_pns6)
At-risk-o-poverty rates are based on the share o persons with an equivalised disposable incomethat is below the threshold o 60 % o national equivalised median income. Some 17.8 % o thewhole o the EU-27’s population was at-risk-o-poverty in 2009. Tis rate increased to 17.8 %among those aged 65 or over, rising to 20.3 % or those aged 75 and above. Some 13.9 % o
male pensioners were considered to be at-risk-o-poverty in the EU-27 in 2009; this share roseto 16.6 % among emale pensioners. Te Baltic Member States, Cyprus and Bulgaria recordedthe highest proportion o pensioners at-risk-o-poverty in 2009.
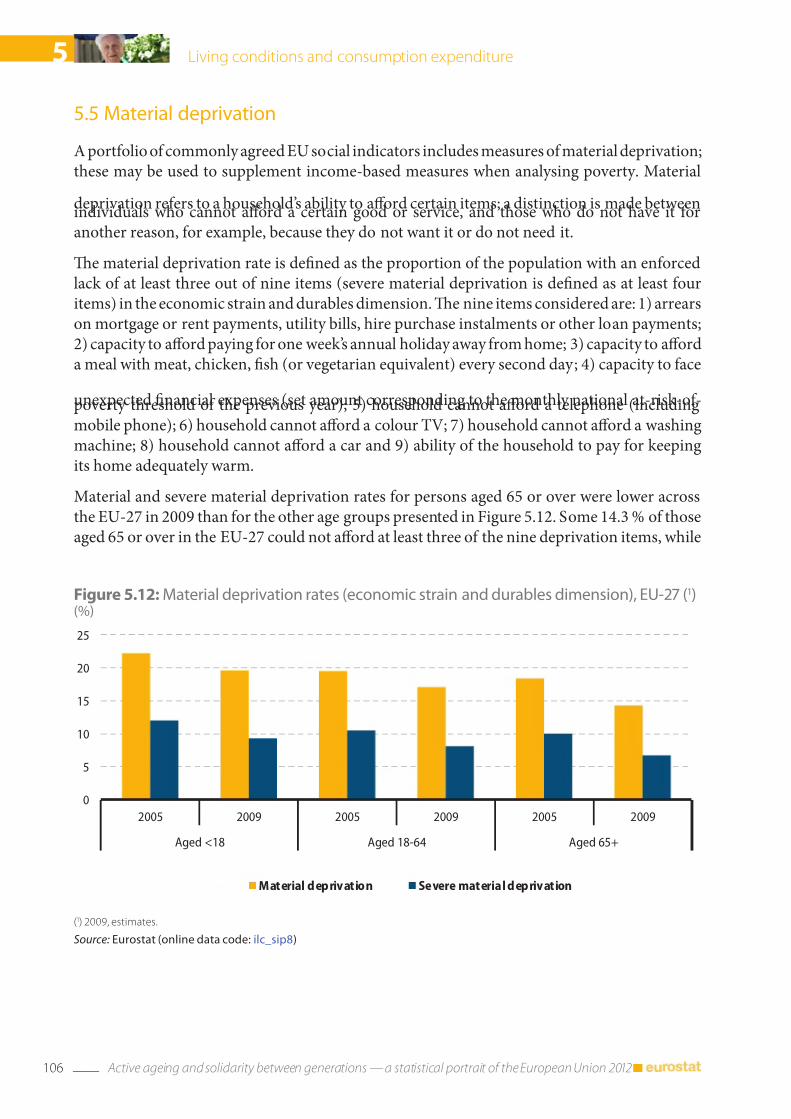
7/31/2019 Active ageing and solidarity between generations 2012 edition A statistical portrait of the European Union 2012
http://slidepdf.com/reader/full/active-ageing-and-solidarity-between-generations-2012-edition-a-statistical 108/147
106 Active ageing and solidarity between generations — a statistical portrait of the European Union 2012
5 Living conditions and consumption expenditure
5.5 Material deprivation
A portolio o commonly agreed EU social indicators includes measures o material deprivation;these may be used to supplement income-based measures when analysing poverty. Material
deprivation reers to a household’s ability to aord certain items; a distinction is made betweenindividuals who cannot aord a certain good or service, and those who do not have it oranother reason, or example, because they do not want it or do not need it.
Te material deprivation rate is dened as the proportion o the population with an enorcedlack o at least three out o nine items (severe material deprivation is dened as at least ouritems) in the economic strain and durables dimension. Te nine items considered are: 1) arrearson mortgage or rent payments, utility bills, hire purchase instalments or other loan payments;2) capacity to aord paying or one week’s annual holiday away rom home; 3) capacity to aorda meal with meat, chicken, sh (or vegetarian equivalent) every second day; 4) capacity to ace
unexpected nancial expenses (set amount corresponding to the monthly national at-risk-o-poverty threshold o the previous year); 5) household cannot aord a telephone (includingmobile phone); 6) household cannot aord a colour V; 7) household cannot aord a washingmachine; 8) household cannot aord a car and 9) ability o the household to pay or keepingits home adequately warm.
Material and severe material deprivation rates or persons aged 65 or over were lower acrossthe EU-27 in 2009 than or the other age groups presented in Figure 5.12. Some 14.3 % o thoseaged 65 or over in the EU-27 could not aord at least three o the nine deprivation items, while
Figure 5.12: Material deprivation rates (economic strain and durables dimension), EU‑27 (1)(%)
0
5
10
15
20
25
2005 2009 2005 2009 2005 2009
Aged <18 Aged 18-64 Aged 65+
Material deprivation Severe material deprivation
(1) 2009, estimates.
Source: Eurostat (online data code: ilc_sip8)
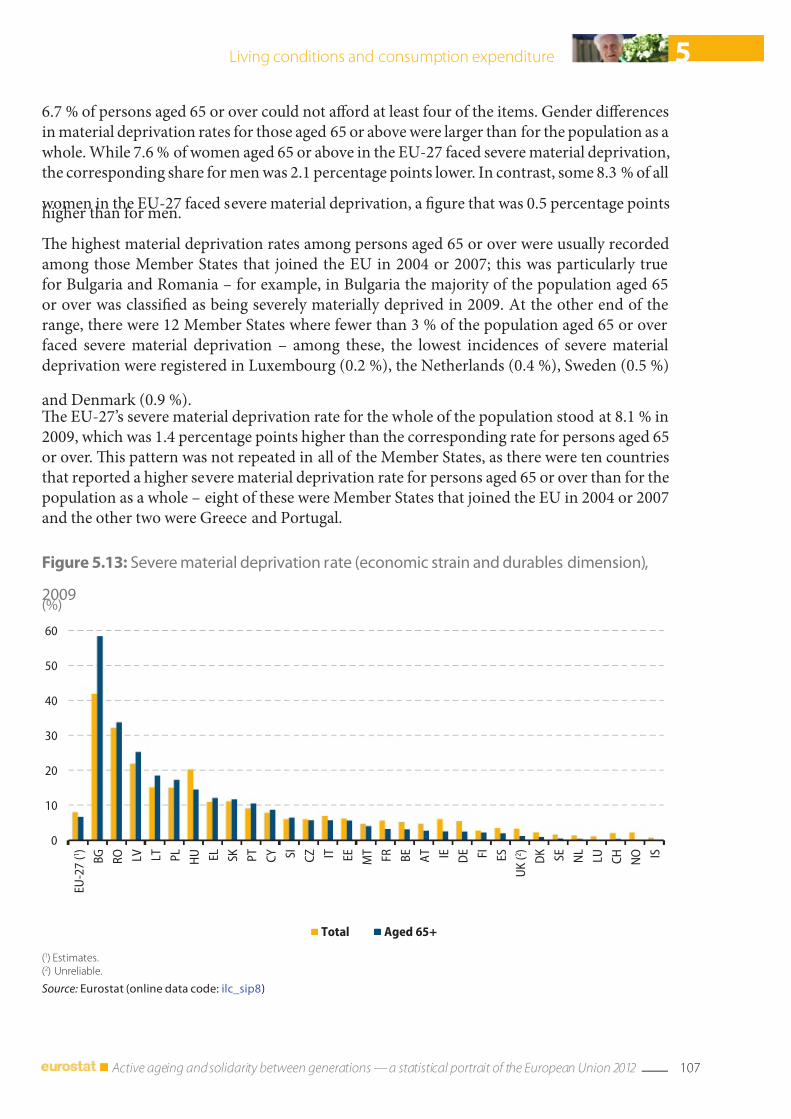
7/31/2019 Active ageing and solidarity between generations 2012 edition A statistical portrait of the European Union 2012
http://slidepdf.com/reader/full/active-ageing-and-solidarity-between-generations-2012-edition-a-statistical 109/147
107 Active ageing and solidarity between generations — a statistical portrait of the European Union 2012
5Living conditions and consumption expenditure
6.7 % o persons aged 65 or over could not aord at least our o the items. Gender dierencesin material deprivation rates or those aged 65 or above were larger than or the population as awhole. While 7.6 % o women aged 65 or above in the EU-27 aced severe material deprivation,the corresponding share or men was 2.1 percentage points lower. In contrast, some 8.3 % o all
women in the EU-27 aced severe material deprivation, a gure that was 0.5 percentage pointshigher than or men.
Te highest material deprivation rates among persons aged 65 or over were usually recordedamong those Member States that joined the EU in 2004 or 2007; this was particularly trueor Bulgaria and Romania – or example, in Bulgaria the majority o the population aged 65or over was classied as being severely materially deprived in 2009. At the other end o therange, there were 12 Member States where ewer than 3 % o the population aged 65 or overaced severe material deprivation – among these, the lowest incidences o severe materialdeprivation were registered in Luxembourg (0.2 %), the Netherlands (0.4 %), Sweden (0.5 %)
and Denmark (0.9 %).Te EU-27’s severe material deprivation rate or the whole o the population stood at 8.1 % in2009, which was 1.4 percentage points higher than the corresponding rate or persons aged 65or over. Tis pattern was not repeated in all o the Member States, as there were ten countriesthat reported a higher severe material deprivation rate or persons aged 65 or over than or thepopulation as a whole – eight o these were Member States that joined the EU in 2004 or 2007and the other two were Greece and Portugal.
Figure 5.13: Severe material deprivation rate (economic strain and durables dimension),
2009(%)
0
10
20
30
40
50
60
E U - 2 7 ( 1 )
B G
R O L
V L T
P L
H U E
L S K
P T
C Y S
I C Z I T
E E
M T
F R
B E
A T I E
D E F
I E S
U K ( 2 )
D K
S E
N L
L U
C H
N O I S
Total Aged 65+
(1) Estimates.(2) Unreliable.
Source: Eurostat (online data code: ilc_sip8)
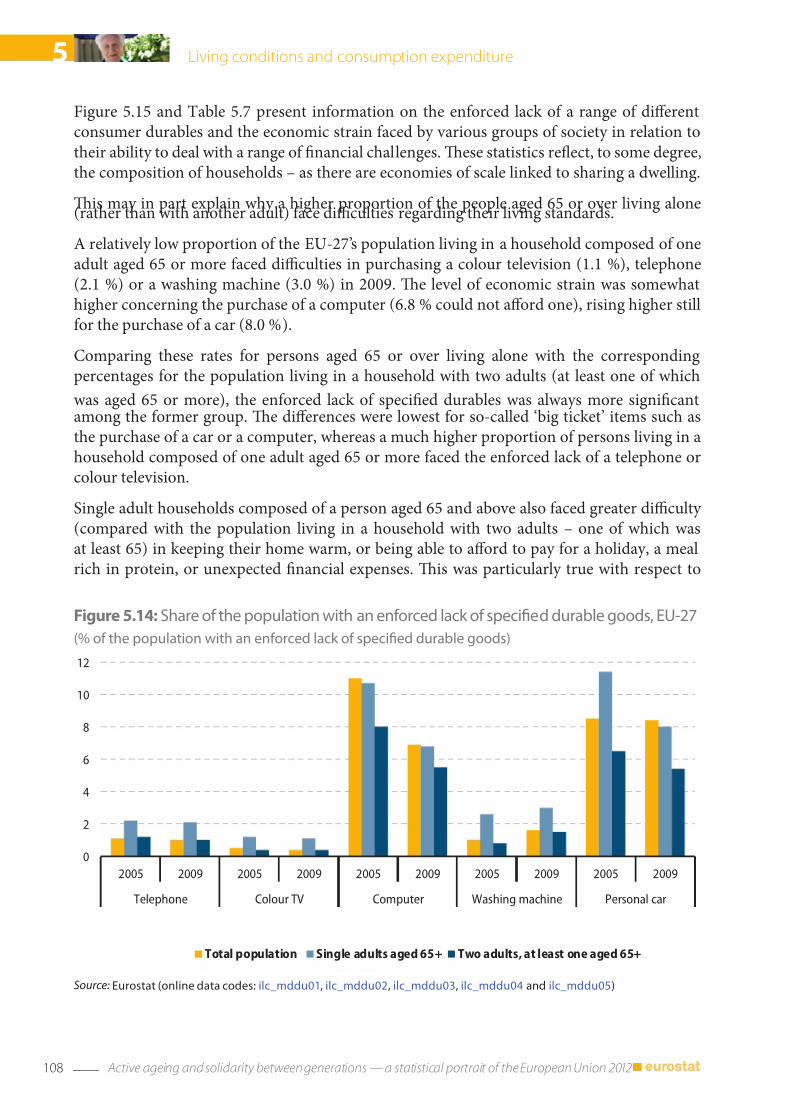
7/31/2019 Active ageing and solidarity between generations 2012 edition A statistical portrait of the European Union 2012
http://slidepdf.com/reader/full/active-ageing-and-solidarity-between-generations-2012-edition-a-statistical 110/147
108 Active ageing and solidarity between generations — a statistical portrait of the European Union 2012
5 Living conditions and consumption expenditure
Figure 5.14: Share o the population with an enorced lack o specied durable goods, EU‑27
(% o the population with an enorced lack o specied durable goods)
0
2
4
6
8
10
12
2005 2009 2005 2009 2005 2009 2005 2009 2005 2009
Telephone Colour TV Computer Washing machine Personal car
Total population Single adults aged 65+ Two adults, at least one aged 65+
Source: Eurostat (online data codes: ilc_mddu01, ilc_mddu02, ilc_mddu03, ilc_mddu04 and ilc_mddu05)
Figure 5.15 and able 5.7 present inormation on the enorced lack o a range o dierentconsumer durables and the economic strain aced by various groups o society in relation totheir ability to deal with a range o nancial challenges. Tese statistics reect, to some degree,the composition o households – as there are economies o scale linked to sharing a dwelling.
Tis may in part explain why a higher proportion o the people aged 65 or over living alone(rather than with another adult) ace diculties regarding their living standards.
A relatively low proportion o the EU-27’s population living in a household composed o oneadult aged 65 or more aced diculties in purchasing a colour television (1.1 %), telephone(2.1 %) or a washing machine (3.0 %) in 2009. Te level o economic strain was somewhathigher concerning the purchase o a computer (6.8 % could not aord one), rising higher stillor the purchase o a car (8.0 %).
Comparing these rates or persons aged 65 or over living alone with the correspondingpercentages or the population living in a household with two adults (at least one o which
was aged 65 or more), the enorced lack o specied durables was always more signicantamong the ormer group. Te dierences were lowest or so-called ‘big ticket’ items such asthe purchase o a car or a computer, whereas a much higher proportion o persons living in ahousehold composed o one adult aged 65 or more aced the enorced lack o a telephone orcolour television.
Single adult households composed o a person aged 65 and above also aced greater diculty (compared with the population living in a household with two adults – one o which wasat least 65) in keeping their home warm, or being able to aord to pay or a holiday, a mealrich in protein, or unexpected nancial expenses. Tis was particularly true with respect to
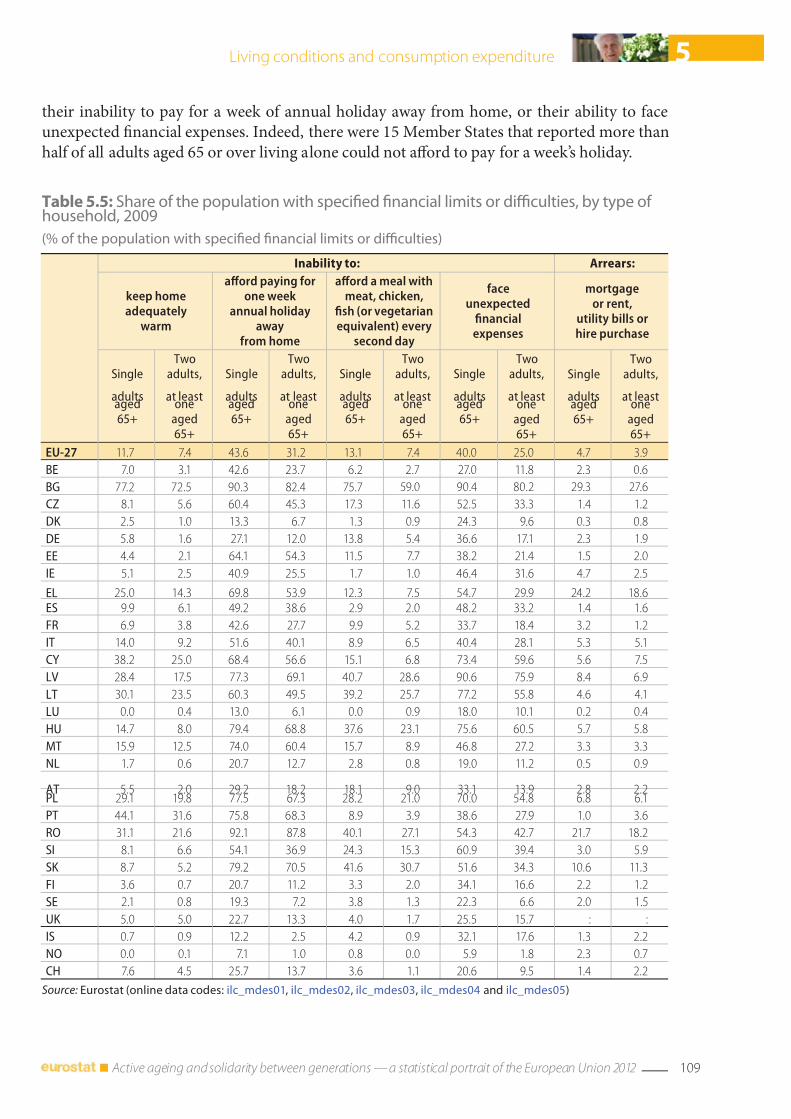
7/31/2019 Active ageing and solidarity between generations 2012 edition A statistical portrait of the European Union 2012
http://slidepdf.com/reader/full/active-ageing-and-solidarity-between-generations-2012-edition-a-statistical 111/147
109 Active ageing and solidarity between generations — a statistical portrait of the European Union 2012
5Living conditions and consumption expenditure
Table 5.5: Share o the population with specied nancial limits or difculties, by type o household, 2009
(% o the population with specied nancial limits or difculties)
Inability to: Arrears:
keep homeadequately
warm
aord paying orone week
annual holidayaway
rom home
aord a meal withmeat, chicken,
sh (or vegetarianequivalent) every
second day
aceunexpected
nancialexpenses
mortgageor rent,
utility bills orhire purchase
Single
adultsaged65+
Twoadults,
at leastone
aged65+
Single
adultsaged65+
Twoadults,
at leastone
aged65+
Single
adultsaged65+
Twoadults,
at leastone
aged65+
Single
adultsaged65+
Twoadults,
at leastone
aged65+
Single
adultsaged65+
Twoadults,
at leastone
aged65+
EU-27 11.7 7.4 43.6 31.2 13.1 7.4 40.0 25.0 4.7 3.9
BE 7.0 3.1 42.6 23.7 6.2 2.7 27.0 11.8 2.3 0.6
BG 77.2 72.5 90.3 82.4 75.7 59.0 90.4 80.2 29.3 27.6
CZ 8.1 5.6 60.4 45.3 17.3 11.6 52.5 33.3 1.4 1.2
DK 2.5 1.0 13.3 6.7 1.3 0.9 24.3 9.6 0.3 0.8
DE 5.8 1.6 27.1 12.0 13.8 5.4 36.6 17.1 2.3 1.9
EE 4.4 2.1 64.1 54.3 11.5 7.7 38.2 21.4 1.5 2.0
IE 5.1 2.5 40.9 25.5 1.7 1.0 46.4 31.6 4.7 2.5
EL 25.0 14.3 69.8 53.9 12.3 7.5 54.7 29.9 24.2 18.6ES 9.9 6.1 49.2 38.6 2.9 2.0 48.2 33.2 1.4 1.6
FR 6.9 3.8 42.6 27.7 9.9 5.2 33.7 18.4 3.2 1.2
IT 14.0 9.2 51.6 40.1 8.9 6.5 40.4 28.1 5.3 5.1
CY 38.2 25.0 68.4 56.6 15.1 6.8 73.4 59.6 5.6 7.5
LV 28.4 17.5 77.3 69.1 40.7 28.6 90.6 75.9 8.4 6.9
LT 30.1 23.5 60.3 49.5 39.2 25.7 77.2 55.8 4.6 4.1
LU 0.0 0.4 13.0 6.1 0.0 0.9 18.0 10.1 0.2 0.4
HU 14.7 8.0 79.4 68.8 37.6 23.1 75.6 60.5 5.7 5.8
MT 15.9 12.5 74.0 60.4 15.7 8.9 46.8 27.2 3.3 3.3
NL 1.7 0.6 20.7 12.7 2.8 0.8 19.0 11.2 0.5 0.9
AT 5.5 2.0 29.2 18.2 18.1 9.0 33.1 13.9 2.8 2.2PL 29.1 19.8 77.5 67.3 28.2 21.0 70.0 54.8 6.8 6.1
PT 44.1 31.6 75.8 68.3 8.9 3.9 38.6 27.9 1.0 3.6
RO 31.1 21.6 92.1 87.8 40.1 27.1 54.3 42.7 21.7 18.2
SI 8.1 6.6 54.1 36.9 24.3 15.3 60.9 39.4 3.0 5.9
SK 8.7 5.2 79.2 70.5 41.6 30.7 51.6 34.3 10.6 11.3
FI 3.6 0.7 20.7 11.2 3.3 2.0 34.1 16.6 2.2 1.2
SE 2.1 0.8 19.3 7.2 3.8 1.3 22.3 6.6 2.0 1.5
UK 5.0 5.0 22.7 13.3 4.0 1.7 25.5 15.7 : :
IS 0.7 0.9 12.2 2.5 4.2 0.9 32.1 17.6 1.3 2.2
NO 0.0 0.1 7.1 1.0 0.8 0.0 5.9 1.8 2.3 0.7
CH 7.6 4.5 25.7 13.7 3.6 1.1 20.6 9.5 1.4 2.2
Source: Eurostat (online data codes: ilc_mdes01, ilc_mdes02, ilc_mdes03, ilc_mdes04 and ilc_mdes05)
their inability to pay or a week o annual holiday away rom home, or their ability to aceunexpected nancial expenses. Indeed, there were 15 Member States that reported more thanhal o all adults aged 65 or over living alone could not aord to pay or a week’s holiday.

7/31/2019 Active ageing and solidarity between generations 2012 edition A statistical portrait of the European Union 2012
http://slidepdf.com/reader/full/active-ageing-and-solidarity-between-generations-2012-edition-a-statistical 112/147
7/31/2019 Active ageing and solidarity between generations 2012 edition A statistical portrait of the European Union 2012
http://slidepdf.com/reader/full/active-ageing-and-solidarity-between-generations-2012-edition-a-statistical 113/147
111 Active ageing and solidarity between generations — a statistical portrait of the European Union 2012
Participation in society
Te number o older persons in the EU is expected to grow considerably over the comingdecades, leading to interest in the current and potential contribution that could be made by older persons to society. From a societal perspective, increased involvement o the elderly could bring additional economic and social value. Active participation o older persons may be promoted through a range o initiatives, such as: encouraging the retired to take on part-time work, engaging older persons in community initiatives and voluntary work, or adaptingscal systems to recognise inormal care that is provided by older persons (or example, child-minding).
A Eurobarometer survey in September and October 2011 ound that 23 % o the EU-27population aged 15 or over were not at all concerned that the number o elderly people aged 65and over would increase, while a urther 32 % were not very concerned.
Social capital is a concept that highlights relationships within society through the promotion o
cooperation; it is ofen seen as a collectively generated public good derived rom the activitieso communities and social networks. Being a member o an organisation, having trust in othersand voting in elections can be regarded as promoting social capital.
Te same Eurobarometer survey ound that 70 % o the EU-27 population aged 15 or overthought that people aged 55 and over played a major role in being active in the local community.Almost the same proportion, some 71 % o the EU-27 population, agreed that people aged 55and over played a major role in politics (participating or voting).
On a more personal level, social contact and relations with other people are thought to have aconsiderable positive inuence on an individual’s well-being and health. Indeed, the continued
participation o older persons in society may maintain their eeling o sel-worth, thereby avoiding risks associated with isolation, a loss o condence or reduced sel-esteem.
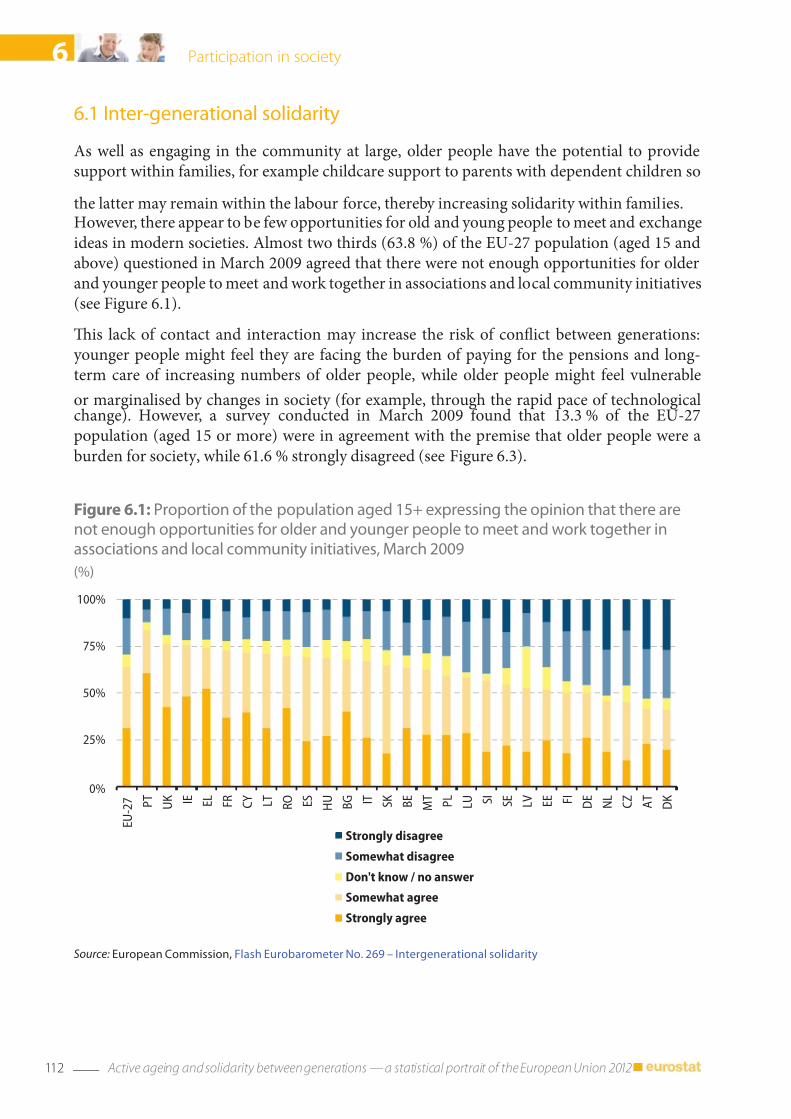
7/31/2019 Active ageing and solidarity between generations 2012 edition A statistical portrait of the European Union 2012
http://slidepdf.com/reader/full/active-ageing-and-solidarity-between-generations-2012-edition-a-statistical 114/147
112 Active ageing and solidarity between generations — a statistical portrait of the European Union 2012
6 Participation in society
6.1 Inter‑generational solidarity
As well as engaging in the community at large, older people have the potential to providesupport within amilies, or example childcare support to parents with dependent children so
the latter may remain within the labour orce, thereby increasing solidarity within amilies.However, there appear to be ew opportunities or old and young people to meet and exchangeideas in modern societies. Almost two thirds (63.8 %) o the EU-27 population (aged 15 andabove) questioned in March 2009 agreed that there were not enough opportunities or olderand younger people to meet and work together in associations and local community initiatives(see Figure 6.1).
Tis lack o contact and interaction may increase the risk o conict between generations:younger people might eel they are acing the burden o paying or the pensions and long-term care o increasing numbers o older people, while older people might eel vulnerable
or marginalised by changes in society (or example, through the rapid pace o technologicalchange). However, a survey conducted in March 2009 ound that 13.3 % o the EU-27population (aged 15 or more) were in agreement with the premise that older people were aburden or society, while 61.6 % strongly disagreed (see Figure 6.3).
Figure 6.1: Proportion o the population aged 15+ expressing the opinion that there arenot enough opportunities or older and younger people to meet and work together inassociations and local community initiatives, March 2009
(%)
0%
25%
50%
75%
100%
E U - 2 7 P
T U K I E E
L F R
C Y
L T
R O E
S H U
B G I T S
K B E
M T
P L
L U S
I S E
L V
E E F
I D E
N L
C Z
A T
D K
Strongly disagree
Somewhat disagree
Don't know / no answer
Somewhat agree
Strongly agree
Source: European Commission, Flash Eurobarometer No. 269 – Intergenerational solidarity
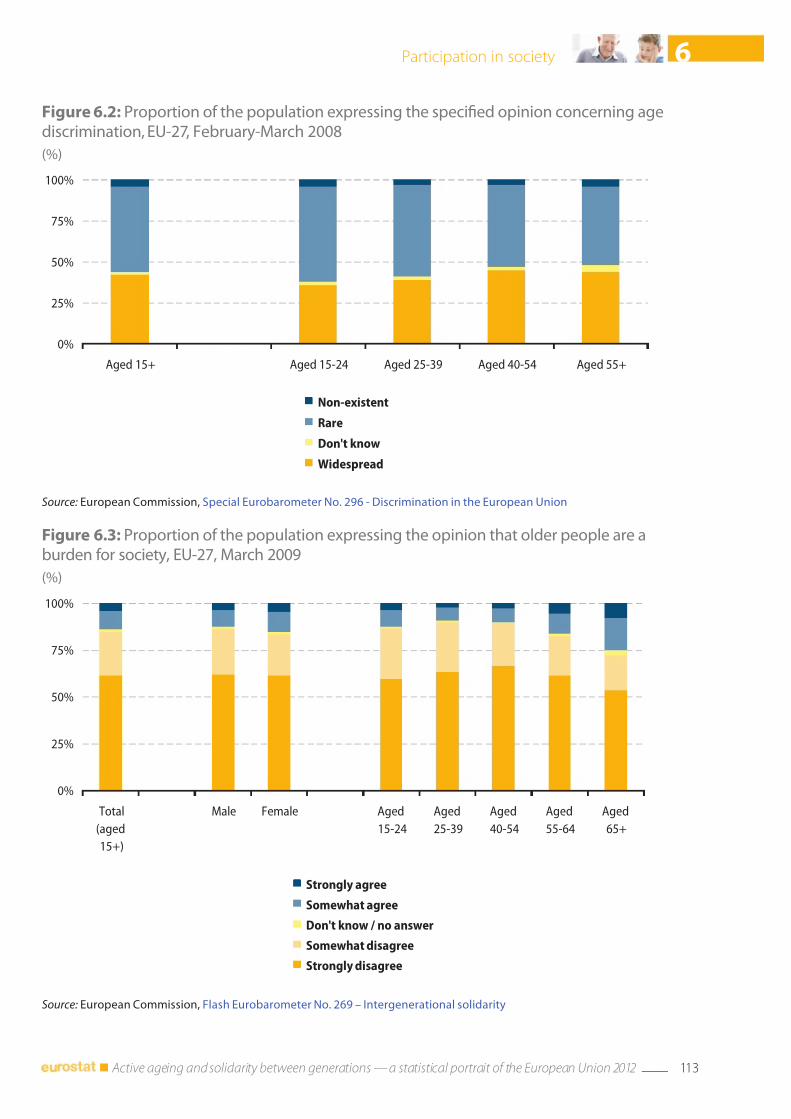
7/31/2019 Active ageing and solidarity between generations 2012 edition A statistical portrait of the European Union 2012
http://slidepdf.com/reader/full/active-ageing-and-solidarity-between-generations-2012-edition-a-statistical 115/147
113 Active ageing and solidarity between generations — a statistical portrait of the European Union 2012
6Participation in society
Figure 6.3: Proportion o the population expressing the opinion that older people are aburden or society, EU‑27, March 2009
(%)
0%
25%
50%
75%
100%
Total
(aged
15+)
Male Female Aged
15-24
Aged
25-39
Aged
40-54
Aged
55-64
Aged
65+
Strongly agree
Somewhat agree
Don't know / no answer
Somewhat disagree
Strongly disagree
Source: European Commission, Flash Eurobarometer No. 269 – Intergenerational solidarity
Figure 6.2: Proportion o the population expressing the specied opinion concerning agediscrimination, EU‑27, February‑March 2008
(%)
0%
25%
50%
75%
100%
Aged 15+ Aged 15-24 Aged 25-39 Aged 40-54 Aged 55+
Non-existent
Rare
Don't know
Widespread
Source: European Commission, Special Eurobarometer No. 296 ‑ Discrimination in the European Union

7/31/2019 Active ageing and solidarity between generations 2012 edition A statistical portrait of the European Union 2012
http://slidepdf.com/reader/full/active-ageing-and-solidarity-between-generations-2012-edition-a-statistical 116/147
114 Active ageing and solidarity between generations — a statistical portrait of the European Union 2012
6 Participation in society
Figure 6.4: Proportion o the population aged 15+ expressing the opinion that localauthorities should support associations and initiatives that oster stronger relationsbetween young people and older people, March 2009
(%)
Source: European Commission, Flash Eurobarometer No. 269 – Intergenerational solidarity
0%
25%
50%
75%
100%
E U - 2 7
P T
R O I E
M T
E S
F R
C Y
U K
D E
E L I T S
I F I
P L
L T
L U
B E
A T
S E
L V
B G
N L
E E
S K
H U
D K
C Z
Strongly disagree
Somewhat disagree
Don't know / no answer
Somewhat agree
Strongly agree
Te reaty o Lisbon (15) made inter-generational solidarity an explicit aim or the unctioningo the EU. Further visibility was given to this goal through the launch, by a group o civil society organisations, o a European day on intergenerational solidarity – this is 29 April each year.Intergenerational solidarity may be promoted through various channels, or example through civil
society, the media and academia. National studies (or example, in Ireland or the Netherlands),show that care and assistance tends to ow upwards rom children to elderly parents and thatnance ows downwards rom the elderly to their children; note, the same results may not holdin all Member States, notably among some that joined the EU in 2004 or 2007.
In March 2009 more than nine out o ten (91.6 %) people aged 15 and above in the EU-27agreed that local authorities should support associations and initiatives that oster strongerrelations between younger people and older people (see Figure 6.4). However, in almost allo the EU Member States – Lithuania and Belgium being the only exceptions – less than hal o the population agreed that the government was doing a good job in promoting a better
understanding between the young and the old (see Figure 6.5).(15) Ar ticle 3.3, available at http://eur-lex.europa.eu/JOHtml.do?uri=OJ:C:2007:306:SOM:en:HTML.
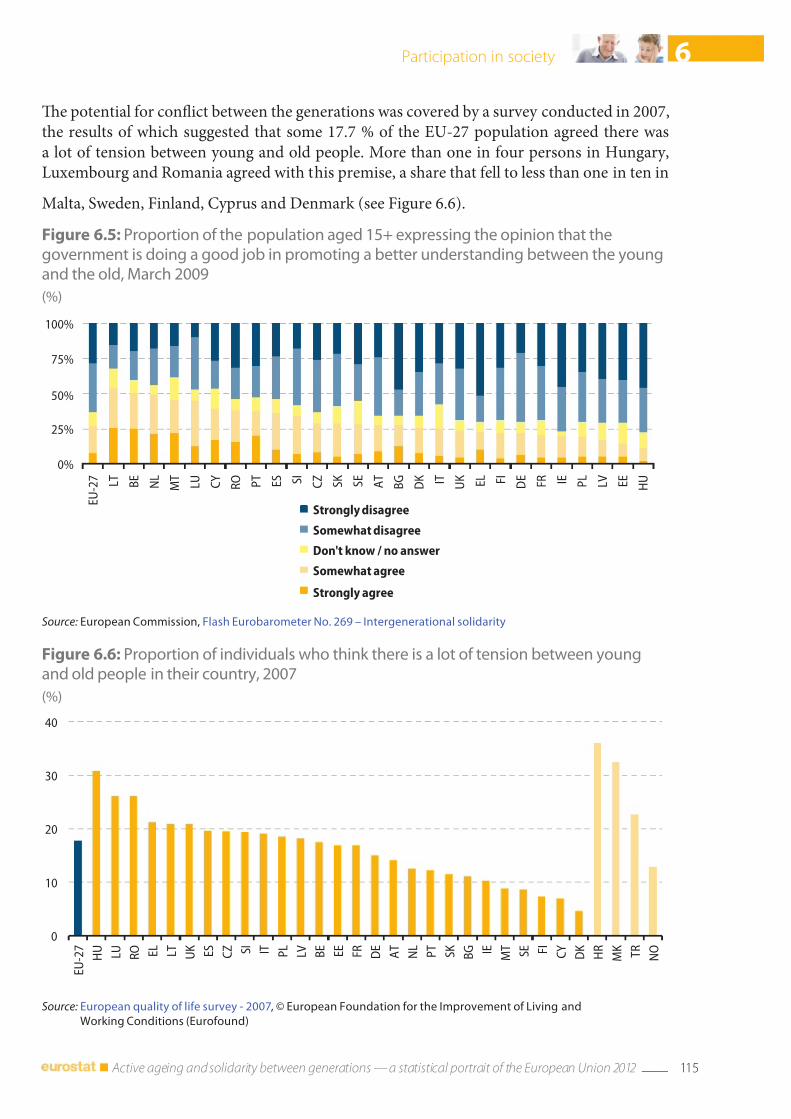
7/31/2019 Active ageing and solidarity between generations 2012 edition A statistical portrait of the European Union 2012
http://slidepdf.com/reader/full/active-ageing-and-solidarity-between-generations-2012-edition-a-statistical 117/147
115 Active ageing and solidarity between generations — a statistical portrait of the European Union 2012
6Participation in society
Figure 6.5: Proportion o the population aged 15+ expressing the opinion that thegovernment is doing a good job in promoting a better understanding between the youngand the old, March 2009
(%)
0%
25%
50%
75%
100%
E U - 2 7
L T
B E
N L
M T
L U
C Y
R O P
T E S S
I C Z
S K
S E
A T
B G
D K I T
U K
E L F
I D E
F R I E P
L L V
E E
H U
Strongly disagree
Somewhat disagree
Don't know / no answer
Somewhat agree
Strongly agree
Source: European Commission, Flash Eurobarometer No. 269 – Intergenerational solidarity
Figure 6.6: Proportion o individuals who think there is a lot o tension between youngand old people in their country, 2007
(%)
0
10
20
30
40
E U - 2 7
H U
L U
R O E
L L T
U K
E S
C Z S
I I T P
L L V
B E
E E
F R
D E
A T
N L
P T
S K
B G I E
M T
S E F
I C Y
D K
H R
M K
T R
N O
Source: European quality o lie survey ‑ 2007, © European Foundation or the Improvement o Living and
Working Conditions (Euroound)
Te potential or conict between the generations was covered by a survey conducted in 2007,the results o which suggested that some 17.7 % o the EU-27 population agreed there wasa lot o tension between young and old people. More than one in our persons in Hungary,Luxembourg and Romania agreed with this premise, a share that ell to less than one in ten in
Malta, Sweden, Finland, Cyprus and Denmark (see Figure 6.6).
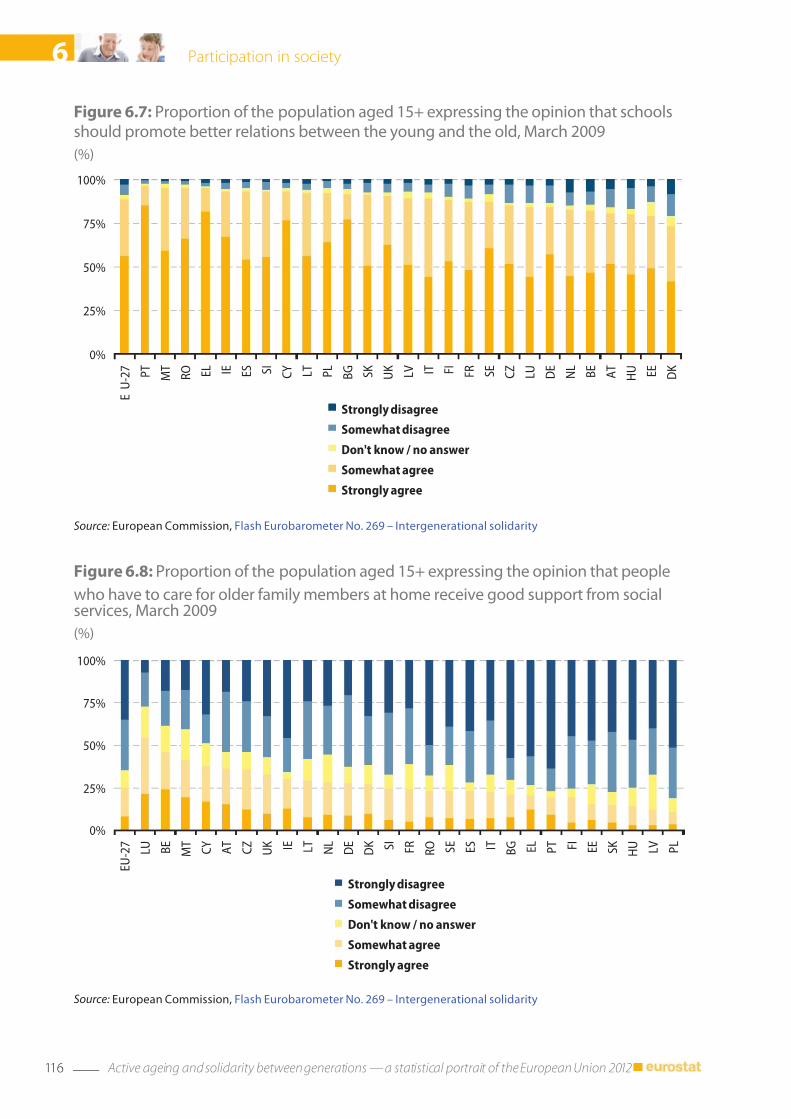
7/31/2019 Active ageing and solidarity between generations 2012 edition A statistical portrait of the European Union 2012
http://slidepdf.com/reader/full/active-ageing-and-solidarity-between-generations-2012-edition-a-statistical 118/147
116 Active ageing and solidarity between generations — a statistical portrait of the European Union 2012
6 Participation in society
Figure 6.8: Proportion o the population aged 15+ expressing the opinion that people
who have to care or older amily members at home receive good support rom socialservices, March 2009
(%)
0%
25%
50%
75%
100%
E U - 2 7
L U
B E
M T
C Y
A T
C Z
U K I E L
T N L
D E
D K S
I F R
R O S
E E S I T
B G E
L P T F
I E E
S K
H U
L V
P L
Strongly disagree
Somewhat disagree
Don't know / no answer
Somewhat agree
Strongly agree
Source: European Commission, Flash Eurobarometer No. 269 – Intergenerational solidarity
Figure 6.7: Proportion o the population aged 15+ expressing the opinion that schoolsshould promote better relations between the young and the old, March 2009
(%)
0%
25%
50%
75%
100%
E U - 2 7
P T
M T
R O E
L I E E S S
I C Y
L T
P L
B G
S K
U K
L V I T F
I F R
S E
C Z
L U
D E
N L
B E
A T
H U E
E D K
Strongly disagree
Somewhat disagree
Don't know / no answer
Somewhat agree
Strongly agree
Source: European Commission, Flash Eurobarometer No. 269 – Intergenerational solidarity
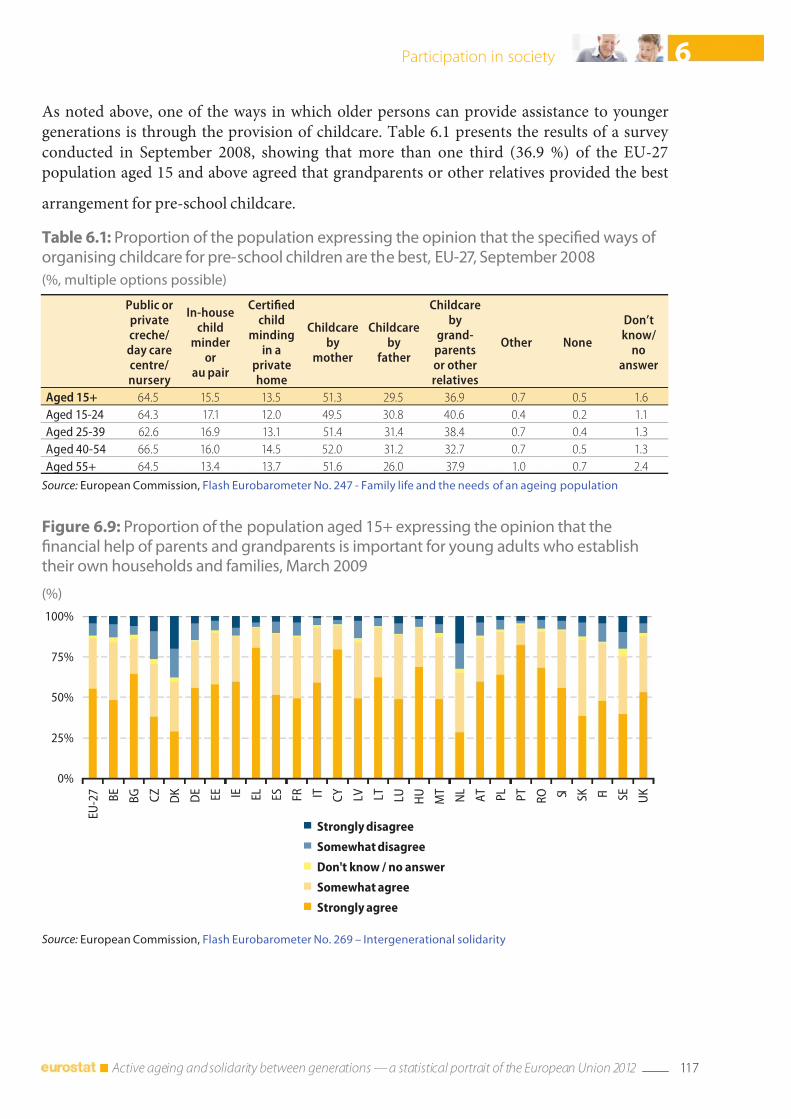
7/31/2019 Active ageing and solidarity between generations 2012 edition A statistical portrait of the European Union 2012
http://slidepdf.com/reader/full/active-ageing-and-solidarity-between-generations-2012-edition-a-statistical 119/147
117 Active ageing and solidarity between generations — a statistical portrait of the European Union 2012
6Participation in society
Figure 6.9: Proportion o the population aged 15+ expressing the opinion that thenancial help o parents and grandparents is important or young adults who establishtheir own households and amilies, March 2009
(%)
0%
25%
50%
75%
100%
E U - 2 7
B E
B G
C Z
D K
D E
E E I E E
L E S
F R I T C
Y L V
L T
L U
H U
M T
N L
A T
P L
P T
R O S I S
K F I S E
U K
Strongly disagree
Somewhat disagree
Don't know / no answer
Somewhat agree
Strongly agree
Source: European Commission, Flash Eurobarometer No. 269 – Intergenerational solidarity
Table 6.1: Proportion o the population expressing the opinion that the specied ways o organising childcare or pre‑school children are the best, EU‑27, September 2008
(%, multiple options possible)
Public orprivatecreche/day carecentre/nursery
In-housechild
minderor
au pair
Certiedchild
mindingin a
privatehome
Childcareby
mother
Childcareby
ather
Childcareby
grand-parentsor otherrelatives
Other None
Don’tknow/
noanswer
Aged 15+ 64.5 15.5 13.5 51.3 29.5 36.9 0.7 0.5 1.6
Aged 15-24 64.3 17.1 12.0 49.5 30.8 40.6 0.4 0.2 1.1
Aged 25-39 62.6 16.9 13.1 51.4 31.4 38.4 0.7 0.4 1.3
Aged 40-54 66.5 16.0 14.5 52.0 31.2 32.7 0.7 0.5 1.3
Aged 55+ 64.5 13.4 13.7 51.6 26.0 37.9 1.0 0.7 2.4
Source: European Commission, Flash Eurobarometer No. 247 ‑ Family lie and the needs o an ageing population
As noted above, one o the ways in which older persons can provide assistance to youngergenerations is through the provision o childcare. able 6.1 presents the results o a survey conducted in September 2008, showing that more than one third (36.9 %) o the EU-27population aged 15 and above agreed that grandparents or other relatives provided the best
arrangement or pre-school childcare.
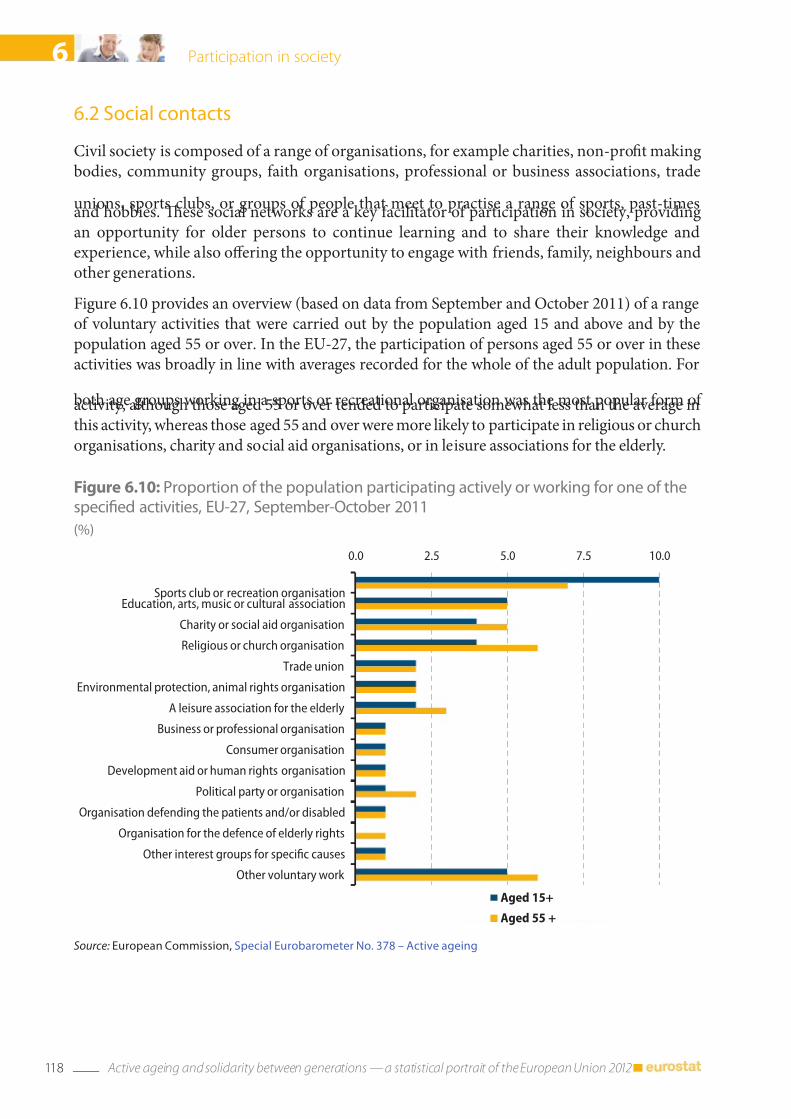
7/31/2019 Active ageing and solidarity between generations 2012 edition A statistical portrait of the European Union 2012
http://slidepdf.com/reader/full/active-ageing-and-solidarity-between-generations-2012-edition-a-statistical 120/147
118 Active ageing and solidarity between generations — a statistical portrait of the European Union 2012
6 Participation in society
6.2 Social contacts
Civil society is composed o a range o organisations, or example charities, non-prot makingbodies, community groups, aith organisations, proessional or business associations, trade
unions, sports clubs, or groups o people that meet to practise a range o sports, past-timesand hobbies. Tese social networks are a key acilitator o participation in society, providingan opportunity or older persons to continue learning and to share their knowledge andexperience, while also oering the opportunity to engage with riends, amily, neighbours andother generations.
Figure 6.10 provides an overview (based on data rom September and October 2011) o a rangeo voluntary activities that were carried out by the population aged 15 and above and by thepopulation aged 55 or over. In the EU-27, the participation o persons aged 55 or over in theseactivities was broadly in line with averages recorded or the whole o the adult population. For
both age groups working in a sports or recreational organisation was the most popular orm o activity, although those aged 55 or over tended to participate somewhat less than the average inthis activity, whereas those aged 55 and over were more likely to participate in religious or churchorganisations, charity and social aid organisations, or in leisure associations or the elderly.
Figure 6.10: Proportion o the population participating actively or working or one o thespecied activities, EU‑27, September‑October 2011
(%)
0.0 2.5 5.0 7.5 10.0
Sports club or recreation organisationEducation, arts, music or cultural association
Charity or social aid organisation
Religious or church organisation
Trade union
Environmental protection, animal rights organisation
A leisure association for the elderly
Business or professional organisation
Consumer organisation
Development aid or human rights organisation
Political party or organisation
Organisation defending the patients and/or disabled
Organisation for the defence of elderly rights
Other interest groups for specic causes
Other voluntary work
Aged 15+
Aged 55 +
Source: European Commission, Special Eurobarometer No. 378 – Active ageing
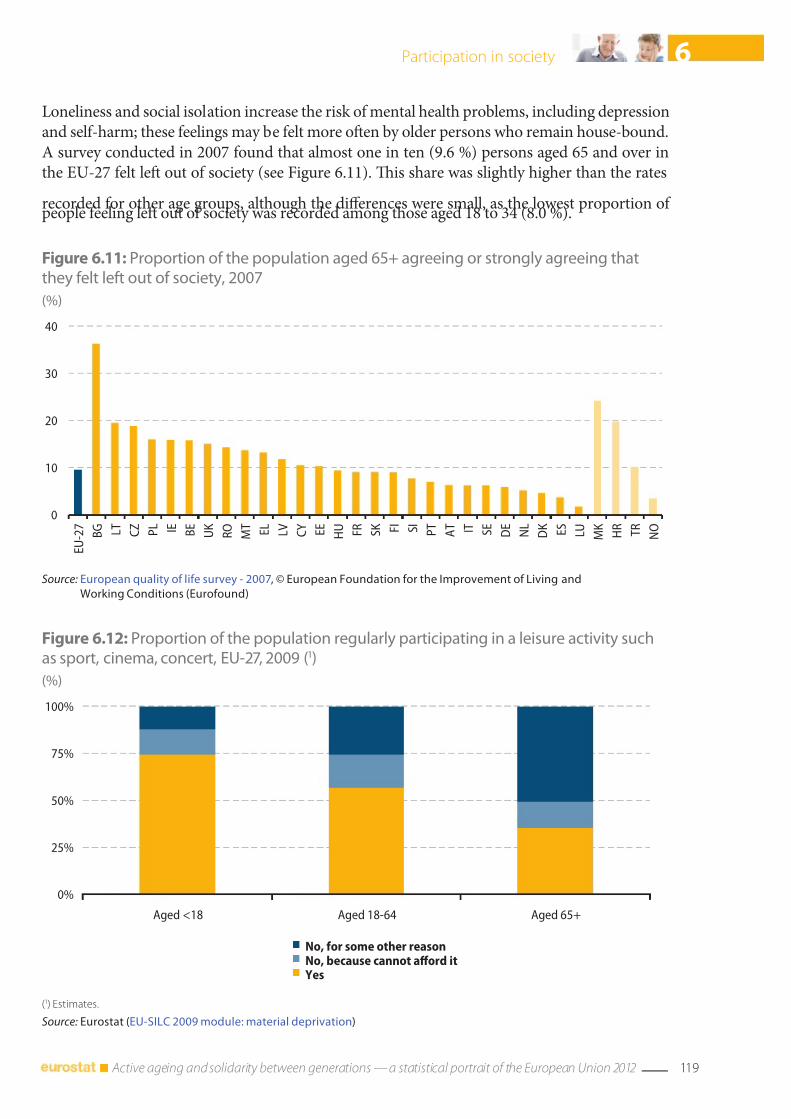
7/31/2019 Active ageing and solidarity between generations 2012 edition A statistical portrait of the European Union 2012
http://slidepdf.com/reader/full/active-ageing-and-solidarity-between-generations-2012-edition-a-statistical 121/147
119 Active ageing and solidarity between generations — a statistical portrait of the European Union 2012
6Participation in society
Figure 6.12: Proportion o the population regularly participating in a leisure activity suchas sport, cinema, concert, EU‑27, 2009 (1)
(%)
0%
25%
50%
75%
100%
Aged <18 Aged 18-64 Aged 65+
No, for some other reason
No, because cannot aord it
Yes
(1) Estimates.
Source: Eurostat (EU‑SILC 2009 module: material deprivation)
Figure 6.11: Proportion o the population aged 65+ agreeing or strongly agreeing thatthey elt let out o society, 2007
(%)
0
10
20
30
40
E U - 2 7
B G L
T C Z
P L I E B
E U K
R O
M T
E L
L V
C Y
E E
H U
F R
S K F
I S I
P T
A T I T S
E D E
N L
D K
E S
L U
M K
H R
T R
N O
Source: European quality o lie survey ‑ 2007, © European Foundation or the Improvement o Living and
Working Conditions (Euroound)
Loneliness and social isolation increase the risk o mental health problems, including depressionand sel-harm; these eelings may be elt more ofen by older persons who remain house-bound.A survey conducted in 2007 ound that almost one in ten (9.6 %) persons aged 65 and over inthe EU-27 elt lef out o society (see Figure 6.11). Tis share was slightly higher than the rates
recorded or other age groups, although the dierences were small, as the lowest proportion o people eeling lef out o society was recorded among those aged 18 to 34 (8.0 %).

7/31/2019 Active ageing and solidarity between generations 2012 edition A statistical portrait of the European Union 2012
http://slidepdf.com/reader/full/active-ageing-and-solidarity-between-generations-2012-edition-a-statistical 122/147
120 Active ageing and solidarity between generations — a statistical portrait of the European Union 2012
6 Participation in society
Figure 6.13: Proportion o the population stating that they exercise or play sport with thespecied requency, EU‑27, October 2009
(%)
0%
25%
50%
75%
100%
A g e d
1 5 +
A g e d
1 5 - 2 4
A g e d
2 5 - 3 9
A g e d
4 0 - 5 4
A g e d
5 5 - 6 9
A g e d
7 0 +
A g e d
1 5 - 2 4
A g e d
2 5 - 3 9
A g e d
4 0 - 5 4
A g e d
5 5 - 6 9
A g e d
7 0 +
Total Men Women
Never
Seldom
With some regularity
Regularly
Source: European Commission, Special Eurobarometer No. 334 ‑ Sport and physical activit y
While there have been EU-wide campaigns aimed at increasing participation rates in relationto sports and exercise, ew initiatives have been targeted specically at the older generations.Nevertheless, it would appear that physical activity can play an important role in improvingthe quality o lie among older persons, as regular physical activity has the potential to improve
physiological and psychological conditions.Figure 6.12 shows that age was a major actor in determining the proportion o the populationwho regularly participated in a sports or leisure activity. More than a hal (56.8 %) o thosesurveyed in the EU-27 that were aged 18 to 64 reported regularly carrying out a sport, or
visiting a cinema or concert in 2009; this share was much lower or persons aged 65 and over(35.3 %).
According to a Eurobarometer survey conducted in October 2009, some 40 % o the EU-27population aged 15 and above exercised or played sport with at least some regularity. Figure6.13 shows that this share was lower among persons aged 70 and above (21 % or women and
23 % or men). A similar question rom the same survey concentrated upon physical activitiesother than sport. Almost two thirds (65 %) o the EU-27 population aged 15 and above statedthat they engaged in physical exercise (outside o playing sport). Te proportion o personsaged 70 and above engaged in non-sporting physical exercise with at least some regularity wasagain lower than average (54 % or women and 63 % or men).
A survey conducted in October 2009 provides inormation on the share o the populationwho were members o a sports or health and tness club (see Figure 6.14). Te general patternacross the EU-27 was or membership levels to all as a unction o age, while men were morelikely than women to be a member o a sports club.
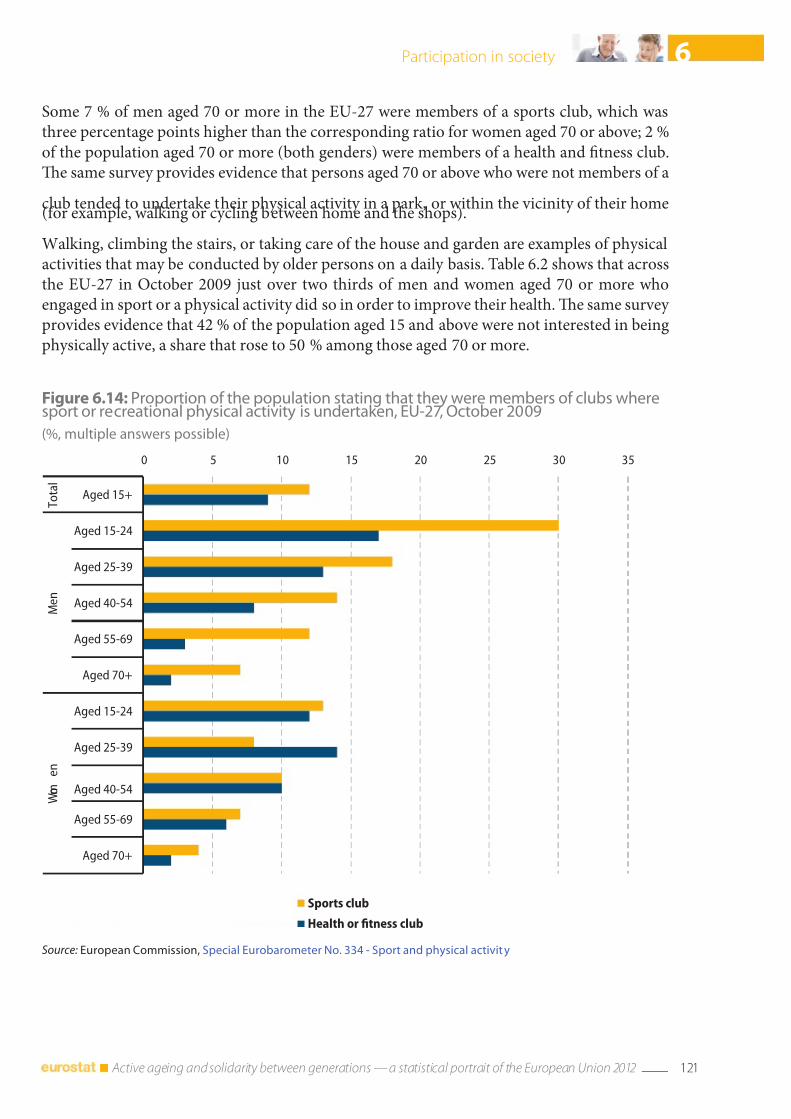
7/31/2019 Active ageing and solidarity between generations 2012 edition A statistical portrait of the European Union 2012
http://slidepdf.com/reader/full/active-ageing-and-solidarity-between-generations-2012-edition-a-statistical 123/147
121 Active ageing and solidarity between generations — a statistical portrait of the European Union 2012
6Participation in society
Figure 6.14: Proportion o the population stating that they were members o clubs wheresport or recreational physical activity is undertaken, EU‑27, October 2009
(%, multiple answers possible)
0 5 10 15 20 25 30 35
Aged 15+
Aged 15-24
Aged 25-39
Aged 40-54
Aged 55-69
Aged 70+
Aged 15-24
Aged 25-39
Aged 40-54
Aged 55-69
Aged 70+
T o t a l
M e n
W o m
e n
Sports club
Health or tness club
Source: European Commission, Special Eurobarometer No. 334 ‑ Sport and physical activit y
Some 7 % o men aged 70 or more in the EU-27 were members o a sports club, which wasthree percentage points higher than the corresponding ratio or women aged 70 or above; 2 %o the population aged 70 or more (both genders) were members o a health and tness club.Te same survey provides evidence that persons aged 70 or above who were not members o a
club tended to undertake their physical activity in a park, or within the vicinity o their home(or example, walking or cycling between home and the shops).
Walking, climbing the stairs, or taking care o the house and garden are examples o physicalactivities that may be conducted by older persons on a daily basis. able 6.2 shows that acrossthe EU-27 in October 2009 just over two thirds o men and women aged 70 or more whoengaged in sport or a physical activity did so in order to improve their health. Te same survey provides evidence that 42 % o the population aged 15 and above were not interested in beingphysically active, a share that rose to 50 % among those aged 70 or more.
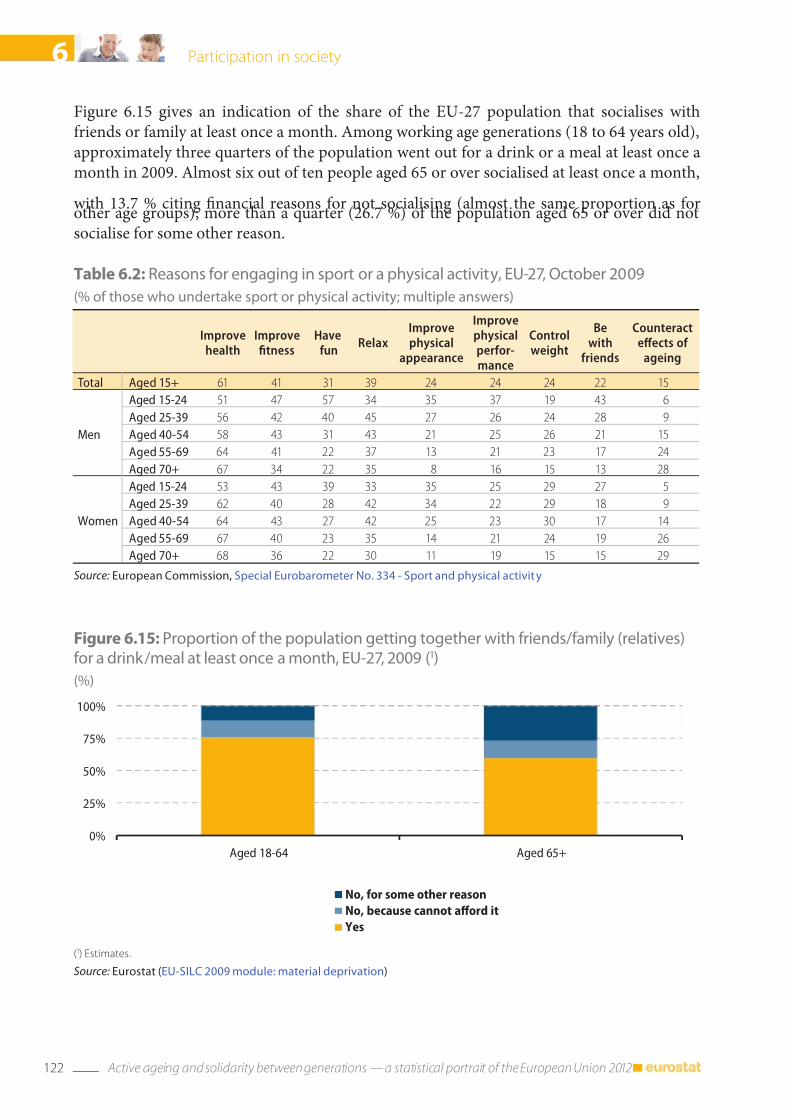
7/31/2019 Active ageing and solidarity between generations 2012 edition A statistical portrait of the European Union 2012
http://slidepdf.com/reader/full/active-ageing-and-solidarity-between-generations-2012-edition-a-statistical 124/147
122 Active ageing and solidarity between generations — a statistical portrait of the European Union 2012
6 Participation in society
Table 6.2: Reasons or engaging in sport or a physical activity, EU‑27, October 2009
(% o those who undertake sport or physical activity; multiple answers)
Improvehealth
Improvetness
Haveun
RelaxImprovephysical
appearance
Improvephysicalperor-mance
Controlweight
Bewith
riends
Counteracteects o
ageing
Total Aged 15+ 61 41 31 39 24 24 24 22 15
Men
Aged 15-24 51 47 57 34 35 37 19 43 6
Aged 25-39 56 42 40 45 27 26 24 28 9
Aged 40-54 58 43 31 43 21 25 26 21 15
Aged 55-69 64 41 22 37 13 21 23 17 24
Aged 70+ 67 34 22 35 8 16 15 13 28
Women
Aged 15-24 53 43 39 33 35 25 29 27 5
Aged 25-39 62 40 28 42 34 22 29 18 9
Aged 40-54 64 43 27 42 25 23 30 17 14
Aged 55-69 67 40 23 35 14 21 24 19 26
Aged 70+ 68 36 22 30 11 19 15 15 29
Source: European Commission, Special Eurobarometer No. 334 ‑ Sport and physical activit y
Figure 6.15: Proportion o the population getting together with riends/amily (relatives)or a drink/meal at least once a month, EU‑27, 2009 (1)
(%)
0%
25%
50%
75%
100%
Aged 18-64 Aged 65+
Yes
No, because cannot aord it
No, for some other reason
(1) Estimates.
Source: Eurostat (EU‑SILC 2009 module: material deprivation)
Figure 6.15 gives an indication o the share o the EU-27 population that socialises withriends or amily at least once a month. Among working age generations (18 to 64 years old),approximately three quarters o the population went out or a drink or a meal at least once amonth in 2009. Almost six out o ten people aged 65 or over socialised at least once a month,
with 13.7 % citing nancial reasons or not socialising (almost the same proportion as orother age groups); more than a quarter (26.7 %) o the population aged 65 or over did notsocialise or some other reason.
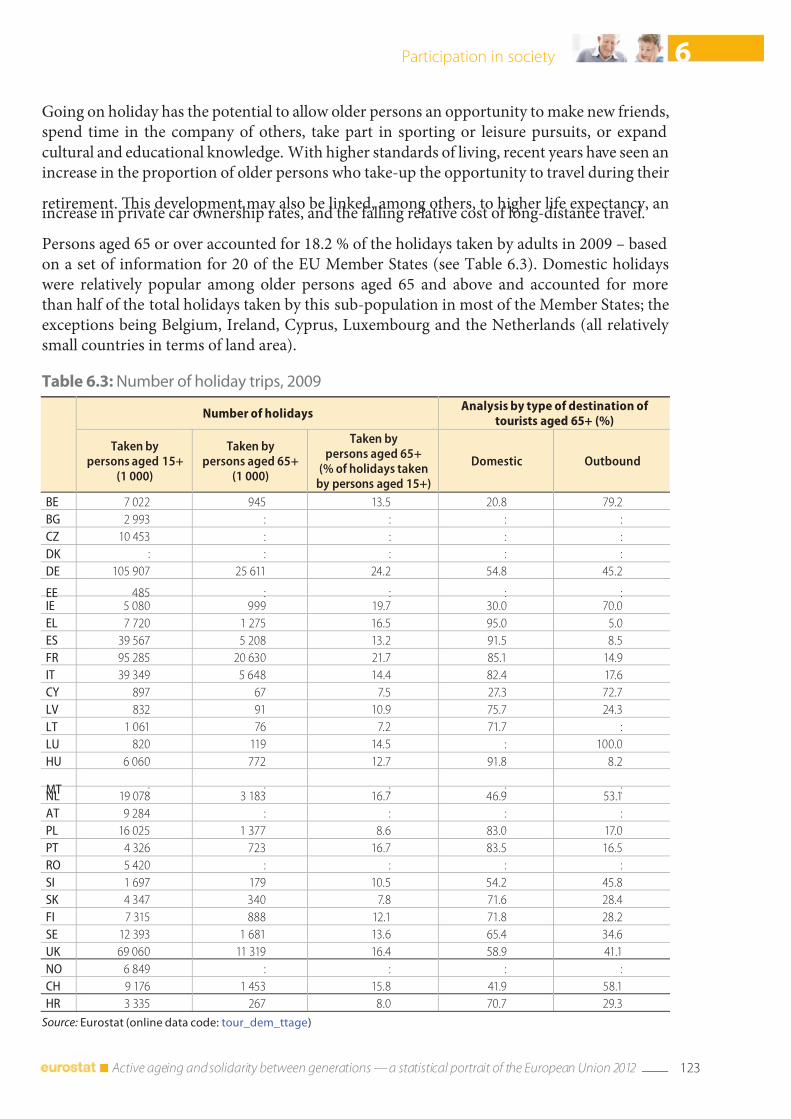
7/31/2019 Active ageing and solidarity between generations 2012 edition A statistical portrait of the European Union 2012
http://slidepdf.com/reader/full/active-ageing-and-solidarity-between-generations-2012-edition-a-statistical 125/147
123 Active ageing and solidarity between generations — a statistical portrait of the European Union 2012
6Participation in society
Table 6.3: Number o holiday trips, 2009
Number o holidaysAnalysis by type o destination o
tourists aged 65+ (%)
Taken bypersons aged 15+
(1 000)
Taken bypersons aged 65+
(1 000)
Taken bypersons aged 65+
(% o holidays takenby persons aged 15+)
Domestic Outbound
BE 7 022 945 13.5 20.8 79.2
BG 2 993 : : : :
CZ 10 453 : : : :
DK : : : : :
DE 105 907 25 611 24.2 54.8 45.2
EE 485 : : : :IE 5 080 999 19.7 30.0 70.0
EL 7 720 1 275 16.5 95.0 5.0
ES 39 567 5 208 13.2 91.5 8.5
FR 95 285 20 630 21.7 85.1 14.9
IT 39 349 5 648 14.4 82.4 17.6
CY 897 67 7.5 27.3 72.7
LV 832 91 10.9 75.7 24.3
LT 1 061 76 7.2 71.7 :
LU 820 119 14.5 : 100.0
HU 6 060 772 12.7 91.8 8.2
MT : : : : :NL 19 078 3 183 16.7 46.9 53.1
AT 9 284 : : : :
PL 16 025 1 377 8.6 83.0 17.0
PT 4 326 723 16.7 83.5 16.5
RO 5 420 : : : :
SI 1 697 179 10.5 54.2 45.8
SK 4 347 340 7.8 71.6 28.4
FI 7 315 888 12.1 71.8 28.2
SE 12 393 1 681 13.6 65.4 34.6
UK 69 060 11 319 16.4 58.9 41.1
NO 6 849 : : : :
CH 9 176 1 453 15.8 41.9 58.1
HR 3 335 267 8.0 70.7 29.3
Source: Eurostat (online data code: tour_dem_ttage)
Going on holiday has the potential to allow older persons an opportunity to make new riends,spend time in the company o others, take part in sporting or leisure pursuits, or expandcultural and educational knowledge. With higher standards o living, recent years have seen anincrease in the proportion o older persons who take-up the opportunity to travel during their
retirement. Tis development may also be linked, among others, to higher lie expectancy, anincrease in private car ownership rates, and the alling relative cost o long-distance travel.
Persons aged 65 or over accounted or 18.2 % o the holidays taken by adults in 2009 – basedon a set o inormation or 20 o the EU Member States (see able 6.3). Domestic holidayswere relatively popular among older persons aged 65 and above and accounted or morethan hal o the total holidays taken by this sub-population in most o the Member States; theexceptions being Belgium, Ireland, Cyprus, Luxembourg and the Netherlands (all relatively small countries in terms o land area).

7/31/2019 Active ageing and solidarity between generations 2012 edition A statistical portrait of the European Union 2012
http://slidepdf.com/reader/full/active-ageing-and-solidarity-between-generations-2012-edition-a-statistical 126/147

7/31/2019 Active ageing and solidarity between generations 2012 edition A statistical portrait of the European Union 2012
http://slidepdf.com/reader/full/active-ageing-and-solidarity-between-generations-2012-edition-a-statistical 127/147
125 Active ageing and solidarity between generations — a statistical portrait of the European Union 2012
6Participation in society
Table 6.5: Major motivation or main holiday trip among those who made at leastone holiday trip, EU‑27, 2009
(%)
Sun/beach
Wellness/health
treatment
Rest/recreation
Citytrips
Sports-related
Nature Culture/religion
Visitingriends/relatives
Don’t
know/no
answer
Aged 15+ 19 3 37 7 4 6 6 17 1
Aged 15-24 24 1 34 7 7 3 4 20 1
Aged 25-39 20 2 42 6 3 4 4 18 1
Aged 40-54 21 3 40 6 4 7 5 14 1
Aged 55+ 13 6 33 9 3 9 9 17 1
Source: European Commission, Flash Eurobarometer No. 291 ‑ Survey on the attitudes o Europeans towards tourism
Table 6.7: Most important consideration when making a decision about travel plans,EU‑27, February 2010
(%)
Aged15+
Aged15-24
Aged25-39
Aged40-54
Aged55+
Personal experience 18.2 15.3 16.3 18.1 20.8
Recommendations o riends and colleagues 29.7 32.2 33.6 29.8 25.9
Guide-books & magazines (commercial) 4.8 3.4 3.7 5.0 6.0
Catalogues, brochures (non-commercial) 5.5 3.0 3.6 4.4 8.7
Internet 24.3 33.3 32.1 27.7 12.8Travel/tourist agencies 11.1 8.2 8.4 10.3 14.7
Media (newspaper, radio, TV ) 3.3 3.7 1.3 2.8 4.7
Don’t know/no answer 3.1 0.8 1.0 1.9 6.3
Source: European Commission, Flash Eurobarometer No. 291 ‑ Survey on the attitudes o Europeans towards tourism
Table 6.6: Means o transport on main holiday trip among those who made at least
one holiday trip, EU‑27, 2009
(%)
Aeroplane Boat Train BusCar/
motorbikeBicycle Other
Aged 15+ 35 2 7 6 48 0 1
Aged 15-24 39 2 9 9 40 1 1
Aged 25-39 36 2 7 3 51 0 1
Aged 40-54 34 2 4 3 55 0 1
Aged 55+ 34 3 8 11 43 0 2
Source: European Commission, Flash Eurobarometer No. 291 ‑ Survey on the attitudes o Europeans towards tourism
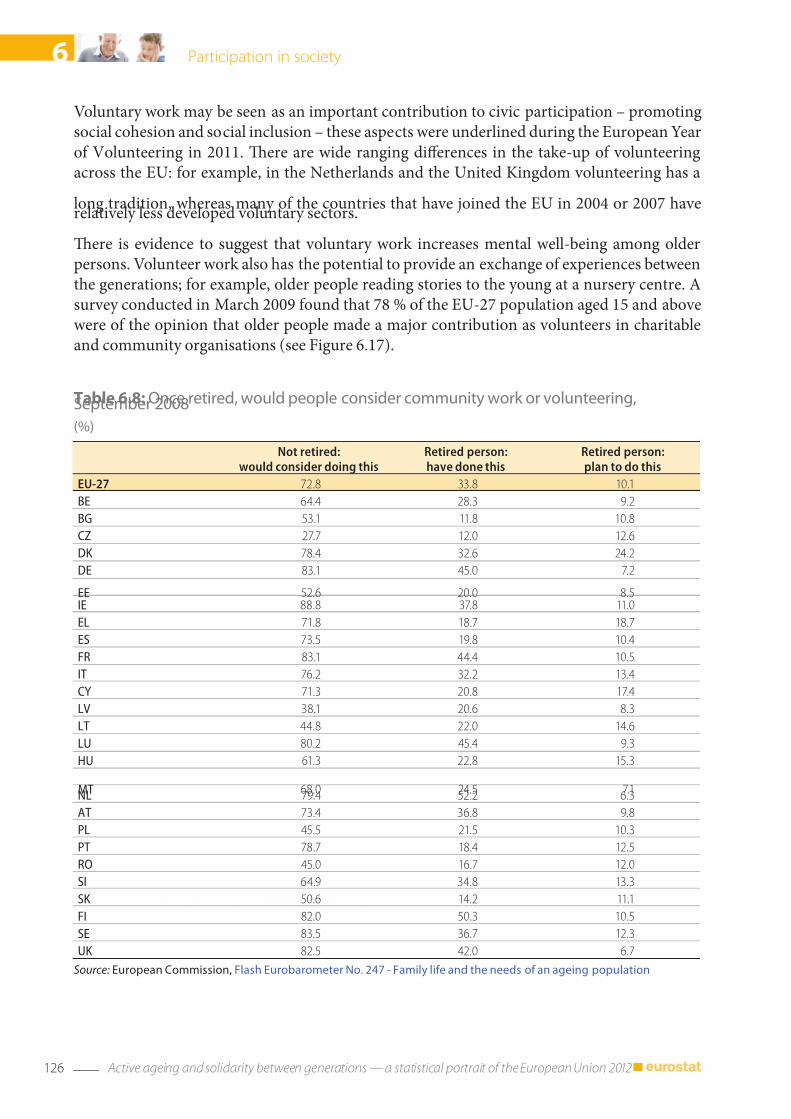
7/31/2019 Active ageing and solidarity between generations 2012 edition A statistical portrait of the European Union 2012
http://slidepdf.com/reader/full/active-ageing-and-solidarity-between-generations-2012-edition-a-statistical 128/147
126 Active ageing and solidarity between generations — a statistical portrait of the European Union 2012
6 Participation in society
Table 6.8: Once retired, would people consider community work or volunteering,September 2008
(%)
Not retired:would consider doing this
Retired person:have done this
Retired person:plan to do this
EU-27 72.8 33.8 10.1
BE 64.4 28.3 9.2
BG 53.1 11.8 10.8
CZ 27.7 12.0 12.6
DK 78.4 32.6 24.2
DE 83.1 45.0 7.2
EE 52.6 20.0 8.5IE 88.8 37.8 11.0
EL 71.8 18.7 18.7
ES 73.5 19.8 10.4
FR 83.1 44.4 10.5
IT 76.2 32.2 13.4
CY 71.3 20.8 17.4
LV 38.1 20.6 8.3
LT 44.8 22.0 14.6
LU 80.2 45.4 9.3
HU 61.3 22.8 15.3
MT 68.0 24.5 7.1NL 79.4 52.2 6.3
AT 73.4 36.8 9.8
PL 45.5 21.5 10.3
PT 78.7 18.4 12.5
RO 45.0 16.7 12.0
SI 64.9 34.8 13.3
SK 50.6 14.2 11.1
FI 82.0 50.3 10.5
SE 83.5 36.7 12.3
UK 82.5 42.0 6.7
Source: European Commission, Flash Eurobarometer No. 247 ‑ Family lie and the needs o an ageing population
Voluntary work may be seen as an important contribution to civic participation – promotingsocial cohesion and social inclusion – these aspects were underlined during the European Yearo Volunteering in 2011. Tere are wide ranging dierences in the take-up o volunteeringacross the EU: or example, in the Netherlands and the United Kingdom volunteering has a
long tradition, whereas many o the countries that have joined the EU in 2004 or 2007 haverelatively less developed voluntary sectors.
Tere is evidence to suggest that voluntary work increases mental well-being among olderpersons. Volunteer work also has the potential to provide an exchange o experiences betweenthe generations; or example, older people reading stories to the young at a nursery centre. Asurvey conducted in March 2009 ound that 78 % o the EU-27 population aged 15 and abovewere o the opinion that older people made a major contribution as volunteers in charitableand community organisations (see Figure 6.17).

7/31/2019 Active ageing and solidarity between generations 2012 edition A statistical portrait of the European Union 2012
http://slidepdf.com/reader/full/active-ageing-and-solidarity-between-generations-2012-edition-a-statistical 129/147
127 Active ageing and solidarity between generations — a statistical portrait of the European Union 2012
6Participation in society
Figure 6.16: Active participation (or voluntary work) in at least one organisation, EU‑27,May 2010
(%)
0%
25%
50%
75%
100%
Aged 15+ Aged 15-24 Aged 25-39 Aged 40-54 Aged 55+
None
Don't know
Yes
(1) A list o 15 types o organisations was suggested, including those concerned with: solidarity and humanitarian aid, health care,environment, sport, protection o human rights, social inclusion, education and training.
Source: European Commission, Standard Eurobarometer No. 73
Figure 6.17: Proportion o the population expressing the opinion that older peoplemake a major contribution as volunteers in charitable and community organisations, EU‑27,March 2009
(%)
0%
25%
50%
75%
100%
Aged 15+ Aged 15-24 Aged 25-39 Aged 40-54 Aged 55-64 Aged 65+
Strongly disagree
Somewhat disagree
Don't know / no answer
Somewhat agreeStrongly agree
Source: European Commission, Flash Eurobarometer No. 269 ‑ Intergenerational solidarity

7/31/2019 Active ageing and solidarity between generations 2012 edition A statistical portrait of the European Union 2012
http://slidepdf.com/reader/full/active-ageing-and-solidarity-between-generations-2012-edition-a-statistical 130/147
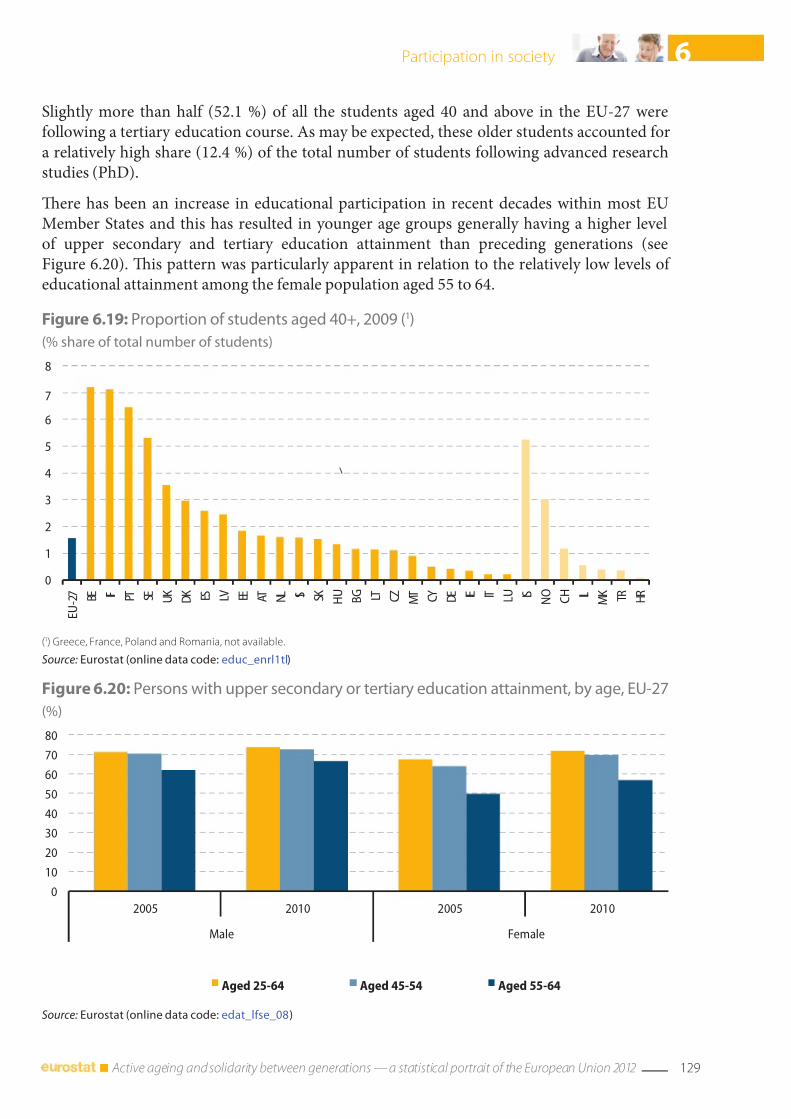
7/31/2019 Active ageing and solidarity between generations 2012 edition A statistical portrait of the European Union 2012
http://slidepdf.com/reader/full/active-ageing-and-solidarity-between-generations-2012-edition-a-statistical 131/147
129 Active ageing and solidarity between generations — a statistical portrait of the European Union 2012
6Participation in society
Figure 6.19: Proportion o students aged 40+, 2009 (1)
(% share o total number o students)
0
1
2
3
4
5
6
7
8
E U - 2 7
B E F I P T S E U
K D K E S L V E E A
T N L S I S K H
U B G L T C
Z M T
C Y
D E I E I T L
U I S N O
C H L I
M K
T R
H R
(1) Greece, France, Poland and Romania, not available.
Source: Eurostat (online data code: educ_enrl1tl)
Figure 6.20: Persons with upper secondary or tertiary education attainment, by age, EU‑27
(%)
0
10
20
30
40
50
60
70
80
2005 2010 2005 2010
Male Female
Aged 25-64 Aged 45-54 Aged 55-64
Source: Eurostat (online data code: edat_lse_08)
Slightly more than hal (52.1 %) o all the students aged 40 and above in the EU-27 wereollowing a tertiary education course. As may be expected, these older students accounted ora relatively high share (12.4 %) o the total number o students ollowing advanced researchstudies (PhD).
Tere has been an increase in educational participation in recent decades within most EUMember States and this has resulted in younger age groups generally having a higher levelo upper secondary and tertiary education attainment than preceding generations (seeFigure 6.20). Tis pattern was particularly apparent in relation to the relatively low levels o educational attainment among the emale population aged 55 to 64.
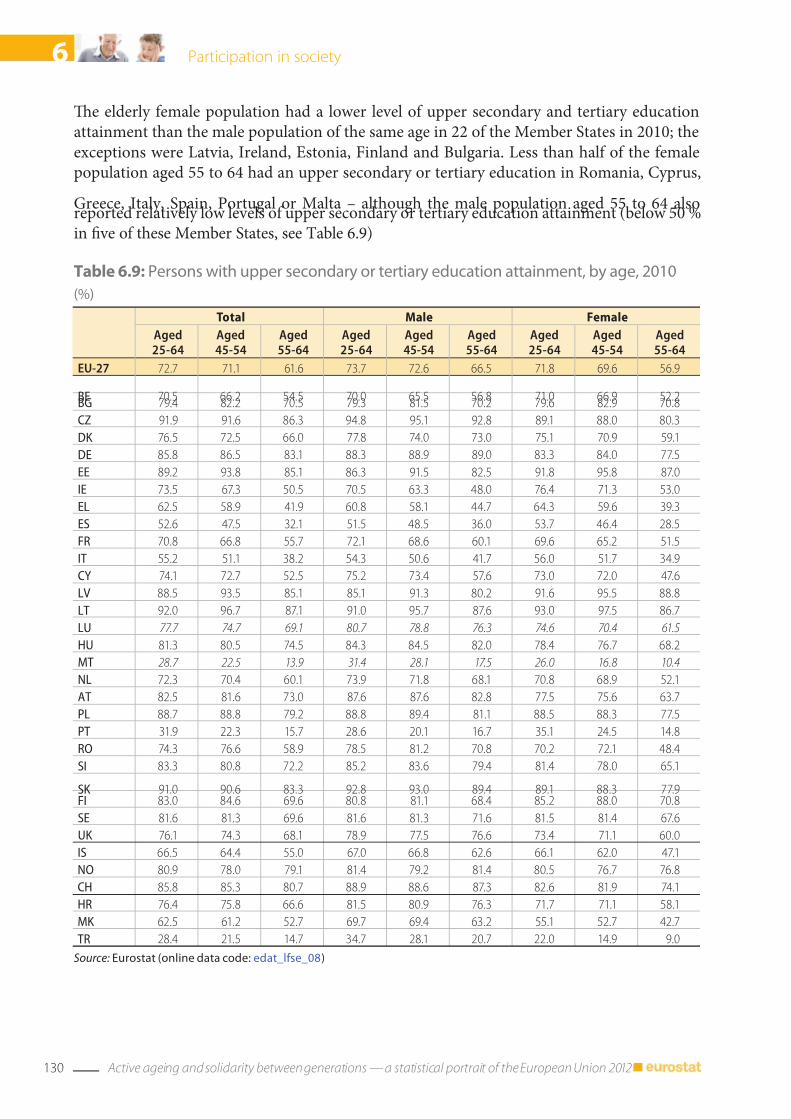
7/31/2019 Active ageing and solidarity between generations 2012 edition A statistical portrait of the European Union 2012
http://slidepdf.com/reader/full/active-ageing-and-solidarity-between-generations-2012-edition-a-statistical 132/147
130 Active ageing and solidarity between generations — a statistical portrait of the European Union 2012
6 Participation in society
Table 6.9: Persons with upper secondary or tertiary education attainment, by age, 2010
(%)
Total Male Female
Aged25-64
Aged45-54
Aged55-64
Aged25-64
Aged45-54
Aged55-64
Aged25-64
Aged45-54
Aged55-64
EU-27 72.7 71.1 61.6 73.7 72.6 66.5 71.8 69.6 56.9
BE 70.5 66.2 54.5 70.0 65.5 56.8 71.0 66.9 52.2BG 79.4 82.2 70.5 79.3 81.5 70.2 79.6 82.9 70.8
CZ 91.9 91.6 86.3 94.8 95.1 92.8 89.1 88.0 80.3
DK 76.5 72.5 66.0 77.8 74.0 73.0 75.1 70.9 59.1
DE 85.8 86.5 83.1 88.3 88.9 89.0 83.3 84.0 77.5
EE 89.2 93.8 85.1 86.3 91.5 82.5 91.8 95.8 87.0
IE 73.5 67.3 50.5 70.5 63.3 48.0 76.4 71.3 53.0
EL 62.5 58.9 41.9 60.8 58.1 44.7 64.3 59.6 39.3
ES 52.6 47.5 32.1 51.5 48.5 36.0 53.7 46.4 28.5
FR 70.8 66.8 55.7 72.1 68.6 60.1 69.6 65.2 51.5
IT 55.2 51.1 38.2 54.3 50.6 41.7 56.0 51.7 34.9
CY 74.1 72.7 52.5 75.2 73.4 57.6 73.0 72.0 47.6
LV 88.5 93.5 85.1 85.1 91.3 80.2 91.6 95.5 88.8
LT 92.0 96.7 87.1 91.0 95.7 87.6 93.0 97.5 86.7
LU 77.7 74.7 69.1 80.7 78.8 76.3 74.6 70.4 61.5
HU 81.3 80.5 74.5 84.3 84.5 82.0 78.4 76.7 68.2
MT 28.7 22.5 13.9 31.4 28.1 17.5 26.0 16.8 10.4
NL 72.3 70.4 60.1 73.9 71.8 68.1 70.8 68.9 52.1
AT 82.5 81.6 73.0 87.6 87.6 82.8 77.5 75.6 63.7
PL 88.7 88.8 79.2 88.8 89.4 81.1 88.5 88.3 77.5
PT 31.9 22.3 15.7 28.6 20.1 16.7 35.1 24.5 14.8
RO 74.3 76.6 58.9 78.5 81.2 70.8 70.2 72.1 48.4
SI 83.3 80.8 72.2 85.2 83.6 79.4 81.4 78.0 65.1
SK 91.0 90.6 83.3 92.8 93.0 89.4 89.1 88.3 77.9FI 83.0 84.6 69.6 80.8 81.1 68.4 85.2 88.0 70.8
SE 81.6 81.3 69.6 81.6 81.3 71.6 81.5 81.4 67.6
UK 76.1 74.3 68.1 78.9 77.5 76.6 73.4 71.1 60.0
IS 66.5 64.4 55.0 67.0 66.8 62.6 66.1 62.0 47.1
NO 80.9 78.0 79.1 81.4 79.2 81.4 80.5 76.7 76.8
CH 85.8 85.3 80.7 88.9 88.6 87.3 82.6 81.9 74.1
HR 76.4 75.8 66.6 81.5 80.9 76.3 71.7 71.1 58.1
MK 62.5 61.2 52.7 69.7 69.4 63.2 55.1 52.7 42.7
TR 28.4 21.5 14.7 34.7 28.1 20.7 22.0 14.9 9.0
Source: Eurostat (online data code: edat_lse_08)
Te elderly emale population had a lower level o upper secondary and tertiary educationattainment than the male population o the same age in 22 o the Member States in 2010; theexceptions were Latvia, Ireland, Estonia, Finland and Bulgaria. Less than hal o the emalepopulation aged 55 to 64 had an upper secondary or tertiary education in Romania, Cyprus,
Greece, Italy, Spain, Portugal or Malta – although the male population aged 55 to 64 alsoreported relatively low levels o upper secondary or tertiary education attainment (below 50 %in ve o these Member States, see able 6.9)
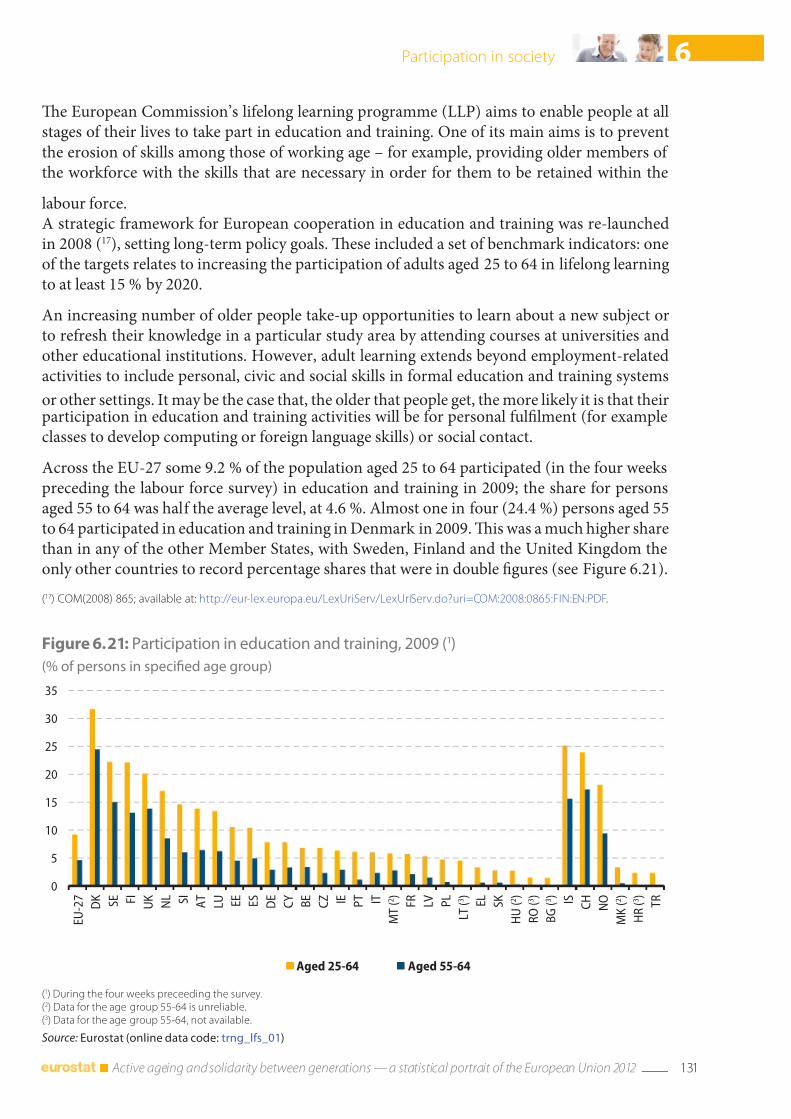
7/31/2019 Active ageing and solidarity between generations 2012 edition A statistical portrait of the European Union 2012
http://slidepdf.com/reader/full/active-ageing-and-solidarity-between-generations-2012-edition-a-statistical 133/147
131 Active ageing and solidarity between generations — a statistical portrait of the European Union 2012
6Participation in society
Figure 6.21: Participation in education and training, 2009 (1)
(% o persons in specied age group)
0
5
10
15
20
25
30
35
E U - 2 7
D K
S E F
I U K
N L S
I A T
L U E
E E S
D E
C Y
B E
C Z I E
P T I T
M T ( 2 )
F R
L V
P L
L T ( 3 )
E L
S K
H U ( 2 )
R O ( 3 )
B G ( 3 )
I S C H
N O
M K ( 2 )
H R ( 3 )
T R
Aged 25-64 Aged 55-64
(1) During the our weeks preceeding the survey.(2) Data or the age group 55-64 is unreliable.(3) Data or the age group 55-64, not available.
Source: Eurostat (online data code: trng_ls_01)
Te European Commission’s lielong learning programme (LLP) aims to enable people at allstages o their lives to take part in education and training. One o its main aims is to preventthe erosion o skills among those o working age – or example, providing older members o the workorce with the skills that are necessary in order or them to be retained within the
labour orce.A strategic ramework or European cooperation in education and training was re-launchedin 2008 (17), setting long-term policy goals. Tese included a set o benchmark indicators: oneo the targets relates to increasing the participation o adults aged 25 to 64 in lielong learningto at least 15 % by 2020.
An increasing number o older people take-up opportunities to learn about a new subject orto reresh their knowledge in a particular study area by attending courses at universities andother educational institutions. However, adult learning extends beyond employment-relatedactivities to include personal, civic and social skills in ormal education and training systems
or other settings. It may be the case that, the older that people get, the more likely it is that theirparticipation in education and training activities will be or personal ullment (or exampleclasses to develop computing or oreign language skills) or social contact.
Across the EU-27 some 9.2 % o the population aged 25 to 64 participated (in the our weekspreceding the labour orce survey) in education and training in 2009; the share or personsaged 55 to 64 was hal the average level, at 4.6 %. Almost one in our (24.4 %) persons aged 55to 64 participated in education and training in Denmark in 2009. Tis was a much higher sharethan in any o the other Member States, with Sweden, Finland and the United Kingdom theonly other countries to record percentage shares that were in double gures (see Figure 6.21).
(17) COM(2008) 865; available at: http://eur-lex.europa.eu/LexUriServ/LexUriServ.do?uri=COM:2008:0865:FIN:EN:PDF.
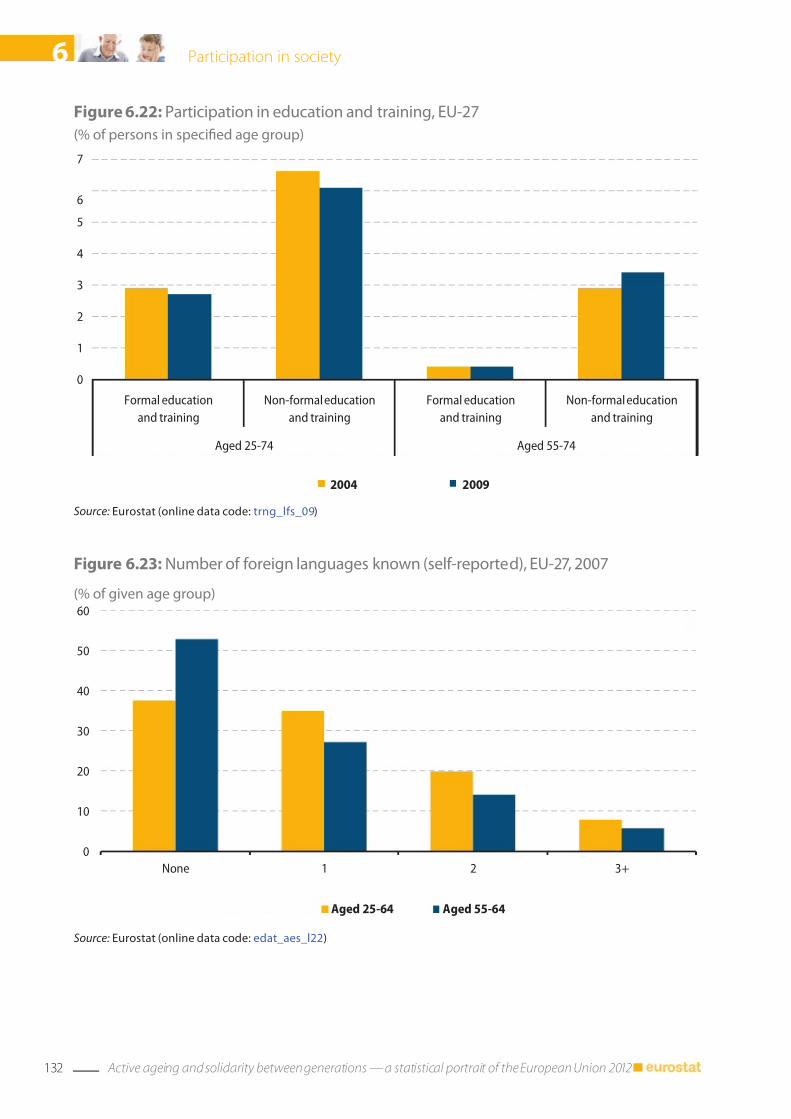
7/31/2019 Active ageing and solidarity between generations 2012 edition A statistical portrait of the European Union 2012
http://slidepdf.com/reader/full/active-ageing-and-solidarity-between-generations-2012-edition-a-statistical 134/147
132 Active ageing and solidarity between generations — a statistical portrait of the European Union 2012
6 Participation in society
Figure 6.23: Number o oreign languages known (sel‑reported), EU‑27, 2007
(% o given age group)
0
10
20
30
40
50
60
None 1 2 3+
Aged 25-64 Aged 55-64
Source: Eurostat (online data code: edat_aes_l22)
Figure 6.22: Participation in education and training, EU‑27
(% o persons in specied age group)
0
1
2
3
4
5
6
7
Formal education
and training
Non-formal education
and training
Formal education
and training
Non-formal education
and training
Aged 25-74 Aged 55-74
2004 2009
Source: Eurostat (online data code: trng_ls_09)

7/31/2019 Active ageing and solidarity between generations 2012 edition A statistical portrait of the European Union 2012
http://slidepdf.com/reader/full/active-ageing-and-solidarity-between-generations-2012-edition-a-statistical 135/147
133 Active ageing and solidarity between generations — a statistical portrait of the European Union 2012
6Participation in society
6.4 Transport
A white paper on moving towards a competitive and resource-ecient transport system wasreleased by the European Commission in 2011 (18). One o its initiatives – under the heading
o service quality and reliability – is to improve the quality o transport and accessibility o inrastructure or older persons and passengers with reduced mobility.
Older people tend to travel less than younger people; this partly relates to them not needingto travel to school or to work on a daily basis. Although they may travel on a less regular basisand or shorter average distances, mobility plays a key role in active ageing – rearming theindependence o older persons. Te older that people become the higher the risk that they willsuer rom health problems that may inhibit their mobility – in more serious cases this may result in them becoming dependent on others.
Te role o the car in providing mobility or older persons is o particular importance in
rural areas, as towns and cities tend to have more developed public transport networks. Teproblems o moving around are compounded or older persons by: concerns over accessibility issues; the comort o transport terminals; a range o saety issues (such as the perceived andactual threat o violence on public transport, poor road illumination, speeding vehicles, orpoorly parked vehicles). Furthermore, when moving around older persons also need to beaware o the possibility that their own sensory skills, reaction times and physical abilities may decline with age.
Figure 6.24: Main mode o transport used or daily activities, EU‑27, October 2010(%)
0%
25%
50%
75%
100%
Aged 15+ Aged 15-24 Aged 25-39 Aged 40-54 Aged 55+
Others / don't know / no answer
No regular mobility
Motorbike
Cycling
Walking
Public transport
Car
Source: European Commission, Flash Eurobarometer No. 312 ‑ Future o transport
(18) COM(2011) 144; available at: http://eur-lex.europa.eu/LexUriServ/LexUriServ.do?uri=COM:2011:0144:FIN:EN:PDF .

7/31/2019 Active ageing and solidarity between generations 2012 edition A statistical portrait of the European Union 2012
http://slidepdf.com/reader/full/active-ageing-and-solidarity-between-generations-2012-edition-a-statistical 136/147
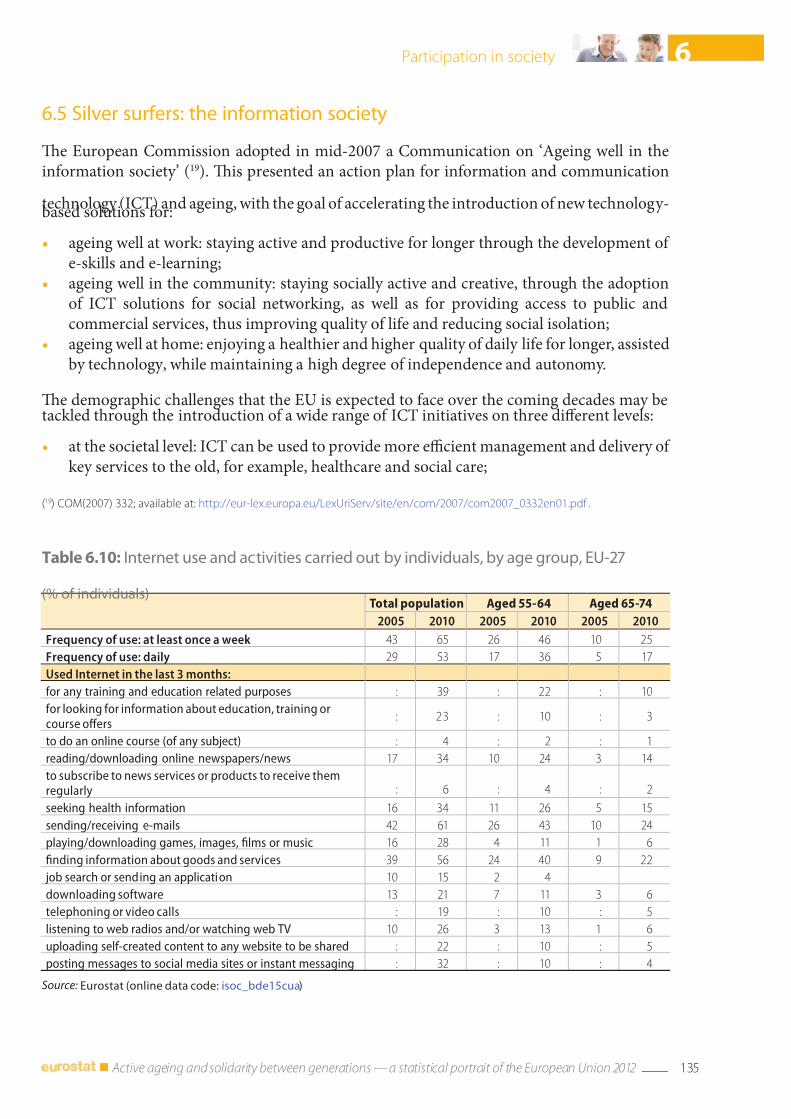
7/31/2019 Active ageing and solidarity between generations 2012 edition A statistical portrait of the European Union 2012
http://slidepdf.com/reader/full/active-ageing-and-solidarity-between-generations-2012-edition-a-statistical 137/147
135 Active ageing and solidarity between generations — a statistical portrait of the European Union 2012
6Participation in society
6.5 Silver surers: the inormation society
Te European Commission adopted in mid-2007 a Communication on ‘Ageing well in theinormation society’ (19). Tis presented an action plan or inormation and communication
technology (IC) and ageing, with the goal o accelerating the introduction o new technology-based solutions or:
• ageing well at work: staying active and productive or longer through the development o e-skills and e-learning;
• ageing well in the community: staying socially active and creative, through the adoptiono IC solutions or social networking, as well as or providing access to public andcommercial services, thus improving quality o lie and reducing social isolation;
• ageing well at home: enjoying a healthier and higher quality o daily lie or longer, assistedby technology, while maintaining a high degree o independence and autonomy.
Te demographic challenges that the EU is expected to ace over the coming decades may betackled through the introduction o a wide range o IC initiatives on three dierent levels:
• at the societal level: IC can be used to provide more ecient management and delivery o key services to the old, or example, healthcare and social care;
Table 6.10: Internet use and activities carried out by individuals, by age group, EU‑27
(% o individuals)Total population Aged 55-64 Aged 65-74
2005 2010 2005 2010 2005 2010
Frequency o use: at least once a week 43 65 26 46 10 25
Frequency o use: daily 29 53 17 36 5 17
Used Internet in the last 3 months:
or any training and education related purposes : 39 : 22 : 10
or looking or inormation about education, training orcourse ofers
: 23 : 10 : 3
to do an online course (o any subject) : 4 : 2 : 1
reading/downloading online newspapers/news 17 34 10 24 3 14
to subscribe to news services or products to receive themregularly : 6 : 4 : 2
seeking health inormation 16 34 11 26 5 15
sending/receiving e-mails 42 61 26 43 10 24
playing/downloading games, images, lms or music 16 28 4 11 1 6
nding inormation about goods and services 39 56 24 40 9 22
job search or sending an application 10 15 2 4
downloading sotware 13 21 7 11 3 6
telephoning or video calls : 19 : 10 : 5
listening to web radios and/or watching web TV 10 26 3 13 1 6
uploading sel-created content to any website to be shared : 22 : 10 : 5
posting messages to social media sites or instant messaging : 32 : 10 : 4
Source: Eurostat (online data code: isoc_bde15cua)
(19) COM(2007) 332; available at: http://eur-lex.europa.eu/LexUriServ/site/en/com/2007/com2007_0332en01.pd .

7/31/2019 Active ageing and solidarity between generations 2012 edition A statistical portrait of the European Union 2012
http://slidepdf.com/reader/full/active-ageing-and-solidarity-between-generations-2012-edition-a-statistical 138/147
136 Active ageing and solidarity between generations — a statistical portrait of the European Union 2012
6 Participation in society
Table 6.11: Internet skills, EU‑27
(% share o given age group)
Individuals with various degrees o Internet skills (1)
Low Medium High
2006 2010 2006 2010 2006 2010
Among all individuals
Total population 30 32 19 30 6 10
Aged 55-64 25 35 8 16 1 2
Aged 65-74 11 22 2 7 : :
Among individuals who have used the Internet
Total population 52 44 33 40 10 13
Aged 55-64 68 63 21 28 3 4
Aged 65-74 68 68 15 23 2 1
(1) Internet skills are part o e-skills and are dened in relation to a set o six activities: using a search engine to nd inormation; sendinge-mails with attached les (documents, pictures, etc.); posting messages to chatrooms, newsgroups or an online discussion orums;using the Internet to make telephone calls; using peer-to-peer le sharing or exchanging movies, music, etc.; creating a web page);low Internet skills are dened as carrying out one or two o these ac tivities; medium Internet skills are dened as carrying out three orour o these activities; high Internet skills are dened as carrying out ve or six o these activities.
Source: Eurostat (online data code: isoc_bde15csk )
• at the level o the enterprise: there may be considerable opportunities or business toinnovate and expand into a range o new IC-based product and service markets thatrespond to the needs o this growing segment o the population;
• at the level o the individual: IC can be used to counter health problems and improve
quality o lie, or example, to aid in counteracting problems relating to memory, vision,hearing or mobility, which become more prevalent with age.
One area where there may be considerable growth is with respect to so-called ‘smart homes’.Tese are dwellings which incorporate a communications network that connects key electricalappliances and services, allowing the homes o older persons to be remotely controlled ormonitored rom aar – thereby providing the security that may be necessary to allow olderpersons to remain at home living in an independent ashion. Generally the use o IC allsas a unction o age, decreasing in each o the EU Member States; this pattern is particularly prevalent among older women, many o whom live alone in single households. Te Digital
Agenda or Europe (20
), one o the agship initiatives under the Europe 2020 strategy, aims topromote independent and sae living or the elderly and to encourage involvement in society.Te Digital Agenda has set a target or having 60 % regular Internet use (at least once perweek) among disadvantaged people by 2015 (the sub-population o socially disadvantagedpeople includes persons aged 55 to 74). able 6.10 shows that in 2010 around 17 % o theEU-27’s population aged 65 to 74 made daily use o the Internet; this share was 36 percentagepoints below the average or all age groups. Te most common activities carried out by persons aged 65 to 74 who had used the Internet (during the three months prior to the survey)included: sending and receiving e-mails; nding out inormation about goods and services;seeking health inormation; and reading online newspapers or news websites. Te majority o
persons aged 55 to 74 who already gained experience using the Internet reported a low levelo Internet skills in 2010 (see able 6.11). Te take-up o mobile devices or Internet accesswas also relatively low among those aged 65 to 74 in the EU-27 (see Figure 6.26). Tis may, at
(20) Available at: http://ec.europa.eu/inormation_society/digital-agenda/index_en.htm.
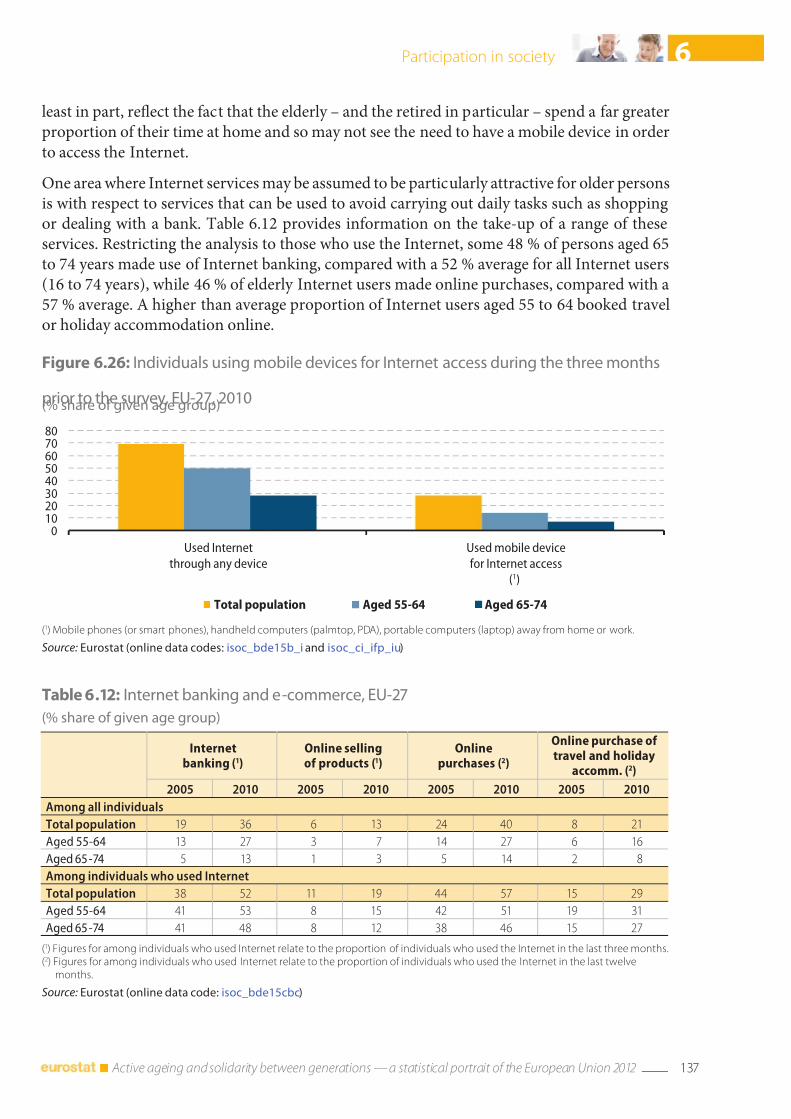
7/31/2019 Active ageing and solidarity between generations 2012 edition A statistical portrait of the European Union 2012
http://slidepdf.com/reader/full/active-ageing-and-solidarity-between-generations-2012-edition-a-statistical 139/147
137 Active ageing and solidarity between generations — a statistical portrait of the European Union 2012
6Participation in society
Table 6.12: Internet banking and e‑commerce, EU‑27
(% share o given age group)
Internetbanking (1)
Online sellingo products (1)
Onlinepurchases (2)
Online purchase o travel and holiday
accomm. (2)
2005 2010 2005 2010 2005 2010 2005 2010
Among all individuals
Total population 19 36 6 13 24 40 8 21
Aged 55-64 13 27 3 7 14 27 6 16
Aged 65-74 5 13 1 3 5 14 2 8
Among individuals who used Internet
Total population 38 52 11 19 44 57 15 29
Aged 55-64 41 53 8 15 42 51 19 31
Aged 65-74 41 48 8 12 38 46 15 27
(1) Figures or among individuals who used Internet relate to the proportion o individuals who used the Internet in the last three months.(2) Figures or among individuals who used Internet relate to the proportion o individuals who used the Internet in the last twelve
months.
Source: Eurostat (online data code: isoc_bde15cbc)
Figure 6.26: Individuals using mobile devices or Internet access during the three months
prior to the survey, EU‑27, 2010(% share o given age group)
01020304050607080
Used Internet
through any device
Used mobile device
for Internet access
(1)
Total population Aged 55-64 Aged 65-74
(1) Mobile phones (or smart phones), handheld computers (palmtop, PDA), portable computers (laptop) away rom home or work.
Source: Eurostat (online data codes: isoc_bde15b_i and isoc_ci_ip_iu)
least in part, reect the act that the elderly – and the retired in particular – spend a ar greaterproportion o their time at home and so may not see the need to have a mobile device in orderto access the Internet.
One area where Internet services may be assumed to be particularly attractive or older personsis with respect to services that can be used to avoid carrying out daily tasks such as shoppingor dealing with a bank. able 6.12 provides inormation on the take-up o a range o theseservices. Restricting the analysis to those who use the Internet, some 48 % o persons aged 65to 74 years made use o Internet banking, compared with a 52 % average or all Internet users(16 to 74 years), while 46 % o elderly Internet users made online purchases, compared with a57 % average. A higher than average proportion o Internet users aged 55 to 64 booked travelor holiday accommodation online.
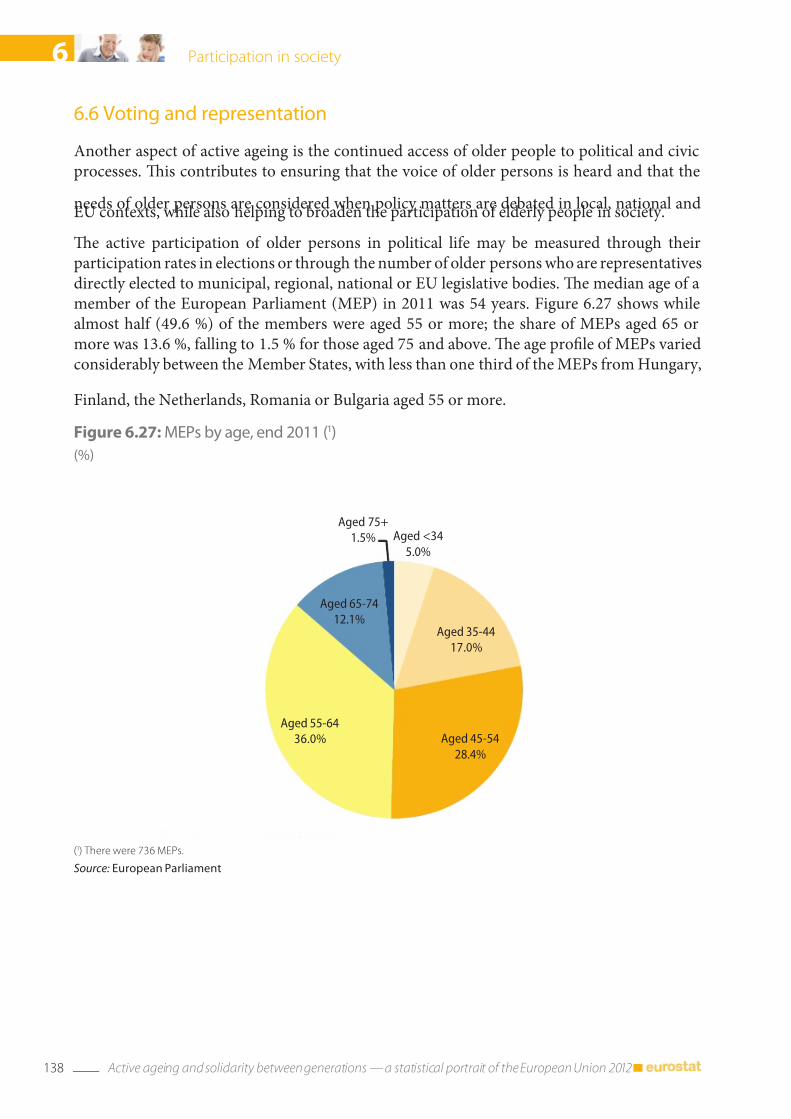
7/31/2019 Active ageing and solidarity between generations 2012 edition A statistical portrait of the European Union 2012
http://slidepdf.com/reader/full/active-ageing-and-solidarity-between-generations-2012-edition-a-statistical 140/147
138 Active ageing and solidarity between generations — a statistical portrait of the European Union 2012
6 Participation in society
6.6 Voting and representation
Another aspect o active ageing is the continued access o older people to political and civicprocesses. Tis contributes to ensuring that the voice o older persons is heard and that the
needs o older persons are considered when policy matters are debated in local, national andEU contexts, while also helping to broaden the participation o elderly people in society.
Te active participation o older persons in political lie may be measured through theirparticipation rates in elections or through the number o older persons who are representativesdirectly elected to municipal, regional, national or EU legislative bodies. Te median age o amember o the European Parliament (MEP) in 2011 was 54 years. Figure 6.27 shows whilealmost hal (49.6 %) o the members were aged 55 or more; the share o MEPs aged 65 ormore was 13.6 %, alling to 1.5 % or those aged 75 and above. Te age prole o MEPs variedconsiderably between the Member States, with less than one third o the MEPs rom Hungary,
Finland, the Netherlands, Romania or Bulgaria aged 55 or more.
Figure 6.27: MEPs by age, end 2011 (1)
(%)
Aged <34
5.0%
Aged 35-44
17.0%
Aged 45-54
28.4%
Aged 55-64
36.0%
Aged 65-74
12.1%
Aged 75+
1.5%
(1) There were 736 MEPs.
Source: European Parliament
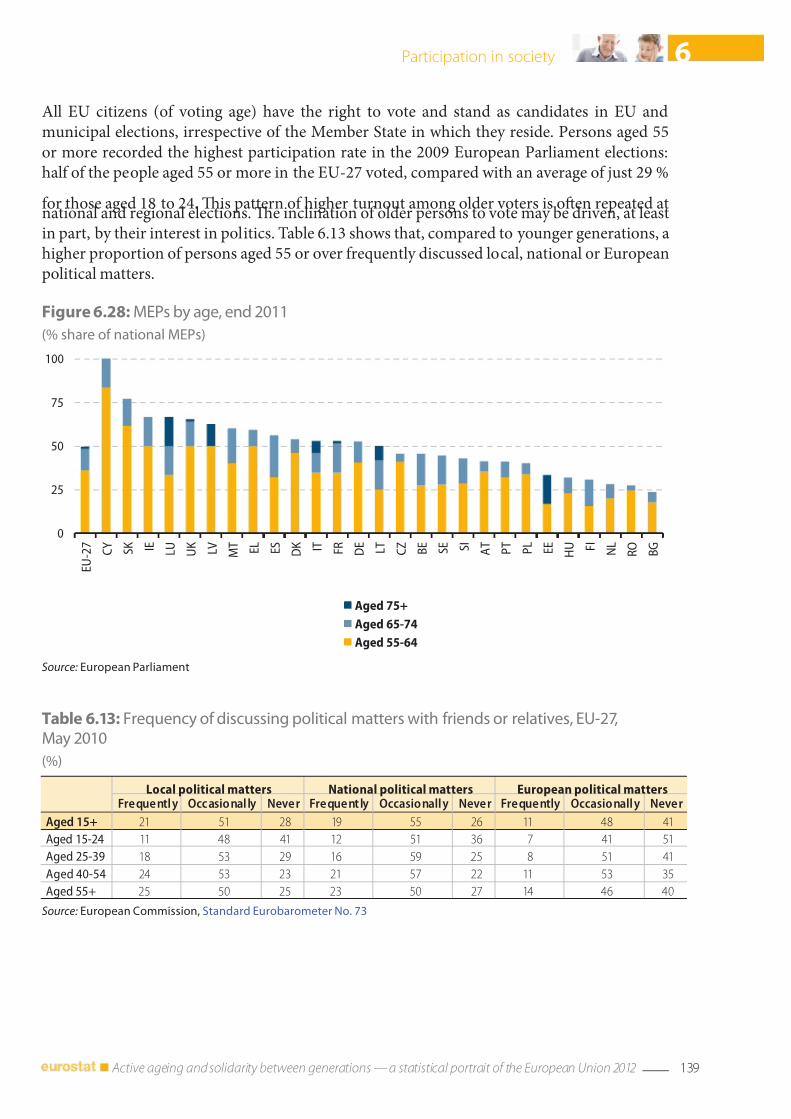
7/31/2019 Active ageing and solidarity between generations 2012 edition A statistical portrait of the European Union 2012
http://slidepdf.com/reader/full/active-ageing-and-solidarity-between-generations-2012-edition-a-statistical 141/147
139 Active ageing and solidarity between generations — a statistical portrait of the European Union 2012
6Participation in society
Figure 6.28: MEPs by age, end 2011
(% share o national MEPs)
0
25
50
75
100
E U - 2 7
C Y
S K I E
L U
U K
L V
M T
E L
E S
D K I T F
R D E
L T
C Z
B E
S E S
I A T
P T
P L
E E
H U F
I N L
R O
B G
Aged 55-64
Aged 65-74
Aged 75+
Source: European Parliament
Table 6.13: Frequency o discussing political matters with riends or relatives, EU‑27,May 2010
(%)
Local political matters National political matters European political mattersFrequently Occasionally Never Frequently Occasionally Never Frequently Occasionally Never
Aged 15+ 21 51 28 19 55 26 11 48 41
Aged 15-24 11 48 41 12 51 36 7 41 51
Aged 25-39 18 53 29 16 59 25 8 51 41
Aged 40-54 24 53 23 21 57 22 11 53 35
Aged 55+ 25 50 25 23 50 27 14 46 40
Source: European Commission, Standard Eurobarometer No. 73
All EU citizens (o voting age) have the right to vote and stand as candidates in EU andmunicipal elections, irrespective o the Member State in which they reside. Persons aged 55or more recorded the highest participation rate in the 2009 European Parliament elections:hal o the people aged 55 or more in the EU-27 voted, compared with an average o just 29 %
or those aged 18 to 24. Tis pattern o higher turnout among older voters is ofen repeated atnational and regional elections. Te inclination o older persons to vote may be driven, at leastin part, by their interest in politics. able 6.13 shows that, compared to younger generations, ahigher proportion o persons aged 55 or over requently discussed local, national or Europeanpolitical matters.

7/31/2019 Active ageing and solidarity between generations 2012 edition A statistical portrait of the European Union 2012
http://slidepdf.com/reader/full/active-ageing-and-solidarity-between-generations-2012-edition-a-statistical 142/147
140 Active ageing and solidarity between generations — a statistical portrait of the European Union 2012
Symbols, abbreviations and acronyms
Symbols, abbreviations and acronyms
: not available or condential- not applicable
% percent& and
EU-27 European Union o 27 Member States including Belgium, Bulgaria, the CzechRepublic, Denmark, Germany, Estonia, Ireland, Greece, Spain, France, Italy,Cyprus, Latvia, Lithuania, Luxembourg, Hungary, Malta, the Netherlands,Austria, Poland, Portugal, Romania, Slovenia, Slovakia, Finland, Sweden andthe United Kingdom; note that unless otherwise stated, the EU aggregate in thispublication reers to all 27 countries, as i these 27 countries had been part o theEU in periods prior to 1 January 2007
BE BelgiumBG BulgariaCZ Czech RepublicDK Denmark DE Germany EE EstoniaIE IrelandEL GreeceES Spain
FR FranceI Italy CY CyprusLV LatviaL LithuaniaLU LuxembourgHU Hungary M MaltaNL NetherlandsA Austria
PL PolandP PortugalRO RomaniaSI SloveniaSK SlovakiaFI FinlandSE SwedenUK United Kingdom
7/31/2019 Active ageing and solidarity between generations 2012 edition A statistical portrait of the European Union 2012
http://slidepdf.com/reader/full/active-ageing-and-solidarity-between-generations-2012-edition-a-statistical 143/147
141 Active ageing and solidarity between generations — a statistical portrait of the European Union 2012
Symbols, abbreviations and acronyms
IS IcelandLI Liechtenstein
NO Norway CH SwitzerlandME MontenegroHR CroatiaMK (21) ormer Yugoslav Republic o MacedoniaR urkey
accomm. accommodationBMI body mass indexEES European employment strategy EIP European innovation partnership(s)ESF European social undEU European UnionEUR euroEU-SILC European Union statistics on income and living conditionsGDP gross domestic productGP general practitionerIC inormation and communication technology ISCED international standard classication o education
LLP lielong learning programmeMEP member o the European ParliamentOECD Organisation or Economic Co-operation and DevelopmentOMC open method o coordinationPAYE pay-as-you-earnPDA personal digital assistantPhD doctor o philosophy (postgraduate academic degree)PPS purchasing power standardSGP stability and growth pactV television
UMS universal mobile telecommunications serviceWHO World Health Organisation3G third generation (mobile telecommunications)
(21) Provisional ISO code which does not prejudge in any way the denitive nomenclature or this country, which is to beagreed ollowing the conclusion o negotiations currently taking place on this subject at the United Nations.

7/31/2019 Active ageing and solidarity between generations 2012 edition A statistical portrait of the European Union 2012
http://slidepdf.com/reader/full/active-ageing-and-solidarity-between-generations-2012-edition-a-statistical 144/147

7/31/2019 Active ageing and solidarity between generations 2012 edition A statistical portrait of the European Union 2012
http://slidepdf.com/reader/full/active-ageing-and-solidarity-between-generations-2012-edition-a-statistical 145/147
European Commission
Active ageing and solidarity between generations – A statistical portrait of the European Union 2012
Luxembourg: Publications Ofce o the European Union
2011 — 141 pp. — 14.8 x 21 cm
Theme: Population and social conditions
Collection: Statistical books
ISBN 978-92-79-21507-0
ISSN 1830-7906
doi:10.2785/17758
Cat. No KS-EP-11-001-EN-C

7/31/2019 Active ageing and solidarity between generations 2012 edition A statistical portrait of the European Union 2012
http://slidepdf.com/reader/full/active-ageing-and-solidarity-between-generations-2012-edition-a-statistical 146/147
HOW TO OBTAIN EU PUBLICATIONS
Free publications:
• via EU Bookshop (http://bookshop.europa.eu);
• at the European Union’s representations or delegations. You can obtain their contact details on the Internet (http://ec.europa.eu) or by sending a faxto +352 2929-42758.
Priced publications:
• via EU Bookshop (http://bookshop.europa.eu).
Priced subscriptions (e.g. annual series of the Official Journal of theEuropean Union and reports of cases before the Court of Justiceof the European Union):
• via one of the sales agents of the Publications Office of the European Union(http://publications.europa.eu/others/agents/index_en.htm).

7/31/2019 Active ageing and solidarity between generations 2012 edition A statistical portrait of the European Union 2012
http://slidepdf.com/reader/full/active-ageing-and-solidarity-between-generations-2012-edition-a-statistical 147/147
Active ageing andsolidarity between generations
A statistical portrait of the European Union 2012
The European Union’s population structure is
changing and becoming progressively older – at
the beginning o 2010, there were 87 million
people aged 65 and over in the EU, more than 17 %
o the total population.
In response to demographic challenges being
aced within Europe, the European Union
designated 2012 as the European Year or Active
Ageing and Solidarity between Generations.
The overall objective o the European Year is
to acilitate the creation o an active ageing
culture in Europe based on a society or all ages.
As Europeans live longer and healthier lives,
governments are looking or ways to involve
older persons more in society and to keep themactive. Eurostat is marking the European Year by
K S -E P -1 1 - 0 0 1 -E N - C