active 3d sensing - institute of photogrammetry and remote sensing
TRANSCRIPT

Centro di Ricerche Informatiche SCUOLA NORMALE SUPERIORE PISA QUADERNI 10, 2000 per i Beni Culturali
1/21
Active 3D sensing
J-Angelo Beraldin, Francois Blais, Luc Cournoyer, Guy Godin and Marc Rioux Institute for Information Technology National Research Council Canada Ottawa, Ontario, Canada, K1A 0R6
e-mail: [email protected]
Abstract Active three-dimensional vision is concerned with extracting information from the geometry and the texture of the visible surfaces in a scene, reasoning about the data and finally, communicating the results. With the recent technological advances made in electronics, photonics, computer vision and computer graphics, it is now possible to construct reliable, high resolution and accurate three-dimensional active range cameras. This paper will cover the elements that compose these range cameras. The basic physical principles that underline the majority of these systems are reviewed. In particular, optical triangulation and time delay measurement systems are covered here. A number of applications illustrating the technology are shown. Finally, in order to help the reader, a number of web-based resources in active 3D vision are listed.
1 Introduction The desire to capture shape by optical means dates back to the beginning of photography. In the 1860’s François
Villème invented a process known as photo sculpture, which used 24 cameras (see Newhall 1958). Profiles of the subject to be reproduced were taken on photographic plates, projected onto a screen (using the magic lantern), and transferred to a piece of clay using a pantograph. Commercial applications developed rapidly; studios opened in Paris, London, and New York. The studios stayed in operation from 1863 to 1867, when it was realized that the photo sculpture process was not more economical than the traditional sculpture technique. In any case, the process still needed a lot of human intervention. Indeed, the photo sculpture process supplied only 24 profiles, which were used to rough down the piece of clay, leaving a large amount of manual work to finish the sculpture. A professional sculptor was needed and the photo sculpture process required quite an investment in terms of cameras, projection and reproduction systems, and skilled labour to operate them. It is only with the advent of computers that the process of capturing shape by optical means has regained substantial interest, more than 100 years later.
In the last twenty years many advances have been made in the field of solid-state electronics, photonics, computer vision and computer graphics. One obvious change that is instrumental in the growth of these technology sectors has been the availability of affordable fast computers, interconnect networking products and feature-packed software tools. Furthermore, electronic information exchange through web-based services has allowed us to gather technical and scientific information in more efficient ways. The days when one had to send letters to companies in order to receive technical information are long gone. With a few click of a mouse, anyone can access datasheets for a particular integrated circuit, the latest software development tools, 3D scanners manufacturers, scientific papers, web demonstration of a product, …etc. Non-contact measurement techniques like those based on structured light (active 3D vision) and passive stereo are examples of fields that have benefited from all of these developments (see Handbook of computer vision 1999 and Besl 1988). Figure 1 presents a classification of surface and volume measurement techniques. Many applications do not allow contact or alterations to an object or surroundings to suit the measurement system, e.g., by changing the reflectivity of the surface with paint. These non-contact measurement techniques have found widespread use in heritage, environment modeling, virtual reality, and many industrial fields. Figure 2 shows a classification of non-contact measurement strategies that rely on light waves. In the case of passive techniques (that use ambient light), only visible features with discernable texture gradients like on intensity edges are measured. Laser-based and liquid crystal (LC) projector-based technologies are used to structure the environment, through artificial light projection means, to acquire dense range maps from visible surfaces that are rather featureless to the naked eye or a video camera. Active 3D vision is concerned with extracting information from the geometry and the texture of the visible surfaces in a scene, reasoning about the sometimes large amount of data and finally, communicating the results. In contrast, two-dimensional vision is concerned with interpreting a 3D environment under a specific illumination (visible, IR, UV, X)
Centro di Ricerche Informatiche SCUOLA NORMALE SUPERIORE PISA QUADERNI 10, 2000 per i Beni Culturali
2/21
using a single projection or multiple projections generated by a camera (still or video). Though 2D vision is being used successfully in many industrial inspection applications, it gives only limited information about the detailed shape of an object in a scene. Active 3D vision sensors provide directly the geometry of an object or an environment. By keeping the properties of invariance in rotation and translation of 3-D objects, sensors that capitalize on active 3D vision can resolve most of the ambiguities found with 2D imaging systems. Moreover, with laser-based approaches, the 3-D information becomes relatively insensitive to background illumination and surface texture. They require minimal operator assistance to generate the 3D coordinates. This paper will concentrate on three-dimensional (3D) active vision. In the sections below, we will cover the elements that compose these range cameras. We will review the basic physical principles that underline the majority of these systems, i.e. those that exploit optical triangulation (law of cosines) and those that are based upon the measurement of time delays generated by light traveling in a medium. A number of applications will be covered here. Other applications are given in this special issue of the journal. A section listing some web-based 3D vision sites that we have accumulated over the years is presented in a separate section. Finally, concluding remarks appear at the end of the paper.
2 Representations of three-dimensional surfaces The simplest and sometimes most convenient way of representing and storing surface coordinates of a scene is
with the use of a depth map. A depth map, as shown on Figure 3b, is like a matrix where the x and y distance information corresponds to the rows and columns of the matrix, and the corresponding depth measurements (z values) are stored in the matrix elements. Depth map is like a grey scale image generated by a 2D camera (Figure 3a) except that the z information replaces the intensity information. If the elements of the matrix are organized so that for a given 3D coordinate all the coordinates surrounding it are physically neighbours of that coordinates then the matrix is known as an organized point cloud. Instead, if the neighbourhood of a given coordinate is totally random then the matrix is known as an un-organized point cloud. Figure 3c shows an example of a cloud point image of a 3D image. A triangular mesh can be used to display a range image (see Figure 4a) or as illustrated in Figure 4b, a grey scale value is assigned to each surface element (e.g. using a triangular patch) according to their slope angles. This method provides a way to artificially shade an image in order to highlight surface details. The object appears to be made of a white material and observed under point source illumination. Small 3D objects can be viewed on a screen with the help of liquid crystal display (LCD) modified stereo glasses as depicted in Figure 5a. Knowing the shape, two views generated with some disparity can be displayed on a screen in a sequential order. Depending on the refresh rate, the human eye will fuse the two images into a stereoscopic image. Hence, the object will appear as if it was coming out of the screen. Similarly, large environments can be displayed on a much larger screen, e.g. in a virtual reality (VR) room like the one in our laboratories (see Figure 5b). Obviously, other displaying options exist but are not covered here, like anaglyphs. Direct 3D replica of physical objects is also possible using, for instance, stereolithographic techniques or selective laser sintering (SLS). Some definitions related to the use of the word pixel in a 3D space are brought to the attention of the reader. A pixel (short for “picture element”) represents a point in a 2-dimensional space. Therefore, pixels have no depth. In a 3D space, one can represent a point as being part of a surface or a volume. Hence, a distinction between surfel (short for “surface element”) and a voxel (short for “volumetric pixel”) is made. Both have depth information but a voxel represents a “dice or cube” in a 3-dimensional space; a surfel represents a small part of a hull.
3 Basic measurement principles
3.1 Triangles Triangles are the basis of many measurement techniques, from basic geodesic measurements performed in
ancient Greece to more modern laser-based 3D cameras. The Greek philosopher Thales (6th century BC) has been credited with the discovery of five theorems in geometry1. Two of which are used to solve the triangulation equations in a range camera. They state that opposite angles of intersecting straight lines are equal and a triangle is determined if its base and the angles relative to the base are given (see Figure 6a). Choosing one of the three laws, i.e. sines, cosines and tangents, solves the last theorem.
1 http://www.britannica.com

Centro di Ricerche Informatiche SCUOLA NORMALE SUPERIORE PISA QUADERNI 10, 2000 per i Beni Culturali
3/21
3.2 Speed of light A fundamental property of light waves is their velocity of propagation. In a given medium, light waves travel with
a finite and constant velocity. Thus the measurement of time delays created by light traveling in a medium from a source to a reflective target surface and back to the source (round trip) offers a very convenient way to evaluate distance. The current accepted value for the speed of light in a vacuum is exactly c = 299,792,458 m/sec. If the light waves travel in air then a correction factor equal to the refraction index (depending on the air density) must be applied to c, n ≈ 1.00025. Let us assume that the speed of light is 3×10⁸ m/sec then one can convert this to a reciprocal form, i.e. 3.33 nanoseconds per meter traveled. If one wants a resolution of 1 mm then a time delay of about 3.33 picoseconds will have to be measured.
3.3 Mixing two waves When two monochromatic waves are made to cross each other (same location in space and at the same time),
the region of crossing will exhibit an interference pattern. A simple trigonometric relation expressing the sum or product of the cosine of two angles can describe this mathematically. The process of mixing two waves is fundamental to many 3D vision cameras like Moiré and interferometric systems.
( ) ( ) ( ) ( )( )bababa ++−= coscos21coscos (1)
4 Light sources and photo-sensors
4.1 Incoherent sources of light Incoherent sources of light can be divided into two main classes
• Thermal sources: the radiation is the result of high temperature, e.g. the sun, tungsten filament lamps • Electric discharge through a gas, e.g. high-voltage sparks
The sun can be used for 3D measurement as in shape from shading methods (see Horn 1986) or by cast shadow methods (see Bouguet and Perona 1998). Most 3D cameras, though, will tend to use controlled sources as are found in liquid crystal display (LCD) matrices where each pixel in the projector can become opaque or semi-transparent. Hence, complex patterns can be generated by a computer and projected onto a scene. Usually, a halogen lamp of about 200-300 Watts is used (see Figure 6b).
4.2 Lasers - Light Amplification by Stimulated Emission of Radiation Incoherent light sources can and are used for digitizing geometry in 3D, but laser sources (see Figure 7a) have
unique advantages for 3D imaging. One of these is brightness, which cannot be obtained by an incoherent emitter. In general, the light produced by lasers is (far more) monochromatic, very directional, highly bright, and spatially more coherent than that from any other light sources. Spatial coherence allows the laser beam to stay in focus when projected on a scene. Unfortunately, high spatial coherence means that speckle is produced when a rough surface is illuminated with coherent laser light. As shown on Figure 7b, speckle appears as a granular pattern superimposed over a scene when that scene is imaged with either a 2D camera or the human eye. Incidentally, as with incoherent light, speckle grains are focused on, in front of, or, behind the retina depending on the degree of myopia a person suffers. In 3D imaging systems, speckle is considered a source of multiplicative noise. Linear filtering techniques (mainly based on temporal operators) won’t reduce speckle-induced noise. Speckle grains appear as if they were attached to the surface of a scene. Later, a scanning approach capable of reducing speckle by spatial filtering will be presented. It is known as the auto-synchronized scanner. Lasers are now available commercially as combined RGB (see Figure 8a for a white laser) or with diverse projection patterns as illustrated on Figure 8b.
4.3 Single photo-sensor A photosensitive element can be realised as a MOS detector (see Figure 9a) or simply as a p/n junction (see
Figure 9b). The electron-hole pairs generated in the depletion region by the impinging photons are separated by an electric field usually generated with an external bias voltage. This process allows the building up of an electronic charge or current depending the read-out mechanism. The sensitivity of the conversion process depends on the photon flux and wavelength, and on the bias voltage. A typical spectral response for a silicon p/n photodiode is as follows 1) below λ~400nm and above λ ~1100nm silicon is insensitive to the radiation; the maximum occurs at around λ~650nm. The peak conversion factor ranges between 0.2 and 0.35 A/W. Figure 10 shows two photographs of photo-

Centro di Ricerche Informatiche SCUOLA NORMALE SUPERIORE PISA QUADERNI 10, 2000 per i Beni Culturali
4/21
sensors used in triangulation and time delay measurement systems. Other semiconductor materials will give a different spectral response, e.g. Indium Gallium Arsenide (InGaAs) sensors used in an eye-safe system (see Beraldin et al. 2000). Our eyes have a spectral response in the range from 400 nm to 700 nm with a peak at 555 nm. Another aspect of measuring light is the dynamic range. A high dynamic range is important because depending on a scene signals go from the very weak to a very high intensity. Semiconductor sensors have a typical dynamic range of 10 000. Some have been fabricated with a dynamic range approaching the human eye, i.e., 106.
4.4 Linear arrays of photo-sensors Commercial linear arrays use either an array of photodiodes (p/n type) that are wire-bonded to a MOSFET-
based multiplexer (see Figure 11) or Charge Coupled Devices (CCD) technology with MOS photo-sensors (Figure 12a). The width of the active area of one photodiode varies from 7 µm to about 50 µm and its height from 100 µm to about 2500 µm. Array lengths vary between 64 and 10 000 photo-elements (pixels). The maximum clock speed is about 15 MHz. The output of a linear array is a stream of pulses where the envelope is a function of the laser spot distribution. The time occurrence of the peak on the signal is directly related to the position of the laser spot imaged from a scene. Mainly single spot (static or scanning) cameras use these linear arrays of sensors. If laser projection is used, then, because of speckle noise, large pixels are preferred over smaller ones. Some high-speed 3D systems, e.g. video rate 3D, use an analog position sensor like the lateral effect photo-diodes illustrated in Figure 10b.
4.5 Matrix arrays of photo-sensors Matrix arrays (see Figure 12b) were originally designed as a replacement for vidicon camera tubes. The
development was mainly driven by the different video signal broadcast standards found throughout the world. About fifteen years ago, most sensors implemented an interlaced reading strategy. Nowadays, progressive scan sensors are widely available. As opposed to interlacing where even lines of pixels are read first (then odd line), progressive scan is a technique by which all the pixels in the matrix array are read one by one. This process allows for an optimal use of the photosensitive area and reduced noise generated by poor synchronization between even-odd images. CCD technology has been largely used in the past and it is still the leading technology for medium to large arrays of sensors. CCD technology allows reaching high resolution and good image quality. However, the reduced signal processing capability of CCDs make them inadequate for the integration of sensing and processing on the same substrate. Recently, a number of companies have introduced image sensors fabricated in CMOS technology (the leading technology in microelectronics). These sensors are augmented by on-chip signal processing functions like analogue-to-digital conversion and vendors are claiming a reduction in power consumption and cost of the sensor. In fact, there are currently about 100 times more fabrication sites for CMOS than for CCD.
5 3D sensing: Triangulation Triangulation is used in applications requiring an operating range that is less than 10 meters. Short-range sensors
are designed for mainly small objects placed at less than 0.5 m to the camera, while medium range can cover ranges from 0.5 m to 2 m depending on the configuration. For ranges between 2 m and 10 m, there are a limited number of triangulation-based sensors available commercially. Though some systems have been built with baselines in excess of 1000 mm to cover distances up to 50 m.
5.1 Single spot and profile measurement The basic geometrical principle of optical triangulation is shown in Figure 13a and b. One can relate Figure 6a, law of cosines, and the discussion in Section 3.1 to Figure 13a. Knowing two angles (α and ∆β) of a triangle relative to its base (baseline d) determines the shape of the triangle. For an incremental change of distance, ∆z, one measures the change ∆β (assuming α constant) using the theorem of opposite angles (discussion in Section 3.1). The angle sensor shown on that figure is in fact one the position sensors presented in Sections 4.4 and 4.5. As one expects, angles are performed by indirect measurement, i.e. using a ratio of two distances. This configuration is known as a single spot laser probe. To measure a profile, one needs to scan (mirror or gantry) the spot. Returning to Figure 13b, the light beam generated by the laser is deflected by a mirror and scanned on an object. A camera, composed of a lens and a position sensitive photo-sensor, measures the location of the image of the illuminated point on the object. By simple trigonometry, the ( x z, ) coordinates of the illuminated point on the object are calculated. From Figure 13b,

Centro di Ricerche Informatiche SCUOLA NORMALE SUPERIORE PISA QUADERNI 10, 2000 per i Beni Culturali
5/21
zd fo
p fo=
+ tan( )θ (2)
and
x z= tan( )θ (3)
where p is the position of the imaged spot on the position detector,θ is the deflection angle of the laser beam, d is the separation between the lens and the laser source (camera baseline), and fo is the effective distance between the position detector and the lens. To show some of the limitations of this triangulation method, let us approximate the standard deviation of the error in z ,σ z , as a function of p only. The law of propagation of errors gives
σ σzz
f d po
≈2
(4)
where σ p is the standard deviation of the error in the measurement p . Here, the standard deviation is equivalent to the measurement uncertainty. The measurement uncertainty in z is therefore inversely proportional to both the camera baseline and the effective focal length of the lens, but directly proportional to the square of the distance. Unfortunately, fo and d cannot be made as large as desired. The baseline d is limited mainly by the mechanical structure of the
optical set-up (stability of the whole system decreases as d increases) and by shadow effects (self occlusion problems increase with d ). Furthermore, in the conventional triangulation geometry, the field of view Φ x of the sensor, is given by
ΦxP
fo
= −2 12
tan ( ) (5)
where P is the length of the position detector. Therefore, in the conventional set-up, a compromise among field of view, measurement uncertainty of the 3D measurement, and shadow effects must be considered. A synchronized geometry provides a way to alleviate these tradeoffs. The paper by Rioux 1994 presents an innovative approach to triangulation-based range imaging. It shows a synchronized scanning scheme that allows very large fields of view with small triangulation angles and that without compromising precision. With smaller triangulation angles (or equivalently d on Figure 13b), a reduction of shadow effects is inherently achieved. The intent is to synchronize the projection of the laser spot with its detection. As depicted in Figure 14a, the instantaneous field of view of the position detector follows the spot as it scans the scene. The focal length of the lens is therefore related only to the desired depth of field or measurement range and not to the field of view. Implementation of this triangulation technique by an auto-synchronized scanner approach yields a considerable reduction in the optical head size compared to the conventional triangulation method. In our systems, the longest baseline is no more than 150 mm. Furthermore, with optical synchronization an improvement in ambient light immunity due to a small instantaneous field of view (long focal lengths) and a reduction of speckle noise (through spatial filtering) are achieved.
5.2 Area measurement In order to acquire a full 3D image, one has to either move the scanner or use another technique that yields full
field 3D measurements.
5.2.1 Mechanical displacement 5.2.1.1 Galvanometer-based The basic optical configuration for this large field of view 3D digitizer is depicted in Figure 14b. Both mirrors are driven by galvanometers. A raster imaging mode produces a range image of the scene: the x-axis scanner (fast axis) is used for the line scanning while the y-axis (slower speed) deflects vertically the scanned beam to produce a raster image. A 3D surface map is obtained by scanning a laser beam onto a scene, collecting the light that is scattered by the scene in synchronism with the projection mirrors, and finally, focusing this light onto a linear position detector, e.g.,

Centro di Ricerche Informatiche SCUOLA NORMALE SUPERIORE PISA QUADERNI 10, 2000 per i Beni Culturali
6/21
photodiode array, charge-coupled device, or lateral effect photodiode (as described in Section 4). The image acquisition process yields three quantities per sampling interval: two angular positions of the mirrors and the position of the laser spot on the linear position detector. The equations obtained after the calibration process are used to map the angular position of the mirrors and the laser spot position into ( x y z, , ) coordinates. Increased depth of focus is achieved by tilting the position sensor (see Figure 14b) according to the Scheimpflug condition (Rioux 1994). 5.2.1.2 Translation stages, rotation motors and CMM Depending on the application, line scanners can be mounted on rotation, translation stages or Coordinate measuring machines (CMM). In general, CMM are preferred for applications aimed at metrology, Rotation stages offer a very compact solution to generating 3D images. Figure 15 illustrates a rotation and translation stages used in the scanning of an area with a line scanner.
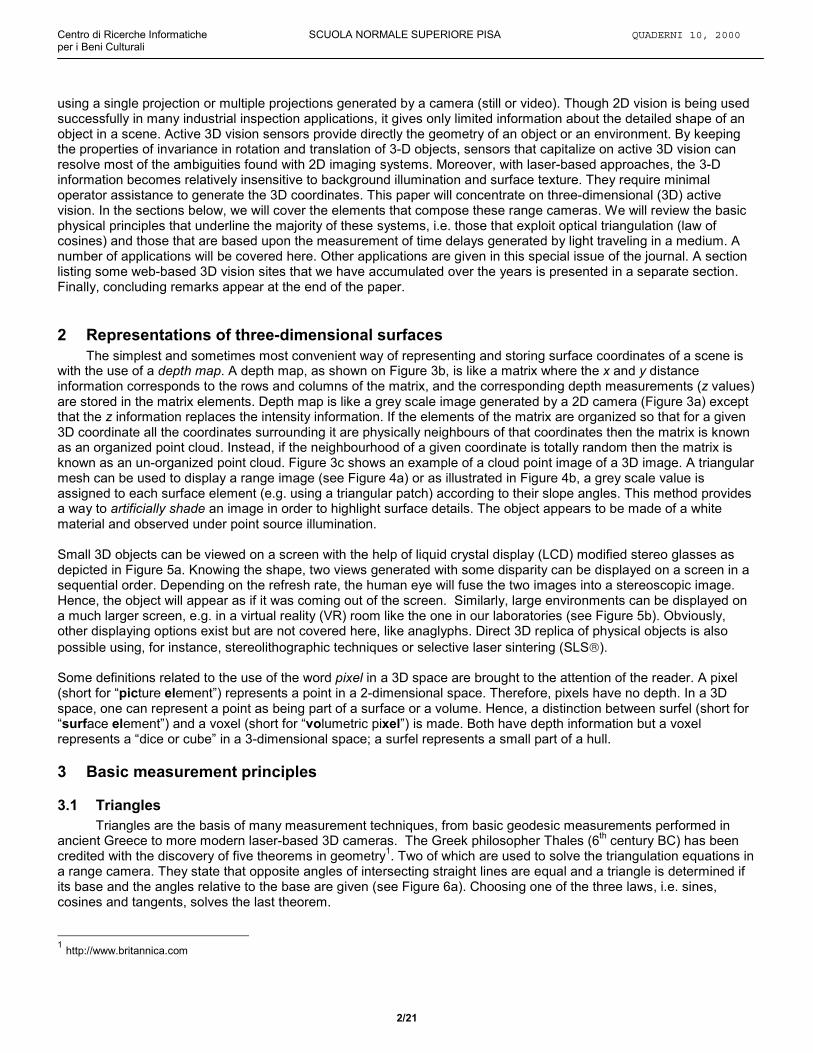
5.2.2 Multi-point and line projection In order to avoid the use of mechanical fixtures, one can use multiple laser beams and design an algorithm for the extraction of the shape. This is illustrated in Figure 16 where a single line projection is compared with a multiple laser projection. The effect of the intersection of the laser line with the object surface as view by a 2D camera is evident. Triangulation is performed in a manner similar to Section 5.1 except that an area position sensor (Section 4.5) must be used. The main challenge with multi-laser line projection systems is the unique or un-ambiguous separation of the different directions of projection.
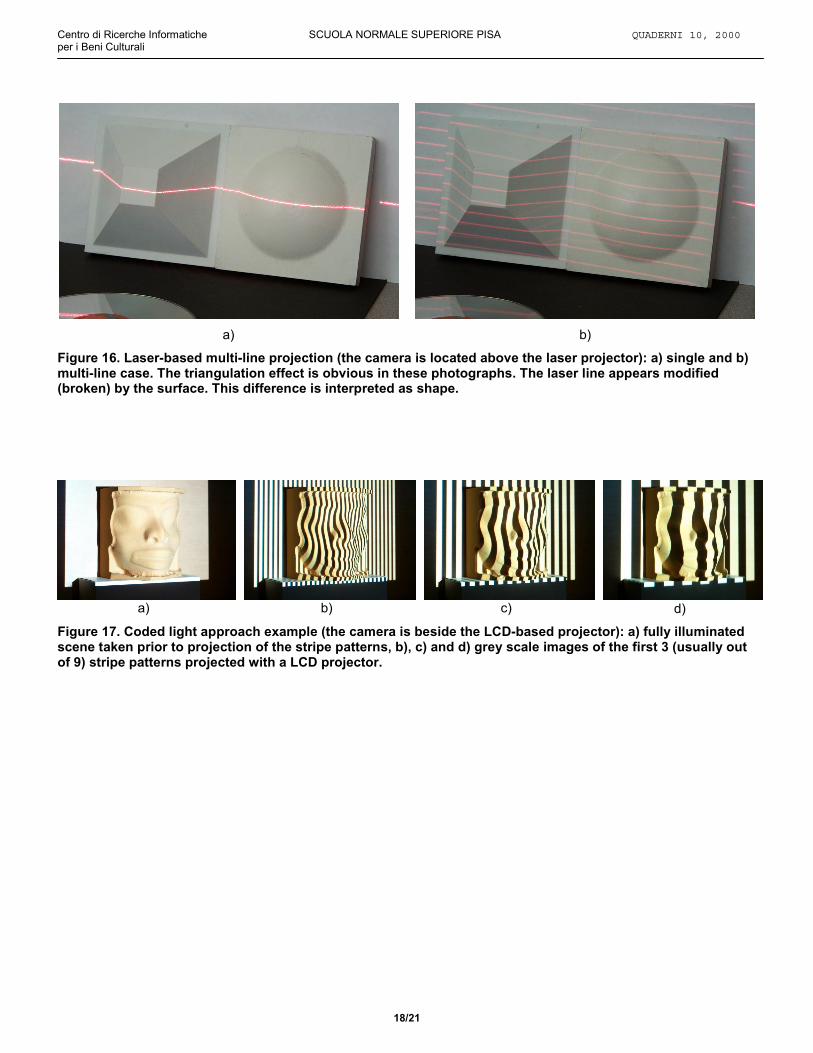
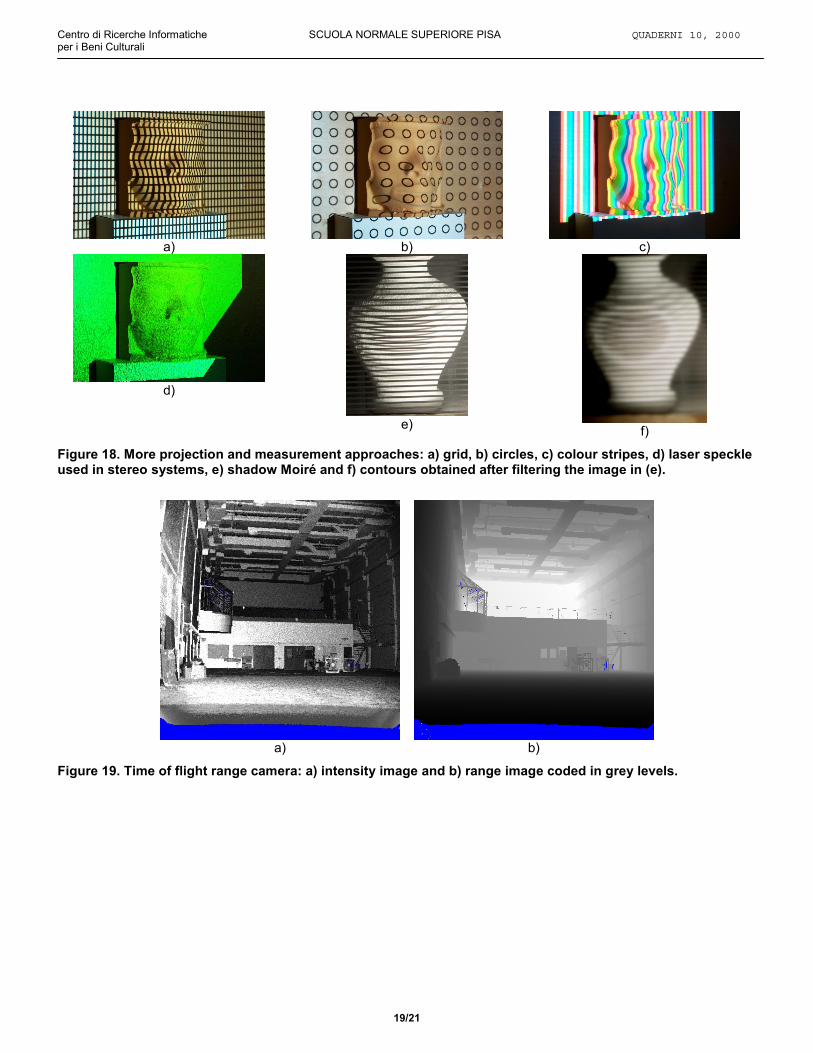
5.2.3 Fringe and coded pattern projection Pattern projection schemes belong to the category of full field 3D cameras. Many patterns (also know as codes) have been proposed to uniquely express light directions, e.g. gray-code (Figure 17) and phase-shift methods have been proposed in the literature. As presented by Sansoni et al. 1999, the gray-code technique allows the unique description of 2n different directions of projection, where n is the code length (number of images projected with a unique pattern). The larger this number, the wider the non-ambiguity height interval gets. A draw back with this technique is that because each projection direction is associated with a code word, the measurement resolution is rather low. For instance, with 9 images (Figure 17 shows 3 of them), 512 levels in z are measured. Fortunately, when this previous approach is combined with a phase-shift approach, a theoretically infinite height resolution can be obtained. In practice it is limited only by the errors that are due to quantization of the gray levels in the intensity image and by electronic noise (no speckle noise here). Sansoni et al. 1999 report on a system that can discriminate more than 2000 levels in z. Other patterns have been used like grids (Figure 18a), circles (Figure 18b), colour stripes (Figure 18c) and speckle for stereo system (Figure 18d). Again, the main challenge with these coded line projection systems is the unique separation of the different directions of projection on objects that have sudden jumps in z and wild texture differences across their surface.
5.2.4 Moiré effect The Moiré effect is simply the result of two amplitude modulated spatial signal interacting together. This phenomenon can be observed on television when people being interviewed wear stripped clothing. Figure 18e illustrates a technique known as shadow Moiré. The principle is based on equation (1) where if a and b are two spatial frequencies then the interaction gives a term with the cosine of the difference of the angles and the sum. When a low pass filter is applied to the image the difference term remains (along with a phase term not shown in that equation). An example is given in Figure 18f. The example is rather crude but it serves to illustrate the technique.
5.2.5 Hand-held One can expect range cameras to become widely available in handheld versions where a user can snap high-resolution 3D shapes along with intensity texture information all around an object and/or an environment. Already, a number of companies have announced or are already selling products based on a LC projector/digital camera combination or profile sensors equipped magnetic or ultrasonic positioning devices. Section 9 lists a few sites that link to such systems.

Centro di Ricerche Informatiche SCUOLA NORMALE SUPERIORE PISA QUADERNI 10, 2000 per i Beni Culturali
7/21
6 3D sensing: Time delay Interesting enough, 3D systems based on time delay measurement are used either for very small fields of view (<
10 mm) or very large ones (> 10 m). For ranges between 0.2 m and 2 m, there is a limited number of this type of sensor available commercially.
6.1 Time of flight
6.1.1 Single point and mirror-based scanning Long-range sensors (range exceeding 10 meters) are usually based on the time-of-flight (TOF) technology (also known as laser radar or lidar for short). Data from this type of range sensor scanners, plus texture, has been used for creating model of the interior of large structures or used on airborne mapping systems (Baltsavias 1999). The distance camera to object (z) is measured by sending a relatively short impulse of light on a reflective surface and measuring the round trip, let say τ,
2τcz = (6)
As discussed in Section 3.2, if one wants a resolution of 1 mm then a time delay of about 3.33 picoseconds will have to be measured. Most commercial systems provide a resolution of about 10 mm to 100 mm. For short-range applications this is not satisfactory but if one compares the resolution to the distance earth-moon, them 100 mm is just fine. These scanners also tend to be more costly than triangulation-based sensors. In order to handle large bandwidths required by short pulses, sophisticated electronics that minimize sensitivity to variation in signal strength are needed. Figure 19 presents intensity and range images generated with a time-of-system. Other systems based on continuous wave (CW) modulation get around the measurement of short pulses by modulating the power of the laser beam. Again the modulated signal is projected onto a surface, the scattered light is collected and a circuit measures the phase difference between the two waveforms and hence a time delay. The range z is given by
AMfcz φπ
∆=4
(7)
where φ∆ is the phase difference and AMf is the modulation frequency. For instance, with a frequency of 10MHz and a phase resolution of 0.01 degree (not too difficult with standard electronics), the resolution in z is about 0.5 mm. Because the returned wave cannot be associated with a specific part of the original signal, it is not possible to derive the absolute distance information from a simple CW method. This is known as the ambiguity interval and is given by
AMamb f
cz2
= (8)
In the example above, the interval is about 15 m. The range measurement uncertainty is proportional to ambz and inversely proportional to the Signal-to-Noise Ratio (SNR). To get around the inconvenience of a range ambiguity interval, one can use multiple frequency waveforms.
6.1.2 Full field Recent progress has been made in the area of full field 3D imaging using time delay measurement. Here a high power laser floods a scene and the return signal is captured by an area sensor that converts the returned energy from the whole scene into a time delay map. A micro-channel plate sensor used in gain modulation regime has been used. Newer sensors perform the measurement on photonic mixer devices Handbook of Computer Vision and Applications 1999.
6.2 Interferometric and Holographic The high coherence of laser light is very helpful in measurement involving interference of light beams. If a light beam is divided into two parts (reference and measuring) that travel different paths, when the beams are combined together interference fringes are produced (see equation 1). Such devices are called laser interferometers. Very small displacements (in the order of a fraction of wavelengths) can be detected (using coherent detection), and longer distances can be also measured with low measurement uncertainty (by counting wavelengths). Many systems have

Centro di Ricerche Informatiche SCUOLA NORMALE SUPERIORE PISA QUADERNI 10, 2000 per i Beni Culturali
8/21
been built on that principle, one find such techniques as multi-wavelength, holography and speckle interferometry. White light interferometry is also possible even if the coherence length of broadband light is very short. Therefore these systems will operate only on short measurement range z. A good survey of those techniques appears in Handbook of Computer Vision and Applications 1999.
7 Performance evaluation of laser-based triangulation sensors
7.1 Laser beam propagation Optical triangulation resolution is limited by the diffraction of the laser light. Even in the best emitting conditions
(single mode) the laser light does not maintain collimation with distance. In fact, the smaller the laser beam, the bigger is the divergence produced by diffraction. Figure 20 illustrates that constraint. The solid line shows the relationship between the X and Y axes (direction perpendicular to the laser projection) and the physical dimensions of the object to be scanned. A detailed analysis of this propagation property can be found in Beraldin et al. 2000.
7.2 Measurement uncertainty Diffraction limits impose a constraint on the resolving power along the X and Y-axes as described above, but
along the range axis (Z) one could expect a continuous improvement as the amount of laser power is increased. Unfortunately this is not the case; indeed the coherence of the laser light produces damaging interference effects that limit the resolving power of a position sensor. This is known as the speckle effect (Figure 7b) and typically (for visible wavelength) it limits the position sensitivity to about 2-5 µm. When this figure is projected back into the scene it often means hundreds of micrometers. It is important to remember this limitation at the designing stage because it prescribes the physical length of the position sensor and the pixel size to be used in order to achieve the desired resolution.
7.3 Calibration The calibration of any range camera is concerned with the extraction of the internal parameters of the range
camera when a mathematical model exists (focal length, lens distortions, scanning parameters, etc.) or with a mapping of the distortions in a look-up table when some elements cannot be modelled very well. After this phase, the range measurements are available in a rectangular co-ordinate system. After the calibration process, the accuracy, repeatability and measurement uncertainties of the range camera can be determined. This is the verification stage. Though no standard or certification method exists currently to evaluate the accuracy, the repeatability and the measurement uncertainty of range cameras, the user has to devise techniques to ensure high standards. Repeatability and accuracy can only be measured with different positions and orientations of a known calibration object. Assuming this calibration object is traceable to a known standard, an accuracy estimate can be computed. As a rule of thumb, the calibration object should have an accuracy that is at least ten times better than that of the range camera itself. Here we give a famous quotation taken from Lord Kelvin. It should summarize the importance of knowing how a 3D system measures physical quantities. ``When you can measure what you are speaking about, and express it in numbers, you know something about it; but when you cannot measure it, when you cannot express it in numbers, your knowledge of it is of a meagre and unsatisfactory kind: it may be the beginning of knowledge, but you have scarcely, in your thoughts, advanced it to the stage of science.'' - Sir William Thompson, Lord Kelvin (1824-1907)
8 Some applications
8.1 Heritage Museum objects, paintings, archaeological site features, architectural elements and sculpture can be digitized to
provide a high-resolution 3D digital record of the object or site. The digital record or “digital model” should provide archival quality documentation which can be used for a variety of research, conservation, archaeological and architectural applications, for fabricating accurate replicas as well as for interactive museum displays and Virtual 3D Theatre applications. Dating back to 1984, our Group has collaborated with the Canadian Conservation Institute, the Canadian Museum of Civilization and the National Gallery of Canada, as well as with several international cultural agencies, on the development of museum and heritage applications of 3D laser scanner-imaging technology. Three

Centro di Ricerche Informatiche SCUOLA NORMALE SUPERIORE PISA QUADERNI 10, 2000 per i Beni Culturali
9/21
systems developed by NRC, each designed for different imaging applications, have been applied to museum and heritage applications: the High Resolution Colour Laser Scanner, the portable Biris 3D Laser Camera and the Large Field of View Laser Scanner. The technology has been applied to a variety of museum and heritage applications: • Archival Documentation: tool mark details • Museum Exhibition and Display Applications: interactively examine fine details on 3D digital models using a
large screen monitor • Research Applications: magnified, accurately measure, examined under different lighting conditions and display
of 3D models with or without colour, e.g. brush stroke on paintings, roll-out photographs • Art Conservation Applications: the data provides an accurate record of the shape, surface condition and colour
of an object, which can be used to document and monitor changes at different points in time • Archaeological Recording, Architectural & Historic Building, Digitizing Sculpture Applications: on-site
acquisition and modelling • Replication Applications: the object is not touched or damaged during scanning, scale replicas can be made
which are much closer or truer representations than those copied by hand, the data can be formatted to machine the replica directly to make a mould
• 3D Virtualized Reality Theatre Applications: Interactive 3D Virtualized reality systems offer the potential for the “digital repatriation” of models of artefacts, which have been removed to distant museums, back into the virtualized model of their original site.
8.1.1 Models from colour and shape data This range camera differs from most cameras in that colour is added to the auto-synchronized design by coupling a polychromatic laser (e.g. RGB laser) to the optical fibre that brings the light source to the 3D camera. On the scene, the laser light appears white (see Figure 21a). At the collection, colour separation is made on a single linear position sensor using a collinear dispersive optical element close to the collecting lens. The brightness signals measured by the position sensor at the three laser wavelengths depend on the absolute power of the laser, the distance from the camera to the surface element being measured, the orientation of that surface element relative to camera, and the physical properties of the surface itself. The goal of colour correction is to obtain unique values for the colour components that depend only on the physical properties, namely the reflectance, intrinsic to the surface element. Detailed information on the colour correction algorithms can be found in Baribeau et al. 1992. Other mathematical models to describe this phenomenon for digital cameras have been proposed in the literature (see Rushmeier and Bernardini 1999, Levoy et al. 2000). The result of recording of a Nicaraguan figurine is illustrated in Figure 21. Acquisition of the high-resolution 3D images is performed with a precision translation stage. An image is composed of 1024 profiles and each profile contains 1024 co-ordinates (x, y, z, R, G, B). In order to digitize the whole object, multiple images are captured all around the object and assemble together into a seamless archival quality high-resolution 3D digital model. Figs. c-d show two different views of the completed 3D model of this figurine. Due to the simultaneous digitizing of the three laser colours impinging on the position sensor, the registration of the geometric data and the colour data is perfect. This feature is unique to NRC technology.
8.1.2 Portable system for remote sites The Biris range camera was developed to work in difficult environments where reliability, robustness, and ease
of maintenance are as important as the accuracy. This technique when combined with advanced signal processing algorithms allows Biris to become very tolerant to ambient light illumination, e.g. sunlight. The hand portable Biris system (based on laser triangulation) was tested on sites in Padova in 1997 and Pomposa in 1998, both in Italy. The objective was the demonstration of the laser scanner camera for on-site 3D model creation. Incidentally, the NRC has also participated in the project organized by Prof. Levoy (Levoy et al. 2000) in Florence by providing scans of chisel marks with a Z uncertainty of 0.01 mm on the Michelangelo’s David. In Padova, multiple range images were taken at various locations all around a sculpture by Giovanni Pisano (circa 1305). The marble sculpture is located in the “Cappella degli Scrovegni” in Padova, Italy (Figure 22). The views have enough overlap between them to find the registration and to merge them together. There is no need for artificial aids like targets. The generation of the models is done using the software Polyworks2. The final model is created after the merging process (removal of overlaps) or after compressing the polygons to a desired resolution. Figure 22 presents the whole statue, which contains approximately 1,500,000 polygons. All the range images for the sculpture, the vaults 2 Innovmetric Software Inc. http://www.innovmetric.com

Centro di Ricerche Informatiche SCUOLA NORMALE SUPERIORE PISA QUADERNI 10, 2000 per i Beni Culturali
10/21
and the Altar table (not shown) were acquired in a single one-day session (10 h long). This includes unpacking and packing, regular backups of data and moving the camera-tripod assembly around the environment (see Beraldin et al. 1999). Finally, the model of the statue was created in a separate 3-day session of 6 h per day. The same techniques were applied to the creation of digital 3D models of a number of bas-reliefs by Donatello (circa 1446-1450, located in the Basilica del Santo in Padova). At the Abbey of Pomposa (circa 850), the scans had to be performed outdoors under high levels of ambient light. Many results appear in Beraldin et al. 1999.
8.2 Virtualized reality Perhaps one can envision integrating virtual environments (generated from hypothesis about the world) and
virtualized environments (generated from the physical world – also known as built reality) in our everyday life. Virtual and virtualized environments (VE) offer the possibility to expand our abilities in planning, creating and experiencing new surroundings and perhaps allow us to visit a remote site as a virtual tourist. A virtual environment should represent a collection of objects with such diverse properties as shape, dimension, colour, rigidity, transparency, size, etc. These objects must be linked together in the virtual or virtualized environment so that human beings can interact with the whole environment and therefore experience that compelling sense of immersion attributed to our five senses. Virtual is used when objects are generated in a computer from hypothesis about the world. Virtualized stems from the generation of object models from the physical world that surrounds us. The result ends up in the computer memory but the generation process is different. Hence, virtualized objects or environments are the result of a measurement process (see El-Hakim et al. 1996). As described in the present paper, most 3D models can be used in virtualized environments. But only those models with the highest resolution are desirable.
8.3 Other applications There exist obviously other research topics and applications for active 3D vision. For example,
• Manufacturing applications • 3D information management • Supervisory Scanner Human Interface • Tracking systems and dynamic environments: Space • Anthropometrical applications
9 Sampling of web resources on active 3D vision In this section we list the relevant web pages located on our server at NRC. From these web pages the reader will be able to gather a lot of information about 3D resources on the net: 3D Digitizing, 3D Model Building Software, Universities, 3D Research Centres, Vision Conference Listings, Virtual Reality, Applications in 3D, Services, 3D Synthetic Models, and finally other 3D information like computer, hardware, accessories, and software. The reader should understand that not all web sites are listed but we try to keep them up to date. The address is
http://www.vit.iit.nrc.ca/Pages_Html/English/Links.html
10 Conclusion The recent technological advances discussed above have made possible the construction of reliable and
accurate three-dimensional cameras. Consequently, both research laboratories and companies have developed many three-dimensional data acquisition systems. These cameras, also known as range cameras, are as diverse as their intended application. We reviewed some of the basic principle behind their operation. From simple trigonometric relations to parameters involved in the digitizing of a 3D object, e.g., sampling density, measurement uncertainty, accuracy issues and scanning strategies. The purpose of measuring 3D objects and sites could be for documentation, inspection or visualisation and possibly all of them. Raster scans, panoramic views and whole field systems are all possible acquisition strategies. The potential of active 3D vision for applications in heritage or as an input to virtualized reality environments was discussed. Real world acquisition and modeling is now possible. Technological advances are such that difficulties are more of a logistical nature than technology per se.
Many techniques exist to digitize small objects with both a high-resolution 3D surface and a view independent surface texture with perfect registration between them. Models of large objects, structures and environments are possible but we are convinced that the combination of the current technique with other methods that are being explored in our laboratory and others around the world will be required. In the case of virtual and virtualized environments offer the possibility to expand our abilities in planning, creating and experiencing new surroundings, e.g. virtual tourism on sites that have been closed to the general public.

Centro di Ricerche Informatiche SCUOLA NORMALE SUPERIORE PISA QUADERNI 10, 2000 per i Beni Culturali
11/21
11 Acknowledgements The authors want to acknowledge the various collaborators that have participated in the realisation of the projects discussed in this paper, many thanks to the Canadian Museum of Civilization, and our colleagues of the Visual Information Technology group. We are indebted to Prof. Guido M. Cortelazzo and Antonio Vettore for their logistical support throughout the work n Padova. The authors want to acknowledge the help of Prof. Ing. Marco Gaiani at the University of Milano, the Soprintendenza ai beni artistici e storici per le province di Ferrara, Ravenna, e Forlì for the opportunity to demonstrate our technology in Pomposa. Thanks to Anne-Christine Loranger for loaning us the Nicaraguan sculpture.
References Handbook of Computer Vision and Applications. 1999. Volume 1: Sensors and Imaging, Chap. 17-21 Editors B. Jähne, H. Haußecker and P. Geißler, Academic Press, San Diego. Baltsavias, E.P. 1999. Airborne laser scanning: basic relations and formulas. ISPRS Journal of Photogrammetry & Remote Sensing (54), 199–214. Baribeau, R., Rioux, M., Godin, G., 1992. Color reflectance modeling using a polychromatic laser range sensor. IEEE Transactions on Pattern Analysis and Machine Intelligence, Vol. 14 (2), 263-269. Beraldin, J.-A., Blais, F., Cournoyer, L., Rioux, M., El-Hakim, S.H., Rodella, R., Bernier, F., Harrison, N., 1999. 3D Digital Imaging and Modeling, Proceedings Second International Conference on 3D digital imaging and modelling, Ottawa, Canada, pp. 34-43. Beraldin, J.-A., Blais, F., Rioux, M., Cournoyer, L., Laurin, D., MacLean, S.G., 2000. Eye-safe digital 3D sensing for space applications. Opt. Eng. 39(1), 196-211. Besl, P.J. 1988. Range Imaging Sensors. Machine Vision and Applications (1), 127-152. Bouguet, J.-Y., Perona, P. 1998. 3D Photography Using Shadows. Conf. Proceeding of EUSIPCO, Island of Rhodes, Greece, pp. 1273-1276. El-Hakim, S.-F., Beraldin, J.-A., Godin, G., Boulanger, P. 1996. Two 3-D Sensors for Environment Modeling and Virtual Reality: Calibration and Multi-view registration. International Archives of Photogrammetry and Remote Sensing. Volume 31, Part B5, Commission V, Vienna, Austria, July 9-19, pp. 140-146. Horn, B.K.P., 1986. Robot Vision. The MIT Press, McGraw-Hill Book Company, Cambridge, MA. Levoy., M., Pulli, K., Curless, B., Rusinkiewicz, S., Koller, D., Pereira, L., Ginzton, M., Anderson, S., Davis, J., Ginsberg, J., Shade, J., Fulk, D., 2000 The Digital Michelangelo Project: 3D Scanning of Large Statues, to appear in Siggraph 2000 proceedings, New Orleans, USA Newhall, B., 1958 Photosculpture. Image, 7(5). 100-105. Rioux, M. 1994. Digital 3-D imaging: theory and applications. SPIE Proceedings, Videometrics III, International Symposium on Photonic and Sensors and Controls for Commercial Applications, Boston, MA. October 31 - November 4, Vol. 2350, pp. 2-15. Rushmeier, H., Bernardini, F., 1999. Computing consistent normals and colors from photometric data 3-D Digital Imaging and Modeling. Proceedings Second International Conference on 3D digital imaging and modelling, Ottawa, Canada, pp. 99 –108. Sansoni, G., Carocci, M., Rodella, R.. 1999. 3D vision based on the combination of Gray code and phase phase shift light projection. Applied Optics, 38(31) 6565-6573.

Centro di Ricerche Informatiche SCUOLA NORMALE SUPERIORE PISA QUADERNI 10, 2000 per i Beni Culturali
12/21
Figures
3D surface and volumemeasurement
Contact
Destructive
Non-contact
Ultrasonic wavesf = 0.01 to 10 MHz
f : frequency
Micro-wavesf = 10 to 100 GHz
Higher energy wavesf > 1000 THz
X-rays in CT scanLaser range andpattern projection
camerasAirborne Synthetic
Aperture Radar (SAR)
Array sonar systems
Slicing
Non-destructive
Coordinate measuringmachines (CMM)
Articulated arms with encoders,precision bearings, and
counterbalancing
Light wavesf = 100 to 1000 THz
Plumb line & ruler
Figure 1. Classification of 3D surface and volume measurement techniques.
Light wavesf = 100 to 1000 THz
Active
Passive
Triangulation(cosine law)
Time delay(speed of light
& laser coherence)
Projection:single spot
Sequential and singlefringe projection
Moiré
Phase shifting
Photogrammetry
Shape from shading
Stereopsis: binocular vision
Focus/de-focus: Confocal microscopy
Silhouettes: photo sculpture
Colour-coded projection
Projection:sheet of light
Projection:Bundle of rays
Time-of-flight(TOF)
Pulsed (Lidar)
Continuous modulation(AM, FM, ...)
Multi-wavelength
HolographicInterferometry
(optically coherentdetection)
Speckle or Whitelight-based
Figure 2. Classification of non-contact 3D surface measurement techniques based on light waves.

Centro di Ricerche Informatiche SCUOLA NORMALE SUPERIORE PISA QUADERNI 10, 2000 per i Beni Culturali
13/21
a) b)
c)
Figure 3. Representation methods of a 3D surface: a) standard intensity 2D image, b) depth coded as gray levels and c) 3D points.
a)
b)
Figure 4. More representation methods of a 3D surface: a) wire-mesh super-imposed on the intensity image and b) synthetic shading (artificial lighting).
Rows
Columns

Centro di Ricerche Informatiche SCUOLA NORMALE SUPERIORE PISA QUADERNI 10, 2000 per i Beni Culturali
14/21
Figure 5. Presenting a 3D scene on a display: a) 3D model of an object is view with stereo glasses and b) a model or a complete environment is experienced in a virtual reality room.
a)
Halogen lamp
Reflector
Lensingarrangement
Liquid Crystal Display (LCD)matrix of semi-transparent
pixels
b)
Figure 6. Basic elements: a) similar triangles and cosine law and b) liquid crystal display-based projector.
a)
b)
Figure 7. Coherent light sources: a) red diode laser (650 nm) and green (532 nm) solid-state laser and b) speckle pattern generated by a rough surface illuminated by a green laser.

Centro di Ricerche Informatiche SCUOLA NORMALE SUPERIORE PISA QUADERNI 10, 2000 per i Beni Culturali
15/21
a)
b)
Figure 8. Laser projectors: a) separation of colours for a white laser into red, green, and, blue light beams and b) types of laser projector patterns.
metalField oxidechannel
stop
p-typesilicon
substrate
depletion zone........
Front side illumination
Back side illumination
e-
+10V
a)
cathoden+ doped back contact diffusion
Bulk n-dopedsilicon (50 µµµµm)
Depletion region
p- doped active area(1-3 µµµµm)
Incident light
AnodeAR coatingSiO2
b)
Figure 9. Photosensitive elements: a) realised as a MOS detector and b) as a p/n junction.
a)
b)
Figure 10. Photographs of some photo-sensors: a) single element photodiode and b) linear and dual-axis lateral effect photodiodes.

Centro di Ricerche Informatiche SCUOLA NORMALE SUPERIORE PISA QUADERNI 10, 2000 per i Beni Culturali
16/21
Figure 11. Linear array of photodiodes: schematic and photographs of 2 sensors with different size pixels.
a)
b)
Figure 12. Example of linear array and area arrays of photo-sensors: a) typical CMOS arrays and b) CCD video camera.
a) b)
Figure 13. Principal of active triangulation: a) a triangulation-based laser probe, b) conventional approach with scanning.

Centro di Ricerche Informatiche SCUOLA NORMALE SUPERIORE PISA QUADERNI 10, 2000 per i Beni Culturali
17/21
a)
b)
Figure 14. Autosynchronized scanner: a) simplified schematic diagram of a single scan axis scanner and b) dual-scan axis (equally used in triangulation & time of flight systems).
a)
b)
Figure 15. Area scanning with mechanical equipment : a) rotation table and b) 3 degree-of-freedom translation stage.
Centro di Ricerche Informatiche SCUOLA NORMALE SUPERIORE PISA QUADERNI 10, 2000 per i Beni Culturali
18/21
a)
b)
Figure 16. Laser-based multi-line projection (the camera is located above the laser projector): a) single and b) multi-line case. The triangulation effect is obvious in these photographs. The laser line appears modified (broken) by the surface. This difference is interpreted as shape.
a) b) c) d)
Figure 17. Coded light approach example (the camera is beside the LCD-based projector): a) fully illuminated scene taken prior to projection of the stripe patterns, b), c) and d) grey scale images of the first 3 (usually out of 9) stripe patterns projected with a LCD projector.
Centro di Ricerche Informatiche SCUOLA NORMALE SUPERIORE PISA QUADERNI 10, 2000 per i Beni Culturali
19/21
a)
b)
c)
d)
e)
f)
Figure 18. More projection and measurement approaches: a) grid, b) circles, c) colour stripes, d) laser speckle used in stereo systems, e) shadow Moiré and f) contours obtained after filtering the image in (e).
a)
b)
Figure 19. Time of flight range camera: a) intensity image and b) range image coded in grey levels.

Centro di Ricerche Informatiche SCUOLA NORMALE SUPERIORE PISA QUADERNI 10, 2000 per i Beni Culturali
20/21
Figure 20. Physical limits of 3D optical measurements based on laser projection. The solid line shows the relationship between the X and Y axes (direction perpendicular to the laser projection) and the physical dimensions of the object to be scanned; the dotted line, is the uncertainty in Z imposed by laser speckle.
a)
b)
c)
d)
Figure 21. 3D colour scanning and modeling of a Nicaraguan figurine: a) close-up of the whitish laser line, b) wire-mesh representation of the 3D model (reduced to 100 000 polygons), c) one view of the completed 3D model shown with synthetic shading (colour removed), and, d) colour texture mapped onto the 3D shape.

Centro di Ricerche Informatiche SCUOLA NORMALE SUPERIORE PISA QUADERNI 10, 2000 per i Beni Culturali
21/21
Figure 22. Madonna con il Bambino, G. Pisano (circa 1305): a) portable biris system used to scan the sculpture, b) site in the Cappella degli Scrovegni in Padova, and, c) completed 3D model of the statue shown from a virtual point of view not available to tourists visiting the Chapel. Height is about 1.29 m.