actionable recovery and resilience strategies for
TRANSCRIPT

BRIEFING BOOKPrepared by the DC Office of Planning (OP) and the Office of the Deputy Mayor for Planning and Economic Development (DMPED) as background for the Urban Land Institute Advisory Service Panel
November 2020
Actionable Recovery and Resilience Strategies for Washington, DC’s Central Business District

Briefing Book: Actionable Recovery and Resilience Strategies for Washington, DC’s Central Business District 2
TABLE OF CONTENTS Sponsors: Government of the District of Columbia & ULI Foundation ............................................................. 4
1. INTRODUCTION .................................................................................................................................... 5
Panel Assignment ...................................................................................................................................................................... 5
Summary of Issues ............................................................................................................................................................... 5
Summary of Key Considerations and Objectives ................................................................................................... 6
Objectives ............................................................................................................................................................................... 7
Questions for Panel ............................................................................................................................................................ 7
2. OVERVIEW OF STUDY AREA ............................................................................................................... 9
Demographics ........................................................................................................................................................................... 10
Land Use & Development Patterns ................................................................................................................................... 11
Central Washington Planning Area .............................................................................................................................. 11
Land Use ................................................................................................................................................................................. 13
Zoning Tools .......................................................................................................................................................................... 14
Governance ................................................................................................................................................................................ 16
District Government Structure ..................................................................................................................................... 16
Relationship with Federal Government: The Home Rule Act .......................................................................... 17
National Capital Planning Commission ...................................................................................................................... 17
Regional Cooperation ....................................................................................................................................................... 18
3. PANEL FOCUS AREAS .......................................................................................................................... 19
Equity and Inequity in the CBD ......................................................................................................................................... 19
Economic Development ........................................................................................................................................................ 19
Employment ......................................................................................................................................................................... 19
Consumer Spending within the District ................................................................................................................... 20
Economic Impact of Visitors........................................................................................................................................... 21
Consumer Spending and Visitors within the CBD ............................................................................................... 22
Revenue in the District: FY20 through FY24 ......................................................................................................... 23
Predictions for a Return to Work ................................................................................................................................ 24
Key Challenges and Opportunities ........................................................................................................................... 24
Commercial: Office Market ................................................................................................................................................ 26
Impacts of COVID-19 ........................................................................................................................................................ 29
Key Challenges and Opportunities ........................................................................................................................... 30
Commercial: Hotel Market .................................................................................................................................................. 32

Briefing Book: Actionable Recovery and Resilience Strategies for Washington, DC’s Central Business District 3
Impacts of COVID-19 ........................................................................................................................................................ 33
Key Challenges and Opportunities ............................................................................................................................34
Commercial: Retail Market ................................................................................................................................................. 36
Impacts of COVID-19 ........................................................................................................................................................38
Key Challenges and Opportunities ............................................................................................................................38
Commercial: Food and Hospitality ................................................................................................................................. 40
Impacts of COVID-19 ......................................................................................................................................................... 41
Key Challenges and Opportunities ............................................................................................................................ 42
Residential ............................................................................................................................................................................... 44
Affordability ........................................................................................................................................................................ 46
Homelessness ..................................................................................................................................................................... 46
Impacts of COVID-19 ..................................................................................................................................................... 47
Key Challenges and Opportunities ........................................................................................................................... 48
Small Businesses..................................................................................................................................................................... 50
Impacts of COVID-19 ......................................................................................................................................................... 51
Support for Small Businesses During COVID-19 .................................................................................................. 51
Key Challenges and Opportunities ........................................................................................................................... 52
Arts, Culture, and Entertainment ..................................................................................................................................... 55
Impacts of COVID-19 ........................................................................................................................................................ 56
Key Challenges and Opportunities ............................................................................................................................ 57
Public Space, Activation, Design and Civic Infrastructure .................................................................................... 59
Recent and Current Relevant Planning Efforts ...................................................................................................... 61
Impacts of COVID-19 ........................................................................................................................................................ 62
Transportation Equity ...................................................................................................................................................... 63
Key Challenges and Opportunities ........................................................................................................................... 64
Acknowledgements ................................................................................................................................................................ 65
4.BACKGROUND AND SUPPLEMENTAL RESOURCES ...................................................................... 66
Cover Picture Credits
Top Right: Rita Abou Samra, DC Office of Planning Middle Right: Washington, DC Economic Partnership (WDCEP) Bottom Left: The Interstellar Studio for DowntownDC BID

Briefing Book: Actionable Recovery and Resilience Strategies for Washington, DC’s Central Business District 4
Sponsors: Government of the District of Columbia & ULI Foundation
The Office of the Deputy Mayor for Planning and Economic Development (DMPED) assists the Mayor in the coordination, planning, supervision, and execution of economic development efforts in the District of Columbia with the goal of creating and preserving affordable housing, creating jobs, and increasing tax revenue.
The DC Office of Planning (OP) is tasked with planning for the long-term growth of the District of Columbia, to help ensure it reflects our values of an inclusive and vibrant city. OP guides development in the District of Columbia’s distinctive neighborhoods by engaging stakeholders and residents, performing research and analysis, serving as the steward of our historic resources, and publishing various planning documents, including the Comprehensive Plan.
The ULI Foundation works to make the world a better place by supporting the research and programs of the Urban Land Institute, which provides leadership in the responsible use of land and in creating and sustaining thriving communities worldwide.

Briefing Book: Actionable Recovery and Resilience Strategies for Washington, DC’s Central Business District 5
1. INTRODUCTION
In November 2020, the Government of the District of Columbia partnered with the Urban Land Institute (ULI) Foundation to host a virtual Advisory Services Panel (vASP) with professional experts to explore strategies that would enhance an equitable economic recovery from the COVID-19 public health emergency in the Central Business District (CBD). This briefing book was originally created as a background document to distill the key challenges in the CBD – both longstanding challenges and emerging challenges stemming from the public health emergency – for the ULI panel and highlight trends, existing District and partner efforts, and current challenges and potential opportunities within key focus areas. Now, this briefing book provides important context for the recommendations from the ULI panel. To see the panel’s final report with the full list of recommendations, visit the ULI webpage: https://americas.uli.org/washington-d-c-virtual-advisory-services-panel/.
Panel Assignment
Summary of Issues
The COVID-19 public health emergency has severely disrupted the District’s CBD. It has caused widespread leisure and hospitality business closures and created intense pressure on the retail, hospitality, and arts, cultural, and entertainment sectors. Decreased employment and revenue resulting from COVID-19 have further exacerbated the existing challenges of high office vacancy rates and limited vibrancy stemming from few residential opportunities in the area.
Similar to CBDs around the country, the District’s Downtown and Golden Triangle areas have long been large commercial district-employment hubs with a mix of office, retail, hospitality, and cultural and entertainment uses. At the heart of the nation’s capital, the CBD plays a unique role in welcoming workers, visitors, and residents alike to work, play, and enjoy, all within steps from national landmarks and attractions. The CBD is anchored by a large office market, an exciting landscape of retail stores, restaurants, and hotels, including many local and small businesses, and numerous acclaimed entertainment and cultural spaces that all provide a wide range of employment opportunities, including for low skilled workers.
Since the beginning of the public health emergency, a combination of remote work and stalled travel from business and leisure activities plus the cessation of convention and event travel has meant area businesses have lost significant portions of their customer base, resulting in widespread business closures and vacancies and exposing the core vulnerabilities of the CBD.
It is critical to recognize that the impacts of COVID-19 have not been shared equally across workers, businesses, and residents in the District and have revealed systemic and entrenched inequities. From an economic perspective, a majority of the jobs lost in the District have been low-wage occupations in front-line service industries, such as the Food & Drinking Places Subsector within the Leisure & Hospitality Sector as well as the Retail Subsector within the Trade & Transportation Sector. At the same time, most office workers in the Professional and Business Services Sector have been able to work remotely during the public health emergency. Small

Briefing Book: Actionable Recovery and Resilience Strategies for Washington, DC’s Central Business District 6
businesses, particularly businesses with Black and Latino proprietors, have seen high rates of closure across the District, and businesses in majority-Black neighborhoods have faced longer wait times for important federal aid such as the Paycheck Protection Program, further entrenching the pervasive underlying issues that challenged minority-owned businesses to operate and scale successfully even before the crisis.1 From a health perspective, Black residents accounted for 74% of the District’s total deaths from COVID-19 and Latino residents accounted for 13% as of early October 2020, despite the fact that these populations only make up 46.0% and 11.3% percent of the population, respectively.2
Any efforts to spur the equitable recovery of the District’s CBD must address both long-standing, systemic and emerging challenges for Black and Latino workers, business owners, and residents. The Mayor’s proposed Comprehensive Plan supports this goal and highlights, through a crosswalk3, nearly 100 polices and actions that will help ensure all residents have what they need to thrive, no matter their race, age, neighborhood, or income. These policies are supported by important data and trends throughout the update that reflect current disparities and should be considered in the equitable recovery efforts of the CBD.
Summary of Key Considerations and Objectives
Given the formidable challenges facing the District and the CBD, the District is committed to implementing a rapid and equitable recovery that considers the following elements:
• Equity-driven approaches that close the gaps in high rates of closures among Black and Latino businesses and expand support and opportunities for underserved and underrepresented entrepreneurs, for example, small-scale commercial spaces that can facilitate low-barrier entrepreneurship spaces;
• New mix and use models for the CBD that include rethinking the scale and approach for commercial uses, for example, through clusters of regional-serving office buildings and more flexible office spaces; and a pivot to more residential, for example, through identifying conversion opportunities for office and hotel to residential;
• New business models for retail, restaurants, and cultural hubs and how these models could take advantage of available space;
• The role of public space, creative public space activation, and civic infrastructure in creating inclusive places and fostering vibrancy, such as providing opportunities for small-scale entrepreneurs and access to healthy food including farmers markets, streateries or expanding outdoor dining, etc.;
• Approaches towards reintroducing the CBD to workers, visitors, and residents as part of COVID-19 recovery phases; and
1 https://www.brookings.edu/research/new-data-shows-small-businesses-in-communities-of-color-had-unequal-access-to-federal-covid-19-relief/ 2 https://coronavirus.dc.gov/data 3https://plandc.dc.gov/sites/default/files/dc/sites/Comprehensiveplan/page_content/attachments/Comp%20Plan%20Equity%20Crosswalk_June2020.pdf

Briefing Book: Actionable Recovery and Resilience Strategies for Washington, DC’s Central Business District 7
• Avenues for leveraging the current complicated nature of international travel to drive local tourism anchored on historic and monumental offerings within the District’s built environment.
Objectives
The District asked the panel to consider specific issues and impacts of the COVID-19 public health emergency and make recommendations to optimize the mix and use of space in key employment centers aimed at minimizing vacancy, catalyzing vibrancy, bolstering tax base, and creating new opportunities for underserved entrepreneurs.
• Impacts & Issues. Consider the cumulative effects of the COVID-19 pandemic on office, hotel, retail, hospitality, and entertainment on the CBD.
• CBD Model Rethink. Reimagine the traditional CBD model through an equity-forward lens to include residential and small-scale commercial spaces for underserved entrepreneurs.
• Supporting Infrastructure. Examine the role of public space, design, and civic infrastructure in supporting vibrancy and equity.
• Solutions. Seek to increase the economic resiliency, equity, and vibrancy of the CBD through innovative approaches and recommendations that rethink/catalyze commercial, residential, retail, hospitality, cultural, and entertainment uses and civic infrastructure.
Questions for Panel
More specifically, the District asked the panel to explore the following questions:
Optimizing Land Uses • Can and should the role and function of the CBD pivot towards one that embraces
residential through conversions and other opportunities? • How would residential interact with existing and proposed uses in the CBD? Should the
District consider a new commercial district model for the CBD?
Promoting Inclusive Economic Development • Given the changing state of the economy, what does the economic future of the CBD
look like? Which uses and economic activities should the District prioritize in the CBD? • How can the District rethink the current approach and business makeup of the CBD to
be more inclusive? How can the District reduce barriers to entrepreneurship and small business?
• What types or models of business are more inclusive and resilient? Are there interim as well as long term strategies for more equitable entrepreneurship?
Leveraging Public Space Activation and Civic Infrastructure • How can public space, design, and civic infrastructure play a role in supporting vibrancy
in the CBD? What are the specific opportunities?

Briefing Book: Actionable Recovery and Resilience Strategies for Washington, DC’s Central Business District 8
• How can the interaction of public space and infrastructure, including access and mobility, support more equitable spaces and outcomes?
• What are strategies that the District, BIDs, and other stakeholders can explore in order to ensure that the operation of the CBD’s public and civic spaces can be welcoming and celebrate the racial diversity of the city and be inclusive and welcoming to all, including marginalized individuals?
A brief note on the data in this report: the original report was written in October 2020 and used the latest data available at that time. Given the economic changes occurring throughout the COVID-19 public health emergency, OP reviewed the existing data in January 2021 and updated them when changes reflected a change in interpretation. OP did not update data when they seemed in line with the previous data and interpretation. This study area and the District as a whole continue to be dynamic markets, and OP is constantly monitoring and reporting on the economic impacts of the COVID-19 public health emergency to ensure the District’s response and recovery strategies are data-driven and informed.

Briefing Book: Actionable Recovery and Resilience Strategies for Washington, DC’s Central Business District 9
2. OVERVIEW OF STUDY AREA
The District’s CBD is a large commercial district and major regional employment hub with a mix of office, retail, hospitality, and cultural and entertainment uses in the heart of Washington, DC. The CBD consists of 2.6 square miles, bordered approximately by Massachusetts Ave NW and Connecticut Ave NW to the North; North Capitol Street and Louisiana Ave NW to the East; Virginia Ave NW, H St NW bordering the White House, and Pennsylvania Ave NW to the South; and 22nd Ave NW to the West. See Figure 1 below for the specific boundaries of the study area.4
The CBD is composed of two important business improvement districts (BIDs) both founded in 1997: DowntownDC and Golden Triangle. Together, these two BIDs receive their funding from a portion of property taxes within their boundaries, which supports multifaceted place-based economic development.
• The DowntownDC Business Improvement District (BID) is “a private non-profit organization that provides capital improvements, resources and research that keep the BID area clean, safe, economically and environmentally strong and accessible.” DowntownDC "encompasses a 138-block area of approximately 520 properties from Massachusetts Avenue on the north to Constitution Avenue on the south, and from Louisiana Avenue on the east to 16th Street on the west.”5
• The Golden Triangle BID is a “43-square-block neighborhood that stretches from Dupont Circle to Pennsylvania Avenue... The primary focus of the BID is to provide a clean, safe, and vibrant environment within this remarkable neighborhood, and to retain and attract businesses to the Golden Triangle.”6
Note on the study area’s geography: the panel’s geographic area of focus is the CBD, which is mostly composed of the DowntownDC and Golden Triangle BIDs. For long-range planning, the CBD is included in but does not account for the entire geography of the Central Washington Planning Area, which is one of the ten Planning Areas used in the District’s Comprehensive Plan. The study area also includes a very small portion of the Northwest Planning Area. Because the data available vary by specific geography, this report notes specific geography when data is provided.
4 The study area consists of fourteen census block groups: tract 55, block groups 1, 3, 4, and 5; tract 58, block groups 1 and 2; tract 59, block group 1; tract 101, block groups 1 and 2; tract 107, block groups 1 and 2; and tract 108 block groups 1, 2, and 3. 5 https://www.downtowndc.org/who-we-are/ 6 https://goldentriangledc.com/about-us/

Briefing Book: Actionable Recovery and Resilience Strategies for Washington, DC’s Central Business District 10
Figure 1: CBD Study Area
Source: DC Office of Planning, 2020.
Demographics
The population of the study area within the CBD is 21,425 residents. The study area contains 9,802 households, with an average household size of approximately 1.6. The area is less racially diverse than the District as a whole, with 70% of the population identifying as White, 13% as Asian, and 11% as Black. In comparison, the District’s population includes 47% of residents identifying as Black, 41% as White, and 4% as Asian. Of the residents in the CBD, 9% identify as Hispanic or Latino, compared to the 11% of the District’s residents who identify as Hispanic or Latino.
The median household income of the study area is higher than the District, at $90,443 compared to $82,604. Educational attainment in the study area is also higher than the District as a whole, with 82% of CBD residents over 25 years of age holding a Bachelor’s degree or above, compared to 58% in the entire District. While the median age of the CBD (30.7) is only slightly lower than the District’s median age (33.9), only 3% of the CBD’s population are children under 18 and 8% are adults over 65, compared to 18% and 12% in the District, respectively.7
The population of the study area within the CBD is 21,425 residents. The study area contains 9,802 households, with an average household size of . The area is less racially diverse than the District as a whole, with 70% of the population identifying as White, 13% as Asian, and 11% as Black. Of the residents in the CBD, 9% identify as Hispanic or Latino.
7 U.S. Census ACS 2014-2018, 5-year estimates

Briefing Book: Actionable Recovery and Resilience Strategies for Washington, DC’s Central Business District 11
Figure 2: Employment in the CBD by Sector
Source: US Census, LEHD LODES, 2017. DC Office of Planning.
Of the total workers in the CBD, 56% are held by persons identifying as White and 33% are held by persons identifying as Black, compared to 51% and 38% respectively in the District as a whole. The share of jobs held by persons identifying as Asian (8%), two or more races (2%), and Hispanic or Latino (10%) is comparable to the share of workers in the District as a whole. Jobs in the CBD held by workers with various levels of education attainment are similar in the CBD and the District. There are slightly fewer jobs held by workers with less than a high school education in the CBD, at 14% compared to 16% in the District, and slightly more jobs held by workers with a Bachelor’s Degree or Advanced Degree at 40% compared to 36% in the District.8
Land Use & Development Patterns
Central Washington Planning Area
The CBD is primarily within the Central Washington Planning Area, a geography used by the DC Office of Planning for long-range planning including the Comprehensive Plan. It should be noted that a very small portion, approximately 10 buildings, of the CBD falls within the Near
8 US Census, Longitudinal Employer-Household Dynamics Origin-Destination Employment Statistics (LEHD LODES), 2017.
29%16%
12%10%
7%5%
4%4%
4%2%2%
2%1%
1%1%1%
0% 5% 10% 15% 20% 25% 30% 35%
Professional, Scientific, and Technical ServicesOther (Except Public Administration)
Accomodation and Food ServicesAdministrative and Support and Waste Management…
Public AdministrationEducational Services
InformationHealth Care and Social Assistance
Finance and InsuranceReal Estate and Leasing
Retail TradeArts, Entertainment, and Recreation
ConstructionTransportation and Warehousing
Wholesale TradeManagement of Companies and Enterprises
Percentage of Each Sector

Briefing Book: Actionable Recovery and Resilience Strategies for Washington, DC’s Central Business District 12
Northwest Planning Area. The following information is excerpted from the Central Washington Element in the Mayor’s proposed Comprehensive Plan.9
“Planning for this area is done collaboratively with the federal government, with the National Capital Planning Commission having land use authority over federal lands. Central Washington includes the city’s traditional Downtown and other employment centers, it includes Gallery Place and Penn Quarter, the region’s entertainment and cultural center, and recently emerging neighborhoods like Mount Vernon Triangle and NoMa. A majority of the area is within Ward 2, with portions also in Ward 6. All of Central Washington is within the boundary of the 1791 L’Enfant Plan and its streets, land uses, and design reflect this legacy.
Compared to the other nine Planning Areas in the city, Central Washington contains much higher percentages of commercial, mixed-use, and federal land. Commercial and mixed-use land represents 14.6% of the total. Non-park federal land also represents 19.9% of the total. Much of this land is also developed with offices, but the owner and occupant is the federal government.
Approximately 33 percent of the Planning Area consists of transportation rights-of-way. One-quarter of the land area is parks, recreation, and open space, and the portion allotted for this is slightly higher than Washington, DC’s total of 22.7 percent. Much of the open space is contained within the National Mall, and almost all of the remainder comprises federal reservations managed by the National Park Service (NPS). The federal open space has significant programming restrictions, limiting its use for local purposes and District activities. Residential land (land that is only residential and not mixed-use) comprises just 1.7 percent of the Planning Area. Almost all of this acreage consists of mid- to high-rise apartments, with average densities exceeding 100 units per acre. The area features this low percentage because most residential developments in Central Washington also include non-residential uses within their buildings, making them mixed-use developments, which are counted under the commercial and mixed-use category.”
Modern planning for a “living” vibrant downtown first took shape with the Living Downtown vision document and the Downtown Plan in the 1980s and continued with the Downtown Action Agenda in 2001. These documents set goals for residential development, arts, retail and preserving important historic assets. Chief among the Downtown Action Agenda’s objectives was to maximize and concentrate downtown housing by developing approximately 12,500 units in the area Downtown between the I-395 and 14th NW to the east and west and M Street and Pennsylvania Avenue to the north and south.10 Another key objective was to increase the vitality of street life and improve the urban design setting of the area to facilitate lively, pedestrian-oriented spaces.
9 https://plandc.dc.gov/sites/default/files/dc/sites/Comprehensiveplan/publication/attachments/Chapter%2016_Central% 20Washington_April2020.pdf 10 https://planning.dc.gov/sites/default/files/dc/sites/op/publication/attachments/Downtown%20Action%20Agenda% 20Compiled_web.pdf

Briefing Book: Actionable Recovery and Resilience Strategies for Washington, DC’s Central Business District 13
Land Use
Within the proposed Comprehensive Plan’s Future Land Use Map (FLUM), a majority of the land in the CBD is Commercial-High Density (CHD), as shown in Figure 3. Also present in the FLUM are parcels of Federal (FED) land and Parks, Residential High-Density (RHD), Institutional (INST), and Recreation, and Open Space (PROS) land.11 More information on the Future Land Use Map and General Policy Map can be found on the Plan DC website.12
Figure 3: Study Area Future Land Use & Legend of Future Land Use Categories
Source: DC Office of Planning, 2020.
Currently, the CBD’s zoning is comprised of a series of dedicated Downtown Zones, as shown in Figure 4 below. According to the DC Zoning Regulations, “the purposes of the Downtown (D) zones (D-1-R, D-2, D-3, D-4, D-4-R, D-5, D-5-R, D-6, D-6-R, D-7, and D-8) are to provide for the orderly development and use of land and structures in areas the Comprehensive Plan generally characterized as:
• Central Washington; or • Appropriate for a high-density mix of office, retail, service, residential, entertainment,
lodging, institutional, and other uses, often grouped into neighborhoods with distinct identities.
The Downtown Zone aims to create a balanced mixture of land uses by providing incentives and requirements for retail, residential, entertainment, arts, and cultural uses the Comprehensive
11 https://plandc.dc.gov/page/future-land-use-map-and-generalized-policy-map 12 https://plandc.dc.gov/page/future-land-use-map-and-generalized-policy-map

Briefing Book: Actionable Recovery and Resilience Strategies for Washington, DC’s Central Business District 14
Plan identifies as essential to a successful downtown, and by guiding and regulating office development.”13 One important note of the Downtown Zone is that residential development is allowed by-right, incentivized through additional density provisions, and actually required in certain areas.
Figure 4. Downtown Zone District
Source: DC Office of Zoning, 2020.
More information on the Downtown Zones can be found on the DC Office of Zoning’s Interactive Zoning Map.14
Zoning Tools
The goals of the Living Downtown concept were implemented through zoning changes that created the Downtown Development District (DD), which used several innovative tools to promote a mix of uses to counter market forces which result in higher land values for office developments and minimize the presence of other uses and the vibrancy they bring. This was particularly true of tools used to stimulate residential development within three defined areas in the eastern portion of the ULI study area by attempting to balance the economics of residential and non-residential development. Tools included requirements for a minimum amount of housing in each new building within these downtown “neighborhood” areas, but allowed the residential and other preferred use requirements to be transferred and aggregated to individual sites through a tool called Combined Lot Development. This allowed for the
13 https://dcgis.maps.arcgis.com/apps/MapJournal/index.html?appid=ae5830535a384a7f9ae40527f607b32e§ion=7. 14 https://dcgis.maps.arcgis.com/apps/MapJournal/index.html?appid=ae5830535a384a7f9ae40527f607b32e§ion=7.

Briefing Book: Actionable Recovery and Resilience Strategies for Washington, DC’s Central Business District 15
housing goals to be met while giving developers flexibility to have a single primary use in each building. Zone names in Figure 4 above that end in “R” indicate there is a requirement for housing as a part of any development. The third major tool to balance the economics were Transferable Development Rights that incentivized preferred uses such as housing, arts, and retail by enabling them to generate additional density rights and then sell that bonus density to enable office buildings to have more square footage than would otherwise be permitted.
The tools, first implemented in the 1990s, were revised in 2001 when in addition to Combined Lot Development and Transferable Development Rights, residential was relieved of Floor Area Ratio (FAR) restrictions, have been very successful in supporting residential development in the Downtown Development District. Since 2001, over 10,000 units of housing have been developed in the Downtown Development District, concentrated primarily in the areas where residential uses were incentivized: Penn Quarter, Chinatown, Mount Vernon Square, and just outside of the Downtown BID in the Mount Vernon Triangle and its fringes. There are now 12,999 residential units in the Downtown Development District, according to data from CoStar.
As a measure of these tools’ success, as part of the District’s 2016 Zoning Review & Revision (ZR16) process, the Downtown Development District was expanded and renamed Downtown Zones. Combined Lot Developments and the Transferable Development Rights mechanisms were combined into one tool called Housing Credits, and the areas where Credits could be employed were expanded from the eastern portion of the ULI study area to the broader area of Central Washington seen in the map within Figure 4. The construction of more than the required amount of housing could generate credits that could then be traded to office developments seeking additional density within the same Credit Trade Area where the extra housing was constructed. ZR16 also largely relieved housing of FAR restrictions throughout Downtown. In many zones, residential density was limited only by the height restrictions of the 1910 Height Act. However, ZR16 did not apply any outright residential requirements on any of the D Zone expansion areas. Only 82 units have been added in the western portion of the CBD study area, since ZR16 took effect in that area of Downtown, and only one unit was within the D zone of the CBD study area.

Briefing Book: Actionable Recovery and Resilience Strategies for Washington, DC’s Central Business District 16
Governance
Governance in the CBD is primarily under local control, but there are some federal assets within the study area under federal control, including both federal buildings and public parks. More information on the structure of the Government of the District of Columbia is included below.
District Government Structure
The following information on the District’s governance structure comes from the DC City Administrator website.15
The District of Columbia Government consists of three branches of government: Executive, Legislative, and Judicial. The current form of government was established by the District of Columbia Home Rule Act in 1973. Although local officials have the authority to pass laws and govern local affairs, the United States Congress maintains the power to overturn local laws. Furthermore, unlike any other jurisdiction in the country, residents of the District of Columbia are not represented by voting members of the United States Congress.
Executive Branch
The executive branch is governed by an elected Mayor who serves a 4-year term. The Mayor has the sole authority and responsibility for the daily administration of the District government. The City Administrator is appointed by the Mayor and is responsible for the day-to-day management of District government agencies, setting operational goals and implementing the legislative actions and policy decisions of the Mayor and DC Council.
The current organization of the District government also includes four Deputy Mayors who, reporting through the City Administrator, manage the day-to-day operations of agencies within a defined cluster.
Although most District agencies report directly to the Mayor, some agencies are independent or classified as regional bodies. For example, the Office of the Chief Financial Officer is an independent agency (an arrangement that is unique to the District government).
Legislative Branch
The legislative branch consists of a 13-member Council. The Council of the District of Columbia includes one Member from each of the District’s eight wards, four At-Larger Members, and a Council Chairman. Members of the Council serve 4-year terms on a
15 https://oca.dc.gov/page/dc-government-organization

Briefing Book: Actionable Recovery and Resilience Strategies for Washington, DC’s Central Business District 17
staggered election cycle. Like any legislative branch, the Council passes laws, approves the District’s budget, and is responsible for general oversight of the executive branch.
The Legislative Branch also consists of 41 Advisory Neighborhood Commissions. ANC’s represent a small sub-set of each Ward in the city, thereby having the closest official ties to the people in a neighborhood. ANC’s present their positions and recommendations on issues to various District government agencies, the Executive Branch, and the Council. They also present testimony to independent agencies, boards, commissions, and Federal agencies.
Judicial Branch
The judicial branch consists of the court system and a handful of boards and commissions that support the court system. The Superior Court of the District of Columbia is the local trial court. The Superior Court consists of a chief judge and 61 associate judges that hear cases involving criminal and civil law. The District of Columbia Court of Appeals is the highest court and is similar to a state supreme court. The Court of Appeals consists of a chief judge and eight associate judges. All judges in the District of Columbia are appointed by the President of the United States and confirmed by the US Senate.
Relationship with Federal Government: The Home Rule Act
The following information on the relationship with the federal government comes from the DC Council website.16
The Home Rule Act is the result of the ongoing push by District residents for control of their own local affairs. The existing local government is the most expanded form of self-government since the establishment of the District as the seat of the federal government. Under the Home Rule government, however, Congress reviews all legislation passed by the Council before it can become law and retains authority over the District’s budget. Also, the President appoints the District’s judges, and the District still has no voting representation in Congress. Because of these and other limitations on local government, citizens continue to lobby for the authority held by all 50 states.
National Capital Planning Commission
The National Capital Planning Commission has oversight over the federal land in the CBD and creates broad-based policies intended to ensure consistent, coordinated development of federal facilities within the National Capital Region.17 The following information comes from the National Capital Planning Commission Website.18
16 https://dccouncil.us/dc-home-rule/ 17 https://www.ncpc.gov/about/authorities/ 18 https://www.ncpc.gov/about/

Briefing Book: Actionable Recovery and Resilience Strategies for Washington, DC’s Central Business District 18
Established by Congress in 1924, the National Capital Planning Commission (NCPC) is the federal government’s central planning agency for the National Capital Region. Through planning, policymaking, and project review, NCPC protects and advances the federal government’s interest in the region’s development. The Commission provides overall planning guidance for federal land and buildings in the region by reviewing the design of federal and certain local projects, overseeing long-range planning for future development, and monitoring capital investment by federal agencies.
The 12-member Commission represents federal and local constituencies with a stake in planning for the nation’s capital. The President of the United States appoints three citizens, including the chair. At least one presidential appointee must reside in Virginia and another in Maryland while the third is at-large. The Mayor of the District of Columbia appoints two citizens. Both must be Washington, DC residents. Remaining members are ex officio, who typically appoint alternates to represent them at Commission meetings. These are: The Mayor of the District of Columbia, The Chair of the Council of the District of Columbia, Heads of the three executive branch agencies with significant land holdings in the region, Leaders of the U.S. House and Senate committees with oversight responsibility of Washington, DC.
Regional Cooperation
This information on regional cooperation comes from the Metropolitan Washington Council of Governments’ website.19
The District is also actively engaged with the Metropolitan Washington Council of Governments (COG). COG is an independent, nonprofit association, with a membership of 300 elected officials from 24 local governments, the Maryland and Virginia state legislatures, and U.S. Congress. Every month, more than 1,500 officials and experts connect through COG to share information and develop solutions to the region’s major challenges. The Board of Directors is COG’s governing body and is responsible for its overall policies. In addition, a wide network of city and county managers, police and fire chiefs, housing and planning directors, environmental experts, public health officials, transportation planners, and more coordinate through COG’s committees.
19 https://www.mwcog.org/about-us/cog-and-our-region/

Briefing Book: Actionable Recovery and Resilience Strategies for Washington, DC’s Central Business District 19
3. PANEL FOCUS AREAS
Due to the highly interconnected nature of the CBD’s sectors and the exacerbated impacts of the COVID-19 public health emergency on virtually all of the economic activity within the study area, the District wanted the ULI panel to consider the following sectors when examining opportunities for an equitable recovery in the CBD: economic development; commercial markets including the office market, hotel market, and retail market; residential markets; small businesses; and arts, culture, and entertainment. In addition, the District also wanted the panel to consider the role of public spaces, creative public space activation, urban design, and civic infrastructure such as transportation in ensuring the vibrancy of the CBD as a whole.
Each focus area section below includes information on trends for the District and CBD both before and during the public health emergency; key graphs and data; and key challenges and opportunities for the panel to consider.
Equity and Inequity in the CBD
As mentioned previously, the COVID-19 public health emergency has exposed existing inequities in the CBD and drawn attention to potential opportunities to increase equity in the CBD and the District as a whole. The District wishes to seek opportunities to advance equity in all its forms including racial, social-economic, and gender equity and focus on creating opportunities to ensure all residents, businesses, and workers in the CBD have what they need to thrive. There are several notable areas where equity could be deepened in the CBD that are mentioned throughout this report including affordable housing and increased housing opportunities, small business development and sustainability, safe, inclusive, and healthy public spaces, and affordable transportation access.
Economic Development
The CBD contains a mix of land uses, economic sectors, and core industries that help promote the District as a world-class city and vibrant regional and national economic hub. This section highlights key economic development indicators and high-level trends during the public health emergency for the District including employment, consumer spending trends, local revenue sources, and changes in tourism.
Employment
The COVID-19 public health emergency has caused significant job losses in the District. In February 2019, before the pandemic, the District had approximately 800,000 total jobs and an unemployment rate of 5.1%. In April 2020, the unemployment rate had reached a historic high of 11.7% - the previous peak had been in 11.2% in 1983. Through the summer and fall of 2020,

Briefing Book: Actionable Recovery and Resilience Strategies for Washington, DC’s Central Business District 20
the District’s unemployment rate fell steadily to 7.5% in November; however, about 50,000 jobs had been lost since February 2020, according to data from the Bureau of Labor Statistics.20
Within the CBD, employment losses during the public health emergency have been concentrated among Leisure and Hospitality Sector jobs, stemming from the reduced demand of workers commuting to the area and resulting in an outsized impact on lower-income households. In a report from the DowntownDC BID, “employment was an estimated 179,700 as of June 2020, down from 188,600 at the end of 2019 —a decline of 8,900 jobs… primarily due to closures and lower sales levels at hotels, restaurants, stores, theatres and performance venues, the Walter E. Washington Convention Center and Capital One Arena.” DowntownDC’s employment base continued to be primarily office workers. “While most of these workers are not working at their offices, they are still employed.” As of 2019 in the Golden Triangle, approximately 8% of the jobs were in the Hospitality, Food, and Retail sectors, and there were about 250 retail establishments and 230 dining and drinking establishments in the BID. 21 While many of the jobs held by office workers within the CBD have not been significantly impacted, remote work for those workers has had cascading effects on the local retail, food, and arts, culture, and entertainment businesses and employees who relied on those workers for their support. This dynamic and the impact on workers and businesses is explored further in sections below.
Looking ahead to the District’s future employment, the Office of the Chief Financial Officer (OCFO) predicts that while the District’s fiscal recovery will likely occur in 2022, it will be much longer, potentially even a decade or more, for a complete recovery of jobs, corporate debt, and national debt, among other economic indicators. According to a revised revenue estimate in December 2020, the DC OCFO expects job growth to “decline 3.0 percent in FY 2020 and an additional 1.8 percent in FY 2021 as public health restrictions continue through 2021. A rebound of 3.1 percent growth in FY 2022 and 2.0 percent in FY 2023 brings jobs in DC back up to 2019 levels.”22
Consumer Spending within the District
The effect of COVID-19 on retail and consumer spending has been particularly severe, as shown in Figure 5 below, with the District experiencing greater negative impacts to consumer spending compared to the national average across every consumer category except for grocery. Compared to January 2020, total consumer spending in October 2020 was down 21.7% in the District, according to data from Opportunity Insights.23 The lowest level of consumer spending occurred at the end of April 2020 when total consumer spending was half (48.7%) that of January 2020 levels, and the District experienced a sustained period between the end of March and the end of June where the total consumer spending remained lower than 30% of January levels. Between January 2020 to October 2020, the District has persistently had the highest or among the highest declines in consumer spending in the nation in several categories: transportation (-69.6%),
21 https://www.downtowndc.org/wp-content/uploads/2020/08/DowntownDC-Economic-Update-Q2-2020-v2.pdf 22 https://cfo.dc.gov/sites/default/files/dc/sites/ocfo/publication/attachments/Revenue%20Estimate%20Letter%20093020.pdf 23 https://www.tracktherecovery.org/

Briefing Book: Actionable Recovery and Resilience Strategies for Washington, DC’s Central Business District 21
restaurants and hotel (-48.1%), and entertainment and recreation (-49.7%). Much of the significant decrease in spending in these categories is a consequence of the District’s position as a major employment location at the center of a multi-state metropolitan region, as well as the city’s status as a major leisure and business travel destination. The impact of consumer spending on specific sectors is explored further in the following sections.
Figure 5: Percent Change in Total Consumer Spending in the District
Source: Opportunity Insights, Economic Tracker, 2020.
Economic Impact of Visitors
Over the past decade, the District has continuously seen growth of the number of visitors. Since the onset of the COVID-19 public health emergency, the loss of visitors including tourists has been devastating to many District businesses and employees. In September 2020, according to Destination DC and Tourism Economics, “visitor spending [in the District] was down 83 percent, or $5.6 billion, for March 8-August 22, 2020 compared to 2019.” In addition, “there have been 42 cancellations [of large events] to date, resulting in a $422 million total loss, not including in-hotel meetings and leisure groups.”24 Projections from Destination DC show that the District’s domestic visitor volume for 2020 is projected to decline by more than half the 2019 volume, down from 22.8 million in 2019 to just 11 million in 2020, but then bounce back to approximately 17 million in 2021 and 20 million in 2022.25
Visitors impact several commercial sectors including hotels, food and hospitality, and arts, culture, and entertainment, and it will be critical for the District and the CBD to strategize on how to attract nearby visitors from the 50 million people who live within a four-hour drive from DC, extending to areas including Raleigh, North Carolina, New York City, New York, and Pittsburgh, Pennsylvania.
24 https://washington.org/destination-dc-releases-washington-dcs-visitation-numbers-and-forecast-discusses-industry-resiliency 25 https://washington-org.s3.amazonaws.com/s3fs-public/washington_dc_hotel_visitor_forecast_2020-2022.pdf

Briefing Book: Actionable Recovery and Resilience Strategies for Washington, DC’s Central Business District 22
Consumer Spending and Visitors within the CBD
An analysis conducted by DMPED using Replica data and Mastercard Point of Sale (POS) Average Spend Index data through the public health emergency indicates that both consumer spending and visitors in the CBD have decreased significantly since February 2020. In September, the CBD attracted 2.7 million trips and experienced an Average Spend Index of 935. These figures are both 72% below February 2020 (pre-COVID) levels when the CBD attracted over 9 million trips (3.3 million from Maryland, 3.1 million from Virginia, 2.8 million from within DC) and experienced an Average Spend Index of 3,300. Both total trips to the CBD and Average Spend Index hit a low point in April 2020, when the CBD attracted only 1.56 million trips with an accompanying Average Spend Index of 726. These figures represent significant declines of 83% and 78%, respectively, from February 2020’s (pre-COVID) levels. See Figure 6 and Figure 7 below for change in trips to the CBD and Average Spend Index over time.
Figure 6: Consumer Trips and Average Spend Index Within the CBD
Feb 2020 Apr 2020 Jul 2020 Aug 2020 Sep 2020
Trips to CBD by Origin
DC 2,800,000 500,000 900,000 960,000 1,000,000
MD 3,300,000 600,000 900,000 900,000 980,000
VA 3,100,000 600,000 600,000 670,000 730,000
Total 9,000,000 1,560,000 2,490,000 2,500,000 2,700,000
Change since Feb 2020
N/A -83% -72% -72% -70%
Average Spend Index
Average Spend Index
3,300 726 1,000 935 Data not available
Change Since Feb 2020
N/A -78% -69% -72% Data not available
Source: Office of the Deputy Mayor for Planning and Economic Development (DMPED) analysis of Replica DC, VA & MD data, 2020, made available by the Office of the Chief Technology Officer. Note: DMPED no longer has access to the spend data for the CBD and other specific areas. Please reach out to DMPED if you are interested in learning more.

Briefing Book: Actionable Recovery and Resilience Strategies for Washington, DC’s Central Business District 23
Figure 7: Average Spend Index and Trips Within the CBD – February to August 2020
Source: Office of the Deputy Mayor for Planning and Economic Development Analysis of Replica DC, VA & MD data, 2020, made available by the Office of the Chief Technology Officer.
Revenue in the District: FY20 through FY24
The District’s 2020 revenues have been impacted by the public health emergency, although not as severely as first projected in April 2020. In December 2020, the DC OCFO revised revenue estimates for Fiscal Years 2020 to 2024 to reflect changes from the April 2020 and September 2020 estimate and highlighted the impact of the public health emergency on different types of revenue.26
• Sales tax revenue has been hardest hit during the public health emergency. The tax revenue generated by the hospitality sector – hotels and restaurants – declined 46 percent in FY 2020. Sales tax revenue declined 23.5 percent in FY 2020, and gross sales tax revenue in FY 2021 is forecasted to decline 9 percent before rebounding 27 percent in FY 2022. Full recovery to FY 2019 levels of sales tax revenue is not expected to occur until FY 2024.
• Real property tax revenue collections have not been as impacted as expected, and the collection rate in FY 2020 was similar to that of 2019. Real property tax revenue is
26 https://cfo.dc.gov/sites/default/files/dc/sites/ocfo/publication/attachments/Revenue%20Estimate%20Letter%20093020.pdf

Briefing Book: Actionable Recovery and Resilience Strategies for Washington, DC’s Central Business District 24
expected to decline 0.1 percent in FY 2021 and 1.0 percent in FY 2022 and then fully recover to FY 2020 levels by FY 2023.
• Income tax revenue has performed relatively well, despite significant job losses in the hospitality and retail sectors. Income tax revenue from individuals and businesses grew 5.5 percent in FY 2020 and is projected to be unchanged in FY 2021 with an increase of 3.4 percent in FY 2021.
• Deed tax revenue has been impacted, with a greater impact on commercial properties than residential properties and an estimated longer time frame for the recovery. Deed tax revenue declined almost 20 percent in FY 2020 and is projected to grow 2.7 percent in FY 2021; however, deed tax collections are not expected to fully recover until FY 2023 and may be further at risk with significant square feet in office market and multifamily housing being delivered to the market during a period of high vacancy rates.
• Finally, non-tax revenue declined 15.6 percent and are expected to continue to decline, with the largest reductions from building permits, for-hire vehicle fees, and traffic fines.
Predictions for a Return to Work
The safe return of office workers to the District, and specifically to the CBD, will be crucial for the CBD’s businesses, but recent data and projections indicate that the return might extend to summer/fall 2021. An August 2020 Greater Washington Partnership survey of employers in the Capital Region (composed of DC, Baltimore, and Richmond) found that approximately 72% of employers with long-term reopening plans expect to have their employees return to the office by summer 2021 while one-third still are unsure of their summer 2021 plans. Even after a return to the physical office, nearly half of the organizations surveyed said that they expect “at least 10% of their workforce to telework permanently.”27 Another survey conducted in June 2020 by the National Capital Region Transportation Planning Board (TPB) found that more than half (57%) of work sites surveyed expect to see a long-term increase in teleworking, with 20% believing that they will continue teleworking at the current pandemic level and another 37% believing that they will have increased teleworking post-pandemic.28 The increase in permanent teleworking will likely mean that fewer workers will be concentrated in the CBD on a given work day, impacting demand for services and activities within the CBD.
Key Challenges and Opportunities
Key Challenges • The disparate impact of job losses across sectors has significant equity implications. Job
losses were concentrated in low-wage jobs across the Leisure and Hospitality Sector. • Similar to state and local governments across the country, the District is operating with
constrained revenue and is projected to remain impacted for several fiscal years in the future.
27 https://www.greaterwashingtonpartnership.com/capital-covid-snapshot/ 28 https://www.mwcog.org/newsroom/2020/09/16/regional-surveys-explore-covid-19-impact-on-telework-commuting--telework-commuter-connections/

Briefing Book: Actionable Recovery and Resilience Strategies for Washington, DC’s Central Business District 25
• The District’s role as the nation’s capital, the center of a metropolitan region, and a major business and leisure travel destination present vulnerabilities to changes in demand for visitor travel. While the number of visitors in the District is below normal levels, the city will experience a reduction in consumer spending that is likely to be concentrated in and near the CBD.
Key Opportunities • The District has a once-in-a-generation opportunity to reimagine the configuration of
the CBD and including the balance of land uses, which could include more housing serving a wide range of incomes. This conversation should include a discussion of the types of employment opportunities in the CBD and implications for the workforce. These opportunities are further described in each section below.

Briefing Book: Actionable Recovery and Resilience Strategies for Washington, DC’s Central Business District 26
Commercial: Office Market
The CBD’s office market dominates the land use within this area, which both makes it an attractive place to conduct business and creates vulnerability from a reliance on the physical presence of office workers and the dominance of office sector uses, particularly office buildings with large floor plates. In addition to the government as well as Professional and Business Services workers who occupy CBD office buildings, the office market directly employs thousands of workers who support the functions of the office buildings including security, cleaning staff, and maintenance and other building staff and who have been impacted by the changes to remote work. This section highlights key economic development indicators and high-level trends with the office market including vacancy, rent, and the impact of new supply coming to the market.
The District has a robust office market, fueled both by the presence of the federal government and a private office sector. The study area’s office market is the largest in the District, composed of what traditional submarket analyses refer to as the East End submarket, the West End submarket, and the traditional CBD submarket. The CBD’s total office market is 97.9 million square feet. As shown in Figure 8 below, approximately 57.7% of the total office market is Class A, with 13.1% of that total as Trophy Class A; 39.6% of the total market is Class B; and a very small amount, just 2.7%, is Class C.
Figure 8: CBD Office Market Inventory
Class Type Inventory (square feet) Percentage of total
Class A Total 56.5 million 57.7%
Class A: Trophy 12.8 million 13.1%
Class B 38.8 million 39.6%
Class C 2.6 million 2.7%
Total 97.9 million 100%
Source: CoStar Data, 2020, DC Office of Planning.
While the District’s office market is robust, it had high vacancy rates prior to the public health emergency, as shown in Figure 9 below. The overall office vacancy rate in the District has increased for the past nine straight quarters.29 In addition, expansion in competitive supply in nearby submarkets outside the District, such as Arlington, Tysons, and Bethesda, has increased downward pressure on the District and CBD occupancy.30
The CBD's office market has been sluggish in absorbing new supply to the market. In Q4 2019, before the public health emergency, the CBD’s overall vacancy rate was 14.0%, and the
29 https://www2.colliers.com/en/research/washington-dc/washington-dc-office-report-q3-2020 30 https://www.us.jll.com/content/dam/jll-com/documents/pdf/research/q3-2020-office-insights/Washington-DC-Office-Insight-Q3-2020.pdf

Briefing Book: Actionable Recovery and Resilience Strategies for Washington, DC’s Central Business District 27
submarket had seen vacancy rates above 10.0% for the past five years. The CBD’s vacancy rate has been higher than the District’s average for the past five years since Q3 2019.
Figure 9: Overall Office Vacancy Rate
Source: CoStar, 2020, DC Office of Planning.
As shown in Figure 10 below, Class A buildings have had the highest vacancy rate in the CBD across all buildings, with a 15.2% vacancy rate in Q4 2019 (pre-COVID). Class B buildings had the next highest vacancy rate increasing over 7.2 percentage points, ranging from 7.5% in Q4 2019 and 14.7% in Q3 2020, and Class C buildings had a much lower vacancy rate and accounted for much less supply.
New supply to the market and existing older and unused office space in the CBD have generated rising vacancy rates and minimal rent growth, according to a 2019 DowntownDC BID report. In addition, the CBD faces competition from other submarkets within the District, and while the District continues to retain office tenants and attract new ones, some tenants have moved to the new markets in NoMa and Southwest DC.31 As of 2018, the Golden Triangle BID had approximately 230 office buildings in the BID representing one-tenth of the District’s office properties. The properties under development primarily represent a shift from Class B office to Class A and Trophy office space, with an emphasis on supplying “more flexible, modern spaces.”32
31 https://www.downtowndc.org/wp-content/uploads/2020/05/SOD2019.pdf 32 https://goldentriangledc.com/initiative/real-estate/
5%
7%
9%
11%
13%
15%
17%
QTD
'20
Q2
'20
Q4
'19
Q2
'19
Q4
'18
Q2
'18
Q4
'17
Q2
'17
Q4
'16
Q2
'16
Q4
'15
Q2
'15
Q4
'14
Q2
'14
Q4
'13
Q2
'13
Q4
'12
Q2
'12
Q4
'11
Q2
'11
Q4
'10
Q2
'10
DC CBD

Briefing Book: Actionable Recovery and Resilience Strategies for Washington, DC’s Central Business District 28
Figure 10: Office Vacancy Rate by Class Type in the CBD
Source: CoStar, 2020, DC Office of Planning.
Office rents per square foot in the District had been experiencing a gradual increasing trend over time. As shown in Figure 11 below, between Q4 2019 and Q3 2020, office asking rents per square foot had increased approximately 1%. In the previous year, between Q4 2018 and Q4 2019 rents had increased approximately 2%. Since Q1 2010, asking rents per square foot for office in the CBD have been slightly higher than compared to the District as a whole, with an average difference of approximately 1% between Q1 2018 and Q4 2019.
Figure 11: Office Asking Rent per Square Foot - DC and CBD
Source: CoStar, 2020, DC Office of Planning.
0%
2%
4%
6%
8%
10%
12%
14%
16%
18%
QTD
'20
Q2
'20
Q4
'19
Q2
'19
Q4
'18
Q2
'18
Q4
'17
Q2
'17
Q4
'16
Q2
'16
Q4
'15
Q2
'15
Q4
'14
Q2
'14
Q4
'13
Q2
'13
Q4
'12
Q2
'12
Q4
'11
Q2
'11
Q4
'10
Q2
'10
Class A Class B Class C

Briefing Book: Actionable Recovery and Resilience Strategies for Washington, DC’s Central Business District 29
The federal government’s presence plays an important role in sustaining and stabilizing the District’s office market and within the CBD. According to a Q3 2020 report from CBRE, the “GSA signed five leases in Q3 2020” in the District and together with District government leasing, “the government sector accounted for 45% of all Q3 leasing activity.” Several notable leases happened in the CBD during Q3 2020 including the GSA Federal Reserve renewal (319,000 square feet), the GSA Secret Service renewal (74,234 square feet), and Texas A&M University’s new lease (47,418 square feet).33
Impacts of COVID-19
COVID-19 has exacerbated pressures on the District’s and CBD’s office market. In the third quarter of 2020, the District posted the highest direct vacancy rate on record at 12.8%, which was slightly higher than the previous record of Q2 2020 at 12.3%, according to CoStar. The District “experienced its fourth consecutive quarter of occupancy loss of 177,000 square feet of negative absorption in Q3 2020, bringing year-to-date contraction to 779,000 square feet.”34 For the first time since the second quarter of 2017, all three classes of office buildings (Class A, Class B, and Class C) in the District registered slightly negative absorption.35 A leading factor in the office market’s negative absorption is intense uncertainty about how coworking companies, a primary driver of office demand in recent years, will weather the public health emergency and economic challenges.
Since the public health emergency hit in March 2020, as shown in Figure 9 above, the District’s average office vacancy rate was 12.8%. Within the CBD, the Q3 2020 overall vacancy rate was 15.5%, up 0.6 percentage points from Q2 2020 where the vacancy rate was 14.9%, with Class A and Class B rising throughout the public health emergency. In addition, office asking rents per square foot for the CBD narrowed with the asking rents in the District as a whole (see Figure 11 above), falling slightly from $53.62 per square foot in Q1 2020 to $53.12 per square foot in Q4 2020.
New office market construction has slowed within the CBD and the District as a whole, but “more development starts are anticipated once there is clarity in the market."36 The District has more than 2.7 million square feet under construction in Q3 2020, and the CBD has the most square feet under construction, nearly double that of the next submarkets, Capitol Riverfront and Southwest. In Q3 2020, nearly a million square feet of office space (915,081 square feet) was under construction in the CBD, including more than 482,000 square feet of Trophy Class and 433,000 square feet of Class A.37
Finally, it is not entirely known how many office support workers lost employment during the public health emergency. The Services Employees International Union (SEIU) Local 32BJ, which is the largest property service workers union in the country, noted that “over half of commercial property owners in the D.C. area have not laid off any contracted janitors” but also shared that
33 https://www.cbre.us/research-and-reports/Washington-DC-Office-MarketView-Q3-2020 34 https://www.cbre.us/research-and-reports/Washington-DC-Office-MarketView-Q3-2020 35 https://www2.colliers.com/en/research/washington-dc/washington-dc-office-report-q3-2020 36 https://www2.colliers.com/en/Research/2020-Midyear-Top-25-Office-Markets-Report 37 https://www.cbre.us/research-and-reports/Washington-DC-Office-MarketView-Q3-2020

Briefing Book: Actionable Recovery and Resilience Strategies for Washington, DC’s Central Business District 30
some commercial property owners had laid off over 40% of their janitorial workforce in April 2020.38 More than 3,100 cleaning workers who are members of that union have lost their jobs in the Washington Region, despite local leaders, including Mayor Bowser, urging building owners to not lay off or cut benefits to cleaning staff.39 Information on other support workers is limited, but it is likely that security workers and maintenance staff have also been laid off or faced reduced hours at similar rates.
Key Challenges and Opportunities
Key Challenges • The 2020 election seems to have suppressed leasing activities, especially by government
contractors. It is typical for leasing volume to dip in the year prior to a presidential election, though forced telework and unprecedented governmental instability likely diminished short-term leasing activity at a greater rate. Since 2011, the federal government has reduced its footprint in the District’s office market by approximately 13%, according to a Q3 2020 JLL Research report.40
• Compared to peer markets, traditional users of office market space including government, law firms, and finance and insurance account for a much higher rate of the District’s pre-leasing, according to a Q3 2020 JLL Research report.41
• Growth in Trophy Class office has cannibalized demand from the traditional Class A office market. Class A vacancy in this planning area is likely to reach historic levels over the next two to three years, which will limit demand for upgrading older properties.
• The decline of co-working is likely to slow recovery in the office market, at least in the short-term.
• Traditional office work and the frequency of people physically coming into offices to work will likely change, even after the public health emergency is over, potentially reducing demand for office spaces and accelerating obsolescence for some older buildings.
• The COVID-19 public health emergency has demonstrated for many companies that they were able to successfully continue their operations remotely. Companies have started to question whether they need the same amount of space in premium-priced employment centers going forward. As leases come up for renewal, tenants may demand less office space over time, leading to vacancy, downward pressure on rents.
• Despite high vacancy rates in the office market, the Class A, Class B and Class C office buildings command higher rents per square foot than Class A residential buildings, which make market-driven office to residential conversions unlikely in the short-term.
• Historically, there has been a heavy reliance on public transit for travel to the CBD. It is unclear how employees will choose to travel when they return to work.
38 https://www.seiu32bj.org/press-release/while-most-d-c-commercial-building-owners-keep-essential-janitors-on-the-job-carr-properties-lays-off-40-despite-collecting-over-98-rent-in-april/ 39 https://www.washingtontimes.com/news/2020/jun/21/dc-areas-laid-off-janitors-risk-health-care-loss-s/ 40 https://www.us.jll.com/en/trends-and-insights/research/washington-dc-office-insight 41 https://www.us.jll.com/en/trends-and-insights/research/washington-dc-office-insight

Briefing Book: Actionable Recovery and Resilience Strategies for Washington, DC’s Central Business District 31
Key Opportunities • As more space becomes available, there is an opportunity to rethink the design and
function of office buildings in the CBD. For example, a greater emphasis on flexible spaces that facilitate information sharing and collaboration can leverage the CBD’s leading workforce accessibility by pairing these new facilities with executive offices, high focus work spaces, and short-term work spaces.
• There may be a rise in options for tenants seeking short-term, high quality space as more sublease spaces enters the market. These spaces can help emerging firms take advantage of proximity to decision-makers and attract top talent.
• Office space is likely to serve 3 primary functions looking forward: 1) collaboration and relationship building; 2) private, high focus workspace; and 3) short-term layover space for productivity between meetings. Significantly increasing rates of remote work are a driving factor in how office use is likely to shift. Since more employees will be working from home, central locations are likely to be more important because they afford the greatest workforce access. These trends are likely to be beneficial to the CBD.
• Lower rental rates for office space may increase the CBD’s competitive position in the region.
• The GSA continues to lease space in the CBD and may have a need for additional space depending on the staffing needs of the federal government. As the office market changes, the CBD has the potential to become value and price competitive with other locations in the region. These trends may introduce an opportunity to partner with GSA on its real estate needs by expanding the federal government’s stabilizing presence during a period of uncertainty.
• Strategic engagement with the commercial broker community can quickly inform more strategic planning of the CBD’s office markets by drawing on their data and experience with buyer and seller decision-making processes.
• With increasing office vacancy, there could be a potential to expand institutional uses, such as universities, innovation districts, and corporate partnerships within the CBD, taking advantage of Class B and sublease space.
Briefing Book: Actionable Recovery and Resilience Strategies for Washington, DC’s Central Business District 32
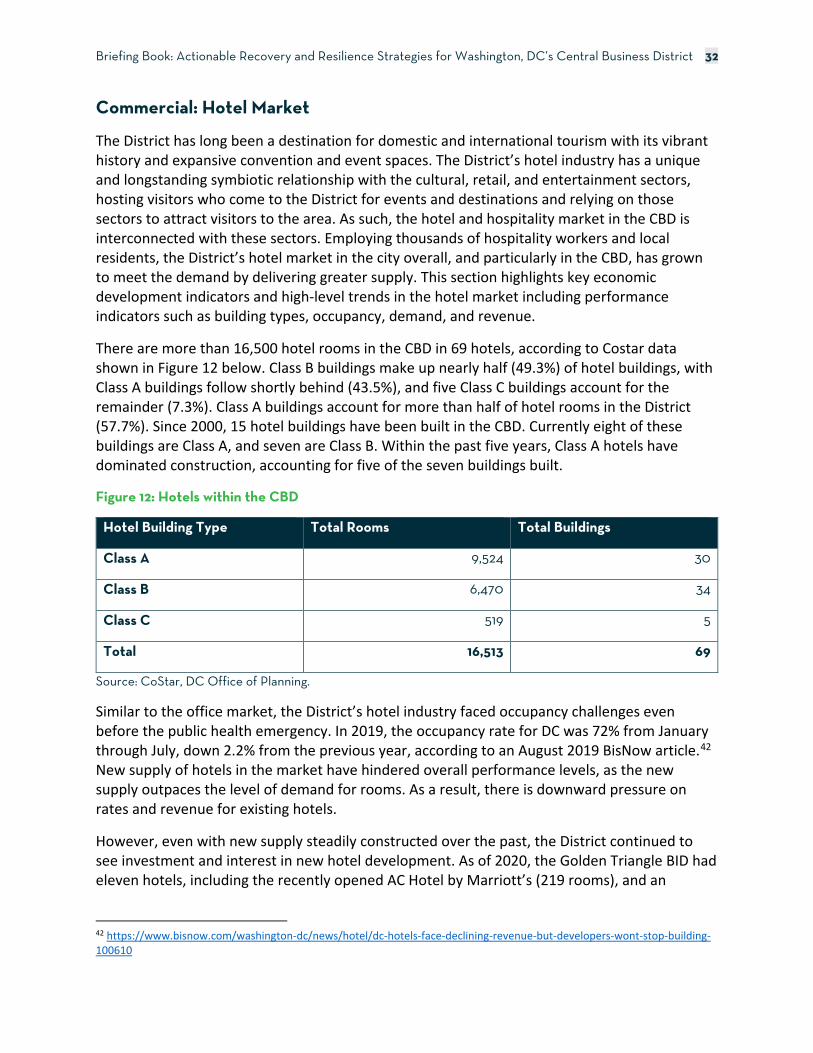
Commercial: Hotel Market
The District has long been a destination for domestic and international tourism with its vibrant history and expansive convention and event spaces. The District’s hotel industry has a unique and longstanding symbiotic relationship with the cultural, retail, and entertainment sectors, hosting visitors who come to the District for events and destinations and relying on those sectors to attract visitors to the area. As such, the hotel and hospitality market in the CBD is interconnected with these sectors. Employing thousands of hospitality workers and local residents, the District’s hotel market in the city overall, and particularly in the CBD, has grown to meet the demand by delivering greater supply. This section highlights key economic development indicators and high-level trends in the hotel market including performance indicators such as building types, occupancy, demand, and revenue.
There are more than 16,500 hotel rooms in the CBD in 69 hotels, according to Costar data shown in Figure 12 below. Class B buildings make up nearly half (49.3%) of hotel buildings, with Class A buildings follow shortly behind (43.5%), and five Class C buildings account for the remainder (7.3%). Class A buildings account for more than half of hotel rooms in the District (57.7%). Since 2000, 15 hotel buildings have been built in the CBD. Currently eight of these buildings are Class A, and seven are Class B. Within the past five years, Class A hotels have dominated construction, accounting for five of the seven buildings built.
Figure 12: Hotels within the CBD
Hotel Building Type Total Rooms Total Buildings
Class A 9,524 30
Class B 6,470 34
Class C 519 5
Total 16,513 69
Source: CoStar, DC Office of Planning.
Similar to the office market, the District’s hotel industry faced occupancy challenges even before the public health emergency. In 2019, the occupancy rate for DC was 72% from January through July, down 2.2% from the previous year, according to an August 2019 BisNow article.42 New supply of hotels in the market have hindered overall performance levels, as the new supply outpaces the level of demand for rooms. As a result, there is downward pressure on rates and revenue for existing hotels.
However, even with new supply steadily constructed over the past, the District continued to see investment and interest in new hotel development. As of 2020, the Golden Triangle BID had eleven hotels, including the recently opened AC Hotel by Marriott’s (219 rooms), and an
42 https://www.bisnow.com/washington-dc/news/hotel/dc-hotels-face-declining-revenue-but-developers-wont-stop-building-100610

Briefing Book: Actionable Recovery and Resilience Strategies for Washington, DC’s Central Business District 33
additional hotel under construction (the 66-room Penelope Hotel).43 Within the DowntownDC BID, there were three planned hotel projects before the public health emergency including Acumen Cos’s 100-200 room hotel; Jet Hospitality’s renovation for a 75-100 boutique hotel, and Quadrum Global’s 400 room hotel, according to the Downtown BID’s Summer 2020 report.44
Impacts of COVID-19
The reduction of visitors to the District through leisure and business travel has severely impacted the performance of the District’s hotel market and led to significant layoffs for workers in the industry. With the cancellations of large events and hesitancy of visitors to travel, especially by plane, during the public health emergency, the hotel market has faced extremely low demand. In addition, the summer months typically draw significant domestic and international visitors which bolster the hotel market, but the public health emergency hampered that seasonal growth.
This reduced demand has left thousands of District hotel workers without work. In late March 2020, Unite Here Local 25, a union that represents hotel and restaurant workers, reported that 97% of their more than 7,000 members were out work and that the union shifted to sharing resources about unemployment and social services.45 Later in the public health emergency, a national survey conducted by the American Hotel and Lodging Association in late July 2020 found that 87% of hotels report being forced to lay off or furlough staff and only 37% of hotels surveyed have brought back at least half of their employees.46 According to DOES Industry Closing and Layoffs data, at least 22 hotels in the District have provided layoff notices to their workers since March 15, 2020 impacting more than 7,000 workers.47
The overall performance of the hotel market has been much lower than this time last year. Figure 13 below shows the year-over-year changes in the District’s hotel market performance from March to August 2020. Demand (measured as rooms sold) was the lowest in April with just over 59,000 rooms sold, a decline of nearly 93% from April 2019, and total revenue was down 96.4% in April 2020 from the previous year to just $8,150,324. While the DC hotel market’s performance improved slightly from the lowest point in April 2020, each month continued to fall well below the previous year’s performance with hotel occupancy ranging from 15% in May to 23.6% in July, down 82.4% and 72.5% from the same time last year, respectively. RevPAR, or revenue per available room, is commonly used to measure performance in the hotel industry, and the District’s performance in 2020 has suffered significantly. In April, the RevPAR was $14.93, a decline of 93.4% from April 2019, and while there has been incremental progress in the summer months, the RevPAR has remained extremely low.
43 https://goldentriangledc.com/initiative/real-estate/; https://www.bizjournals.com/washington/news/2019/12/18/the-districts-first-ac-hotel-opens-sunday-heres-a.html 44 https://www.downtowndc.org/wp-content/uploads/2020/08/DowntownDC-Economic-Update-Q2-2020-v2.pdf 45 http://www.dclabor.org/home/its-very-bad-dc-hotel-workers-cope-with-covid-19 46 https://www.ahla.com/press-release/survey-onhttps://www.ahla.com/press-release/survey-only-37-percent-hotels-have-brought-back-least-half-their-employeesly-37-percent-hotels-have-brought-back-least-half-their-employees 47 https://does.dc.gov/page/industry-closings-and-layoffs-warn-notifications-2020

Briefing Book: Actionable Recovery and Resilience Strategies for Washington, DC’s Central Business District 34
Figure 13: Hotel Performance for District Hotels
YOY Demand (rooms sold)
YOY Occupancy
YOY Average Daily Rate
YOY Revenue
YOY RevPAR
YOY Supply
March -61.5% -62.2% -5.8% -63.7% -64.4% 1.8%
April -93.1% -87.5% -47.3% -96.4% -93.4% -45.0%
May -89.7% -82.4% -49.9% -94.8% -91.7% -41.0%
June -85.5% -76.7% -42.5% -91.7% -86.6% -38.0%
July -83.0% -71.9% -32.0% -88.4% -80.9% -40.0%
August -80.1% -72.5% -15.1% -83.1% -76.6% -28.0%
Source: STR, 2020.
The hotel market within the CBD was further impacted by the public health emergency. The DowntownDC BID highlighted that hotel revenue in June 2020 was just 6% of June 2019 revenue, and for the first time since 1997, the hotel occupancy rate “dropped below that of other DC hotels for April-June 2020”. Occupancy in hotels within the DowntownDC BID ranged from 74% in pre-COVID February to the lowest rate of 3% in April to 8% in May and 15% in June.48
Looking forward, STR predicts that hotels in the CBD will have a 25% occupancy rate this year, compared to last year’s occupancy rate of 76%.49
Key Challenges and Opportunities
Key Challenges • Large hotels that draw convention-related travelers are likely to remain challenged for
3-4 years until the convention business fully recovers. • Group travel, which includes students, seniors, and international travel, is likely to
remain low until a vaccine is widely available. International tourism volume is likely to remain at low levels for a protracted period of time. This trend is likely to be exacerbated by the global perception that the United States has done a poor job managing the public health crisis.
• In the long-term, the volume of business travel may recover to a lower level than in the past, following widespread adoption of video conferencing.
• Value-added services within hotels, such as restaurants, may be slow to recover due to increased costs for amenities that generate little profit due to higher overhead compared to stand- alone restaurants.
48 https://www.downtowndc.org/wp-content/uploads/2020/08/DowntownDC-Economic-Update-Q2-2020-v2.pdf 49 https://dcist.com/story/20/09/02/covid-19-pandemic-dc-tourism/
Briefing Book: Actionable Recovery and Resilience Strategies for Washington, DC’s Central Business District 35
• Americans may be more hesitant to fly for a period of time, resulting in a continued reduction in visitors to the District. Additionally, the economics of the airline industry are changing in ways that may result in higher costs for air travel. Notably, many airlines are reducing their fleet size by retiring larger and older aircraft sooner than scheduled.
Key Opportunities • Leisure travel within driving distance is likely to increase throughout the recovery period
and potentially accelerate significantly following availability of a vaccine. Destination DC is launching a campaign aimed at the more than 50 million people who live within a 4-hour drive of the District.
• Face-to-Face meetings, particularly among executives, are likely to carry a higher value after this period of protracted social isolation. As a result, individual business travel will likely be one of the early segments of the hotel market to return. Additionally, the nature of government and professional and business service work in the District increases the likelihood of business travel to the District. (Larger business meetings and lower level staff travel are likely to return more slowly.)
• New business models that blur the lines between extended-stay hotels and short-term rentals may help absorb excess hotel rooms on the market.
• New business practices that reduce staff and guest interaction may improve profitability of hotels as the market recovers.
• By and large, the District’s hotel stock is particularly high quality, which increases the likelihood that financially distressed assets will be purchased and put back into service as the market recovers.

Briefing Book: Actionable Recovery and Resilience Strategies for Washington, DC’s Central Business District 36
Commercial: Retail Market
The CBD’s overall retail market is a mix of boutique storefronts, higher-end retail, small business storefronts highlighting products made in the District, and online stores with brick-and-mortar retail. The retail market serves the diverse population, worker, and visitor base and has been a high value market for both national chains and local, home-grown businesses. This section highlights key economic development indicators and high-level trends within the retail market including vacancy, rent, and absorption into the market.
The DC Economic Strategy noted that retail is an important economic sector that represents $1.5 billion of the District’s GDP and provides 23,000 jobs.50 The District’s retail market was performing relatively well up until the public health emergency. A report from JLL Research found that in 2019 “overall retail openings in the District of Columbia have outpaced retail closings nearly four to one” surpassing the performance of the sector in 2018 which had 1.3 retail closing for every opening.51 Restaurants and fitness studios accounted for most of the growth, and most of that activity was concentrated in the Central Washington Planning Area where the CBD is located.
Figure 14 shows that retail vacancy rates in the District have been historically higher than in the CBD. However, the CBD had a spike of vacancies in Q2 2018 which sharply returned to normal by the end of 2018, but then experienced a steady increase in vacancies starting in Q3 2019. During the public health emergency, retail vacancy in the CBD rose to its current level of 7.2%, nearly a full percentage point higher than the District’s current average vacancy rate of 6.3%.
Figure 14: Retail Vacancy Rates in the District and CBD
Source: CoStar, 2020, DC Office of Planning.
50 https://dceconomicstrategy.com/coresectors/retail/ 51 https://www.us.jll.com/en/views/what-coffee-sweat-and-fine-dining-are-doing-for-dc-retail
1%
2%
3%
4%
5%
6%
7%
8%
QTD
'20
Q2
'20
Q4
'19
Q2
'19
Q4
'18
Q2
'18
Q4
'17
Q2
'17
Q4
'16
Q2
'16
Q4
'15
Q2
'15
Q4
'14
Q2
'14
Q4
'13
Q2
'13
Q4
'12
Q2
'12
Q4
'11
Q2
'11
Q4
'10
Q2
'10
DC Vacancy CBD Vacancy
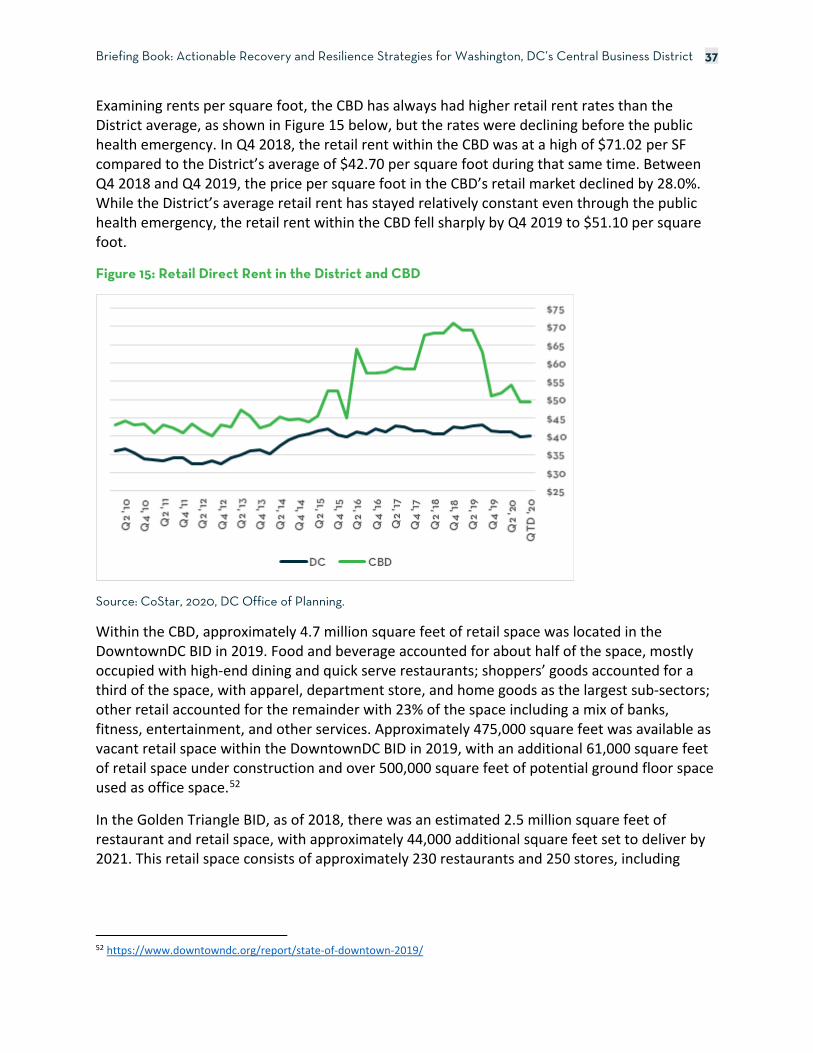
Briefing Book: Actionable Recovery and Resilience Strategies for Washington, DC’s Central Business District 37
Examining rents per square foot, the CBD has always had higher retail rent rates than the District average, as shown in Figure 15 below, but the rates were declining before the public health emergency. In Q4 2018, the retail rent within the CBD was at a high of $71.02 per SF compared to the District’s average of $42.70 per square foot during that same time. Between Q4 2018 and Q4 2019, the price per square foot in the CBD’s retail market declined by 28.0%. While the District’s average retail rent has stayed relatively constant even through the public health emergency, the retail rent within the CBD fell sharply by Q4 2019 to $51.10 per square foot.
Figure 15: Retail Direct Rent in the District and CBD
Source: CoStar, 2020, DC Office of Planning.
Within the CBD, approximately 4.7 million square feet of retail space was located in the DowntownDC BID in 2019. Food and beverage accounted for about half of the space, mostly occupied with high-end dining and quick serve restaurants; shoppers’ goods accounted for a third of the space, with apparel, department store, and home goods as the largest sub-sectors; other retail accounted for the remainder with 23% of the space including a mix of banks, fitness, entertainment, and other services. Approximately 475,000 square feet was available as vacant retail space within the DowntownDC BID in 2019, with an additional 61,000 square feet of retail space under construction and over 500,000 square feet of potential ground floor space used as office space.52
In the Golden Triangle BID, as of 2018, there was an estimated 2.5 million square feet of restaurant and retail space, with approximately 44,000 additional square feet set to deliver by 2021. This retail space consists of approximately 230 restaurants and 250 stores, including
52 https://www.downtowndc.org/report/state-of-downtown-2019/

Briefing Book: Actionable Recovery and Resilience Strategies for Washington, DC’s Central Business District 38
fitness services; salons and barbershops; casual to high-end clothing stores; jewelry, gifts, and specialty stores; and financial and business services.53
Impacts of COVID-19
Similar to other commercial markets, the retail market has been significantly impaired during the public health emergency. Many non-essential businesses were forced to close in mid-March 2020 during the stay-at-home orders and have since had to adjust to new operations, lower consumer spending, and increased protections and costs for the safety of their workers and customers. In the District, 2020 retail spending has steadily increased from its lowest point of -35% in early April compared to mid-January but remains at -10% as of early October. This reduction in consumer spending in 2020 has driven and largely mirrored employment trends within the retail sector, with the lowest decrease in employment of 28.1% in mid-April compared to mid-January. In early October, employment in the retail trade sector remains at a decline of 14.3% compared to sector employment in January.54
Within the CBD, retail vacancy rates climbed to their highest point since 2010 at 7.2% in Q3 2020. In Q3 2020, the retail vacancy rate in the CBD exceeded the District’s average. At the same time, retail rent per square foot also fell between Q4 2019 (before the public health emergency) and Q3 2020 at a much slower rate of 3.4%. The retail vacancy rate in the DowntownDC BID reached a record high of 17.1% in July 2020, and five destination stores – including Bed Bath & Beyond, Uniqlo, and Jos A Banks – permanently closed in 2020. In addition, while a majority (86%) of the destination stores in the BID were open in July 2020, the stores were “only achieving sales of 30-50% of their 2019 sales levels.” Finally, it is important to note that 4 shopping stores with high-end retail were under construction in July 2020 and will deliver even more retail space to the area.55
Key Challenges and Opportunities
Key Challenges • Online retail sales represent about 15% of all sales and are growing at an accelerating
rate due to ongoing consumer adoption and safety concerns pertaining to COVID-19. Due to these trends, full price and premium department stores are under increasing financial pressure nationwide. In urban areas, some retailers have sold centrally located buildings for redevelopment to raise cash for modernizing and repositioning their businesses, which often carry large debt loads. In the Washington region, Tysons Virginia has emerged as the focal point for national brand retailing and it is likely to grow more significant as COVID-19 drives further consolidation in the segment.
• Bed Bath & Beyond has permanently closed their Chinatown store, and there are a limited number of retailers with business models that would benefit from the type of space in a central location.
53 https://goldentriangledc.com/wp-content/uploads/2015/01/2018-GTBID-Office-Market-Presentation.pdf 54 https://www.tracktherecovery.org/ 55 https://www.downtowndc.org/wp-content/uploads/2020/08/DowntownDC-Economic-Update-Q2-2020-v2.pdf

Briefing Book: Actionable Recovery and Resilience Strategies for Washington, DC’s Central Business District 39
• Fast Fashion retailers had been a major driving force in downtown retail prior to the public health emergency. The primary customers for these businesses are workers in downtown office buildings. Due to the nature of the products and shopping experience, which is based on the thrill of the hunt, some of these businesses may have a very difficult path to recovery.
• Casual wardrobes, facilitated by remote work, may influence work attire even when workers return to the office. It is unclear how many businesses within the Men’s Business Attire and Women’s Business Attire categories can survive social distancing and then endure potentially reduced demand because of changing work attire trends.
Key Opportunities • Similar to other types of retail, fashion is increasingly moving online. Companies, such as
Indochino, Bonobos, and Warby Parker, have demonstrated the impact of pairing showrooms, often with measuring and tailoring services, with online retail. As this type of business model expands, it is likely to function as a regional market similar to luxury retail. This trend benefits the District in the long-term because the CBD has the greatest access to the region’s consumer base, which is supplemented by workers and visitors.
• As national credit tenants downsize and close locations, vacant retail spaces present an opportunity for small and local retailers as well as other tenants such as artists and creatives to occupy ground floor space. Different approaches such as the shop within a shop model could be considered as well as more flexible and shorter lease terms that allow for temporary use.
• As online retail expands, demand for one- and two-hour shipping is also increasing. Amazon, Target, and online retailers are pioneering new business models that mix convenience-oriented retail with fulfillment centers for immediate delivery. These facilities may be particularly interested in securing leases in centrally-located, larger spaces, such as the vacant Bed Bath & Beyond location at Gallery Place.
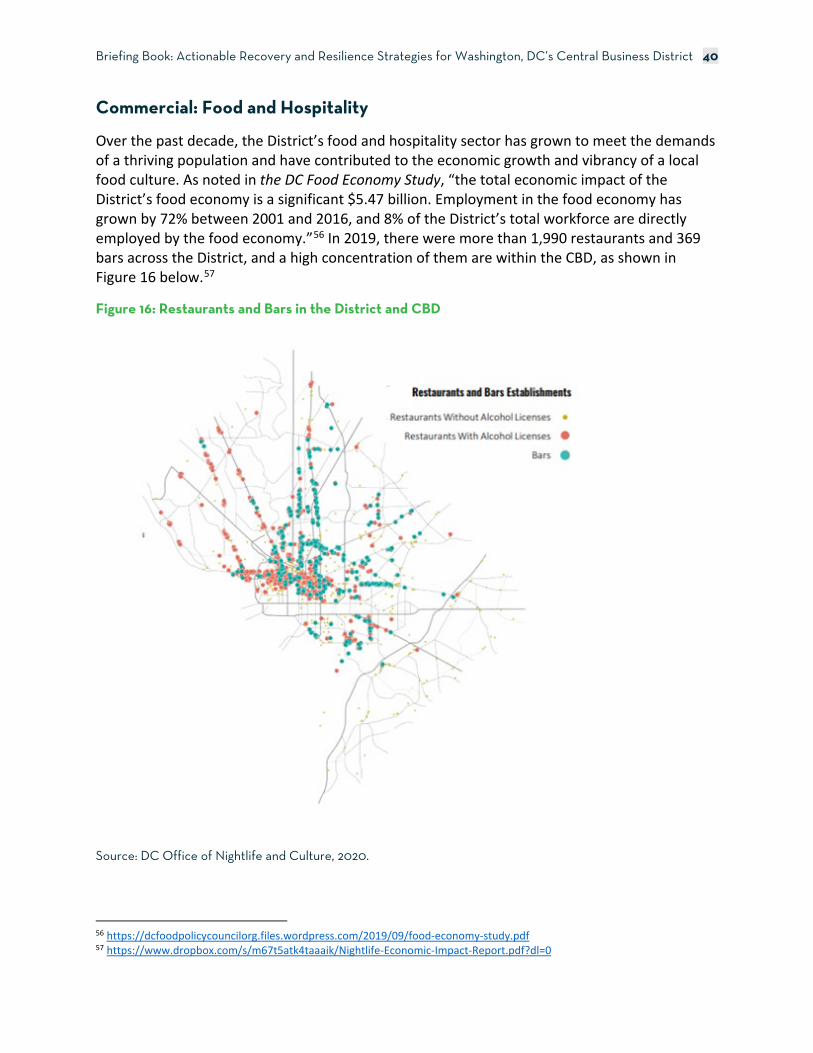
Briefing Book: Actionable Recovery and Resilience Strategies for Washington, DC’s Central Business District 40
Commercial: Food and Hospitality
Over the past decade, the District’s food and hospitality sector has grown to meet the demands of a thriving population and have contributed to the economic growth and vibrancy of a local food culture. As noted in the DC Food Economy Study, “the total economic impact of the District’s food economy is a significant $5.47 billion. Employment in the food economy has grown by 72% between 2001 and 2016, and 8% of the District’s total workforce are directly employed by the food economy.”56 In 2019, there were more than 1,990 restaurants and 369 bars across the District, and a high concentration of them are within the CBD, as shown in Figure 16 below.57
Figure 16: Restaurants and Bars in the District and CBD
Source: DC Office of Nightlife and Culture, 2020.
56 https://dcfoodpolicycouncilorg.files.wordpress.com/2019/09/food-economy-study.pdf 57 https://www.dropbox.com/s/m67t5atk4taaaik/Nightlife-Economic-Impact-Report.pdf?dl=0

Briefing Book: Actionable Recovery and Resilience Strategies for Washington, DC’s Central Business District 41
Despite the growth of the District’s food and hospitality sector, businesses in the sector faced important challenges before the public health emergency including thin margins, employee transportation, high costs of rent, and navigating regulatory and permitting processes. In addition, there were clear inequities across the District when it came to food and hospitality businesses – Wards 7 and 8 were underserved by healthy food retail such as a grocery stores, sit-down restaurants, drinking establishments, and manufacturing and production space for food producers.58, 59
Impacts of COVID-19
The food and hospitality sector has been the hardest hit sector by the public health emergency both in the District and nationally. A September 2020 report from the National Restaurant Association found that nearly 1 in 6 restaurants, approximately 100,000 restaurants, are closed either permanently or long-term. Overall, sales were down 34% on average, and 60% of proprietors say their total operational costs are higher than before the public health emergency.60
The food and hospitality sector within the District and the CBD particularly reflects those national trends. Several local media outlets have documented the restaurants and bars that have permanently closed. For example, one list from the website Eater lists more than 50 restaurants and bars have permanently closed as of early October.61 Within the DowntownDC BID, restaurant sales were down 80% in July 2020 compared to the regional rate of being down 52%. Nine destination restaurants closed during the first seven months of 2020, and seven restaurants were under construction in July 2020 with an additional three more announced.62
The District’s Food Access and Food Security in the District of Columbia Report highlighted that “workers in the District’s food economy are especially vulnerable to food insecurity given the effects of the public health emergency on this sector. With the closure of restaurants, hotels and other establishments in the food, hospitality and entertainment industries at the beginning of COVID-19, the associated job losses were immediate and significant. Most unemployment claims filed between March 15 and June 15 were from employees in food and hospitality industries. Between March 2020 and April 2020, the District lost 30,100 jobs in the food services and drinking places industry.”63 Previous research had found that the majority of jobs in the District’s food economy were already low-wage jobs, with the average annual income less than half of the District’s median average household income (approximately $30,844 compared to $72,935 in 2016).64
58 https://www.dropbox.com/s/m67t5atk4taaaik/Nightlife-Economic-Impact-Report.pdf?dl=0 59 https://dcfoodpolicycouncilorg.files.wordpress.com/2019/09/food-economy-study.pdf 60 https://restaurant.org/news/pressroom/press-releases/100000-restaurants-closed-six-months-into-pandemic 61 https://dc.eater.com/2020/5/18/21262400/dc-restaurants-permanently-closed-covid-19-coronavirus-crisis 62 https://www.downtowndc.org/wp-content/uploads/2020/08/DowntownDC-Economic-Update-Q2-2020-v2.pdf 63 https://dcfoodpolicy.org/foodsecurity2020/ 64 https://dcfoodpolicy.org/reports/food-economy-study/

Briefing Book: Actionable Recovery and Resilience Strategies for Washington, DC’s Central Business District 42
Key Challenges and Opportunities
Key Challenges • Many fine dining businesses are not well positioned in terms of brand, location and
business model to pivot to delivery-centric models. This may result in an elevated rate of business closures in the CBD.
• The convenience food and beverage category is likely to contract significantly as the customer base is artificially small due to widespread remote work practices among downtown businesses that are expected to be in place for more than a year. National businesses, such as Starbucks and Chipotle, are likely to close lower-performing locations and may not renew expiring leases to conserve capital.
• Many downtown bars and night clubs may have difficulty surviving social distancing because their business models require high occupancy loads and are not easily adaptable.
• Retail and restaurants rely on concentrations of similar businesses to attract a regional consumer base, and clusters of related or competing businesses help customers identify markets to shop and dine.
• When ground floor businesses close in a concentrated area, they can generate an exaggerated perception of financial hardship and diminished consumer choice, which can influence whether customers choose to shop in that market. Additionally, potential tenants for upper floor office or apartment space may be dissuaded by adverse street level conditions.
• Workers still employed in restaurants and other food businesses face higher rates of exposure to COVID-19, even in outdoor dining operations, and these low-wage workers often have limited access to healthcare, childcare, and transportation. Front-line food workers and restaurants need additional support in ensuring the safety of workers and customers.
Key Opportunities • Expanded opportunities for outdoor dining can reanimate downtown restaurants and
increase visibility to future customers. • Leveraging large parks, such as Farragut Square and eventually Franklin Square to create
event and picnic locations can amplify outdoor dining as an emerging facet to downtown restaurant business models and support enhanced vibrancy of residential neighborhoods.
• Advanced online ordering systems at restaurants can help busy office workers maximize their lunch breaks by deploying online ordering systems to eliminate the wait.
• Ghost kitchens, restaurants designed specifically to provide food for delivery, were an emerging concept prior to COVID-19. Frequently, the brand names have no brick-and-mortar presence and kitchens can produce meals for several brands at once. This model has the potential to meet catering and office market lunch demands in the future.

Briefing Book: Actionable Recovery and Resilience Strategies for Washington, DC’s Central Business District 43
• The District’s Make Food Work Strategy outlines key ways for the District to support front-line food workers and promote career growth, workforce development, and broader environmental support for low-wage workers.65
• Some restaurants have partnered with the District and its non-profit partners to prepare and deliver meals for individuals experiencing food insecurity during the public health emergency.
65 https://dcfoodpolicycouncilorg.files.wordpress.com/2020/02/make-food-work-executive-summary-dc-food-policy-council-2.pdf

Briefing Book: Actionable Recovery and Resilience Strategies for Washington, DC’s Central Business District 44
Residential
Housing is a vital component of Washington, DC’s inclusive growth – it is embedded in the District’s neighborhoods and defines who we are as a city. Housing choice and affordability provide residents with stability and opportunity, and safe and stable housing supports physical, financial, and emotional health. Washington, DC, like many American cities, is experiencing increasing housing costs due to a growing population, and a constrained supply of housing, which has exacerbated the challenges with housing affordability.66 This section highlights key indicators and high-level trends within the residential market including production, vacancy, and asking rents.
As noted in the District’s Housing Equity Report, “the District currently has a total of approximately 325,000 housing units. More than a third (37 percent) are single-family homes (townhouses and detached houses) and a little over half (54 percent) are condos, co-ops, and rental apartments in large multi-family buildings (buildings with more than four units). The remainder is composed of small, two- to four-unit buildings. Of the total housing stock in the District, about a sixth (16 percent) is dedicated affordable.”67 Additionally, there are an estimated 75,000 units under rent control across 2,200 buildings which is roughly 36 percent of the District’s rental units.68
CoStar data indicates that the study area has approximately 7,400 units as of Q3 2020, although it is important to note that CoStar data includes only for-rent multi-family properties that tend to be larger than 10 units. As seen in Figure 17 below, multi-family asking rents per square foot in the CBD experienced a generally increasing trend between Q1 2010 and Q3 2019, with some variation in recent years, and had reached a high of $3.53 per square foot in Q3 2019.
66 https://housing.dc.gov/sites/default/files/dc/sites/housingdc/page_content/attachments/Housing%20Equity%20Report %2010-15-19.pdf 67 https://housing.dc.gov/sites/default/files/dc/sites/housingdc/page_content/attachments/Housing%20Equity%20Report %2010-15-19.pdf 68 https://www.dcpolicycenter.org/publications/rent-control-snapshot-2019/#_ftn3

Briefing Book: Actionable Recovery and Resilience Strategies for Washington, DC’s Central Business District 45
Figure 17: Multi-Family Residential Asking Rents per Square Foot in the CBD
Source: CoStar, 2020, DC Office of Planning.
Multi-family rental vacancy in the CBD had reached a recent high of 11.6% in Q4 2013, but decreased sharply in subsequent years, with vacancy rates between 4.3% and 6.6% from 2015 to 2018. As seen in Figure 18 below, in Q4 2019 the multi-family rental vacancy rate in the CBD was 4.5%. Through 2020, CBD multi-family vacancy climbed quickly to one of the highest levels on record approaching 10% by the end of 2020.
Figure 18: Multi-Family Residential Rental Vacancy Rates in the CBD
Source: CoStar, 2020, DC Office of Planning.
Within the boundaries of the CBD, there are relatively few residential construction projects in the development pipeline. Three planned projects in the CBD include residential units: a

Briefing Book: Actionable Recovery and Resilience Strategies for Washington, DC’s Central Business District 46
DMPED project at Capitol Crossing with 150 units, 100 of which are affordable; Monument Realty’s Monument Chinatown mixed-use project with approximately 130 units, 10 of which are affordable; and an office to residential conversion project at 1313 L Street, which will have 222 residential units.
Affordability
Creating more opportunities for affordable housing across the city is a key priority of the District and the Bowser Administration. As reported in the Mayor’s Housing Equity Report, the Central Washington Planning Area had approximately 2,890 dedicated affordable housing units in 2018.69 Mayor Bowser’s goal for the District is to produce 36,000 units by 2025 with 12,000 affordable to low-income residents. The report calls for 1,040 of the 12,000 affordable units to be produced in the Central Washington Planning Area. As of January 2021, just 60 affordable units have been produced.70
Homelessness
The issue of homelessness in the District remains a critically important challenge related to housing affordability and supports for low-income residents. According to the District’s 2020 Point in Time count, there were over 6,300 individuals who are literally homeless in January 2020, a slight decrease of 2% from the previous year.71 The District has made significant investments and policy decisions to address homelessness, namely through the Homeward DC Plan and its call for increased permanent supportive housing and the development of family shelters in each ward, but thousands of residents continue to experience homelessness in the city and homelessness is likely to increase after eviction moratoriums in the District and the region end after the public health emergency.
Both BIDs in the CBD have concerted efforts to help individuals experiencing homelessness, with the Golden Triangle BID’s Homeless Outreach Program where outreach workers connect individuals with social supports and the DowntownDC BID’s Downtown Day Services Center where providers offer a range of services including food, showers, laundry, and behavioral health support.72 73 In 2018, Pathways to Housing recognized both BIDS and their efforts to help end chronic homelessness for 125 people in one year. Despite these notable efforts, homelessness continues to be an important issue within the CBD, and the District is committed to implementing the strategies outlined in the Homeward DC Strategic Plan and deepening its investments to ensure homelessness is a rare, brief, and non-recurring experience.74
69 https://housing.dc.gov/sites/default/files/dc/sites/housingdc/page_content/attachments/Housing%20Equity%20Report% 2010-15-19.pdf 70 http://open.dc.gov/36000by2025/ 71 https://www.mwcog.org/documents/2020/06/10/homelessness-in-metropolitan-washington-results-and-analysis-from-the-annual-point-in-time-pit-count-of-homeless-persons-featured-publications-homelessness/ 72 https://www.downtowndc.org/program/homeless-services/ 73 https://goldentriagledc.com/initiative/homeless-outreach/ 74 https://ich.dc.gov/sites/default/files/dc/sites/ich/page_content/attachments/ICH-StratPlan2.11%20web.pdf

Briefing Book: Actionable Recovery and Resilience Strategies for Washington, DC’s Central Business District 47
Impacts of COVID-19
Since the public health emergency began, daily asking rents for residential units have decreased, and housing vacancy has increased for the whole District and specifically within the most expensive planning areas. Daily asking rents across the whole city have declined 4.6% to $2.53 per square foot since hitting a peak of $2.65 per square foot on March 7, 2020, according to CoStar data through October 4, 2020. Figure 19 below shows the change in rents and vacancy rates by planning area. Central Washington rents declined the most, dropping 11% over the time period to $2.91 per square foot, and experienced the third highest change in vacancy during this time.
Residential vacancy during COVID-19 increased the most in the most expensive planning areas and those with the largest amount of new supply delivered since the beginning of 2020. The daily vacancy rate for the whole District as of October 4 is 9.4%, according to CoStar data. This is an increase of 2.8 percentage points since March 7, 2020 when the vacancy rate was 6.7%. There are approximately 3,900 more vacant units in DC now then there were at the start of the COVID-19 public health emergency. Central Washington has a vacancy rate of 11.5%, up from 6.9% in March 2020. The multi-family rental vacancy rate in the CBD has increased from 4.5% to 9.1% between Q4 2019 and Q3 2020, an increase of 5 percentage points.
Figure 19: Residential Asking Rates and Vacancy Rates by Planning Area
Asking Rents Vacancy Rate Area 3/7/2020 10/4/2020 Percent
Change 3/7/2020 10/4/2020 Percentage
Change
DC Total $2.65 $2.53 -4.6% 6.7% 9.4% 2.8%
Near NW $3.41 $3.26 -4.4% 7.1% 9.8% 2.7%
Anacostia/ Near SW
$3.28 $3.11 -5.1% 9.0% 16.3% 7.3%
Central Washington
$3.27 $2.91 -11.0% 6.9% 11.5% 4.6%
Mid-City $2.99 $2.87 -4.0% 6.6% 10.6% 4.1%
Rock Creek West
$2.87 $2.69 -6.2% 6.2% 8.3% 2.1%
Capitol Hill $2.39 $2.35 -1.9% 11.1% 16.6% 5.4% Upper NE $2.33 $2.27 -2.6% 7.9% 7.7% -0.2% Rock Creek West
$2.14 $2.11 -1.3% 4.7% 5.4% 0.7%
Far NE SE $1.51 $1.54 1.8% 1.5% 1.9% 0.4% Far SE SW $1.36 $1.37 0.4% 4.3% 5.0% 0.7%
Source: CoStar, 2020, DC Office of Planning.

Briefing Book: Actionable Recovery and Resilience Strategies for Washington, DC’s Central Business District 48
As seen in Figure 20 below, across the Washington metropolitan region, high-cost submarkets have been especially hit hard by declining demand, according to CoStar. The asking rent for units in Downtown DC decreased by 9.4% from March to September 30, 2020. Downtown DC had the highest change in the District’s submarkets and the fourth highest change in the metro’s submarkets, following Ballston, Crystal City/Pentagon City, and Rosslyn.
Figure 20: Changes in Asking Rents in Washington Region Submarkets
Source: CoStar, 2020.
Key Challenges and Opportunities
Key Challenges • It is difficult for residential development to compete for land in area of the District
where land prices are set by office development. Only very expensive, high end housing can compete for privately held development sites without zoning or other land use regulations that support housing. In addition, residential rents have dropped 9.4% within the CBD since March 2020, while office rents have only fallen by 1%. In general, office rents do not reset as fast, because their leases are on a longer timeline. While there is an elevated and growing amount of vacant office space in the CBD, owners are less likely to want to convert to residential in the near term due to reduced demand for centrally located units under current conditions.
• Overall, there are very few developable sites in the CBD. This means additional housing must come from either redevelopment or conversion of existing uses.
• There are few affordable units in the CBD, which limits the ability of low-income households to benefit from the area’s proximity to jobs, public space, and economic opportunity.
• There is significant delivery and construction of multi-family units in markets adjacent to the CBD; however, demand for those units in the short run is soft and growing softer. There is an opportunity for the District to help stabilize these buildings and achieve

Briefing Book: Actionable Recovery and Resilience Strategies for Washington, DC’s Central Business District 49
affordability for some of those units by striking a deal with those residential buildings to secure affordable units as they come online.
• Renters may be deemphasizing proximity to jobs as a key criterion in their housing searches and may instead prioritize other factors such as larger units and in unit amenities.
• The relatively small residential population means there is a very limited local consumer base to support retailers. With the decline in workers and visitors to the CBD, the impact on the retail sector is acute. Additionally, the relatively small residential population has a limited ability to generate vibrancy in public spaces. By encouraging housing, the District can provide support for the retail and activate public spaces.
Key Opportunities • The District has explored the potential for commercial to residential conversion across
the Planning Areas and identified location specific opportunities for conversion. In a 2020 analysis, the District found that while opportunities in Central Washington where the study area is located, conversions are most likely to occur in the West End and near Massachusetts Ave as well as between Dupont Circle and Georgetown. Overall, the District found that Ward 3 has the greatest opportunity for both office and hotel conversions in the District.
• In order to successfully leverage potential opportunities to convert or redevelop unused office space to residential, the District could incentivize and/or consider expanding housing requirements in strategic areas. Zoning incentives and requirements with the Housing Credit process have proven successful in the CBD study area and in the immediate vicinity.
• The hotel market may also present a few more likely opportunities for conversion to residential. Prior to COVID-19, the District’s hotel market had an oversupply of rooms. While demand for hotel rooms will likely recover quickly following the end of the COVID-19 public health emergency, the demand is likely to be lower than pre-COVID demand as business travel is expected to recover more slowly following the widespread adoption of video conferencing. Conversion opportunities are most likely to be buildings that have had at least 10 years since their last major renovation. Tourist hotels may be the most likely for conversion, followed by the oldest business hotels, and then standard boutique hotels.
• While there are currently a limited number of sites available for residential development in the CBD, there may be opportunities to develop underused land, such as institutional land and property owned by the faith community, into affordable housing opportunities.
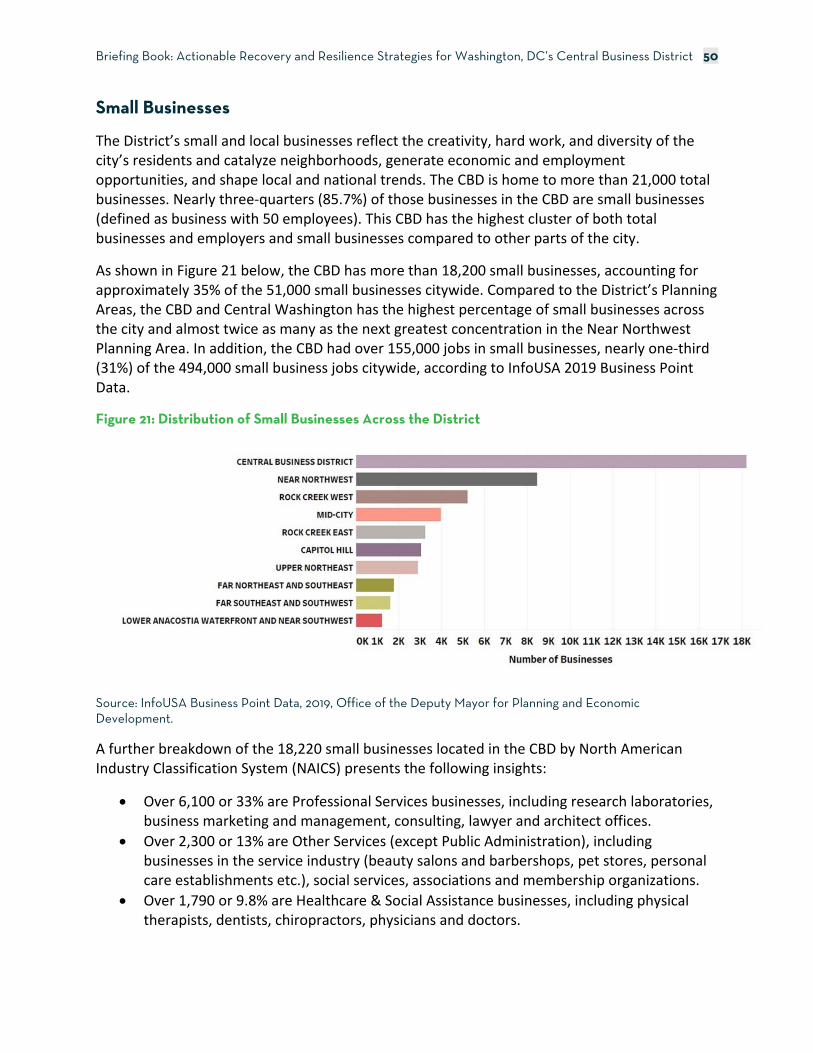
Briefing Book: Actionable Recovery and Resilience Strategies for Washington, DC’s Central Business District 50
Small Businesses
The District’s small and local businesses reflect the creativity, hard work, and diversity of the city’s residents and catalyze neighborhoods, generate economic and employment opportunities, and shape local and national trends. The CBD is home to more than 21,000 total businesses. Nearly three-quarters (85.7%) of those businesses in the CBD are small businesses (defined as business with 50 employees). This CBD has the highest cluster of both total businesses and employers and small businesses compared to other parts of the city.
As shown in Figure 21 below, the CBD has more than 18,200 small businesses, accounting for approximately 35% of the 51,000 small businesses citywide. Compared to the District’s Planning Areas, the CBD and Central Washington has the highest percentage of small businesses across the city and almost twice as many as the next greatest concentration in the Near Northwest Planning Area. In addition, the CBD had over 155,000 jobs in small businesses, nearly one-third (31%) of the 494,000 small business jobs citywide, according to InfoUSA 2019 Business Point Data.
Figure 21: Distribution of Small Businesses Across the District
Source: InfoUSA Business Point Data, 2019, Office of the Deputy Mayor for Planning and Economic Development.
A further breakdown of the 18,220 small businesses located in the CBD by North American Industry Classification System (NAICS) presents the following insights:
• Over 6,100 or 33% are Professional Services businesses, including research laboratories, business marketing and management, consulting, lawyer and architect offices.
• Over 2,300 or 13% are Other Services (except Public Administration), including businesses in the service industry (beauty salons and barbershops, pet stores, personal care establishments etc.), social services, associations and membership organizations.
• Over 1,790 or 9.8% are Healthcare & Social Assistance businesses, including physical therapists, dentists, chiropractors, physicians and doctors.
Briefing Book: Actionable Recovery and Resilience Strategies for Washington, DC’s Central Business District 51
• Nearly 870 or 4.8% are Accommodation and Food services businesses, including full-service or limited service restaurants, hotels & motels, coffee shops and bars.
• Nearly 230 or 1.3% are Arts, Entertainment, and Recreation businesses, including live theaters, event centers, music and live entertainment, museums, health clubs and gyms.
Impacts of COVID-19
The COVID-19 pandemic and the ensuing public health related restrictions have negatively impacted small businesses with District businesses experiencing a 55% decrease in revenue since January 2020 while about 38% of small businesses in the District remain closed as of August. The hospitality sector along with restaurant and hotel locations have also suffered significant declines in consumer spending with restaurants and hotels recording a 53% decline from January spending as of August. 75 In addition, nearly half of all jobs lost in the District were in the restaurant industry, and 75% of the industry’s losses were in full-service restaurants – 571 of these full-service restaurants are located in the CBD, according to InfoUSA Business Point Data.
Small businesses have had to pivot their business models to adapt to public health restrictions, lay off workers or cut back hours to realign with customer demand (or lack thereof), and face increased costs from obtaining materials to protect the safety of their workers and their customers. The confluence of these factors, combined with significant reductions in consumer spending, have led to small businesses in the District experiencing the third largest negative impact on revenues and sixth largest closure rate of 53 major cities in the US, according to an October 2020 report from the DC Policy Center.76 The report highlights that small businesses anticipate needing further significant support in the next six months including increasing marketing or sales (38% of businesses surveyed); obtaining financial assistance/additional capital (36%); better providing for safety of customers and employees (26%); identifying and hiring new employees (25%); and developing online sales or websites (16%).77
Support for Small Businesses During COVID-19
Since the beginning of the public health emergency, the District has responded to help support the needs of small and local businesses. DMPED’s DC Small Business Recovery Microgrants program was designed to aid small businesses in adjusting for revenue losses during the early days of the COVID-19 pandemic. More than $26 million in grants were awarded to over 7,000 businesses across over 15 major industry classes, as shown in Figure 22 below. Approximately $5.6 million of this went to about 960 businesses located in the CBD employing about 600 DC residents.78
75 https://www.tracktherecovery.org/ 76 https://www.dcpolicycenter.org/wp-content/uploads/2020/10/2020-State-of-Business-Report_for-web_pages-1.pdf 77 https://www.dcpolicycenter.org/wp-content/uploads/2020/10/2020-State-of-Business-Report_for-web_pages-1.pdf 78 https://coronavirus.dc.gov/page/dc-small-business-microgrants-program-report

Briefing Book: Actionable Recovery and Resilience Strategies for Washington, DC’s Central Business District 52
Figure 22: Locations and NAICS Industry Class of Small Business Microgrant Recipients
Source: Office of the Deputy Mayor for Planning and Economic Development, 2020.
In addition to the initial microgrant programs, the District launched The Bridge Fund in mid-November to further assist small business employers with maintaining operations and employees. The $100 million investment fund was targeted to restaurants ($35 million), retailers ($15 million), entertainment venues ($20 million), and hotels ($30 million) and had specific set-asides for each type of business for resident-owned businesses, small business enterprise, and economically disadvantaged individuals, woman-owned businesses, or certified Disadvantaged Business Enterprises.
Other grant programs have also been administered in an effort to quicken the process of economic recovery and to retain small and local businesses. These include the DC Child Care Provider Relief Fund, which provided $5 million to local child care facilities79, and the Small Business Resiliency Fund, which is a $3 million fund providing up to $10,000 to businesses with 50 or fewer employees.80 Finally, many small businesses in the District and the CBD also received federal small business support through the Paycheck Protection Program, Economic Injury Disaster Loans, and other programs through the U.S. Small Business Administration.
Key Challenges and Opportunities
Key Challenges • One of the major challenges small business face in the CBD is the reduction in daytime
population. In comparison to February numbers, the CBD has seen a decline of about 70% in visits since COVID related restrictions due to the preferred and safer option of the regular downtown worker to work from home. This factor, along with the fact that
79 https://coronavirus.dc.gov/page/dc-child-care-provider-relief-fund 80 https://coronavirus.dc.gov/page/small-business-resiliency-fund

Briefing Book: Actionable Recovery and Resilience Strategies for Washington, DC’s Central Business District 53
the CBD has more office and commercial offerings over residential uses, has led to the recorded 55% decline in revenue and 38% closure of small businesses.
• Another challenge is access to economic recovery funds and loans to sustain business processes. While grants administered by DC government have been designed to have a broad reach given the available resources, small businesses have had reported delays with accessing some of the more robust federal loan facilities such as the PPP loans. As mentioned above, delays were most significant for businesses located in majority-Black communities and impact Black and Latino businesses disproportionately.81 In addition, the significant delay in the availability of federal funds from the HEROES act and a continuation of the PPP program might determine if a majority of these small businesses will survive.
• The high cost of maintaining a brick-and-mortar location during a period of reduced economic activity remains a significant challenge for small businesses. Locations that were once regarded as investments are currently a burden because of retail rent.
• There is cost and confusion related to regulatory compliance. This is an equity concern as it relates to business fines and fees.
• There is a need to reconceptualize the relationship to customer base to be online. This presents a challenge in terms of creating a community that is less rooted to a physical location, while still focused on local community.
Key Opportunities • The harmful economic impacts from the public health emergency have been
concentrated in the Leisure and Hospitality Industry while several of the region’s largest high-wage industries have continued growing through 2020. It is likely that a significant portion of the consumer base has pent-up demand that may generate strong retail sales once a vaccine is available.
• Available office spaces and ground floor retail space in the CBD present an opportunity to provide small businesses with lower-cost, low-footprint rental spaces.
• Reducing costs and streamlining processes such as permitting and fees could help sustain existing businesses and foster the creation of new businesses.
• The District’s Department of Small and Local Business Development (DSLBD) works closely with existing small businesses and emerging entrepreneurs to support them maintaining and starting their businesses. Through DSLBD’s existing programs and partnerships, the District could directly connect with small businesses operating or wanting to operate in the CBD and continue to provide education for small businesses that address unique challenges that they are facing.
• While many small businesses have sadly temporarily or permanently closed because of the pandemic, the District’s entrepreneurial activity has not decreased. According to an October 2020 report from DC Policy Center, the number of business applications in the District submitted between July and mid-August 2020 was 40% higher than the same period last year. Efforts to support emerging entrepreneurs and incubate new
81 https://www.brookings.edu/research/new-data-shows-small-businesses-in-communities-of-color-had-unequal-access-to-federal-covid-19-relief/

Briefing Book: Actionable Recovery and Resilience Strategies for Washington, DC’s Central Business District 54
businesses models and concepts can help ensure these new businesses successfully enter and find their place in the local market.
• Throughout the public health emergency, the District has created innovative pilots such as the Educational, Arts, and Retail Stores pilot to help non-essential businesses respond to public health guidelines and test operations. The District should continue testing and piloting different approaches that allow small businesses to stay open and expand into available public space while ensuring public safety.

Briefing Book: Actionable Recovery and Resilience Strategies for Washington, DC’s Central Business District 55
Arts, Culture, and Entertainment
The District’s arts, culture, and entertainment sectors contribute significantly to the District as a whole and enhance the vibrancy of the CBD. The DC Cultural Plan found that the cultural economy supports more than “$30 billion in annual spending and $1.1 billion in tax revenue related to more than 150,000 jobs” and that a significant amount of cultural production and entertainment takes place in the CBD.82 According to the DC Office of Nightlife and Culture, the District had 41 nightlife venues, including 24 performing arts venues, 11 movie theaters, and six live music venues, and 37 nightclubs spread across the city. Among the significant cultural and entertainment assets within the CBD are national museums including the National Building Museum, National Museum of Women in the Arts and several Smithsonian Museums; prominent theaters and performance spaces including the National Theater and Woolly Mammoth Theater; and large sports and event centers including the Capital One Arena and Ronald Reagan Building and International Trade Center. Restaurants and bars were highlighted in the food and hospitality section above.83
The nightlife economy is an important sector within both the District and CBD, and it has grown significantly in recent years. According to the DC Office of Nightlife and Culture’s Economic Impact of DC’s Nightlife Industry report, “nightlife activity contributes significantly to the District’s economy. Since the nightlife economy depends heavily on customer traffic outside of the traditional nine to five, nightlife industries allow for second jobs and often provide for more flexible and creative work.”84 Nightlife businesses are heavily concentrated in the center of the District, with a significant amount located in the CBD as shown in Figure 23 below.
82 https://planning.dc.gov/publication/dc-cultural-plan 83 https://www.dropbox.com/s/m67t5atk4taaaik/Nightlife-Economic-Impact-Report.pdf?dl=0 84 https://www.dropbox.com/s/m67t5atk4taaaik/Nightlife-Economic-Impact-Report.pdf?dl=0

Briefing Book: Actionable Recovery and Resilience Strategies for Washington, DC’s Central Business District 56
Figure 23: Concentrations of Nightlife Businesses in the District
Source: DC Office of Nightlife and Culture, 2020.
The arts, culture, and entertainment organizations within the DowntownDC BID welcomed an impressive 7.5 million visitors in 2019, despite being down from the previous year. Attendance in 2019 was down 20% from 2018, mostly due to the closure of a few museums and renovations at the Capital One Arena. Museums were the largest sector in the culture and entertainment with 4.8 million visitors (down 24% from 2018), followed by the Capital One Arena with 2 million visitors (down 13% from 2018), and performing arts venues with 727,000 visitors (down 4% from 2018).85
Impacts of COVID-19
Consumer spending on entertainment and recreation in the District has fallen by nearly half between January and October 2020, and the arts, culture, and entertainment sectors in the CBD have felt that impact.86 According to the DowntownDC BID, there were “almost no cultural and entertainment visitors for April-Dec 2020” due to closures of the Capital One Area and seven of eight museums in the BID and the cancellations of over 1,000 theatre and other
85 https://www.downtowndc.org/report/state-of-downtown-2019/ 86 https://www.tracktherecovery.org/

Briefing Book: Actionable Recovery and Resilience Strategies for Washington, DC’s Central Business District 57
performances, “meaning a total of 400,000 patrons will not be coming to DowntownDC in 2020.”87 It is worth noting that the Smithsonian museums are reopening with new safety measures and timed passes to ensure proper social distancing in the museums.
In addition, according to research conducted for the DC BID Council, sports and entertainment districts will likely take longer to recover from the COVID-19 public health emergency because the retailers and restaurants who serve those districts will not reach their pre-pandemic sales level until the venues can safely reopen at full capacity.
It is worth noting that the longer recovery takes, the more likely it is that a larger number of arts and cultural organizations will close. Importantly, federal recovery funding for arts and cultural organizations would help sustain the sector and prepare it for recovery. The District is a leader among states in providing grant dollars along with other forms of relief to these organizations, but more support is likely needed to ensure organizations can successfully weather the storm.
Within the District’s nightlife sector specifically, even before the public health emergency, the industry had significant operational needs and challenges including: rising costs and slim margins; attracting and retaining employees; transportation access; regulatory costs and timeframes; and community approvals.88
Key Challenges and Opportunities
Key Challenges • Repairing diminished consumer confidence in safe travel and participating in large-
group events is key for full recovery of the arts, culture, and entertainment sectors. • It is unknown when and how nightlife and entertainment will return to the CBD, given
the difficulty in implementing social distancing in nightlife and large entertainment businesses.
• Sustaining performance venues, such as theaters and concert halls, during extended social distancing will be increasingly challenging because these organizations have very limited options for revenue generation with limited capacity.
• The decrease in daytime population in the CBD during the recovery period will reduce the base of potential customers and patrons for arts and cultural businesses, as well as continue to impact overall vibrancy.
• Artists and performers may have difficulty sustaining their practices through protracted social distancing.
Key Opportunities • Cultural exhibition organizations, such as museums and galleries, may be able to open
sooner (with socially distanced access) than other arts, culture, and entertainment
87 https://www.downtowndc.org/wp-content/uploads/2020/08/DowntownDC-Economic-Update-Q2-2020-v2.pdf 88 https://communityaffairs.dc.gov/sites/moca/files/dc/sites/moca/publication/attachments/Nightlife-Economic-Impact-Report%20%281%29.pdf
Briefing Book: Actionable Recovery and Resilience Strategies for Washington, DC’s Central Business District 58
businesses. These spaces may be sought after relief valves for the pent-up cultural and entertainment demand.
• Cultural organizations have a unique opportunity to connect digitally with a content-hungry customer base. Disney Plus’s streaming of Hamilton demonstrated both a model and demand for this type of presentation.
• Large outdoor spaces and venues, such as the National Mall, could be used to host events to maintain connections with patrons.
• Lower-cost and more flexible term commercial space (both ground floor retail as well as upper floor office) may be available during the recovery period, which could support arts and cultural organizations as well as individual artists and creatives.

Briefing Book: Actionable Recovery and Resilience Strategies for Washington, DC’s Central Business District 59
Public Space, Activation, Design and Civic Infrastructure
Public life is what people create and experience when they connect with one another in public spaces, such as streets, plazas, parks, and city spaces between buildings. It represents the everyday activities people naturally participate in when they spend time outside of their homes, workplaces, and cars. Public life is an important driver of physical and mental health; sustainable mobility; social benefits; culture, identity, and sense of place; and safety and economic development.89 The District is fortunate to have a wealth of park spaces, squares, and pedestrian-friendly streets and sidewalks that comprise the city‘s public space, and the CBD has an expansive array of these public spaces and also hosts important connectivity passageways through the city including the K Street Corridor and Pennsylvania Ave NW.9091
Due to a lack of residential uses in the CBD, public spaces in the CBD are often considered to be underperforming, because of limited foot traffic during non-work hours. Specific metrics to measure the performance of public space are taking shape, but below three public spaces and activations and their role in the CBD are highlighted: sidewalk cafes, farmers markets, and activities of BIDs.
Sidewalk Cafes: As shown in Figure 24 below, there are over 900 permanent outdoor cafes on a combination of private and public space in the District. A high proportion of sidewalk café activity is located within the CBD. During the public health emergency, as the District moved into Phase II of reopening, the Mayor allowed for expanded sidewalk café space and for community organizations to apply for streateries or expanded space for outdoor dining, which expand restaurant space into street parking or traffic lanes.92
89 https://planning.dc.gov/sites/default/files/dc/sites/dcps/page_content/attachments/2018.12%20DC%20Public %20Space%20Activation%20Stewardship%20Guide_web.pdf 91 https://planning.dc.gov/sites/default/files/dc/sites/op/page_content/attachments/K%20Street%20Public% 20Life%20Study.pdf 92 https://coronavirus.dc.gov/release/mayor-bowser-announces-plans-open-streateries-and-lower-citywide-speed-limit-dc-reimagines

Briefing Book: Actionable Recovery and Resilience Strategies for Washington, DC’s Central Business District 60
Figure 24: Locations of Outdoor Sidewalk Cafes in the District
Source: DC Department of Transportation and DC Office of Planning, 2020.
Farmers Markets: Farmers markets play a crucial role in providing fresh food to District residents, and throughout the public health emergency, the District has worked to ensure that farmers markets could remain open with proper social distancing requirements. In early April 2020, Mayor Bowser issued Mayor’s Order 2020-058, which required that all farmers markets wanting to operate during the public health emergency to apply for and receive a waiver. OP developed an online application for farmers market operators to demonstrate how they planned to comply with public health requirements, formed a small farmers market review team, and created a system for reviewing and approving the waivers.93 Over 40 farmers markets applied and were approved to operate during the public health emergency.
BID Public Space Activations: The Golden Triangle BID and DowntownDC BID provide place management within their respective boundaries, which includes public space maintenance and programming. For example, the Golden Triangle BID sees roughly 26,000 passersby on weekdays. The BID has created events to activate public spaces within its boundaries, such as the “Farragut Fridays” weekly summer event, which includes programmed activities and food trucks to encourage nearby office workers to visit Farragut Square. The BID has also invested in public realm improvements and activations, such as creating rain gardens in sidewalk space or hosting an annual poetry contest that includes placing signs with Haiku submissions around the BID. The DowntownDC BID also has activated public space through its recent Murals that
93 https://dcfoodpolicycouncilorg.files.wordpress.com/2020/09/food-security-report-9-24-20.pdf

Briefing Book: Actionable Recovery and Resilience Strategies for Washington, DC’s Central Business District 61
Matter: Activism Through Public Art program that features street art created this summer in response to social justice protests; its field asset management team of ambassadors trained to monitor and report issues such as loose sidewalks and graffiti; and its work in developing design guidelines for the BID for standards such as tree planting, accessibility regulations, and design.
Recent and Current Relevant Planning Efforts
There are several plans relevant to the study area that focus on improving public life and space in CBD. These plans, and their findings regarding public space in the CBD, are reviewed below:
The K Street Public Life Study: In 2019, the DC Office of Planning released the K Street Public Life Study, which revealed important findings regarding the use of public space on an important thoroughfare in the CBD. Many of the study’s findings are applicable to the broader CBD. For example, K Street NW and Connecticut Ave NW is the busiest intersection in the District, but K Street is an underperforming downtown space. Notably, the main population that uses K Street are working age adults on the weekday. On weekends, activity is approximately 77% lower than during the week, and the population is primarily tourists. K Street lacks activity due to the fact that the over half (57%) of the land is office space, there are more appealing public spaces nearby, and pedestrians on K Street face a range of barriers, including a lack of shade and seating and difficulty crossing the street. The study recommends improving K Street through design elements, such as streamlining place management and permitting processes; improving street design with the tree canopy and public seating; changing land use to increase restaurants and retail; and using temporary activation strategies.94
The Downtown East Re-Urbanization Strategy: Released in 2019, the Downtown East Re-Urbanization Strategy incorporates part of the study area, but also adjacent neighborhoods that have experienced substantial population growth in recent years. The strategy focuses in large part on creating community-serving spaces that will enhance the neighborhood vitality of the area. This includes creating a large park to serve as a central community gathering place for the growing neighborhood, as well as a network of smaller public spaces and a community-defining public realm.95
Pennsylvania Avenue NW Pedestrian Life Study: A 2015 study of Pennsylvania Avenue NW, at the southern edge of the study area, demonstrated similar findings to the K Street Public Life Study. While the Pennsylvania Avenue NW Pedestrian Life Study found that the street did have several elements that could be attractive to pedestrian activity, such as generous tree canopy, enjoyable streetscape elements, and stately architecture, the corridor also had substantially lower foot-traffic during off-peak times. Challenges cited by the study include lack of land use diversity, inactivity at night, lack of places and destinations to draw people to the area, an unclear identity, and a lack of human scale design. The study suggests programming and design
94 https://planning.dc.gov/sites/default/files/dc/sites/op/page_content/attachments/K%20Street%20Public%20Life% 20Study.pdf 95 https://planning.dc.gov/sites/default/files/dc/sites/op/page_content/attachments/Downtown%20East%20ReUrbanization %20Strategy%20-%20Final%2008-2019.pdf

Briefing Book: Actionable Recovery and Resilience Strategies for Washington, DC’s Central Business District 62
ideas for the public spaces in the area in order to attract more visitors, activating ground floor uses, and using design elements to bring existing buildings to human scale.96
Franklin Park Transformation: Franklin Park is a nearly 5-acre national park located in the CBD. In recent years, the park had fallen into disrepair and had limited amenities and programming. The National Park Service (NPS), the District of Columbia, and the DowntownDC BID created a partnership to plan for the transformation of Franklin Park to better serve the surrounding community. Notably, this involved negotiating with NPS to include a revenue-generating pavilion to sustain operation of the park.97 Establishing this partnership and agreement with NPS provides a model for the several other NPS-owned public spaces located within the CBD.
K Street Transitway: Led by the DC Department of Transportation (DDOT), the K Street Transitway project will reconfigure the K Street NW Corridor to make more efficient and effective use of the right of way for multimodal travel. The project will “feature a two-way dedicated busway running in the center of K Street from 12th Street NW to 21st Street NW. The new design eliminates service lanes along K Street and places medians in the center of the roadway to protect the busway. The new medians will feature bus stops, lighting, landscaping, and pedestrian amenities. Much of the streetscape will be improved with new bioretention, landscaping, and pedestrian amenities, including Vision Zero safety improvements.”98 The project is expected to be completed by 2024.
Impacts of COVID-19
The COVID-19 public health emergency has been a unique opportunity to both reimagine public space and recognize how underutilized or poorly designed space can hinder health and equity across the city, and the District has implemented several opportunities to catalyze underused space for new activities that meet the needs of the District’s residents, businesses, and neighborhoods. The District helped usher in new and innovative public space uses to support restaurants and retail in expanding their outdoor serving space; create safe streets for residents to maintain social distance while outside; and help farmers markets implement public health and social distancing guidelines to continue being a source of healthy food for residents.
The outcomes of these efforts have included:
• By early September, there were over 580 sidewalk café or streatery registrations for restaurants, retailers, and community organizations across the District, with a significant amount located in the CBD;
• In late September, the DowntownDC BID launched “Dine Out on 8th Street”, a destination streatery where nine downtown restaurants expanded their dining capacity for five weekends;99
96 https://planning.dc.gov/sites/default/files/dc/sites/op/page_content/attachments/PeopleOnPenn.pdf 97 https://www.downtowndc.org/wp-content/uploads/2017/10/20-0213_FRANKLIN-PARK_DESIGN.pdf 98 https://ddot.dc.gov/page/k-street-transitway 99 https://www.npr.org/local/305/2020/09/22/915648824/a-streatery-is-coming-to-downtown-d-c-this-week-here-s-how-it-works

Briefing Book: Actionable Recovery and Resilience Strategies for Washington, DC’s Central Business District 63
• The DC Slow Streets Initiative, where local streets are restricted to local traffic and speed limits are set at 15 miles per hour, expanded to 22 miles in early August from 5 miles in early June 2020; and
• Over 40 farmers markets were approved to operate in the District, including one in Penn Quarter on Thursdays.
Transportation Equity
An important element to the public life and civic infrastructure in the CBD is the challenges around transportation equity and connectivity. In the moveDC 2021 update, the District “recognizes that there are inequities in transportation policy, planning and project delivery in Washington, DC. Deep-rooted structural injustices and inequities have contributed to the disparate access to safe, affordable and efficient transportation that provides access to economic opportunities, housing and services for communities across the District.” The District “also acknowledges these inequities have disproportionately and negatively impacted environmental and health outcomes in our underserved communities.”100
Transportation needs vary across the District, and the DC Department of Transportation (DDOT) uses low proximity to frequent transit, access to jobs and destinations, and safety risks to identify where transportation improvements are needed. DDOT created a Transportation Needs Map to identify areas of the District with the greatest transportation needs.101 Among other findings from this analysis, the agency finds that many of the areas with the greatest transportation needs are the same areas in the District that have higher concentrations of historically marginalized communities, including people of color, low-income residents, persons with disabilities, and residents with low English proficiency. It will be critical to prioritize investment and improvement in these areas to better increase access to opportunities.
The disparities in the District’s transportation system can also be seen in the amount of time spent and/or percentage of household income some District Residents dedicate to making trips. Many of the low-income workers who support the businesses within the District and CBD rely on transit. A Washington Post 2017 analysis of the household income and transit-reliance within census tracts, shown in Figure 25 below, found that the District “has a higher concentration of low-income, transit-reliant residents than nearby counties in Virginia and Maryland” and “many of those Census tracts lie across the Anacostia River.”102
100 https://movedc-dcgis.hub.arcgis.com/pages/equity 101 https://movedc-dcgis.hub.arcgis.com/pages/mapping-transportation-needs 102 https://www.washingtonpost.com/graphics/local/transit-access/?utm_term=.fae764b67213

Briefing Book: Actionable Recovery and Resilience Strategies for Washington, DC’s Central Business District 64
Figure 25: Commuting Patterns by Income in the Washington Region
Source: Washington Post, 2017.
Transportation inequities have been further exacerbated in the District, as lower income residents, often people of color, have relied on the public transit system to get to essential jobs and services while more affluent residents work remotely or avoid making public transit trips by using app-based services.103
Key Challenges and Opportunities
Key Challenges • The relatively small number of residential units in the CBD presents challenges for
ensuring activation of public space seven days a week throughout the day and evening. During the public health emergency, this challenge has been exacerbated by the lack of office workers in the CBD.
• Local retailers and artists have highlighted persistent challenges with navigating the permitting process for the use of outdoor space in the CBD.
• Existing transportation inequities and potential reductions in future transit services due to fiscal constraints in the WMATA budget make it harder for workers who live in other
103 https://www.washingtonpost.com/nation/2020/05/15/amid-pandemic-public-transit-is-highlighting-inequalities-cities/?arc404=true

Briefing Book: Actionable Recovery and Resilience Strategies for Washington, DC’s Central Business District 65
parts of the city to commute to the CBD, especially for late-night workers in the restaurant and hospitality industries who tend to be low wage workers.
Key Opportunities • The District’s investments in public parks such as Franklin Park and transit ways such as
K Street will make those areas more vibrant and more supportive of residential tenants. There is an opportunity for the District to encourage residential development along these public space assets and leverage those public space investments for improved residential experiences.
• The District has a considerable amount of public spaces in its CBD, comprised of wide sidewalks, as well as local and federal park spaces and plazas. All of these spaces in the CBD have the potential to support additional public space activations and draw more visitors to the CBD.
• Due to the District’s large amount of public space, the city has an advanced regulatory environment in place governing the use of public space. These regulations and review bodies have proven especially useful and nimble for adapting to the public health emergency and expanding opportunities such as outdoor dining.
• Reimaging park and street life as part of physical distancing is likely to make urban areas feel more human and dynamic increasing the appeal of working in central locations.
• The CBD can build off of the successful model of the Downtown Christmas Market, which is one of the District’s most successful and longest-running annual events.
• Emerging modes of transportation, such as e-bikes, and autonomous vehicles may increase the accessibility and desirability of these locations.
Acknowledgements
The District’s sponsor team was a collaboration between the DC Office of the Deputy Mayor for Planning and Economic Development (DMPED) and the DC Office of Planning (OP).
The development of this Briefing Book was led by Sakina Khan and Emily Johnson (OP) in coordination with Sharon Carney, Sybongile Cook, Tatiana Torres, and Femi Adelakun (DMPED). Additional key contributors were: Ryan Hand, Jordan Chafetz, Art Rodgers, and Rogelio Flores (OP).

Briefing Book: Actionable Recovery and Resilience Strategies for Washington, DC’s Central Business District 66
4. BACKGROUND AND SUPPLEMENTAL RESOURCES
These links provide additional background and supplemental information on the CBD, the District’s land use and long-range plans, and various economic sectors and priorities.
Land Use & Development Patterns • District of Columbia Proposed Comprehensive Plan Update. Central Washington
Element. April 2020. • District of Columbia Proposed Comprehensive Plan Update. Equity Crosswalk. April
2020. • District of Columbia Proposed Comprehensive Plan Update. Amending the DC
Comprehensive Plan Website. November 2020. • District of Columbia Office of Planning (OP). Downtown East Re-Urbanization Strategy.
August 2019. • DowntownDC BID. State of Downtown 2019. 2019.
Economic Development • District of Columbia Deputy Mayor for Planning and Economic Development (DMPED).
DC’s Economic Development Strategy. March 2017. • District of Columbia Office of the Chief Financial Officer (OCFO). Revised Revenue
estimates for FY 2021 – 2024. December 30, 2020. • Greater Washington Partnership. Capital COVID-19 Snapshot: Safe Return to Work
Surveys. August 2020. • DowntownDC BID. DowntownDC Economy Update. Economy Update. Summer 2020. • Destination DC. Destination DC Releases Washington, DC’s Visitation Numbers and
Forecast, Discusses Industry Resiliency Efforts. September 2, 2020.
Office Market • CBRE. Q3 2020 Office Market Analysis. September 2020. • Gensler. Design Parameters for Urban Office to Residential Conversion. 2016. • JLL. Washington, DC Office Insight Q3 2020. September 2020.
Food and Hospitality • District of Columbia Office of Planning (OP) and District of Columbia Food Policy Council
(FPC). DC Food Economy Study. 2019. • District of Columbia Office of Planning (OP) and District of Columbia Food Policy Council
(FPC). Food Access and Food Security in the District of Columbia: Responding to the COVID-19 Public Health Emergency. September 2020.
• District of Columbia Office of Planning (OP) and District of Columbia Food Policy Council (FPC). Make Food Work: A Strategy to Strengthen the District’s Food Workforce. January 2020.
Residential • District of Columbia Deputy Mayor for Planning and Economic Development (DMPED).
Office-to-Affordable Housing Task Force Report. August 2019.

Briefing Book: Actionable Recovery and Resilience Strategies for Washington, DC’s Central Business District 67
• District of Columbia Office of Planning (OP) and District of Columbia Department of Housing and Community Development. Housing Equity Report: Creating Goals for Areas of Our City. October 2019.
Retail and Small Business • Sunaina Kathpalia. DC Policy Center. How many small businesses are in DC? May 5,
2020. • National League of Cities Center for Research and Innovation. Supporting Entrepreneurs
and Small Business: A Toolkit for Local Leaders. 2012. • Coalition for Nonprofit Housing and Economic Development (CHNED). DC Small Business
Policy Project: Implementation of Recommendations. February 15, 2017. • U.S. Census Small Business Pulse Survey. Overall Findings for the District of Columbia.
Arts, Culture, and Entertainment • District of Columbia Mayor’s Office of Nightlife and Culture. Economic Impact of DC’s
Nightlife Industry. February 2020. • District of Columbia Office of Planning (OP), District of Columbia Commission on the Arts
and Humanities (DCCAH), and District of Columbia Office of Cable Television, Film, Music, and Entertainment (OCTFME). DC Cultural Plan. April 2019.
Public Space and Design • District of Columbia Office of Planning (OP). K Street Public Life Study. November 2019. • District of Columbia Office of Planning (OP). District of Columbia Public Space Activation
& Stewardship Guide. December 2018. • DC Department of Transportation (DDOT), District of Columbia Office of Planning (OP),
and DC Health. Reimaging Outdoor Space: Restaurants and Retail: Guidelines for Expanded and New Outdoor Seating. June 2020.
Transportation • Washington Metropolitan Transit Authority (WMATA). COVID-19 Budget Impacts. • District of Columbia Department of Transportation (DDOT). K Street Transit Way: A New
Streetscape with Multimodal Benefits. April 2020. • District of Columbia Department of Transportation (DDOT). Pennsylvania Avenue West
Project Background. • District of Columbia Department of Transportation (DDOT). 20th/21st/22nd St NW
Protected Bike Lanes Final Report. August 12, 2019. • District of Columbia Department of Transportation (DDOT). Connecticut Avenue
Streetscape and Deck-Over Project.