action plan to 2024 - department of basic education
TRANSCRIPT

Action Plan to 2024
Towards the realisation of Schooling 2030
Taking forward South Africa’s
National Development Plan 2030
AUGUST 2020

Foreword by the Minister
It gives me great pleasure to present this new basic education sector plan, Action Plan to 2024. This is the third five-year plan of its kind. It is the product of many months of technical work and consultation with key stakeholders.
The plan attests to government’s commitment to continuing our struggle to redress the inequalities of our colonial past. It is closely aligned to government’s National Development Plan, and reflects our commitment to the Sustainable Development Goals of the United Nations, and the Continental Education Strategy for Africa (CESA) of the African Union.
Especially now, in the context of the coronavirus pandemic, it is vital that government provide direction to the country. Not only does the current plan provide evidence-based strategic direction for the sector, it is also very clear on the linkages between basic education and other sectors of society, and on how we compare internationally. In some respects, we have done well, for instance when it comes to improving learning outcomes. In other respects, we have not done as well as we would have liked. Where success has been limited, it is important that we understand why, and take remedial action.
The plan reflects six priorities identified by the Council of Education Ministers (CEM) early in 2020. These priorities are:
1. Foundational skills of numeracy and literacy, especially reading.
2. Immediate implementation of a curriculum with skills and competencies for a changing world, with the emphasis being on the Three Stream Model, entrepreneurship education, focus schools, coding and robotics, and the implications of the Fourth Industrial Revolution.
3. Decisive action on quality and efficiency through the implementation of standardised assessments to reduce failure, repetition, and drop-out rates, and the introduction of the General Education Certificate.
4. Two years of Early Childhood Development (ECD) before Grade 1, and the migration of education services for 0 to 4 year olds from Social Development to Basic Education.
5. An infrastructure development plan focussing on delivery and regular maintenance, with a proper sense of costs and financing.
6. Work with Sport and Recreation, Arts and Culture, Health, and the South African Police Services to teach and promote social cohesion, health and school safety.
These are not new priorities, and progress in all six areas has occurred. For instance, this plan outlines the evidence on success with respect to improvements in reading in the foundation phase and expanding early childhood development. However, just because there has been progress, further progress is not guaranteed. We continually need to re-assess where we are, what the evidence says, and whether we are employing the right tactics. The plan, by providing recent trends, a comprehensive framework of what the options are, and examples of good practice beyond South Africa, serves as an excellent tool in this process.
This has become particularly urgent in the context of COVID-19. While the plan provides a brief outline on how the pandemic is likely to affect the sector, it is still too early to gauge its full long-term impact. It is undoubtedly presenting new challenges. But it can also serve as a catalyst for certain types of innovation, for instance in the areas of e-learning and e-government.
Even with the progress made so far, we are still far from achieving the just, equitable, and high-quality schooling system we all yearn for. Yet, as the plan makes clear, it is becoming increasingly evident that this vision is realisable within the lifetimes of many of those who will use this plan.
MRS ANGIE MOTSHEKGA, MP
MINISTER
DATE: 26/08/2020
Foreword by the Director-General
Action Plan to 2024 is being released at an opportune time. It is clearer than ever that we have a schooling system which for many years has been improving. This is especially so following recent corrections to the PIRLS Grade 4 reading trend. Furthermore, we have a Department of Basic Education which is committed to qualitative improvement, has become better at monitoring quality trends, is able to innovate in critical areas such as curriculum development and teacher professional development, and accepts that we are all on a steep learning curve, as government and as a country.
This plan is moreover being released at an exceptionally difficult time for South Africa and the world, as we struggle to grapple with the direct and indirect fallout of the coronavirus pandemic. As explained in the plan, we have many enhancements in the pipeline, including the new Systemic Evaluation, the General Education Certificate in Grade 9 and the Three Stream Model. We may have to adjust the timing of these innovations, and how we take them forward, as a result of the pandemic. I am confident that we have the skills, motivation and vision in the Department to face these new challenges, so that the disruption in our progress in minimised.
Above all, we have a Department which understands that the focus must now fall, more strongly than ever, on those most disadvantaged by history and circumstance. Schools must continue to serve as buffer against the worst effects of poverty, for instance through the National School Nutrition Programme, and a pathway towards a better future. In part, this means ensuring that more youths from historically disadvantaged communities qualify to enter university programmes, contribute to addressing the country’s skills shortfalls, and become the engineers, medical doctors, and government planners of tomorrow. But it is also about ensuring that everyone leaves the schooling system with skills which can serve him or her for life, as well as a deep understanding of our country, of its difficult past, its injustices, the progress it has made, and the opportunities it offers.
I invite all South Africans to engage with this plan, and to continue participating in our country’s lively debates around how we can take the basic education sector to greater heights.
MR HM MWELI
DIRECTOR-GENERAL
DATE: 23/08/2020

iv
Important note on the COVID-19 pandemic
The five-year plan was formulated before the COVID-19 pandemic. By May 2020, the reality
of the enormous costs of the pandemic for society, the economy, and education were clear. The
effects of the pandemic will remain for years. At the same time, the pandemic provided an
opportunity for South Africans to prove their resilience and ingenuity at a time when the
nation faced a common enemy.
The pandemic does not remove any of the priorities outlined in the plan. However, it delays
the point at which certain milestones can be reached, for budgetary and other reasons.
Moreover, the pandemic reshapes to some extent existing priorities.
The overall goal of the various actors in the basic education sector must remain to improve the
quality of learning outcomes, and reduce educational inequalities. We should not lose sight of
this. South Africa has been on an upward trajectory in terms of the skills acquired by learners
for around two decades. This has profound and positive implications for South Africa’s future.
The momentum of this improvement cannot be lost as a result of the pandemic.
In fact, we can think of illiteracy among our primary school learners almost in the way we have
learnt to think about the coronavirus. It is a scourge which must be eliminated, by identifying
‘hotspots’ where children are not learning as they should, and intervening to ensure that
people’s futures are not compromised.
COVID-19 is unlikely to disappear quickly, and beyond that there is a high likelihood that we
could be struck by another pandemic. In future, the basic education system should be better
prepared for this risk.
Good nutrition is the backbone of effective learning, especially for younger learners. The
National School Nutrition Programme needs to be better prepared to ensure that food continues
to be available to learners from poor households, even during school closures.
Understanding pandemics and viruses needs to feature more strongly in the Life Orientation
curriculum. If teachers and learners understand these topics, they are more likely to embrace
the behavioural changes that pandemics necessitate. There need to be emergency plans which
everyone is familiar with, and which can be put into effect at relatively short notice. Such
emergency plans must include the sudden scaling up of procedures to maintain hygiene, for
instance more frequent hand-washing, cleaning of the school premises, and physical distancing.
There should perhaps be periodic drills of these emergency plans, in the same way as schools
need occasional fire drills.
School infrastructure needs to support hygiene. Here an uninterrupted supply of water, which
has not been a reality for all schools, needs to be prioritised.
Lastly, the COVID-19 pandemic and associated school closures have brought to the fore the
weakness of information and communication technologies (ICTs) in many schools, and gaps
with regard to digital content for learners and teachers. South Africa is behind many similar
countries in this regard. This gap must be closed. Learners, particularly those at the secondary
level facing important national examinations, should become more accustomed to using online
resources. If teachers are accustomed to using these resources, it becomes easier for this to be
realised among learners. Technology innovation is important whether we are faced with a health
crisis or not.

v
Summary of Action Plan to 2024 Section 1 of this plan locates South Africa’s educational
challenges within in a historical context, and explains the role of education in overcoming the legacy of colonialism, inequality and poverty.
Section 2 explains that the plan is directed at anyone with an interest in the transformation of basic education, and describes how it might be used.
Section 3 describes the international and national policy commitments which inform our direction: Thuma mina; the National Development Plan; the Sustainable Development Goals (SDGs); the Continental Education Strategy for Africa (CESA).
Section 4 encapsulates a vision for a modern and decolonised schooling system.
Section 5 presents the theory of educational change that informs this plan, meaning our understanding of how educational improvement comes about.
Section 6 describes recent trends which inform the plan. It outlines serious budgetary and demographic challenges, but also substantial gains in learning outcomes achieved over the last 15 or so years, according to the international and national evidence. Five likely reasons for the improvements are evaluated:
1. The tools of the Curriculum and Assessment Policy Statement
2. Access to high-quality books
3. Assessment practices
4. Improved subject knowledge among teachers
5. Access to both Grade R and pre-school below Grade R
Section 7 describes three areas where innovation is being prioritised:
Early grade reading
Assessments

vi
e-Education
Section 8 explains the key planning elements of the current plan, and of Presidency’s Medium Term Strategic Framework (MTSF), and the overlaps between the two. Planning elements are, for instance, the 27 goals and 36 indicators used in the basic education sector.
Section 9 discusses issues in relation to the first 13 goals of the plan, goals which specify exactly what learning outcomes we want to improve. Much of the emphasis falls the interpretation of the available statistics, and better measures of progress in the future.
Section 10 discusses the remaining 14 goals, goals which specify how learning outcomes are to be improved. (The 27 goals are listed on the following page.)

vii
The 27 Schooling 2030 goals
This plan has 27 goals. Goals 1 to 13 deal with outputs we want to achieve in relation to learning
and enrolments. Goals 14 to 27 deal with how the outputs are to be achieved. Five priority
goals are indicated by three stars (). In the interests of continuity, the 27 goals are the
same as those appearing in Action Plan to 2014 (the one exception is Goal 9, which refers to
Grade 9, where the earlier plan referred to Grade 8). These goals were also used in Action Plan
to 2019.
Goal 1 Increase the number of learners in Grade 3 who, by the end of the year, have mastered the minimum language and numeracy competencies for Grade 3.
Goal 2 Increase the number of learners in Grade 6 who, by the end of the year, have mastered the minimum language and mathematics competencies for Grade 6.
Goal 3 Increase the number of learners in Grade 9 who, by the end of the year, have mastered the minimum language and mathematics competencies for Grade 9.
Goal 4 Increase the number of Grade 12 learners who become eligible for a Bachelors programme at a university.
Goal 5 Increase the number of Grade 12 learners who pass mathematics.
Goal 6 Increase the number of Grade 12 learners who pass physical science.
Goal 7 Improve the average performance of Grade 6 learners in languages.
Goal 8 Improve the average performance of Grade 6 learners in mathematics.
Goal 9 Improve the average performance of Grade 9 learners in mathematics.
Goal 10 Ensure that all children remain effectively enrolled in school at least up to the year in which they turn 15.
Goal 11
Improve the access of children to quality Early Childhood Development (ECD) below Grade 1.
Goal 12 Improve the grade promotion of learners through Grades 1 to 9.
Goal 13 Improve the access of the youth to Further Education and Training (FET) beyond Grade 9.
Goals 14 to 27 deal with the things we must do to achieve our 13 output goals.
Goal 14 Attract a new group of young, motivated and appropriately trained teachers to the teaching profession every year.
Goal 15 Ensure that the availability and utilisation of teachers are such that excessively large classes are avoided.
Goal 16
Improve the professionalism, teaching skills, subject knowledge and computer literacy of teachers throughout their entire careers.
Goal 17 Strive for a teacher workforce that is healthy and enjoys a sense of job satisfaction.
Goal 18 Ensure that learners cover all the topics and skills areas that they should cover within their current school year.
Goal 19
Ensure that every learner has access to the minimum set of textbooks and workbooks required according to national policy.
Goal 20 Increase access amongst learners to a wide range of media, including computers, which enrich their education.
Goal 21
Ensure that the basic annual management processes take place across all schools in the country in a way that contributes towards a functional school environment.

viii
Goal 22 Improve parent and community participation in the governance of schools, partly by improving access to important information via the e-Education strategy.
Goal 23 Ensure that all schools are funded at least at the minimum per learner levels determined nationally and that funds are utilised transparently and effectively.
Goal 24 Ensure that the physical infrastructure and environment of every school inspire learners to want to come to school and learn, and teachers to teach.
Goal 25 Use schools as vehicles for promoting access to a range of public services amongst learners in areas such as health, poverty alleviation, psychosocial support, sport and culture.
Goal 26 Increase the number of schools that effectively implement the inclusive education policy and have access to centres that offer specialist services.
Goal 27
Improve the frequency and quality of the monitoring and support services provided to schools by district offices, partly through better use of e-Education.
1
Contents
1 The historical context........................................................................................................ 4
2 Purpose of the Action Plan ............................................................................................... 7 3 National and international commitments ....................................................................... 9
3.1 Thuma mina and renewal ...............................................................................................9 3.2 The National Development Plan ....................................................................................9 3.3 International commitments ..........................................................................................13
3.4 Curriculum innovation for 21st century skills .............................................................16 4 Our vision of a modern and decolonised schooling system ......................................... 18
5 Our theory of educational change ................................................................................. 20 6 Developments up to 2019 that influence our strategic direction ................................. 27 6.1 The demographic and spending trends ........................................................................27 6.2 Areas of service delivery success ................................................................................31 6.3 Challenges and how to resolve them ...........................................................................42
7 Innovation priorities ....................................................................................................... 44 7.1 Early grade reading ......................................................................................................44
7.2 Assessments .................................................................................................................48 7.3 e-Education ..................................................................................................................54 8 The correspondence between MTSF and Action Plan elements ................................. 60 9 Output goals that look at learning outcomes and coverage (Goals 1 to 13) ............... 65 9.1 Goals 1 to 3: Meeting minimum standards in grades 3, 6 and 9 .................................65
9.2 Goals 4 to 6: Meeting minimum standards in Grade 12 ..............................................73 9.3 Goals 7 to 9: Improving average performance in international tests ...........................78 9.4 Goal 10: Compulsory schooling ..................................................................................90
9.5 Goal 11: Access to ECD and Grade R .............................................................92 9.6 Goals 12 to 13: Improving grade attainment ...............................................................94 10 The goals dealing with the how of improving schooling (Goals 14 to 27) ................ 100 10.1 Goal 14: Supply of young teachers ............................................................................100 10.2 Goal 15: Teacher availability and class sizes ............................................................104
10.3 Goal 16: Teacher capacity and professionalism ............................................107 10.4 Goal 17: Teacher well-being and job satisfaction .....................................................112
10.5 Goal 18: Curriculum coverage in schools .................................................................113 10.6 Goals 19 to 20: Educational materials ...........................................................114 10.7 Goal 21: School management ........................................................................116
10.8 Goal 22: Community participation ............................................................................118 10.9 Goal 23: School funding ............................................................................................119
10.10 Goal 24: School buildings and facilities ....................................................................121 10.11 Goal 25: Learner well-being ......................................................................................123 10.12 Goal 26: Inclusive education .....................................................................................125 10.13 Goal 27: District support ................................................................................126 Appendix B: District codes ................................................................................................. 132
Appendix C: Corrections to the initially published PIRLS trend ................................... 133 Appendix D: Useful documents .......................................................................................... 136
2
Acronyms used
ANA Annual National Assessments
APP Annual Performance Plan
AU African Union
CAPS Curriculum and Assessment Policy Statement CESA Continental Education Strategy for Africa
CPI Consumer price index
CPTD Continuing professional teacher development
DBE Department of Basic Education
DDD Data Driven Districts
DHET Department of Higher Education and Training
DPME Department of Performance Monitoring and Evaluation
ECD Early Childhood Development
FET Further Education and Training
GHS General Household Survey
ICT Information and communication technologies
IEA International Association for the Evaluation of Educational Achievement
IQMS Integrated Quality Management System
IRT Item response theory
ITE Initial teacher education
LTSM Learning and teaching support material
LURITS Learner Unit Record Information Tracking System
MDG Millennium Development Goal
MTSF Medium Term Strategic Framework
NDP National Development Plan
NECT National Education Collaboration Trust
NEEDU National Education Evaluation and Development Unit
NGO Non-government organisation
NQF National Qualifications Framework
NSC National Senior Certificate
NSNP National School Nutrition Programme
OAG Office of the Auditor-General PIRLS Progress in International Reading Literacy Study
PLC Professional learning community
QMS Quality Management System
SACMEQ Southern and Eastern Africa Consortium for Monitoring Educational
Quality
SA-SAMS South African School Administration and Management System
SBA School-based assessment
SDG Sustainable Development Goal
SES Socio-economic status
SGB School Governing Body
SMS School Monitoring Survey
SONA State of the Nation Address
Stats SA Statistics South Africa
TALIS Teaching and Learning International Survey
TIMSS Trends in International Mathematics and Science Study
TVET Technical and vocational education and training
UN United Nations
UNESCO United Nations Educational, Scientific and Cultural Organization
UNICEF United Nations Children’s Fund
WEF World Economic Forum

3
The following acronyms are used for the provinces:
EC Eastern Cape
FS Free State
GP Gauteng
KN KwaZulu-Natal LP Limpopo
MP Mpumalanga
NC Northern Cape
NW North West
WC Western Cape

4
1 The historical context
The NDP on education’s role in dealing with the apartheid legacy:
The education system will play a greater role in building an inclusive
society, providing equal opportunities and helping all South Africans
to realise their full potential, in particular those previously
disadvantaged by apartheid policies, namely black people, women
and people with disabilities. (p. 296)
In 2018, the Department of Basic Education released the Report of the History Ministerial Task
Team to address the ‘perceived lack of knowledge of the country’s history amongst learners, and the role of history in instilling love of country’1. Just as an understanding of South Africa’s
history among all citizens is a pre-requisite for social cohesion, the challenges and successes of
the schooling system cannot be properly understood without a good grasp of this system’s
history.
Much has been written about the history of education in South Africa. Unfortunately, some of
it suffers from the biases seen in many South African history books. The perspectives of the
colonised have been ignored and often the history presented attempts, explicitly or implicitly,
to justify the process of colonisation and oppression. Fortunately, recent decades have seen the
emergence of more balanced accounts of our past, including the past of our education system.
We now have histories that detail how the education system was used to maintain racial and
gender prejudices and stereotypes, and perpetuate inequalities. Understanding this history is
vital for the ongoing transformation of education and to ensure that education helps create a
society that values equality and rejects prejudice.
There are a few aspects of our history that deserve special mention here because they inform
the education strategies of government rather directly and should be kept in mind as the debates
and planning proceed.
Apartheid brought with it prolonged segregation by race, but also language, with a ferociousness not seen in any other country during the twentieth century. South Africa has been
lauded for its ability to realise reconciliation and shared values, partly through its highly
progressive Constitution, following the formal end of apartheid in 1994. However, the legacy
of division is still strong and is reinforced by economic inequalities. What this means is that
schools and the schooling system must continuously make a conscious effort to heal the
divisions of the past, foster a sense of South African nationhood and, above all, provide
education opportunities that will break down the deep inequalities that still pervade South African society. In higher education in recent years,
this work has increasingly been referred to as the work
of decolonising education. This term is also applicable
to basic education. Here too, decolonising the system
as a whole, and the curriculum in particular, involves
understanding the harm done to nationhood and the
psychology of both the oppressed and the oppressors.
This understanding should guide a process of healing
which affirms equality, undoes the marginalisation of African culture and values brought about
by colonisation and apartheid, and moves beyond the confines a Eurocentric world view and
curriculum.
1 Department of Basic Education, 2018a: 8.
…decolonising the system as a whole, and the curriculum in particular, involves understanding the harm done to nationhood and the psychology of both the oppressed and the oppressors.

5
Apartheid, especially following the 1953 Bantu Education Act, was characterised not only by
the racial segregation of learners but, crucially, also by segregation in the training of teachers2.
Different groups of teachers experienced training that was different in terms of its resourcing,
its quality and its ideological thrust. Individual teachers, teacher unions, NGOs and government
have done much work over the years to erode the apartheid teacher training legacy through, for
instance, new in-service training programmes and the promotion of common values via the
mass media. Yet, this apartheid legacy will remain present for many years to come. It will
continue to be necessary to address these legacy problems in the design of in-service
training and in the way training programmes are targeted towards teachers.
Per learner spending by the state under apartheid was highly unequal and differentiated by race
and ethnicity. Although these funding inequalities became slightly smaller towards the end of
apartheid, in 1994, spending on every white learner was still about 4,5 times as high as for every
black African learner. It was only in around 2000 that public spending per learner came close
to being equal and that the apartheid spending legacy, at least in a recurrent expenditure sense,
could be said to have ended. However, the legacy of inequality with respect to many years of
unequal expenditure remains stark, both as far as backlogs in physical capital (such as school
buildings) are concerned and human capital (largely due to the unequal teacher training legacy
referred to previously). Moreover, the allowance made after 1994 for the charging of fees in
public schools serving the middle class, subject to exemptions in the case of learners from poor
households, means that, even as far as total recurrent spending is concerned, there are large
spending inequalities, though these inequalities are considerably smaller than those that existed
under apartheid. Allowing school fees in public schools has often been referred to as the cost
of maintaining an inclusive public school system serving a broad range of the South African
society. Indeed, by developing country standards, the size of South Africa’s independent school
sector is small. Instead, social inequities are reflected within the public school system, as
opposed to between the public and private school systems, as happens in many other developing
countries. These historical factors make South Africa’s school funding system complex and, in
many ways, unique. A key challenge will continue to be improving equality within a public
school system that operates within a highly unequal society. Reducing inequality in basic
education, in particular with respect to the skills learners leave school with, is fundamental for
bringing about a more equal society.
South Africa’s education system can be proud of its contribution towards the struggle against
colonialism and apartheid. Schools, from the many missionary schools which, over the
centuries, opposed attempts by colonial authorities to stop the education of black South
Africans, to the government schools in Soweto and other townships in the 1970s, where students
faced the might of the apartheid state, have been at the centre of the struggle for a new South
Africa. Many of South Africa’s post-apartheid leaders
emerged from student and teacher organisations. The
protests that began with the 1976 schools uprising and
continued almost unabated until the fall of apartheid were necessarily directed at undermining the authority
of the apartheid state. They played an important
historical role. The cost of this struggle, many have
argued, is that in too many schools it became difficult
to re-instate authority and discipline, after 1994, in line
with the new school policies of a democratic South Africa. This Action Plan acknowledges that
insufficient discipline and accountability in the system, from the classroom up to the
offices of some senior managers in the administration, continues to be a hurdle in the path
of development.
2 See for instance Rakometsi (2008).
…insufficient discipline and accountability in the system, from the classroom up to the offices of some senior managers in the administration, continues to be a hurdle in the path of development.
6
An important aspect of the struggle against apartheid was its grassroots nature and its reliance
on local democratic structures. South Africa’s school governing bodies (SGBs) are an important
embodiment of this tradition and should be upheld as a means of maintaining accountability to
local communities. This Action Plan promotes strong SGBs that play a key role in improving
the quality of schooling.
The 1913 Land Act set in motion a process of land
dispossession and resettlement that has shaped the
human geography of South Africa and influenced the
location of schools. Schools in former ‘homelands’
account for just under half of all public school
enrolments and face a particular form of poverty
characterised by the inaccessibility of public facilities
and jobs. It has been argued, for instance in the 2005
Ministerial Report on Rural Education, that the specific
needs of schools in former ‘homelands’, for instance in terms of poverty alleviation and relevant
skills development, have not been sufficiently catered for by our education policies. To a large
degree quintiles 1 to 3 of the five socio-economic quintiles cover the schools in question,
meaning that many of the quintile-specific interventions by government are attempts to
address the specific needs of rural schools.
Around the world, much of the legacy of colonialism persists through the dominance of colonial languages. In South Africa, English, though only spoken by about 4% of public school learners
as a home language3, is the predominant language of the textbooks used in classrooms, as well
as in the system’s policy documents. The history of marginalisation of the remaining official
languages and, in particular, of the country’s nine African languages continues, despite the
official position of equality between the languages as enshrined in the 1996 Constitution. The
schooling system needs to pay special attention to the promotion of all official languages.
Compelling research indicating that young children learn best if, during the first few years of their schooling, key concepts are taught in their home language, informs South Africa’s
education policies. But beyond these pedagogical considerations, promoting all languages in
the education system is a matter of national pride and of liberation.
Finally, there is a strong tradition of associating success in education with academic studies at
a university after school. While university studies are obviously a noble and important pursuit,
alternatives have not received the focus they deserve in schools. In particular, vocational
training options within schools and beyond basic education have not been sufficiently available
and, when available, were under-valued by many teachers and parents. This is partly a symptom of the history of unequal access to vocational training under apartheid and the legacy of race-
based job reservation. Even today, in the National Senior Certificate examinations, white
learners are six times as likely as black African learners to take one or more of the four key
technical subjects4. Schools, in particular secondary schools, must provide black learners with
better access to vocationally-oriented subjects and should play a more pro-active role in
alerting the youth to new training and job opportunities and in moving away from a narrow
focus on university studies as the only post-school study option.
3 Analysis of 2016 Community Survey microdata. 4 Engineering Graphics and Design, Civil Technology, Electrical Technology, Mechanical Technology.
The 1913 Land Act set in motion a process of land dispossession and resettlement that has shaped the human geography of South Africa and influenced the location of schools.

7
2 Purpose of the Action Plan
This plan represents another milestone in the journey towards quality schooling for all South
Africans. This document takes stock of key developments in the basic education sector since
the release in 2015 of the last sector plan, Action Plan to 2019: Towards the realisation of
Schooling 2030. It reiterates many of the priorities outlined in Action Plan to 2019, as well as the earlier Action Plan to 2014. However, there are also shifts of emphasis in the wake of lessons
learnt in recent years.
The current plan is directed at a broad range of stakeholders involved in the momentous task of
transforming South Africa’s schools. These stakeholders include parents, teachers, school
principals, officials at the district, provincial and national levels, members of Parliament,
leaders in civil society organisations, including teacher unions, private sector partners,
researchers, and international partner agencies such as UNICEF and the World Bank. The
document also serves to share with people outside the country, including foreign investors, ideas and strategies that South Africans firmly believe will enhance our education levels, and
hence our prosperity, social cohesion, and ability to contribute to global development.
This plan provides continuity insofar as it follows the basic structure of the previous two sector
plans. Thus, the original 27 goals covering a broad range of issues and interventions remain. Of
these 27 goals, 13 deal with performance and participation outcomes we strive for and 14 deal
with the ‘how’ of realising these improvements, in other words actions that need to be taken to
strengthen the sector. Twenty-seven goals may seem like many goals, but they are retained as
we want to underline how diverse the role players are who contribute towards educational
improvement. To promote focus within the system, however, five of the 27 goals remain
priority goals. These deal with Grade R, teacher development, learning materials, school
management and support by district offices. The five priority goals are indicated by in
this plan. The 36 indicators of Action Plan to 2019, which are attached to individual goals, also
remain, though how they are dealt with differs (see section 8).
There are a number of planning documents that guide the basic education sector apart from this
one. What they say is essentially the same, but their intended audiences, time horizons and level
of detail differ. Other important documents include the following:
National Development Plan 2030: Our future – make it work. This plan, released by the President in 2012, is a landmark document that guides the nation. It is based on much
research and public consultation. The sections in the plan dealing with education also drew
to a large degree from early versions of Action Plan to 2014. The current Action Plan is
closely aligned to the National Development Plan (NDP).
Medium Term Strategic Framework. The MTSF document, produced by Presidency,
translates the National Development Plan commitments to actions to be taken during the
2019 to 2024 electoral cycle. In producing the basic education section of the MTSF,
Presidency worked closely with the Department of Basic Education (DBE). The MTSF focusses on seven priorities, of which Priority 2, ‘Education, skills and health’ is of special
relevance to the basic education sector. A key purpose of the MTSF is to demonstrate how
the seven priorities link to each other, for instance how health, education and employment
creation support each other.
Strategic plan of the DBE 2019-2024. This plan, which guides each annual plan (or
‘Annual Performance Plan’) of the DBE, is required by the Department of Performance
Monitoring and Evaluation (DPME) and is strongly focussed on how the DBE will use its
budget to contribute towards progress in the basic education sector. It should be
remembered, however, that most spending in this sector is from the budgets of provincial
education departments. The provincial departments each have their own five-year strategic
8
plan and annual performance plans. The DBE works hard at ensuring that the plans of the
ten departments (the DBE and the nine provincial departments) are aligned to each other,
to the Action Plan, and to the NDP.

9
3 National and international commitments
3.1 Thuma mina and renewal
Developments in the education sector need to be aligned to the broader development goals of
the national government, and South Africa’s commitments to a host of global agreements
relating to human development.
In his maiden State of the Nation Address to Parliament in 2018, President Ramaphosa laid out
a vision, widely referred to as Thuma mina, to arrest what had been several years of
deterioration with respect to key development indicators, including levels of poverty and
unemployment. While the speech also acknowledges
ongoing improvements in the outcomes of our
education system, this system would not be immune to
a worsening economic context. In calling citizens and
public servants to become personally involved in a
process of national renewal, the President drew from
Hugh Masekela’s song ‘Thuma mina’ (‘send me’):
I wanna be there when the people start to turn it around
When they triumph over poverty
…
I wanna lend a hand
Send me.
Though the President affirmed that the ‘majority of [public servants] serve our people with
diligence and commitment’, he also emphasised that there had been a ‘tide of corruption’,
involving both the public and private sectors, a tide which urgently needed to be turned.
Important elements of this task include a renewed
‘commitment to ethical behaviour and ethical
leadership’ among everyone, a return to the mission of
building a capable state, as well as a refocussing among
public servants on the ‘people first’ principle of Batho
Pele. ‘We want to instil a new discipline, to do things correctly, to do them completely and to do them
timeously,’ he pointed out. He moreover called for ‘professional bodies and regulatory
authorities to take action against members who are found to have acted improperly and
unethically’. Section 6 below outlines how the negative economic climate, have been felt in the
basic education sector. The President’s call for renewal and action is a central concern of the
current Action Plan.
Important features of President Ramaphosa’s subsequent two 2019 State of the Nation
Addresses are discussed in various places in the current plan.
3.2 The National Development Plan
The NDP on the role of educational quality in the national
development process:
Improved education ... will lead to higher employment and earnings,
while more rapid economic growth will broaden opportunities for all
and generate the resources required to improve education. (p. 26)
‘We want to instil a new discipline, to do things correctly, to do them completely and to do them timeously,’…
President Ramaphosa laid out a vision, widely referred to as ‘Thuma mina’, to arrest what had been several years of deterioration with respect to key development indicators…

10
Government’s apex plan is the National Development Plan (NDP), National development plan
2030: Our future - make it work, published by the National Planning Commission in 20125. The
NDP is referenced in many places in the current plan. This section sums up the basic education
priorities put forward in the NDP. Further details about these priorities, and how successful the
sector has been in responding to them, are outlined in sections 7 to 10.
Chapter 9 of the NDP deals with education. However, other parts of the plan, dealing for
instance with the kind of society we strive for, and the systems and culture needed in the public
service as a whole, are also important for the sector.
Social cohesion is emphasised in the following (from the plan’s overview):
The plan envisions a South Africa where everyone feels free yet bounded to others;
where everyone embraces their full potential, a country where opportunity is determined
not by birth, but by ability, education and hard work. (p. 24)
Economic development is recognised as critical for fighting poverty, and in this fight education
plays a central role6:
Improved education ... will lead to higher employment and earnings, while more rapid
economic growth will broaden opportunities for all and generate the resources required
to improve education. (p. 26)
Critical success factors for the NDP, but also for effective planning and implementation in
education, are the following (p. 59):
Focused leadership: ‘Policy changes should be approached cautiously based on
experience and evidence ...’
A plan for all: ‘Broad support across society is needed for ... successful implementation
... Vigorous debate is essential for building consensus.’
Institutional capability: ‘Institutions improve through continuous learning and
incremental steps ... This requires good management ... high performance ... ethics and
a willingness to learn from experience.’
Willingness to prioritise: ‘... senior public officials should focus most of their attention
on a few strategic priorities.’
Chapter 3, dealing with the economy and employment, includes proposals which are of direct
relevance for basic education:
Provide skills development for students currently in school with a focus on grooming
an entrepreneurial attitude. This should include reviewing the curriculum with a view
to encouraging entrepreneurial thinking and creating the skills necessary for start-ups.
The review should consider focusing education into technical and academic streams
after grade 8, and establishing vocational and technical training for students in grades 9
and 11. (p. 143)
The above underpins the DBE’s Three Stream Model proposal, discussed in section 3.4 below.
5 National Planning Commission, 2012. 6 A recent World Bank (2018a) report on fighting poverty in South Africa provides important details on
the relationship between poverty reduction and education.

11
Turning to Chapter 9, the sections on early childhood development (ECD) and basic
education are of direct relevance to the basic education sector.
The section on early childhood development stresses the need to deal with the very basics of
early childhood development. In South Africa, high numbers of children suffer from physical
stunting as a result of poor nutrition in the early years – one in five children are affected according to the NDP (p. 299). The ten government departments, one national and nine
provincial, dealing with basic education are expected to take on a larger responsibility in the
area of ECD, insofar as these departments would begin managing the public funding of ECD
centres. These departments are also expected to take forward the NDP goal of universal
coverage for all children in the year prior to Grade R. ECD centres are expected to provide not
just education, but a range of support, including nutrition.
The section on basic education has 11 sub-sections.
(1) The role of stakeholders in basic education. The NDP reiterates the ideal of collaboration,
support and accountability between stakeholders as expressed in existing education policies.
Specific systems to facilitate accountability to parents are envisaged:
Providing meaningful information to parents on their children’s performance can enable
them to hold schools accountable. Performance tends to improve when parents are
actively involved and take an interest in the affairs of the school. (p. 303)
(2) School infrastructure. The NDP stresses the importance of applying minimum standards,
and envisages all schools having libraries, laboratories, computer centres and broadband.
(3) Curriculum, incentives, inclusivity and language issues. The plan emphasises curriculum
stability, and reiterates existing policy positions that emphasise the need for mother tongue
instruction in the initial years of school, in order to establish a solid reading and language
scaffolding for the child. Better career guidance, starting at the primary level, is also
emphasised.
(4) Sports, art and culture. The role of both sports and physical education are affirmed, in a
context where health problems such as child obesity are on the rise. Arts and culture should be
used to promote an understanding of history.
(5) Long-term goals for basic education. The top long-term developmental priority in the
NDP is to increase the percentage of learners reaching adequate achievement levels with respect
to their language and mathematical (or numeracy) competencies. Monitoring of this should
occur via national assessment programmes, as well as participation in international
programmes. This aligns with global monitoring priorities agreed on in conjunction with the
Sustainable Development Goals – see section 3.3 below. Moreover, at a higher level of
achievement, it is expected that a much larger percentage of Grade 12 learners would be ready
for mathematically- and scientifically-oriented programmes at university.
(6) Retain more learners. Here the aim falls on getting more youths to complete twelve years
of education, either at school in some alternative institution, such a TVET7 college. This has
implications for coordination between the Department of Basic Education (DBE) and the
Department of Higher Education and Training (DHET).
(7) Proposals to improve human capacity. This is a substantial sub-section. Increasing the
quantity of teachers over the longer term, in order to reduce the number of unacceptably large classes, is emphasised. Improving the quality of teaching should also be pursued through
7 Technical and vocational education and training.

12
various strategies. Effective in-service training is needed, teachers need better access to the
latest technologies that assist teaching, career paths should be better at rewarding good teachers,
and teachers in schools whose results improve should be rewarded through incentives directed
to the school as a whole. The critical importance of relations between the employer and
teacher unions is acknowledged. In line with lessons from other countries, union leaders
should be given access to training that will assist them in fulfilling their role as leaders in the
profession and in the broader national development process. Finally, the NDP calls for the
departments to assume a more pro-active role in determining where young teachers end up
teaching, in the interests of getting more good teachers with relevant qualifications into
historically disadvantaged schools.
(8) Proposals for improving school management. In order to strengthen management by
existing school principals, both support and accountability are emphasised. The capacity of
districts to support schools is important. Moreover, work needs to proceed on the design of
performance contracts for school principals. Principals who repeatedly fail to reach reasonable
targets should be replaced. The South African Schools Act approach of increasingly placing
mechanisms for school improvement under the control of principals – they need powers if they
are to be held accountable – is affirmed in the NDP. With regard to the appointment of new
school principals, the NDP proposes the use of competency assessments, and underlines the
importance of removing undue union influence in the appointment process, partly by
strengthening the relevant oversight functions in districts.
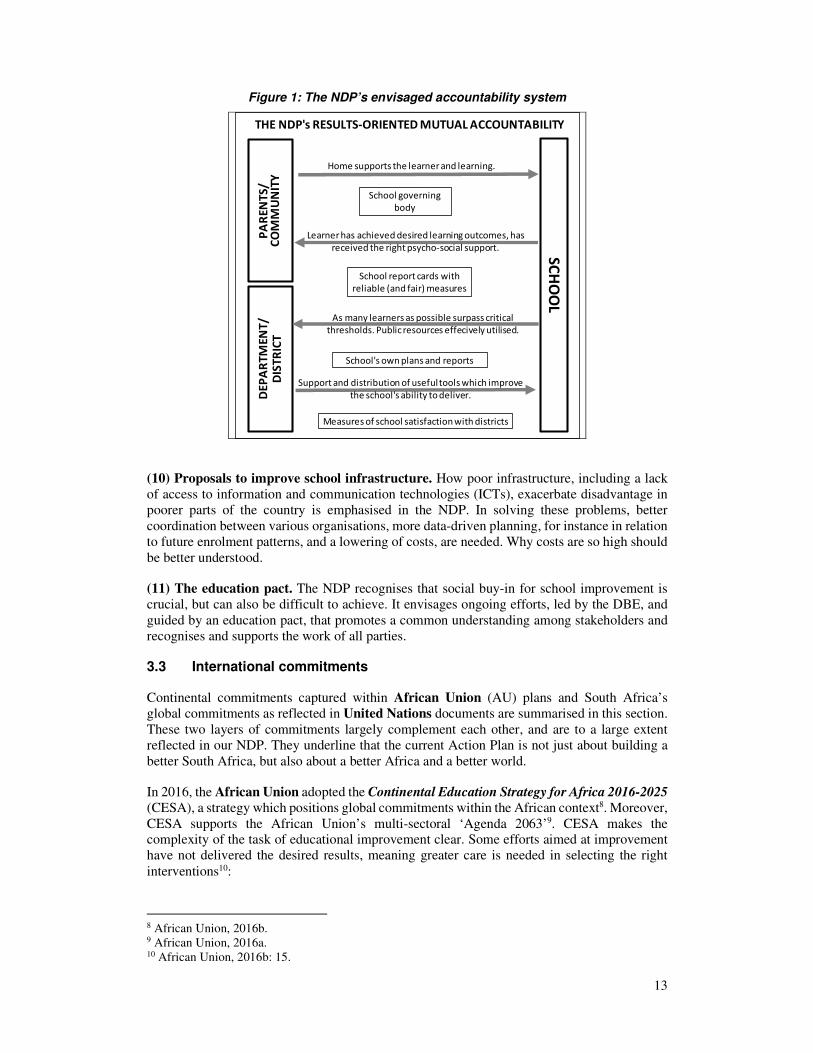
(9) Proposals for results oriented mutual accountability. The NDP envisages a strengthening
of two-way accountability between districts and schools: districts need to provide support and
services which schools find useful, and schools need to account to districts for the quality of
the schooling offered to the community. Moreover, two-way accountability between parents
and the school are needed: schools need to report in better ways to parents on how well children
learn, and parents need to demonstrate that they provide support in the home. Crucially, these
lines of accountability depend on ‘reliable measures’ of learning outcomes at schools which everyone can use to gauge progress. The NDP acknowledges how difficult accountability
reforms can be:
Accountability measures are likely to be met with resistance because they change the
balance of power. At first, they will add to the workload of teachers and principals and
put new obligations on parents. Once systems and routines are established, the workload
will lessen and the system will deliver benefits for everyone. (p. 311)
The following diagram illustrates the NDP’s ‘results oriented mutual accountability’ system, or
‘ROMA’. The elements of this are discussed further in, for instance, section 5.
13
Figure 1: The NDP’s envisaged accountability system
(10) Proposals to improve school infrastructure. How poor infrastructure, including a lack
of access to information and communication technologies (ICTs), exacerbate disadvantage in
poorer parts of the country is emphasised in the NDP. In solving these problems, better
coordination between various organisations, more data-driven planning, for instance in relation
to future enrolment patterns, and a lowering of costs, are needed. Why costs are so high should
be better understood.
(11) The education pact. The NDP recognises that social buy-in for school improvement is
crucial, but can also be difficult to achieve. It envisages ongoing efforts, led by the DBE, and
guided by an education pact, that promotes a common understanding among stakeholders and
recognises and supports the work of all parties.
3.3 International commitments
Continental commitments captured within African Union (AU) plans and South Africa’s
global commitments as reflected in United Nations documents are summarised in this section.
These two layers of commitments largely complement each other, and are to a large extent
reflected in our NDP. They underline that the current Action Plan is not just about building a
better South Africa, but also about a better Africa and a better world.
In 2016, the African Union adopted the Continental Education Strategy for Africa 2016-2025
(CESA), a strategy which positions global commitments within the African context8. Moreover,
CESA supports the African Union’s multi-sectoral ‘Agenda 2063’9. CESA makes the complexity of the task of educational improvement clear. Some efforts aimed at improvement
have not delivered the desired results, meaning greater care is needed in selecting the right
interventions10:
8 African Union, 2016b. 9 African Union, 2016a. 10 African Union, 2016b: 15.
THE NDP's RESULTS-ORIENTED MUTUAL ACCOUNTABILITY
SC
HO
OL
PA
RE
NT
S/
CO
MM
UN
ITY
DE
PA
RT
ME
NT
/D
IST
RIC
T
Learner has achieved desired learning outcomes, has
received the right psycho-social support.
Home supports the learner and learning.
School governing
body
School report cards with
reliable (and fair) measures
School's own plans and reports
Measures of school satisfaction with districts
As many learners as possible surpass critical
thresholds. Public resources effecively utilised.
Support and distribution of useful tools which improve
the school's ability to deliver.

14
In some instances, data on learning achievements point to more than two-thirds of the
children failing to read competently at the grade levels they are in…. This is a result of
poor quality of teaching, facilities and dire lack of learning materials. Moreover,
leadership, school management and quality assurance in this sub-sector have been
ineffective in bringing about meaningful reforms.
CESA puts forward twelve strategic objectives, of which eleven are directly relevant to basic
education and are listed in the table appearing below11.
The Sustainable Development Goals (SDGs) of the United Nations12 replace the previous
Millennium Development Goals (MDGs), which expired in 2015. The SDGs differ from the
MDGs in two fundamental respects. Firstly, in education they shift the emphasis decisively
towards the quality of schooling, or what learners actually learn, where the MDGs had focussed
largely on enrolment. Secondly, they represent an important shift towards a much stronger
concern around the dangers of inequality, across the world and within countries. The quality of schooling, and the ‘inequality of quality’, are matters which have been on the South African
policy agenda for many years. The fact that they are central to the SDGs should be welcomed.
SDG Goal 4 is: ‘Ensure inclusive and equitable quality education and promote lifelong
learning opportunities for all’. This goal has a number of sub-goals, which are listed in the
table below (just the sub-goals of direct relevance to basic education are listed)13. The aim of
this table is in part to facilitate comparison of the AU and UN education goals. The goals have
been arranged in a manner, and with headings, which facilitate linking to the current Action
Plan.
Strategic objectives of the African
Union’s Continental Education Strategy
for Africa 2016-2025
Sub-goals related to basic education of
the UN’s Sustainable Development Goals
e-Education
3. Harness the capacity of ICT to improve
access, quality and management of
education and training systems.
Assessments and basic learning outcomes
4: Ensure acquisition of requisite knowledge
and skills as well as improved completion
rates at all levels and groups through
harmonization processes across all levels for
national and regional integration.
5. Accelerate processes leading to gender
parity and equity.
4.1 By 2030, ensure that all girls and boys
complete free, equitable and quality primary
and secondary education leading to relevant
and effective learning outcomes.
4.5 By 2030, eliminate gender disparities in
education and ensure equal access to all levels of education and vocational training
for the vulnerable, including persons with
disabilities, indigenous peoples and children
in vulnerable situations.
4.6 By 2030, ensure that all youth and a
substantial proportion of adults, both men
and women, achieve literacy and numeracy.
11 The excluded one is SO 9: ‘Revitalize and expand tertiary education, research and innovation to address
continental challenges and promote global competitiveness’. 12 United Nations, 2017a. 13 Goal 13.3, on education and environmental sustainability, is the only sub-goal in the table falling
under a main goal other than Goal 4.

15
Strategic objectives of the African
Union’s Continental Education Strategy
for Africa 2016-2025
Sub-goals related to basic education of
the UN’s Sustainable Development Goals
21st century skills
7. Strengthen the science and math curricula
in youth training and disseminate scientific
knowledge and culture in society.
8. Expand TVET opportunities at both
secondary and tertiary levels and strengthen
linkages between the world of work and
education and training systems.
4.4 By 2030, substantially increase the
number of youth and adults who have
relevant skills, including technical and
vocational skills, for employment, decent
jobs and entrepreneurship.
4.3 By 2030, ensure equal access for all
women and men to affordable and quality
technical, vocational and tertiary education,
including university
Social cohesion and the environment
10. Promote peace education and conflict
prevention and resolution at all levels of
education and for all age groups.
4.7 By 2030, ensure that all learners acquire
the knowledge and skills needed to promote
sustainable development, including, among others, through education for sustainable
development and sustainable lifestyles,
human rights, gender equality, promotion of
a culture of peace and non-violence, global
citizenship.
13.3 Improve education, awareness-raising
and human and institutional capacity on
climate change mitigation, adaptation,
impact reduction and early warning and
appreciation of cultural diversity and of
culture’s contribution to sustainable
development.
Early childhood development
4.2 By 2030, ensure that all girls and boys
have access to quality early childhood
development, care and pre-primary
education so that they are ready for primary
education.
Management and governance
11. Improve management of education
system as well build and enhance capacity
for data collection, management, analysis,
communication, and use.
12. Set up a coalition of stakeholders to
facilitate and support activities resulting
from the implementation of CESA 16-25.
Teachers and teaching
6. Launch comprehensive and effective
literacy programmes across the continent to
eradicate the scourge of illiteracy.
1. Revitalize the teaching profession to
ensure quality and relevance at all levels of
education.
4.c By 2030, substantially increase the
supply of qualified teachers, including
through international cooperation for
teacher training in developing countries,
especially least developed countries and
small island developing States.

16
Strategic objectives of the African
Union’s Continental Education Strategy
for Africa 2016-2025
Sub-goals related to basic education of
the UN’s Sustainable Development Goals
School buildings and facilities
2. Build, rehabilitate, preserve education
infrastructure and develop policies that
ensure a permanent, healthy and conducive
learning environment in all sub-sectors and
for all, so as to expand access to quality
education.
4.a Build and upgrade education facilities
that are child, disability and gender sensitive
and provide safe, non-violent, inclusive and
effective learning environments for all.
3.4 Curriculum innovation for 21st century skills
Though the fundamentals of education, in particular the acquisition of basic language, literacy
and numeracy skills, will be crucial no matter what happens in the wider world, the extent to which school curricula are relevant in a rapidly changing world is often questioned. Both the
AU and UN goals outlined in section 3.3 allude to the need for innovation in education to make
youths better prepared for a society and labour market which has in many respects changed.
In South Africa, these debates are influenced by the need to tackle the country’s glaring
inequalities and the legacy of apartheid. In his 2018 State of the Nation Address (SONA),
President Ramaphosa emphasised the need to harness technological change to advance radical
economic transformation. Government has defined radical economic transformation as
follows14:
Government’s programme of radical economic transformation is about placing the economy on a qualitatively different path that ensures more rapid, sustainable growth,
higher investment, increased employment, reduced inequality and deracialisation of the
economy.
This is to be achieved through, in particular, employment-generating investments in productive
infrastructure which address spatial imbalances, a shift to the ‘green economy’, greater
competitiveness, broad-based black economic empowerment (BBBEE) initiatives, and the
elimination of unnecessary regulatory burdens and skills development. The schooling system
needs to make optimal use of emerging technologies to strengthen teaching and learning, but also needs to consider how learners can be better prepared for technological change in society,
and to help bring about radical economic transformation. The President, in the 2018 SONA,
underlined that ‘young people [should] be exposed to the world of work through internships,
apprenticeships, mentorship and entrepreneurship’. Some of this should start already in school.
Moreover, he reiterated that ‘the growth of our economy will be sustained by small businesses’,
a position that underlines the importance of entrepreneurial thinking and financial literacy.
The DBE has taken a number of steps to improve the readiness of learners for the 21st century.
A major 2018 study, drawing from local and international expertise, has charted a possible way
forward for advancing e-Education, which includes improving the exposure of schools and
learners to new technologies. This study is discussed in section 7.3 below. Policy work and
limited piloting in relation to the Three Stream Model has been conducted by the DBE. This
model involves creating three streams at the secondary level: academic; technical vocational;
technical occupational. The technical vocational stream differs from the technical occupational
stream insofar as it has a stronger theory component and is easily taken through to the post-school level, in particular TVET colleges. Within schools, the three streams are designed to
14 Presidency, 2014: 6.

17
extend down to Grade 7, in contrast to the current system where subject differentiation only
begins in Grade 10. As indicated in section 3.2, the basic elements of the model appear in the
NDP. As indicated in the 2019 budget speech of the Minister of Basic Education, curriculum
specialisation would be realised through Focus Schools or National Schools of Specialisation.
The legal recognition of such schools in the South African Schools Act was introduced in
201115. Turning to the primary level, the DBE completed in 2019 a curriculum for coding and
robotics for Grades R to 3, and Grade 7. The piloting of this curriculum in selected schools
begins in 2020.
An influential 2016 UNESCO guide titled Guiding principles for learning in the twenty-first
century expressed the need as follows16:
…there is increasing understanding that new areas of knowledge, competences, and
behaviours need to be integrated into curricula if young people are going to function
well in an increasingly complex global society. In the future, they may be faced with enormous challenges associated with poverty, overpopulation, and declining bio-
capacity.
This guide also acknowledges that while the need is widely recognised, how exactly to adapt
school curricula is much debated. It emphasises embracing basic principles that everyone can
agree on. The principles put forward in the guide cover four core areas: knowledge,
competencies, attitudes and broad approaches to learning.
The 2019 World Development Report, which focusses on current trends in the nature of work,
underlines the importance of the foundational skills that must underlie any move to more
advanced skills17:
Three types of skills are increasingly important in labor markets: advanced cognitive
skills such as complex problem-solving, sociobehavioral skills such as teamwork, and
skill combinations that are predictive of adaptability such as reasoning and self-efficacy.
Building these skills requires strong human capital foundations and lifelong learning.
The World Economic Forum (WEF), which brings together leaders in the public and private
sectors across the world, has expressed the need in terms of preparing youths for the Fourth
Industrial Revolution. A WEF report titled Realizing human potential in the Fourth Industrial
Revolution18 underlines the need for ‘digital fluency’ – learners should become more
knowledgeable about the technical aspects of the systems they deal with on a daily basis, such
as social media, but should also understand they impact in beneficial and sometimes harmful
ways on society.
What education systems to turn to as ‘role models’ in modernising our approaches is hotly
debated. To illustrate, while the WEF has strongly promoted looking at advanced countries19,
the World Bank, in its 2018 World Development Report, has warned developing countries
against attempting to import, for instance, the decentralised ‘Finland model’ into a context
where institutions and teacher capacity are weak20. Clearly, while there is value in
understanding how advanced systems work, the fact that any education system needs to
modernise in stages must be accepted.
15 See section 12(3)(iii) of the Act, inserted by the 2011 Basic Education Laws Amendment Act. 16 Hughes and Acedo, 2016: 6. 17 World Bank, 2019b: 3. 18 World Economic Forum, 2017. 19 World Economic Forum, 2017: 11. 20 World Bank, 2018c: 175.

18
4 Our vision of a modern and decolonised schooling system
The NDP...
... envisions a South Africa where everyone feels free yet bounded to
others; where everyone embraces their full potential, a country where
opportunity is determined not by birth, but by ability, education and
hard work. (p. 24)
The vision for schools that guides this document is stated below. It is essentially the same vision
that informed the previous two Action Plans.
Making sure that every young South African receives quality schooling is an urgent need. Yet,
we realise that this cannot be brought about overnight. We need a clear vision of where we want
to be in 2030, or even before then if possible. And we must make sure that every year we move
a bit closer to our vision, recognising that a large improvement is actually an accumulation of
many smaller changes. By 2030 we must see the following in every South African school:
Learners attend school every day and are on time because they want to come to school, the
school is accessible and because they know that if they miss school when they should not, some
action will be taken. Learners understand the importance of doing their schoolwork, in school and at home, and they know their school will do everything possible to get them to learn what
they should. Much learning happens through the use of computers and, from Grade 3 onwards,
all learners are computer literate. Part of the reason why learners want to come to school is that
they get to meet friends in a safe and secure environment where everyone is respected, they will
receive a good meal, they know they can depend on their teachers for advice and guidance, and
they are able to participate in sporting and cultural activities organised at the school after school
hours.
Teachers who received the training they require are continuously improving their capabilities and are confident in their profession. Teachers understand the importance of their profession
for the development of the nation and do their utmost to give their learners a good educational
start in life. They are, on the whole, satisfied with their jobs because they feel their employer is
sensitive to their personal and professional needs and that their pay and conditions of service in
general are decent and similar to what one would find in other professions.
The school principal ensures that teaching in the school takes place as it should, according to
the national curriculum, and understands his or her role as a leader whose responsibility is to
promote harmony, creativity and a sound work ethic within the school community and beyond.
Parents, who are well informed about what happens in the school, are keen to be involved in
school affairs. They receive regular reports about how well their children perform against clear
standards that are shared by all schools. These parents know that if something is not happening
as it should in the school, the principal or someone in the department will listen to them and
take steps to deal with any problems.
Learning and teaching materials are in abundance and of a high quality. National policy,
which is widely understood, describes the minimum quantity and quality of materials that every
learner must have access to. Computers in the school are an important medium through which
learners and teachers access information.

19
School buildings and facilities are spacious, functional, safe and well maintained. Learners,
teachers and the school community as a whole look after their buildings and facilities because
they take pride in their school.

20
5 Our theory of educational change
The term ‘theory of change’ has become popular in recent years. What it means here is the
Department of Basic Education’s understanding of how better quality schooling is brought
about. A plan such as Action Plan to 2024 must be informed by an idea of how different factors
influence each other to bring about better learning and teaching in the classroom. How this works is a subject of lively debate, debates which will never be fully resolved as there will
always be some uncertainty, even among the experts, around how schooling is improved. What
follows is the ‘theory of change’ used for the current Action Plan. It is not cast in stone, and it
emphasises only some factors, in particular those factors which we believe are especially
important.
Action Plan to 2014 did include a diagram illustrating how different actors in the schooling
system are linked to each other. The diagram that follows is an adaptation of that earlier one
and gets closer to a proper ‘theory of change’. It, and the accompanying discussion, are informed by the National Development Plan, the various policies of the basic education sector,
agreements concluded with teacher unions, and guidance provided by UNESCO on the basis of
lessons learnt from around the world21.
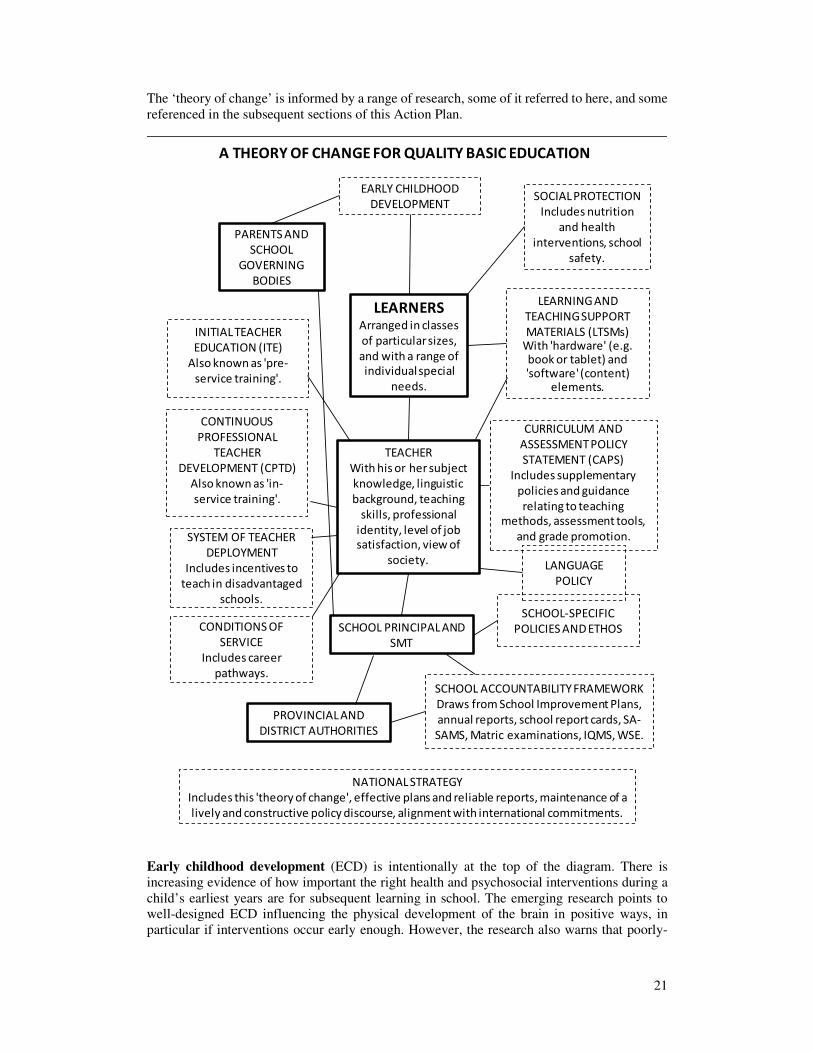
This is how the diagram works. Each solid-line box is an important actor in the system. At the
centre of the ‘theory of change’ is the central actor, the learner. The theory of change is about
improving learning in a manner that improves the learner’s opportunities in life through the
acquisition of foundational language and numeracy competencies, and beyond that specific
subject knowledge and life skills.
Each dotted-line box is a sub-system of the larger schooling system. Each of these sub-systems
has three features:
Support provided to key people, in particular teachers and school managers, to facilitate
effective service delivery and build human capacity. Support can take the form of
personalised support, or tools that facilitate the work.
Accountability on the part of all actors in the schooling system. Put simply, accountability
is about demonstrating that one has done the best one could given the resources available,
and the context.
Information to assist in the targeting of support and the running of fair accountability
systems.
Lines between the boxes in the diagram highlight where actors must work particularly closely
with each other, where actors have a special responsibility or interest in a particular sub-system,
and where the alignment across sub-systems is particularly important.
The diagram is deliberately a simplification of what is clearly a far more complex system. To highlight just one key omission, school infrastructure is not included partly because the
evidence on, for instance, the impact of specific classroom designs on learning is mixed.
Moreover, the basic elements of school infrastructure, such as decent toilets, have relevance
beyond the matter of effective learning, as they also represent the fulfilment of basic human
rights, a matter not dealt with in the ‘theory of change’ presented here.
21 Of particular significance with regard to the latter is the 2013-2014 Global Monitoring Report, titled
Teaching and learning: Achieving quality education for all (UNESCO, 2014a)
21
The ‘theory of change’ is informed by a range of research, some of it referred to here, and some
referenced in the subsequent sections of this Action Plan.
Early childhood development (ECD) is intentionally at the top of the diagram. There is
increasing evidence of how important the right health and psychosocial interventions during a
child’s earliest years are for subsequent learning in school. The emerging research points to well-designed ECD influencing the physical development of the brain in positive ways, in
particular if interventions occur early enough. However, the research also warns that poorly-
TEACHER
With his or her subject
knowledge, linguistic
background, teaching
skills, professional
identity, level of job satisfaction, view of
society.
SYSTEM OF TEACHER
DEPLOYMENT
Includes incentives to
teach in disadvantaged
schools.
LEARNING AND
TEACHING SUPPORT
MATERIALS (LTSMs)With 'hardware' (e.g. book or tablet) and 'software' (content)
elements.
CURRICULUM AND
ASSESSMENT POLICY
STATEMENT (CAPS)
Includes supplementary
policies and guidance
relating to teaching methods, assessment tools,
and grade promotion.
CONTINUOUS
PROFESSIONAL
TEACHER
DEVELOPMENT (CPTD)
Also known as 'in-
service training'.
LEARNERSArranged in classes
of particular sizes,
and with a range of individual special
needs.
INITIAL TEACHER
EDUCATION (ITE)
Also known as 'pre-
service training'.
CONDITIONS OF
SERVICE
Includes career
pathways.
EARLY CHILDHOOD
DEVELOPMENT
SCHOOL PRINCIPAL AND
SMT
SCHOOL ACCOUNTABILITY FRAMEWORK
Draws from School Improvement Plans,
annual reports, school report cards, SA-
SAMS, Matric examinations, IQMS, WSE.
NATIONAL STRATEGY
Includes this 'theory of change', effective plans and reliable reports, maintenance of a
lively and constructive policy discourse, alignment with international commitments.
PROVINCIAL AND
DISTRICT AUTHORITIES
PARENTS AND
SCHOOL
GOVERNING
BODIES
SCHOOL-SPECIFIC
POLICIES AND ETHOS
A THEORY OF CHANGE FOR QUALITY BASIC EDUCATION
LANGUAGE
POLICY
SOCIALPROTECTION
Includes nutrition
and health
interventions, school
safety.

22
designed ECD services can have zero or even negative impacts on a child’s development22. The
NDP emphasises expanding and improving the quality of our ECD. At the most basic level,
around one-fifth of children have suffered stunting due to poor nutrition23, which can result in
lasting impairments in the ability to learn. Clearly this is unacceptable and should be eradicated.
Once in school, a learner’s chances of learning are strongly influenced by three key classroom
factors: the capabilities of the teacher, the availability of learning and teaching support
materials, and class size. Moreover, in particular for learners from poorer households, a
nutritional meal provided by the school plays a major role.
The capabilities of the teacher depend on a complex combination of factors. Understanding
this sufficiently is a vital prerequisite for effective action. Initial teacher education (ITE) is
meant to provide teachers with the professional grounding needed for effective teaching. The
evidence suggests that this element of the system has improved in the last two decades (see
section 10.1). However, around two-thirds of teachers working in public schools currently received their initial professional training before the reforms of the early 2000s, and it is only
in around 2038 that we can expect all teachers to have a post-reform ITE background. This
makes it especially important to offer continuous professional teacher development (CPTD).
Teachers, like other professionals, require ongoing updating of their skills, in part because
teaching methods evolve as new technologies emerge. However, teachers with a weak ITE
foundation need especially good support. Evidence from around the world suggests that it is
particularly hard to change classroom practices through CPTD, yet some approaches work better than others. This has led to a strong emphasis on evaluating existing programmes, and a
keen interest in more teacher-driven and less top-down professional learning communities
(PLCs). As discussed below, there are certain topics, such as early grade reading, which need
to be covered far better in both ITE and CPTD24.
One problem in the learning and teaching process warrants a stronger emphasis in teacher
education: the particularly poor performance of boys, starting already in the earliest grades.
As discussed in section 9.1, while boy under-performance is a worldwide phenomenon, it is
particularly serious in South Africa. The causes of this need to be understood better, and remedies inside and outside the classroom need to be explored. Boy under-performance is likely
to be a factor contributing to the scourge of gender-based violence in schools.
The availability of effective learning and teaching support materials (LTMSs) relies in part
on investments in the development of good content – the ‘software’ – and in part on funding,
distribution systems and technologies that make texts accessible to learners – the ‘hardware’
side of the equation. The positive impacts of LTSMs are likely to be enhanced if learners can
take materials home. The development of LTSMs is not a straightforward matter, and clearly
not all LTSMs are equally effective in different linguistic, socio-economic and cultural
contexts. Good research into what works best, for instance when it comes to the complex area
of reading acquisition for young learners, can clearly lead to better materials. There is currently
a shift away from paper-based materials towards digital materials viewed through devices such
as tablets. This shift, if not well managed, can complicate matters. It is useful to think of what
features these different types of ‘hardware’ have in common. In both cases, it seems optimal to
mix centralised procurement, to bring about economies of scale, with some school choice as to what technology to use. Factors that influence the latter include financial cost, the stability of
electricity at the school, human capacity to migrate to digital technologies, and storage and
security factors.
22 Yoshikawa and Kabay, 2015. 23 National Planning Commission, 2012: 299. 24 UNESCO, 2014a: 236; VVOB, 2017.

23
While there is important research from around the world showing that changing average class
sizes only makes a small difference to what learners learn, it must be noted that this research
tends to deal with class sizes which are much lower than those seen in many South African
schools. South Africa’s classes are in fact very large by international standards, a fact which is
particularly worrying at the primary level where individualised attention to learners is so
important. According to TIMSS25 data, one in seven Grade 5 learners is in a class with 50 or
more learners. Classes with, say, 50 young learners crowded into a typical South African
classroom are clearly undesirable, for learners as well as teachers. A related matter is that grade
repetition rates remain high, even in the Foundation Phase. In Grade 1 around 15% of learners
are repeating, while the figure is around 10% or grades 2 and 3. This contributes significantly
to higher class sizes. Experiences in other countries, such as Brazil, which have recently opted for automatic grade promotion at the primary level, should be looked at carefully26. Several
South African education experts have argued that making learners repeat in the Foundation
Phase does more harm than good.
Other elements in the diagram, described below, may not impact as directly on the classroom
as the ones referred to above, yet they remain vital change factors.
South Africa’s conditions of service for educators are determined nationally. These policies
play a large role in influencing who chooses to take up teaching as a profession, and whether
the best teachers remain in the public system. The research underlines the importance of
developing clear and logical career pathways for teachers, meaning opportunities for advancement with respect to pay, responsibilities, and professional self-fulfilment27. Teacher
unions and the provincial employers have for many years acknowledged that much work is
needed to improve existing career pathways, for instance through a better focus on the role of
senior teaching positions, such as those of schools-based ‘heads of department’, and a more
transparent process of promotion into management posts. Budget constraints in recent years
have underlined the importance of better costing methods, and better cost projections, to inform
conditions of service and career pathway policies. This is necessary in part so that the sector
can lobby effectively for sufficient resourcing.
The system of teacher deployment includes the ‘post provisioning’ policy governing how
enrolment numbers are used to generate each school’s entitlement to publicly paid educator
posts, and a complex system of redeployment which moves ‘excess’ teachers with fewer years
of experience first, giving these teachers some say as to where they move, and schools some
say as to whom they appoint as a new teacher. The system works relatively well in some
provinces, but is a source of frustration, bottlenecks and across-school inequality in others.
Learning from the provinces which manage this process best must be an important part of the way forward. A crucial element of any deployment system should be incentives to teach in
disadvantaged schools28, in other words schools which are typically not a teacher’s first choice.
While policy for such incentives exists in South Africa, it is not widely implemented, and the
policy itself is due for a review29.
The Curriculum and Assessment Policy Statement (CAPS) is a voluminous set of documents
which describes what should be taught in each subject and grade, and to some extent how. It
moreover explains how teachers and schools should assess learners. The CAPS, introduced between 2012 and 2014, has in general been well received30. However, there are aspects of the
CAPS which need to be expanded on in the interests of quality learning and teaching. It is now
25 Trends in International Mathematics and Science Study. 26 Koppensteiner, 2013. 27 UNESCO, 2014a: 264. 28 UNESCO, 2014a: 251. 29 Government Notice 25 of 2007. 30 Department of Planning, Monitoring and Evaluation, 2017.
24
clear that there is a critical need to provide Foundation Phase teachers with better guidance and
materials to help them teach reading properly, in line with emerging evidence and practices
around the world. While there has been some progress with regard to the availability of good
assessment tools for teachers, more needs to be done in this critical area. Much research has
emphasised the importance of better formative assessment in schools throughout the school
year. Formative assessment is assessment for learning, where summative assessments represent
assessment of learning and often occurs twice a year. As indicated above, grade promotion
rules, at least at the Foundation Phase, need to be re-assessed.
How our eleven official languages are used in the classroom has major implications for
learning. Learners who speak one of the nine indigenous African languages at home generally
experience a dual disadvantage: not only must they begin learning in an unfamiliar language in
Grade 4, mostly English, they also tend to come from more socio-economically disadvantaged
households, for instance as far as the highest level of education of their parents is concerned.
The language policy in each school is determined in part by overarching national policies, such
as in relation to what languages are used for teaching from Grade 4, but also by school-level
decisions relating to, for instance, the language(s) to use for teaching purposes up to Grade 3.
The DBE’s promotion of the switch, between grades 3 and 4, from an African language to
English across most of the system remains supported by research31. However, what is clear is
that in too many schools the switch is made difficult by the fact that all languages are poorly
taught. This needs to change.
The NDP places considerable emphasis on the school principal as an agent of change in the
schooling system. Much research emphasises that principals, supported by their School
Management Team (SMT), need to play a stronger instructional leadership role32. Managers
need to pay more attention to how teachers teach, and how academic improvement over time
for the school as a whole is monitored, keeping in mind that the national improvement in
learning outcomes envisaged by the NDP is the sum of improvements brought about in each of
several thousand schools across the country.
It goes without saying that school principals have an important role to play in countering, within the schooling system, the ‘tide of corruption’ President Ramaphosa warned against in his 2018
State of the Nation Address. The schooling sector has not been immune to such ills, as
demonstrated by an important Ministerial Task Team report released in 201633.
While schools are accountable, through various means, to districts and the provincial
authorities, there is a need for a holistic school accountability framework to bring together
the various strands, and identify critical gaps. Much research underlines the role of effective
school accountability in bringing about educational improvement. Existing school
accountability elements include the annual school improvement plan, each school’s annual
report, the increasing use of the SA-SAMS34 school management system, and the Whole
School Evaluation (WSE) programme run in certain provinces.
For the 6 200 or so public schools offering Grade 12, the accountability of schools revolves
largely around the Matric examination results. The DBE has begun a process of implementing
a better framework for using these results, which does not rely so heavily on the well-known
‘pass rate’ (total National Senior Certificate passes over examination candidates). The latter
indicator is correctly seen as biased, in part because it penalises schools which do a better job
of preventing the dropping out of learners before Grade 12. Developing better school-level
measures of performance, using the Grade 12 results, must continue to be a priority. This work
31 Taylor and Coetzee, 2013. 32 World Bank, 2018c: 148. 33 Department of Basic Education, 2016c. 34 South African School Administration and Management System.
25
should include looking at the possibility of national ‘school report cards’, tools which have
become widely used in other developing countries35, and which have to a limited extent been
applied in some provinces.
In her 2019 budget speech, the Minister of Basic Education announced that work would begin
on the piloting of a Grade 9 General Education Certificate (GEC), as proposed by a Ministerial Task Team in 201436. The primary purpose of this would be to facilitate subject
choices beyond Grade 9 and articulation between schools and TVET37 colleges. However,
should the GEC be introduced, information generated by the new national examinations should
feature within the school accountability system. This would be of particular relevance for the
approximately 2 300 public schools, mainly in Eastern Cape, whose highest grade is currently
Grade 938.
Strengthening the accountability of the approximately 14 800 public primary schools with no
grade above Grade 7, and their principals, remains a key challenge. The NDP refers to the need for ‘reliable measures’ of performance for every primary school39. A 2017 agreement with
teacher unions focusses on establishing the Systemic Evaluation programme, which would
include the testing of samples of grades 3, 6 and 9 learners every year. This would permit highly
accurate monitoring of whether learning outcomes were improving at the province and national
levels. In fact, this sample-based testing is likely to produce more accurate system-level trends
than a testing system covering every school. Yet the need to monitor with a reasonable degree
of accuracy the levels of performance and trends of all primary schools remains necessary. The
DBE will continue to work towards this goal.
A part of the solution lies in the better use of data that already exists. The capturing of school-
based assessment (SBA) data in SA-SAMS is more widespread than ever before. Data
emerging from the Integrated Quality Management System (IQMS) on the evaluations of
school principals (and teachers) is now routinely captured on the payroll system. While these
data sources do suffer from comparability problems – different provinces implement IQMS
scores differently, and there is ample evidence that SBA result are not strictly comparable
across schools – they can nonetheless be used as a source to understand what is happening in individual districts and schools. The LURITS40 system of individual learner records has
moreover made it possible to monitor whether the primary school a learner originates from
influences his or her Grade 12 results. Importantly, while the monitoring solutions alluded to
here can be helpful, it is essential that any high-stakes evaluations, for instance of school
principal performance, be based on data that are comparable and that the evaluation system is
seen as fair by those affected.
Depending on the definition of poverty used, a quarter to a half of South Africa’s learners come
from poor households. Poverty can bring with it an inability to pay for transport to school or a
school uniform, weak capacity of parents or caregivers to provide educational support, and a
variety of social problems in the home. Of course, even non-poor learners can experience the
latter. These factors all impact negatively on learning. A variety of policies dealing with, for
instance nutrition, scholar transport, safety in schools and the identification of especially
vulnerable children contribute to the social protection offered by the schooling system to
mitigate the effects of poverty.
35 Cheng and Moses, 2016. 36 Department of Basic Education, 2014a. 37 Technical and vocational education and training. 38 Areas in the Eastern Cape where these schools are common also have separate schools catering just
for grades 10 to 12. 39 National Planning Commission, 2012: 311. 40 Learner Unit Record Information Tracking System.

26
Districts play a critical role in managing support to schools and teachers, and the accountability
of schools. Their support functions span many of the boxes in the diagram, including
professional teacher development, teacher deployment, LTSMs, and school governing bodies.
As emphasised in the NDP, the accountability between districts and schools is mutual. Schools
are accountable to districts for effective use of the available resources, and districts are
accountable to schools for providing quality support services41.
The national strategy on how to bring about quality basic education is expressed in the NDP
and the current Action Plan. The national strategy must be a living one, characterised by a lively
and constructive policy discourse, informed by reliable information produced by government
and non-government players. All this can profoundly influence the mood in the sector, and trust
between stakeholders, which inevitably impacts on what happens in schools and classrooms. A
key new element in the national debates which the DBE will prioritise is the new Systemic
Evaluation programme, which is expected to become fully operational in 2020. This programme
focusses not just on learning outcomes, but also the multitude of contextual factors. One reason
why it is important is that it will enable South Africa to report against the UN Sustainable
Development Goal (SDG) indicators dealing with the attainment of proficiency levels among
children.
41 National Planning Commission, 2012: 311.
27
6 Developments up to 2019 that influence our strategic direction
The NDP on over-arching ‘critical success factors’ for national
development:
Focused leadership: “Policy changes should be approached
cautiously based on experience and evidence ...”
A plan for all: “Broad support across society is needed for ...
successful implementation ... Vigorous debate is essential for
building consensus.”
Institutional capability: “Institutions improve through continuous
learning and incremental steps ... This requires good management ...
high performance ... ethics and a willingness to learn from
experience.”
Willingness to prioritise: “... senior public officials should focus most
of their attention on a few strategic priorities.” (p. 59)
This section summarises what the key developments in the sector up to 2019, in particular those
since 2014, have been and what this means for the way forward. More details can be found in
the discussion of the 27 goals, starting in section 9. First, two unanticipated and serious trends
which have been beyond the control of the education departments, namely an increase in births
and serious budget constraints arising largely out of weak economic growth, are outlined
(section 6.1). Thereafter, the several policy and service delivery successes in the sector, despite
the adverse budgetary climate, are discussed (section 6.2). Finally, challenges experienced in the sector, within areas where the education departments do exercise considerable control, are
discussed (section 6.3).
6.1 The demographic and spending trends
A large increase in Grade 1 enrolments, particularly in 2011, followed by a large Grade 2
increase in 2012, and so on up the grades, were a reflection of serious and unexpected
demographic shifts. It is now clear that the number of births per year rose to a new level
during the 2003 to 2005 period. The reasons for this are not fully understood, but the evidence
suggests easier access to antiretroviral treatment was the principal cause. Whatever the cause,
the schooling system had to deal with an unexpectedly large inflow of children. The patterns are shown in Figure 2. For instance, grades 1 to 3 enrolments increased by 10% between 2010
and 2018, while grades 4 to 7 enrolments increased by 13% between 2013 and 2018. In addition
to this, large enrolment increases were seen in grades 10 to 12, not as a result of the rise in
births, but lower dropping out at the upper secondary level.

28
Figure 2: Enrolment trends 1999 to 2017
Source: Official annual EMIS publications of DBE. Note: Values reflect public and independent ordinary school enrolments. Enrolment figures before around 2005 are less reliable than more recent ones. This explains some of the large ‘swings’ in the earliest years.
A further unexpected trend which put pressure on the delivery of basic education was weak and
declining economic growth, and as a consequence weak growth in revenue collection. Figure 3
provides a simplified illustration of various related trends – each series of statistics starts at 100
in 2007. GDP in real terms grew, but at a slowing rate. Annual growth slowed from 3.3% or
more in 2010 and 2011 to around 1.0% in 2015 to 2017, compared to growth rates of over 4.5%
in the years 2004 to 2007. Had economic growth been even 3.0% in the 2012 to 2018 period,
the economy and money available to spend on education would have been 9% higher in 2018
than it actually was. The increases in population and enrolments referred to earlier are also
shown. What put additional financial pressure on the sector was the fact that the salaries of
educators (and other public servants) rose considerably faster than inflation. By 2017, the
purchasing power of the average educator was 36% higher than in 2007. While this may have
been good for teacher motivation and attracting good educators into the sector, it put pressure
on provincial budgets. Consequently, the number of educators who could be employed declined
from a peak of 432 000 in 2011 to 405 000 in 2018 (yet the 2018 figure was still higher than
the figure seen in 2007, which was 387 000).
0
500
1,000
1,500
2,000
2,500
3,000
3,500
4,000
4,500
19
99
20
00
20
01
20
02
20
03
20
04
20
05
20
06
20
07
20
08
20
09
20
10
20
11
20
12
20
13
20
14
20
15
20
16
20
17
20
18
Th
ou
sa
nd
s o
f le
arn
ers
Grade R Grades 1 to 3 Grades 4 to 7 Grades 10 to 12 Grades 8 to 9
+10%
+13%

29
Figure 3: Indicators of funding and costs since 2007
Sources: Real GDP is from the Reserve Bank. The population trend is from Stats SA’s mid-year population estimates. School enrolment is official figures from DBE publications, with learners in all grades and both public and independent ordinary schools counted. Educator pay is calculated from actual spending figures in Persal, counting just permanently employed educators. The employee count is also from Persal, with any educator employed in November (or, for some years, October) being counted. The per learner spending trend uses a price index where 20% is weighted by CPI and 80% is weighted by the cost of the average employee. Spending figures cover just current (non-capital) spending, for whole provincial education departments. But these figures exclude spending on functions moved from the provincial to national level between 2014/15 and 2015/16, namely FET colleges and adult education. Without this exclusion, the trend would have appeared worse.
The blue curve in Figure 3 represents what could be bought for each learner, taking into
account the rising cost of educators, and assuming that non-personnel costs rose in line with
CPI. Clearly, following a large increase after 2007, this blue curve displayed a gradual decline, from 2011. This has been undesirable and is a consequence of a combination of weak economic
growth, above-inflation salary increases, and enrolment increases.
The trends seen in Figure 3 bring about challenges, yet they are manageable. Delivering quality
schooling is not impossible, and as will be shown below, there are reasons to be optimistic.
95
100
105
110
115
120
125
130
135
140
145
20
07
20
08
20
09
20
10
20
11
20
12
20
13
20
14
20
15
20
16
20
17
20
18
20
19
20
20
Ind
ex
wh
ere
20
07
va
lue
= 1
00
Real GDP
Population aged 5 to 19
School enrolment
Average annual gross pay of educators in constant Rand
All publicly employed educators
Cost-adjusted index of spending per public ordinary school
learner

30
Despite economic difficulties, learning outcomes have continued to improve, and important
innovations have been occurring in the sector. Moreover, the economic situation is expected to
improve in future years42.
As one might expect, the pressures described above have resulted in a deterioration of an
important indicator, the learner-educator (LE) ratio. LE ratios have risen from around 2011
for both primary and secondary schools, as can be seen in Figure 4 below. However, despite
these increases, LE ratios have remained below what they were around 2003.
Figure 4: Learner-educator ratios 2003 to 2017
Source: Snap Survey microdata. Note: Only public ordinary schools are considered. ‘Primary’ is any school with learners in the range of grades 1 to 7. ‘Secondary’ is any school with learners in the range of grades 8 to 12. There is a small overlap between the two categories, where schools have both primary and secondary learners. For the numerator of each school, only grades 1 to 12 learners were counted. For the denominator, all educators, whether public employees or employees of the School Governing Body, were counted. Grade R practitioners were not counted. Mean LE ratios across schools were calculated using total enrolment as a weight in order to avoid biases produced by small schools. A method was used which compared two adjacent years at a time, using only schools present in both years, with the highest and lowest 5% of LE ratios excluded. This was necessary given some anomalies with the educator values in the Snap Survey.
Higher LE ratios generally translate into larger classes. This is not a trend South Africa can
afford. Historically, South Africa’s classes have been large by international standards. Among
countries participating in TIMSS 2015 Grade 4 assessments, South Africa had the largest
primary-level classes by far. In South Africa, 51% of Grade 5 learners were in classes larger
than 40, other countries with high values being Morocco, with 23%, Indonesia with 16%, and
Chile with 15%. The South African figure is confirmed by other data sources, such as the DBE’s
LURITS43. There is one important window of opportunity to alleviate this situation. Large
expected changes in the age profile of educators will bring down the average cost of an educator
in real terms as younger educators cost less than older educators. If managed well, this
opportunity will allow for increases in the total number of educators working in schools. This
receives attention in section 10.2.
42 For instance, the World Bank (2019: 112) expects South Africa’s economic growth to gradually
improve in the coming years. 43 Learner Unit Record Information Tracking System.
28
29
30
31
32
33
34
35
20
03
20
04
20
05
20
06
20
07
20
08
20
09
20
10
20
11
20
12
20
13
20
14
20
15
20
16
20
17
LE r
ati
o
All Primary Secondary

31
6.2 Areas of service delivery success
At the heart of development in the schooling sector must be obviously be what learners learn.
This is made clear in the NDP and the Sustainable Development Goals. It continues to be of
great significance for South Africa’s development that learning outcomes, according to the
three international standardised testing programmes South Africa participates in, are on an upward trajectory. The following graph (Figure 5) updates a similar graph that appeared in
Action Plan to 2019. It outlines past achievements and what government targets envisage for
the future, in terms of the TIMSS44 mathematics tests. When ambitious TIMSS targets
extending to 2025 in the earlier Action Plan to 2014 were formulated, there was little certainty
that they could be reached. It was thus good news when 2011 and 2015 TIMSS results revealed
significant improvements, in fact along a trajectory that was about as steep as that of the fastest
improving countries in the world (for instance Brazil’s PISA45 improvements between 2000
and 2012). This puts South Africa on track to achieve its long-range TIMSS targets. By 2015,
South Africa was almost on a par with Botswana (which also tested Grade 9 in 2015). Assuming
that past improvement trends continue, South Africa is set to reach a level of performance seen
in Grade 8 in Thailand in 2015 by around 2022, and would surpass Malaysia’s 2015 Grade 8
level by 2030. These further improvements are of course not guaranteed, but sustained
dedication to the activities outlined in the current Action Plan, and the NDP, would improve
the chances of reaching the targets.
Figure 5: Past and envisaged educational quality trend for South Africa
Sources: Points indicated in the graph, South African and other, are from official TIMSS reports, with one exception, namely the 2002 Grade 9 figure for South Africa, which is from Reddy et al (2012). Note: All the South Africa points refer to Grade 9. The 2002 Grade 8 average was 264, 21 points below the Grade 9 average for the same year, but this Grade 8 figure is not reflected in the graph. The 2019 target of 401 is from MTSF targets published online in 2016. The 2029 target of 472 is from Action Plan to 2019.
Comparing South Africa’s long-range TIMSS mathematics trends to those of other developing
countries is telling. As seen in Figure 6 below, South Africa has experienced the steepest and
most sustained improvement, though Ghana in the years 2003 to 2011 saw a similarly positive
trend.
44 Trends in International Mathematics and Science Study. 45 Programme for International Student Assessment.
200
250
300
350
400
450
500
2000 2005 2010 2015 2020 2025 2030
TIM
SS
Gra
de
9 s
co
re i
n m
ath
em
ati
cs
Already achieved
2002-2015
Future targets
Thailand Gr 8
2015
Botswana Gr 9
2015 Malaysia Gr 8
2015
Morocco Gr 8 2015
Ghana Gr 8
2011

32
Figure 6: The TIMSS lower secondary trends of developing countries
Note: ZAF9 refers to South Africa Grade 9, ZAF8 to South Africa Grade 8, BWA8 to Botswana Grade 8, and BWA9 to Botswana Grade 9. Three-letter country codes are standard ISO codes. In what is referred to officially as ‘TIMSS 2003’, South Africa tested learners in 2002.
TIMSS science results reveal similar patterns to TIMSS mathematics. Analysis for the
landmark 2017 High Level Panel report of the legislative sector46 confirmed that South Africa’s
TIMSS gains were strongest among the most disadvantaged, meaning that schooling has
contributed to reducing social inequalities47. Importantly, it is these improvements in the grades
below Grade 12 which account for upward trends in the Grade 12 indicators. SACMEQ48 and
PIRLS49 results at the primary level are somewhat more difficult to interpret than the TIMSS
results, in part due to statistical adjustment issues, yet they both point to improvements of a
magnitude comparable to those seen in TIMSS. Specifically, while TIMSS mathematics
improvements in Grade 9 for 2002 to 2015 came to 0.07 standard deviations a year, the 2007
to 2013 improvement in Grade 6 mathematics, according to SACMEQ, came to a similar 0.06
standard deviations a year. Looking at annual improvements this way, in terms of standard
deviations, allows one to make approximate comparisons of trends across different testing
programmes50.
During 2019, the DBE attempted to replicate the flat PIRLS Grade 4 reading trend for the 2011
to 2016 period published in the official PIRLS reports of 2017. This was done in view of
confusion that existed around the longer 2006 to 2016 trend: the 2006 to 2011 trend had seemed
too steep, while the 2011 to 2016 trend was flat. The analysis used the publicly available item-
level data for 2011 and 2016. It was not possible to replicate the officially released trend. It has
now been accepted by the relevant experts, including experts at the IEA51, the organisation
based in the Netherlands which runs PIRLS, that the officially released flat trend for 2011 to
2016 in PIRLS is not correct. That trend is based on an inappropriate conversion of South
46 Parliament, 2017. 47 Van der Berg and Gustafsson, 2017: 7. 48 Southern and Eastern Africa Consortium for Monitoring Educational Quality. See in particular
Department of Basic Education (2017a). 49 Progress in International Reading Literacy Study. 50 OECD, 2010. 51 International Association for the Evaluation of Educational Achievement.
250
300
350
400
450
19
94
19
95
19
96
19
97
19
98
19
99
20
00
20
01
20
02
20
03
20
04
20
05
20
06
20
07
20
08
20
09
20
10
20
11
20
12
20
13
20
14
20
15
20
16
TIM
SS m
ath
em
ati
cs
sc
ore
ZAF8 ZAF9 BWA8 BWA9 CHL
EGY GHA IDN IRN MAR
SAU SYR TUN TUR

33
Africa’s 2011 score from the prePIRLS to PIRLS scale. The DBE is in the process of working
with the IEA to ensure that the correct trend is properly communicated. The actual 2011 to 2016
trend, at 0.05 standard deviations a year, appears to be among the steepest upward trends of all
PIRLS participants. This is good news for South Africa as improving reading in the early grades
is a clear priority of the President. Moreover, the fact that TIMSS, PIRLS and SACMEQ now
all point to similar upward trends brings about more certainty. The trends for these three
programmes are summarised in the following graph:
Figure 7: TIMSS, PIRLS and SACMEQ trends for South Africa
Note: Numbers beside the lines represent improvements expressed as South African standard deviations a year.
Further details on PIRLS appear in Appendix C.
In 2015, South Africa participated for the first time in TIMSS at the primary level, specifically
Grade 5. This will facilitate further the tracking of progress in primary schools (the next round
of TIMSS is in 2019).
Turning to Grade 12 results, the highly publicised pass rate, meaning National Senior
Certificates (NSCs) obtained divided by learners writing the examination, is but one of many
indicators tracking trends at this level. Government’s Medium Term Strategic Framework
(MTSF), which is based on the NDP, emphasises the aim of getting all youths to obtain the
NSC, or an equivalent qualification, either from a school or TVET52 institution. It also
emphasises the attainment of an NSC allowing for Bachelors-level studies at a university, and
obtaining a mark of at least 50% in mathematics and physical science. In the case of
mathematics, this 50% threshold is the lowest threshold applied for entry into mathematically-
oriented university programmes such as accounting and engineering.
Trends in the attainment of the National Senior Certificate, and a sub-set of this, the NSC with
a Bachelors-level pass, both qualifications which tend to have a decisive influence on the
opportunities available to young South Africans, are illustrated in Figure 8 below. It is important
to note that most learners who obtain the NSC, but not a Bachelors-level pass, achieve the lower
Diploma-level pass. For example, in 2018 62% of these learners obtained the Diploma-level
pass. This permitted an additional 140 000 learners from the class of 2018 to study for a
52 Technical and vocational education and training.
480
490
500
510
520
530
540
550
560
250
270
290
310
330
350
370
390
1999 2004 2009 2014
SAC
ME
Q s
cale
TIM
SS-P
IRLS
sca
le
TIMSS Gr 9 math. PIRLS Gr 4 reading SACMEQ Gr 6 math.
PIRLS 2011 before
correction
PIRLS 2011 after
correction

34
Diploma at a university. Both indicators shown in Figure 8 have displayed a general upward
trend for the last twenty or so years. The increase in Bachelors-level passes, at 3,6% a year, has
been the strongest. Youths qualifying for entry into a Bachelors programme at a university has
increased from around 100 000 in 1994, to around 160 000 in recent years. These figures are
from the public examination system only and exclude, above all, the approximately 10 000 a
year Bachelors-level passes emerging from the Independent Examinations Board (IEB) system.
The trends seen in the graph should be viewed in the light of population trends. Statistics
South Africa (Stats SA) mid-year population estimates point to negative growth in the
population aged 1853. Specifically, demographic factors have resulted in a shrinkage, by about
1,0% a year, of the age 18 population since 2011. This means that the increase in the likelihood
of obtaining a qualification for the average youth has been even greater than the values in Figure
8 suggest. Importantly, we can expect the age 18 population cohort to begin growing in size
from 2022, as a result of the birth trends described above.
Figure 8: NSC and Bachelors-level increases since 1994
Note: Prior to 2008, a Bachelors-level pass was referred to as a Matriculation Exemption. Values reflect only results of full-time candidates, excluding the effect of the supplementary examinations and any examinations taken by MEO (Multiple Examination Opportunity) candidates in the following year.
Figure 8 moreover under-states the progress made by reflecting just qualifications received by
full-time examination candidates after the first sitting of the examinations. What is thus not
reflected are the following: the situation after supplementary examinations are written early in the following year; NSCs obtained by part-time examination candidates, generally youths
repeating all or part of their Grade 12 studies; and credits obtained in separate examinations in
the following year for Multiple Examination Opportunity (MEO) candidates. In addition,
what a comprehensive accounting for NSCs needs to take into account is the fact that roughly
7 000 learners a year obtain the NSC for the second (or even third) time, as part of an attempt
to improve their subject-specific results. These factors reflect opportunities that have become
increasingly available to youths to pursue the ‘Matric’ beyond their first attempt. MEO was
introduced only in 2015. The number of part-time candidates has increased dramatically, from
around 1 000 in 2008, to 83 000 in 2010, to around 167 000 in 2018. Once all these factors have
been taken into account, the net result is that the annual number of NSCs obtained in recent
years in the public examination system is around 23 000 higher than the levels illustrated in
Figure 8. Thus one can say that in 2018 around 425 000 youths obtained the NSC for the first
time. Around one-third of the additional 23 000 is due to part-time candidates qualifying for
53 Figures accompanying the 2018 mid-year population estimates used.
0
50,000
100,000
150,000
200,000
250,000
300,000
350,000
400,000
450,000
500,000
19
93
19
94
19
95
19
96
19
97
19
98
19
99
20
00
20
01
20
02
20
03
20
04
20
05
20
06
20
07
20
08
20
09
20
10
20
11
20
12
20
13
20
14
20
15
20
16
20
17
20
18
20
19
20
20
Lea
rne
rs
NSC Bachelors-level

35
the NSC, while two-thirds is due to full-time candidates failing on their first attempt, but then
reaching a point where they fulfil all the NSC requirements, via supplementary or MEO
examinations.
Stats SA data collected from households confirm the rise in the number of youths obtaining
the NSC. As shown by Figure 9, the percentage of youths successfully completing Grade 12 has increased from around 45% around 2005, to close to around 55% in 201854. The peaks of
the various curves in the graph point to the fact that many youths obtain their NSC rather late.
For instance, in 2018 the peak at age 24 illustrates that below this age many youths had still not
obtained the NSC. This reflects opportunities created to allow youths to achieve the NSC
beyond their first attempt. However, it also points to a challenge, namely the need to get more
youths to complete their secondary schooling successfully at a younger age.
Figure 9: Grade 12 attainment among youths according to household data
Source: Stats SA’s General Household Survey. Note: To smoothen the curves and eliminate outlier statistics brought about by the sample-based nature of the data, each marker represents the average across three years. For instance, age 23 is the average across ages 22 to 24.
The fact that just under half of youths do not obtain the NSC, and thus leave the schooling
system without a formal qualification with which to navigate post-school education and the
labour market, is a concern that is often raised. Successful completion of Grade 12 must continue to increase, but it should also be remembered that South Africa’s secondary school
completion is not unusual among developing countries. According to UNESCO, the upper
secondary education completion rate for South Africa has been equal to that of middle income
countries in general in recent years55. To illustrate, it is currently slightly above those of Tunisia,
Egypt and Uruguay, but a bit below that of Indonesia.
Government’s targets envisage that by 2019 there would be 270 000 Bachelors-level NSC
passes per year, with this number rising to 435 000 by 203056. The NDP envisages that by 2030
there would be 425 000 university graduates produced annually, essentially students
54 Very similar statistics are obtained from the National Income Dynamics Study (NIDS) data of the
Department of Planning, Monitoring and Evaluation (DPME). 55 UNESCO, 2017a: 329. 56 Department of Planning, Monitoring and Evaluation, 2016a; Department of Basic Education, 2015a.
30
35
40
45
50
55
20 21 22 23 24 25 26 27 28
Pe
rce
nta
ge
of
yo
uth
s
Age
2018
2017
2016
2015
2014
2013
2012
2011
2009
2007
2004
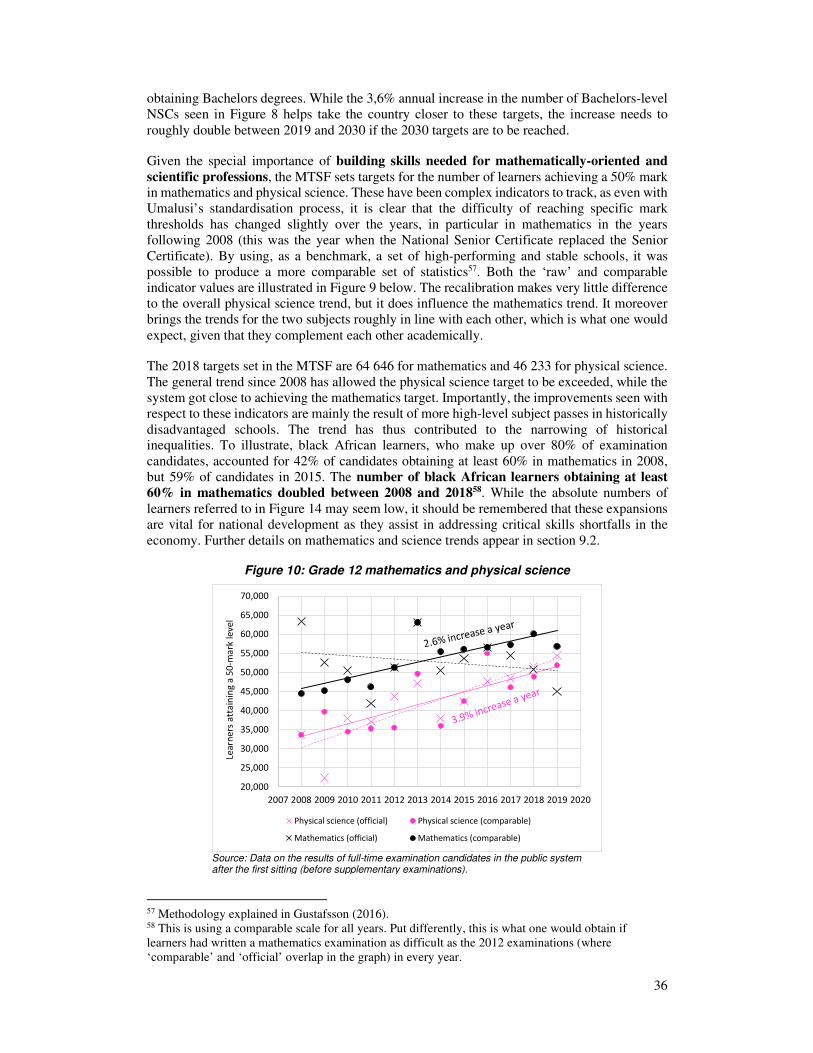
36
obtaining Bachelors degrees. While the 3,6% annual increase in the number of Bachelors-level
NSCs seen in Figure 8 helps take the country closer to these targets, the increase needs to
roughly double between 2019 and 2030 if the 2030 targets are to be reached.
Given the special importance of building skills needed for mathematically-oriented and
scientific professions, the MTSF sets targets for the number of learners achieving a 50% mark in mathematics and physical science. These have been complex indicators to track, as even with
Umalusi’s standardisation process, it is clear that the difficulty of reaching specific mark
thresholds has changed slightly over the years, in particular in mathematics in the years
following 2008 (this was the year when the National Senior Certificate replaced the Senior
Certificate). By using, as a benchmark, a set of high-performing and stable schools, it was
possible to produce a more comparable set of statistics57. Both the ‘raw’ and comparable
indicator values are illustrated in Figure 9 below. The recalibration makes very little difference
to the overall physical science trend, but it does influence the mathematics trend. It moreover
brings the trends for the two subjects roughly in line with each other, which is what one would
expect, given that they complement each other academically.
The 2018 targets set in the MTSF are 64 646 for mathematics and 46 233 for physical science.
The general trend since 2008 has allowed the physical science target to be exceeded, while the
system got close to achieving the mathematics target. Importantly, the improvements seen with
respect to these indicators are mainly the result of more high-level subject passes in historically
disadvantaged schools. The trend has thus contributed to the narrowing of historical inequalities. To illustrate, black African learners, who make up over 80% of examination
candidates, accounted for 42% of candidates obtaining at least 60% in mathematics in 2008,
but 59% of candidates in 2015. The number of black African learners obtaining at least
60% in mathematics doubled between 2008 and 201858. While the absolute numbers of
learners referred to in Figure 14 may seem low, it should be remembered that these expansions
are vital for national development as they assist in addressing critical skills shortfalls in the
economy. Further details on mathematics and science trends appear in section 9.2.
Figure 10: Grade 12 mathematics and physical science
Source: Data on the results of full-time examination candidates in the public system after the first sitting (before supplementary examinations).
57 Methodology explained in Gustafsson (2016). 58 This is using a comparable scale for all years. Put differently, this is what one would obtain if
learners had written a mathematics examination as difficult as the 2012 examinations (where
‘comparable’ and ‘official’ overlap in the graph) in every year.
20,000
25,000
30,000
35,000
40,000
45,000
50,000
55,000
60,000
65,000
70,000
2007 2008 2009 2010 2011 2012 2013 2014 2015 2016 2017 2018 2019 2020
Lea
rne
rs a
tta
inin
g a
50
-ma
rk l
ev
el
Physical science (official) Physical science (comparable)
Mathematics (official) Mathematics (comparable)

37
Note: Solid lines are trendlines for the comparable statistics, while dotted lines are trendlines for the ‘raw’ statistics.
Improvements in the quality of schooling are a large part of the reason why more youths are
‘surviving’ school to a higher grade and obtaining some form of NSC. An analysis of Grade
11 completion along the lines of Figure 9 reveals that completion of this grade improved from
61% in 2007 to 73% in 2018. The corresponding figures for Grade 10 are 73% and 84%. This
trend has occurred without a noticeable increase in the average age of learners. For instance,
the average age of Grade 12 full-time examination candidates, on 1 January of their Grade 12
year, has remained stable at around 18,1 years since at least 2008.
The evidence presented above points unequivocally to progress in the basic education sector in
the area that matters most, namely learning outcomes. It is important to understand as best as
possible what drove this progress, as this needs to inform the way forward. It is impossible to
attribute the improvements in any scientific way to specific interventions and social trends.
However, new policies, and successes in implementing these policies, provide an indication of
the likely drivers of change. Five changes in the sector seem to stand out, and are discussed below: (1) the CAPS tools designed to facilitate the implementation of the curriculum in the
classroom; (2) better access among learners to high-quality books, such as the national
workbooks; (3) more focussed assessment practices; (4) improved subject knowledge among
newly graduated teachers; and (5) increasing access to both Grade R and pre-school below
Grade R.
As already discussed in section 5 above, the Curriculum and Assessment Policy Statement
(CAPS) was a set of guides introduced into the schooling system between 2012 and 2014 and
intended to clarify exactly what had to be taught in the various subjects and grades. The CAPS
provided certainty where, it had been argued, the previous curriculum documents, introduced
in 2002, were too vague and difficult to interpret. Greater levels of specificity in the curriculum
guides began even before the implementation of the CAPS, with the launch of the Foundations
for Learning programme in 200859. In 2017, DPME released an evaluation of the
implementation of CAPS, according to which the great majority of the users of the guides
found them superior to preceding guides60. An earlier 2014 evaluation by Umalusi had
arrived at similar conclusions61, and a 2017 report by the Brookings Institute comparing
curricula across countries found the CAPS to be appropriately focussed on necessary skills62.
While both reports underline that good curriculum guides on their own are no guarantee of
quality schooling, and that how the curriculum is implemented is key, the fact that better
curriculum documentation, which was accompanied by training, became available to teachers
is a likely factor behind the improvements in learning outcomes described above.
It has become increasingly clear that in one critical area the CAPS and accompanying materials
need to provide teachers, and their trainers, with even clearer guidance. This is the area of early grade reading. Reading is poorly taught in the initial grades in much of the schooling system.
Gaps in this regard can disadvantage a learner for the rest of his or her schooling career. An
increasing awareness of this problem led in 2015 to an ambitious research and materials
development initiative known as the Early Grade Reading Study (EGRS)63, managed by the
DBE but involving a wide range of partners. The study64, covering various ‘treatment’ groups
of schools and a ‘control group’, found that specific actions could improve the reading abilities
59 Government Notice 306 of 2008. 60 Department of Planning, Monitoring and Evaluation, 2017a: 16. 61 Grussendorff et al, 2014. 62 Care et al, 2017. 63 This should not be confused with the Early Grade Reading Assessment, or EGRA, an internationally
available set of tools to assess young learners. 64 Department of Basic Education, 2017b: 14.

38
of learners during their first two grades by between
0,05 and 0,17 of a standard deviation per year. Such
improvements compare favourably with, for instance,
the 0,07 standard deviations a year of improvement
seen in TIMSS (discussed above). The ‘treatments’ in
this study thus emerge as significant opportunities to
strengthen early grade reading. What were the treatments? More details are provided in section
7.1 below, but essentially the interventions involved getting teachers to devote more time to
specific types of group-guided activities in the classroom, and tasks where learners worked on
their own, with the teacher’s oversight.
Several initiatives aimed at ensuring that learners have access to the books they need have
clearly paid off. The notion that textbooks are unimportant, not uncommon fifteen years ago, is
a thing of the past. The CAPS are very clear about the importance of textbooks. Teachers saying
they used a textbook as their main classroom resource for teaching mathematics increased from
a worryingly low 30% in 2002 to 70% in 2011 according to TIMSS65. In SACMEQ, the
percentage of Grade 6 learners saying they had access to a mathematics textbook increased
from around 36% in 2007 to around 66% in 201366. The General Household Survey, which for
many years has asked households what they would complain about in relation to schooling,
points towards a consistent decline in the percentage
of learners where lack of books was a problem, from
20% in 2002 to 4% in 2017. The GHS has since 2013
included additional questions on access to books in
schools, with responses indicating that access to
national workbooks required by learners improved
from around 83% of grades 1 to 9 learners in 2013 to 96% in 2017, with similar trends across
grades67.
The national workbooks, formally known as the Rainbow Workbooks and first distributed to schools in 2011, remain a vital means not only for improving access in the classroom to high
quality texts with stimulating graphics, but also for building up a stock of books in homes in a
context where most South African households are ‘book poor’. TIMSS 2015 data indicate that
the presence of books in the home is particularly low in South Africa, with 42% of lower
secondary learners indicating that there were just zero to ten books available68. More books in
the home raises the opportunities for recreational reading and learning outside school.
Such activities have also been made more possible by increases in the highest level of education
in South Africa’s households. In 2003, only 41% of learners in schools enjoyed the presence of
at least one household member with a Grade 12 qualification (or some higher qualification). By
2017, this figure had risen to 60%.
How was access to books improved? Budgets devoted to learning and teaching support
materials (LTSMs), including the so-called school allocation, were prioritised. Government has
focussed strongly on lowering book prices, in particular where books are bought in bulk. South
Africa’s successes in achieving particularly low unit costs for workbooks, without
compromising on quality, has been acknowledged by UNESCO69. Moreover, national and
provincial systems delivering materials to schools have been strengthened.
65 From analysis of the TIMSS microdata. Unfortunately, the TIMSS 2015 data do not allow for this
statistic to be calculated. 66 Moloi and Chetty (2010: 28) and Department of Basic Education (2017a: 19). 67 Department of Basic Education (2014b: 31) and Department of Basic Education (2019a: 28, 30). 68 Analysis of the TIMSS microdata. Botswana was found to be equally ‘book poor’, with other
developing countries displaying somewhat better figures – 40% in Morocco, 35% in Egypt, around
25% in Chile, Thailand and Iran. 69 UNESCO, 2014a: 285.
Improvement factor 2: Better access among learners to high-quality books, such as the national workbooks
Improvement factor 1: The CAPS tools designed to facilitate the implementation of the curriculum in the classroom

39
Yet despite improvements, many of the most recent statistics on access to books remain
worrying. In grades 10 to 12, the percentage of learners accessing textbooks in all his or her
subjects has remained at around 78% between 2013 and 2017 according to the GHS. According
to the 2017 School Monitoring Survey, a survey aimed specifically at monitoring progress
against indicators put forward in Action Plan to 2019, 83% of Grade 9 learners and around 84%
of Grade 12 learners had access to a mathematics textbook70. Clearly, all these figures should
be 100%. Achieving this is not just a question of buying books, but also of preserving and re-
using them, and ensuring that learners do not lose books or leave them at home.
The drive to improve access to books among learners, while important, can easily result in
insufficient attention being paid to the quality of books used in schools. Several initiatives to
improve the quality of textbooks have been undertaken in recent years. Apart from the national
workbooks, the DBE has developed other Foundation Phase (grades R to 3) materials, in
particular graded readers and Big Books, to strengthen alignment to the CAPS. These
materials draw from recent evidence on best classroom practices. Official national catalogues
of approved books help to ensure that poor quality materials are kept out of public schools.
Assessment as a tool for improving teaching and learning has evolved over the last ten years,
and important lessons have been learned which will help to shape the way forward. The CAPS
distinguish between informal and formal assessment activities, with the latter category
comprising assessment tasks, tests and examinations. The CAPS
also provide considerable guidance on how teachers should conduct assessments, guidance which was reinforced through an
intensive process of ‘CAPS training’ in the years 2011 to 2014.
The curriculum guides preceding the CAPS, introduced in 2002,
had provided far less guidance on assessments. Fresh approaches to assessment began
already in 2008, with teacher training linked to the Foundations for Learning programme.
It is very likely that more clarity and focus with regard to assessments among teachers
contributed to the improvements seen in the international assessments.
Systemic assessments are assessments without any direct implications for individual learners, for instance with regard to grade promotion, but which help managers and planners understand
the relative academic performance of whole schools, districts or provinces, or the country as a
whole, and whether there is improvement at these levels. In 2011, South Africa embarked on
an ambitious universal (or censal) national assessment, the Annual National Assessments
(ANA), covering grades 1 to 6 and Grade 9. This programme came to an abrupt end in 2015
due to disagreements among stakeholders, and in particular between government and teacher
unions, around the purpose of ANA. During the four years in which ANA was implemented, it played a major role in bringing to the fore the quality of learning and teaching, in the national
debates but also at a very local level. School principals, parents and district officials were able
to compare the quality of learning across schools, in particular primary schools, in ways which
had not been possible previously. However, following an intensive evaluation of the strengths
and weaknesses of ANA71, stakeholders have agreed there were specific problems in the design
of the programme, problems which should be avoided in future. These problems, and the way
forward for systemic assessments, are discussed in section 7.2.
Despite some concerns around the quality and relevance of initial teacher education at
universities72, the evidence points very clearly to younger
teachers being better equipped to teach than their older
peers who received their initial training in the previous
system. Specifically, it was found that results from tests in
70 Department of Basic Education, 2019e: 50-51. 71 Department of Basic Education, 2016a. 72 Deacon, 2016.
Improvement factor 3: More focussed assessment practices
Improvement factor 4: Improved subject knowledge among newly graduated teachers

40
mathematics and language written by teachers as part of SACMEQ 2007, but also 2013, pointed
to younger teachers displaying a level of subject knowledge which was considerably higher
than that of older teachers. The average mathematics score of South Africa’s teachers in 2007
put South Africa in position nine among fourteen SACMEQ countries. Had all of South Africa’s
teachers displayed the average of younger teachers graduating after around 2005, South Africa
would have been in position three (after Kenya and Zimbabwe). This demonstrates the
remarkable magnitude of the qualitative change. In policy terms, this pattern suggests that
moving all teacher education from colleges to universities in the late 1990s was a necessary
change.
It is likely that stronger subject knowledge among younger teachers would have played some
role in the improvements in learning outcomes. Yet the impact of this would have been limited
as it takes time for older teachers to be replaced by younger teachers. In 2017, schools-
based educators aged 37 and below – roughly those educators who would all have been trained
at universities – still comprised just 23% of all schools-based educators.
What the SACMEQ data did not point to is any noticeable improvement in the subject
knowledge of older teachers, despite the existence of various in-service teacher training
initiatives. This type of finding is not uncommon around the world – the existing evidence
suggests it is very difficult to bring about changes in classroom practices on a large scale
through traditional in-service training73. Yet even if subject knowledge among older teachers
did not change much, teaching practices must have shifted, or the improvements in learning outcomes would not have occurred. The Integrated Quality Management System (IQMS),
the performance management system for individual teachers, would have helped to bring about
this shift. Data collected from the IQMS indicate that around 60% of teachers are in schools
where different teachers are assigned different overall categories out of the four – unacceptable,
satisfactory, good, outstanding. This points to processes in the school where there is some
acknowledgement that some teachers require more support than others, and that certain teachers
can learn from other teachers. Unfortunately, 40% of teachers are in schools where everyone is assigned exactly the same category, suggesting performance management is not taken seriously.
These issues receive more attention in section 10.3.
The fifth likely contributor to qualitative improvements in the schooling sector is increasing
participation in Grade R and pre-school institutions. Figure 11 below points to the changes in
institutionalised early childhood development over the last two decades. In 1998, 18% of
children aged 0 to 6 were attending a pre-school, meaning some kind of education and care
institution outside a school. By 2017, that figure had
reached 43%. Most of this expansion occurred before 2012. Schools-based Grade R increased from 13% to 72%
of the age five cohort between 1999 and 2017. There have
been concerns around the quality of both Grade R and pre-
schooling in general. Currently, little is known about this,
though an evaluation commissioned by government of schools-based Grade R as it existed in
in the 2005 to 2011 period, has been published74. The quality of schools-based Grade R is very
likely to have improved in subsequent years following the introduction of national workbooks
and other materials in this grade.
Historically, the ten education departments have been minimally involved in the pre-school
sector, though expansion of this sector is likely to have been in part the result of school policies
such as no fee schools and publicly funded Grade R in schools, which would have freed up
some household funds to pay for pre-school. This situation is set to change following
73 World Bank, 2003: 124. 74 Department of Planning, Monitoring and Evaluation, 2014.
Improvement factor 5: Increasing access to both Grade R and pre-school below Grade R

41
government’s commitment to moving the pre-school sector from the departments of social
development to the departments of education.
Figure 11: 1998 to 2017 participation trends
Source: October Household Survey for 1998; General Household Survey for the other three years. Microdata used are accessible through https://www.datafirst.uct.ac.za. Note: The category ‘Day mother / Gogo’ is excluded.
What has been described are five positive changes in the sector representing likely explanations
for the improvements seen in learning outcomes. Clearly, these five areas need to watched
carefully in future years to ensure that positive change continues.
It is important not to lose sight of background work which may not appear to be impacting
directly on educational outcomes, but which nonetheless is necessary for an environment in
which progress occurs. In this regard, three interventions focussing on social protection, and specifically alleviating pressures on the poor, stand out. The National School Nutrition
Programme (NSNP) has continued to expand its reach, from 70% of all learners in 2010 to 82%
in 2017. There has been a slight increase, from around 2% in 2010 to 3% in 2017, in the
percentage of learners benefitting from scholar transport schemes aimed at assisting learners
with the greatest difficulties in commuting to school. The percentage of learners walking to
school has declined considerably, from 75% in 2009 to 67% in 2017, in part due to urbanisation.
The percentage of learners not paying fees as a result of government’s no fee schools and fee
exemptions policies has risen steadily, from 47% in 2009 to 67% in 2017. All these figures are
from Stats SA’s General Household Survey and therefore reflect responses from recipients of
the interventions75.
Other ‘background achievements’ include relatively sound financial management by the ten
education departments. Though there have problems in this area, the achievements should not
be under-estimated. Above all, despite the serious budget constraints described in section 6.1,
the required 80 to 20 split between personnel and non-personnel spending specified in the
funding norms has largely been upheld. For instance, audited 2016/17 figures point to
compensation of employees amounting to 82% of total current spending in provincial
departments. The phenomenon seen in the late 1990s, an earlier period of serious budget
pressures, when personnel spending squeezed out spending on vital supplies such as books has
75 Department of Basic Education, 2019a: 35, 39.
0
10
20
30
40
50
60
70
80
90
100
0 1 2 3 4 5 6 7 8
% o
f c
hil
dre
n
Age on the survey date
1998 2007 2012 2017
Pre-school
School
Not attending

42
thus mostly been avoided. The 2018 wage agreement, which among other things resolved a
longstanding grievance on the part of teacher unions around pay progression, was implemented
in a manner which reduced unintended costs often associated with migration to new salary
scales. This bodes well for maintaining and even growing the size of the workforce, and
reversing the deterioration in the LE ratio referred to in section 6.1.
6.3 Challenges and how to resolve them
The five service delivery improvements outlined in section 6.2 all carried their own
challenges. The CAPS may have improved guidance to teachers, yet guidance and training on
how to teach reading in the early grades is lacking. Access to books improved, yet not all
learners have the books they need in the classroom, for various reasons, not all relating to
funding and book deliveries. A strong emphasis on assessments, and the introduction of ANA,
helped improve the focus on learning outcomes, yet flaws in ANA led to disagreements between
government and unions, which in turn led to the discontinuation of the programme. Younger teachers enjoy better initial teacher education, yet efforts to raise the level of subject knowledge
among older teachers through in-service training has yielded little success. Participation in ECD
has risen dramatically, yet there are concerns around whether the quality of these services truly
prepare children for school. These challenges obviously all point to opportunities for improving
learning outcomes in future years.
Section 6.1, which described unexpected challenges relating to population increases and budget
constraints, serves as a reminder that the schooling sector needs to be prepared, as far as
possible, for a range of eventualities. The year 2018 put the Western Cape, and specifically
Cape Town, in the international spotlight as the threat of so-called Day Zero, or a virtual closure
of the water distribution system, seemed likely. Even if schools had not experienced water cuts,
Day Zero would have been sufficiently disruptive to impact on education. Also in 2018, a
tornado damaged 26 schools in Eastern Cape. UNESCO has prepared a guide on how schooling
systems can prepare for climate change, and South Africa’s own climate change adaptation
strategy indicates that increasingly we need to be ready to deal with extreme weather
phenomena. Climate change is something which the schooling system must prepare for, through measures to mitigate impacts, and through the education of teachers and learners of the
issues76.
Section 7 below deals with innovation work that has been happening, and should be taken
forward and prioritised, in three areas which cut across many of the 27 goals of this Action
Plan: early grade reading; assessments; and e-education. Details relating to the 27 goals
themselves, beginning in section 9, discuss action that needs to be taken in relation to these
goals.
At the highest level, it is important to realise that as the schooling system improves, achieving
further improvement will become increasingly difficult and complex. There are many ‘low-hanging fruits’ at the start of the improvement trajectory, for instance supplying books to
learners. However, in future years less obvious improvements in areas such as organisational
culture and systems development capacity will become increasingly important to sustain
improvements. A key chapter in the NDP relates not to education specifically, but to the entire
system of service delivery. Chapter 13, titled ‘Building a capable and developmental state’,
describes the main challenge as follows77:
The main challenge has been unevenness in capacity that leads to uneven performance in local,
provincial and national government. This is caused by a complex set of factors, including
tensions in the political-administrative interface, instability of the administrative leadership,
skills deficits, the erosion of accountability and authority, poor organisational design and low
76 UNESCO, 2016a, 2016b; Department of Environmental Affairs, 2017: 11, 67. 77 National Planning Commission, 2012: 408-9.

43
staff morale. … The search for a quick fix has diverted attention from more fundamental
priorities. A deficit in skills and professionalism affects all elements of the public service.
This ‘unevenness’ in the quality of service delivery systems across the basic education sector
is clearly a part of the reason why educational inequalities persist. The required response to
these challenges is set forth as follows in the NDP:
A developmental state brings about rapid and sustainable transformation in a country’s
economic and/or social conditions through active, intensive and effective intervention
in the structural causes of economic or social underdevelopment. Developmental states
are active. They do not simply produce regulations and legislation. They constantly
strive to improve the quality of what they do by building their own capacity and
learning from experience. They also recognise the importance of building constructive
relations with all sectors of society, while insulating themselves from capture by
sectional interests.
The implication of this is that those working for the development of the schooling system
increasingly need to improve how things get done, not just focus on what is done.

44
7 Innovation priorities
Action Plan to 2019 identified two strategic areas of innovation needed in the sector:
assessments and e-education. The current Action Plan adds a third one: early grade reading.
This addition acknowledges important advances made in the sector in recent years around how
to teach reading in the early grades, and how to provide training to teachers in the desired
methods.
UNESCO and others underline the importance of innovation in schools and schooling systems.
Innovation means adopting new approaches, and possibly new technologies, to bring about
effective teaching and learning. Yet while innovation is important, it comes with its own
risks. The excitement that comes with innovation can result in a situation where people lose
sight of why the change is occurring. In education, innovation must clearly bring about better
quality schooling, and a reduction in existing educational inequalities. Moreover, the costs of
the innovation should be justified by the educational gains. A focus on innovation should not detract from the importance of improving more routine, and less exciting, parts of the system.
As a UNESCO guide on innovation points out, ‘The need for system maintenance can be
overlooked in the flood of enthusiasm that often accompanies innovation’78.
7.1 Early grade reading
Evidence has been mounting around the world on how weak the reading acquisition of children
is in the initial grades, how severely this can disadvantage children for life, and which
interventions work best to improve the situation79.
In South Africa, this evidence has been acknowledged in the President’s June 2019 State of the
Nation Address (SONA): ‘Our schools will have better educational outcomes and every 10 year
old will be able to read for meaning’. The earlier February 2019 SONA had referred to the
means for achieving this:
The department’s early grade reading studies have demonstrated the impact that a
dedicated package of reading resources, expert reading coaches and lesson plans can
have on reading outcomes. We will be substantially expanding the availability of these
early reading resources across the foundation phase of schooling.
Groundbreaking research in South Africa was undertaken in recent years by the DBE, working
with partner organisations, to produce South Africa-specific knowledge about early grade
reading. The research project is known as the Early Grade Reading Study (EGRS). This study
has confirmed that, despite the introduction of the CAPS, in most schools the teaching of reading remains weak. It has also established that migrating to the teaching approaches put
forward by the CAPS is possible, even in relatively large classes, and moreover necessary as
these approaches do in fact lead to better reading skills among learners. Importantly, the EGRS
tested various in-service teacher training methods and concluded that certain approaches
involving some individualised coaching is preferable, yet not prohibitively costly.
Widespread innovation is thus necessary on two levels. Firstly, better methods for teaching
reading must be promoted in the Foundation Phase (grades R to 3). This implies acknowledging
that methods currently in use in many schools are ineffective and should not continue. It also implies making it clearer to teachers, but even parents and education administrators, what
methods do achieve the desired outcomes. Secondly, better teacher training methods are
78 Inbar, 1996: 42. 79 UNESCO, 2017b; UNESCO, 2017a: 191-213; Popova et al, 2016.
45
possible and necessary. In particular, the EGRS found that off-site training offered to large
groups of teachers tends not to yield the expected results.
The early grade reading innovations thus span both the goals dealing with Foundation Phase
learning outcomes (Goal 1), and those dealing with teacher development, learning materials,
class sizes and curriculum coverage (goals 14 to 20).
The EGRS followed a ‘randomised control trial’ (RCT) research methodology, which is
now widely used in education research. Certain schools, known as ‘treatment schools’, received
interventions to improve the teaching of reading, while a few ‘control schools’ received no
intervention. The difference in the progress of the reading skills of learners in treatment schools,
compared to control schools, informed the findings of the EGRS. The study started in 2015 and
involved 150 primary schools in North West Province. Interventions included more traditional
training for teachers in centralised venues for one sub-group of the treatment schools, and a
more intensive process of individualised coaching for the teachers of another sub-group. Details on the EGRS are available in a series of published reports80. Section 6.2 above discussed the
magnitude of the reading improvements achieved in the treatment schools which enjoyed the
individualised coaching.
What was different about the teaching of reading in the schools which received the
individualised coaching, compared to those which did not? What exactly accounted for the
substantial benefits enjoyed by learners in the former group? The EGRS included classroom
observations by researchers to help answer these important questions81. These observations
inform the discussion and diagram that follow.
When it comes to what teachers did, two key differences stand out. Firstly, in the treatment schools teachers were interested in and capable of ensuring that learners were engaged in
learning activities all the time, often in a fairly independent manner. Learners were seldom
inactive, or bored. Teachers in the treatment schools thus understood better how much time it
takes for learners to develop their reading and writing skills. They understood the cost of
wasting time. They insisted on more individual reading and writing work, or work in groups,
as opposed to a teacher-centred approach of the teacher talking, and asking questions to the
class as a whole, an approach which, if over-emphasised, is unlikely to keep learners active and
interested. Teachers knew how to conduct group-guided reading sessions, sessions where the
teacher assists a group of up to ten learners, while giving the rest of the class interesting tasks
to do.
Secondly, teachers in the treatment schools were better at viewing the day’s class as part of a
year-long process where learners acquire specific skills. At the back of their minds they were
aware of, for instance, how many new words learners had to become familiar with. They
understood the importance of building up the learners’ vocabulary. This was possible largely
thanks to a series of planning tools given to teachers: standard year plans, lesson plans and
‘curriculum coverage trackers’ which allowed teachers to see whether they were falling
behind. The use of these tools was reinforced through WhatsApp messages. Very importantly,
the plans given to teachers were realistic, and to some extent flexible. Plans which attempt to
cover too much, or which do not take into account the fact that children from more
disadvantaged backgrounds may take longer to reach particular milestones, can discourage
teachers and in fact stifle progress.
The availability of enough good materials in the classroom is essential to stimulate the
teacher and her learners. But this on its own is not enough. The study found that in a large number of control schools, or schools which did not receive the training, materials such as the
80 Department of Basic Education, 2017b; Taylor et al, 2017. 81 Department of Basic Education, 2017c.

46
national workbooks and graded readers were available, but they were not well used. In fact, in
many of the control schools graded readers sat unused and in storage. The national workbooks
and graded readers complement each other, and are both necessary. National workbooks belong
to the learner, the learner can write in them, and they can be taken home. However, they focus
largely on shorter texts, often just a sentence or two at a time in the Foundation Phase, though
they explain grammar and spelling in a systematic fashion. Graded readers, on the other hand,
provide learners with an opportunity to go through a story spanning several pages. These
readers, however, mostly stay in the classroom and cannot be taken home. They are ‘graded’ in
the sense that they facilitate moving from less to more demanding texts. In addition to these
books, the availability of other materials is also important for the reading teacher: charts; so-
called ‘Big Books’, giant books which the teacher can show to the whole class; and flashcards,
cards with pictures or single words.
Importantly, learners in the treatment schools did use the national workbooks extensively, and
wrote in them about as much as control school learners. However, in addition to this, ‘treated’
learners wrote far more in their exercise books than learners in the control group. This is
because treated learners spent far more time writing.
Large classes did not emerge as a barrier to implementing strategies such as group-guided
reading. In fact, the EGRS found that the largest improvements in reading were achieved in
relatively large classes, meaning classes of between 38 and 45 learners82. What might happen
in even larger classes, beyond 45 learners, was not examined in the EGRS. Importantly, LURITS data indicate that a third of grades 1 to 3 learners are in classes of more than 45
learners, and a quarter in classes of more than 50 learners83. The strategies identified as
workable by the EGRS are very likely to have a limited impact on extremely large classes.
Clearly, efforts to improve the acquisition of reading must include tackling excessive class
sizes (this is discussed in detail in section 10.2).
The following diagram illustrates the basics of the effective teaching of reading in the
Foundation Phase, based on lessons learnt from EGRS84. This is obviously a simplification.
Guides used for training teachers contain much more detail. It is important that not just teachers, but also parents and departmental officials have at least a basic understanding of what effective
strategies for teaching reading look like. Without this understanding, parents may not be
supportive of strategies to change classroom practices.
82 Department of Basic Education, 2017b: 17. 83 Analysis of LURITS 2015 data. 84 See for instance Department of Basic Education (2017c: 30-34).

47
The classroom practices that brought about improvements to the reading proficiency of learners,
captured in the above diagram, are essentially those specified in the CAPS. The EGRS
specifically went about realising the practices of the CAPS. The EGRS findings thus confirm
that most schools have not internalised the CAPS, that doing so is possible, even with relatively
large classes of up to around 45 leaners, and that following what is in the CAPS properly
does indeed bring about better reading skills among learners.
The EGRS moreover confirms that we need to rethink in-service teacher training, in ways that in-service training is being re-examined in other countries too. The more traditional off-
site training offered to groups of teachers within the EGRS produced improvements which were
only half as large as those brought about when teachers received individualised coaching. This
coaching consisted of around sixteen visits by a coach spread over two years to each teacher
receiving this support. The annual cost in per learner terms came to around R804, or around 7%
of what the state in general spends on each learner per year.
Two
fundamental
requirements:
1. The right materials in
the right quantities.
2. Skills on the part of the teacher in conducting the various types of
activities.
MORE EFFECTIVE TEACHING OF READING (AND WRITING) IN THE FOUNDATION PHASE
WHOLE-CLASSACTIVITIES
33% to 50% of class time
Examples...
Teacher demonstrates letter formation.
Teacher reads from a Big Book and discusses the reading with the class
(often referred to as shared reading).
Learners take turns to read to the class as a whole, in part to practice
pronunciation (phonics).
Teacher discusses with the class tasks just completed on an individual
basis using the national workbooks.
GROUP-GUIDED
ACTIVITIES
40% to 46% of class time
INDIVIDUALLY-FOCUSSED ACTIVITIES
±20% of class time
TRANSITION ACTIVITIES
±10% of class time
Examples of what happens in the guided group
(up to ten learners, preferably with similar levels
of ability)...
Teacher provides more individualised
guidance with respect to phonics, grammar, and
the meaning of texts (often referred to as group-
guided reading). Graded readers are commonly
used.
Examples of what the
rest of the class does...
Learners complete
short written exercises in
the national workbook.
Learners practice handwriting.
Examples...
Learners write short paragraphs, for instance in response to questions in
the national workbook, while the teacher assists individual learners who are
struggling.
Learners can also do this in pairs.
Examples...
Learners are given or collect materials they will use.
Seating arrangements are changed to accommodate or end groupwork
activities.
Percentages of time are based on classroom observations of relatively successful Grade 2 teachers in the Early Grade Reading Study
(EGRS).
PLANNING AND
ASSESSMENT OUTSIDE THE CLASSROOM
Examples...
The teacher uses results from the Early Grade Reading Assessment
EGRA) tools to plan teaching activities and decide on ability groups.
The teacher uses planning tools to monitor progress in the CAPS
programme and the introduction of enough new vocabulary.
The teacher marks work performed by learners to provide individual feedback and to gauge the level of the class as a whole.
In general,
more time
needed on this
in South
Africa's
classrooms
48
How will the teacher training and changes in classroom practices highlighted by the EGRS be
brought about across all schools in the country needing this? The DBE has established a multi-
stakeholder task team to oversee the implementation of further training, and monitoring of
results, across all provinces, and to advocate for budget allocations for the initiative, as well as
non-government funding. Moreover, the DBE is in the process of establishing a stronger web
presence for the materials emerging from the EGRS. It is important that materials such as
the lesson plans and monitoring tools be made widely available so that they become used and
understood by, for instance, district officials providing support to schools and the large range
of non-government organisations engaged in teacher training. Moreover, an EGRS web space
could serve as a clearinghouse for materials, and promote high quality materials in all official
languages.
7.2 Assessments
Action Plan to 2019, in discussing innovation in the area of assessments, focussed on better test design, scoring and feedback approaches in the Annual National Assessments (ANA)
programme. Since that earlier plan was released in 2015, there have been developments which
change the context for innovation in assessments in several ways.
Firstly, the ANA programme was discontinued in 2015 due to disagreements between the
education departments and teacher unions over the way forward for the programme. While
government favoured gradual design improvements to the programme, without suspending the
programme, teacher unions favoured suspending the programme until a redesign had been
completed. Important details relating to this disagreement are outlined below. Filling at least a
part of the gap left by ANA is a new programme known as the National Assessment Programme
(NAP)85. This programme, which has involved extensive stakeholder engagement, is also
discussed below.
Secondly, the UN’s Sustainable Development Goals (SDGs) formalised a strong global
commitment to tracking progress over time in the learning outcomes of children, and to having
evidence inform education quality interventions. The SDGs were adopted by UN members in
2015, and the SDG indicators in 2017. A key indicator in terms of assessments is the
following86:
4.1.1 Proportion of children and young people: (a) in grades 2/3; (b) at the end of primary; and
(c) at the end of lower secondary achieving at least a minimum proficiency level in (i) reading
and (ii) mathematics, by sex
Thirdly, the value of school report cards, based at least in part on assessments of learning
outcomes, as a tool for improving accountability and transparency, has become increasingly
clear as more countries have adopted them87.
Fourthly, in response to mounting criticism that the widely used ‘pass rate’ at the Grade 12
level is often a poor gauge of school quality or progress, the DBE has, since 2015, been exploring innovative ways of using Grade 12 results to evaluate the system. In particular, work
on an ‘inclusive basket’ of indicators has gone ahead.
The discussion below begins by outlining what innovations are under way, and must be taken
forward, in relation to the monitoring of progress against SDG Indicator 4.1.1. Attention then
turns to the realisation of the National Development Plan’s (NDP) call for ‘reliable measures’
for every primary school, which in part involves exploring school report cards for these schools
85 What has been previously referred to as the National Integrated Assessment Framework (NIAF) has,
since 2019, been referred to as the National Assessment Programme (NAP). 86 United Nations, 2017a. 87 See for instance Cheng and Moses (2016).

49
in the South African context. Finally, the discussion turns to innovations at the secondary level,
specifically in relation to the ‘inclusive basket’ and, again, to opportunities presented by school
report cards.
The current section does not cover all the innovation that needs to occur with respect to
assessments. As pointed out in section 5, the evidence suggests that better formative
assessment is one under-explored avenue for improvements in what happens in classrooms.
Clearly, innovation is needed here too, both in terms of system-wide policies and tools, and in
terms of what individual schools and teachers do. Formative (but also diagnostic) assessments
are discussed in section 10.3.
An emphasis on assessment is sometimes interpreted as an exclusive focus on the individual
learner, at the expense of a focus on the teacher or the school. It should become clear below
(and in the rest of this Action Plan) that this is not premise used here. Effective assessments
improve the teacher’s ability to teach, and provide vital information for managers in the
system to take action and to be held accountable.
If innovative ways of tracking progress in learning outcomes are to be realised, lessons from
the recent past need to be considered carefully. The
weaknesses in the design of ANA are captured in a 2016 proposal
for the way forward88. These weaknesses include the limited
comparability over time of the ANA results – obviously a crucial
issue if progress is to monitored – and an insufficient use of
contextual and background information when results were
presented. Crucially, a clear policy stating the overall role of ANA in improving education was
absent. The absence of a clear policy was arguably at the heart of the disagreements between
the departments and teacher unions. It was not clear how information emerging from ANA
should, and should not, be used to inform support programmes and hold various actors in the
system accountable.
In moving forward, best practices from around the world in the area of tracking educational
progress need to be considered. As emphasised in the 2016 proposal, confidential (or secure)
‘anchor items’, or questions which are repeated across years, are needed. This is most easily
implemented in a representative sample of schools, where it is relatively easy to ensure that
items repeated across time are not ‘leaked’. The technical aspects of test design and sampling
can be complex. Fortunately, there are examples of best practice in the international assessment
programmes South Africa participates in, such as TIMSS.
The National Assessment Programme (NAP) includes the re-introduction of the sample-based
Systemic Evaluation as a focal tool for measuring progress and reporting against national
targets and the SDG indicator on learning proficiency. The Systemic Evaluation will be able to
produce sufficiently reliable trend data at the national and provincial levels (but not below this). The Systemic Evaluation was run previously in 2001 (Grade 3), 2004 (Grade 6) and 2007
(Grade 3). A key strength of the Systemic Evaluation was that it included background
questionnaires administered to learners, teachers, the school principal, and in some cases
parents. This allowed for reporting on learning outcomes relative to the socio-economic
challenges faced by schools. Crucially, learning outcomes should always be viewed relative to
the socio-economic context89. The background questionnaires moreover revealed important
observations and complaints on the part of teachers and schools about the support and services
received from district, provincial and national officials.
88 Department of Basic Education, 2016a. 89 See for instance Crouch and Mabogoane (1998).
Innovative ways of tracking systemic progress in learning outcomes.
50
However, there were also problems with the Systemic Evaluation which should not be repeated.
The time lag between assessments of the same grade were long and the depth of analysis in the
national reports was insufficient (in particular for 2007). Many of these problems can be traced
to limited capacity to run assessments. The international literature emphasises the need for
developing countries to build capacity in the field of psychometrics, and to ensure that the
institutional placement of the assessment programme facilitates a rigorous, honest and
professional approach to assessing90. The 2016 proposal emphasises that the Systemic
Evaluation should be conducted by an independent body with the required skills. It is moreover
important that these skills be built up internally within the ten education departments, in part to
facilitate the use and interpretation of the Systemic Evaluation results.
To sum up, what are the key innovation challenges in relation to tracking progress in learning
proficiency, an activity the SDGs but also the NDP require us to
take seriously? Above all, a world-class national assessment is
needed to gauge whether the desired improvements in learning
outcomes outlined in this Action Plan and elsewhere are being
achieved. This work requires sophisticated planning and
management with respect to sampling, test design, the use of anchor items, and the generation
of meaningful reports which bring about a better informed education policy discourse.
Section 3.2 has already referred to the NDP’s call for reliable measures of learning outcomes
for every primary school, as part of a broader system of results oriented mutual accountability (ROMA). The innovation
required here is both technical and societal. As indicated in
section 3.2, accountability reforms can be difficult, and require a
clear commitment from all parties to shared principles.
Assessments of educational quality raise legitimate concerns
around fairness. They should not lead to situations where only one layer of the system, for
instance school principals, are seen to bear the full responsibility for quality schooling. Clearly, all parties, from policymakers, to officials, to principals, to teachers, to parents, need to share
this responsibility. A further problem is that monitoring learning outcomes may be seen as
unnecessary if communities are under the impression that relatively superficial factors, such as
school discipline and attractive school premises, guarantee that quality learning is occurring.
The evidence shows clearly that no such guarantees exist.
South Africa is unusual among Southern African Development Community (SADC)
countries for its absence of some form of standardised assessment covering all primary
schools. According to UNESCO, South Africa (at least since the discontinuation of ANA in 2015) and Angola are alone in SADC in not having some universal assessment or examination
at the primary level91. One implication of this is that it becomes difficult to hold primary school
principals accountable. Another way of looking at the problem is that school principals are left
with no sound basis for arguing that they have delivered quality schooling. This problem
extends to two-thirds of the schooling system: 66% of grades R to 12 learners are in schools
without Grade 12, in other words in schools without information that could be used to construct
a ‘reliable measure’ of learning outcomes.
This legacy of a lack of information is likely to be one factor explaining the relatively poor
performance of South Africa’s schools in an international context, even after the improvements
described in section 6.2. Evidence points towards countries with widespread and accurate
information on learning outcomes, combined with effective accountability systems,
90 UNESCO Institute for Statistics, 2018: 11; Clarke, 2012. 91 UIS Database of National Assessments, http://uis.unesco.org/en/uis-learning-outcomes, accessed
2019.
Sampling, test design and reporting.
Innovative and reliable measures of learning outcomes for every primary school.

51
performing better in terms of learning outcomes92. Moreover, attempts to empower local
actors, such as school principals and parents in school governing bodies, in line with the South
African Schools Act, is likely to be less successful in the absence of this information.
While it is not too difficult to design an assessment system that can accurately tell the
differences in educational quality across all schools at one point in time, designing a universal
(or censal) system that can track progress over time to a sufficiently reliable degree is
extremely difficult. This is often not fully understood, and misunderstandings in this regard
lay behind many of the problems in ANA. It is popularly believed that good teachers can
produce and mark assessments which can produce comparable measures of performance over
time. In fact, without the confidential anchor items referred to above, assessment experts would
argue it is impossible to produce trends which are sufficiently reliable. Yet such items are
difficult to implement on a large scale because they must be kept secure. Some schooling
systems, such as the Brazilian one, or South Africa’s own Western Cape, conduct universal
assessments and report on trends at the individual school level. But whether these trends are
sufficiently reliable has never been properly established. Best practice would be the approach
followed in, for instance, Australia’s system, coincidentally named the National Assessment
Program. Australia’s NAP tests learners in all schools, but in parallel around 1 000 learners in
a very small ‘equating sample’ also write a test consisting of a combination of items from the
universal test, and confidential items repeated over time in the equating sample. This allows for
results in the universal tests to be adjusted so they do become sufficiently comparable over
time, using what was found through the equating sample93. If universal tests are ‘leaked’ this
does not endanger comparability over time as the items in these tests are never repeated.
Less rigorous approaches can be followed, but then policies on how results are used need
to reflect the fact that trends would be less reliable. This can be complex, in particular if it
not clear how unreliable the trends are. Above all, situations must be avoided where, for
example, action is taken with regard to a school, or a group of schools, based on a finding that
learning outcomes are deteriorating, when it is possible that the downward trend is a
measurement error.
One avenue the DBE has been exploring since 2016, is better use of quarterly assessment
data in grades 3, 6, 9 and 12 in schools to gauge trends at the provincial and district levels.
For this purpose, in 2016 the DBE began an ambitious project of collecting learner-level formal
assessment data, per subject, into a national data warehouse. These results are standardised
insofar as teachers must follow the CAPS, and insofar as in around two-thirds of primary
schools ‘common assessments’ are used, meaning test papers produced by the district or
province94. Yet crucially, how test scripts are marked is likely to differ across schools. Nonetheless, better use of these data, in particular the grades 3 and 6 data, could serve as a first
step towards a clearer awareness of, at the very least, the extent to which different schools are
conducting assessments consistently and in a manner which suggests proper adherence to the
CAPS. The following map illustrates what can be done with the data. It is clear that in some
districts the consistency of results across subjects is worryingly low. Yet in others it is about as
high as one could expect. This can assist in identifying where training in better assessment
practices should be targeted.
92 Hanushek and Woessman, 2010: 25. 93 Australian Curriculum, Assessment and Reporting Authority, 2017: 18-19. 94 Department of Basic Education, 2019b: 98.

52
Figure 12: Consistency of school-based assessment data in Eastern Cape
Note: Correlations are school-specific, and indicate how similarly ranked learners are if languages or mathematics results are used. Data analysed were Term 2 continuous assessment data from 2018. Colours of districts illustrate how poorly correlated the scores were in the worst schools, specifically schools in the 10th percentile in each district. In green districts at least 90% of schools display a correlation across subjects that is better than around 0.60.
The 2016 proposal underlines that ‘assessment overload’ in schools should be avoided.
Hence the proposal envisages the option of a ‘national Summative Assessment’ at just the Grade
6 level, in the third or fourth term – the discontinued ANA involved national assessments in
every grade, an approach which became burdensome for the system. The proposal envisages
that the new national assessment would replace existing school-based assessments in Grade 6
in the relevant term. This makes sense, yet any such replacement would have to come with
careful planning around the possible effects of abrupt changes to grade repetition patterns.
Avoiding assessment overload is in part a question of avoiding duplication across assessments driven by the district, the province, and national. The observation made by the 2009 curriculum
implementation review95, that there was too much ‘layering’ brought about by different levels
of the administration running similar initiatives in parallel, is to some extent still a problem.
One strong reason in favour of having national, as opposed to provincial, assessments is that
proper design of these programmes requires scarce skills, which are not available across all nine
provinces.
The 2017 School Monitoring Survey conducted by the DBE gathered important information
about how principals and teachers feel about standardised assessments. Around three-quarters of school principals and teachers support having a ‘national examination’ in Grade 6. Around
two-thirds believe that the results from such an examination should be used to compare schools.
Importantly, support for a Grade 6 examination was noticeably stronger among schools
serving less advantaged communities96.
How might the results from, for instance, a Grade 6 national assessment covering all primary
schools be used in a new system of school report cards? Importantly, this type of tool would
not be entirely new in South Africa. Western Cape has gained valuable experiences from school
report cards drawing from the province’s ‘systemic tests’. Every year, the DBE’s set of reports
on the National Senior Certificate include a report with school-level statistics. Though ANA
did not make school-level statistics public, it placed considerable emphasis on district-level
statistics. Apart from school report cards, district report cards are a further option. School
95 Department of Basic Education, 2009. 96 Department of Basic Education, 2019b: 101-102. Also further analysis of the original microdata.
MF
BU
COCR
EA
NB
MB
FOGR
GT
DU
KI
LA LI
FL
QT
QU
LU
MT
UI
PO
ST
MA
Across-subject Grade 3 correlations in schools:10th percentile in district.40 to .49.50 to .59.60 to .72
53
report cards would clearly have to be designed with a view to enhancing the two lines of
accountability envisaged in the NDP: the line between schools and parents, and the line
between schools and the district (see the earlier Figure 1). They should, especially in a country
as unequal as South Africa, present information on learning outcomes in combination with data
on the socio-economic status of learners. Countries which have implemented these tools and
from which we could learn include Brazil, Rwanda, Malawi and Indonesia97. In Chile, research
showed that where officials believed parents would understand certain concepts in these cards,
they in fact did not98. Making these tools fit for purpose requires careful consideration of the
communication aspects.
To sum up, what are the key innovation challenges for developing reliable measures of learning
outcomes for every primary school? The technical, societal and political aspects must all be
managed very carefully. Any system must not only be rigorous and fair, it must be seen by
all affected parties to be so. In particular, there needs to
be a shared understanding of what the likely margins of
error in school-level trends over time are. Accountability
mechanisms, such as school report cards, must be
informed by experiences in other countries, but should be
tailor-made for the South African context, and need to be
carefully negotiated with, above all, teacher unions. For
accountability to be fair and effective, school-level
‘reliable measures’ must be read together with information on the socio-economic background
of each school’s learners. This requires addressing shortfalls in the design of the poverty
quintiles into which schools are currently placed.
Obtaining better indicators of Grade 12 performance is a relatively straightforward matter,
given that the Grade 12 examination undergoes extensive quality
assurance and data are easily accessed. Even so, there are risks.
Dropping out before Grade 12, and changes over time in the subject combinations of examination candidates, are among the
factors which can complicate comparisons. The pass rate,
meaning candidates obtaining the NSC divided by all candidates, is widely used in the
education debates, yet it can be distorted by differences across schools in terms of who becomes
a candidate, in other words who ‘survives’ and does not drop out. For example, the pass rate in
KwaZulu-Natal is low, but this is in part because this province ensures that a higher proportion
of youths reach Grade 12 and become examination candidates. The proportion of youths
obtaining the NSC in this province has in fact been above the national average99. The pass rate
is deliberately not among the official Grade 12 indicators. The Medium Term Strategic
Framework (MTSF) of government focusses instead on indicators which are less susceptible to
distortion, such the total number of mathematics candidates obtaining a mark of 50% or more.
The DBE has invested in the development of a more robust system to gauge the performance
of schools using Grade 12 results. Specifically, work has proceeded on an ‘integrated basket’
of indicators for Grade 12100. Together with National Treasury, the DBE commissioned work
on what Grade 12 indicators work best101, and with the Dell Foundation has piloted a Grade 12
97 Cheng and Moses, 2016. 98 Taut et al, 2009. 99 Department of Basic Education, 2016b: 61. 100 See for instance response to Parliamentary question 983-P of 2017 at
http://pmg.org.za/files/RNW982-170606.docx. 101 National Treasury, 2017.
Understanding how comparable measures are over time, accountability mechanisms which are seen as fair, reliable information on socio-economic status.
Better indicators of Grade 12 performance.

54
‘school report card’ which is accessible online to secondary schools as part of the Data-Driven
Districts (DDD) partnership102.
What are the key innovation challenges for developing better indicators of Grade 12
performance? Given that the Grade 12 data are good, much of innovation must occur in relation
to how statistics are presented, and effective policies outlining how statistics should be used, and should not be
used. Policies should be designed in a manner which
minimises unintended consequences, such as a view that
comparisons across schools are unfair. Success with
regard to school report cards at the secondary level will
provide valuable lessons for the introduction of similar
tools at the primary level.
7.3 e-Education
Here e-Education means the use of modern information and communication technologies
(ICTs) in the delivery of schooling. In dealing with this area of innovation, Action Plan to
2019 focussed strongly on the need for a national strategy that would clarify three things: (1)
how technological innovation must be aligned to the aim of improving learning outcomes; (2)
what, in terms which can be widely understood, the available technologies, and their likely costs
and benefits, are; and (3) how different stakeholders should work together to promote e-
Education.
Since the release of the last Action Plan, progress and change has occurred in the e-Education
space, but many gaps remain. An important step forward was a 2018 study, facilitated by the National Education Collaboration Trust (NECT), which brought together the insights of several
foreign and local experts and, via a telephonic survey, the opinions of around 1 200 district
and school personnel103. NECT is a centre for educational innovation working closely with the
DBE, and largely funded by the state. The study led to seven ‘high priority’ recommendations:
1. Enhance the links across education goals, metrics, and data down to the school level,
and tailor to the provincial context.
2. Create mechanisms for accountability for data accuracy to further enable a culture
that values data. 3. Accelerate the rollout of Operation Phakisa for ICT infrastructure and improve
affordability of connectivity.
4. Create dedicated roles with strong specialist ICT and data analysis capabilities.
5. Define and implement a public-private collaboration framework.
6. Build a robust ICT landscape of data systems and ed-tech tools.
7. Define data and system interoperability standards.
The study found there had been progress during the previous five or so years. Above all, growth
in the use by schools of SA-SAMS, the South African School Administration and Management
System, and better organised provincial and national warehousing of SA-SAMS data, have had
tangible benefits in the form of less duplication in the submission of data, and the introduction
of online tools through which schools and districts can visualise important statistics. Crucially,
the study found that managers in, for instance, districts are becoming increasingly aware of how
data can contribute towards better planning and management. Progress was achieved largely
through modalities of development involving public-private partnerships. The Data Driven
Districts (DDD) initiative, involving the education departments, the Dell Foundation, and other
102 The ‘Grade 12 School Report Card’ under the ‘Reports’ tab, at www.dbedashboard.co.za. This is
only accessible via a password, which schools have. 103 Department of Basic Education, 2019c; National Education Collaboration Trust, 2019.
Effective communication of appropriate indicators of Grade 12 performance, policy outlining clearly how indicators should, and should not, be used.
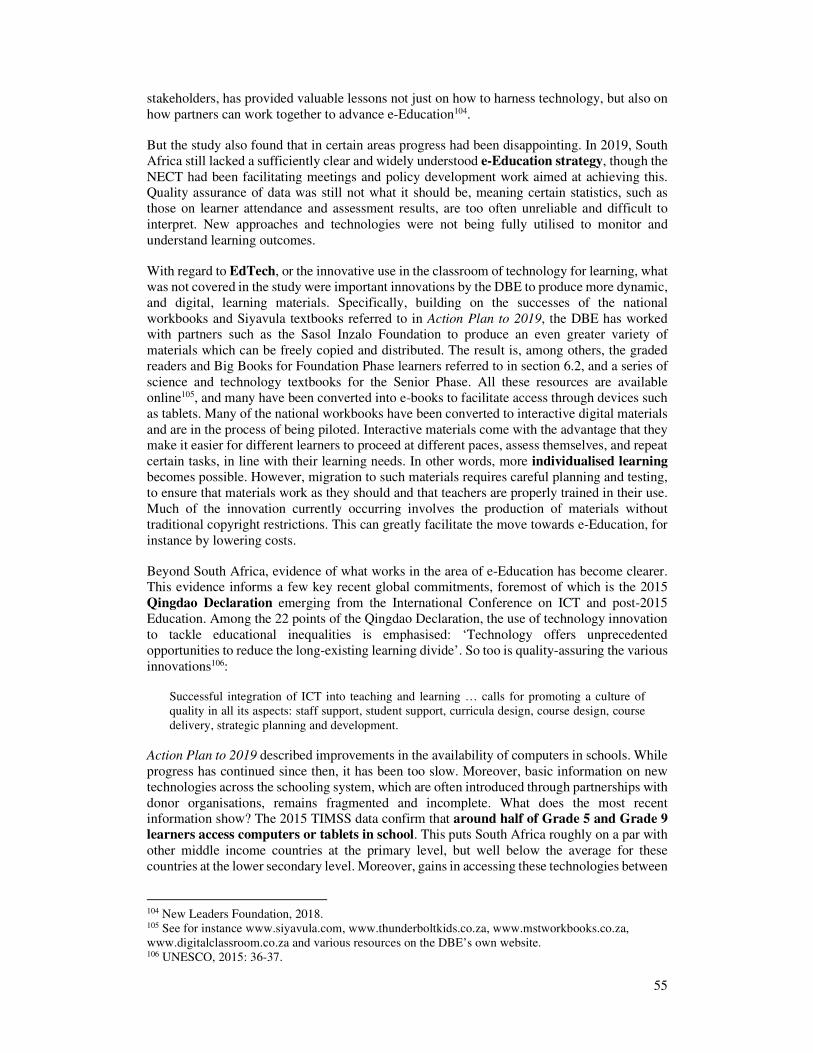
55
stakeholders, has provided valuable lessons not just on how to harness technology, but also on
how partners can work together to advance e-Education104.
But the study also found that in certain areas progress had been disappointing. In 2019, South
Africa still lacked a sufficiently clear and widely understood e-Education strategy, though the
NECT had been facilitating meetings and policy development work aimed at achieving this. Quality assurance of data was still not what it should be, meaning certain statistics, such as
those on learner attendance and assessment results, are too often unreliable and difficult to
interpret. New approaches and technologies were not being fully utilised to monitor and
understand learning outcomes.
With regard to EdTech, or the innovative use in the classroom of technology for learning, what
was not covered in the study were important innovations by the DBE to produce more dynamic,
and digital, learning materials. Specifically, building on the successes of the national
workbooks and Siyavula textbooks referred to in Action Plan to 2019, the DBE has worked with partners such as the Sasol Inzalo Foundation to produce an even greater variety of
materials which can be freely copied and distributed. The result is, among others, the graded
readers and Big Books for Foundation Phase learners referred to in section 6.2, and a series of
science and technology textbooks for the Senior Phase. All these resources are available
online105, and many have been converted into e-books to facilitate access through devices such
as tablets. Many of the national workbooks have been converted to interactive digital materials
and are in the process of being piloted. Interactive materials come with the advantage that they make it easier for different learners to proceed at different paces, assess themselves, and repeat
certain tasks, in line with their learning needs. In other words, more individualised learning
becomes possible. However, migration to such materials requires careful planning and testing,
to ensure that materials work as they should and that teachers are properly trained in their use.
Much of the innovation currently occurring involves the production of materials without
traditional copyright restrictions. This can greatly facilitate the move towards e-Education, for
instance by lowering costs.
Beyond South Africa, evidence of what works in the area of e-Education has become clearer. This evidence informs a few key recent global commitments, foremost of which is the 2015
Qingdao Declaration emerging from the International Conference on ICT and post-2015
Education. Among the 22 points of the Qingdao Declaration, the use of technology innovation
to tackle educational inequalities is emphasised: ‘Technology offers unprecedented
opportunities to reduce the long-existing learning divide’. So too is quality-assuring the various
innovations106:
Successful integration of ICT into teaching and learning … calls for promoting a culture of
quality in all its aspects: staff support, student support, curricula design, course design, course
delivery, strategic planning and development.
Action Plan to 2019 described improvements in the availability of computers in schools. While
progress has continued since then, it has been too slow. Moreover, basic information on new
technologies across the schooling system, which are often introduced through partnerships with
donor organisations, remains fragmented and incomplete. What does the most recent information show? The 2015 TIMSS data confirm that around half of Grade 5 and Grade 9
learners access computers or tablets in school. This puts South Africa roughly on a par with
other middle income countries at the primary level, but well below the average for these
countries at the lower secondary level. Moreover, gains in accessing these technologies between
104 New Leaders Foundation, 2018. 105 See for instance www.siyavula.com, www.thunderboltkids.co.za, www.mstworkbooks.co.za,
www.digitalclassroom.co.za and various resources on the DBE’s own website. 106 UNESCO, 2015: 36-37.

56
the 2011 and 2015 waves of TIMSS were strong in most developing countries, but negligible
in South Africa.
The 2017 School Monitoring Survey provided valuable information which is roughly in line
with what emerges from TIMSS. In public schools, 64% of Grade 12 learners are in schools
which have a computer laboratory. This figure remains skewed in favour of the historically advantaged: it is 93% for quintile 5 and 40% for quintile 1. Inter-provincial differences are
also large, for instance 91% in Free State (a particularly successful province in this regard)
against 25% in Limpopo.
The percentage of Grade 12 learners who take one of the two computer subjects, Computer
Applications Technology and Information Technology, has remained a roughly static 6% for
many years – 20% in quintile 5 against 2% in quintile 1. While there are now many technology
and curriculum options to follow beyond the traditional computer subjects, and the traditional
computer lab, the importance of these formats for bringing technology innovation into historically disadvantaged schools should not be under-estimated. They offer proven routes to
skills in areas such as computer programming and can serve as a first step towards
technology innovation for schools which currently have experienced very little of this.
Moreover, there are clearly ‘low hanging fruits’ in the form of historically disadvantaged
secondary schools which currently have a computer laboratory, but which do not formally offer
any computer subject – around a third of quintiles 1 to 3 secondary schools fall into this category
according to the School Monitoring Survey. The intervention required here is mostly support to existing teachers so that they can offer these subjects, or the appointment of a suitably
qualified teacher. Promoting access to new technologies at the secondary level before moving
to the primary level is an approach that has is commonly followed in Asian countries. Moreover,
it is noteworthy that despite the proliferation of mobile devices, Asian countries have continued
to emphasise having at least one computer lab per school107.
The following graph illustrates statistics on computer labs for both the secondary and primary
levels emerging from the School Monitoring Survey.
Figure 13: Access to computer labs in schools 2017
Source: Analysis of School Monitoring Survey microdata.
107 UNESCO, 2016b: 5, 50. See also an account of Slovakia’s phasing of secondary then primary in
UNESCO (2014b: 59), with upper secondary computer subjects serving as a key entry point into
schools.
0
10
20
30
40
50
60
70
80
90
100
EC FS GP KN LP MP NC NW WC SA
% o
f p
ub
lic
sch
oo
l le
arn
ers
wit
h a
t lea
st o
ne
com
pu
ter
lab
in
thei
r s
ch
oo
l
Grade 6 Grade 12

57
As indicated above, one e-Education area which has seen considerable progress is the use of
data for management and planning. The School Monitoring Survey indicates that outside the
Western Cape, usage of SA-SAMS by school principals has been high: at least 97% in six
provinces, with a somewhat lower 94% in KwaZulu-Natal and 86% in Gauteng. Western Cape
has historically used its own provincial system for housing school information. The fact that
58% of principals using SA-SAMS said they used it for financial management indicates that
the management functionality of the tool, as opposed to just its data collection function,
has become a reality. Moreover, 97% of school principal users agreed SA-SAMS was well
designed108.
The DDD initiative, which is described as exemplary in an international OECD study109, has
demonstrated how the efforts by schools in systemically organising their data, through SA-
SAMS, can facilitate better comparisons across schools, and over time, with respect to key
indicators such as Grade 12 results and attendance. This, in turn, can lead to more informed
school management and governance processes, and better management in the districts – DDD
stands for Data Driven Districts. Essentially, DDD involves bringing together the SA-SAMS
data from schools, running some quality controls, and then making statistics on performance
and trends at the school, district, province and national levels available to registered users
online. Statistics are made available through ‘dashboards’ which users can manipulate.
To date, registered users include school principals and officials at the district level and above.
The initiative was started in 2012, by a range of government and non-government partners, and
has expanded substantially since then. By 2014, schools enrolling about half a million learners
were covered. In 2015, the figure had reached two million learners, in four provinces, and by
2020 eleven million learners in the eight provinces other than Western Cape110. Western Cape
had not been incorporated due to its use of an alternative system to SA-SAMS. A key DDD
project introduced recently was the piloting of Grade 12 report cards within the system of
dashboards. There are of course many challenges in ensuring that time and money invested in
DDD truly add to better managed schools and districts. Some of these challenges are discussed
in section 10.13.
The NDP on the importance of broadband in schools:
... the most crucial enabler of ICT [in schools] is high-speed
broadband. (p. 303)
Turning to internet access, in the country as a whole there has been an improvement insofar as the percentage of the population accessing the internet in 2007, at 8%, was slightly below the
middle income country average then, while by 2017 the figure, at 56%, exceeded this global
average slightly111. Yet progress with regard to internet access in schools has been slow.
According to the School Monitoring Survey, in 2017 access by principals, teachers and
learners to the internet in secondary schools was 68%, 59% and 21%. In primary schools,
the figures were in fact slightly better, at 72%, 66% and 36%112. These are figures reported by
the school principal, in the case of learners specifically for grades 6 and 12. The 2016
Community Survey of Stats SA, which collected data from households, pointed to lower
figures: 7% of learners at the primary level – grades 1 to 7 – and 9% at the secondary level –
grades 8 to 12 – were accessing the internet at their school. Whichever figures on uses, they are
108 Department of Basic Education, 2019e: 134-135. 109 OECD, 2019: 27. 110 Omarjee, 2016. 111 World Development Indicators dataset of the World Bank (accessed May 2019), the middle income
country averages being 9% and 45% for the two years. 112 These statistics are all based on learner-weighted schools. For example, at the secondary level 59%
of Grade 12 learners were in schools where teachers accessed the internet.
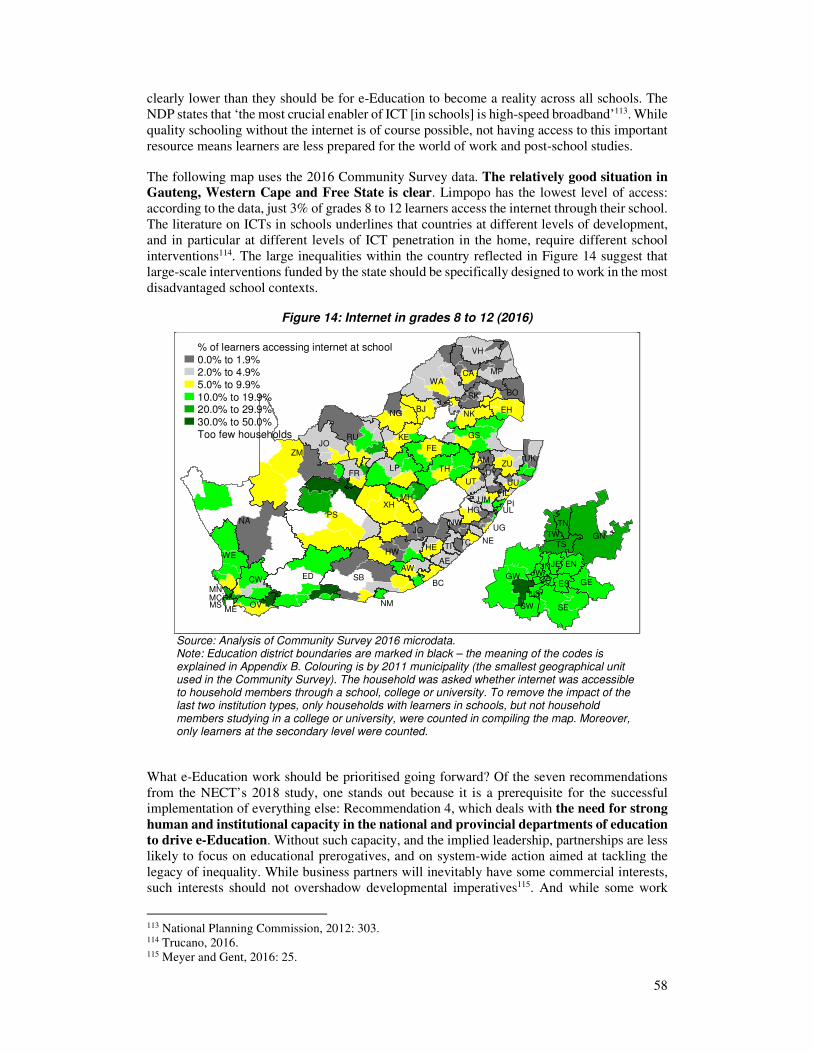
58
clearly lower than they should be for e-Education to become a reality across all schools. The
NDP states that ‘the most crucial enabler of ICT [in schools] is high-speed broadband’113. While
quality schooling without the internet is of course possible, not having access to this important
resource means learners are less prepared for the world of work and post-school studies.
The following map uses the 2016 Community Survey data. The relatively good situation in
Gauteng, Western Cape and Free State is clear. Limpopo has the lowest level of access:
according to the data, just 3% of grades 8 to 12 learners access the internet through their school.
The literature on ICTs in schools underlines that countries at different levels of development,
and in particular at different levels of ICT penetration in the home, require different school
interventions114. The large inequalities within the country reflected in Figure 14 suggest that
large-scale interventions funded by the state should be specifically designed to work in the most
disadvantaged school contexts.
Figure 14: Internet in grades 8 to 12 (2016)
Source: Analysis of Community Survey 2016 microdata. Note: Education district boundaries are marked in black – the meaning of the codes is explained in Appendix B. Colouring is by 2011 municipality (the smallest geographical unit used in the Community Survey). The household was asked whether internet was accessible to household members through a school, college or university. To remove the impact of the last two institution types, only households with learners in schools, but not household members studying in a college or university, were counted in compiling the map. Moreover, only learners at the secondary level were counted.
What e-Education work should be prioritised going forward? Of the seven recommendations
from the NECT’s 2018 study, one stands out because it is a prerequisite for the successful implementation of everything else: Recommendation 4, which deals with the need for strong
human and institutional capacity in the national and provincial departments of education
to drive e-Education. Without such capacity, and the implied leadership, partnerships are less
likely to focus on educational prerogatives, and on system-wide action aimed at tackling the
legacy of inequality. While business partners will inevitably have some commercial interests,
such interests should not overshadow developmental imperatives115. And while some work
113 National Planning Commission, 2012: 303. 114 Trucano, 2016. 115 Meyer and Gent, 2016: 25.
AE
AM
AW
BC
BJ
BO
CA
CW ED
EH
EN
ES
FE
FR
GE
GN
GS
GW
HE
HG
HW
IL
JC
JE
JG
JN
JO
JS
JW
KE
LP
MC
ME
MH
MN
MP
MS
NA
NE
NG NK
NM
NW
OV
PI
PS
RU
SB
SE
SK
SW
TC
TH
TI
TN
TS
TWUG
UK
UL
UM
UT UU
UY
VH
WA
WE
XH
ZM
ZU
% of learners accessing internet at school
0.0% to 1.9%2.0% to 4.9%5.0% to 9.9%
10.0% to 19.9%20.0% to 29.9%
30.0% to 50.0%Too few households
59
must focus on limited groups of schools, for instance when new approaches are piloted,
technological change should ultimately encompass all schools, in particular historically
disadvantaged schools. A narrow focus on simply ‘showcasing’ technology change in a few
such schools must be avoided.
Recommendation 4 underlines the importance of having a skilled team to lead e-Education innovation. This team needs a clear mandate, and a good relationship with the top political and
technical leaders in the basic education sector. The World Bank refers to such a team as a
‘national educational technology agency’ and has published case studies covering a few
relatively successful countries116. South Africa is still several steps from having a well-
established and properly resourced national agency, though structures such Operation Phakisa
serve as an important step in the right direction.
Turning to the roll-out of specific technologies, President Ramaphosa made the following
important commitment in his 2019 State of the Nation Address:
Over the next six years, we will provide every school child in South Africa with digital
workbooks and textbooks on a tablet device. We will start with those schools that have been
historically most disadvantaged and are located in the poorest communities, including
multigrade, multiphase, farm and rural schools.
This represents a major commitment, in budgetary and service delivery terms, on the part of
government. For this initiative to be a success, and expectations to be met, careful planning is
needed. Important lessons can be learnt from countries such as Kenya, which have embarked
on similar tablet initiatives. One lesson is that it is important to compare the costs and benefits
of different approaches through evaluations in smaller groups of schools117. Should
teachers be given devices first, for instance? What are the optimal ages at which children are
able to benefit from these technologies? Crucially, what type of educational software works best in the South African context? The evidence is clear that well-focussed interventions using
tablets can bring significant benefits118. However, a poorly-focussed one is likely to make little
or no difference to the education process.
In summary, the increasing importance of ICTs in society, and the fact that their costs are
continuously dropping, plus the opportunities these technologies create for better learning
processes, make e-Education a high-priority area of innovation. Yet of the three innovation
areas prioritised in this plan, it is clearly the most complex. Technologies are continually
changing, many different stakeholders are involved, the cost-benefit dynamics are highly
complex, and yet the state must put forward a relatively simple and clear position that convinces
the various stakeholders. South Africa already has a wealth of experience in specific ICT
interventions, and several high-level policies and reviews, on which to build the necessary
plans, budgeting and action through which e-Education can be used to advance educational
quality and reduce inequalities.
116 Trucano and Dykes, 2017. 117 Piper et al, 2016; Piper et al, 2015. 118 McEwan (2015), in an important review of evaluated education interventions, finds ICT-focussed
interventions, if well designed, to have particularly large impacts.

60
8 The correspondence between MTSF and Action Plan elements
The Action Plan structure of 27 goals, linked to 36 indicators of national and provincial
progress, was introduced with the release of Action Plan to 2014, in 2012. Subsequently, in
2014, Presidency, and specifically the Department of Planning, Monitoring and Evaluation
(DPME), introduced the Medium Term Strategic Framework (MTSF) for the period 2014 to 2019. The basic education part of the MTSF, while strategically very much in line with Action
Plan to 2014, and Action Plan to 2019, followed a more compact structure, with six ‘sub-
outcomes’, linked to 55 indicators, of which 13 were ‘impact indicators’. The MTSF for 2019
to 2024 introduces an even more compact structure119. The correspondence between this and
the Action Plan elements is described in this section.
This 2019 to 2024 MTSF has the following four basic education outcomes:
• Improved school-readiness of children
• 10-year-old learners enrolled in publicly funded schools read for meaning
• School physical infrastructure and environment that inspires learners to learn and teachers
to teach
• Youths better prepared for further studies, and the world of work beyond Grade 9
The table on the next page indicates with a large bullet where an Action Plan goal has a very
clear correspondence with one of the four MTSF outcomes. Small bullets point to other linkages
and serve as a reminder of how inter-connected the parts of the system are. For instance, the
infrastructure outcome is not just about the infrastructure itself, it is about facilitating learning,
considering the needs of special needs learners, and ensuring that is space to serve feed and
maintain hygiene. Blue text represents the thirteen outcome goals of the Action Plan.
119 Department of Planning, Monitoring and Evaluation, 2020.

61
TWENTY-SEVEN ACTION PLAN GOALS AND FOUR MTSF BASIC EDUCATION OUTCOMES School-
read-
iness
Read
for
meaning
School
infra-
structure
Further
studies,
world of
work
1 to 3. Increase the number of learners in Grade 3 | 6 | 9 who, by the end of the year, have mastered the minimum language and
numeracy competencies for Grade 3. i i i
4. Increase the number of Grade 12 learners who become eligible for a Bachelors programme at a university. i i
5 and 6. Increase the number of Grade 12 learners who pass mathematics | physical science. i i
7 and 8. Improve the average performance of Grade 6 learners in languages | mathematics. i i i
9. Improve the average performance of Grade 9 learners in mathematics. i i
10. Ensure that all children remain effectively enrolled in school at least up to the year in which they turn 15. i i i i
11. Improve the access of children to quality Early Childhood Development (ECD) below Grade 1. i i
12. Improve the grade promotion of learners through Grades 1 to 9. i i i
13. Improve the access of the youth to Further Education and Training (FET) beyond Grade 9. i i
14. Attract a new group of young, motivated and appropriately trained teachers to the teaching profession every year. i i i i
15. Ensure that the availability and utilisation of teachers are such that excessively large classes are avoided. i i i i
16. Improve the professionalism, teaching skills, subject knowledge and computer literacy of teachers throughout their entire careers. i i i
17. Strive for a teacher workforce that is healthy and enjoys a sense of job satisfaction. i i i i
18. Ensure that learners cover all the topics and skills areas that they should cover within their current school year. i i i i
19. Ensure that every learner has access to the minimum set of textbooks and workbooks required according to national policy. i i i i
20. Increase access amongst learners to a wide range of media, including computers, which enrich their education. i i i i
21. Ensure that the basic annual management processes take place across all schools in the country in a way that contributes towards a
functional school environment. i i i i
22. Improve parent and community participation in the governance of schools, partly by improving access to important information via
the e-Education strategy. i i i i
23. Ensure that all schools are funded at least at the minimum per learner levels determined nationally and that funds are utilised
transparently and effectively. i i i i
24. Ensure that the physical infrastructure and environment of every school inspire learners to want to come to school and learn, and
teachers to teach. i i i
25. Use schools as vehicles for promoting access to a range of public services amongst learners in areas such as health, poverty
alleviation, psychosocial support, sport and culture. i i i i
26. Increase the number of schools that effectively implement the inclusive education policy and have access to centres that offer
specialist services. i i i i
27. Improve the frequency and quality of the monitoring and support services provided to schools by district offices, partly through
better use of e-Education. i i i i

62
The following list indicates what Action Plan indicators the thirteen MTSF indicators are
related to. For each of the Action Plan indicators, the 2030 target is given in square brackets.
These targets have not changed since Action Plan to 2019.
THIRTY-SIX ACTION PLAN AND 13 MTSF INDICATORS
1.1 and 1.2. Percentage of Grade 3 learners performing at the required literacy | numeracy level
according to the country’s Annual National Assessments. [95%]
> Proportion of Grade 3 learners reaching the required competency levels in reading and numeracy
skills as assessed through the new Systemic Evaluation by 2024
> Average score obtained by Grade 4 learners in PIRLS by 2021
2.1 to 3.2. Percentage of Grade 6 | 9 learners performing at the required language | mathematics level
according to the country’s Annual National Assessments. [95%]
> Learning outcomes in Grades 6 and 9 in critical subjects reflected through the new Systemic
Evaluation by 2024
4. Number of Grade 12 learners who become eligible for a Bachelors programme in the public national
examinations. [436 000]
> The number of youths obtaining Bachelor-level passes in NSC by 2024
5. Number of Grade 12 learners passing mathematics. [380 000]
> The number of youths obtaining 60% and above in mathematics and physical science by 2024
6. Number of Grade 12 learners passing physical science. [350 000]
7. Average score obtained in Grade 6 in language | mathematics in the SACMEQ assessment. [640]
> Learning outcomes in Grade 6 Maths and Reading according to the international SACMEQ by
2020
> Average score obtained by Grade 5 learners in TIMSS by 2023
9. Average Grade 9 mathematics score obtained in TIMSS. [472]
> Learning outcomes in Grade 9 in Maths and Science in TIMSS programmes by 2023
10. Percentage of 7 to 15 year olds attending education institutions. [100%]
11. The percentage of Grade 1 learners who received Grade R. [100%]
> Proportion of 6-year-olds (Grade R) enrolled in educational institutions by 2024
> Proportion of 5 year olds (Grade RR) enrolled in educational institutions by 2024
> Proportion of Grade R learners that are school ready by 2024
12.1. The percentage of children who turned 9 in the previous year and who are currently enrolled in
Grade 4 (or a higher grade). [90%]
12.2. The percentage of children who turned 12 in the previous year and who are currently enrolled in
Grade 7 (or a higher grade). [80%]
13.1. The percentage of youths who obtained a National Senior Certificate from a school. [75%]
13.2. The percentage of youths who obtained any FET qualification. (This is an indicator of concern to
DBE and DHET.) [100%]
14. The number of qualified teachers, aged 30 and below, entering the public service as teachers for the
first time during the past year. [14 000]
15.1. The percentage of learners who are in classes with no more than 45 learners. [100%]
15.2 The percentage of schools where allocated teaching posts are all filled. [100%]
16.1. The average hours per year spent by teachers on professional development activities. [80]
16.2. The percentage of teachers who are able to attain minimum standards in anonymous and sample-
based assessments of their subject knowledge. [Target still to be set.]
17. The percentage of teachers absent from school on an average day. [4%]
18. The percentage of learners who cover everything in the curriculum for their current year on the
basis of sample-based evaluations of records kept by teachers and evidence of practical exercises done
by learners. [100%]
19. The percentage of learners having access to the required textbooks and workbooks for the entire
school year. [100%]
20. The percentage of learners in schools with a library or multimedia centre fulfilling certain minimum
standards. [100%]
> Schools with access to functional internet connectivity for teaching and learning, connected
through different options working with the DCDT
21. The percentage of schools producing the minimum set of management documents at a required
standard, for instance a school budget, a school improvement plan, an annual report, attendance
registers and a record of learner marks. [100%]

63
22. The percentage of schools where the school governing body meets the minimum criteria in terms of
effectiveness. [100%]
23.1. The percentage of learners in schools that are funded at the minimum level. [100%]
23.2. The percentage of schools that have acquired the full set of financial management responsibilities
on the basis of an assessment of their financial management capacity. [100%]
24. The percentage of schools complying with a very basic level of school infrastructure. [100%]
> Increase the number of schools which reach minimum physical infrastructure norms and
standards.
25. The percentage of children who enjoy a publicly funded school lunch every school day. [75%]
26. The percentage of learners in schools with at least one educator who received specialised training in
the identification and support of special needs. [100%]
27.1. The percentage of schools visited at least twice a year by district officials for monitoring and
support purposes. [100%]
27.2. The percentage of school principals rating the support services of districts as being satisfactory.
[90%]
Important challenges in relation to the Action Plan (and MTSF) indicators must be noted.
When the 36 Action Plan indicators appeared in Action Plan to 2014, released in 2012, it was
made clear that measuring progress in terms of these indicators would be a challenge,
technically and otherwise. It was also emphasised that the calculation of indicator values should
occur nationally, but through a process involving consultation with provinces. Some indicators
required data which had never been collected before. Specifically, four indicators in Action
Plan to 2014 had no baseline values. For example, there was no data, or even a clear
methodology, on measuring the degree to which learners complete the curriculum in a year. Yet
all the 36 indicators were considered important enough to warrant an investment in the required
data. Importantly, the great majority of indicators did come with baseline values in Action Plan
to 2014, even if there were uncertainties, for instance when different data sources pointed to
slightly different values. One purpose of having indicators is to stimulate more focussed use of
existing data sources, and this was clearly achieved.
A major result of the preparations for Action Plan to 2014 was the 2011 School Monitoring
Survey (SMS), a survey covering around 2 000 randomly selected schools and intended to plug
information gaps where existing data sources were not sufficient for the calculation of certain
indicators. When Action Plan to 2019 was released, in 2015, all 36 indicators carried baseline
values, as well as targets. This was possible in part thanks to the 2011 SMS. Action Plan to
2019 envisaged a re-running of the SMS on a periodic basis, starting again in 2015.
Unfortunately, in part due to budget pressures, this was delayed for two years. As already
indicated in previous sections, the SMS was run again in 2017 and DBE plans to repeat this
survey with sufficient regularity.
All plans should be followed by reports on progress against the plan. Without such reports,
plans lose their impact. Action Plan to 2014 highlighted the need for a ‘national sector review’
produced every year, which would among other things report on progress in terms of the Action
Plan indicators. It was not possible to produce regular and fully-fledged sector reviews due to
capacity constraints. Ideally this should happen in future, and efforts to build the required
capacity must continue. Yet a number of reports on progress, focussing on the 36 indicators,
were produced120.
Problems with the Annual National Assessments, discussed in section 7.2, are clearly a key
reason why reporting on progress has been has not been as strong as it could have been. Moving
forward, integrating the envisaged Systemic Evaluation with aspects of the School
Monitoring Survey would help to streamline the monitoring work and reduce costs.
120 See in particular Department of Basic Education (2013a, 2014c, 2016b, 2019b).
64
A critical challenge with respect to the monitoring of progress lies in the external quality
assurance of the DBE’s statistics. One option here would be auditing by the Office of the
Auditor-General (OAG). For many years, the OAG has audited not just financial statistics,
but also the non-financial performance statistics of the ten education departments. By far most
of the 36 Action Plan indicators have not been subject to OAG auditing yet, as they have not
been formally linked to budget programmes within the DBE and provincial department Annual
Performance Plans (APPs). However, it has been proposed that this link should be made to
improve accountability in the basic education sector around the accuracy of the statistics. While
in theory this is a good idea, and accountability to an external body is necessary, the proposal
carries its own risks. OAG capacity for the auditing of statistics outside the financial sphere is
still limited. In particular, complexities relating to comparable samples, psychometrics and inevitable margins of error are considerable and it may not be possible to build this capacity in
the OAG for some time. It is probably best for budget programmes to be linked to non-financial
indicators which, while not reflecting the ultimate outcomes of the education process, are less
complex yet important: number of schools built, learner-educator ratios, and so on. Currently,
budget programmes are linked to such relatively non-complex indicators.
One under-explored option for strengthening the checks and balances around indicator values
is the declaration of at least some of the 36 Action Plan indicators as ‘official statistics’, in
terms of the 1999 Statistics Act. This would require Statistics South Africa to quality assure
statistics produced by the Department of Basic Education, and advise on future improvements.
The approach in the current plan is to provide values, and recent trends, for as many of
the 36 Action Plan indicators as possible, under each of the 27 goals. Moreover, plans to
improve monitoring with respect to these indicators is explained. The challenges associated
with moving towards the 2030 targets indicated above are also discussed. Though it has been
suggested that the indicators be changed, this option has not been adopted for this plan. The
position of the DBE is that effort is best spent optimising reporting using the existing set of
indicators. While reporting against some indicators will continue to be difficult for some time, even approximations of indicator values can be useful for planning and monitoring. This does
not mean that the DBE is not committed to reliable comparisons over time, and accurate trend
data. As is shown in the current plan, with a rigorous analysis of the various sources of data,
and for many indicators various sources must be used, a sufficiently accurate picture of recent
progress can be obtained.

65
9 Output goals that look at learning outcomes and coverage (Goals 1 to 13)
Goals 1 to 13 deal with specific outcomes of the schooling system, both outcomes relating to
enrolment and attainment, and outcomes relating to what learners learn. Amongst the latter, one
can distinguish between average performance, or average marks, and the proportion of learners
surpassing critical thresholds.
Goals and indicators marked with are of an especially high priority.
9.1 Goals 1 to 3: Meeting minimum standards in grades 3, 6 and 9
Goal 1 Increase the number of learners in Grade 3 who, by the end of the year, have
mastered the minimum language and numeracy competencies for Grade 3.
Goal 2 Increase the number of learners in Grade 6 who, by the end of the year, have
mastered the minimum language and mathematics competencies for Grade 6.
Goal 3 Increase the number of learners in Grade 9 who, by the end of the year, have
mastered the minimum language and mathematics competencies for Grade 9.
Improving basic language and mathematics competencies in line with these three goals lies at
the heart of educational improvement. Basic competencies are a prerequisite for good
performance across all subjects in the curriculum. They are a prerequisite for keeping
learners’ hopes high, and avoiding dropping out. Academic success moreover helps to bring
about stability, a sense of purpose, and respect for others, within each school. Success breeds
more success. As pointed out in the National Development Plan (NDP), South Africa’s large
socio-economic inequalities are rooted in educational inequalities which largely come about
through unequal schooling. Narrowing the performance gap across schools is a key challenge.
The theory of change put forward in section 5 explains how many different factors contribute
towards better quality learning and teaching in the classroom. However, progress to date
suggests that particularly important factors are the following: good curriculum guides; access
to books; effective assessment practices; teacher competencies, including subject knowledge;
and effective pre-schooling prior to entering primary school (see section 6.2).
While evidence of what works must be used extensively, effective school and classroom
practices are in part an art, in part a science. Progress requires teachers and managers to make
use of proven methods, but also to innovate and adapt. A culture of professionalism and reading
is important. There are now many useful analyses and guides that those working in the sector
should use. The documentation emerging from the Early Grade Reading Study (EGRS) was
discussed in section 7.1. The National Education Collaboration Trust (NECT) has in recent
years built up a stock of materials, available online, to assist teachers across key subjects,
including mathematics. The DBE’s National Education Evaluation and Development Unit
(NEEDU) has published several excellent reports over the years, with a recent one focussing
on what makes certain secondary schools stand out as particularly successful121.
Indicator 1.1. Percentage of Grade 3 learners performing at the required literacy
level according to the country’s Annual National Assessments.
Indicator 1.2. Percentage of Grade 3 learners performing at the required numeracy level
according to the country’s Annual National Assessments.
Indicator 2.1. Percentage of Grade 6 learners performing at the required language
level according to the country’s Annual National Assessments.
121 Department of Basic Education, 2018d.

66
Indicator 2.2. Percentage of Grade 6 learners performing at the required mathematics level
according to the country’s Annual National Assessments.
Indicator 3.1. Percentage of Grade 9 learners performing at the required language
level according to the country’s Annual National Assessments.
Indicator 3.2. Percentage of Grade 9 learners performing at the required mathematics level
according to the country’s Annual National Assessments.
The primary data source for the above six indicators will be the new sample-based Systemic
Evaluation programme, described previously in section 7.2. This programme will begin
producing the required information in 2020, and will gauge trends through secure anchor items.
How the ‘required’ literacy and numeracy levels are determined is critical. Pass thresholds such
as a score of 50% in an assessment is commonly used in the schooling system. Such thresholds
are easy to use, and do serve some purposes. However, this approach is not adequate for the
above six indicators. The item response theory (IRT) scoring approach to be used in the
Systemic Evaluation produces not percentage correct statistics, but ‘IRT scores’ such as those
seen in PIRLS, SACMEQ and TIMSS (though it is possible to calculate the underlying classical
scores). This IRT approach is necessary to ensure that scores, meaning the IRT scores, are
comparable over time.
Minimum proficiency levels have received much attention since the adoption of the
Sustainable Development Goals (SDGs), which require monitoring the percentage of learners
who become ‘proficient’. There have been attempts by UNESCO to standardise the meaning of
‘proficient’ at different school levels and for different subjects122. At the same time, the relevant
United Nations guides make it clear that ultimately countries should use thresholds that are
locally useful, though of course thresholds need to be consistent over time if progress is to be
measured123. Much caution should be taken when interpreting certain South Africa statistics
appearing in the international reports, including those of UNESCO124.
The international assessment programmes South Africa participates in, though not the primary data sources for the above indicators, provide a vital check of what to expect. In 2015, South
Africa entered learners in Grade 5 for the first time in TIMSS, having done so only for
grades 8 and 9 learners in earlier years. The ‘low international benchmark’ determined by
TIMSS has been put forward as an optimal threshold for reporting against the SDGs125. Using
this benchmark, 39% of Grade 5 learners in South Africa could be considered proficient.
However, the benchmark has been designed for Grade 4, not Grade 5. This would largely
explain why this proficiency figure, of 39% in mathematics, is so much higher than the corresponding figure for PIRLS reading discussed below126. Figure 15 below illustrates the
distribution of the official ‘IRT scores’ in Grade 5 mathematics, for South Africa. The low
international benchmark is set at 400 TIMSS points.
122 UNESCO Institute for Statistics, 2017. 123 United Nations, 2017b. 124 To illustrate, UNESCO Institute for Statistics (2019: 13) points to the percentage of learners who are
proficient in mathematics in Grade 3 moving from 68% in 2012, to 87% in 2014, to 39% in 2015.
Clearly, these figures do not represent a believable trend. 125 UNESCO Institute for Statistics, 2017: 42, 55. 126 Mullis et al, 2016: Exhibit 2.2; Isdale et al, 2017: 22.

67
Figure 15: TIMSS Grade 5 mathematics IRT distribution 2015
Source: Analysis of TIMSS microdata available at https://timssandpirls.bc.edu. One of five plausible values used (the selection makes no visible difference to the graph).
As in the case of PIRLS (discussed below), in TIMSS around half of questions are multiple
choice questions, and half constructed response questions requiring learners to write a response.
The following is a constructed response question actually asked in TIMSS 2015 – if questions
are not used for linking in future years, they can be made public. TIMSS assumes that a learner
reaching the low international benchmark should be in a position to answer this question
correctly. In South Africa, 41% of Grade 5 learners got this question right, against 57% in
Indonesia and 63% in Morocco (the grade being Grade 4 for these countries)127.
Interestingly, the following question, which is considered indicative of having reached the
intermediate international benchmark by TIMSS, produced better results for South Africa than
the above question. This is despite the fact that the intermediate benchmark is higher than the
low benchmark. Here 60% of South Africa’s Grade 5 learners were able to provide a correct
response, against 51% in Indonesia and 23% in Morocco128. This serves as a reminder that,
firstly, what is considered difficult in TIMSS is based largely on what learners across the world
can and cannot actually do, and that improving learning outcomes in South Africa requires
looking very carefully at exactly what topics learners do poorly in.
127 Mullis et al, 2016: Exhibit 2.4.2. 128 Mullis et al, 2016: Exhibit 2.5.2.
0.0
0.5
1.0
1.5
2.0
2.5
3.0
3.5
4.0
4.5
100 200 300 400 500 600 700
% o
f le
arn
ers
wit
h t
his
IRT
sco
re
(ro
un
de
d t
o t
he
clo
ses
t m
ult
iple
of
10
)
IRT score
39%Average IRT
score: 376
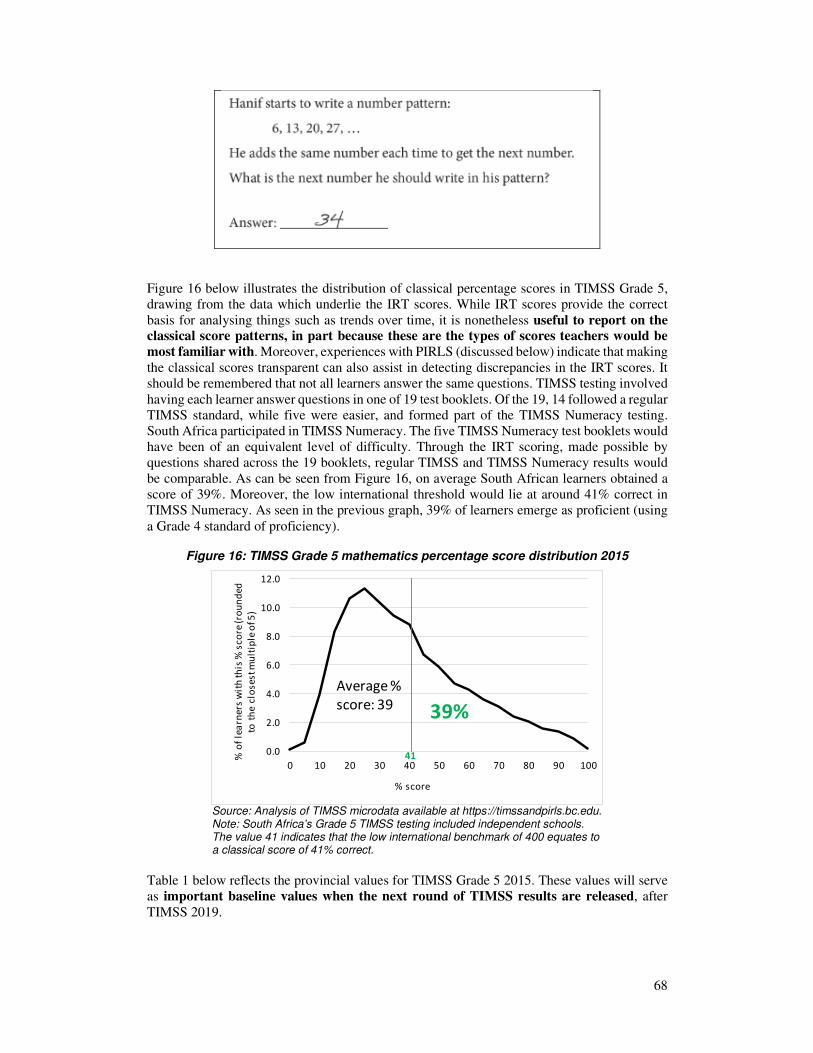
68
Figure 16 below illustrates the distribution of classical percentage scores in TIMSS Grade 5,
drawing from the data which underlie the IRT scores. While IRT scores provide the correct
basis for analysing things such as trends over time, it is nonetheless useful to report on the
classical score patterns, in part because these are the types of scores teachers would be
most familiar with. Moreover, experiences with PIRLS (discussed below) indicate that making
the classical scores transparent can also assist in detecting discrepancies in the IRT scores. It
should be remembered that not all learners answer the same questions. TIMSS testing involved
having each learner answer questions in one of 19 test booklets. Of the 19, 14 followed a regular
TIMSS standard, while five were easier, and formed part of the TIMSS Numeracy testing.
South Africa participated in TIMSS Numeracy. The five TIMSS Numeracy test booklets would
have been of an equivalent level of difficulty. Through the IRT scoring, made possible by
questions shared across the 19 booklets, regular TIMSS and TIMSS Numeracy results would
be comparable. As can be seen from Figure 16, on average South African learners obtained a
score of 39%. Moreover, the low international threshold would lie at around 41% correct in
TIMSS Numeracy. As seen in the previous graph, 39% of learners emerge as proficient (using
a Grade 4 standard of proficiency).
Figure 16: TIMSS Grade 5 mathematics percentage score distribution 2015
Source: Analysis of TIMSS microdata available at https://timssandpirls.bc.edu. Note: South Africa’s Grade 5 TIMSS testing included independent schools. The value 41 indicates that the low international benchmark of 400 equates to a classical score of 41% correct.
Table 1 below reflects the provincial values for TIMSS Grade 5 2015. These values will serve
as important baseline values when the next round of TIMSS results are released, after
TIMSS 2019.
0.0
2.0
4.0
6.0
8.0
10.0
12.0
0 10 20 30 40 50 60 70 80 90 100
% o
f le
arn
ers
wit
h th
is %
sc
ore
(ro
un
ded
to t
he
clo
sest
mu
ltip
le o
f 5)
% score
39%
41
Average %
score: 39

69
Table 1: Provincial TIMSS Grade 5 mathematics means
Sample size (learners) IRT mean
Classical mean
EC 1,194 343 33 FS 1,131 373 38 GP 1,625 420 48 KN 1,173 367 37 LP 1,307 344 32 MP 1,179 384 40 NC 1,026 373 39 NW 1,221 355 35 WC 1,076 441 51 SA 10,932 376 39
Source: IRT values are from Isdale et al (2017: 23). Classical scores are calculated from the microdata available at https://timssandpirls.bc.edu. The total number of sampled schools was 297.
Figure 17 below presents a similar analysis of South Africa’s Progress in International Reading
Literacy Study (PIRLS) results. It should be noted that South Africa’s 2011 results for PIRLS
have been revised, following a re-analysis of the raw data after the official reports were
released in 2017. Official PIRLS 2016 reports indicated that between 2011 and 2016 there was
no statistically significant change, the IRT average scores for the two years being 323 and
320129. Moreover, they pointed to the percentage of learners reaching the PIRLS low
international benchmark declining from 24% in 2011 to 22% in 2016130. The IEA131, the
international body running PIRLS, has confirmed that this trend is not correct, and has revised
the international reports. Details are provided in Appendix C. Specifically, while 2016 results
seem reliable, in the case of 2011, the conversion of the IRT score from the original prePIRLS
scale to the PIRLS scale was incorrect. However, there seems no reason to doubt the raw data and the classical scores for 2011, meaning it is possible to calculate a more reliable trend across
the two points in time.
As shown in Figure 17, South Africa’s classical scores in PIRLS improved, from 35% correct
in 2011 to 42% correct in 2016. These scores use only results from the four reading passages
common across both 2011 and 2016. The trend amounts to an improvement of around 0.05
standard deviations per year. Such an improvement would generally be considered good, and
would make South Africa one of the fastest PIRLS improvers for the period 2011 to 2016.
The PIRLS low international benchmark, when converted to a classical score, lies at around
62% correct (considering just the four reading passages in question). Using classical scores, the
percentage of learners reaching this benchmark improved from 18% in 2011 to 22% in 2016.
Clearly, the 2016 level is still very low. It was the lowest figure seen among all 2016 PIRLS
participants, which were mainly developed countries, though several other developing
countries, such as Morocco, Egypt and Iran, also took part.
129 Mullis et al, 2017: 29. 130 Mullis et al, 2017: 58. 131 International Association for the Evaluation of Educational Achievement.

70
Figure 17: PIRLS Grade 4 mathematics percentage score distribution 2011 and 2016
Source: Analysis of PIRLS microdata available at https://timssandpirls.bc.edu. Note: Scores reflected here are any scores based on four passages common across the two years: Ants; Baghita’s Perfect Orange; Summer My Father Was Ten; Training a Deaf Polar Bear. If just one of the four passages is analysed, a similar trend emerges.
It is important to recognise what the PIRLS low international benchmark means. What is it
that 78% of Grade 4 learners could not do in 2016? The following is the description
appearing in the international PIRLS report of what a child reaching the low international
benchmark should be able to do132.
Importantly, in PIRLS 2016 in South Africa, learners responded to tests in the language of
learning and teaching (LOLT). This meant that the largest languages in the sample were
English (around 18% of learners), isiZulu (14%), Afrikaans (12%) and isiXhosa (10%)133. Each
South African learner answered questions in relation to two reading passages, with each reading
passage carrying around 16 questions, meaning each learner answered around 30 questions.
Around half of all questions were multiple choice questions, the others ‘constructed response’
questions requiring the learner to write a response. The booklet containing two reading passages given to each learner could differ, in terms of which reading passages were included, across
learners. In PIRLS Literacy, the version of PIRLS applied in South Africa, there were 16
booklets altogether, each containing two of 12 reading passages134.
132 Mullis et al, 2017: 60. 133 Howie et al, 2017: 34. 134 Martin et al, 2017: 6.8.
0
2
4
6
8
10
12
14
16
18
0 10 20 30 40 50 60 70 80 90 100% o
f le
arn
ers
wit
h th
is %
sc
ore
(ro
un
de
d t
o
the
clo
ses
t m
ult
iple
of 1
0)
% score
2011 2016
Average % score
2011: 35%
2016: 42%
62
2011: 18%
2016: 22%

71
As one might expect, learners tend to perform better in the multiple choice questions than in
the constructed response questions – multiple choice questions give learners the opportunity to
guess, and given that these questions in PIRLS contain four options, pure guessing would on
average produce a correct response at least 25% of the time. Below, one of the PIRLS questions,
released through the international report135, which learners reaching the low international
benchmark are expected to get right, appears. The question relates to a reading passage (not
published in the international report). In this constructed response question, the learner can
obtain one or two marks. In South Africa, 43% of learners obtained at least one mark –
figures for the same question were 57% in Morocco, 66% in Egypt and 73% in Denmark (but
this Denmark figure refers to Grade 3, not Grade 4).
The reason why only 22% of South African learners reached the low international benchmark
is related to how many questions of various levels of difficulty learners got correct. In fact,
relatively few learners were unable to answer any of the constructed response questions: 7% of
the 12,810 tested learners scored zero for the constructed response questions. However, as
many as 18% of learners obtained a score of just 1 or 2 in the constructed response
questions, when the total score obtainable through these questions was around 17.
Figure 18 provides a critical check that trends seen in Figure 17 above were not the result of
shifts in the sample, for instance in the form of more middle class learners in 2016. In Figure
18, the results of learners of a similar socio-economic status (SES) are compared. It is clear that
the largest improvements in the classical scores were seen among learners with a lower
socio-economic status. This bodes well for reducing educational inequalities.
135 Mullis et al, 2017: 64.
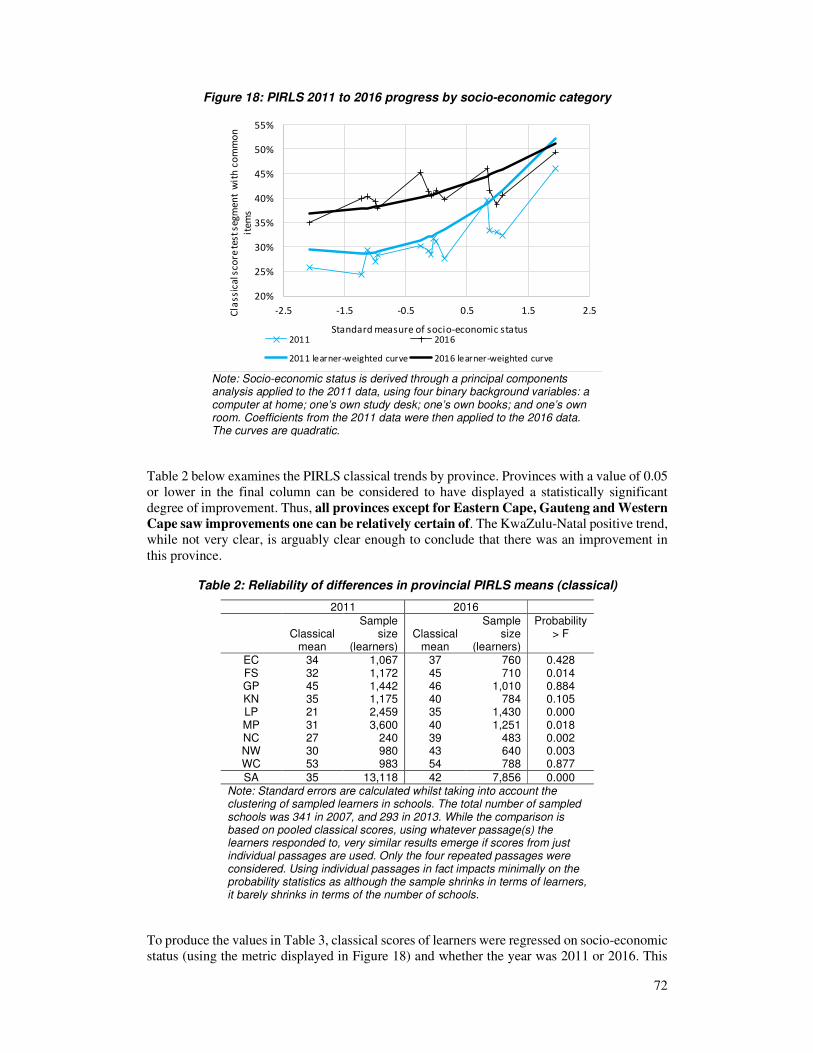
72
Figure 18: PIRLS 2011 to 2016 progress by socio-economic category
Note: Socio-economic status is derived through a principal components analysis applied to the 2011 data, using four binary background variables: a computer at home; one’s own study desk; one’s own books; and one’s own room. Coefficients from the 2011 data were then applied to the 2016 data. The curves are quadratic.
Table 2 below examines the PIRLS classical trends by province. Provinces with a value of 0.05
or lower in the final column can be considered to have displayed a statistically significant
degree of improvement. Thus, all provinces except for Eastern Cape, Gauteng and Western
Cape saw improvements one can be relatively certain of. The KwaZulu-Natal positive trend,
while not very clear, is arguably clear enough to conclude that there was an improvement in
this province.
Table 2: Reliability of differences in provincial PIRLS means (classical)
2011 2016
Classical
mean
Sample size
(learners) Classical
mean
Sample size
(learners)
Probability > F
EC 34 1,067 37 760 0.428 FS 32 1,172 45 710 0.014 GP 45 1,442 46 1,010 0.884 KN 35 1,175 40 784 0.105 LP 21 2,459 35 1,430 0.000 MP 31 3,600 40 1,251 0.018 NC 27 240 39 483 0.002 NW 30 980 43 640 0.003 WC 53 983 54 788 0.877
SA 35 13,118 42 7,856 0.000 Note: Standard errors are calculated whilst taking into account the clustering of sampled learners in schools. The total number of sampled schools was 341 in 2007, and 293 in 2013. While the comparison is based on pooled classical scores, using whatever passage(s) the learners responded to, very similar results emerge if scores from just individual passages are used. Only the four repeated passages were considered. Using individual passages in fact impacts minimally on the probability statistics as although the sample shrinks in terms of learners, it barely shrinks in terms of the number of schools.
To produce the values in Table 3, classical scores of learners were regressed on socio-economic
status (using the metric displayed in Figure 18) and whether the year was 2011 or 2016. This
20%
25%
30%
35%
40%
45%
50%
55%
-2.5 -1.5 -0.5 0.5 1.5 2.5Cla
ss
ica
l sc
ore
tes
t s
eg
me
nt
wit
h c
om
mo
n
ite
ms
Standard measure of socio-economic status2011 2016
2011 learner-weighted curve 2016 learner-weighted curve

73
type of analysis ‘controls’ for SES, and thus in effect examines whether learners of the same
SES improved over time. Again, the results point to improvements, to a high degree of
certainty, in five of the nine provinces.
Table 3: Provincial PIRLS trends with SES controls
Percentage point gain
(coeff. on ‘Is 2016’) p value
EC 3.8 0.311 FS 13.1*** 0.005 GP 1.7 0.706 KN 5.0 0.152 LP 14.1*** 0.000 MP 7.3** 0.027 NC 11.7*** 0.001 NW 12.3*** 0.002 WC 0.6 0.875
SA 5.8*** 0.000
*** indicates that the estimate is significant at the 1% level of significance, ** at the 5% level.
Gender differences in PIRLS in South Africa are noteworthy. While almost all PIRLS countries
display better performance for girls than boys, in South Africa, this gap in favour of females
is the second-highest among the 50 countries. Girls achieved an average of 347 PIRLS points
in 2016, against 295 for boys136. This means girls were ahead of boys by around half a standard
deviation, a gap one might expect between learners from one grade and the next. This gap may
have widened: PIRLS 2011 data point to a smaller gap of 0.30 of a standard deviation in favour
of girls. While the TIMSS Grade 5 data also point to an advantage for girls, it is a smaller, at
around 0.16 of a standard deviation. Yet it is one of the largest gaps among tested TIMSS
countries.
9.2 Goals 4 to 6: Meeting minimum standards in Grade 12
Goal 4 Increase the number of Grade 12 learners who become eligible for a Bachelors
programme at a university.
Goal 5 Increase the number of Grade 12 learners who pass mathematics.
Goal 6 Increase the number of Grade 12 learners who pass physical science.
There are many standards associated with the National Senior Certificate. For example, a
candidate may achieve a Bachelors-level pass, allowing for Bachelors studies at a university,
or a Diploma-level pass, allowing for Diploma studies at a university. The emphasis has
increasingly fallen on levels of performance in Grade 12 which will allow someone to pursue
university studies, given government’s plans to expand university participation to meet the
demands of the economy. Marks achieved in mathematics and physical science, subjects
which represent scarce skills, are commonly used for university entrance requirements, typical
thresholds being percentage scores of 50, 60 or 70. As discussed in section 6.2, there have been
improvements in the number of candidates reaching a score of 50. The same can be said for
students achieving 60 and 70.
Sustainable improvements in Grade 12 outcomes must of course be driven by improvements
across all grades of the schooling system. However, the availability of a wealth of information
on Grade 12 performance makes it possible to use information at this level in innovative ways
to incentivise schools, and to take corrective action where schools are clearly under-performing.
The DBE’s work on an ‘inclusive basket’ of indicators has brought about a more informed
debate on how well provinces and districts perform in Grade 12, one that is less reliant on the
136 Mullis et al, 2017: 36.

74
traditional ‘pass rate’, which is easily manipulated by keeping weaker candidates away from
the examinations (see section 9.6). The challenge is to use the available data better at the
school level, in part so that the ‘results-oriented mutual accountability’ culture envisaged
by the NDP can be made a reality. Work of this nature at the secondary level can in turn
inform work on building systems at the primary level.
An example of a school-level indicator which can prompt action is whether a school offers
mathematics and physical science, and whether at least one candidate achieves a mark of 50 or
more in each. Currently, around 10% of public ordinary school Grade 12 learners per year find
themselves in schools where not one learner achieves a mark of 50 or more in mathematics.
The same applies to physical science. These are obviously ‘red flags’ warranting action.
Furthermore, some schools do not offer these subjects at all. Around 2% of public ordinary
school learners are in schools where no-one took mathematics, the figure for physical science
being 5%.
Indicator 4. Number of Grade 12 learners who become eligible for a Bachelors
programme in the public national examinations.
Indicator 5. Number of Grade 12 learners passing mathematics.
Indicator 6. Number of Grade 12 learners passing physical science.
As shown in earlier Figure 8, over the longer 1994 to 2018 period, the number of Grade 12
graduates who qualify for Bachelors studies has been increasing by 4.3% a year. Table 4
below indicates that for the period 2010 to 2018, the annual increase was a bit lower, at 3.6%. However, if one takes into account the average annual decline in the relevant population, of
1.1%, one obtains an annual increase of 4.7% for 2010 to 2018. One can think of this 4.7% as
representing the annual increase in the share of the youth population with a Bachelors-level
pass. Eastern Cape stands out as a province with exceptionally strong growth in the number of
Bachelors-level passes, even before population decline is taken into account.
Table 4: Provincial trends in full-time Bachelors-level passes and the youth population
A: Annual % increase in NSCs with a
Bachelors-level pass 2010-2018
B: Annual % increase in population aged 15
to 19, 2010-2018 A minus B
EC 7.1 -3.6 10.7 FS 5.2 -1.5 6.6 GP 3.1 1.4 1.7 KN 2.0 -1.8 3.8 LP 3.6 -2.8 6.4 MP 5.0 -0.8 5.8 NC 2.5 -0.3 2.8 NW 2.1 -0.5 2.5 WC 4.6 0.4 4.2
SA 3.6 -1.1 4.7
Sources: As for Table 13 (see discussion preceding that table). Note: Percentages represent annual increases in the linear slopes for the 2010 to 2018 period, divided by the mean across all years.
Table 5 indicates that provincial Bachelors-level passes per year as a proportion of the age 18
population ranges from 12%, in the case of Northern Cape, to 24%, in the case of Western

75
Cape. Northern Cape and North West stand out as provinces with low levels of attainment
(Table 5) and low levels of improvement (Table 4).
Table 5: Provincial Bachelors-level passes relative to population
A: Average Bachelors-level passes per year
2016-2018
B: Age 18 population (with
LURITS adjustment) A / B
EC 16,671 109,558 15.2 FS 9,276 47,369 19.6 GP 38,356 180,993 21.2 KN 37,087 187,256 19.8 LP 18,290 102,922 17.8 MP 12,374 72,929 17.0 NC 2,497 20,152 12.4 NW 8,917 54,501 16.4 WC 20,670 87,627 23.6
SA 164,139 863,306 19.0
Note: See discussion of Table 14 for an explanation of how the population values were calculated.
Concerns raised in relation to the monitoring of NSCs in general (see section 9.6) apply here
too. Figures in Table 5 above (and in the tables below dealing with high-level achievement in
mathematics and physical science) are under-estimates insofar as they do not take into account
the achievement of part-time examination candidates in the public examination system, or of the private systems, in particular the Independent Examination Board. The latter adds around
10 000 to the national total seen in Table 5. Part-time students add around 3 000 additional
Bachelors-level passes a year.
It is important to bear in mind that Bachelors-level passes do not account for all youths able to
pursue university studies. While around 20% of youths obtain a Bachelors-level NSC currently,
a further 17% approximately obtain a Diploma-level NSC, which allows for studies for a higher
diploma at a university, in particular the ‘universities of technology’. In total then, around 37%
of youths obtain an NSC allowing them to study at a university. Yet a Bachelors-level pass clearly improves someone’s chances of entering a university programme. A 2016 study found
that youths with Bachelors-level passes are three times as likely to pursue university studies as
someone with only a Diploma-level pass137.
Turning to Indicators 5 and 6, Table 6 below reflects basic passes, and relatively good passes,
in mathematics and physical science. The ‘50 and above’ values would be those reflected in
earlier Figure 10. Increasingly, the emphasis has fallen not just on passes, but passes of a level
that would permit youths entry into mathematically- and scientifically-oriented university
programmes.
137 Van Broekhuizen et al, 2016: 92.
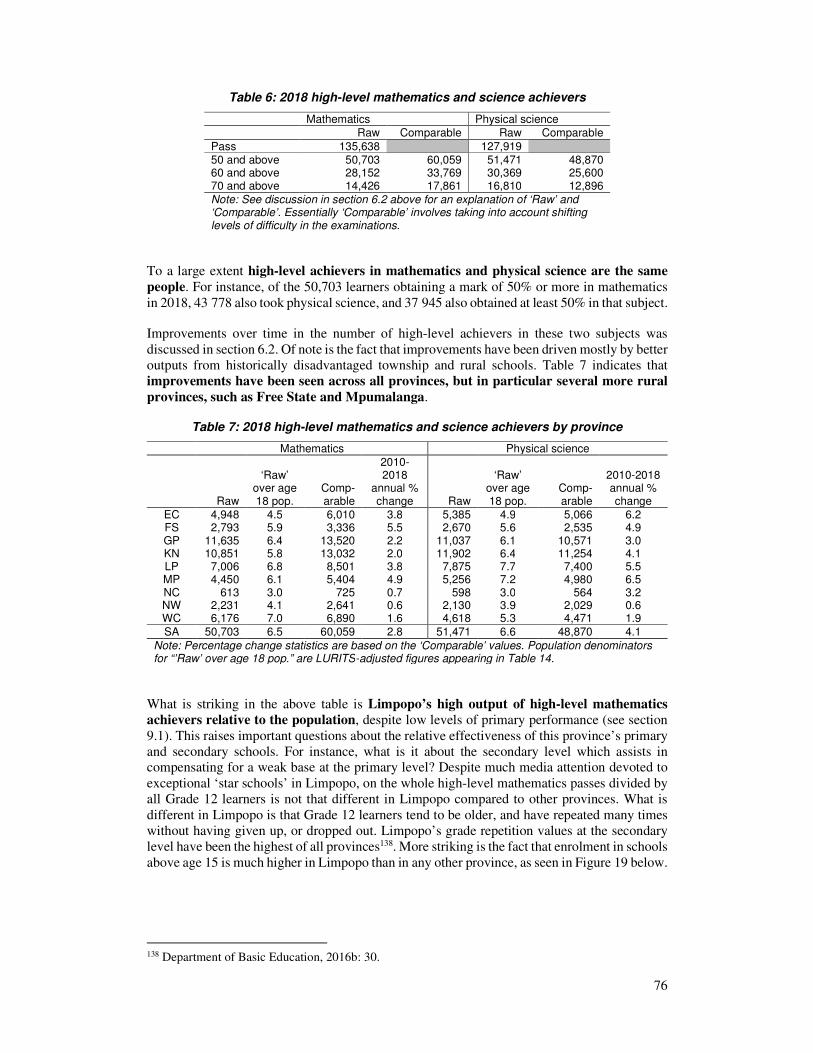
76
Table 6: 2018 high-level mathematics and science achievers
Mathematics Physical science
Raw Comparable Raw Comparable
Pass 135,638 127,919 50 and above 50,703 60,059 51,471 48,870 60 and above 28,152 33,769 30,369 25,600 70 and above 14,426 17,861 16,810 12,896
Note: See discussion in section 6.2 above for an explanation of ‘Raw’ and ‘Comparable’. Essentially ‘Comparable’ involves taking into account shifting levels of difficulty in the examinations.
To a large extent high-level achievers in mathematics and physical science are the same
people. For instance, of the 50,703 learners obtaining a mark of 50% or more in mathematics
in 2018, 43 778 also took physical science, and 37 945 also obtained at least 50% in that subject.
Improvements over time in the number of high-level achievers in these two subjects was
discussed in section 6.2. Of note is the fact that improvements have been driven mostly by better
outputs from historically disadvantaged township and rural schools. Table 7 indicates that
improvements have been seen across all provinces, but in particular several more rural
provinces, such as Free State and Mpumalanga.
Table 7: 2018 high-level mathematics and science achievers by province
Mathematics Physical science
Raw
‘Raw’ over age 18 pop.
Comp-arable
2010-2018
annual % change Raw
‘Raw’ over age 18 pop.
Comp-arable
2010-2018 annual % change
EC 4,948 4.5 6,010 3.8 5,385 4.9 5,066 6.2 FS 2,793 5.9 3,336 5.5 2,670 5.6 2,535 4.9 GP 11,635 6.4 13,520 2.2 11,037 6.1 10,571 3.0 KN 10,851 5.8 13,032 2.0 11,902 6.4 11,254 4.1 LP 7,006 6.8 8,501 3.8 7,875 7.7 7,400 5.5 MP 4,450 6.1 5,404 4.9 5,256 7.2 4,980 6.5 NC 613 3.0 725 0.7 598 3.0 564 3.2 NW 2,231 4.1 2,641 0.6 2,130 3.9 2,029 0.6 WC 6,176 7.0 6,890 1.6 4,618 5.3 4,471 1.9
SA 50,703 6.5 60,059 2.8 51,471 6.6 48,870 4.1
Note: Percentage change statistics are based on the ‘Comparable’ values. Population denominators for “’Raw’ over age 18 pop.” are LURITS-adjusted figures appearing in Table 14.
What is striking in the above table is Limpopo’s high output of high-level mathematics
achievers relative to the population, despite low levels of primary performance (see section
9.1). This raises important questions about the relative effectiveness of this province’s primary
and secondary schools. For instance, what is it about the secondary level which assists in compensating for a weak base at the primary level? Despite much media attention devoted to
exceptional ‘star schools’ in Limpopo, on the whole high-level mathematics passes divided by
all Grade 12 learners is not that different in Limpopo compared to other provinces. What is
different in Limpopo is that Grade 12 learners tend to be older, and have repeated many times
without having given up, or dropped out. Limpopo’s grade repetition values at the secondary
level have been the highest of all provinces138. More striking is the fact that enrolment in schools
above age 15 is much higher in Limpopo than in any other province, as seen in Figure 19 below.
138 Department of Basic Education, 2016b: 30.
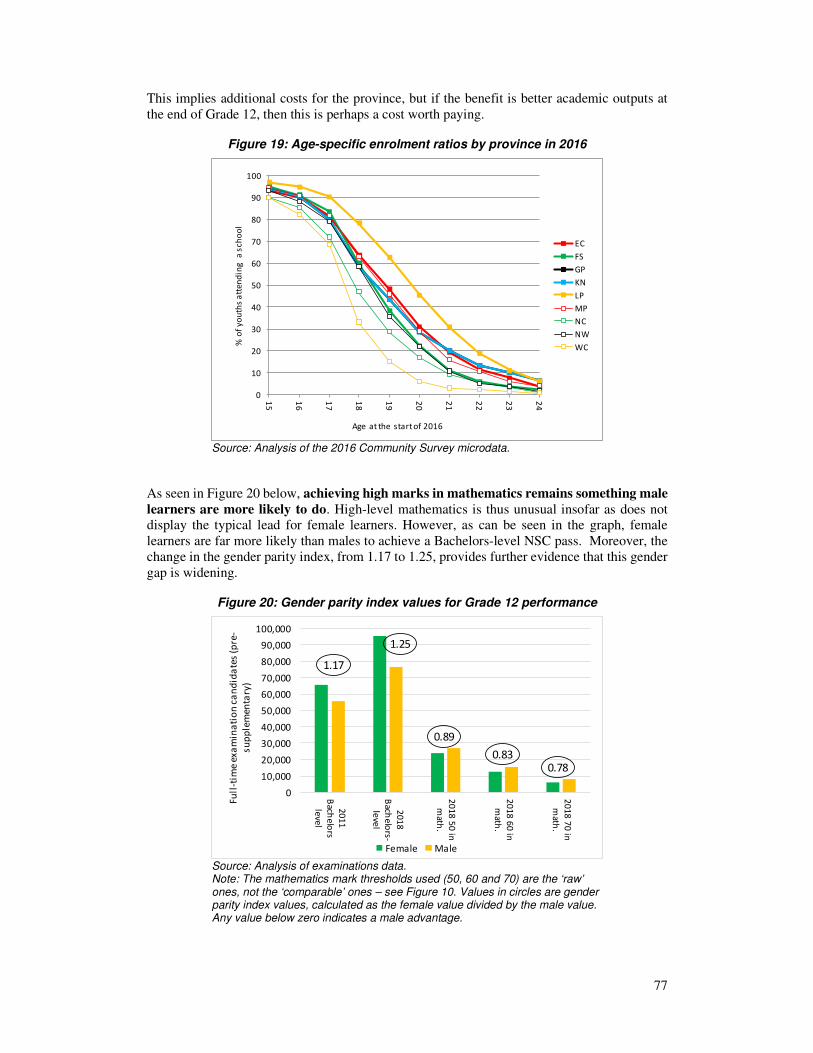
77
This implies additional costs for the province, but if the benefit is better academic outputs at
the end of Grade 12, then this is perhaps a cost worth paying.
Figure 19: Age-specific enrolment ratios by province in 2016
Source: Analysis of the 2016 Community Survey microdata.
As seen in Figure 20 below, achieving high marks in mathematics remains something male
learners are more likely to do. High-level mathematics is thus unusual insofar as does not display the typical lead for female learners. However, as can be seen in the graph, female
learners are far more likely than males to achieve a Bachelors-level NSC pass. Moreover, the
change in the gender parity index, from 1.17 to 1.25, provides further evidence that this gender
gap is widening.
Figure 20: Gender parity index values for Grade 12 performance
Source: Analysis of examinations data. Note: The mathematics mark thresholds used (50, 60 and 70) are the ‘raw’ ones, not the ‘comparable’ ones – see Figure 10. Values in circles are gender parity index values, calculated as the female value divided by the male value. Any value below zero indicates a male advantage.
0
10
20
30
40
50
60
70
80
90
100
15
16
17
18
19
20
21
22
23
24
% o
f y
ou
ths
att
en
din
g a
sch
oo
l
Age at the start of 2016
EC
FS
GP
KN
LP
MP
NC
NW
WC
0
10,000
20,000
30,000
40,000
50,000
60,000
70,000
80,000
90,000
100,000
20
11
Bach
elo
rs
leve
l
20
18
Bach
elo
rs-
leve
l
20
18
50
in
math
.
20
18
60
in
math
.
20
18
70
in
math
.
Full
-tim
e e
xa
min
ati
on
ca
nd
ida
tes
(pre
-
su
pp
lem
enta
ry)
Female Male
1.17
1.25
0.89
0.830.78

78
9.3 Goals 7 to 9: Improving average performance in international tests
Goal 7 Improve the average performance of Grade 6 learners in languages.
Goal 8 Improve the average performance of Grade 6 learners in mathematics.
Goal 9 Improve the average performance of Grade 9 learners in mathematics.
The emphasis on TIMSS Grade 9 and SACMEQ Grade 6 in these three goals, and their three
indicators, reflects the fact that it is in these two testing series that South Africa has had the
longest engagement. SACMEQ was first run in 2000 in South Africa, and TIMSS lower
secondary testing already in 1995. Since then, PIRLS and TIMSS Grade 5 have been added to
the international tests South Africa participates in.
Though the international tests are not tailor-made for the South African curriculum and context,
as will be the case with the new Systemic Evaluation, improving South Africa’s performance
in these tests is largely a matter of pursuing national strategies. However, these strategies could be better informed by the excellent data which emerge from the international systems. In
particular, these data can assist in determining in which specific language and mathematics
topics South Africa’s learners are most behind.
Indicator 7. Average score obtained in Grade 6 in language in the SACMEQ assessment.
Indicator 8. Average score obtained in Grade 6 in mathematics in the SACMEQ
assessment.
The official South African report following SACMEQ IV, which involved testing across fifteen countries in 2013, pointed to substantial improvements in the 2007 to 2013 period. In Grade 6
reading, South Africa’s SACMEQ score improved from 495 to 538, while in mathematics it
improved from 495 to 552139. These improvements, as well as the distributions of scores, are
illustrated in Figure 21 and Figure 22 below. In terms of standard deviations, the improvements
came to 0.07 standard deviations a year in reading, and 0.10 a year in mathematics. These are
large improvements by international standards.
Figure 21: SACMEQ Grade 6 reading IRT score distribution 2007 and 2013
Source: Analysis of SACMEQ microdata.
139 Department of Basic Education, 2017a: 27.
0.0
0.5
1.0
1.5
2.0
2.5
3.0
3.5
4.0
4.5
5.0
200 400 600 800 1000% o
f le
arn
ers
wit
h t
his
IR
T s
co
re (
rou
nd
ed
to t
he
clo
se
st
mu
ltip
le o
f 5
)
IRT score
2007 2013
Average IRT score
2007: 495
2013: 538

79
Figure 22: SACMEQ Grade 6 mathematics IRT score distribution 2007 and 2013
Source: Analysis of SACMEQ microdata.
Improvements with respect to the underlying classical scores are illustrated in Figure 23 and
Figure 24. Only questions (or items) which were common, meaning they were exactly the same,
across the two years, were considered. In the case of mathematics, this meant 23 questions, and
in the case of reading, 21 questions. Each question was a multiple-choice question consisting
of four options, one of which was correct. Unlike PIRLS (and TIMSS), SACMEQ consists only
of multiple-choice questions. The classical score improvements translate to a 0.02 standard
deviation per year improvement in reading, and a 0.06 standard deviation per year gain in
reading. The fact that these improvements are smaller than those for the IRT scores could be
because South Africa’s learners performed particularly well in the non-common items.
Figure 23: SACMEQ Grade 6 reading percentage score distribution 2007 and 2013
Source: Analysis of SACMEQ microdata. 21 questions common across both years were considered.
0.0
1.0
2.0
3.0
4.0
5.0
6.0
7.0
200 400 600 800 1000% o
f le
arn
ers
wit
h t
his
IR
T s
co
re (
rou
nd
ed
to t
he
clo
se
st
mu
ltip
le o
f 5
)
IRT score
2007 2013
Average IRT score
2007: 495
2013: 552
0
2
4
6
8
10
12
14
16
18
20
0 10 20 30 40 50 60 70 80 90 100
% o
f le
arn
ers
wit
h t
his
% s
co
re (
rou
nd
ed
to t
he
clo
se
st
mu
ltip
le o
f 1
0)
% score
2007 2013
Average % score
2007: 52%
2013: 59%

80
Figure 24: SACMEQ Grade 6 mathematics percentage score distribution 2007 and 2013
Source: Analysis of SACMEQ microdata. 23 questions common across both years were considered.
The following four graphs confirm what has been seen in other data, such as the PIRLS data
(section 9.1 above), namely that most of the improvement was due to gains experienced by
historically disadvantaged learners.
0
5
10
15
20
25
30
35
40
0 10 20 30 40 50 60 70 80 90 100
% o
f le
arn
ers
wit
h t
his
% s
co
re (
rou
nd
ed
to t
he
clo
se
st
mu
ltip
le o
f 1
0)
% score
2007 2013
Average % score
2007: 39%
2013: 45%

81
Figure 25: SACMEQ 2007 to 2013 reading progress by socio-economic category
Note: Socio-economic status is derived through a principal components analysis applied to the 2013 data using ten binary background variables referring to household possessions. Coefficients from the 2013 data were then applied to the 2007 data. The SES measure has a mean of zero and a standard deviation of 1.4.
20%
25%
30%
35%
40%
45%
50%
55%
60%
65%
70%
-7 -6 -5 -4 -3 -2 -1 0 1
Cla
ss
ica
l sc
ore
(c
om
mo
n it
em
s o
nly
)
Standard measure of socio-economic status
2007 2013
350
400
450
500
550
600
650
-7 -6 -5 -4 -3 -2 -1 0 1
IRT
sc
ore
Standard measure of socio-economic status
2007 2013

82
Figure 26: SACMEQ 2007 to 2013 mathematics progress by socio-economic category
See note to previous figure.
In Table 8 and Table 9, ‘Probability > F’ values close to zero point to an improvement with a
high degree of certainty. Specifically, difference-in-means tests were run. To illustrate, a
‘Probability > F’ value of 0.050 points to certainty that a change occurred at a 95% level of
confidence. It is clear that all provinces except for Gauteng and North West saw statistically
significant improvements in both subjects. For Gauteng and North West, there is ambiguity
with regard to mathematics insofar as the classical scores do not point to a statistically
significant change, while the IRT scores do.
20%
25%
30%
35%
40%
45%
50%
55%
60%
65%
70%
-7 -6 -5 -4 -3 -2 -1 0 1
Cla
ss
ica
l sc
ore
(c
om
mo
n i
tem
s o
nly
)
Standard measure of socio-economic status
2007 2013
350
400
450
500
550
600
650
-7 -6 -5 -4 -3 -2 -1 0 1
IRT
sc
ore
Standard measure of socio-economic status
2007 2013

83
Table 8: Reliability of differences in provincial SACMEQ reading means
Sample size
(learners) Classical mean considering
common items only IRT mean
2007 2013 2007 2013 Prob. >
F 2007 2013 Prob. >
F
EC 1,068 1,023 43 52 0.002 448 503 0.000 FS 958 483 51 61 0.001 491 543 0.002 GP 1,020 1,137 66 67 0.741 573 580 0.701 KN 1,492 1,573 51 57 0.027 486 529 0.004 LP 917 967 40 48 0.001 425 487 0.000 MP 869 575 49 60 0.000 474 536 0.000 NC 926 344 54 61 0.043 506 538 0.070 NW 914 460 55 57 0.494 506 522 0.383 WC 907 555 67 74 0.020 583 628 0.021
SA 8,164 6,562 52 59 0.000 495 538 0.000
Source: Analysis of the microdata. IRT means can also be seen in Department of Basic Education (2017a: 27) and Moloi and Chetty (2010: 43). Note: Standard errors are calculated whilst taking into account the clustering of sampled learners in schools. The total number of sampled schools was 392 in 2007, and 297 in 2013.
Table 9: Reliability of differences in provincial SACMEQ mathematics means
Classical mean considering
common items only IRT mean
2007 2013 Prob. >
F 2007 2013 Prob. >
F
EC 34 41 0.010 469 525 0.000 FS 38 46 0.003 492 551 0.000 GP 49 50 0.684 545 577 0.054 KN 38 43 0.008 485 542 0.000 LP 31 39 0.000 447 513 0.000 MP 35 43 0.002 476 539 0.000 NC 40 46 0.057 499 544 0.008 NW 41 43 0.546 503 540 0.054 WC 51 62 0.002 566 654 0.000
SA 39 45 0.000 495 552 0.000
Table 10, like the earlier Table 3, provides assurance that any changes in the overall mean are
not simply the result of non-comparable samples. Essentially, Table 10 confirms what was
seen in the previous two tables. For both Gauteng and North West, there is low certainty that
actual improvements in either subject occurred.
Table 10: Provincial SACMEQ trends with SES controls
Reading Mathematics
IRT Classical
(common items) IRT Classical
(common items)
EC 48*** 7.6*** 56*** 5.9** FS 49*** 9.5*** 57*** 7.2*** GP 11 1.8 35** 1.6 KN 29** 3.2 46*** 3.8** LP 58*** 7.6*** 63*** 6.9*** MP 51*** 8.9*** 56*** 6.8*** NC 25 5.5* 39*** 4.6* NW 13 1.9 35** 1.8 WC 50*** 7.9*** 95*** 11.7***
SA 33*** 4.8*** 49*** 4.6***
*** indicates that the estimate is significant at the 1% level of significance, ** at the 5% level.

84
Indicator 9. Average Grade 9 mathematics score obtained in TIMSS.
The TIMSS Grade 9 trend provided the earliest evidence of substantial improvements in
learning outcomes. These improvements became clear after the 2011 results were released.
Figure 27 below illustrates the change over time in the distribution of scores. South Africa’s
mean moved from 285 to 372 between 2002 and 2015. The percentage of learners reaching at
least the TIMSS low international benchmark, a score of 400, rose from 11% in 2002 to 34%
in 2015.
Figure 27: TIMSS Grade 9 mathematics IRT score distribution 2002, 2011 and 2015
Source: Analysis of TIMSS microdata available at https://timssandpirls.bc.edu (for 2011 and 2015) and obtained from the HSRC (2002 data). Note: Where 2003 was the official testing year for the 2003 wave of TIMSS, South Africa undertook testing in 2002. All figures reflect Grade 9 results – for most other countries the grade tested was Grade 8. The average IRT scores and percentages of students reaching the low international benchmark are published in the following: Reddy et al (2012); Mullis, Martin, Foy and Arora (2012); Mullis et al (2016). Note that the 2002 Grade 9 testing in South Africa excluded independent schools, while these schools were included in the following two years. Based on patterns in the 2011 and 2015 data, it can be concluded that the 2002 mean would have been four points higher, so 289 instead of 284, had independent schools been included.
The TIMSS Grade 9 trend translates into an improvement of 0.08 of a South African standard
deviation a year for the 2002 to 2011 period, and 0.06 standard deviations a year for 2011 to
2015. Both of these figures are high in the sense that it is rare to find improvements this large
anywhere in the world. However, if the difference between the two represents a slowing down
of progress, this would be worrying.
Figure 28 below provides a sense of the underlying classical, or percentage, scores for 2011
and 2015. The low international benchmark of 400 TIMSS points translates roughly into a
classical score of 24% correct.
0
1
2
3
4
5
6
0 100 200 300 400 500 600 700% o
f le
arn
ers
wit
h t
his
IR
T s
co
re (
rou
nd
ed
to
th
e
clo
se
st
mu
ltip
le o
f 1
0)
IRT score
2002 2011 2015
Average IRT score:
2002: 285
2011: 353
2015: 372
2002: 11%
2011: 24%
2015: 34%

85
Figure 28: TIMSS Grade 9 mathematics percentage score distribution in 2011 and 2015
Source: Analysis of TIMSS microdata. Just 129 items common across both years were considered in this analysis. Note that no student responds to all 129 items, in line with the matrix sampling approach of TIMSS.
The low average percentage scores seen in Figure 28, of 19% in 2011 and 22% in 2015, reflect
the fact that in TIMSS lower secondary there is no easier version of the standard test, as is seen
in TIMSS and PIRLS Grade 4.
The following question is one which a learner able to reach the low international benchmark
should be able to get right. For this particular question, 52% of South Africa’s Grade 9 learners
in 2015 got the question right, against figures of 44% for Grade 9 in Botswana and, in the case
of Grade 8, 59% in Canada, 61% in Morocco, and 64% in the United States140. The fact that
just 34% of South Africa’s learners reached the low international benchmark suggests that this
particular question was one South African learners handled relatively well.
140 Mullis et al, 2016: Exhibit 2.11.1. See also Department of Basic Education (2017e, 2017f).
0
5
10
15
20
25
30
35
40
45
0 10 20 30 40 50 60 70 80 90 100
% o
f le
arn
ers
wit
h t
his
% s
co
re (
rou
nd
ed
to
th
e
clo
se
st
mu
ltip
le o
f 1
0)
% score
2011 2015
24
Average % score:
2011: 19%
2015: 22%

86
By Grade 9, learners are relatively informed about the highest educational level of their parents or guardians. This makes it possible to produce the breakdown seen in Figure 10 below. In
many ways, parent education is the best measure of socio-economic status for the purposes of
understanding a learner’s success at school. Socio-economic status impacts on the education
process largely through the support and advice available from older members of the
household. As seen in previous graphs examining the relationship between learning outcomes
and SES, the largest improvements have been seen among the least advantaged learners.

87
Figure 29: TIMSS 2002 to 2013 mathematics progress by parent education
Note: The highest of two values was used: educational attainment of the female or male parent (or guardian).
Figure 30: TIMSS 2002 to 2013 mathematics progress by province
Sources: Provincial means published in Zuze et al (2017: 24) and Reddy et al (2012: 8) used.
Figure 30 above illustrates the provincial trends, using published IRT means for provinces.
Table 11 below examines whether changes from one TIMSS round of assessments to the next
are statistically significant, given the sample size. As for Table 8 above, the values in the last
two columns are critical. Values closer to zero point to a higher level of certainty. The 2002 to
2011 change is statistically significant in all provinces except for Northern Cape and Western
Cape. The smaller 2011 to 2015 gains, which are in part smaller because the time period was
shorter, are statistically significant at the national level, and in just two provinces, namely
KwaZulu-Natal and Limpopo. This does not mean that gains (or losses) in other provinces did
not occur. It simply means that given the size of the sample, one cannot be certain about the
trend.
250
270
290
310
330
350
370
390
410
<G
rad
e 9
Gra
de
9
Gra
de
12
Ce
rtifica
te
Dip
lom
a
De
gre
e
Po
st-gra
d
Me
an
IR
T s
co
re o
f le
arn
er)
2002 2011 2015
240
260
280
300
320
340
360
380
400
420
20
00
20
02
20
04
20
06
20
08
20
10
20
12
20
14
20
16
IRT
sc
ore
EC
FS
GP
KN
LP
MP
NC
NW
WC
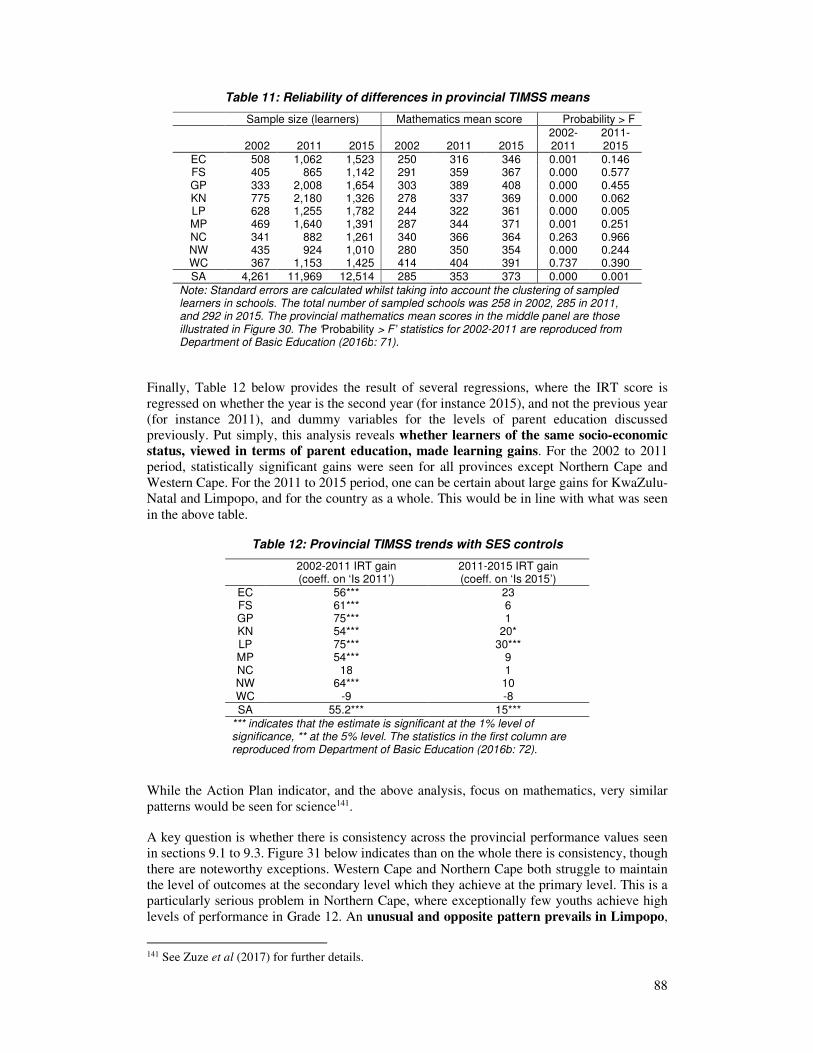
88
Table 11: Reliability of differences in provincial TIMSS means
Sample size (learners) Mathematics mean score Probability > F
2002 2011 2015 2002 2011 2015 2002-2011
2011-2015
EC 508 1,062 1,523 250 316 346 0.001 0.146 FS 405 865 1,142 291 359 367 0.000 0.577 GP 333 2,008 1,654 303 389 408 0.000 0.455 KN 775 2,180 1,326 278 337 369 0.000 0.062 LP 628 1,255 1,782 244 322 361 0.000 0.005 MP 469 1,640 1,391 287 344 371 0.001 0.251 NC 341 882 1,261 340 366 364 0.263 0.966 NW 435 924 1,010 280 350 354 0.000 0.244 WC 367 1,153 1,425 414 404 391 0.737 0.390
SA 4,261 11,969 12,514 285 353 373 0.000 0.001
Note: Standard errors are calculated whilst taking into account the clustering of sampled learners in schools. The total number of sampled schools was 258 in 2002, 285 in 2011, and 292 in 2015. The provincial mathematics mean scores in the middle panel are those illustrated in Figure 30. The ‘Probability > F’ statistics for 2002-2011 are reproduced from Department of Basic Education (2016b: 71).
Finally, Table 12 below provides the result of several regressions, where the IRT score is
regressed on whether the year is the second year (for instance 2015), and not the previous year
(for instance 2011), and dummy variables for the levels of parent education discussed
previously. Put simply, this analysis reveals whether learners of the same socio-economic
status, viewed in terms of parent education, made learning gains. For the 2002 to 2011
period, statistically significant gains were seen for all provinces except Northern Cape and
Western Cape. For the 2011 to 2015 period, one can be certain about large gains for KwaZulu-
Natal and Limpopo, and for the country as a whole. This would be in line with what was seen
in the above table.
Table 12: Provincial TIMSS trends with SES controls
2002-2011 IRT gain (coeff. on ‘Is 2011’)
2011-2015 IRT gain (coeff. on ‘Is 2015’)
EC 56*** 23 FS 61*** 6 GP 75*** 1 KN 54*** 20* LP 75*** 30*** MP 54*** 9 NC 18 1 NW 64*** 10 WC -9 -8
SA 55.2*** 15***
*** indicates that the estimate is significant at the 1% level of significance, ** at the 5% level. The statistics in the first column are reproduced from Department of Basic Education (2016b: 72).
While the Action Plan indicator, and the above analysis, focus on mathematics, very similar
patterns would be seen for science141.
A key question is whether there is consistency across the provincial performance values seen
in sections 9.1 to 9.3. Figure 31 below indicates than on the whole there is consistency, though
there are noteworthy exceptions. Western Cape and Northern Cape both struggle to maintain
the level of outcomes at the secondary level which they achieve at the primary level. This is a
particularly serious problem in Northern Cape, where exceptionally few youths achieve high
levels of performance in Grade 12. An unusual and opposite pattern prevails in Limpopo,
141 See Zuze et al (2017) for further details.

89
where outcomes at the secondary level are much better than what one would expect, given weak
performance at the primary level. This warrants further investigation. Possible explanations
were discussed in section 9.2.
Figure 31: Overall view of learner performance by province
Sources: Provincial performance values were adjusted to give a mean of zero and a standard deviation of 1 across the nine (unweighted) provinces. Original PIRLS values are those seen in Howie et al (2017: 50), TIMSS Grade 5 values are those seen in Table 1, SACMEQ values are 2013 values from Table 8 and Table 9, TIMSS Grade 9 values are 2015 values from Table 11, Bachelors-level values are from Table 5, and Grade 12 mathematics and physical science values are from Table 7.
It is important to bear in mind that the burden of poverty experienced by each province
influences learning in the classroom in many ways, through parent education, access to
educational materials in the home, and nutrition. Poor educational performance in a province is thus not only a reflection of the efficiency of the provincial schooling system. Figure 32
confirms that what can be called ‘learning poverty’, or not reaching minimum thresholds in
assessments, is closely correlated to income poverty. This underlines the importance of
collaboration between the basic education sector and other areas of government dealing with
matters of poverty, in particular the social grants system and health.
-2.00
-1.50
-1.00
-0.50
0.00
0.50
1.00
1.50
2.00
2.50
PIR
LS
20
16
Re
ad
ing
Gr 4
TIM
SS
20
15
Ma
ths G
r 5
SA
CM
EQ
20
13
Re
ad
ing
Gr 7
SA
CM
EQ
20
13
Ma
ths G
r 6
TIM
SS
20
15
Ma
ths G
r 9
Ba
che
lors N
SC
ov
er p
op
.
Gr 1
2 m
ath
em
atic
s hig
h-
lev
el o
ve
r po
p.
Gr 1
2 scie
nc
e h
igh
-lev
el o
ve
r
po
p.
Sta
nd
ard
ise
d p
rov
inc
ial m
ea
su
re
EC
FS
GP
KN
LP
MP
NC
NW
WC
SecondaryPrimary

90
Figure 32: Learning poverty and income poverty
Sources: TIMSS figures from Isdale et al (2017: 23). Income poverty values from Statistics South Africa (2017: 64).
9.4 Goal 10: Compulsory schooling
Goal 10 Ensure that all children remain effectively enrolled in school at least up to the
year in which they turn 15.
This goal is one which is largely achieved, with 99% of children in the age 7 to 15 range, as
defined by the South African Schools Act, attending school. Yet this leaves around 130 000
children in the relevant age range outside school, of which around 40 000 are disabled. These
are children whose basic educational rights are being denied. A far more ambitious strategy is
needed to address the needs of these children. A part of the solution, as explained below, is to
use existing monitoring systems better, and to embark on joint projects with the social
development sector, nationally and provincially.
The ‘effectively enrolled’ part of this goal alludes to the matter of learner absenteeism on
specific days. Systems such as SA-SAMS and the DDD dashboards, discussed in section 7.3,
have provided better information on learner absenteeism, and this may be one factor behind the
slight drop in absenteeism over the last ten years. The percentage of learners who reported being absent on one or more days in the last week, according to Stats SA household data,
declined from an average of 7.1% for the years 2009 to 2013, to 5.7% for years 2014 to 2017142.
This trend should continue.
Indicator 10. Percentage of 7 to 15 year olds attending education institutions.
This indicator is in part about compliance with the South African Schools Act, which states
that children should attend school from the calendar year in which they turn 7 to the calendar
year in which they turn 15. Thus legally, a child may not attend an institution while she is aged
six in the calendar year before she turns seven, and similarly she may legally be outside an
institution while aged fifteen in the calendar year after she turned fifteen. In fact, for many years
attendance in an institution for children aged seven to fifteen has been high. The General
Household Survey data of 2017 points to 99% of children aged 7 to 13 attending a school, 98%
for children aged 14, and 97% for children aged 15.
142 Department of Basic Education, 2019a: 33. The 7.1% average ignores the exceptionally low 2010
statistic, which may be an error, or influenced by the 2010 FIFA World Cup.
R² = 0.871
20
30
40
50
60
70
25 35 45 55 65
% o
f G
rad
e 5
lea
rner
s re
ac
hin
g
TIM
SS G
rad
e 4
low
in
tern
ati
on
al
be
nch
ma
rk
% of population NOT being poor
WC
GP
FSNC
MP
NW
KN
LP
EC

91
Indicator values for provinces are all high – Figure 19 above indicates that for age 15, all
provinces except for Western Cape and Northern Cape displayed enrolment ratios of 93%
to 97% – the two provinces mentioned here both displayed 90%.
The problem of non-attendance in the compulsory ages tends to be localised. Figure 33
below illustrates enrolment ratios for children of compulsory school-going age in recent years. The ratios displayed are the averages found across two sources: Census 2011 and 2016
Community Survey. Averages across the two years produced more stable and reliable values.
Parts of rural Western Cape and Northern Cape are out-of-school ‘hotspots’ – the municipalities
in red in these two provinces are Kannaland, Breede Valley and Ubuntu. Ikwezi in Eastern Cape
displays the worst figures for that province. In KwaZulu-Natal the same can be said for Kwa
Sani and Mthonjaneni.
Figure 33: Compliance with compulsory schooling (2011-2016)
Source: Analysis of Census 2011 (10% sample) and Community Survey 2016 microdata. Note: The map considers children who, at the start of the year, were aged 6 to 14. These children should all have been enrolled in school in 2016. Average school enrolment ratios across the two sources, for 2011 and 2016, were used. Education district boundaries are marked in black – the meaning of the codes is explained in Table 22. Colouring is by 2011 municipality. It should be noted that enrolment ratios obtained from Census and Community Survey data over the years have tended to be around two percentage points lower than they should be for reasons which are not clear (see for instance Gustafsson, 2012). This explains the discrepancy between, say, Gauteng’s municipalities displaying values mostly below 97.5 and official figures for the province of 99% (derived from the General Household Survey).
There has been confusion around the extent to which the out-of-school are accounted for by
children with disabilities. Stats SA household data indicate that for children aged 7 to 15,
enrolment ratios for disabled children are lower than those for non-disabled children, but the
difference is not very large. Among disabled children of compulsory school age, around 90%
attend school, against 99% for the non-disabled. Around 4% of children are disabled, according
to Stats SA data, and using internationally accepted definitions. The largest categories are
difficulty with ‘self-care, such as washing or dressing’ (2.1% of children aged 7 to 15
experience considerable difficulties) and difficulty ‘in communicating in his/her usual language
AE
AM
AW
BC
BJ
BO
CA
CW ED
EH
EN
ES
FE
FR
GE
GN
GS
GW
HE
HG
HW
IL
JC
JE
JG
JN
JO
JS
JW
KE
LP
MC
ME
MH
MN
MP
MS
NA
NE
NG NK
NM
NW
OV
PI
PS
RU
SB
SE
SK
SW
TC
TH
TI
TN
TS
TWUG
UK
UL
UM
UT UU
UY
VH
WA
WE
XH
ZM
ZU
Enrolment ratio ages 6 to 14
87.5 to 89.990.0 to 92.492.5 to 94.9
95.0 to 97.497.5 to 100.0

92
including sign language’ (0.8%). The data point to around 40 000 disabled children not
attending school143.
Ensuring that all children of compulsory school-going age attend school requires better
monitoring of dropping out, and the following up of individual cases, than is currently the case.
Specifically, a key challenge remains to make better use of systems such as the DBE’s LURITS, a national database of individual learners which is updated several times a year, to identify
dropping out ‘hotspots’ in the country, so that social work efforts can be directed there. It is
clear that virtually all children spend at least some time in a school, meaning they would be
captured in LURITS at some point in time. Stats SA data indicate that only around 0.2% of
children never get to attend an institution. Insofar as this is not home schooling, this also
represents a challenge. However, the larger challenge is ensuring that learners, once in the
system, do not drop out.
9.5 Goal 11: Access to ECD and Grade R
Goal 11
Improve the access of children to quality Early Childhood Development (ECD) below
Grade 1.
Around 95% of children now go through a year of Grade R, with participation in poorer parts
of the country being the highest. Grade R continues to be offered mostly in primary schools,
though around 28% occurs in separate pre-school institutions144. Less advantaged households
are more likely to make use of a primary school. The percentage of Grade R participation being
in a pre-school is 24% for households where no-one has a Matric, 28% for households where
the highest qualification is a Matric, and 35% for households where someone has a post-Matric
qualification. The most serious participation challenge when it comes to Grade R is to ensure
that the remaining 5% of children who do not go through a year of Grade R, do so. This problem
is most likely to be found among poorer households. In 2016, around 10% of children aged five
at the start of the year in a household without a Matriculant did not attend an education
institution, against a figure of 5% for households with someone holding a post-Matric
qualification145. Challenges when it comes to the quality of Grade R persist, and are being
addressed through the upskilling of Grade R teachers and better provisioning of books,
including the national workbooks for Grade R.
A key challenge in the coming years will be the migration of pre-schools from the social
development sector to the basic education sector. This migration, introduced through the National Development Plan (see section 3.2 above), and confirmed in President Ramaphosa’s
State of the Nation Address of February 2019, is intended to strengthen the educational aspects
of all pre-schools, given how important early cognitive development is for later learning.
However, strengthening the educational aspects will not mean that health and psycho-social
aspects are neglected. In fact, the NDP’s call for malnutrition-related stunting to be eradicated
has large implications for nutrition programmes in pre-schools. During 2019, the DBE began
an intensive stocktaking and policy dialogue process to prepare the DBE, and the nine
provincial education departments, for their new responsibilities. The intention is not to disrupt
what is currently working well, but at the same time to bring about renewal in the ECD sector.
Five pillars for the work ahead have been identified: (1) legislation and policy; (2) institutional
arrangements; (3) services; (4) resources (including human resources, funding, infrastructure
and learning support materials); and (5) communication and advocacy. Current annual spending
on the pre-school sector is estimated to be around R1,7bn, with most of this being spending by the nine provincial social development departments, largely on subsidies for centres. Until the
143 Department of Basic Education, 2019a: 20-26. Also supplementary analysis of 2018 GHS data. 144 Department of Basic Education, 2016b: 58. 145 Statistics from analysis of the 2016 Community Survey.

93
budget situation improves, a key challenge will be advocating for more money through well-
costed and convincing proposals, and ensuring that existing funding is spent as efficiently as
possible.
Indicator 11. The percentage of Grade 1 learners who received Grade R.
Improvements in Grade R participation over the last two decades – the schools-based part of
this trend was shown in earlier Figure 2 – have occurred in the context of rising levels of
participation at levels below Grade R (see Figure 11). Given the NDP’s emphasis on improving
participation rates and the quality of services in pre-schools for the year preceding Grade R,
current enrolment ratios for children aged three and four at the start of the year are particularly
important. In 2016, 78% of children aged four at the start of the year were enrolled in an education institution, the figure being 58% for those aged three at the start of the year. This
means much of the envisaged rise in participation rates for the pre-Grade R year is already
a reality. Figure 34 below indicates that participation rates for those aged four on 1 January
2016 were high in many rural education districts and municipalities. Moreover, Limpopo and
Eastern Cape, the two provinces with the greatest burdens of poverty (see Figure 32 above),
display the highest participation rates.
Figure 34: ECD enrolment at age 4 (2016)
Source: Analysis of Community Survey 2016 microdata. Note: Age is as on 1 January 2016. Provincial values, from highest to lowest are: Limpopo 87%; Free State and Eastern Cape 82%; Gauteng 81%; Mpumalanga and North West 77%; Western Cape 73%; Northern Cape and KwaZulu-Natal 71%. Education district boundaries are marked in black – the meaning of the codes is explained in Table 22. See also note to Figure 14.
Turning to Grade R, and Indicator 11 specifically, at least since 2009 around 95% of Grade 1 learners have experienced Grade R somewhere. This statistic varies little across provinces146.
The aim should be to make this statistic 100% across all provinces.
The 2014 to 2019 MTSF envisages an indicator on the quality of Grade R: ‘Percentage of Gr 1
entrants who attended Gr R that are school ready’147. The DBE has been piloting instruments
146 Department of Basic Education, 2019a: 12. 147 Presidency, 2014.
AE
AM
AW
BC
BJ
BO
CA
CW ED
EH
EN
ES
FE
FR
GE
GN
GS
GW
HE
HG
HW
IL
JC
JE
JG
JN
JO
JS
JW
KE
LP
MC
ME
MH
MN
MP
MS
NA
NE
NG NK
NM
NW
OV
PI
PS
RU
SB
SE
SK
SW
TC
TH
TI
TN
TS
TWUG
UK
UL
UM
UT UU
UY
VH
WA
WE
XH
ZM
ZU
Enrolment ratio age 4
10% to 29%30% to 49%50% to 69%
70% to 79%80% to 89%
90% to 100%

94
to test learners entering Grade 1 in order to give effect to this indicator and improve
interventions focussing on Grade R. It is important that school readiness, or the lack thereof, be
seen in conjunction with key health issues, in particular stunting.
9.6 Goals 12 to 13: Improving grade attainment
Goal 12 Improve the grade promotion of learners through Grades 1 to 9.
Goal 13 Improve the access of the youth to Further Education and Training (FET)
beyond Grade 9.
Low levels of grade promotion, meaning high levels of repetition, put a strain on resources and
bring about larger class sizes. At the same time, in certain situations grade repetition can be of
benefit to the individual learner, and can prepare a learner better for subsequent grades. More
effective learning and teaching is one obvious way to reduce grade repetition. Restricting grade
repetition through policy is another approach. Currently, no learner can repeat more than one
grade per (mostly) three-year curriculum phase. Some have proposed that tighter restrictions
are needed in the Foundation Phase (grades R to 3), given how large classes are at this level,
and the need for groupwork and some individualised attention if, in particular, reading and
writing are to be taught properly (see sections 7.1 and 10.2). It is moreover argued that at this
level grade repetition does little to assist children. Policy on grade repetition remains
particularly complex, with strong arguments being presented both for and against solutions such
as automatic grade progression. The research evidence is not conclusive, and there are many
ways of allowing for repetition, and curbing repetition148. This area of policy needs more
attention. The costs and effects of repetition are too large to ignore. South Africa needs to
study carefully how other countries have dealt with this matter.
Turning to survival up the grades of the schooling system, two current policy initiatives are
likely to influence the pathways of learners in important ways in future: one is the introduction
of the Grade 9 General Education Certificate (introduced in section 5 above), the other the
Three Stream Model (section 3.4 above). Insofar as the GEC helps to strengthen the focus on
learning outcomes, and national standards, in Grade 9, it will encourage ‘survival’ to Grade 12,
and the NSC, in part by ensuring that learners are better prepared academically and make the
right Grade 10 subject choices. However, the GEC could also increase repetition in Grade 9,
and perhaps reduce the current very high levels of repetition in Grade 10, depending on how
the new national examinations are linked to grade promotion. The Grade 9 qualification is
specifically intended to facilitate an earlier movement of youths from school to a TVET college,
by providing more reliable information for colleges needed for the placement of youths who do
not have the Matric. Currently, only around a fifth of TVET college students do not already
have a Matric, or the NSC, according to household data (see the discussion of Indicator 13.2
below). It is common for youths to repeat NQF149 levels 2, 3 and 4, by first obtaining the NSC
in a school, and then pursuing ‘N’ courses or a National Certificate (Vocational), the NC(V),
in a college, programmes which are also at NQF levels 2 to 4. This is inefficient. By helping to
resolve this inefficiency, the GEC could contribute towards ensuring that more youths
obtain some qualification at the NQF 4 level.
The Three Stream Model is intended to create opportunities for learners who do not want to
pursue an academic stream. This is likely to reduce dropping out, promote ‘survival’ in the
schooling system, and give certain learners a more meaningful secondary school education.
148 Van der Berg et al, 2019. 149 National Qualifications Framework.

95
Indicator 12.1. The percentage of children who turned 9 in the previous year and who are
currently enrolled in Grade 4 (or a higher grade).
Indicator 12.2. The percentage of children who turned 12 in the previous year and who are
currently enrolled in Grade 7 (or a higher grade).
Reaching the ideal of 100% for the above two indicators is largely a question of reducing grade
repetition, which in turn depends largely on improvements in the quality of learning and
teaching. Recent trends have been in the right direction insofar as grade repetition has declined:
since 2013, and according to General Household Survey data, the percentage of learners in
grades 1 to 12 repeating their current grade has steadily declined from 11,8% in 2013 to
9,6% in 2017150 (and 9,1% in 2018).
The 2016 Community Survey provides an especially good opportunity to gauge age-grade
compliance in the schooling system, in large part because the data are able to tell the age of
children at the start of the calendar year. Figure 35 below displays the percentage of children
aged 12 at the start of 2016 who were in Grade 7 or a higher grade, in other words at a level
they should be without repetition. This is thus Indicator 12.2. The national figure is 66% and
provincial figures are given in the footnote to the map. In 2013 the national figure was 63%
according to Annual Survey of Schools data151. The differences across provinces are large: for
instance, in KwaZulu-Natal 70% of 12 year-olds in 2016 had reached at least Grade 7, against around 57% for Free State and Eastern Cape. This would result in larger classes and
inefficiencies in the latter provinces.
Figure 35: Twelve-year-olds in the right grade (2016)
Source: Analysis of Community Survey 2016 microdata. Note: The map considers children who, at the start of the year, were aged 12. Anyone who was reported to have completed Grade 6 (or a higher grade) was considered to be in the right grade, and not have been delayed in his or her grade progression through factors such as repetition. Provincial values, from best to worst are: Gauteng 74%; KwaZulu-Natal 70%; Limpopo 69%; Western Cape 64%; Mpumalanga 63%; North West 61%; Northern Cape 58%; Free State 57%; and Eastern Cape 56%.
150 Department of Basic Education, 2019a: 32. 151 Department of Basic Education, 2015: 59.
AE
AM
AW
BC
BJ
BO
CA
CW ED
EH
EN
ES
FE
FR
GE
GN
GS
GW
HE
HG
HW
IL
JC
JE
JG
JN
JO
JS
JW
KE
LP
MC
ME
MH
MN
MP
MS
NA
NE
NG NK
NM
NW
OV
PI
PS
RU
SB
SE
SK
SW
TC
TH
TI
TN
TS
TWUG
UK
UL
UM
UT UU
UY
VH
WA
WE
XH
ZM
ZU
% of 12 year-olds who are at the right grade
25% to 39%40% to 49%50% to 59%
60% to 69%70% to 79%
80% to 85%

96
Indicator 13.1. The percentage of youths who obtained a National Senior Certificate from a
school.
Indicator 13.2. The percentage of youths who obtained any FET qualification. (This is an
indicator of concern to DBE and the Department of Higher Education and Training.)
The first of the above two indicators has attracted much attention and debate over the years.
The intention with the explanations that follow is to clarify what the available data say. Systems
used to calculate indicator values need improving, not just because accurate indicator values
are needed, but also because these systems are important operationally, for instance in
permitting youths to accumulate NSC credits over time. More comprehensive reporting on the
NSCs obtained over time, going beyond figures published in the DBE’s widely used year-end
examination reports, is needed. Moreover, for the indicator to be calculated and interpreted
properly, certain discrepancies between DBE enrolment statistics and Stats SA population
estimates need to be understood better. Finally, it is important to bear in mind that changes in patterns of grade repetition in grades below Grade 12, as well as certain other factors, can make
Indicator 13.2 values ‘jumpy’ – they can shift up and down each year. For proper interpretation
of the values, it is necessary to view the longer-range trend over five or more years.
As indicated in Figure 9 in an earlier section, household data point to an increase in the
percentage of youths with a Grade 12 qualification, from around 45% to 55% between
2004 and 2018, approximately a 22% increase (10 percentage points as a percentage of 45%).
The corresponding increase for the 2004 to 2018 period if one considers NSCs obtained by full-
time candidates in schools, in the public examination system, is about 30% (calculated from values in Figure 8 above). As already pointed out in section 6.2, completion of upper secondary
schooling in South Africa is not exceptionally high or low by middle income standards.
Indicator 13.1 lies behind many disagreements seen in recent years, with many arguing that the
figure is much lower than, say, the 55% for 2018 reflected by the household data. The fact-
checking organisation Africa Check has looked in the matter and essentially agreed that
the DBE’s interpretation of the data is correct152.
Figure 36 provides a provincial breakdown of the national curves seen in Figure 9 above, though
below the focus is on the most recent years. There are clearly very large inter-provincial
differences. Youths in Gauteng are around 50% more likely to have an NSC compared to
youths in Eastern Cape. The Figure 36 levels provide vital background information for
understanding the traditional ‘pass rate’, meaning the percentage of examination candidates
obtaining the certificate after their initial sitting for the examinations. This traditional pass rate
is in fact not an official indicator of progress. Yet it is widely used. The important thing to bear
in mind is that the traditional pass rate can be raised by restricting the number of examination
candidates. In particular, it should be noted that though KwaZulu-Natal displays a below
average traditional pass rate, its curve in Figure 36 is relatively high. This because in this
province a relatively high proportion of youths become examination candidates.
152 Web article headed “The flaw in SA’s ‘real’ matric pass rate figure”, at https://africacheck.org/spot-
check/the-flaw-in-sas-real-matric-pass-rate-figure-as-calculated-by-the-eff-da/ (accessed 2019).
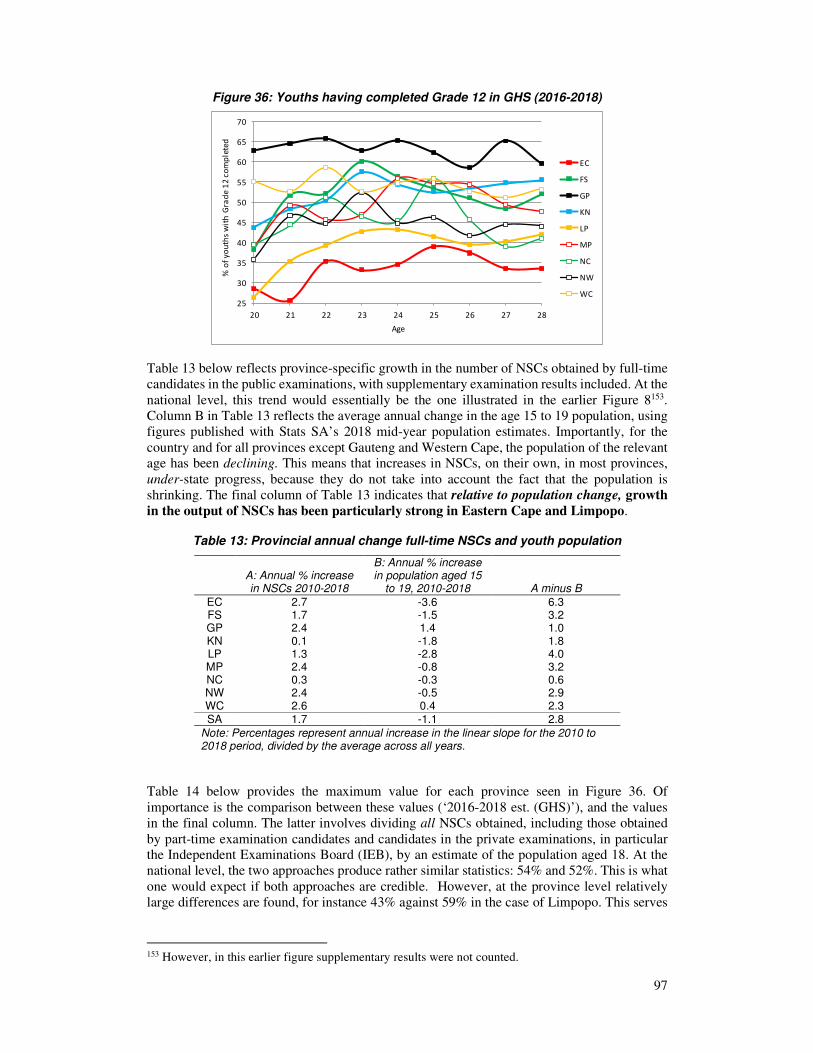
97
Figure 36: Youths having completed Grade 12 in GHS (2016-2018)
Table 13 below reflects province-specific growth in the number of NSCs obtained by full-time
candidates in the public examinations, with supplementary examination results included. At the
national level, this trend would essentially be the one illustrated in the earlier Figure 8153.
Column B in Table 13 reflects the average annual change in the age 15 to 19 population, using
figures published with Stats SA’s 2018 mid-year population estimates. Importantly, for the
country and for all provinces except Gauteng and Western Cape, the population of the relevant age has been declining. This means that increases in NSCs, on their own, in most provinces,
under-state progress, because they do not take into account the fact that the population is
shrinking. The final column of Table 13 indicates that relative to population change, growth
in the output of NSCs has been particularly strong in Eastern Cape and Limpopo.
Table 13: Provincial annual change full-time NSCs and youth population
A: Annual % increase in NSCs 2010-2018
B: Annual % increase in population aged 15
to 19, 2010-2018 A minus B
EC 2.7 -3.6 6.3 FS 1.7 -1.5 3.2 GP 2.4 1.4 1.0 KN 0.1 -1.8 1.8 LP 1.3 -2.8 4.0 MP 2.4 -0.8 3.2 NC 0.3 -0.3 0.6 NW 2.4 -0.5 2.9 WC 2.6 0.4 2.3 SA 1.7 -1.1 2.8
Note: Percentages represent annual increase in the linear slope for the 2010 to 2018 period, divided by the average across all years.
Table 14 below provides the maximum value for each province seen in Figure 36. Of
importance is the comparison between these values (‘2016-2018 est. (GHS)’), and the values
in the final column. The latter involves dividing all NSCs obtained, including those obtained
by part-time examination candidates and candidates in the private examinations, in particular the Independent Examinations Board (IEB), by an estimate of the population aged 18. At the
national level, the two approaches produce rather similar statistics: 54% and 52%. This is what
one would expect if both approaches are credible. However, at the province level relatively
large differences are found, for instance 43% against 59% in the case of Limpopo. This serves
153 However, in this earlier figure supplementary results were not counted.
25
30
35
40
45
50
55
60
65
70
20 21 22 23 24 25 26 27 28
% o
f y
ou
ths
wit
h G
rad
e 1
2 c
om
ple
ted
Age
EC
FS
GP
KN
LP
MP
NC
NW
WC

98
as a reminder that many NSC-holders leave certain provinces, such as Limpopo, soon after
obtaining their NSC, to study or work in other provinces, particularly Gauteng.
The population estimate used for the ‘A/C’ ratio draws from both Stats SA mid-year population
estimates, and patterns of enrolment by age at ages below 15, when virtually all children are
enrolled in school. If one uses the unadjusted Stats SA estimates, one obtains the generally lower ratios seen in the column ‘A/B’. These ratios are lower because population figures are
higher, in fact possibly over-estimates insofar as mid-year population estimates tend to
exceed the DBE’s enrolment data by a considerable margin, even after taking into account
the out-of-school.
Table 14: Percentage of youths obtaining the NSC
2013 est.
2016-2018 est. (GHS)
NSCs per year 2014-
2017 (A)
Age 18 pop. 2017 MYPE (B) A/B
Age 18 pop.
adjusted using
LURITS (C) A/C
EC 36 39 48,192 114,137 42 109,558 44 FS 53 60 23,908 47,087 51 47,369 50 GP 63 66 96,458 196,770 49 180,993 53 KN 59 58 101,723 198,932 51 187,256 54 LP 57 43 61,071 103,822 59 102,922 59 MP 57 56 40,263 76,695 52 72,929 55 NC 40 56 7,829 19,701 40 20,152 39 NW 47 52 26,285 59,098 44 54,501 48 WC 52 59 44,013 93,629 47 87,627 50 SA 53 54 449,742 909,872 49 863,306 52
Sources: ‘2013 est.’ are estimates for 2013 described in Department of Basic Education (2016b: 61). ‘2016-2018 est. (GHS)’ reflects maximum points per province seen in Figure 18. ‘NSCs per year 2014-2018’ reflects the average for the years 2014 to 2017, including all NSCs obtained in the public system, so including those of part-time candidates, with duplicates removed, plus NSCs obtained through private systems – the details on the public side are described in Department of Basic Education (2019f: 8). ‘Age 18 pop. 2017 MYPE’ is from Stats SA’s 2017 mid-year population estimates, with single age 18 obtained through Stats SA’s Sprague tool. ‘Age 18 pop. adjusted using LURITS’ represents a downward adjustment of the Stats SA estimate, based on age patterns for grades below Grade 12 in the DBE’s LURITS data, plus Stats SA household-derived school participation ratios, using the approach of Department of Basic Education (2016b: 61).
Figure 37 illustrates the ratios seen in the above table.
Figure 37: Percentage of youths obtaining the NSC
30
35
40
45
50
55
60
65
70
EC FS GP KN LP MP NC NW WC SA
% o
f y
ou
ths
wh
o o
bta
ined
an
NSC
2013 est. 2016-2018 est. (GHS)
2017 est. with MYPE pop. 2017 est. with adjusted pop.

99
If the picture of Grade 12 attainment by age – as in Figure 9 – is broken down by gender, as in
Figure 38 below, the worsening gender gap in favour of girls becomes clear. In 2018, females
aged 22 to 25 were more likely to have successfully completed Grade 12 than males, the
difference being 6 six percentage points. In 2012, the female advantage came to a slightly lower
five percentage points, but in 2004 males of this age group were ahead by one percentage point.
Thus, although more males and females have been completing Grade 12 over time, progress
has been substantially faster for females, resulting in the current female advantage. This is
part of a larger phenomenon seen in many countries around the world whereby females out-
perform males in the education system according to key indicators. In South Africa, the Grade
12 gender inequalities are mirrored in much higher graduation rates for females than males at
universities154.
Figure 38: Grade 12 attainment among youths by gender
Source: Stats SA’s General Household Survey. Note: Smoothing as for Figure 9 used.
Indicator 13.2 deals with the attainment of the NSC or anything equivalent outside the
schooling system. Earlier findings that very few youths obtain some equivalent qualification
without also having an NSC are supported by recent data. The data behind Figure 39 below
indicate that in 2016 just 18% of youths enrolled in TVET colleges reported having successful
completion of Grade 11 or below as their highest level of education. General Household Survey
data from 2018 suggest this remained more or less unchanged in 2018. Assuming a three-year
college programme, this would be roughly compatible with up to 3% of youths obtaining a
qualification other than the NSC at the same level (NQF level 4) without also holding an NSC.
In other words, the current value for the Indicator 13.2 is up to around 3 percentage points
higher than the value for the Indicator 13.1. This puts it at around 55% (last value in Table 14
plus three percentage points). With DHET’s information systems on TVET college enrolments
currently reaching maturity, it should become easier in future to link school and college data
at the student level to monitor transitions between the two in better ways.
154 Van Broekhuizen and Spaull, 2017.
25
30
35
40
45
50
55
60
20 21 22 23 24 25 26 27 28
Pe
rce
nta
ge
of
yo
uth
s
Age
2018 F
2018 M
2012 F
2012 M
2004 F
2004 M
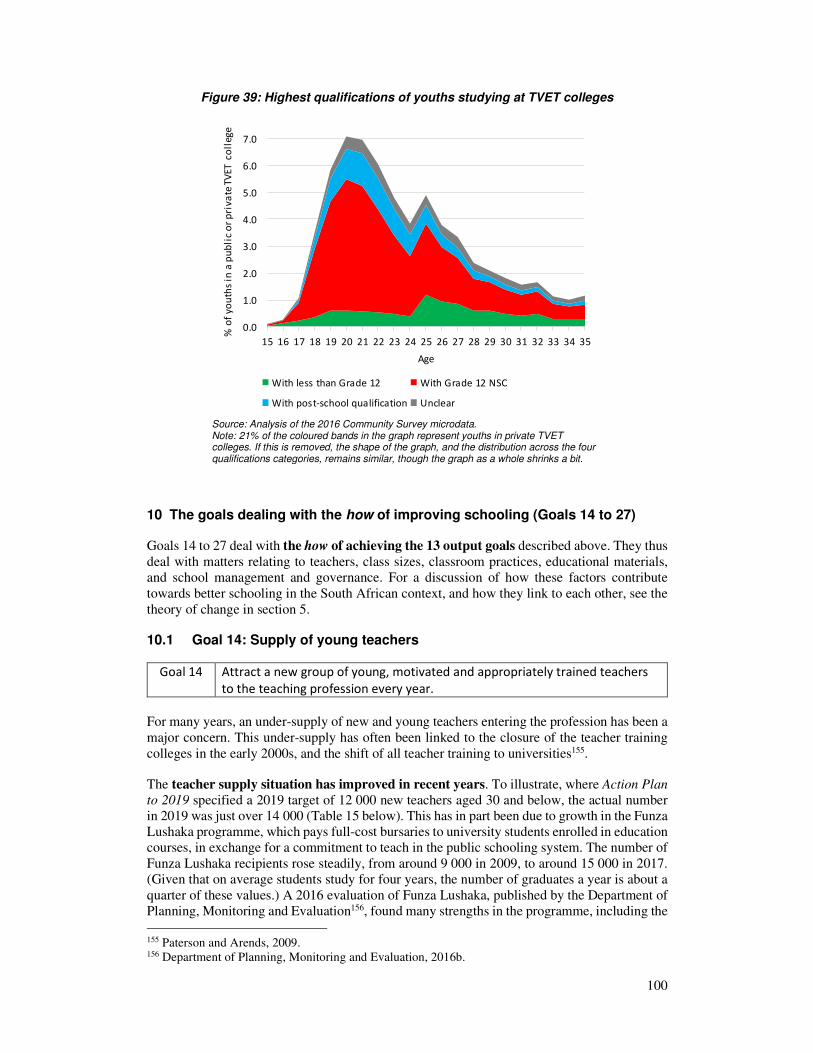
100
Figure 39: Highest qualifications of youths studying at TVET colleges
Source: Analysis of the 2016 Community Survey microdata. Note: 21% of the coloured bands in the graph represent youths in private TVET colleges. If this is removed, the shape of the graph, and the distribution across the four qualifications categories, remains similar, though the graph as a whole shrinks a bit.
10 The goals dealing with the how of improving schooling (Goals 14 to 27)
Goals 14 to 27 deal with the how of achieving the 13 output goals described above. They thus
deal with matters relating to teachers, class sizes, classroom practices, educational materials,
and school management and governance. For a discussion of how these factors contribute
towards better schooling in the South African context, and how they link to each other, see the
theory of change in section 5.
10.1 Goal 14: Supply of young teachers
Goal 14 Attract a new group of young, motivated and appropriately trained teachers
to the teaching profession every year.
For many years, an under-supply of new and young teachers entering the profession has been a
major concern. This under-supply has often been linked to the closure of the teacher training
colleges in the early 2000s, and the shift of all teacher training to universities155.
The teacher supply situation has improved in recent years. To illustrate, where Action Plan
to 2019 specified a 2019 target of 12 000 new teachers aged 30 and below, the actual number
in 2019 was just over 14 000 (Table 15 below). This has in part been due to growth in the Funza
Lushaka programme, which pays full-cost bursaries to university students enrolled in education
courses, in exchange for a commitment to teach in the public schooling system. The number of
Funza Lushaka recipients rose steadily, from around 9 000 in 2009, to around 15 000 in 2017.
(Given that on average students study for four years, the number of graduates a year is about a
quarter of these values.) A 2016 evaluation of Funza Lushaka, published by the Department of
Planning, Monitoring and Evaluation156, found many strengths in the programme, including the
155 Paterson and Arends, 2009. 156 Department of Planning, Monitoring and Evaluation, 2016b.
0.0
1.0
2.0
3.0
4.0
5.0
6.0
7.0
15 16 17 18 19 20 21 22 23 24 25 26 27 28 29 30 31 32 33 34 35
% o
f yo
uth
s in
a p
ub
lic
or
pri
va
te T
VET
co
lleg
e
Age
With less than Grade 12 With Grade 12 NSC
With post-school qualification Unclear

101
fact that the bursaries were sufficient to cover the needs of students, and a recruitment drive
aimed at secondary schools which appears to work well.
What would also have promoted the supply of young teachers is improvements in the outcomes
of the schooling sector (as described in section 6.2). More youths attaining critical thresholds
in the Grade 12 examinations means universities are able to accept more students across all
faculties.
The challenge is not just to attract larger numbers of young graduates into teaching, but to
encourage exceptionally talented youths to enter the profession. The DBE tracks what new
teachers achieved when they were in Grade 12, and the findings are encouraging. Among
learners in Grade 12 in the years 2008 to 2011 who took English first additional language
(EFAL) – 81% of Grade 12 learners do – those who became teachers were clearly among the
best performers. Specifically, half of those learners who became teachers were among the
top one-sixth of learners when it came to performance in EFAL.
A clear challenge in the coming years will be funding for Funza Lushaka. Current budgets
project a decline in Funza bursary recipients, with the number dropping to 12 500 by 2021. A
part of the challenge is to ensure that other funding streams directed at pre-service training are
used effectively. Only around a quarter of young people who graduate as teachers are Funza
Lushaka bursary recipients. A large part of the remaining three-quarters are recipients of other,
less favourable, state funding within the broader National Student Financial Aid Scheme
(NSFAS), through which even Funza Lushaka funding flows.
One of the recommendations of the 2016 review of Funza Lushaka, was that the placement of
Funza Lushaka graduates in schools should be improved, with a view to improving access among historically disadvantaged learners to good teachers. This, in fact, was also a
recommendation of the National Development Plan.
Indicator 14. The number of qualified teachers, aged 30 and below, entering the public
service as teachers for the first time during the past year.
Indicator 14 is one of many important statistics relating to the complex matter of educator
supply and demand. Indicator 14 deals with the supply side. On the demand side, the need for
new educators changes over time, for instance due to the age profiles of educators and how
many educators reach retirement age each year.
In Figure 40 below, the red curve illustrates the trend for educators joining as employees of the
nine provincial education departments, while the green curve reflects the sub-set of these joiners
aged 30 or below on joining. Since around 2013, there has been a clear upward trend. During
this period, around 57% of joiners have been young, in the sense of aged 30 or below. The
average age of educators represented by the green curve, for the 2013 to 2019 period, is 25.
Those represented by the red curve, in other words joiners of any age, display an average age
of 32. Yet 30% joiners since 2013 have been older than 35. The method used to calculate joiners
is aimed at excluding people who exit and then re-enter the system soon thereafter. The numbers
must continue to rise if the demand for teachers in the public system is to met.

102
Figure 40: Educators joining the public service 2007-2019
Source: Persal payroll data and, for initial teacher graduates, the 2019/20 Annual Performance Plan of the Department of Higher Education and Training. Note: The two joiner curves follow a ‘four-year approach’, described in Department of Basic Education (2018e), where someone is considered a joiner if he or she did not appear in the payroll data in any of the previous three years (thus four years of data are used to make the determination). To explain the efficacy of this approach, of the 14,267 joiners aged 30 or below in 2019 illustrated in the graph (these people would not have been present in the data in the years 2016 to 2018), as many as 14,096 were not present in the Persal data in any year in the longer 2004 to 2018 period. The graduates curve reflects the last year of study which led to the graduation.
The black curve in Figure 40 illustrates the number of initial teacher graduates emerging from
universities each year. While this curve appears to follow the total joiners curve closely, this
does not mean that all graduates are being absorbed into the public system. Many graduates
move into private teaching posts, in both independent and public schools, and some joiners
received their training many years ago, or outside South Africa.
Table 15 below reflects recent Indicator 14 values by province, using the method explained in
the footnote to Figure 40.
Table 15: Joiners aged 30 and below per province 2016-2019
2016 2017 2018 2019
EC 1,230 1,157 1,483 1,667 FS 1,046 788 912 811 GP 2,844 3,606 2,589 2,555 KN 3,405 2,616 2,168 3,036 LP 990 1,178 1,459 1,500 MP 1,027 1,077 1,081 1,149 NC 392 414 348 351 NW 1,002 1,028 350 1,525 WC 1,258 1,423 1,575 1,673 SA 13,194 13,287 11,965 14,267
Figure 41 below illustrates the age distributions of publicly employed educators per province
in 2019. Limpopo and Eastern Cape display particularly large bulges of educators close to
retirement age, while a province such as KwaZulu-Natal displays a more even age distribution.
This has important implications for teacher demand. Limpopo and Eastern Cape are more
likely to require relatively large numbers of joiners in the near future to respond to a surge
in retirements.
0
5,000
10,000
15,000
20,000
25,000
30,000
20
07
20
08
20
09
20
10
20
11
20
12
20
13
20
14
20
15
20
16
20
17
20
18
20
19
Join
ers
All joiners
Joiners aged 30 and below
Initial teacher graduates

103
Figure 41: Age distribution of educators in 2019
Source: Persal payroll data.. Note: All publicly employed educators, including those on temporary contracts, were counted.
Table 16 compares teacher supply to an indicator of demand. Eastern Cape and Limpopo had
relatively low levels of joining in recent years – see the two ‘A / C’ and ‘B / C’ columns. At the
same time, and as already discussed, these two provinces are likely to experience a particularly
high demand for educators in the near future – see the final column of Table 16.
Table 16: All joiners per province 2016-2019
2016-2019 annual joiners
aged 30 and below (A)
2016-2019 annual joiners
any age (B)
2016-2019 annual
educator count (C)
A / C (%)
B / C (%)
Peak in age distribution
(%)
EC 1,384 2,765 55,018 2.5 5.0 6.1 FS 889 1,269 23,664 3.8 5.4 4.6 GP 2,899 4,905 71,263 4.1 6.9 4.4 KN 2,806 4,975 97,652 2.9 5.1 4.1 LP 1,282 2,248 53,298 2.4 4.2 6.4 MP 1,084 1,826 34,306 3.2 5.3 5.4 NC 376 775 10,676 3.5 7.3 4.5 NW 976 1,593 26,831 3.6 5.9 5.3 WC 1,482 2,486 33,077 4.5 7.5 4.3
SA 13,178 22,841 405,785 3.2 5.6 4.9
Note: The first three columns represent averages across the four years 2016 to 2019. The last column reflects the heights of the peaks of Figure 41.
Nationally, joiners of any age as a percentage of all educators, at 5.6%, exceeds the national
peak, at 4.9% of all educators. This is good as it suggests the supply of joiners is roughly able
to deal with the future demand. However, the fact that annually young joiners comes to 3.2%
of the workforce is cause for concern and underlines the need to have more young graduates
enter publicly funded educator posts.
0.0
1.0
2.0
3.0
4.0
5.0
6.0
7.0
15
20
25
30
35
40
45
50
55
60
65
% o
f ed
uca
tors
at
this
age
Age
EC
FS
GP
KN
LP
MP
NC
NW
WC

104
10.2 Goal 15: Teacher availability and class sizes
Goal 15 Ensure that the availability and utilisation of teachers are such that
excessively large classes are avoided.
The problem of over-sized classes in the schooling system remains worrying. As illustrated
in Figure 43 below, South Africa’s class sizes emerge as high in an international comparison.
A large part of the problem is the high cost of teachers, relative to GDP per capita, which means
that South Africa employs few teachers relative to school enrolments157. This structural problem
is difficult to change. However, there are other factors relating to the efficiency of teacher
utilisation. As seen in the discussion of the relevant indicator below, more efficient provinces
are able to reduce the presence of excessive class sizes through better timetabling and
management practices.
A further measure which could reduce class sizes is reducing grade repetition, in particular in
the early grades, where large classes make innovative teaching practices difficult to implement.
UNESCO data confirm that repetition in the early grades is high in South Africa. Of 152
countries with figures on the percentage of Grade 1 learners who are repeaters for the years
2015 to 2019, South Africa’s figure of 13% is position 16 from the top. Countries with less
than 5% of Grade 1 learners being repeaters include Mozambique, Thailand, Indonesia,
Kenya, Ghana and Philippines158.
As explained in the theory of change in section 5, incentives to teach in disadvantaged schools
can reduce the current problem whereby large classes tend to be found in remote and historically
disadvantaged schools.
An often overlooked factor is that the radical demographic shifts expected in the teaching force,
as a result of the surge in retirements discussion in section 10.1, is expected to reduce the
average age of teachers, and hence their average cost. Younger teachers are placed lower down
on the salary scales. Some estimates have suggested that this factor could allow for 10% more
teachers to be employed by 2033, relative to the current situation, at current budget trends.
Demographic changes in the educator force clearly do create a window of opportunity for
employing more teachers and lowering South Africa’s learner-educator ratios so that they
approximate more ratios seen in other middle income countries.
Indicator 15.1. The percentage of learners who are in classes with no more than 45
learners.
Indicator 15.2. The percentage of schools where allocated teaching posts are all filled.
According to TIMSS 2015 data, 25% of learners in Grade 5 were in classes exceeding 45
(the figure becomes 26% if one excludes independent schools). According to PIRLS 2016 data,
30% of learners in Grade 4 were in classes exceeding 45. If one goes back to PIRLS 2011 Grade
4, 31% of learners were in classes exceeding 45. According to this, the situation at the primary
level does not appear to have changed much. However, changes at the extreme top end have
shifted the averages substantially, according to PIRLS. In PIRLS, the percentage of learners in
classes exceeding 55 increased from 13% to 18% between 2011 and 2016. This largely explains
the increase in the average class size for Grade 4 reported in the national PIRLS 2016 report,
from an average of 40 in 2011 to 45 in 2016159.
157 Department of Education, 2007. 158 Indicator ‘Percentage of repeaters in Grade 1 of primary education, both sexes (%)’ on UIS.Stat. 159 Howie et al, 2017: 171.

105
TIMSS and PIRLS data thus point to around 70% of primary level learners not being in
classes exceeding 45 learners.
International testing systems such as PIRLS and TIMSS provide a convenient data source for
class size statistics. However, the ideal data source is the Learner Unit Record Information
Tracking System (LURITS). This national data source, which draws from provinces, which in turn draw from the South African School Administration and Management System (SA-
SAMS) operating at schools, includes details on each learner, and their ‘registration class’,
which can serve as a basis for calculating class size. LURITS is largely operational in the DBE,
though completeness is still a problem, and tools required to extract statistics need to be
strengthened.
Trends over time with regard to registration class statistics are not readily available. However,
as explained in section 6.1 above, learner-educator (LE) ratios have been rising nationally
(in other words worsening) since around 2011, though they appear not be as high as they once were, around 2005. The rise has been about 1,4, from 31,0 learners per educator in 2011,
to 32,4 in 2017. One can expect class sizes to have risen to the same degree.
The provincial breakdowns of the trends in the overall LE ratio illustrated in earlier Figure 4
are shown in Table 17 below. All provinces except for Northern Cape have seen a worsening
(an increase) in the LE ratio, with the steepest increases being in Limpopo, Free State (off a
low base) and Western Cape.
Table 17: Provincial LE ratio trends 2011-2017
Average overall LE ratio 2011 to 2017
Annual change 2011 to 2017 (annual slope)
EC 31.5 0.4 FS 29.0 0.6 GP 33.5 0.2 KN 32.0 0.1 LP 31.9 0.8 MP 31.3 0.0 NC 32.2 -0.1 NW 32.1 0.3 WC 32.5 0.5
SA 31.8 0.3
Though the availability of teachers and LE ratios clearly influence class size, there are other
factors relating to the efficient utilisation of teachers. This can be seen in Figure 42 below,
which analyses the situation in primary schools. This graph compares the LE ratios at the level
of the school to the prevalence of large classes. There are important inter-provincial differences. In three provinces – Free State, Northern Cape and Gauteng – there is a lower prevalence of
very large classes, compared to five other provinces even when schools with similar LE ratios
are compared (Western Cape is not included in this comparison). For instance, in schools in
the three ‘efficient provinces’ with an LE ratio of around 30 learners per educator, around 25%
of learners are in classes exceeding 40. In, say, Eastern Cape or Limpopo, schools with a similar
LE ratio of 30 would display around 60% of learners in classes exceeding 40. Why is this the
case? The evidence suggests that timetabling and general practices around the management of teacher time account for many of the differences. This suggests that efficiency measures in
provinces such as Limpopo are part of the solution required to reduce over-sized classes.

106
Figure 42: School LE ratios and class size
Source: 2015 LURITS data. Note: Only schools with no grade above Grade 7 were included in this analysis. Western Cape has been excluded due to data completeness problems, but the data for this province which are available place the provincial curve close to the bottom of the graph, indicating a high degree of efficiency.
Figure 43 below confirms that in an international comparison, South Africa’s class sizes
emerge as high. Half of South Africa’s Grade 4 learners are in classes exceeding 40 (see
‘ZAF’), against just 20% in Morocco (MAR), 16% in Indonesia (IDN) and 14% in Chile (CHL).
Figure 43: International comparison of Grade 4 class sizes
Source: TIMSS microdata available on the international TIMSS website.
0
10
20
30
40
50
60
70
80
17 18 19 20 21 22 23 24 25 26 27 28 29 30 31 32 33 34 35 36 37 38
% o
f le
arn
ers
in
cla
sse
s e
xc
eed
ing
40
School LE ratio
EC
FS
GP
KN
LP
MP
NC
NW
10
15
20
25
30
35
40
45
50
55
60
1 11 21 31 41 51 61 71 81 91
Pu
pil
s p
er
cla
ss
Percentiles of pupils
CHL FIN GEO HKG IDN IRN JOR
JPN KAZ KOR MAR OMN PRT RUS
SAU SGP TUR USA ZAF

107
Turning to Indicator 15.2, the 2017 School Monitoring Survey found that 80% of primary
schools and 72% of secondary schools had all allocated teaching posts filled160. Importantly,
any level 1 teaching post filled by either a permanent or temporary employee was considered a
filled post for the purposes of this indicator. The indicator values were far worse in Eastern
Cape than in any other province: 65% for primary, 56% for secondary. Eastern Cape is
moreover the only province where a substantial percentage of schools have fewer than 75% of
posts filled.
There appears to have been an improvement since 2011, when the previous School
Monitoring Survey was run, though problems in the 2011 data with regard to this indicator
mean comparability over time has been compromised.
10.3 Goal 16: Teacher capacity and professionalism
Goal 16
Improve the professionalism, teaching skills, subject knowledge and computer
literacy of teachers throughout their entire careers.
While many in the basic education sector have successfully promoted teacher professionalism,
and while South Africa’s public schooling system has many dedicated and capable teachers, it
is still widely acknowledged that much must still be done to raise levels of teacher capacity and
professionalism. This task is very much about overcoming the historical legacy of apartheid
teacher training described in section 1. As discussed below, what is very encouraging is clear
evidence pointing to younger teachers emerging from the post-2000 university-based
training system displaying, on average, much higher levels of subject content knowledge
then their older peers.
Education departments and teacher organisations have worked closely on building systems to
monitor and advance professionalism. Yet there is much work still to be done. One achievement
was South Africa’s joining the Teaching and Learning International Survey (TALIS). This
survey, which gathered data from a national sample of just over 2 000 South African lower
secondary teachers in 2017, produces comparable information on the teaching profession across 48 countries, providing an excellent basis for assessing where South Africa’s successes and
failures lie161.
Advancing professionalism is in part about having clear norms and standards governing the
profession, while providing enough space for teachers to be creative and thus exercise their
professionalism. During 2019, an important process was concluded whereby section 4 of the
CAPS162 curriculum guides were amended. The result is a reduction in what had been
described as an overly burdensome demand for formal assessments, such as tests and
assignments, and more space for actual teaching and learning, and for teacher-driven formative,
but also diagnostic, assessment. Formative assessment is relatively informal and is aimed in
part at identifying who in the class is behind when it comes to specific skills. Diagnostic
assessment is more formal, but still teacher-driven, and is aimed at designing some form of
remediation.
The need for more standardised information on the performance of schools, in particular
primary schools, described in section 5, remains a challenge, but this does not conflict with the
correctness of providing teachers more leeway when it comes to how teacher-driven
assessment in the classroom is organised.
160 Department of Basic Education, 2019b: 31. 161 Department of Basic Education, 2019g; OECD, 2018. In South Africa, the collection of TALIS data
occurred in late 2017. 162 Curriculum and Assessment Policy Statement.
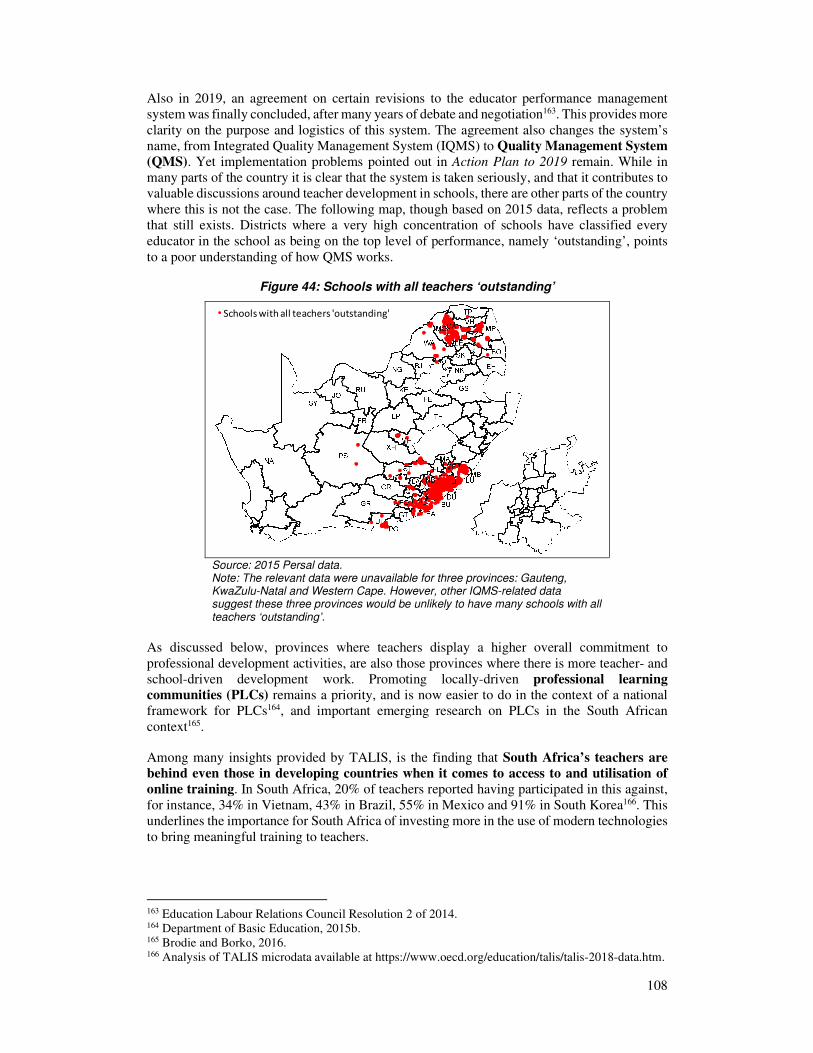
108
Also in 2019, an agreement on certain revisions to the educator performance management
system was finally concluded, after many years of debate and negotiation163. This provides more
clarity on the purpose and logistics of this system. The agreement also changes the system’s
name, from Integrated Quality Management System (IQMS) to Quality Management System
(QMS). Yet implementation problems pointed out in Action Plan to 2019 remain. While in
many parts of the country it is clear that the system is taken seriously, and that it contributes to
valuable discussions around teacher development in schools, there are other parts of the country
where this is not the case. The following map, though based on 2015 data, reflects a problem
that still exists. Districts where a very high concentration of schools have classified every
educator in the school as being on the top level of performance, namely ‘outstanding’, points
to a poor understanding of how QMS works.
Figure 44: Schools with all teachers ‘outstanding’
Source: 2015 Persal data. Note: The relevant data were unavailable for three provinces: Gauteng, KwaZulu-Natal and Western Cape. However, other IQMS-related data suggest these three provinces would be unlikely to have many schools with all teachers ‘outstanding’.
As discussed below, provinces where teachers display a higher overall commitment to
professional development activities, are also those provinces where there is more teacher- and
school-driven development work. Promoting locally-driven professional learning
communities (PLCs) remains a priority, and is now easier to do in the context of a national
framework for PLCs164, and important emerging research on PLCs in the South African
context165.
Among many insights provided by TALIS, is the finding that South Africa’s teachers are
behind even those in developing countries when it comes to access to and utilisation of
online training. In South Africa, 20% of teachers reported having participated in this against,
for instance, 34% in Vietnam, 43% in Brazil, 55% in Mexico and 91% in South Korea166. This
underlines the importance for South Africa of investing more in the use of modern technologies
to bring meaningful training to teachers.
163 Education Labour Relations Council Resolution 2 of 2014. 164 Department of Basic Education, 2015b. 165 Brodie and Borko, 2016. 166 Analysis of TALIS microdata available at https://www.oecd.org/education/talis/talis-2018-data.htm.
Schools with all teachers 'outstanding'

109
Inequalities across provinces can be seen in the following graph. Clearly, teachers in Eastern
Cape and Limpopo are particularly behind when it comes to the resources, skills and
motivation required to explore the internet to obtain teaching materials to suit their needs.
Figure 45: Grade 6 teacher use of the internet for teaching materials
Source: 2017 School Monitoring Survey data.
Indicator 16.1. The average hours per year spent by teachers on professional development
activities.
Indicator 16.2. The percentage of teachers who are able to attain minimum standards
in anonymous and sample-based assessments of their subject knowledge.
The average hours per year spent by teachers on professional development has remained
at about half of what is commonly considered the ideal, namely 80 hours per year. This 80-
hour figure represents the maximum time in a year that the employer may involve educators in
employer-driven training167. Action Plan to 2019 has a 2030 target of 80 hours for Indicator
16.1, the 2019 target being 70 hours.
In 2011, the actual average was 36 hours, and by 2017 this had reached 40 hours. This is
according to the School Monitoring Survey for these two years168. This change was driven largely by improvements in Gauteng and Western Cape. In 2017, the figures were 76 hours in
Western Cape, and 50 hours in Gauteng. The next best province was Free State, with 44 hours.
In all these three provinces, self-initiated and school-initiated professional development
activities accounted for over half all the hours spent. This underlines the importance of
creating opportunities and non-monetary ‘soft’ incentives for schools and teachers to pursue
development activities on their own accord. Many educators continue to spend very little time
on professional development activities: half spent 17 hours or less in 2017 (in 2011, half spent
12 hours or less).
One thing that would explain the relatively good performance of Free State and Gauteng against
this indicator is the fact that in these two provinces 75% and 62% of teachers respectively
167 Education Labour Relations Council (ELRC) Resolution 1 of 2000. 168 Department of Basic Education, 2019e: 35-7.
0
10
20
30
40
50
60
70
80
90
100
EC FS GP KN LP MP NC NW WC SA
% o
f G
rad
e 6
te
ach
ers
an
d f
req
ue
ncy
of
us
e
of
inte
rnet
to
ob
tain
ma
teri
als
fo
r te
ac
hin
g
Never Sometimes Often Always

110
are in schools where professional learning communities have been set up. Across the
remaining provinces, the figure is just 40%. Details appear in Table 18 below.
Table 18: Teachers in a school with at least one PLC in 2017
% at the primary level
% at the secondary
level % overall
EC 27 28 27 FS 72 81 75 GP 59 68 62 KN 51 50 51 LP 27 29 28 MP 40 40 40 NC 37 50 43 NW 41 46 43 WC 48 56 51
SA 45 48 46
Source: Analysis of School Monitoring Survey 2017 data. Note: Teachers are asked the following question: ‘Does your school have a Professional Learning Community (PLC)?’.
Turning to Indicator 16.2, dealing with the subject knowledge of teachers, the SACMEQ 2013
data, which became available for analysis in 2017, offer the most recent nationally
representative information on what teachers know. Though the national and provincial
departments have been engaged in the assessment of teachers, the focus here has been on the use of pre- and post-tests to assess the efficacy of teacher training interventions. The focus
currently of these initiatives is not to produce nationally representative statistics. A protocol
governing these types of initiatives was published in 2019169.
Table 19 below provides the percentage correct scores from the 2007 and 2013 SACMEQ
teacher tests, using only those questions which appeared in both years, to make results
comparable. Nationally, there appears to have been a small improvement, but it is
disappointingly small170. Improvements between 2007 to 2013 with respect to learners were
much larger (see section 9.3). What is noteworthy, is how the provinces with the greatest
burdens of poverty, and the worst learning outcomes among learners, are precisely those
provinces whose teachers experience the largest subject knowledge gaps. This underscores
the need for a more equitable distribution of teaching skills.
169 Department of Basic Education, 2019h. 170 Earlier reports of a significant decline in teacher test results, particularly in reading, have, after
careful analysis of the SACMEQ data, been found to be incorrect. This error arose as a result of
problems in the conversion from the raw data to ‘IRT scores’.

111
Table 19: Percentage correct in the SACMEQ teacher tests
Reading based on 23
common items Mathematics based on
20 common items
2007 2013 2007 2013
EC 62 64 46 55 FS 68 63 54 55 GP 69 69 56 60 KN 67 67 51 51 LP 64 68 48 47 MP 66 67 39 55 NC 70 70 55 58 NW 71 72 51 44 WC 74 76 64 63
SA 67 68 51 54
Figure 46 below illustrate one very positive pattern seen in the SACMEQ teacher test data.
Clearly, younger teachers perform exceptionally well in the SACMEQ mathematics subject
knowledge test. The closeness of the 2007 and 2013 data in this regard is striking. Similar
patterns emerge if one considers the results in the teacher reading comprehension tests. The
ages of the teachers with better subject knowledge suggests that this pattern is closely linked to
the shift of all teacher training to universities around 2000. South Africa’s teacher knowledge
has been a little below average among SACMEQ countries. However, had all teachers
displayed the knowledge levels of teachers who graduated in around 2005 or later, South Africa
would have displayed, for instance, the third-highest mathematics knowledge levels among
teachers in SACMEQ, after Kenya and Zimbabwe. What this suggests is that basic demographic effects, or waiting for more young teachers to enter the system, could be the factor that will
impact most on teacher competencies over the longer term.
Figure 46: Teacher mathematics performance by age
Source: Analysis of the SACMEQ microdata. Note: The classical score represented by the vertical axis is based on 20 items which were common across the 2007 and 2013 SACMEQ teacher tests. Ages of teachers in the 2007 data were incremented by six years in order to align the two curves.
40
45
50
55
60
65
70
75
80
20 30 40 50 60 70
Cla
ssic
al
test
sco
re (
ou
t o
f 1
00
)
Age in 2013
2007 2013

112
10.4 Goal 17: Teacher well-being and job satisfaction
Goal 17 Strive for a teacher workforce that is healthy and enjoys a sense of job
satisfaction.
One of the benefits of the 2018 TALIS survey of lower secondary teachers is that it provides a
measure of teacher job satisfaction in South Africa, relative to that of other countries. The data
indicate that in South Africa, 78% of teachers are satisfied with their job. This is in fact low
compared to other TALIS participants. Only teachers in England displayed a lower level of
satisfaction171. The average for all TALIS countries was 90%.
Many of the challenges described in this Action Plan, from oversized classes to insufficient
access to modern technologies, impact negatively on teacher job satisfaction. On the positive
side, educators have continued to see their purchasing power rise in recent years. Relative to the consumer price index (CPI), the purchasing power of educator salary notches rose by
32% between 2007 and 2019, and by 10% between 2014 and 2019. This largely reflects the
above-inflation cost-of-living adjustments received over many years. In addition to this,
virtually all educators experience a notch progression each year. As a result of the 2018 wage
agreement172, this notch progression changed from 1.0% a year to a more beneficial 1.5% a
year, in line with practices in the rest of the public sector. The schooling system has thus done
relatively well in terms of rewarding educators, in monetary terms, for the work they do. The
key challenge lies in improving the working environment, and professional development
opportunities available to teachers.
Indicator 17. The percentage of teachers absent from school on an average day.
The 2017 School Monitoring Survey (SMS) found that 10% of educators were absent on the
day a field worker visited the school. The 2011 School Monitoring Survey arrived at a figure of 8%. Given that the SMS questionnaire wording changed, the two years are not fully
comparable, meaning no hard conclusions can be drawn in relation to the trend. Moreover, the
confidence intervals for the 2011 and 2017 statistics overlap. Confidence intervals, or margins
of error, exist as the survey is based on a sample173. In 2017, 37% of public school learners were
in schools where, on an average day, no educator was absent. If one examines reasons for
absenteeism, one finds that 4% of teachers in 2017 were absent on an average day due to illness.
The 2011 SMS produced a figure of 3%. If one breaks the 2017 indicator value of 10% down, one finds that 5% is due to personal matters (including illness, but also absence without
approved leave), 3% to study or examination leave, and 2% to work-related tasks such as
attending meetings.
Free State and Mpumalanga are provinces where in both 2011 and 2017, the absenteeism
levels were lower than the national average. Eastern Cape, in contrast, was the only province
to display above average levels of absenteeism in both years.
Looking more broadly at the utilisation of the time of educators, South Africa’s TALIS report
highlighted the problem of only 66% of classroom time being used for teaching and other
educational activities, as opposed to administrative tasks and keeping order in the classroom174.
This is the second-lowest level among all TALIS countries175. Clearly, this points to a problem
which would impact negatively on teacher satisfaction. However, this needs to be seen against
171 OECD, 2019a: 207. 172 Public Service Co-ordinating Bargaining Council (PSCBC) Resolution 1 of 2018. 173 Department of Basic Education, 2019b: 38; Department of Basic Education, 2019e: 40. 174 Department of Basic Education, 2019g: 77. 175 OECD, 2019a: 63, 143.

113
the fact that in TALIS, South Africa’s teachers emerge five places from the top when it
comes to the total amount of time in a week spent working in the classroom.
10.5 Goal 18: Curriculum coverage in schools
Goal 18 Ensure that learners cover all the topics and skills areas that they should cover
within their current school year.
This goal was introduced in the original Action Plan to 2014, in response to concerns that
learners were not covering everything in the curriculum, due to an insufficient focus on correct pacing within the school year. This remains a concern, but the concern has since widened to
encompass questions around whether parts of the curriculum demand too much in terms of the
breadth of topics, and not enough in terms of depth. Globally, there is an increasing interest
in whether developing countries, such as South Africa, attempt to cover too much in the
curriculum176. The revisions to the curriculum documents discussed in section 10.3 above,
involving a reduction in the number of assessment tasks, were in part aimed at allowing teachers
more time to complete the curriculum.
Government’s evaluation of the implementation of the school curriculum, published in 2017,
did not find that the curriculum was overly demanding. However, it pointed to serious time
management problems in the classroom, and in schools as a whole, which, if fixed, would
make it easier to cover the required topics in a year177.
Indicator 18. The percentage of learners who cover everything in the curriculum for their
current year on the basis of sample-based evaluations of records kept by teachers and
evidence of practical exercises done by learners.
Curriculum coverage is extensively monitored within schools, and by district-based subject
advisors who work with schools. What has proven difficult, however, is to systematise the
monitoring of curriculum coverage to the extent that comparable provincial and national
indicator values are produced. Yet the 2017 evaluation pointed to the need for this kind of
monitoring178. While the 2011 School Monitoring Survey did involve an analysis of learner
writing books, and resultant statistics on the volume of work (which is related to, but not the
same as, coverage of topics) were reported in Action Plan to 2019, the 2017 SMS did not include
this type of monitoring. This was largely due to budget constraints.
A key methodological concern is that while one should ideally examine the written work by
learners as it stands at the end of the school year, it is logistically difficult to gather
representative samples of learner books at this point in the year. A less ideal, but more practical,
approach is to examine books, say, halfway through the year, and then to weight curriculum
topics by time required, in a manner that allows evaluators to determine whether enough work
has been done. A further concern is that classes tend to be behind in terms of curriculum
coverage, meaning the percentage of learners covering the entire curriculum is seldom high.
What is thus important is to gauge how far behind learners are. If 90% of the expected volume
of topics has been covered, this is clearly a less serious problem than if the figure is just 50%.
Current attempts to systematise the monitoring of curriculum coverage should continue, as the
degree of coverage is a vital aspect of the overall education process. However, perhaps more
for this indicator than any other in the Action Plan, it must be accepted that experimentation
is necessary, and that margins of error around statistics will for many years remain wide.
176 Pritchett and Beatty, 2012. 177 Department of Planning, Monitoring and Evaluation, 2017a: 11. 178 Department of Planning, Monitoring and Evaluation, 2017a: 39.
114
Moreover, it is important to identify key grades and subjects in the schooling system on which
to focus, and which can serve as indications of general trends. At this stage, it is inefficient to
spread the focus across all grades and subjects.
One under-explored opportunity for gauging curriculum coverage is represented by item-level
test data, such as that from the international PIRLS and TIMSS programmes. To illustrate, the 2015 TIMSS Grade 4 mathematics results point to the content domain ‘geometric shapes and
measures’ being particularly weak in South Africa, when one compares to other TIMSS
countries179.
10.6 Goals 19 to 20: Educational materials
Goal 19
Ensure that every learner has access to the minimum set of textbooks and
workbooks required according to national policy.
Better access to the required books among learners is widely believed to explain much of
the improvement seen in South Africa’s results in the international assessment
programmes. Section 6.2 discussed the successes and challenges in this area. Various data
sources point to improvements in access to books. While a level of access of 100% has not been
reached yet, the system is close to achieving this (see the discussion in relation to Indicator 19
below). Improvements have been achieved through better budgets for learning materials, and
through various initiatives by the DBE aimed at lowering the average cost of each book. The
national workbooks programme has played a large role, and received mention as an example of
good practice in the 2013-2014 UNESCO Global Monitoring Report. The DBE has moreover
actively promoted better quality learning materials.
Apart from providing downloadable copies of key textbooks and workbooks on online, the DBE
has also developed digital and interactive versions of certain workbooks, meaning versions which can be viewed on devices such as tablets (see section 7.3). In the case of interactive
materials, learners receive immediate feedback, even if they are working at a different pace to
other learners in the classroom, of a kind not possible with conventional books. This has the
potential to greatly facilitate the work of the teacher. However, one drawback with digital
materials is that they require a relatively high-cost medium, such as a tablet, which schools may
in some cases not allow learners to take home with them. As discussed in section 6.2, the
learning process is facilitated if learners also have access to a wealth of educational
materials in the home. The national workbooks, which become the property of learners, has
assisted in making homes more ‘book rich’.
As explained in section 7.1, innovation in the way reading is taught in the early grades requires
specific materials. The 2017 School Monitoring Survey revealed that these materials are fairly
widely available. Graded readers were accessed by 90% of Grade 3 learners in 2017, with
the lowest levels of access seen in Mpumalanga (79%) and Limpopo (80%). Big Books were
accessed by 85% of Grade 3 learners, with Mpumalanga displaying the lowest figure at 77%.
Externally provided lessons plans were being used in the case of 82% of Grade 3 learners, with
78% of learners being in classes where plans produced by the DBE were used. Big Books and
externally provided daily lesson plans were slightly more common in historically disadvantaged
schools, while graded readers were a bit more common in historically advantaged schools.
179 Mullis et al, 2016: Exhibit 3.1; Department of Basic Education, 2017d.

115
Indicator 19. The percentage of learners having access to the required textbooks and
workbooks for the entire school year.
The primary data source for this indicator is the School Monitoring Survey. The 2011 SMS
concluded that 61% of learners had access to the required textbooks and workbooks for the
entire school year, on the basis of data on language and mathematics books shown by grades 6
and 9 learners to fieldworkers in the classroom180. The 2017 SMS arrived at a figure of 84%
for grades 6, 9 and 12, and a figure of 96% for Grade 3181, with respect to this indicator,
using somewhat different approaches to those used in 2011. In 2017, Grade 3 workbooks were
physically counted in the classroom by fieldworkers, and interviews with teachers were used as
a basis for the other grades. The evidence suggests that while the required access to books is
still not universal, it is high. There are many reasons why it is not 100%, including an
insufficient availability of books in the school to begin with, books being lost, and books being
left at home by learners.
The big advantage with the School Monitoring Survey is that it focusses on what truly matters,
namely learner access to books, and not for instance book deliveries to schools, which may not
translate to learner access. However, some other data sources confirm that access to books has
been improving in recent years. Section 6.2 above discusses improvements seen in the
TIMSS, SACMEQ and General Household Survey data.
Goal 20 Increase access amongst learners to a wide range of media, including
computers, which enrich their education.
The need to strengthen South Africa’s capacity to migrate to new educational technologies,
and the current situation with regard to access to technology, was discussed in section 7.3 above.
It is clear that learners need exposure and access to high-quality educational materials in the form of prescribed textbooks and workbooks, but also in the form of materials in the home, and
materials housed in a school library, or multimedia centre. Progress has occurred with regard
to the latter, but this has been slow. As discussed below, in relation to Indicator 20, learners
with access to a school library increased from 45% in 2011 to 62% in 2017.
The DBE, as part of its commitment to technology innovation aimed at strengthening education,
began a national initiative in 2017 involving the development of e-libraries in 100 historically
disadvantaged schools. These facilities are rich in digital materials, but over-reliance on the
internet is avoided by ensuring that most materials are off-line, meaning they are accessible even when there is no internet connection. This approach is currently optimal, in a context
where internet connections may not be stable. Lessons from this initiative will inform further
work by the national and provincial departments in this area.
Indicator 20. The percentage of learners in schools with a library or multimedia centre
fulfilling certain minimum standards.
The 2017 School Monitoring Survey revealed that 62% of learners were in schools with a
library or media centre. Access was almost the same across the primary and secondary levels.
The corresponding statistic for 2011 was 45%182. The situation is thus improving, though it
remains worrying that close to 40% of learners did not have access to a school library or media
centre in 2017. The largest provincial improvement was that of Limpopo. Despite this, in 2017
180 Department of Basic Education, 2013a: 16. 181 Department of Basic Education, 2019e: 46. 182 The 2011 value was 40% in Action Plan to 2019. The change is due a recalculation to ensure that
the 2011 and 2017 values, both based on the School Monitoring Survey, were as comparable as
possible.

116
Limpopo and Eastern Cape were the two provinces with the lowest values for this indicator
(45% and 43%)183.
10.7 Goal 21: School management
Goal 21
Ensure that the basic annual management processes take place across all
schools in the country in a way that contributes towards a functional school
environment.
The NDP on empowering capable school principals:
Gradually give principals more administrative powers as the quality
of school leadership improves, including in financial management, the
procurement of textbooks and other educational material, and human
resources management. These delegations ensure that principals are
held accountable for their schools. Provincial departments will
remain the employer of educators, and wages will continue to be
centrally determined. (p. 310)
This goal is a high priority goal in the Action Plan, and links closely with the NDP’s emphasis
on the school, and specifically the school principal, as agents of change. School management
is a complex process, which is sensitive to the socio-economic context of the school, the
leadership and management skills of the principal, the ability of the provincial and district
authorities to provide support and run effective accountability systems, and the level of trust
and agreement between various local actors, including school governing body members and
local teacher union representatives. The basic management processes referred to in Goal 21 are
just one part of effective school management, but they are important. They can be considered
building blocks on which a culture of effective management can be built. The absence of
these basic processes can be considered a ‘red flag’ pointing to the need for urgent remediation.
In recent years, improving financial management systems in schools has received
considerable attention. Following a report on financial mismanagement in schools by the
NGO Corruption Watch in 2015184, an Auditor-General report paid special attention to the
financial systems of schools185. Such systems need to function well, not just to counter
corruption, but also to enhance trust among school-level stakeholders, in part so that more time
can be devoted to educational issues, such as the academic progress of learners. In 2017, the
DBE issued national circulars to clarify how the provisions of the South African Schools Act (SASA) should be carried out186. For instance, they confirmed that bookkeeping and auditing
should be carried out by different people. In 2019, the South African Institute of Chartered
Accountants (SAICA), working with the DBE, released guidelines for the preparation of school
financial statements187. This work has demonstrated that many provinces still do not have the
capacity to fulfil their responsibilities in terms of SASA, and that to some extent the DBE needs
to play a more pro-active role.
The DBE remains committed to the use of competency assessments when candidates are
interviewed for school principal positions. This is something which the NDP has specifically
183 Department of Basic Education, 2019e: 55. 184 Corruption Watch, 2015. 185 Auditor-General, 2016: 39. 186 Circulars M1 and M3 of 2017. 187 South African Institute of Chartered Accountants, 2019.

117
called for. However, negotiations with organisations representing principals have proceeded
more slowly than expected. Yet the fact that competency assessments are on the policy agenda
is in itself raising awareness of the need for skilled individuals to occupy vacant principal
positions. This is important in the current context where a particularly large number of school
principals are reaching retirement age. The DBE has recently implemented competency
assessments for new district directors. By 2019, over 50 candidates for these positions had
undergone assessments. Lessons from this experience will inform the way forward with respect
to school principals. The NDP’s vision of skilful and committed school principals is obviously
not just a matter of competency assessments. It also requires clear guidance on financial
management, of the kind discussed above, and a very clear accountability framework which
explains how various systems relate to each other.
There is a need for more work on streamlining the various processes and documents school
principals must work with. As discussed below, the relationship between the school
improvement plan and the school’s academic improvement plan, remains unclear in the
minds of many principals. The 2017 School Monitoring Survey revealed that how the Quality
Management System (QMS) tools, which each staff member at each school uses to assess his
or her performance, fit into the broader system of quality assurance and accountability is not
sufficiently clear188. Section 5 explained how important a coherent accountability framework is
for educational improvement. The NDP moreover takes the position that the school principal is
a critical actor in this framework.
Indicator 21. The percentage of schools producing the minimum set of management
documents at a required standard, for instance a school budget, a school improvement plan,
an annual report, attendance registers and a record of learner marks.
Up till now, monitoring against this indicator, through the School Monitoring Survey (SMS),
has focussed mostly on the existence of specific mandatory documents at the school, as even the existence of these items has been found to be lacking. However, in 2017, the SMS included
some qualitative assessment of the management documents in question. The 2016 report of
the Auditor-General referred to above moreover provided insights into the strengths and
weaknesses of the financial statements of schools.
SMS data pointed to a decline in the percentage of schools able to show fieldworkers a full set
of ten management documents. The decline was from 44% of schools in 2011 to 31% in 2017189.
While this is disappointing, it should be noted that very strict criteria for calculating the
indicator were applied. For instance, if one of the ten documents was at the principal’s home, then the school would have ‘failed the test’. What is important is to look at the details behind
these indicator values. Of the ten documents, the one seen least in both 2011 and 2017 was the
academic improvement plan, which 78% of schools could show in 2011, and 66% in 2017. A
part of the problem is that many schools believe that academic improvement can be captured
within the separate school improvement plan. Only 13% of schools could show neither an
academic improvement plan nor a school improvement plan in 2017. This 13% of schools
represents 8% of learners – it tends to be smaller schools which are not able to show either plan.
Schools in Eastern Cape tend to be considerably weaker than schools in other provinces
when it comes to the presence of management documents. For instance, in 2017 20% of
Eastern Cape’s learners were in schools where neither the academic improvement plan nor the
school improvement plan was available for viewing by the fieldworker. Though the overall
188 Department of Basic Education, 2019i: 34. 189 Department of Basic Education, 2019e: 67. The 2011 value was 52% in Action Plan to 2019. The
change is due a recalculation to ensure that the 2011 and 2017 values, both based on the School
Monitoring Survey, were as comparable as possible.

118
indicator values were noticeably worse for secondary schools than for primary schools in 2017,
the availability of school plans was the same across the two levels.
10.8 Goal 22: Community participation
Goal 22 Improve parent and community participation in the governance of schools,
partly by improving access to important information via the e-Education
strategy.
The successful running of the 2018 school governing body (SGB) elections demonstrated once again the schooling system’s commitment to involving parents and communities in the
immense task of educational improvement. These elections, conducted across public schools in
the country, are the largest elections in the country, outside of the national, provincial and local
elections run by the Independent Electoral Commission. SGBs, and the various associations
which represent them, are vital for the strengthening of the national ‘education pact’ envisaged
by the NDP.
The 2016 Community Survey of Stats SA provided valuable insights into what communities
think of their public schools. Households were asked whether they rated ‘the local public
school’ as good, average or poor. For 69% of households making use of a school, the response
was ‘good’. Similar questions were asked about the local clinic, hospital and police station. In
virtually all municipalities, satisfaction with the school exceeded satisfaction with these
other non-education institutions. Yet, in parts of the country, a significant proportion of
households indicated they thought the local school was ‘poor’. This is illustrated in the
following map. Clearly, there are several districts in Eastern Cape and Limpopo where many in
the community, up to 22% of households in some areas, are not satisfied with the schooling they receive. These two provinces in fact display the worst statistics, of 10% and 8% not
satisfied respectively. Across the country, levels of satisfaction with primary and secondary
schools were similar.
Figure 47: Local-level satisfaction with schools (2016)
Source: Analysis of Community Survey 2016 microdata. Note: Provincial values, from best to worst are: Free State 4%; Western Cape and Northern Cape 5%; Gauteng 6%; Mpumalanga, KwaZulu-Natal and North West 7%; Limpopo 8%;
AE
AM
AW
BC
BJ
BO
CA
CW ED
EH
EN
ES
FE
FR
GE
GN
GS
GW
HE
HG
HW
IL
JC
JE
JG
JN
JO
JS
JW
KE
LP
MC
ME
MH
MN
MP
MS
NA
NE
NG NK
NM
NW
OV
PI
PS
RU
SB
SE
SK
SW
TC
TH
TI
TN
TS
TWUG
UK
UL
UM
UT UU
UY
VH
WA
WE
XH
ZM
ZU
% of households rating local school as poor
0.0% to 2.9%3.0% to 5.9%6.0% to 8.9%
9.0% to 11.9%12.0% to 22.0%

119
Eastern Cape 10%. Education district boundaries are marked in black – the meaning of the codes is explained in Table 22. See also note to Figure 14.
As explained in this Action Plan’s ‘theory of change’ (section 5), a key challenge is to ensure
that the involvement of communities in the affairs of their schools increasingly includes a
focus in what learners learn. The NDP’s accountability framework is useful: schools need to
be more accountable to parents and communities, but at the same time parents need to be
accountable to schools for ensuring that the best possible educational support is provided in the
home. School report cards which communicate the school’s success in, for instance, getting
children to read at an adequate level, are tools which warrant more attention. Similarly, simple
instructions given to parents and caregivers to monitor their children’s progress in reading can assist in getting parents more involved in the education process. This has proven to be effective
in other countries190. The DDD digital dashboards described in section 7.3, which currently
provide principals with valuable information relating to the school’s performance, relative that
in other, similar schools, could be made accessible to SGB members to produce a more
informed debate in each school around what to focus on.
Indicator 22. The percentage of schools where the school governing body meets the minimum
criteria in terms of effectiveness.
On the basis of the school principal’s opinion on the effectiveness of the school governing body
(SGB), as well as the availability of the minutes from the last three SGB meetings, the 2017
School Monitoring Survey concluded that 62% of schools were minimally effective in
terms of this indicator. This represented an improvement relative to 2011, when the indicator
value stood at 54%191. As with Indicator 21, which deals with school management processes,
primary schools emerged with slightly better indicator values, relative to secondary schools.
This is a bit worrying, as secondary schools require strong governance, given their larger sizes,
and the greater curriculum complexity at the secondary level.
10.9 Goal 23: School funding
Goal 23 Ensure that all schools are funded at least at the minimum per learner levels
determined nationally and that funds are utilised transparently and
effectively.
The school funding system has continued to focus strongly on ensuring that public funding is
sufficient and adequately ringfenced with respect to specific items, in order to minimise
pressure for parents to make financial contributions to the school. In this respect, the schooling
system has been relatively successful. Despite budget constraints in recent years, and the
inability of some provinces to reach national funding targets, the percentage of learners not
charged fees according to Stats SA household data has not risen. In fact, the percentage not
charged school fees, according to household data, has remained at around 66% since 2014192.
To put this in context, Stats SA has found the percentage of the population living in poverty in
recent years being between 25% and 55%, depending on the definition used193. Moreover,
190 Crouch, 2011. 191 Department of Basic Education, 2019e: 73. The 2011 value was 52% in Action Plan to 2019. The
change is due a recalculation to ensure that the 2011 and 2017 values, both based on the School
Monitoring Survey, were as comparable as possible. 192 Department of Basic Education, 2019j: 31. 193 Statistics South Africa, 2017: 15.

120
around 45% of households receive some form of government social grant194. No fee schooling
is extensive enough to cover those in need.
In the case of the 34% of learners who do pay school fees, the system relies on the school
governing body, but also government’s fee exemption policy195 applicable to learners from low-
income households, to keep fees in check. The monitoring of fee trends should be
strengthened, as this information can assist parents in knowing what annual increases are
reasonable. The monitoring which the DBE has undertaken has pointed to above-inflation
increases during the last ten years196.
Indicator 23.1. The percentage of learners in schools that are funded at the minimum
level.
Indicator 23.2. The percentage of schools that have acquired the full set of financial
management responsibilities on the basis of an assessment of their financial management
capacity.
The School Monitoring Survey (SMS) of 2017 found that 74% of learners were funded at
the minimum level, lower than the 79% figure emerging from the previous SMS 2011. The
decline reflects to a large degree the worsening budget situation when SMS 2017 was run.
However, a further factor is that at least for funding purposes, many schools previously
considered quintile 4 or 5 schools, have been reclassified at quintiles 1 to 3 schools. Given that
the latter group of schools is funded at a higher level, this has put a further strain on budgets.
This has occurred mostly in five provinces: Eastern Cape, Free State, Limpopo, Mpumalanga
and North West.
By far the lowest provincial indicator value recorded by the SMS 2017 was that of Eastern
Cape, at 45%. Levels at the primary and secondary levels across all provinces were roughly
similar197.
Turning to Indicator 23.2, the percentage of schools with financial management
responsibilities in three key areas – maintenance of the property, purchasing of
educational materials, and payment for services – declined substantially from 76% in
2011 to 57% in 2017. This is from the School Monitoring Survey198. Closer analysis of the data shows that at the national level virtually all the decline is due to a decline in management
responsibilities relating to learning materials (South African Schools Act section 21[c]
functions). Schools with these responsibilities dropped from 81% to 72%. This in turn was
driven mainly by fewer schools in Eastern Cape, KwaZulu-Natal and North West enjoying these
responsibilities. Responsibilities relating to learning materials in fact increased in Free State
and Mpumalanga. In the other provinces there was no major change here. Trends have thus
tended to be highly province-specific.
194 Statistics South Africa, 2019: 30. 195 Government Notice 869 of 2006; Government Notice 47 of 2011. 196 Department of Basic Education, 2017h: 6 197 Department of Basic Education, 2019e: 79. 198 Department of Basic Education, 2014c: 38; Department of Basic Education, 2019e: 85.
121
10.10 Goal 24: School buildings and facilities
Goal 24 Ensure that the physical infrastructure and environment of every school
inspire learners to want to come to school and learn, and teachers to teach.
The NDP on building more with the money we have:
Investigate the spiralling costs of building schools ... Develop
measures to build schools at a reasonable cost without compromising
quality. (p. 313)
While enrolments in public ordinary schools increased by 2,4% between 2014 and 2019, the
number of schools declined by 4% as a result of the closure of very small and non-viable schools, in particular primary schools. In fact, between 2014 and 2019, the number of public
ordinary schools dropped by about 1 000, from 24 060 to 23 076. This represented an
acceleration of a process that had been occurring before 2014. All provinces except Gauteng
saw a decline in the number of schools after 2014, with the largest declines being in Eastern
Cape – 349 fewer schools – and Free State – 17% fewer schools. The closure of non-viable
schools, which tended to have particularly poor physical infrastructure, can be considered
part of government’s efforts to improve access to adequate school infrastructure.
Expenditure on infrastructure development in the sector has suffered in recent years, as this budget item is often the first to be cut when budgets are constrained. Specifically, spending on
infrastructure dropped in real terms by 23% between 2015 and 2020. Yet in 2020,
infrastructure continued to account for 21% of all non-personnel spending in the sector (in 2015
this figure was 26%). The challenge remains to ensure that funds are spent as efficiently as
possible. This includes improving the availability to schools and the public at large of reports
on progress and delays in specific projects. Apart from improving the accountability of those
involved in the chain of infrastructure development, it helps schools plan for the future, and for
their own fund-raising activities199.
More fundamentally, however, it can still not be said that the schooling system has a cost-
effective model for developing and maintaining school infrastructure. Progress has been
made, in part through the involvement of a broader range of organisations and expertise in the
infrastructure development process. In particular, two DBE-led initiatives, the Accelerated
Schools Infrastructure Development Initiative (ASIDI), in existence since 2011, and the more
recent Sanitation Appropriate for Education (SAFE), have created space for experimentation
with new approaches. The challenge remains, however, to document and consolidate best
practices, and to advocate their use across the sector as a whole.
Indicator 24. The percentage of schools complying with a very basic level of school
infrastructure.
The 2017 School Monitoring Survey (SMS) reports draw from a set of infrastructure standards
published in a 2013 policy, specifically standards which all schools should have reached by
2016. In these standard200, all schools should be adequate with respect to: ‘power supply, water
supply and sanitation’. Using physical inspection criteria developed for the School Monitoring
Survey, and employed similarly in both the 2011 and 2017 runs of the surveys, it was concluded
199 While there is little information currently on how extensively schools themselves are engaged in
infrastructure activities, possibly through partnerships with donors, a 2009 survey found that around
quarter of schools were managing spending on ‘refurbishment of buildings and new buildings’. This
figure was similar across the five quintiles. See Department of Education (2009: 45). 200 Government regulation 920 of 2013.

122
that schools complying with all these basic standards remained unchanged between 2011
and 2017, at 59%. If one converts this into the percentage of learners in schools complying
with the standards one obtains higher values, of 72% for both years. This reflects the fact that
smaller schools tend to display worse physical infrastructure.
The criteria applied are fairly demanding. Running water had to be working when then
fieldworker was at school. The same applied to electricity. With regard to sanitation, schools
had to have adequate and separate toilets for boys, girls and teachers. Adequacy of toilets was
not determined by the number of toilets, but by their type. Toilets had to be flush toilets or
ventilated pit latrine or enviro-loo.
The lack of change in the indicator values came as a disappointment, given the effort and money
devoted to improving school infrastructure over many years. It is important to examine the data
in more detail to understand why the total values did not change. The presence of electricity
and toilets did in fact improve. However, a deterioration in access to running water resulted in there being no change in total values, and this in turn was related to drought and other broader
water supply issues. Clearly, a multitude of factors influence the physical environment of the
school.
Schools with electricity increased from 86% in 2011 to 90% in 2017201. Learners in such schools
went up from 92% to 95%. Schools with the required toilets increased from 75% to 80% of
schools (82% to 87% of learners). If one focusses just on toilets for learners, and ignores
separate toilets for teachers, then the percentage of learners in schools with the required
type of toilets was 91% in both 2011 and 2017.
However, schools with running water declined from 82% to 76% between the two survey years. A sharp decline in KwaZulu-Natal, from 78% of schools to 55% of schools, accounted for much
of this, though all provinces except for Eastern Cape and Northern Cape saw a decline. This is
a worrying trend, as an absence of water compromises the health of learners and staff, and
the entire education process. The trend is mirrored in water supply problems in households.
According to General Household Survey data, KwaZulu-Natal households experiencing
interruptions to their municipal supply of water increased from 39% to 51% between 2011 and
2017 (around four-fifths of households in the province accessed municipal water in both years).
This was the second-largest change, after that of Limpopo.
The School Monitoring Survey also focussed on the availability of classrooms, using standards
for this within the 2013 regulations. Essentially classroom availability was considered adequate
if the number of ordinary classrooms in a schools (excluding specialised classrooms such as
laboratories) exceeded total enrolment divided by 40. The percentage of learners in schools
with enough classrooms, using this standard, increased from 51% in 2011 to 55% in
2017202. This improvement occurred despite the fact that enrolments in public ordinary schools
increased from 11,8 million to 12,5 million between 2011 and 2017, an increase of 6%. Ensuring that the supply of classrooms increased faster than the demand accounts for much of
the spending of recent years. Yet the fact that in 2017 45% of learners were in schools where
there was not an adequate number of classrooms is concerning, though this should not be seen
in isolation from the problem of there also being too few teachers relative to enrolments (see
section 10.2 above).
201 Department of Basic Education, 2019b: 81; Department of Basic Education, 2014c: 40. 202 Department of Basic Education, 2014c: 41. For 2017, Department of Basic Education (2019b: 82)
provides a value of 67.4%, using the school weight. If one uses the learner weight, one obtains 54.8%.

123
10.11 Goal 25: Learner well-being
Goal 25 Use schools as vehicles for promoting access to a range of public services
amongst learners in areas such as health, poverty alleviation, psychosocial
support, sport and culture.
Though Statistics South Africa reports point to a rise in income poverty and unemployment in
recent years, hunger has not risen203. General Household Survey data point to the percentage of learners being in households experiencing child hunger in the preceding year declining from
17% in 2010 to 11% in 2018. It is very likely that close attention to protecting spending on the
National School Nutrition Programme (NSNP) has helped to prevent a deterioration of nutrition
among children. This focus on the NSNP must continue. Yet the fact that one in ten learners
occasionally suffer hunger, and the fact that physical stunting among children remains a real
problem is worrying. The NDP refers to a quarter of children suffering from stunting. This is
confirmed by the 2016 Demographic and Health Survey204. The fact that 27% of South Africa’s
children suffer from stunting puts the country in a slightly better position than Sub-Saharan
Africa as a whole (33%), but considerably worse than Latin America (9%). At the same time,
13% of South Africa’s children are overweight already before age eight, one of the worst figures
in the world205.
Clearly, the schooling system is one of many actors impacting on child nutrition. An in-depth
evaluation of the NSNP completed in 2016 found that this programme, whose funds are
protected through a national conditional grant, largely succeeds in fulfilling its purpose206.
Recommendations from the evaluation, for instance a stronger emphasis on vegetables and
protein in the meals, have been taken forward since 2016.
The Integrated School Health Programme (ISHP) has continued to provide important
screening and referral services at schools, with a special focus on grades 1 and 8 learners. This
helps to ensure that certain learners receive necessary treatments and assistive devices, such as
eyeglasses. Yet the programme needs strengthening and better human and financial
resourcing207. Over several years, the programme has reached about a third of Grade 1 learners,
and a quarter of Grade 8 learners, according to data of the departments of health208. The 2017
School Monitoring Survey data point to 58% of primary level learners being in schools where
at least some learners have been screened for vision, the figure for hearing being 53%. The
coverage suggested by these figures, while promising, is insufficient to ensure that all
vulnerable learners receive the necessary interventions. Stats SA data has consistently pointed
to access to eyeglasses among children from poor households being a third of what it is in the
middle class.
The coming years should see the emergence of a better system of scholar transport. Despite
the existence of national policy, this area of basic education service delivery has suffered from a lack of clarity around how learners are prioritised when resources are limited, how resourcing
can be improved, and how the safety of learners can be enhanced. For many years, just under
3% of learners accessed some form of scholar transport209. It is clear that this figure remains
too low, considering who needs this service.
203 Statistics South Africa, 2019: 66. 204 Department of Health, 2018: 179. 205 UNICEF, 2019: 222. 206 Department of Planning, Monitoring and Evaluation, 2016c. 207 Selebetswe and Mmapheko, 2018. 208 Bamford, 2019. 209 Department of Basic Education, 2019j: 28.

124
The mental health of learners, and of course staff, is also receiving attention, but more needs to
be done. Bullying and various forms of gender-based violence remain alarmingly high in
many parts of the schooling system. The problem starts in the early years. South African
Grade 5 learners report experiencing more bullying than their peers in all other countries
participating in TIMSS. Specifically, in 2015 44% of these learners reported being bullied every
week. At the secondary level, the level of bullying is also among the worst in the world210. The
TALIS survey points to South African school principals being the most concerned among their
TALIS peers about school violence211. South African research confirms that much of the
solution lies in a healthy school culture212. The problem of violence must be tackled holistically.
UNICEF’s multi-country Care and Support for Teaching and Learning (CSTL) initiative213, in
which the DBE is actively involved, has provided a useful framework for bringing together various South African initiatives aimed at reducing violence and advancing social cohesion,
and ensuring that these initiatives focus ultimately on improving the learning and teaching
process. Many of these initiatives use sports, arts and culture as means to achieve their goals.
Indicator 25. The percentage of children who enjoy a publicly funded school lunch every
school day.
Two completely separate data sources are able to provide annual information on this indicator.
It is important to compare the two, and to explain discrepancies, where these are significant.
On the one hand, Stats SA’s General Household Survey (GHS) asks representative samples of
households whether children and youths benefit from a publicly-funded meal at school each
day. These data point to 81% of learners receiving such meals in 2018. This figure has risen
gradually over time, and stood at 70% in 2010214. Importantly, these figures refer to all learners,
in public and independent schools. If one considers just learners from public schools, then the
2018 figure becomes 85%, not 81%. Converting the figure so that it applies to just public
school learners requires applying a ratio of independent school to public school learners from
official enrolment reports, and then making the logical assumption that virtually no learner in
an independent school receives a publicly funded meal. Though Stats SA household surveys do
ask households whether children go to a public or private school, responses are often unreliable
as households will commonly say that a public school charging fees is private.
The GHS also examines the frequency of meals received. Of those receiving meals in 2018,
89% reported receiving a meal ‘every day’, with the remainder being split about evenly
between ‘a few times a week’ and ‘sometimes’.
The other data source is provincial reports. As part of the management of NSNP funding and
service providers, provinces gather statistics on coverage. In some provinces, such as Free State,
household and provincial department figures are close to each other. In other provinces,
household values are considerably lower. For instance, in KwaZulu-Natal, official figures in
recent years of 94% coverage are higher than the around 85% seen in the household surveys
(here only public school learners are considered, and the 85% value includes any level of meal
frequency). Similarly, officially Limpopo’s coverage is 100%, against around 94% in the
household surveys. These discrepancies are not enormous, yet they warrant closer
attention as they could point to problems in the quality control of data in provinces.
210 Mullis et al, 2016: Exhibit 7.5. 211 Department of Basic Education, 2019g: 17. 212 Zuze et al, 2017. 213 Southern African Development Community, 2015. 214 Department of Basic Education, 2019j: 32.
125
10.12 Goal 26: Inclusive education
Goal 26 Increase the number of schools that effectively implement the inclusive
education policy and have access to centres that offer specialist services.
As explained below, an increasing percentage of learners are in schools which have
formally adopted a structure to deal with the issues of special needs learners. This reflects
the success of various initiatives, involving funding and training, to advance the inclusive
education philosophy. Yet around a quarter of learners are in schools which still lack the
necessary arrangements. This represents a challenge in the years ahead.
By 2020, over 800 full-service schools, ordinary schools with additional human and physical
resources needed to cater for more serious special needs within an inclusive environment, had
been declared. National targets in this regard were reached earlier than expected. However,
concerns that these full-service schools are not sufficiently equipped to deal with their new
responsibilities have been raised. This underscores the need for further capacity building.
Nonetheless, full-service schools as a strategy to address the needs of special needs learners, in
a context of resource constraints where not all schools can cater for the full range of needs, can
be considered a success and a model for other developing countries grappling similar issues.
Specialist services to assist learners with learning barriers require specialist staff. The
availability of psychologists and education therapists increased between 2014 and 2019,
with the number of psychologists employed by the provincial education departments increasing
from 95 to 206, and the number of therapists from 857 to 1 177. Yet many provinces remain
under-resourced. For instance, where in 2019 there were around 4 000 learners per education
therapist in Gauteng, this ratio was over 30 000 in Limpopo, Mpumalanga and North West.
Gearing the curriculum towards learners who cope best with a more practical, and less
academic, learning programme is an integral part of realising an inclusive education system.
Since 2017, considerable work has gone into developing and piloting new subjects falling within the ‘technical occupational’ category described in section 3.4 above215. There are 26 new
subjects in this category at the Senior Phase (normally grades 7 to 9), focussing on a range of
skills such as arts and crafts, hairdressing, automotive maintenance, housekeeping, and
upholstery. To date, these subjects have been piloted in special schools. However, it is expected
that these subjects will begin to feature in ordinary schools too, in particular full-service
schools.
Indicator 26. The percentage of learners in schools with at least one educator who received
specialised training in the identification and support of special needs.
The 2017 School Monitoring Survey found that 78% of schools had an educator who had
received specialised training in the identification and support of special needs216. This
cannot be compared to the 91% for this indicator reported in Action Plan to 2019 (and drawing
from the 2011 School Monitoring Survey). The latter 91% figure was derived by considering
any of up to ten educators in a school, and was calculated using learner weights. The more recent 78% figure is based on an interview with just one educator per school, who ideally had
to be the educator responsible for organising special needs support (though in some cases some
other educator was interviewed instead).
What can be compared across the two SMS years is the response of the principal to the question,
used in both years, of whether there was a school-based support team (SBST) or institutional-
215 Government Notice 959 of 2018. 216 Department of Basic Education, 2019e: 102.

126
level support team (ILST) or any other structure to support learners with learning barriers. The
responses suggest that special needs has become a more integral part of planning within
public schools. As seen in Table 20 below, learners in school with the required structure
increased from 64% in 2011 to 77% in 2017. The fact that Limpopo is lagging behind is very
clear from the table. In all provinces, primary schools do slightly better than secondary schools
when it comes to having the required special needs structure. At the national level, in 2017,
81% of primary learners were in schools with the required structure, against 72% for the
secondary level.
Table 20: Integration of special needs into public ordinary schools
% of schools with at least one educator with specialised training in the identification and
support of special needs % of learners in a school with a structure to support
learners with special education needs
SMS 2017 SMS 2011 SMS 2017
EC 69 52 64 FS 96 94 98 GP 93 98 99 KN 82 60 69 LP 63 16 47 MP 87 80 92 NC 68 60 85 NW 76 58 83 WC 89 86 93
SA 78 64 77
10.13 Goal 27: District support
Goal 27
Improve the frequency and quality of the monitoring and support services
provided to schools by district offices, partly through better use of e-
Education.
The NDP on districts:
Many of the weaknesses in schools are a reflection of weaknesses at
the district level. ... Deploy multidisciplinary support teams to work
with districts in the short to medium term. (p. 310)
Much effort has gone into promoting the impact of districts on educational improvement.
District offices should take credit for some of the improvement in learning outcomes
described in section 6.2 above. District officials have been instrumental in sustaining the
innovations in classroom practices brought about by the Curriculum and Assessment Policy
Statement (CAPS), through training and other initiatives. They play a vital role in monitoring
that books reach learners. The National Education Excellence Awards, issued annually since
2014, have helped to identify in which districts best practices can be found. The Data Driven
Districts (DDD) initiative, described in section 7.3, has brought various government and non-
government actors together to create a system which now spans eight provinces and greatly
enhances the organisation and dissemination of data needed by managers217.
217 The DDD website is at https://dbedashboard.co.za. See also Omarjee (2016), Van der Berg et al
(2019) and OECD (2019b).
127
Despite encouraging signs, however, at least anecdotally the quality of the services offered by
districts is often weak. Moreover, reliable measures of quality are still largely lacking. The
information that is available, and which is discussed below, does not point to improvements in
the effectiveness of districts in recent years. Ideally, initiatives such as DDD should translate
into principals who are more satisfied with the monitoring and support interventions of
districts, and into improvements in the indicator values. Yet this is not seen, either in general
or in relation to the four provinces with the longest history of participation in DDD, namely
Free State, Gauteng, Limpopo and Mpumalanga. The 2016 Auditor-General report on
education, which examined the effectiveness of districts, pointed to some solutions, such as the
need for a more streamlined use of district vehicles to facilitate school visits. Resource
constraints are an issue in districts, but this will probably be the case for many years to come. The challenge will continue to be to advocate for better resourcing, while providing the best
service possible with the human and physical resources available. As suggested by the NDP,
solutions must be multidisciplinary. This also implies that future research looking into districts
needs to be multidisciplinary, taking into account the various educational, economic,
geographical, political and psychological factors.
Indicator 27.1. The percentage of schools visited at least twice a year by district officials for
monitoring and support purposes.
Indicator 27.2. The percentage of school principals rating the support services of
districts as being satisfactory.
The 2017 School Monitoring Survey found that the percentage of schools visited at least twice
a year by district officials for monitoring and support purposes remained remarkably constant
between 2011 and 2017, at around 85% of schools, with provincial indicator values in 2017
ranging from 65% for Eastern Cape and 99% for Western Cape218. What is worrying is that
primary schools receive significantly fewer visits than secondary schools, the 2017 indicator values for the two levels being 80% and 94%. This gap is driven largely by Eastern Cape,
KwaZulu-Natal and Northern Cape. In these provinces, support to primary schools clearly
needs to be strengthened. In Eastern Cape almost a third of primary schools receive no
monitoring and support visits219.
With respect to the provincial visits indicator, there were no statistically significant changes at
the province level between 2011 and 2016. However, if instead of using a threshold of two
visits in a year, one uses the average number of visits, considering just monitoring and support
visits, then a slight statistically significant decline in three provinces, Free State, KwaZulu-Natal and Limpopo, emerges. The last two provinces are both provinces where indicator values
were relatively low to begin with. This can be seen in Figure 48 below. If one breaks the 2017
national value of 4.9 visits down by the levels of the schooling system, one obtains 4.3 for
primary schools and 6.7 for secondary schools. This confirms the problem of an under-
prioritisation of the primary level.
218 Department of Basic Education, 2019e: 110. 219 Department of Basic Education, 2019b: 93.
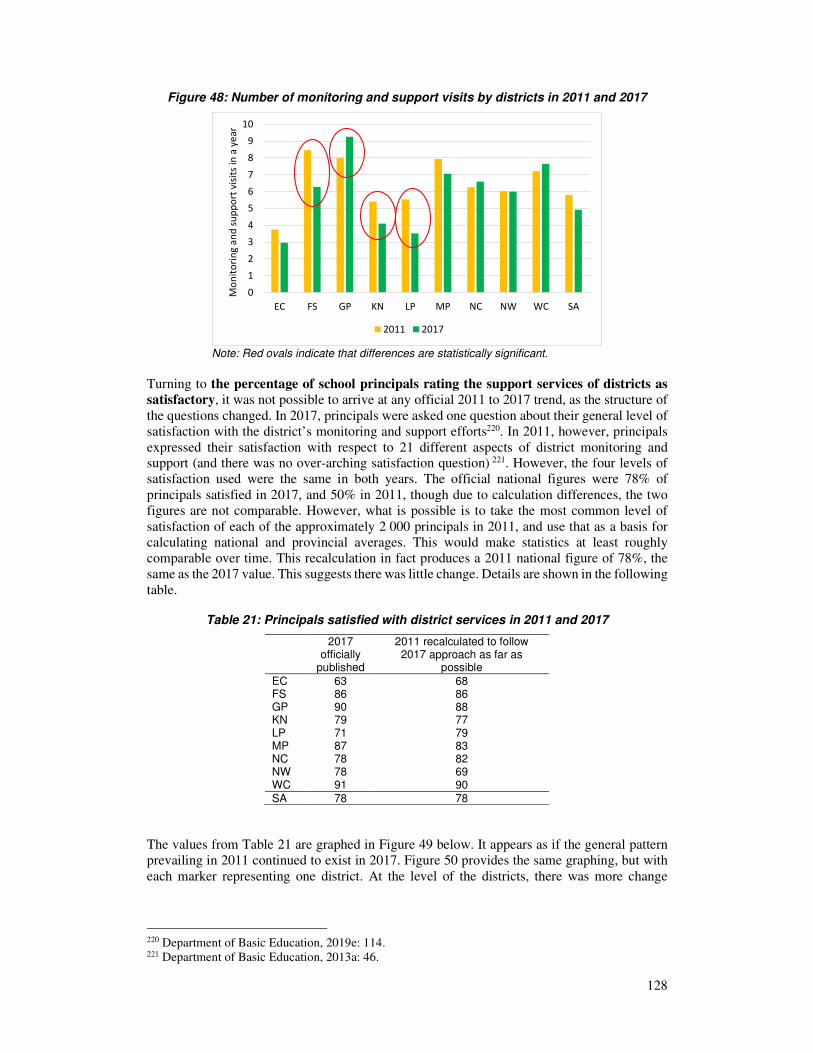
128
Figure 48: Number of monitoring and support visits by districts in 2011 and 2017
Note: Red ovals indicate that differences are statistically significant.
Turning to the percentage of school principals rating the support services of districts as
satisfactory, it was not possible to arrive at any official 2011 to 2017 trend, as the structure of
the questions changed. In 2017, principals were asked one question about their general level of
satisfaction with the district’s monitoring and support efforts220. In 2011, however, principals
expressed their satisfaction with respect to 21 different aspects of district monitoring and support (and there was no over-arching satisfaction question) 221. However, the four levels of
satisfaction used were the same in both years. The official national figures were 78% of
principals satisfied in 2017, and 50% in 2011, though due to calculation differences, the two
figures are not comparable. However, what is possible is to take the most common level of
satisfaction of each of the approximately 2 000 principals in 2011, and use that as a basis for
calculating national and provincial averages. This would make statistics at least roughly
comparable over time. This recalculation in fact produces a 2011 national figure of 78%, the
same as the 2017 value. This suggests there was little change. Details are shown in the following
table.
Table 21: Principals satisfied with district services in 2011 and 2017
2017 officially
published
2011 recalculated to follow 2017 approach as far as
possible
EC 63 68 FS 86 86 GP 90 88 KN 79 77 LP 71 79 MP 87 83 NC 78 82 NW 78 69 WC 91 90
SA 78 78
The values from Table 21 are graphed in Figure 49 below. It appears as if the general pattern
prevailing in 2011 continued to exist in 2017. Figure 50 provides the same graphing, but with
each marker representing one district. At the level of the districts, there was more change
220 Department of Basic Education, 2019e: 114. 221 Department of Basic Education, 2013a: 46.
0
1
2
3
4
5
6
7
8
9
10
EC FS GP KN LP MP NC NW WC SA
Mo
nit
ori
ng
an
d s
up
po
rt v
isit
s in
a y
ea
r
2011 2017
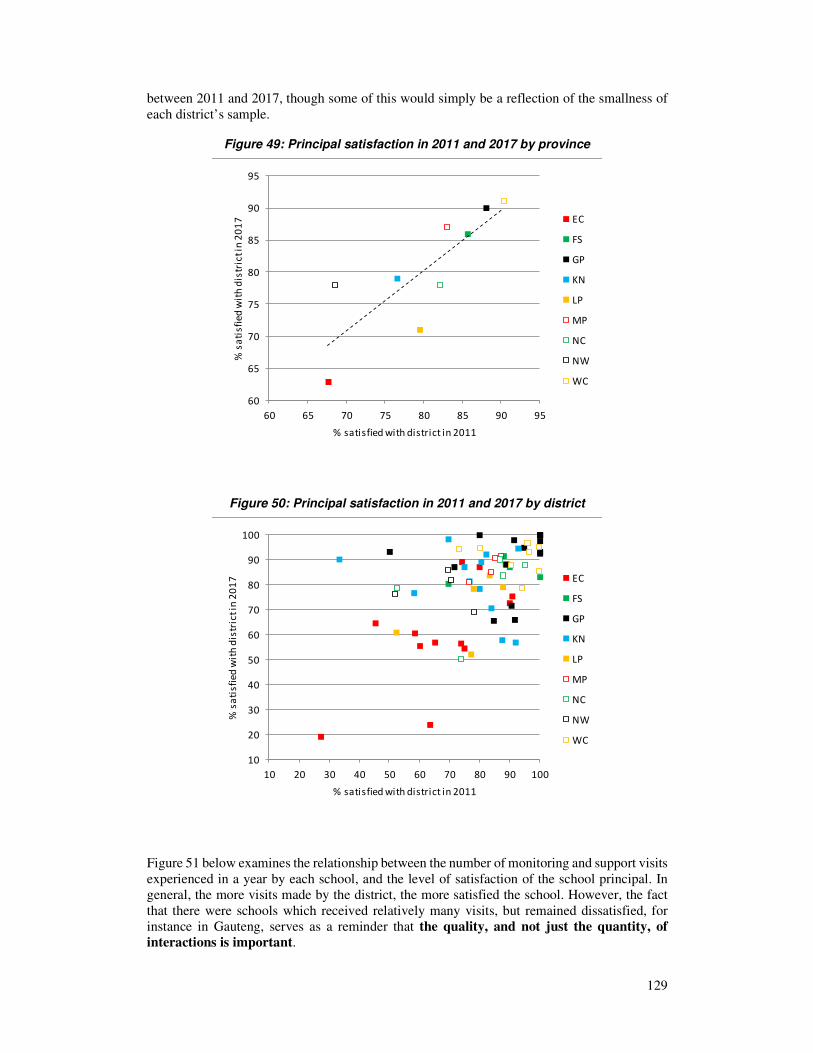
129
between 2011 and 2017, though some of this would simply be a reflection of the smallness of
each district’s sample.
Figure 49: Principal satisfaction in 2011 and 2017 by province
Figure 50: Principal satisfaction in 2011 and 2017 by district
Figure 51 below examines the relationship between the number of monitoring and support visits
experienced in a year by each school, and the level of satisfaction of the school principal. In
general, the more visits made by the district, the more satisfied the school. However, the fact
that there were schools which received relatively many visits, but remained dissatisfied, for
instance in Gauteng, serves as a reminder that the quality, and not just the quantity, of
interactions is important.
60
65
70
75
80
85
90
95
60 65 70 75 80 85 90 95
% s
ati
sfie
d w
ith
dis
tric
t in
20
17
% satisfied with district in 2011
EC
FS
GP
KN
LP
MP
NC
NW
WC
10
20
30
40
50
60
70
80
90
100
10 20 30 40 50 60 70 80 90 100
% s
ati
sfie
d w
ith
dis
tric
t in
20
17
% satisfied with district in 2011
EC
FS
GP
KN
LP
MP
NC
NW
WC

130
Figure 51: Number of district visits and school principal satisfaction in 2017
While the 2017 School Monitoring Survey was not designed to produce reliable statistics across
all districts, it is possible to obtain relatively reliable statistics for districts with larger numbers
of sampled schools. Figure 52 illustrates the level of school principal satisfaction for the 38
districts with at least 20 sampled schools. The district samples are still small, so what is most
important are the general patterns. Free State’s districts do well. In Eastern Cape, districts
with enough schools tend not to offer services principals are happy with.
0
2
4
6
8
10
12
Not satisf ied Somewhat
satisfied
Satisfied Very satisfied
Ave
rag
e m
on
ito
rin
g a
nd
su
pp
ort
vis
its
in a
ye
ar
WH
ERE
AT
LEA
ST O
NE
VIS
IT O
CC
UR
RE
D EC
FS
GP
KN
LP
MP
NC
NW
WC

131
Figure 52: School principal satisfaction with the district in 2017
Source: Analysis of School Monitoring Survey 2017 microdata. Note: Only districts with at least 20 schools are categorised. Within each district, the average across school-specific four-level statistics was calculated. The level values are 1 for ‘Not satisfied’ (or for zero visits occurring), 2 for ‘Somewhat satisfied’, 3 for ‘Satisfied’ and 4 for ‘Very satisfied’. School weights were used in calculating the averages. To provide an idea of the confidence intervals, Bohlabela (BO), with 42 schools, displays a mean of 3.3 with a confidence level of 3.1 to 3.5 (at the 5% level). OR Tambo Inland (TI), with 23 schools, has a mean of 2.2 within a confidence interval of 1.7 to 2.7.
Monitoring the effectiveness of the support work of districts is extremely important, but also
difficult. The official statistics on the two indicators in question do not point to improvements
in recent years. The above analysis looks beyond the headline statistics, and confirms this.

132
Appendix B: District codes
The codes indicated in the following table are for the 70 districts existing at the end of 2017.
Subsequent to that, Limpopo’s five districts were increased to ten.
Table 22: District codes used in maps
Prov. District name Code Prov. District name Code
EC Alfred Nzo East NE KN Pinetown PI EC Alfred Nzo West NW KN Ugu UG EC Amathole East AE KN Umgungundlovu UM EC Amathole West AW KN Umkhanyakude UK EC Buffalo City BC KN Umlazi UL EC Chris Hani East HE KN Umzinyathi UY EC Chris Hani West HW KN Uthukela UT EC Joe Gqabi JG KN Uthungulu UU EC Nelson Mandela NM KN Zululand ZU EC OR Tambo Coastal TC LP Capricorn CA EC OR Tambo Inland TI LP Greater Sekhukhune SK EC Sarah Baartman SB LP Mopani MP
FS Fezile Dabi FE LP Vhembe VH FS Lejweleputswa LP LP Waterberg WA
FS Motheo MH MP Bohlabela BO FS Thabo Mofutsanyana TH MP Ehlanzeni EH FS Xhariep XH MP Gert Sibande GS GP Ekurhuleni North EN MP Nkangala NK
GP Ekurhuleni South ES NC Frances Baard FR GP Gauteng East GE NC John Taolo Gaetsewe JO GP Gauteng North GN NC Namakwa NA GP Gauteng West GW NC Pixley ka Seme PS GP Johannesburg Central JC NC ZF Mgcawu ZM
GP Johannesburg East JE NW Bojanala Platinum BJ GP Johannesburg North JN NW Dr Kenneth Kaunda KE GP Johannesburg South JS NW Dr Ruth Segomotsi Mompati RU GP Johannesburg West JW NW Ngaka Modiri Molema NG GP Sedibeng East SE WC Cape Winelands CW GP Sedibeng West SW WC Eden and Central Karoo ED GP Tshwane North TN WC Metro Central MC GP Tshwane South TS WC Metro East ME GP Tshwane West TW WC Metro North MN
KN Amajuba AM WC Metro South MS KN Harry Gwala HG WC Overberg OV KN Ilembe IL WC West Coast WE

133
Appendix C: Corrections to the initially published PIRLS trend
This appendix explains what the situation was in early 2020 with regard to the PIRLS Grade 4
reading trend. By this time, it was clear that the originally published 2011 to 2016 trend,
indicating no progress, was not correct, and that in fact South Africa saw a 2011 to 2016
improvement which was among the highest for the 43 schooling systems with trends for this period222. Early in 2020, the international PIRLS 2016 reports were re-issued with South
Africa’s no-progress trend removed. The IEA, the organisation which runs PIRLS at the global
level, moreover published a correction on their website, and committed to looking into what
the true magnitude of the 2011 to 2016 improvement for South Africa was.
As explained below, because of the kinds of PIRLS testing South Africa participated in,
adjustments occurred which were unique to South Africa. It is these unique adjustments which
appear to have been problematic. The trends of other countries would not have been affected
by such adjustments. What appears in this appendix does therefore not point to a wider problem in the PIRLS assessments. South Africa remains committed to participating in PIRLS as it
provides a vital opportunity to benchmark progress in a priority area, early grade reading,
against international trends. At the same time, the problems experienced with the 2011 to 2016
trend serve as a reminder that South Africans, inside and outside government, urgently need to
develop the necessary capacity to understand the psychometric techniques employed in PIRLS,
and many other assessment programmes.
The international PIRLS 2016 report indicated that South Africa’s PIRLS score declined
slightly, from 323 in 2011 to 320 in 2016. However, the report also indicated that this difference
is too small to be considered statistically significant, given the sample sizes, meaning that South
Africa saw no progress in this period223. The national PIRLS report, produced by the local
implementers of PIRLS, the Centre for Evaluation and Assessment (CEA), reiterated the no
progress finding224. The 2011 to 2016 no progress trend is illustrated in Figure 53 with a broken
line.
The no progress finding was obviously disappointing for South Africans, but was also
questioned. Trends in the TIMSS Grade 9 and SACMEQ Grade 6 assessments had been clearly
positive. Why would reading in Grade 4 display such a different trend? Moreover, PIRLS
appeared to have displayed a very large positive trend, beyond what virtually any country has
seen, in the earlier period 2006 to 2011, followed by a flat no progress trend between 2011 and
2016. The question was asked whether the 2011 value of 323 was accurate. If it were lower, it
would produce a more consistent PIRLS trend for the longer 2006 to 2016 period. However,
the reliability of the 2006 Grade 4 score, of 253, published in two places225, was said to be
limited, in part because the tests were considered too difficult relative to the abilities of the
tested learners. In 2006, South Africa officially entered Grade 5, not Grade 4 learners, in PIRLS.
Grade 5 results were published in the international reports, but not the Grade 4 results. A Grade
4 national sample was tested as background research. The gap between the Grade 4 and Grade
5 results, of 49 (302 minus 253), or half a standard deviation, was plausible. This is roughly the
degree of progress one might expect from one grade to the next226.
222 See Gustafsson (2020) for the basic technical details. 223 Mullis et al, 2017: 29, 33. 224 Howie et al, 2017: 83. 225 Howie et al, 2008: 19; Department of Education, 2008: 34. 226 Hill et al, 2008: 173.

134
Figure 53: PIRLS values 2006 to 2016
In 2019, the DBE decided to examine the raw PIRLS data, publicly available on the TIMSS-
PIRLS international website, to see if the questions which had been raised could be answered.
Above all, it was believed that closer examination of the data may reveal problems with the
2011 sample, relative to that of 2016. If the 2011 sample consisted of, say, more middle class
test-takers, this could explain the no progress trend, and would indicate that the two samples
were not comparable. In fact, the two samples seemed sufficiently equivalent. However, a
pattern was found which was not expected. It was found that the trends in the raw test data,
specifically the trends relating to classical scores, meaning percentage correct, pointed to large
improvements, despite the published no progress trend using item response theory (IRT) scores.
There were four reading passages, with a total of 65 questions, around half multiple choice and
half constructed response, which were repeated in 2011 and 2016227. A key reason why
analysing the raw data can be difficult, is that different learners respond to different
combinations of passages, in line with the matrix sampling approach employed in PIRLS. Just
over 80% of learners in 2011 and just over 60% of learners in 2016, answered at least one of the four passages common across the two years. These learners would be a random sub-sample
of the larger sample. For all four passages, substantial improvements were found. The largest
improvement appeared for the passage ‘Ants’, with the average classical score rising from 34%
to 41%, while the smallest improvement appeared for the passage ‘Training a deaf polar bear’,
with the average rising from 32% to 37%. These averages are of course all low, and reflect the
fact that South Africa’s overall performance in PIRLS has been the lowest of all countries,
meaning that South Africa would be particularly interested in detecting progress.
The trends in the classical scores were examined from various angles. They were found to be
statistically significant, and large. They amounted to an improvement of around 0.05 standard
deviations a year, which is a large improvement, and comparable to South Africa’s
improvements in TIMSS and SACMEQ. The IEA confirmed in late 2019 that the flat 2011 to
2016 trend can no longer be considered reliable. Moreover, analysts from Boston College,
which implements the technical analysis for the IEA, has confirmed the large gains in classical
scores found by the DBE.
In further analysis, the DBE roughly replicated the IRT analysis used by Boston College to
anchor performance in different years, using common items. This approach, widely used across
international and national testing systems, is vital for producing sufficient comparability over
time. The replication resulted in an IRT score of 295 (and not 323) in 2011. In this replication,
227 The passages are: Ants; Baghita’s perfect orange; Summer my father was ten; Training a deaf polar
bear.
250
260
270
280
290
300
310
320
330
2001 2006 2011 2016 2021
PIR
LS s
co
re
302 (Gr 5)
Published
internationally
253 (Gr 4)
Published locally
only
323 (Gr 4)
Published
internationally
320 (Gr 4)
Published
internationally
295 (Gr 4)
Estimate with
correction

135
the published ‘item locations’, also known as the difficulty parameters, for each common item
(or question), were used.
It is important to underline that South Africa’s original 2011 score of 323 was calculated using
an approach that did not affect any other country, because of the types of PIRLS testing South
Africa participated in. In 2011, South Africa, together with Botswana and Colombia, participated in an easier PIRLS test referred to as prePIRLS, which used a different scale to
what is used in regular PIRLS. South Africa’s prePIRLS score, published in the international
PIRLS 2011 report, was 461. This was not comparable to the general PIRLS results. For PIRLS
2016, it was decided that all countries should have comparable scores. The challenge was thus
to recalibrate the old 2011 value of 461 to the regular PIRLS scale. This appears to have been
done by taking advantage of the fact that Colombia, in 2011, had two samples of learners,
participating in prePIRLS and regular PIRLS. PIRLS technical reports228 indicate that
Colombia’s 2011 data were used for the recalibration. This would make South Africa’s
recalibrated 2011 value sensitive to any discrepancies between the two samples in Colombia.
What appears not to have been done before the publication of trends in 2017 was to use the
differences in South Africa’s raw test results, between 2011 and 2016, as a basis for calculating
the 2011 IRT mean score. This seems to explain the discrepancy between South Africa’s
classical and IRT trends, for the 2011 to 2016 period, a discrepancy seen for no other country.
Because Botswana did not participate in PIRLS 2016, and Colombia already had a 2011 score
based on the regular PIRLS scale, South Africa would remain the only country experiencing
this special recalibration of the 2011 result.
The gain of 25 PIRLS points, from 295 to 323, reflects the third-largest gain of all gains reported
in the PIRLS 2016 international report. The largest is that for Morocco, followed by Oman.
The questions around the 2011 to 2016 PIRLS trend appear to have been answered. The
problem appears not to have been the comparability of the two samples, but instead the way the
2011 IRT mean had been calculated. The comparability of the two samples was checked, as
part of the DBE’s analysis, and it was found to be sufficient. More importantly, it was found
that improvements existed for learners of the same socio-economic status (SES). While there were gains at all SES levels, these were largest for the poorest segments of the population. This
points to a reduction in inequalities with respect to reading outcomes. This is obviously good
news.
The DBE encourages researchers to use the publicly available PIRLS (and TIMSS) data to
analyse further the trends over time. There are many questions that remain unanswered. What
do the types of questions in which gains were seen say about the nature of South Africa’s
improvement? Is South Africa’s improvement different in some qualitative sense from that of,
say, Morocco or Oman? If improvements are concentrated at the lower end of the performance
continuum, what does this mean in terms of various measures of educational inequality?
228 Martin et al, 2017: 12.18.

136
Appendix D: Useful documents
The documents listed below all inform the current Action Plan, are all publicly available, and
are nearly all available on the internet. The focus here is on more recent documents that were
not listed in the bibliography of Action Plan to 2019, or older documents that have recently
been made public.
African Union (2016a). Agenda 2063: The Africa we want. Addis Ababa.
African Union (2016b). Continental Education Strategy for Africa 2016-2025. Addis Ababa.
Armstrong, P. (2014). The impact of teacher characteristics on student performance: An
analysis using hierarchical linear modelling. Stellenbosch: University of Stellenbosch.
Auditor-General (2016). Education sector report for 2015-16. Pretoria
Australian Curriculum, Assessment and Reporting Authority (2017). National Assessment
Program – Literacy and Numeracy 2017: Technical report. Sydney.
Bamford, L. (2019) School health. In Massyn, N., Pillay, Y. & Padarath, A. (eds.), District
Health Barometer 2017/18. Westville: Health Systems Trust: 121-135.
Brodie, K. & Borko, H. (eds). (2016). Professional learning communities in South African
schools and teacher education programmes. Pretoria: HSRC.
Care, E., Kim, H., Anderson, K. & Gustafsson-Wright, E. (2017). Skills for a changing world:
National perspectives and the global movement. Washington: The Brookings Institution.
Cheng, X.J. & Moses, K. (2016). Promoting transparency through information: A global view
of school report cards. Paris: IIEP. Clarke, M. (2012). What matters most for student assessment systems: A framework paper.
Washington: World Bank.
Corruption Watch (2015). Loss of principle: A report on corruption in schools. Johannesburg.
Crouch, L. (2011). Motivating early grade instruction and learning: Institutional issues. In
Amber Gove & Anna Wetterberg (eds.), The Early Grade Reading Assessment:
Applications and interventions to improve basic literacy. Research Triangle Park: RTI
Press: 227-250. Crouch, L. & Mabogoane, T. (1998). No magic bullets, just tracer bullets: The role of
learning resources, social advantage, and education management in improving the
performance of South African schools. Research Triangle Park: Research Triangle
Institute.
Deacon, R. (2016). The initial teacher education research report: Final report. Johannesburg:
JET Education Services.
Department of Education (2008). Education for All: Country report: South Africa. Pretoria.
Department of Basic Education (2009). Report of the Task Team for the Review of the
Implementation of the National Curriculum Statement. Pretoria.
Department of Basic Education (2013a). Detailed indicator report for basic education sector.
Pretoria.
Department of Basic Education (2014a). The Ministerial Task Team report on the National
Senior Certificate. Pretoria. Department of Basic Education (2014b). General Household Survey (GHS) 2013 report:
Focus on schooling. Pretoria.
Department of Basic Education (2014c). Second detailed indicator report for basic education
sector. Pretoria.
Department of Basic Education (2015a). Action Plan to 2019: Towards the realisation of
Schooling 2030. Pretoria.
Department of Basic Education (2015b). Professional learning communities: A guideline for
South African schools. Pretoria.
Department of Basic Education (2016a). The development of a National Integrated
Assessment Framework. Pretoria.
Department of Basic Education (2016b). Report on progress in the schooling sector against
key learner performance and attainment indicators. Pretoria.

137
Department of Basic Education (2016c). Report of the ministerial task team appointed by
Minister Angie Motshekga to investigate allegations into the selling of posts of educators
by members of teachers unions and departmental officials in provincial education
departments. Pretoria.
Department of Basic Education (2017a). The SACMEQ IV project in South Africa: A study of
the conditions of schooling and the quality of education. Pretoria.
Department of Basic Education (2017b). Summary report: Results of Year 2 impact
evaluation: The Early Grade Reading Study. Pretoria.
Department of Basic Education (2017c). The Early Grade Reading Study (EGRS): In-depth
case studies of home language literacy practices in four Grade 2 classrooms in Treatment
1 and 2 schools. Pretoria. Department of Basic Education (2017d). TIMSS item diagnostic report: South Africa Grade 5
numeracy. Pretoria.
Department of Basic Education (2017e). TIMSS item diagnostic report: South Africa Grade 9
mathematics. Pretoria.
Department of Basic Education (2017f). TIMSS item diagnostic report: South Africa Grade 9
science. Pretoria.
Department of Basic Education (2017g). Guidelines relating to elections of school governing
bodies of public schools 2018. Pretoria.
Department of Basic Education (2017h). School fees 2009 to 2016. Pretoria.
Department of Basic Education (2018a). Report of the History Ministerial Task Team.
Pretoria.
Department of Basic Education (2018c). Do assessment practices in your school measure up:
Some lessons from schools that work. Pretoria.
Department of Basic Education (2018d). Schools that work: Lessons from the ground.
Pretoria.
Department of Basic Education (2018e). Inflow of new teachers into the public system.
Pretoria.
Department of Basic Education (2019a). General Household Survey (GHS): Focus on
schooling 2017. Pretoria.
Department of Basic Education (2019b). School Monitoring Survey 2017/18: Technical
report. Pretoria.
Department of Basic Education (2019c). Education data and tool landscape diagnostic in
South Africa: February 2019. Johannesburg: AT Kearney. [Unpublished report].
Department of Basic Education (2019e). 2017 School Monitoring Survey: Quantitative survey
main report. Pretoria.
Department of Basic Education (2019f). A comprehensive view of full- and part-time NSC
candidates 2014-2017 (21 February 2019). Pretoria. Department of Basic Education (2019g). TALIS 2018: South Africa country report: Teachers
and school principals as lifelong learners. Pretoria.
Department of Basic Education (2019h). Protocol document on teacher diagnostic
assessments. Pretoria.
Department of Basic Education (2019i). School Monitoring Survey 2017/2018: Qualitative
case study report. Pretoria.
Department of Basic Education (2019j). General Household Survey (GHS): Focus on
schooling 2018. Pretoria.
Department of Education (2007). Educator pay in South Africa: Pointers for the way forward.
Pretoria.
Department of Education (2009). Gustafsson, M. (2009). School funding and management in
South Africa: Findings from the school survey. Pretoria.
Department of Environmental Affairs (2017). National climate change adaptation strategy.
Pretoria.
Department of Health (2019). South Africa Demographic and Health Survey 2016. Pretoria.
Department of Planning, Monitoring and Evaluation (2014). The impact of the introduction of
Grade R on learning outcomes. Pretoria.
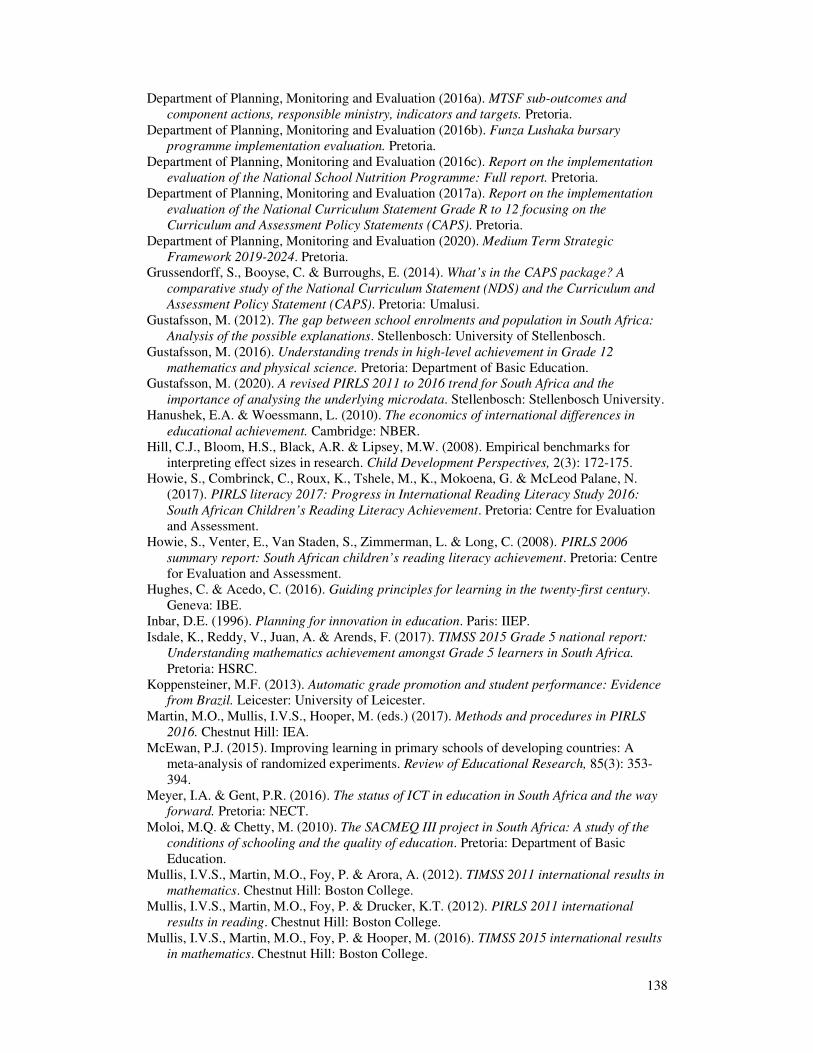
138
Department of Planning, Monitoring and Evaluation (2016a). MTSF sub-outcomes and
component actions, responsible ministry, indicators and targets. Pretoria.
Department of Planning, Monitoring and Evaluation (2016b). Funza Lushaka bursary
programme implementation evaluation. Pretoria.
Department of Planning, Monitoring and Evaluation (2016c). Report on the implementation
evaluation of the National School Nutrition Programme: Full report. Pretoria.
Department of Planning, Monitoring and Evaluation (2017a). Report on the implementation
evaluation of the National Curriculum Statement Grade R to 12 focusing on the
Curriculum and Assessment Policy Statements (CAPS). Pretoria.
Department of Planning, Monitoring and Evaluation (2020). Medium Term Strategic
Framework 2019-2024. Pretoria. Grussendorff, S., Booyse, C. & Burroughs, E. (2014). What’s in the CAPS package? A
comparative study of the National Curriculum Statement (NDS) and the Curriculum and
Assessment Policy Statement (CAPS). Pretoria: Umalusi.
Gustafsson, M. (2012). The gap between school enrolments and population in South Africa:
Analysis of the possible explanations. Stellenbosch: University of Stellenbosch.
Gustafsson, M. (2016). Understanding trends in high-level achievement in Grade 12
mathematics and physical science. Pretoria: Department of Basic Education. Gustafsson, M. (2020). A revised PIRLS 2011 to 2016 trend for South Africa and the
importance of analysing the underlying microdata. Stellenbosch: Stellenbosch University.
Hanushek, E.A. & Woessmann, L. (2010). The economics of international differences in
educational achievement. Cambridge: NBER.
Hill, C.J., Bloom, H.S., Black, A.R. & Lipsey, M.W. (2008). Empirical benchmarks for
interpreting effect sizes in research. Child Development Perspectives, 2(3): 172-175.
Howie, S., Combrinck, C., Roux, K., Tshele, M., K., Mokoena, G. & McLeod Palane, N.
(2017). PIRLS literacy 2017: Progress in International Reading Literacy Study 2016:
South African Children’s Reading Literacy Achievement. Pretoria: Centre for Evaluation
and Assessment.
Howie, S., Venter, E., Van Staden, S., Zimmerman, L. & Long, C. (2008). PIRLS 2006
summary report: South African children’s reading literacy achievement. Pretoria: Centre
for Evaluation and Assessment.
Hughes, C. & Acedo, C. (2016). Guiding principles for learning in the twenty-first century.
Geneva: IBE.
Inbar, D.E. (1996). Planning for innovation in education. Paris: IIEP.
Isdale, K., Reddy, V., Juan, A. & Arends, F. (2017). TIMSS 2015 Grade 5 national report:
Understanding mathematics achievement amongst Grade 5 learners in South Africa.
Pretoria: HSRC.
Koppensteiner, M.F. (2013). Automatic grade promotion and student performance: Evidence
from Brazil. Leicester: University of Leicester.
Martin, M.O., Mullis, I.V.S., Hooper, M. (eds.) (2017). Methods and procedures in PIRLS
2016. Chestnut Hill: IEA.
McEwan, P.J. (2015). Improving learning in primary schools of developing countries: A
meta-analysis of randomized experiments. Review of Educational Research, 85(3): 353-
394.
Meyer, I.A. & Gent, P.R. (2016). The status of ICT in education in South Africa and the way
forward. Pretoria: NECT.
Moloi, M.Q. & Chetty, M. (2010). The SACMEQ III project in South Africa: A study of the
conditions of schooling and the quality of education. Pretoria: Department of Basic
Education.
Mullis, I.V.S., Martin, M.O., Foy, P. & Arora, A. (2012). TIMSS 2011 international results in
mathematics. Chestnut Hill: Boston College.
Mullis, I.V.S., Martin, M.O., Foy, P. & Drucker, K.T. (2012). PIRLS 2011 international
results in reading. Chestnut Hill: Boston College.
Mullis, I.V.S., Martin, M.O., Foy, P. & Hooper, M. (2016). TIMSS 2015 international results
in mathematics. Chestnut Hill: Boston College.
139
Mullis, I.V.S., Martin, M.O., Foy, P. & Hooper, M. (2017). PIRLS 2016 international results
in reading. Chestnut Hill: Boston College.
National Education Collaboration Trust (2019). Beyond the numbers 2019. Pretoria.
National Planning Commission (2012). National development plan 2030: Our future - make it
work. Pretoria.
National Treasury (2017). Optimal school-level Grade 12 performance indicators and a
proposed school report card. Pretoria.
New Leaders Foundation (2018). Data Driven Districts programme: Old Mutual Education
Flagship Project and the DDD Dashboard. Johannesburg.
OECD (2010). The high cost of low educational performance: The long-run economic impact
of improving PISA outcomes. Paris. OECD (2019a). TALIS 2018 results: Teachers and school leaders as lifelong learners. Paris.
OECD (2019b). Philanthropy and education: Quality education for all: Lessons and future
priorities. Paris.
Omarjee, L. (2016). Capturing growth in SA’s schools. Johannesburg: Fin24.
Parliament (2017). Report of the High Level Panel on the Assessment of Key Legislation and
the Acceleration of Fundamental Change. Cape Town.
Paterson, A. & Arends, F. (2009). Teacher graduate production in South Africa. Pretoria: HSRC.
Piper, B., Jepkemei, E., Kwayumba, D. & Kibukho, K. (2015). Kenya’s ICT policy in
practice: The effectiveness of tablets and e-readers in improving student outcomes. Forum
for International Research in Education, 2(1): 3-18.
Piper, B., Zuilkowski, S.S., Kwayumba, D. & Strigel, S. (2016). Does technology improve
reading outcomes? Comparing the effectiveness and cost-effectiveness of ICT
interventions for early grade reading in Kenya. International Journal of Educational
Development, 49: 2014-214.
Popova, A., Evans, D.K. & Arancibia, V. (2016). Training teachers on the job. What works
and how to measure it. Washington: World Bank.
Presidency (2014). Medium-term strategic framework (MTSF): 2014-2019. Pretoria.
Pretorius, E., Jackson, M.A., McKay, V., Murray, S., Spaull, N. (2016). Teaching reading
(and writing) in the foundation phase: A concept note. Stellenbosch: Research on Socio-
economic Policy.
Pritchett, L. & Beatty, A. (2012). The negative consequences of overambitious curricula in
developing countries. Washington: Center for Global Development.
Rakometsi, M.S. (2008). The transformation of black school education in South Africa, 1950-
1994: A historical perspective. Bloemfontein: University of the Free State.
Reddy, V., Prinsloo, C., Arends, F. & Visser, M. (2012). Highlights from TIMSS 2011: The
South African perspective. Pretoria: HSRC. Selebetswe, T.D. & Mmapheko, D.P. (2018). Experiences of school health nurses regarding
the provision of the school health service delivery in the Tshwane district. African Journal
of Primary Health Care & Family Medicine, 10(1).
South African Institute of Chartered Accountants (2019). Guidelines for preparation of public
school financial statements. Johannesburg.
Southern African Development Community (2015). Care and support for teaching and
learning: From policy to practice. Gaborone. Statistics South Africa (2017). Poverty trends in South Africa: An examination of absolute
poverty between 2005 and 2015. Pretoria.
Statistics South Africa (2019). General Household Survey 2018. Pretoria.
Taut, S., Cortés, F., Sebastian, C. & Preiss, D. (2009). Evaluating school and parent reports of
the national student achievement testing system (SIMCE) in Chile: Access,
comprehension and use. Evaluation and Program Planning, 32(2): 129-137.
Taylor, S. & Coetzee, M. (2013). Estimating the impact of language of instruction in South
African primary schools: A fixed effects approach. Stellenbosch: Stellenbosch University.
Taylor, S., Cilliers, J., Prinsloo, C., Fleisch, B. & Reddy, V. (2017). The Early Grade Reading
Study: Impact evaluation after two years of interventions. Johannesburg: JET.

140
Trucano, M. (2016). SABER-ICT framework paper for policy analysis: Documenting national
educational technology policies around the world and their evolution over time.
Washington: World Bank.
Trucano, M. & Dykes, G. (eds.) (2017). Building and sustaining national educational
technology agencies: Lessons, models and case studies from around the world.
Washington: World Bank.
UNESCO (2014a). Education for All global monitoring report 2013/4: Teaching and
learning: Achieving quality education for all. Paris.
UNESCO (2014b). ICT in primary education: Analytical survey volume 3. Paris.
UNESCO (2015). Leveraging information and communication technologies to achieve the
post-2015 education goal: Report of the International Conference on ICT and Post-2015
education. Paris.
UNESCO (2016a). Action for climate empowerment: Guidelines for accelerating solutions
through education, training and public awareness. Paris.
UNESCO (2016b). Getting climate-ready: A guide for schools on climate action. Paris.
UNESCO (2016b). A policy review: Building digital citizenship in Asia-Pacific through safe,
effective and responsible use of ICT. Paris.
UNESCO (2017a). Global Education Monitoring Report 2017/18: Accountability in
education: Meeting our commitments. Paris.
UNESCO (2017b). Teaching and learning to read in a multilingual context: Ways forward
for three Sub-Saharan African countries (Burkina Faso, Niger, Senegal). Paris.
UNESCO Institute for Statistics (2017). Mind the gap: Proposal for a standardised measure
for SDG 4 – Education 2030 agenda. Montreal.
UNESCO Institute for Statistics (2018). Costs and benefits of different approaches to
measuring the learning proficiency of students (SDG Indicator 4.1.1). Montreal.
UNESCO Institute for Statistics (2019). SDG 4 data book: Global education indicators 2019.
Montreal.
UNICEF (2019). The state of the world’s children 2019: Children, food and nutrition. New
York.
United Nations (2017a). Revised list of global Sustainable Development Goal indicators. New
York.
United Nations (2017b). Guidelines to support country reporting on the Sustainable
Development Goals. New York.
Van Broekhuizen, H. & Spaull, N. (2017). The ‘Martha Effect’: The compounding female
advantage in higher education. Stellenbosch: Stellenbosch University.
Van Broekhuizen, H., Van der Berg, S. & Hofmeyr, H. (2016). Higher education access and
outcomes for the 2008 national Matric cohort. Stellenbosch: University of Stellenbosch.
Van der Berg, S., Wills, G., Selkirk, R., Adams, C., Van Wyk, C. (2019). The cost of
repetition in South Africa. Stellenbosch: University of Stellenbosch.
Van der Berg, S. & Gustafsson, M. (2017). Quality of basic education: A report to Working
Group 1 of the High Level Panel on the Assessment of Key Legislation. Cape Town:
Parliament.
Van der Berg, S., Van Wyk, C., Selkirk, R., Rich, K. & Deghaye, N. (2019). The promise of
SA-SAMS & DDD data for tracking progression, repetition and drop-out. Stellenbosch:
University of Stellenbosch. VVOB (2017). Putting SDG4 into practice: Professional learning communities in education.
Brussels.
World Bank (2003). World Development Report 2004: Making services work for poor people.
Washington.
World Bank (2018a). Overcoming poverty and inequality in South Africa: An assessment of
drivers, constraints and opportunities. Washington.
World Bank (2018b). An incomplete transition: Overcoming the legacy of exclusion in South
Africa. Washington.
World Bank (2018c). World Development Report 2018: Learning to realize education’s
promise. Washington.

141
World Bank (2019a). Global economic prospects: Darkening skies. Washington.
World Bank (2019b). World Development Report 2019: The changing nature of work.
Washington.
World Economic Forum (2017). Realising human potential in the Fourth Industrial
Revolution: An agenda for leaders to shape the future of education, gender and work.
Geneva.
Yoshikawa, H. & Kabay, S. (2015). The evidence base on early childhood care and education
in global contexts. Paris: UNESCO.
Zuze, L., Reddy, V., Visser, M., Winnaar, L. & Govender, A. (2017). TIMSS 2015 Grade 9
national report: Understanding mathematics and science achievement amongst Grade 9
learners in South Africa. Pretoria: HSRC.