acronyms - central bank
TRANSCRIPT

Acronyms
Acronyms:AFSI Aggregate Financial Stability Index AML/CFT Anti Money Laundering/Combating the Financing of TerrorismAPSSS Automated Payment and Securities Settlement SystemATM Automated Teller MachinesBCB British Caribbean BankBEL Belize Electricity LimitedBGA Banana Grower AssociationBTL Belize Telecommunications LimitedCAR Capital Adequacy RatioCARICOM Caribbean CommunityCARTAC Caribbean Regional Technical Assistance CentreCBB Central Bank of BelizeCBOE Chicago Board Options ExchangeCBRs Correspondent Banking Relations CDs CertificateofDepositsCFATF Caribbean Financial Action Task ForceCFZ Commercial Free ZoneCLICO Colonial Life Insurance CompanyDBFIA Domestic Bank and Financial Institutions ActDFC Development Finance CorporationDTI Deposit Taking Institution
EPZ Export Processing ZoneEU European UnionFATF Financial Action Task ForceFCIB First Caribbean International BankFDI Foreign Direct InvestmentFIU Financial Intelligence UnitFSIs Financial Soundness IndicatorsGDP Gross Domestic ProductGOB Government of BelizeGPI Gross Premium IncomeICRG International Cooperation Review GroupIMF International Monetary FundMLTPA Money Laundering and Terrorism (Prevention) ActMSCI Morgan Stanley Capital InternationalMTSP Money Transfer Service ProvidersNPL Non performing loanNRA National Risk Assessment OPEC Organization of the Petroleum Exporting Countries RBA Risk Based ApproachROA Return on assetsROE Return on equityUS United States
Abbreviations and Conventions:$ the Belize dollar unless otherwise statedbn billionmn million
Notes:1. SinceMayof1976,theBelizedollarhasbeenfixedtotheUSdollarattherateof
US$1.00 = BZ$2.00.2. Unless otherwise indicated, the Central Bank of Belize is the source of all tables and
charts.

Table of Contents
Page No.
EXECUTIVE SUMMARY 1
Chapter 1 Financial System Overview 4 1.1 Deposit Taking Institutions 4 1.2 Non-Deposit Taking Institutions 6 1.3 Ownership Structure 8
Chapter 2 Regulatory Developments 11 2.1 Changes in Legislative and Regulatory Framework 11 2.2 AML/CFT Implementation 12 2.3 Practice Directions 13 2.4 Financial Infrastructure 13 Chapter 3 Macro-Financial Environment 14 3.1 Global Macro-Financial Risk 15 3.2 External Macro-Economic Risk 17 3.3 Regional Environment 25 3.4 Domestic Environment 25 Chapter 4 Financial Performance of Deposit Taking Institutions 29 4.1 Private Sector Credit 29 4.2 Domestic Banks 31 4.3 International Banks 33 4.4 Credit Unions 35 Chapter 5 Evaluating the Resilience of the Deposit Taking Institutions 39 5.1 Domestic Banks 39 5.2 International Banks 40 5.3 Macro-Stress Test 42 Chapter 6 Financial Performance of the Insurance Sector 45 6.1 Sectoral Performance 45 6.2 Life Insurance Sector: Financial Soundness Indicators 50 6.3 Non-Life Insurance Sector: Financial Soundness Indicators 52
Annex 55
Central Bank of BelizeAnnual Financial Stability Report
1
EXECUTIVE SUMMARY
The 2015-2016 Financial Stability Report aims to provide decision makers and the generalpublicwithacomprehensiveassessmentofBelize'sfinancialsystemfocusingin particular on the stability of themajor financial institutions and the capacity ofthe system (at the micro and macro level) to withstand various shocks that have the potential to damage economic and financial activity. The Report covers a two-yearperiodinwhichdevelopmentsinBelize'sfinancialsectorweresignificantlyinfluencedbyexternal pressures ranging from the loss of correspondent banking relationships to the prolongationofthelow-interestrateenvironmentthatwasareflectionofthecontinuinguncertainty in the economic climate and failure of global growth to gain traction. Across the world, the issue of de-risking was a critical one producing disruptions in cross-borderflowsfor jurisdictionsinAfrica,theCaribbean,EastAsiaandPacific,CentralAsia and the Middle East. In Belize, these disruptions contributed to imbalances in the foreign exchange market that caused domestic foreign exchange queues to lengthen. In addition to the heightened need for careful management and, in some cases, reallocation of commercial banks’ foreign exchange holdings, the long-term viability of affectedfinancialinstitutionswasputinquestionpendingthefavourableresolutionofthe correspondent banking issue. The domestic credit market continued to be marked by sluggishness during this period, which partly reflected the externalmalaise, thereversion to inward looking trade and economic policies in major trading partners and local lender risk aversion.
In this rather challenging setting, the local authorities accelerated efforts to streamline andupgradeBelize'sregulatoryframeworkandfinancialinfrastructure.Thereformofanti-moneylaunderingandcombattingofthefinancingofterrorismlawstookpriority,with the Money Laundering and Terrorism (Prevention) Act (MLTPA) being amended in February 2016 to incorporate FATF recommendations, and preparations being initiated to facilitate the Caribbean Financial Action Task Force (CFATF) fourth round evaluation of Belize currently scheduled to occur in 2021. These preparations include theconductingofBelize'sfirstNationalRiskAssessmentexercisewhichwaslaunchedin July 2016 under the auspices of the National Anti-Money Laundering Committee with the Financial Intelligence Unit coordinating the activities of six working groups.
On the infrastructural side, the modernization of the domestic payments system advanced with the October 2016 launching of the Automated Payments and Securities Settlement System (APSSS), which is comprised of an automated clearing house, real time gross settlements system and central securities depository. The supporting legislation

2 Central Bank of BelizeAnnual Financial Stability Report
3Central Bank of BelizeAnnual Financial Stability Report
(National Payment Systems Act) was passed in December 2016 and in that month a new act was also passed to bring moneylenders under the regulatory ambit of the Central BankofBelize.TheregulatoryambitoftheOfficeoftheSupervisorofInsurancewasalso expanded in 2016 with enactment of legislation that added International Insurance and Private Pensions to its portfolio of responsibilities.
The period under review was punctuated by institutional changes in the banking and insurance sectors. The share of local ownership of the insurance sector increased as RF&G acquired American Life Insurance Company (ALICO) early in 2015 and followed this up later that year with the acquisition of Guardian Life Insurance Company. There was also an increase in the concentration of assets in the domestic banking system as First Caribbean International Bank (FCIB) divested itself of local holdings by selling its BelizebranchtoHeritageBankLtd.ThisreducedthenumberofbankstofiveinJanuary2016. Notwithstanding FCIB's disengagement and the uncertain external environment, financialstabilityindicatorsattheaggregatelevelpointedtoarelativelystablebankingsector with levels of capitalization at 23.84% of risk weighted assets in 2016. There was asignificantimprovementinassetquality,withtheratioofnon-performingloan(NPL)(netofspecificprovisions)tototalloansdecliningfrom7.02%to3.01%inthetwo-yearperiod, as domestic banks came into full compliance with the revised requirements for NPL provisioning initiated by the Central Bank in December 2011.
In the aggregate, the international banking sector was well capitalized at 24.59% of risk weighted assets in 2016. Although the loss of correspondent banking relationships affected some institutions negatively, as a whole, the sector’s liquid asset ratio stood at 45.1% at the end of 2016 which is much above the 24% requirement. There was a marginal improvement in the level of capitalization for the credit union sector as the ratio of net institutional capital to total assets inched up from 9.99% to 10.61%, and steady growth in member deposits in the two year period boosted the sector's excess liquidity by 14.3%.
Turning the focus to the assessment of resiliency, the analysis of the domestic banking sector revealed a measure of vulnerability to credit-related shocks including related party transactions and loan concentration. In the case of the international banking sector, there was a heightening of liquidity risks due to deposit withdrawals triggered by the loss of correspondent banking relationships. When subjected to the macroeconomic stress tests, the domestic banks appeared able to withstand shocks of various degrees, although one bank evidenced vulnerability to macroeconomic shocks with its level of capitalization being heavily impacted under all three scenarios. The Central Bank
continued to closely monitor the situation, which showed slow and steady improvement with a time line having been imposed for the major indicators to meet required standards, failing which a capital injection will be required.

4 Central Bank of BelizeAnnual Financial Stability Report
5Central Bank of BelizeAnnual Financial Stability Report
CHAPTER 1
Financial System OverviewChart 1.1: Structure of the Financial System
1.1 Deposit Taking InstitutionsThe assets of the domestic banks grew by a robust 9.5% in 2015, but this declined by 0.7%in2016partlyreflecting the economic contraction in that year due to reversals in the primary sector, and the negative impact of the loss of some correspondent banking relationships. In the case of the credit unions, asset growth amounted to 8.6% in2015and2016.Thefive largestcredit unions accounted for 94.45% and 93.55% of total assets in 2015 and 2016, respectively.
CIBC First Caribbean International Bank (FCIB) sold its local branch to Heritage Bank Limited in January 2016. As a Canadian owned bank headquartered in Barbados, FCIB had taken over the
operations of the local branch of Barclay’s Bank in 2002. However, its low levels of lending coupled with exorbitant levels of liquidity led to annual losses from 2012 onward. The poor performance of the localbranchwasareflectionofexcessivecentralisation of decision making as well as the strategy of booking domestic loans with offshore affiliates. In August 2015,FCIB announced that it would be exiting from Belize and would be taking steps to wind up its operations. Heritage Bank agreed to purchase all their domestic loans and deposit liabilities, as well as a portion of loans originating from Belize that were booked in FCIB’s Cayman and Bahamas branches. It was also agreed that Heritage would acquire the remaining offshore loans as funding permitted. Heritage Bank’s
0
500
1000
1500
2000
2500
3000
3500
Domestic Banks InternationalBanks
Credit Unions DevelopmentFinancing
Insurance
($m
n)
Dec-14 Dec-15 Dec-16
Chart 1.2: Impact of FCIB’s closure on the Domestic Banking System
0
20
40
60
80
100
120
Dec-15 Feb-16 Dec-15 Feb-16 Dec-15 Feb-16 Dec-15 Feb-16
Distribution of Deposits Large DepositConcentration
Market Share (Loans) Large Loan Concentration
Perc
ent
Atlantic Bank Belize Bank CIBC First Caribbean Heritage Bank National Bank Scotiabank (Belize)
acquisition of FCIB pushed its large loan concentration1 from 8.6% to 17.0% and large deposit concentration from 11.2% to 23.9%, which heightened the attendant risks of contagion and vulnerability to adverse developments.
The impact of foreign correspondent banks’ de-risking activities was particularly severe for the international banks, which mainly do business with the offshore sector. These institutions suffered an overall contraction in assets of 32.5% in the two-year period under review. As a result,theirshareofthefinancialsystemfell from 27.9% to 19.1%, while that of domestic banks and credit unions rose to 58.0% and 16.2%, respectively.
The loss of correspondent banking 1 The amount of loans exceeding 10% of the bank's capital.
relations and outflows for the buyoverof the FCIB branch caused the value of foreign deposits and investments by the commercial banks to decline. In 2015, the foreign asset holdings of the domestic banks shrank by 13.4%, and there was a further decline of 18.6% in 2016. The international banks also experienced declines of 26.0% and 53.4%, in the same periods, respectively.
Exposure to the North American region increased for the domestic banks relative to their dealings with CARICOM and Latin America. At the end of September, the combined share of assets held in CARICOM and Latin America stood at 13.1%, compared to 31.1% at the end of 2014 with this mainly reflecting FCIB’swinding down during 2015 and the non-renewal of matured investments held in
6 Central Bank of BelizeAnnual Financial Stability Report
7Central Bank of BelizeAnnual Financial Stability Report
Table 1.1: Changes in the structure of International Insurance Sector
2015 2016
Class of Intermediaries
Insurance Managers 5 2
Principal Insurance Representatives 5 5
Total Intermediaries 10 7
Class of Insurers
Long Term 1 1
Composite 2 2
Captives 14 11
Re-insurers 5 5
Total Insurers 22 19
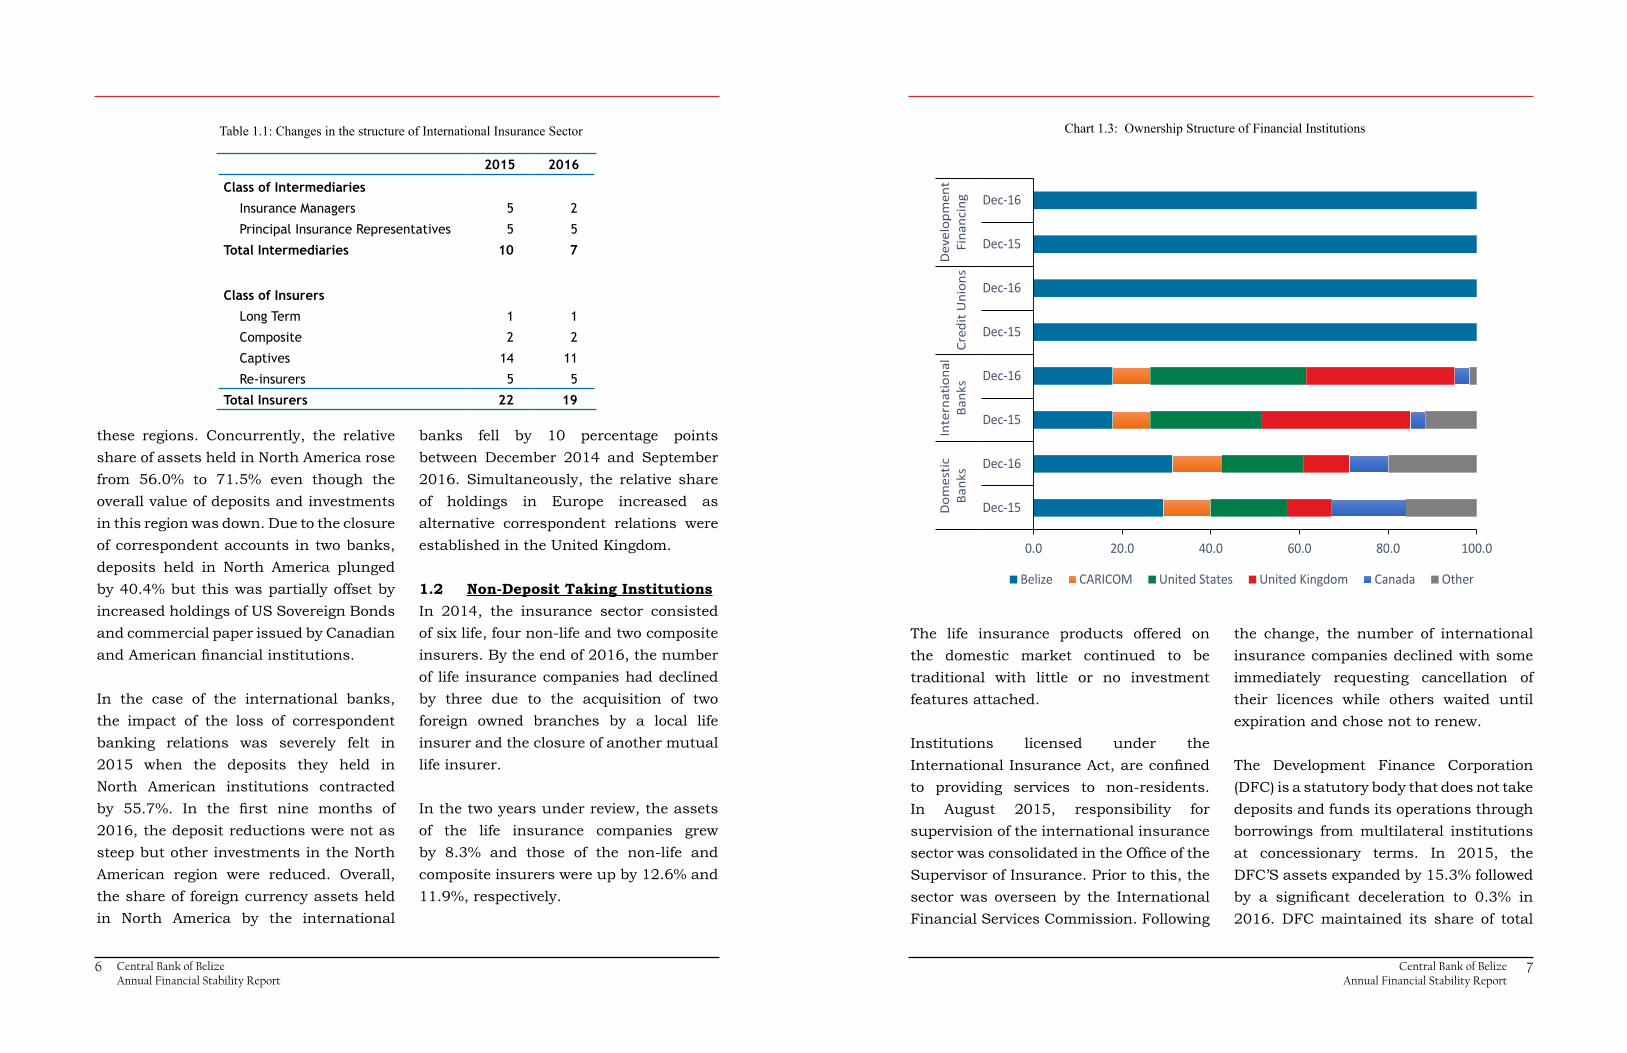
these regions. Concurrently, the relative share of assets held in North America rose from 56.0% to 71.5% even though the overall value of deposits and investments in this region was down. Due to the closure of correspondent accounts in two banks, deposits held in North America plunged by 40.4% but this was partially offset by increased holdings of US Sovereign Bonds and commercial paper issued by Canadian andAmericanfinancialinstitutions. In the case of the international banks, the impact of the loss of correspondent banking relations was severely felt in 2015 when the deposits they held in North American institutions contracted by 55.7%. In the first nine months of2016, the deposit reductions were not as steep but other investments in the North American region were reduced. Overall, the share of foreign currency assets held in North America by the international
banks fell by 10 percentage points between December 2014 and September 2016. Simultaneously, the relative share of holdings in Europe increased as alternative correspondent relations were established in the United Kingdom.
1.2 Non-Deposit Taking InstitutionsIn 2014, the insurance sector consisted of six life, four non-life and two composite insurers. By the end of 2016, the number of life insurance companies had declined by three due to the acquisition of two foreign owned branches by a local life insurer and the closure of another mutual life insurer.
In the two years under review, the assets of the life insurance companies grew by 8.3% and those of the non-life and composite insurers were up by 12.6% and 11.9%, respectively.
Chart 1.3: Ownership Structure of Financial Institutions
The life insurance products offered on the domestic market continued to be traditional with little or no investment features attached.
Institutions licensed under the InternationalInsuranceAct,areconfinedto providing services to non-residents. In August 2015, responsibility for supervision of the international insurance sectorwasconsolidatedintheOfficeoftheSupervisor of Insurance. Prior to this, the sector was overseen by the International Financial Services Commission. Following
the change, the number of international insurance companies declined with some immediately requesting cancellation of their licences while others waited until expiration and chose not to renew.
The Development Finance Corporation (DFC) is a statutory body that does not take deposits and funds its operations through borrowings from multilateral institutions at concessionary terms. In 2015, the DFC’S assets expanded by 15.3% followed by a significant deceleration to 0.3% in2016. DFC maintained its share of total
0.0 20.0 40.0 60.0 80.0 100.0
Dec-15
Dec-16
Dec-15
Dec-16
Dec-15
Dec-16
Dec-15
Dec-16
Dom
estic
Bank
sIn
tern
atio
nal
Bank
sCr
edit
Uni
ons
Dev
elop
men
tFi
nanc
ing
Belize CARICOM United States United Kingdom Canada Other

8 Central Bank of BelizeAnnual Financial Stability Report
9Central Bank of BelizeAnnual Financial Stability Report
assetsinthefinancialsystemat1.8%for2015 and 2016.
1.3 Ownership StructureThe share of local ownership in domestic banks rose from 29.3% to 31.3% in 2016 while the portion held by Canada shrank from 16.8% to 8.9% due to FCIB's exit. The portion held by ‘other’ jurisdictions (namely Honduras) rose from 16.0% to 19.9%.
In the case of the international banks, resident ownership was unchanged at 17.8%, however, the change in ownership structure of one institution pushed the portion of US shareholdings up from 25.2% to 35.2% while resulting in a lowering from 11.6% to 1.6% in the ownership stake of residents from other jurisdictions. The holdings by entities in CARICOM, the United Kingdom and Canada were unchanged during the entire period.
The life insurance sector is dominated by two foreign insurers that are headquartered in Barbados. The largest accounted for 67% of total assets at the end of 2016. The locally owned life insurer has grown significantly due to its 2015 acquisitionof portfolios previously held by American Life Insurance Company (ALICO) and Guardian Life Limited, both of which closed their Belize branches. This insurer had also acquired the CLICO life portfolio in 2009. Unlike the foreign insurers who operate branches in other jurisdictions,
the local insurer has no operations outside of Belize.
In contrast to the life insurance sector, local insurers dominate the general insurance sectorwithfiveofthem(includingthetwocomposites) accounting for 94% of the market.
Like many other countries, Belize faced disruption in financial cross borderflowsfollowingthelossofcorrespondentbankingrelationships(CBRs). Threedomestic banks lost 90% of their established CBRs during a twelve-month period in2015and2016.Thiswasmainlyasaresultofstrategiesadoptedbyfinancialinstitutions in the United States, United Kingdom and Canada in response to heightened scrutiny of bank regulators, and increases in compliance costs and regulatory penalties.
During this period, one domestic bank operated without a CBR for four months before establishing a relationship that offered limited international financialservices. This triggered a shift in banking activities as well as an increase in processing time and transaction costs. Between 2014 and 2016, foreign currency sales by one bank tumbled by $398.4mn, while sales by another bank surged by $365.4mn. A similar movement was observed in foreign currency purchases.
The cost of regaining limited services from foreignfinancial institutions cameat a premium, resulting in higher costs and lengthened processing times for international transactions. These added costs and delays were particularly felt by importers who in addition to bearing higher costs due to the loss of discounts, were also deprived of the relaxed payment arrangements previously accorded to them by suppliers.
In an attempt to maintain existing CBRs and get new relationships, domestic banks employed their own de-risking strategies. Relationships with sectors identifiedashighrisk,suchasmoney transferserviceproviders (MTSPs)andcommercial free zone (CFZ) companies, were terminated by some banks. As a result, a number of sub-agents of MTSPs were unable to maintain accounts with domestic banks, which forced a few of these to cease operations and reduce the accessofindividualstotheformalfinancialsystem.Thislackofaccessobligatedthese agents to transport large volumes of cash, posing security concerns.
Moreover, a number of MTSPs were unable to receive funds for settlement purposes from their international counterparts, compelling these agents to utilize local funds to maintain operations. On the CFZ front, the withdrawal of one domestic
Box 1: Impact of De-Risking on Belize's Economy

10 Central Bank of BelizeAnnual Financial Stability Report
11Central Bank of BelizeAnnual Financial Stability Report
bank, accompanied by deposit restrictions by the only bank operating within theCFZamplifieditscashintensivenature.TheceilingimposedonUSdollardeposits generated within the CFZ partly contributed to the increase in cash holdings not deposited into the banking system, which rose from 41.6% in 2015 to 52.4% in 2016.
The effects of the de-risking strategies on the international banking sector were manifested in the erosion of deposit liabilities and a shift in lending activity. Deposits were stable for two of these banks but there was a gradual decline in deposits for the remaining three banks. While there was strong growth in loans, it was concentrated in one international bank, partly because the others were constrained by the inability to transfer and receive funds across borders.
Todate,thefulleffectsofde-riskingarestillnotquantifiable;however,therehavebeen observed shifts in trends and temporary disruptions in services provided by MTSPs, domestic banks and international banks. These have contributed to pressureswithrespect to thesystem’scapacity tosupport thefixedexchangerate peg and service international debt and other payments. The effects on the economy can be said to be moderate, considering that banks were able to establish relationships with other providers. Nevertheless, there is a notable risk tothesystemwherethelackorinsufficiencyofCBRservicescanseverelyimpactfinancialandeconomicactivity.
Box 1: Impact of De-Risking on Belize's Economy continued Chapter 2
Regulatory Developments and Financial Infrastructure
The domestic supervisory framework underwent modification in response tothe rapid changes in theworld financialsystem. The strengthening of the AML/CFT legal framework is one of the many priorities being addressed through the National Risk Assessment work programme. At the institutional level, a practice direction for corporate governance was introduced in early 2015, and one for consolidated supervision is currently under review. Basel II implementation is another key initiative that is currently in itsembryonicphase.Modificationstotheregulatory oversight of non-deposit taking institutions, included the revamping of the Moneylenders Act and the introduction of a Pensions Act. The International Insurance Act was also amended to consolidate authority for supervision of the sector in theofficeoftheSupervisorofInsurance.
In the last quarter of 2016, a major milestone was achieved in the project to improve Belize’s payments infrastructure with the Central Bank's launch of the Automated Payments and Securities Settlement System (APSSS), which is comprised of an automated clearing house, real time gross settlements system and central securities depository.
2.1 Changes in Legislative and Regulatory Framework(i) Money Laundering and Terrorism (Prevention) Act, 2008 (MLTPA)
To bring Belize’s legal framework into further alignment with the FATF Recommendations, the Money Laundering and Terrorism (Prevention) Act, 2008 (MLTPA) was amended in February 2016. The amendments included enhancements to the customer due diligence process and the reporting of relevant information to the FIU as well as improved provisions for the investigation and prosecution of money laundering, financing ofterrorism and other related crimes.
(ii) Moneylenders (Amendment) ActThe regulatory regime for moneylenders was modernized with the passage of amendments to the Moneylending Act. The amended legislation establishes the Central Bank as the Registrar of Moneylenders, conferring upon it supervisory and enforcement powers consistent with international standards. Prior to the amendments, the Ministry of Finance was responsible for oversight and licensing of money lenders. With the new legislation, it is anticipated that there will be a more concentrated focus on monitoring and

12 Central Bank of BelizeAnnual Financial Stability Report
13Central Bank of BelizeAnnual Financial Stability Report
implementation of measures to identify and mitigate AML/CFT risks in the sector.
The Bill for Moneylenders (Amendment) ActhaditsfirstreadingintheHouseofRepresentatives in the last quarter of 2016 and was passed by the year-end with the changes slated to come into full effect by April 2017.
(iii) Pensions ActThe Private Pensions Act was enacted in March 2016, however, the commencement order and ancillary Regulations were slated to take effect on 1st January 2017. As a result of this legislation, supervision of private pensions has been added to the portfoliooftheOfficeoftheSupervisorof Insurance.
(v) Basel II ImplementationLike its regional counterparts, the Central Bank of Belize has been broadening its focus to better account for market, operational, concentration, reputation, strategic, and systemic risks to the banking sector. In September 2016, CARTAC provided technical assistance to enable the groundwork to be laid for the implementation of the "International Convergence of Capital Measurement and Capital Standards: A Revised Framework" also known as Basel II. Basel II requires banks to identify, measure and mitigate their own risk exposure with the objective
of achieving a further strengthening of the financial sector. The Basel IIimplementation agenda for Belize was in the development stage in the last quarter of the year.
(vi) Insurance ActThere were also amendments to the Insurance Regulations in 2016 that allowed for the publishing of an Exemption Order so as to enable the introduction of micro-insurance in Belize and the lowering of fees payable for companies offering such products.
2.2 AML/CFT Implementation (i) Caribbean Financial Action Task Force (CFATF)
Preparations are underway for the Fourth Round of the Caribbean Financial Action Task Force (CFATF) Mutual Evaluation Assessment which is scheduled for 2021. As a precursor, Belize commenced a National Risk Assessment exercise (NRA) in July 2016. This is being done in light of the FATF Recommendations, which requires countries to identify, assess, and understand money laundering andterroristfinancingrisksandalsothat they take action to effectively mitigate such risks. The National Risk Assessment Project is being led by the National Anti-Money Laundering Committee and is being coordinated by the Financial Intelligence Unit. Six NRA Working Groups have been mobilized. In addition to chairing
the Banking Sector Working Group and Other Financial Services and Securities Working Group, the Central Bank is represented on the National Threats, National Vulnerabilities, Designated Non-Financial Businesses and Professions, and Insurance Sector Working Groups.
(ii) AML Supervision and ComplianceDuring 2016, the Central Bank’s AML Unit participated in the on-site inspection of the Chamber of Commerce and Industry’s Western Union operations to ensure that the latter’s compliance measures are in accordance with international standards as it relates to the provision of money transfer services.
(iii) Other IssuesIn 2015 and 2016, several Central Bank employees participated in trainings that equipped them to perform the role of assessor for CFATF and that also conferred the additional certificationas "Anti-Money Laundering Specialist". Central Bank staff also received training to enhance capacity to detect financialcrimes.
2.3 Practice Directions (i) Corporate Governance
In early 2015, the Central Bank promulgated a practice direction on Corporate Governance which is applicable to all banks and financialinstitutions operating in Belize under
its supervision. The practice direction aims to promote international best practice in corporate governance with respect to the Central Bank's role, the conduct and compensation of boards, risk management, senior management, internal controls, disclosure and transparency.
(ii) Consolidated SupervisionPreparatory work was done for a practice direction on Consolidated Supervision which is slated for implementation in 2017. The practice direction will establish guidelines for more effective monitoring of risk, capital adequacy and governance of institutions that operate as part of a financial group and thus reduce thelikelihood of regulatory arbitrage.
2.4 Financial Infrastructure(i) Modernization of the Payments System
In the last quarter of 2016, the Central Bank of Belize, in collaboration with CentralGovernmentandlocalfinancialinstitutions, operationalized the APSSS. The system connects directly with the local operating systems of banks to improve the quality and speed of electronic payments in Belize. It provides the environment for them to transfer funds and clear cheques faster, and more safely and reliably. Legislation to support the APSSS and other systems that form part of the national payment system was passed in December 2016.

14 Central Bank of BelizeAnnual Financial Stability Report
15Central Bank of BelizeAnnual Financial Stability Report
Chart 3.1: Aggregate Financial Stability Index
The Aggregate Financial Stability Index (AFSI) improved by 4 basis points in 2015 reflectingastrengtheninginthefinancialsoundness of the domestic banking system and to a lesser extent, the improved performance of the macro-economy. There was a further improvement in 2016, with the AFSI increasing by 3.5 basis points as stronger banking performance was supplemented by further financialdevelopment and a more stable world economic climate.
(i) Financial Development The financial development index isa sub-component of the AFSI which gauges the growth of the financialsystem by measuring its asset size and growth relative to GDP. An increase is
0.00
0.10
0.20
0.30
0.40
0.50
0.60
0.70
0.80
0.0
0.5
1.0
1.5
2.0
2.5
3.0
Sep-13 Dec-13 Mar-14 Jun-14 Sep-14 Dec-14 Mar-15 Jun-15 Sep-15 Dec-15 Mar-16 Jun-16 Sep-16 Dec-16
Aggr
egat
e Fi
nanc
ial S
tabi
lity
Inde
x (A
FSI)
Sub-
com
pone
nts o
f AFS
I
Financial Development Economic Performance Financial Soundness Global Environment AFSI
Chapter 3
Macro-Financial Environment
an indication of improvement in the leveloffinancialdevelopment.During2015, the index improved by 9 basis points influenced by growth in theratio of banking system assets to GDP from 87.8% to 92.1%. In the following year, the rise in the ratio of credit to GDP from 57.0% to 57.9% pushed the financial development index 4 basispoints higher.
(ii) Economic Performance The index of economic performance fell by 1 basis point during 2015 largely due to an 18.1% decline in net exports that was offset by an improvement in the credit to GDP gap2. The index
2 The credit to GDP gap is an indicator of systemic imbalance as growth in the gap suggests increasing leveraging taken on by borrowers as the level of credit relative to GDP has exceeded the long term trend.
declined further by 4.6 basis points in 2016 mostly due to the continued reduction in net exports.
(iii) Financial Soundness As in previous years, the financialsoundness index maintained an upward trend during the period under review, rising by 9 basis points in 2015 and with a further increase of 8 basis points in 2016. The improvement in 2015 was attributable to increases in thecapitaladequacy,profitabilityandliquidityofthebanks,whilesignificantimprovements in asset quality bolstered its growth in 2016.
(iv) World Economic Climate The slowdown in the growth of world ouput from 3.4% to 3.1% in 2015 caused the world economic climate index to fall by 2 basis points. However, there was a rebound in 2016 resulting in an increase of 7 basis points in the indexthatlargelyreflecteda4.2basispoint reduction in the CBOE Volatility Index (VIX) and 1.4% increase in the MSCI World Growth Index.
3.1 GLOBAL MACROFINANCIAL RISK3.1.1 Macroeconomic Risk
Macroeconomic risks heightened in the last quarter of 2015 and the firstthreequartersof2016asglobalgrowth once more failed to gain tractionandinflationremainedatlowlevels. Projections for global growth in 2016 were revised downwards
from 3.4% at the start of the year to 3.1% in October, and there was a marginal increase in inflation from0.3%in2015to0.5%inthefirsthalfof 2016. Among the contributing factors to the downward revision in global output was the lack of clarity as to the long term macroeconomic impact of the UK’s exit from the EU with particular reference to future bilateral arrangements. Also of note was the steady deterioration in the terms of trade of commodity exporters. The attempts of the latter to reduce excessive debt while rationalizing production capacity, led to declines in trade volumes of 2.6% in 2015 and 2.3% in 2016. Other issues exerting a dampening effect on the prospects for world output were the aging populations in advanced economies and the political uncertainty associated with inward-looking policies currently supported in the United States and the EU.
3.1.2 Credit Risks and Monetary and Financial Conditions
Credit risk in the corporate and banking sectors intensified in thelast quarter of 2015. With continued sluggishness in the macro-economy, stock market valuations plummeted in late 2015 and early 2016 with the global sell-off of equities being fueled by deteriorating earning expectations. The heightening

16 Central Bank of BelizeAnnual Financial Stability Report
17Central Bank of BelizeAnnual Financial Stability Report
of corporate risk was evidenced by widening credit spreads that translated to increased pressure on the asset quality of banks. The impact was more severe for banks within the Euro area specifically,Greece, Italy, Portugal and Germany. Structural issues ranged from high NPLS, slow credit growth and weaker revenue streams, excess liquidity, inadequate capital buffers, heightened legal costs and regulatory pressure to meet additional capital requirements under the Basel III framework.
While rising corporate risk prompted US banks to tighten lending requirements in late 2015 and early 2016, there was an easing after this as the slowdown in lending and unimpressive growth caused monetary authorities to double down on monetary stimulus in order to offset these measures and stimulate credit growth in the middle and latter part of the year.
3.1.3 Market & Liquidity Risk and Risk Appetite
Market and liquidity risks rose in 2015 and the early part of 2016. The level of market uncertainty was linked to delays in the process of monetary normalization as there were heightened expectations that the US Federal Reserve would increase interest rates and that monetary
policy would be less accommodative. This contributed to a widening in credit spreads. A significantand negative side-effect of the prolongation of monetary stimulus has been that the low interest rate environment has aggravated the search for yield and increased the demand for more risky, high yielding investments. In turn, this puts further strain on the viability of life insurers and pension funds. There was a waning of risk appetite in the case of the emerging economies, as the downturn in their economic performance resulted in substantial outflows in 2015 andthe early part of 2016. There was howeverarecovery incapitalflowsto these markets in the second and third quarters of 2016asfinancialconditions eased.
3.1.4 Emerging Market Conditions
Inthefirstfifteenmonthsoftheperiodunder review, emerging economies experienced heightened risks due to declining oil and commodity prices, the appreciation of the US dollar, capital outflows, down-sizing ofoperations for industries that had built up large excess capacity and the loss of correspondent banking relations (CBRs).
Negative price shocks resulted in output declines, lower revenues
and increased public sector indebtedness for the commodity exporters. This led to the need for deleveraging and a winding down of spending that had been ramped up amid rising commodity prices and low interest rates. Meanwhile, the appreciation of the US dollar negatively impacted economies such as Hungary, Indonesia and Mexico3 whose corporate sectors had high levels of foreign currency exposure on the international markets.
The issue of de-risking also became a critical concern as the withdrawal ofCBRsdisruptedcross-borderflowof funds for jurisdictions in Africa, theCaribbean,EastAsiaandPacific,Central Asia and the Middle East, which experienced termination, restriction or significant alterationin their correspondent banking relationships (CBRs).
There was some abatement of these risks in the latter part of 2016 with commodity prices stabilizing and some improvements in the external account positions of these economies.
3.2 External Macroeconomic Risk The critical issues affecting Belize in 2015 and 2016 included sharp
3 According to IMF Global Financial Stability Report October 2015, for these countries their proportion of foreign currency non-financial corporate debt exceeds 50% of total corporate debt.
declines in its production of commodities for the export market, the impact of global financial de-risking and the persistence of low and negative interest rates in developed economies.
While there were steady declines in commoditypricesin2015andthefirsthalf of 2016, the revenue losses were mainly due to internal production constraints. At an aggregate level, loans by domestic banks to commodity producers accounted for 12.1%4 of their portfolio and for less than 10% of their total non-performing loans. However, the risks were not spread evenly across the system since lending for the sugar and banana sectors was highly concentrated in two banks.
Withthefirstroundimpactofglobalde-risking and loss of CBR’s hindering international financial flows foraffected banks, management of foreign asset holdings became a critical issue toaddresstheartificialshortagesthatwere created. The viability of these institutions and MTSPs was also challenged as increased regulatory and transactional costs were incurred to cope with changes in the system.
3.2.1 Declining commodity pricesCommodity prices sank in 2015 as a result of abundant supplies and weaker growth prospects in China
4 As of September 2016.

18 Central Bank of BelizeAnnual Financial Stability Report
19Central Bank of BelizeAnnual Financial Stability Report
and other emerging economies, which are both significantconsumers and producers. With declines being recorded for most energy commodities (coal being the exception), the energy commodity price index moved downward by 45.1% in 2015 and by 15.3% in 2016. Non-energy prices also dipped by 15.1% in 2015 and 2.5% in 2016 with fertilizers, metals and minerals experiencing the largest price cuts over the two-year period.
In 2017, the commodity price index for energy is forecasted to rise by 25.8% reflecting higher prices forcrude oil, natural gas and coal. The non-energy price index is expected to rise by 5.0% mainly due to higher prices for metals and minerals. As a price-taker, Belize’s trade performance depends partly on export volumes and partly on the specific trading arrangement
negotiated for certain commodities. The major export commodities are sugar, citrus juices, marine products and bananas. Petroleum accounted for approximately 10.0% of Belize’s exports on average over the past three years.
In assessing the impact of lower commodityearningsonthefinancialsystem, the banks were subjected to stress tests which indicated that they had sufficient capital todeal with increases in the level of non-performing loans. However, concentration risk is high for the sugar and banana sectors, which, when combined, account for 60% of loans extended to commodity producers.
3.2.2 Continuingtrendsinfinancialde- risking
A World Bank survey in 2015 identified Africa, the Caribbean,
Chart 3.2: Composition of Domestic Exports: 2016 Chart 3.3: Domestic Banks Lending Portfolio: 2016
Sugar27%
Citrus Juices18%
Molasses2%
Bananas18%
Marine Products11%
Papayas1%
Petroleum6%
Other exports17%
Tertiary Activities
44%
Secondary Activities
40%
Sugar 5%
Citrus1%
Bananas4%
Other 3%
Marine Products
2% Mining & Exploration
1%
EastAsiaandPacific,CentralAsiaand the Middle East as being key jurisdictions where correspondent banking relationships (CBRs) were terminated, restricted or significantly altered. Most of thefinancial institutions that wereterminating or restricting these CBR services were based in the United States and the United Kingdom. The survey revealed that the banks and authorities in the affected jurisdictions viewed lack of profitability,changeinriskappetiteand regulatory parameters as the main reasons for being subjected to de-risking. For their part, the large international banks cited AML/CFT related issues as their prime concern. The World Bank Survey identifiesthe Caribbean as one of the regions most affected by the decline in foreign correspondent banking
Chart 3.4: Domestic Banks’ Foreign Currency Inflows and Net Foreign Assets
Chart 3.5: Foreign Currency Inflows vs. Actual Performance for the Tourism Sector
relationships. Boyce & Kendall (2016) notes the primary economic impact is felt in reduced services, higher costs and loss of business for theCaribbeanfinancialsector.Thereare also negative secondary impacts on the real sector due to constraints on payments such as lengthened time periods for settlements and possible loss of foreign direct investment. The social impact includesreducedfinancialinclusionand the loss of remittances.
In Belize, correspondent bank de-risking has significantly increasedoperational risk in the financialsector, particularly for commercial banks and money transfer service providers (MTSPs). During the last two years, three domestic banks and four international banks were affected as full banking services with their main correspondent banks were terminated and wire transfer services were only partially
0
50
100
150
200
250
300
350
400
2,000
2,100
2,200
2,300
2,400
2,500
2,600
2,700
2,800
2,900
2012 2013 2014 2015 2016
Ne
t Fo
reig
n A
sse
t P
osi
tio
n (
$m
n)
Fore
ign
Cu
rre
ncy
In
flo
ws
($m
n)
Foreign Currency Inflows ($mn) Net Foreign Asset Position ($mn)
500
550
600
650
700
750
800
0
200
400
600
800
1,000
1,200
1,400
2012 2013 2014 2015 2016
No
. of
Arr
iva
ls (
'00
0)
Tou
rism
Exp
en
dit
ure
vs.
In
flo
ws
($m
n)
Tourism Expenditure ($mn) Stayover Arrivals Cruiseship Arrrivals Tourism Inflows ($mn)

20 Central Bank of BelizeAnnual Financial Stability Report
21Central Bank of BelizeAnnual Financial Stability Report
Chart 3.6: Redistribution of Foreign Currency Inflows in the Domestic Banking System (%)
Chart 3.7: Distribution of Net Foreign Assets in the Domestic Banking System (%)
30 36 40 39
34 26 17 18
8 101 1
13 10
12 13
14 1730 30
0
20
40
60
80
100
2014 2015 Sept 2016 2016Shar
e of
For
eign
Cur
renc
y In
flow
s (%
)
BANK 1 BANK 2 BANK 3 BANK 4 BANK 5
Chart 3.8: Distribution of Income from Foreign Exchange Transactions in the Banking System
2923 24
36
56
3643
28
-5
130
0
20
17 19 18
2
12 14 18
-20
0
20
40
60
80
100
120
2014 2015 Sept 2016 2016Distr
ibut
ion o
f Net
Fore
ign A
sset
s (%)
BANK 1 BANK 2 BANK 3 BANK 4 BANK 5
0
5
10
15
20
25
2006 2007 2008 2009 2010 2011 2012 2013 2014 2015 2016
$mn
BANK 1 BANK 2 BANK 3 BANK 4 BANK 5
restored. In their efforts to establish new correspondent relationships, some domestic banks closed existing accounts with MTSPs placing a strain on the operational viability of these institutions. From a financial system stabilityperspective, the impact of de-risking in Belize had implications for foreign reserve currency management and the sustainability of financialinstitutions.
(i) Foreign Currency ManagementIn 2015, the net foreign asset position of the domestic banks improved by 10.6% notwithstanding a 0.5% dip in foreign currency inflows. However,there were declines in both inflows(30.8%) and net foreign assets (13.0%) duringthefirstthreequartersof2016.The steeper than expected decline in foreign inflows partially reflected theloss of correspondent bank relations as foreign exchange earners kept foreign currency abroad to hedge against operational risk. This was particularly evident in the tourism sector, which has a tendency to keep funds offshore. The increases in 2016 in stay-over arrivals (13.2%) and tourism earnings (5.6%) were not matched by a commensurate riseintourisminflows,whichregistereda marginal 0.3% uptick.
Another significant impact of de-risking was the redistribution of foreign exchange inflows across the domestic
banking system. The loss of CBRs by one of the larger players in the foreign exchange market meant that they could nolongerfacilitateinflowsandoutflowswhile still accounting for the largest share of foreign assets in the system. This rapid change in the organization of the market posed a challenge for the distribution of foreign assets to meet domestic foreign exchange demand.
One bank experienced a decline in its share of inflows from 34.0% in 2014to17.4% in thefirst threequartersof2016.Despitethereductionininflows,this bank still held the lion's share of foreign assets in the market, accounting for some 43% of the domestic system at the end of September 2016. It thus became necessary for Central Bank to direct the redistribution of foreign exchange within the domestic system so as to accommodate the smooth movement of payments and receipts. To this end, Exchange Control Direction #2 was amended to require authorised dealers that were unable to conduct foreign currency transactions to sell their foreign currency holdings either to the Central Bank or to an Authorised Dealer. In September 2016, Exchange Control Direction #19 was introduced in order to bring about the redistribution of foreign currency holdings among the banks, by enabling the Central Bank to issue directions to those dealers whose foreign asset holdings exceeded the average for the

22 Central Bank of BelizeAnnual Financial Stability Report
23Central Bank of BelizeAnnual Financial Stability Report
entire system. The direction provided transparency on the Central Bank's approach to the calculation of the foreign asset availability position for each institution.
(ii) Impact of Financial De-risking on Viability of Financial Institutions
(a) Domestic BanksOf the domestic banks that were directly impacted, one is considered to be of systemic importance because of its size and level of interconnectedness in the financialsystem. Prior to 2015, this bank’s share of earnings from foreign exchange transactions were the highest in the system accounting for 40% of the market.5 After the termination of relationships with its main correspondent bank, these earnings fell to 25.6%6 of market share with declines occurring in 2015 and 2016. The reduction in income from foreign exchange transactions, higher cost of compliance and search for alternatives were added stress factors during a contractionary period when profitability is alreadybeing compressed.
(b) International BanksSince 2003, when the International Banking Act was activated, the locally licensed international banks have been facilitating investments
5 Average from 2012 - 2014 6 December 2016
by non-residents in the tourism and real estate sectors of the domestic economy. Two of the five bankscurrently account for about 60% of the market and have ownership links with domestic banks. For one of these banks, no correspondent relationship was restored after these links were severed in 2015, while the second was able to obtain wire transfer services. To cope with the loss of services, clients moved to other institutions abroad which shrank the deposit base by 38.4% between December 2014 and December 2016 and heightened the liquidity risk of the sector.
The locally licensed international banks are required to maintain a minimum ratio of liquid assets to average deposit liabilities of 24%. Maintaining sufficient liquidity hasimplications for the long term viability offinancial institutions,as it enablesthem to meet short term obligations and withstand stress events. At an aggregate level, the industry maintained these requirements although there was a decline in the average from 54.8% in 2014 to 45.1% in 2016. Two institutions experienced notable declines in liquidity during the period reviewed. In the case of one bank, the ratio plummeted from 59.6% to 34.0% in the second quarter of 2015 and declined further, ending the year at 28.9%. The other bank’s operations came to a virtual standstill
Chart 3.9: International Banks’ Loan to Deposit Ratio (%)
Chart 3.10: International Banks’ Liquid Assets to Deposit Ratio (%)
and its liquid asset ratio fell below the 24% requirement in the last quarter of 2015, and remained below the legal requirement throughout 2016. At the end of December its liquid asset ratio stood at 7.6%.
(iii) Money Transfer Service Providers (MTSPs)
As key facilitators of remittance transfers, MTSPs make it possible for persons without formal access to the banking system to obtain and send funds internationally faster and at lower cost. Currently, there are five registeredMTSPs in theBelizeanmarket with a network of 83 branches and sub-agents distributed throughout the country. In 2015, remittance inflows from MTSPs accounted for62.9%oftotalremittanceinflowsintoBelize.
Despite being important for financialinclusion, this sector has been
traditionally perceived as ‘high risk’ because of the inherent nature of the business (Durner and Shetret 2015). When small transactions are aggregated and deposited in lump sums, this results in the obscuring of transactional details and such transactions are deemed more risky if a jurisdiction's adherence to AML/CFT international best practices is considered weak. The recent spate of de-risking activities have had a direct impact since domestic banks seeking to establish relationships with other correspondent banks have closed accounts linked to these MTSPs. In May 2015, upon losing its main correspondent bank, one bank made the decision to close accounts for 11 MTSP sub-agents. Of these, four were forced to shut down and the remaining seven continued to operate but on a fully cash basis. This drastic measure meant that funds
0
50
100
150
200
250
Dec-14 Mar-15 Jun-15 Sep-15 Dec-15 Mar-16 Jun-16 Sep-16
Lo
an
to
De
po
sit
Ra
tio
(%
)
Industry Average Bank 1 Bank 2
-10
0
10
20
30
40
50
60
70
80
Dec 2014 Mar 2015 June 2015 Sept 2015 Dec 2015 Mar 2016 June 2016 Sept 2016 Dec 2016Liq
uid
Asse
ts t
o D
ep
osit
Ra
tio
(%
)
Industry Average Bank 1 Bank 2 Minimum Requirement
24 Central Bank of BelizeAnnual Financial Stability Report
25Central Bank of BelizeAnnual Financial Stability Report
which could have been monitored in the banking system, were now being channelled to the informal sector. The use of cash also increased operational risk since the logistics of holding and transporting cash adds to security concerns. To date, four of these seven MTSPs have been able to restore banking relationships.
In other cases, while some sub-agents were able to maintain accounts with the domestic banks, over a period extending from October 2015 to May 2016, these sub-agents were unable to receive net settlements from their international counterparts which made it difficultto facilitate incoming transfers due to local customers. As an interim short-term measure, some MTSPs utilised ‘float’moneyfromparentcompaniestopay out to customers and further limits were placed on the amount of money customers could send abroad.
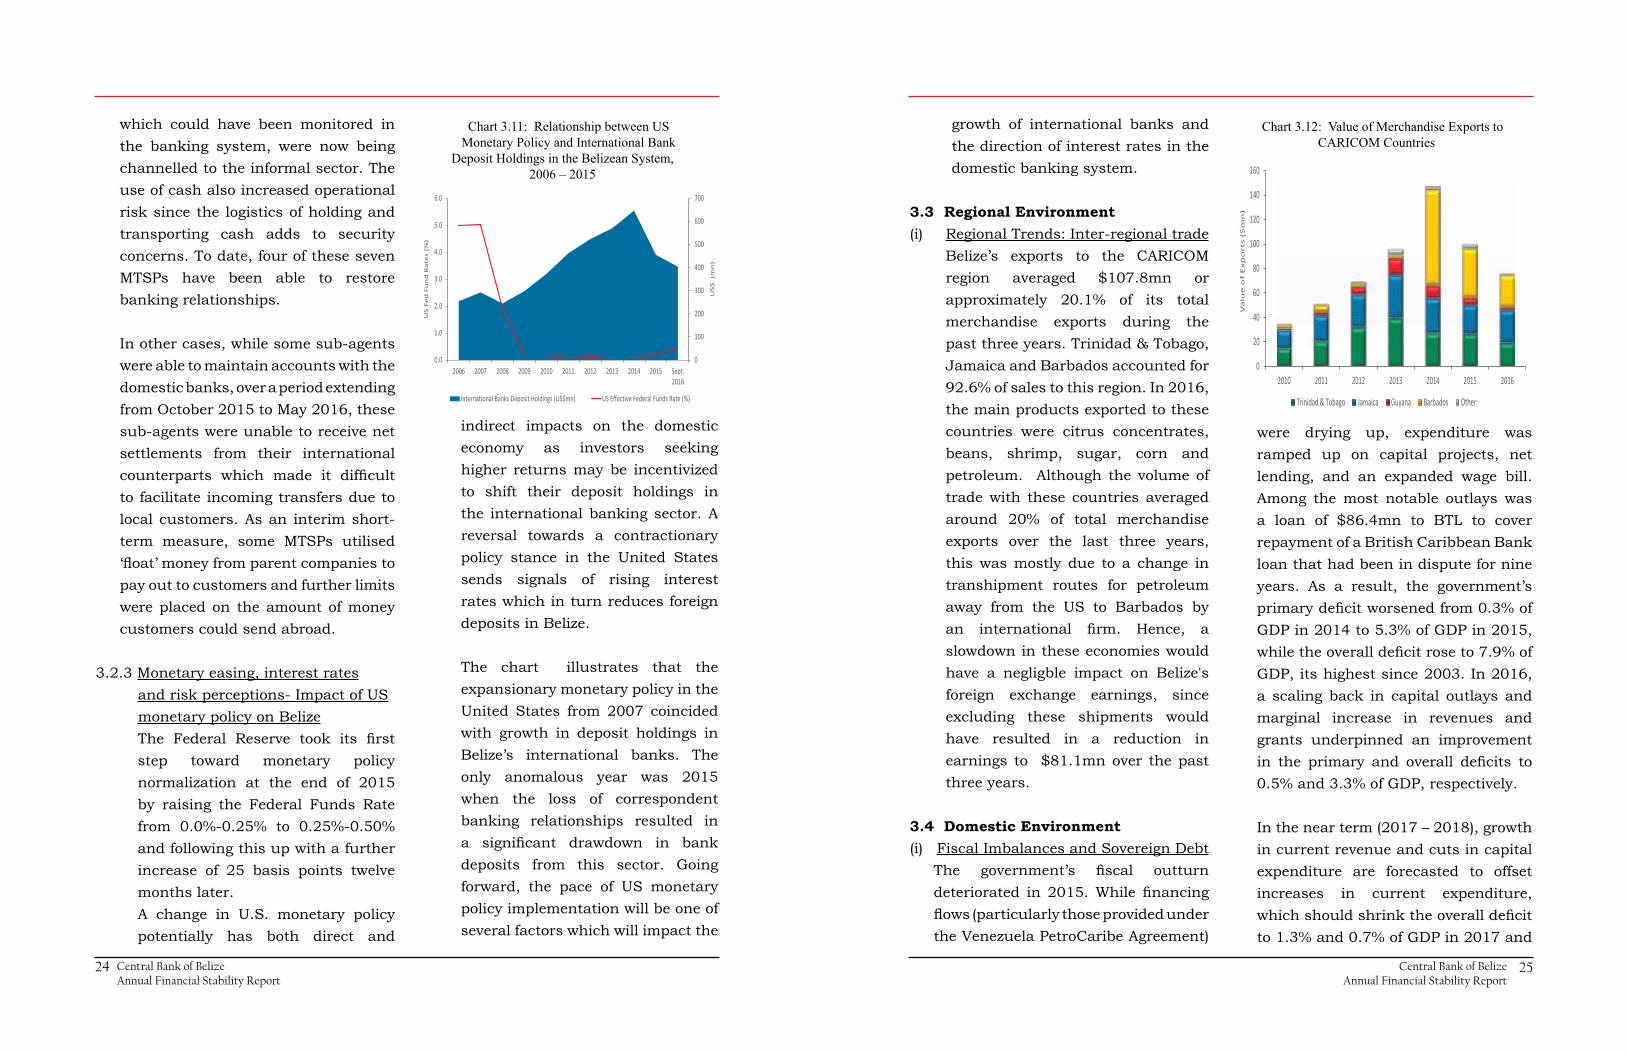
3.2.3 Monetary easing, interest rates and risk perceptions- Impact of US monetary policy on Belize
The Federal Reserve took its firststep toward monetary policy normalization at the end of 2015 by raising the Federal Funds Rate from 0.0%-0.25% to 0.25%-0.50% and following this up with a further increase of 25 basis points twelve months later. A change in U.S. monetary policy potentially has both direct and
indirect impacts on the domestic economy as investors seeking higher returns may be incentivized to shift their deposit holdings in the international banking sector. A reversal towards a contractionary policy stance in the United States sends signals of rising interest rates which in turn reduces foreign deposits in Belize.
The chart illustrates that the expansionary monetary policy in the United States from 2007 coincided with growth in deposit holdings in Belize’s international banks. The only anomalous year was 2015 when the loss of correspondent banking relationships resulted in a significant drawdown in bankdeposits from this sector. Going forward, the pace of US monetary policy implementation will be one of several factors which will impact the
Chart 3.11: Relationship between US Monetary Policy and International Bank
Deposit Holdings in the Belizean System, 2006 – 2015
0
100
200
300
400
500
600
700
0.0
1.0
2.0
3.0
4.0
5.0
6.0
2006 2007 2008 2009 2010 2011 2012 2013 2014 2015 Sept.2016
US
$ (m
n)
US
Fe
d F
un
d R
ate
s (%
)
International Banks Deposit Holdings (US$mn) US Effective Federal Funds Rate (%)
growth of international banks and the direction of interest rates in the domestic banking system.
3.3 Regional Environment(i) Regional Trends: Inter-regional trade
Belize’s exports to the CARICOM region averaged $107.8mn or approximately 20.1% of its total merchandise exports during the past three years. Trinidad & Tobago, Jamaica and Barbados accounted for 92.6% of sales to this region. In 2016, the main products exported to these countries were citrus concentrates, beans, shrimp, sugar, corn and petroleum. Although the volume of trade with these countries averaged around 20% of total merchandise exports over the last three years, this was mostly due to a change in transhipment routes for petroleum away from the US to Barbados by an international firm. Hence, aslowdown in these economies would have a negligble impact on Belize's foreign exchange earnings, since excluding these shipments would have resulted in a reduction in earnings to $81.1mn over the past three years.
3.4 Domestic Environment(i) Fiscal Imbalances and Sovereign Debt
The government’s fiscal outturndeteriorated in2015.While financingflows(particularlythoseprovidedunderthe Venezuela PetroCaribe Agreement)
were drying up, expenditure was ramped up on capital projects, net lending, and an expanded wage bill. Among the most notable outlays was a loan of $86.4mn to BTL to cover repayment of a British Caribbean Bank loan that had been in dispute for nine years. As a result, the government’s primarydeficitworsenedfrom0.3%ofGDP in 2014 to 5.3% of GDP in 2015, whiletheoveralldeficitroseto7.9% of GDP, its highest since 2003. In 2016, a scaling back in capital outlays and marginal increase in revenues and grants underpinned an improvement in the primary and overall deficits to0.5% and 3.3% of GDP, respectively.
In the near term (2017 – 2018), growth in current revenue and cuts in capital expenditure are forecasted to offset increases in current expenditure, whichshouldshrinktheoveralldeficitto 1.3% and 0.7% of GDP in 2017 and
Chart 3.12: Value of Merchandise Exports to CARICOM Countries
0
20
40
60
80
100
120
140
160
2010 2011 2012 2013 2014 2015 2016
Va
lue
of
Exp
ort
s (
$m
n)
Trinidad & Tobago Jamaica Guyana Barbados Other

26 Central Bank of BelizeAnnual Financial Stability Report
27Central Bank of BelizeAnnual Financial Stability Report
2018, respectively, while the primary balance should become positive at 1.8% and 2.4% of GDP in 2017 and 2018, respectively. The implementation of revenue enhancement measures is expected to improve collections of taxes on goods and services, international trade and non-tax revenue. Driving the growth in current expenditure in 2017 are wage increases of 5.5%, fees associated with debt restructuring and higher interest payments on domestic debt, although external interest payments will decline marginally.
Solvency and liquidity issues continue to be of concern as the ratio of Government debt to GDP increased from 74.7% to 88.0% in the two-year period under review. The ratio is expected to peak at 89.3% in 2017 and then gradually decline to 70.5% by 2022. The composition of debt is expected to change with a greater
reliance on domestic borrowing pushing up its share to GDP while the ratio of the external debt to GDP trends downward. Meanwhile, after rising from 16.6% in 2015 to 18.1% in 2016, the share of the government's current revenues devoted to debt servicing is projected to average 19.6% in the next fiveyears.Thecountry'sexternal debt servicing capacity relative to officialforeign reserves is also projected to deteriorate in the medium term, shooting up from 16.9% in 2015 to 38.4% by 2020.
Whileannualfluctuationsareexpected,Central Government is relying on the domestic issuance of short and long termsecuritiestofinanceitspaymentobligations of $393.2mn for settlement of the BTL nationalization, which will be undertaken in two equal installments in 2016 and 2017.
Chart 3.13: Debt Solvency Ratios
0
20
40
60
80
100
2011 2012 2013 2014 2015 2016 2017 2018 2019 2020 2021 2022
Deb
t to
GD
P Ra
tios
(%)
External Debt/GDP Domestic Debt/GDP Total Debt/GDP
0
5
10
15
20
25
30
35
40
45
50
2014 2015 2016 2017 2018 2019 2020 2021
Debt
Servi
ce Ra
tios (%
)
Total Debt Service/ Revenue (%) External Debt Service/Reserves (%)
Chart 3.14: Debt Service Indicators
Chart 3.16: Domestic Banks Distribution of Assets ($mn), 2013 - 2016
Chart 3.15: Distribution of Government Securities ($mn), 2010 - 2016
0
50
100
150
200
250
300
T-Bills T-Notes T-Bills T-Notes T-Bills T-Notes
Central Bank of Belize Domestic Banks Other Sector
Dsitr
ibutio
n of G
over
nmen
t Sec
uritie
s ($m
n)
2013 2014 2015 2016
0 500 1,000 1,500 2,000 2,500 3,000 3,500
2013
2014
2015
2016
Holdings of Central Government Securities Loans to Public Sector
Loans to Private Sector Other Assets

28 Central Bank of BelizeAnnual Financial Stability Report
29Central Bank of BelizeAnnual Financial Stability Report
(ii) Domestic Banking System - Exposure to Government Debt
During 2015 and 2016, the Central Bank held the bulk of the government’s long term securities with an average share of 63.3%, while holdings by the other sector entities averaged 44.2%. Prior to 2014, the domestic banks had been holding approximately 95% of the outstanding Treasury bill issue. However, with the interest rate plummeting to 0.06%, their holdings fell to 75.0% in 2015, with the remainder being shared equally between the Central Bank and other financial institutions. There was afurther decline in the Treasury bill rate to 0.03% at the end of the third quarter of 2016. As a result, the holdings of the domestic banks continued to decline. Their exposure to government debt is currently minimal with securities amounting to 7% of total assets and government loans accounting for less than 1%.
The government's issuance of securities is slated to increase substantially in 2017 with further increases thereafter. It is therefore conservatively estimated that the ratio of commercial banks’ holdings of government securities to total assets will rise from 5% in 2015 to 9% in 2017.
(iii) External Sector Imbalances and Reserve Adequacy
Reserve adequacy is a key determinant of Belize’s financialstability because the economy is very dependent on imports and domestic banks also need to facilitate other private sector outflows such asremittances and profit repatriation.If foreignexchange is insufficient tomeet demands and must be rationed thisreducestheefficiencyofprivatesector operations.
After nine consecutive years of growth,thegrossofficialreservesfellby approximately $100.0mn in 2015 to $873.8mn reflecting a wideningcurrentaccountdeficit,compensationpayments to the previous owners of BTL and BEL, and increased external debt servicing. Although the current account balance improved in 2016, reserves declined by a further $120.7mn to $753.1mn due to lower net loan disbursements to government,andoutflowsrelatedtothe BTL settlements. In the medium term, reserves are being projected to decline mainly due to lower loan disbursementsandthefinalizationofthe BTL settlement. Import coverage is consequently projected to shrink from 4.4 months in 2016 to 3.4 months by 2018.
4.1. Private Sector CreditLending by domestic deposit taking institutions (DTIs) decelerated to 3.7% in 2015 and slowed further to 2.8% by 2016. The deceleration reflected tepid creditdemand, especially for large commercial credit from the banking sector, lower risk appetite on the part of domestic banks and the continuation of write-offs required to reduce the level of non-performing legacy loans held on banks’ balance sheets.
(i) Credit to Household SectorLoans have been split almost evenly between the household and commercial sectors over the past four years. The average growth of household debt was 5.9% in the five year period 2010-2014with a deceleration to 3.4% during 2015 before picking up pace to grow by 5.0% in 2016. Meanwhile, the ratio of household
-10
-5
0
5
10
15
20
25
2011 2012 2013 2014 2015 2016
Cre
dit
Gro
wth
(%)
Domestic Banks' Commercial Credit GrowthDomestic Banks' Household Sector Credit GrowthCredit Unions' Commercial Credit GrowthCredit Unions' Household Sector Credit Growth
debt to GDP has steadily increased from 33.7% in 2010 to 36.1% in 2015 and 38.3% by 2016. At the end of 2016, the domestic banks accounted for 69.4% of total lending to households.
(ii) Credit to Commercial SectorA single large loan to the sugar industry accounted for much of the 6.2% increase in credit to the commercial sector in 2014. In the following year, net lending for commercial activities decelerated to 4.5% and slowed to a crawl in 2016 with an increase of only 0.5%. The slowdown was partly due to write-offs of non-performinglegacyloans,whichintensifiedin 2016. During 2015 and 2016, cumulative new loan disbursements were mainly for tourism, manufacturing and transport, and these were partly offset by repayments from entities involved
Chapter 4
Financial Performance of Deposit Taking Institutions
Chart 4.1: Composition of Lending, by Sector Chart 4.2: Credit Growth(%), by Sector
0
10
20
30
40
50
60
-
500
1,000
1,500
2,000
2,500
3,000
2011 2012 2013 2014 2015 2016
Syst
em N
PL W
rite
-Off
s ($
mn
)
Priv
ate
Sect
or
Cre
dit
($m
n)
Domestic Banks Commercial Credit Domestic Banks Household SectorCredit Unions Commercial Credit Credit Unions Household SectorSystem NPL Write-offs

30 Central Bank of BelizeAnnual Financial Stability Report
31Central Bank of BelizeAnnual Financial Stability Report
Chart 4.3: Composition of Household Debt from Domestic DTIs, 2016
Domestic Bank Personal Loans
33%
Domestic Bank Residential Real Estate &
Construction36%
Credit Unions Residential
Real Estate & Construction
13%
Credit Unions Personal Loans
18%
in merchandise trade and the utilities. Despite loan write-offs of some $32.5mn in 2015, the ratio of the domestic banks’ non-performing loans to total loans (NPL ratio) edged up from 19.0% to 19.6% in
2015 as a result of a 6.9% growth in non-performing loans mainly concentrated in commercial real estate. In 2016, the NPL ratio dropped to 11.9% due to write-offs of $52.7mnanddeclassificationofasizeable
Chart 4.4: Sectoral Distribution of New Commercial Lending1
Chart 4.5: Performance of Lending to the Commercial Sector
-30 -20 -10 0 10 20 30 40
Agriculture
Marine Products
Manufacturing
Building & Construction
Utilities
Transport
Tourism
Distribution
Real Estate
Professional Services
2016 2015
0
10
20
30
40
50
60
70
80
90
0
50
100
150
200
250
300
Com
mer
cial
Con
stru
ctio
n
Tour
ism
Agr
icul
ture
Dis
trib
utio
n
Min
ing
& E
xplo
rati
on
Com
mer
cial
Rea
l Est
ate
Mar
ine
Prod
ucts
Tran
spor
t
Prof
essi
onal
Ser
vice
s
Man
ufac
turi
ng
Ente
rtai
nmen
t
Fore
stry
Uti
litie
s
NPL
Rat
io (%
)
Leve
l of L
endi
ng &
Non
-Per
form
ing
Loan
s ($
mn)
Loans ($mn) NPLs ($mn) NPL Ratio (%)
1 Domestic Banks and Credit Unions 1 Available for domestic banks only
non-performing loan to current status. The categories with themost significantimprovements in asset quality were commercial real estate (which saw a fall in NPL ratio from 36.4% in 2015 to 4.7% in 2016), marine products and distribution.
(i) Credit to GDP GapMovements in the credit to GDP ratio relative to its long term trend (credit to GDP gap) can be an indicator of possible systemic imbalance particularly in the case of a positive credit to GDP gap that points to the level of borrower indebtedness being in excess of the long term trend. In Belize, the credit to GDP gap remained relatively low indicative of a lack of buoyancy in the private sector during most of the period reviewed.
For both sectors, the indicator showed that the build-up in risk was negligible since growth in borrowing has not exceeded the long term trend for the household and commercial sectors.
4.2 Domestic Banks(i) Domestic Banking Stability IndexThe indicator of bank stability rose in the firstquarterof2015duetoimprovementsin all of the key areas, including in particular, capital & concentration risk and profitability. The profits of one domesticbankweresignificantlyboostedafter thesale of a valuable piece of property, and this made a sizeable contribution to the industry’s turnaround in profitabilitywhilst boosting capital levels. During the rest of the year, the Index declined by 27.3 basis points (33.2%) as the system’s aggregate return on assets fell from 1.75% to 1.00%, while return on equity fell from 13.07%to7.34%.Theloweringofprofitsreflected reduced net income for twobanks, one of which was in the process of winding down and the other being the bank that had earlier received the windfall from the sale of property and which subsequently saw a return to normalcy in the level of its non-interest income for the remaining period.
Chart 4.6: Domestic Banking Sectors’ Credit to GDP Gap: Commercial Credit vs. Household Credit
-60
-40
-20
0
20
40
60
80
100
Dec-0
6
Jun-
07
Dec-0
7
Jun-
08
Dec-0
8
Jun-
09
Dec-0
9
Jun-
10
Dec-1
0
Jun-
11
Dec-1
1
Jun-
12
Dec-1
2
Jun-
13
Dec-1
3
Jun-
14
Dec-1
4
Jun-
15
Dec-1
5
Jun-
16
Dec-1
6
Cred
it to G
DP G
ap (%
)
Total Credit to GDP Commercial Credit to GDP Household Credit to GDP

32 Central Bank of BelizeAnnual Financial Stability Report
33Central Bank of BelizeAnnual Financial Stability Report
In 2016, the stability index rose by 4 basis points due to an improvement in asset qualitythatreflectedafallintheratioofnonperforming loans to total loans from 14.02% to 10.45%, while the level of NPL (net of provisions) to capital was more than halved from 31.73% to 14.53%. Partly offsetting these improvements was an increase in capital and concentration risk asprofitrepatriationsfromoneinstitutionand losses generated by two others resulted in a decline in the indicator of capital adequacy. The ratio of large loans to regulatory capital fell from 134.51% in December 2015 to 129.98% in December 2016reflectingareductioninlargeloansand an increase in regulatory capital. The level of concentration risk for the system therefore declined.
(ii) Review of 2015Despite a divestment in regulatory capital caused by the winding down of FCIB prior to its sale, the CAR of the domestic banking system rebounded from a decline of 1.0% in 2014, to increase by 1.5% to 24.9% during 2015. The impact of FCIB's divestment was neutralized by an increase in the capital buffers of the other banks via a combination of capital injections and earnings retention that boosted the system’s total regulatory capital by $39.6mn. The four-year period that the Central Bank had specified for the write-off of legacyNPLs concluded on 30 November 2015 and during that year some $32.5mn in NPLs were written off. The combination of write-
Chart 4.7: The Domestic Banking Stability Index
-0.4
-0.2
0.0
0.2
0.4
0.6
0.8
1.0
Dec-
13
Mar
-14
Jun-
14
Sep-
14
Dec-
14
Mar
-15
Jun-
15
Sep-
15
Dec-
15
Mar
-16
Jun-
16
Sep-
16
Dec-
16
Bank
Sta
bilit
y Ind
ex
Capital and Concentration Risk Asset quality Profitability Liquidity Foreign exchange risk BSI
offs, additional loan loss provisioning and loan growth facilitated a decline in the system’s non-performing loan (less specific loan loss provisions) ratio from7.02% in 2014 to 6.70% in 2015.
Registering 1.0% in 2015, earnings of the domestic banking system met the minimumROAthresholdforthefirsttimein five years. ROE also improved from0.03% to 7.34%, which is significantlyabove the 1.0% benchmark. The improvements reflected a turnaroundin performance as after a small profitof $0.12mn in the previous year, the domesticbankingsystemreportedprofitsof $31.2mn in 2015. This was largely due to two banks: one which had received a substantial dividend payment from a subsidiary in early 2015, and another, which registered increases in interest and non-interest income of 8.3% and 13.0%, respectively, and an 18.3% reduction in non-operating expenses.
The banking system was very liquid, with holdings of liquid assets growing by 15.8% and crossing the $1.0bn threshold for the firsttime.Asaresult,theliquidassetstodeposits ratio stood at 39.8% compared to the required level of 23.0% and the ratio of excess liquid assets to required reserves grew from 60.1% to 76.0%.
(iii)Review of 2016In 2016, the system’s regulatory capital underwent a marginal 0.4% contraction. The negligible decline coincided with a
3.7% rise in risk-weighted assets, the combination of which helped to reduce the system’s CAR by 1.1% to 23.8%. All banks remained comfortably above the 9.0% minimum requirement with CARs ranging from 12.54% to 107.31%. There was further improvement in the NPL ratio (netofspecificprovisions)ofthedomesticbanks (from 6.70% to 3.01%) with this being mainly due to $52.8mn in write-offs, with support coming from additional provisions, and further growth in loans. Since the implementation of the revised Loan Loss Provisions Requirements on 1 December 2011, NPLs have fallen by $129.3mn. 2016 also proved to be another profitable year for the domestic bankingsystem with $20.3mn in profits beingreported,whichreflectedtheimprovementin loan portfolios following several years of provisioning and write-offs. The slight dip in profits relative to 2015was primarilydue to the expensing of additional loan loss provisions. The latter contributed to declines in ROA from 1.00% to 0.63% and ROE from 7.34% to 4.80%. High levels of liquidity continued to be the order of the day with liquid assets growing by an additional 1.1% to $1.1bn and the ratio of excess liquid assets to deposits remaining stable at 39.65%.
4.3 International BanksRegulatory capital in the international banking sector surged by 30.6% in 2015 aided by capital injections and profit retention that coincided with a5.1% reduction in risk weighted assets.

34 Central Bank of BelizeAnnual Financial Stability Report
35Central Bank of BelizeAnnual Financial Stability Report
The latter reflected a contraction in thelevel of deposits due to the loss of some correspondent banking relationships. The system’s CAR consequently jumped from 19.26% to 26.50%, the highest it has been in the last five years. While total NPLsincreased by 6.4%, the NPL ratio of these institutions continued on a downward trend, reducing from 8.28% to 7.66% in
2015, due to the allocation of additional specificloanlossreservesandwrite-offs.The non-recurrence of a sizable one-off transaction that boosted income in the previousyearresultedinprofitsshrinkingsignificantly to US$5.5mn during 2015.Consequently, ROA fell from 4.56% to 0.77% while ROE plunged from 50.07% to 6.21%. With deposits down by 28.1%
Chart 4.8: Commercial Banks Capital Adequacy
21.021.522.022.523.023.524.024.525.025.5
0
500
1,000
1,500
2,000
2,500
2012 2013 2014 2015 2016
Capi
tal A
dequ
acy
Ratio
(%)
Regu
alto
ry C
apita
l & R
isk
Wei
gthe
d As
sets
($m
n)
Regulatory Capital Risk Weighted Assets Capital Adequacy Ratio
Chart 4.9: Domestic Banks' Asset Quality Chart 4.10: Domestic Banks’ Profitability
0
2
4
6
8
10
12
0
50
100
150
200
250
300
350
2012 2013 2014 2015 2016
NP
L R
atio
(N
et
of
Spe
cifi
c P
rovi
sio
ns)
(%
)
No
n-p
erf
orm
ing
Loa
ns
& N
PL
Wri
te-o
ffs
($m
n)
Write-offs ($mn) NPLs ($mn) NPL ratio (net of specific provisions)
-5
0
5
10
15
20
25
30
35
-6
-4
-2
0
2
4
6
8
10
12
2012 2013 2014 2015 2016
Ch
an
ge
in
Sp
ecif
ic P
rovis
ion
ing
Le
ve
ls (
$m
n)
Pro
fita
bil
ity R
ati
os
(%)
Specific Provision Increases ROA ROE
due to the loss of correspondent banking relationships, the sector’s liquidity was negatively impacted. At the end of the year, total holdings of excess liquid assets were 41.1% lower than the prior period’s position.
During 2016, there was a marginal reduction in the CAR as a 9.82% expansion in risk-weighted assets outpaced a 4.7% increase in regulatory capital. The expansion in risk-weighted assets was driven by one bank which registered a 128.2% increase after it re-classifiedsome of its holdings and assigned a risk weight of 100% compared to the zero risk weight that had been assigned earlier. Notwithstanding this, at 24.60% the sector’s capital adequacy ratio continued to be significantly above the 10% legalrequirement. Similarly, by December 2016, an additional decline of 14.3% in
deposits led to a further reduction in the system’s holding of excess liquid assets to US$179.8mn. One bank's liquidity position deteriorated and fell below the 24.0% statutory requirement but as a whole, the sector’s liquid assets to deposits ratio stood at 45.0% in 2015 and 45.13% in 2016.
4.4 Credit UnionsCredit union assets grew by a robust 8.6% in both 2015 and 2016 with lending up by 7.4% and 8.9% in each of these years. Due to the expensing of provisions for NPLs,thesector’snetprofitsdroppedby14.6% in 2015, but this was followed by a recovery in 2016 when a 10.2% increase innetprofitswasrecorded.Allthecreditunions exceeded the 1.0% benchmark for ROA and ROE, which, for the sector as a whole, stood at 4.3% and 24.5%, respectively, in 2016.
Chart 4.11: International Banks’ Profitability
16.1 17.419.3
26.524.6
0
5
10
15
20
25
30
2012 2013 2014 2015 2016
Capital Adequacy Ratio (%) Legal Requirement (%)
Capi
tal A
dequ
acy R
atio
(%)

36 Central Bank of BelizeAnnual Financial Stability Report
37Central Bank of BelizeAnnual Financial Stability Report
The ratio of non-performing loans (net of specific loan loss provisions) remainedbelow the 5.0% threshold for the entire period under review with only one credit union in 2015 and two credit unions in 2016 reporting NPL ratios that exceeded 5.0%. Meanwhile, underpinned by buoyancy in member deposits, the sector maintained high levels of liquidity with
Chart 4.13: International Banks Profitability
0
5
10
15
20
25
0
10
20
30
40
50
60
70
80
2012 2013 2014 2015 2016
NPL R
atio
(net
of s
pecif
ic pr
ovisi
ons)
(%)
Non-
perfo
rmin
g Loa
ns &
Spec
ific P
rovis
ioni
ng
($
US m
n)
Non-performing Loans (US$mn) Specific Provisions (US$mn)
NPL ratio(%) (net of specific provisions)
-40
-30
-20
-10
0
10
20
30
40
-60
-40
-20
0
20
40
60
2012 2013 2014 2015 2016
Prof
itabi
lity R
atio
s (%)
Net I
ncom
e ($U
S m
n)
Net Income (US$mn) ROA (%) ROE (%)
excess liquid asset holdings expanding by 14.3% over the two-year period. This was mostly held in the form of deposits with domestic banks, which stood at $272.8mn (equivalent to 10.2% of domestic banks’ deposit liabilities) by the end of 2016. There was however a notable deceleration in the growth of these holdings from 11.4% in 2015 to 2.9% in 2016 as credit
Chart 4.12: International Banks' Asset Quality
unions began to diversify their investment portfolios by purchasing government securities. The credit unions are required to maintain a net institutional capital to assets ratio of 10%, and during the period under review, small increases were recorded bringing the ratio for the sector to 10.61% at the end of 2016. The steady improvement was partly due to the Central Bank’s direction to the credit unions that did not meet the requirement to appropriate more than the legally required 10.0%oftheirnetprofitstolegalreserves.The number of credit unions that fell short oftherequirementwasreducedfromfiveto three. However, two of the largest credit unions were still below the benchmark and will need to continue building up institutional capital.

38 Central Bank of BelizeAnnual Financial Stability Report
39Central Bank of BelizeAnnual Financial Stability Report
0
100
200
300
400
500
600
700
800
900
1,000
2012 2013 2014 2015 2016
Cred
it Unio
n Asse
ts ($m
n)
Cash and Due from Banks Total Loans Total Assets
3.7
7.7
3.2 3.9 4.0
0
1
2
3
4
5
6
7
8
9
0
15
30
45
60
75
2012 2013 2014 2015 2016
NPL R
atio(n
et of
spec
ific re
serve
s) (%
)
Non-p
erfor
ming
Loan
s ($m
n)
Non Performing Loans (NPLs) NPL Ratio (net of Specific Loan Loss Reserves)
5.4 5.5 5.3 4.2 4.3
28.9 30.2 31.3
24.4 24.5
0
5
10
15
20
25
30
35
2012 2013 2014 2015 2016
Prof
itabil
ity Ra
tios (
%)
Return on Assets Return on Equity
Chart 4.14: Assets of the Credit Union Sector
Chart 4.15: Credit Unions Non Performing Loans
Chart 4.16: Credit Unions Profitability
The resilience of the banking sector was gauged by applying several single factor and forward-looking macroeconomic shocks1. The results of the static tests for three periods were compared, but FCIB was excluded from tests for December 2015 and onward as it was in the process of divesting its operations. In the case of the macroeconomic stress test, the National Bank of Belize was excluded from the model due to its small size and minimal impact on the banking system.
5.1 Domestic Banks The static stress test results indicate that the domestic banking system is somewhat vulnerable to deteriorations in loan portfolios, related party transactions and loan concentration. The impact of the sector-specificshockswasonlysignificantunder the high stress scenario in 2015. The system's response to liquidity shocks was stable in both 2015 and 2016.
(i) Loan Portfolio DeteriorationAlthough the CAR for the system as a whole remained above the 9% minimum requirement under all stress scenarios for this particular shock, some banks would need capital injections under the medium and high shock scenarios. Even so, the
1 The model applied for the macroeconomic stress test was developed during Belize 2011 Financial Sector Assessment Program and for this analysis was applied only to the domestic banking system..
system has notably gained resilience since the capital injections needed to restore undercapitalized banks subjected to medium and high stress shocks fell from $58.9mn in December 2014 to $17.2mn in December 2016.
(ii) Related Party TransactionsBecause of the high capitalization of one bank2 throughout the period, the system also remained above the 9% minimum capital adequacy requirement when related party transactions were stressed. However, vulnerability to related party shocks has increased over the period reviewed, as there was a worsening of the CAR under all scenarios in 2015 and 2016 with capital injections required to bring the system back into compliance rising from $17.8mn in 2014 to $40.9mn by 2016. This was due to the performance of one bank which fell below the requirement for each stress scenario.
(iii) Loan ConcentrationAt the end of 2016, all banks were able to meet the minimum requirements under the low stress scenario for the large loan concentration shock where the assumption was that the three largest borrowers of each bank ceased to service their loans. In the case of the medium and
2 This bank had a pre-shock CAR of 47.48% in Dec 2016.
Chapter 5
Evaluating the Resilience of Deposit Taking Institutions

40 Central Bank of BelizeAnnual Financial Stability Report
41Central Bank of BelizeAnnual Financial Stability Report
Chart 5.1: Impact of Large Loan Default on Domestic Banks Capital Adequacy
high stress3 shocks, however, three banks would be unable to meet the 9% minimum CAR. In the medium shock scenario where the seven largest loans cease to perform, $12.1mn in capital injections would be needed to bring the banks back into compliance, and $25.2mn is needed under the high stress scenario where the ten largest borrowers in excess of 10% of capital cease to make loan repayments.
The system nevertheless displays an increased resilience for all stress scenarios, as capital injections required to bring the system in compliance has declined from $69.1mn in 2014 to $37.3mn in 2016.
3 The top seven and ten largest borrowers in excess of 10% of capital are assumed to become non-performing under the medium and high shocks.
5.2 International Banks The static stress tests applied to the international banks reveal a high level of vulnerability when shocks are applied to liquidity and loan portfolios. On the other hand, the system maintains high resilience to shocks that impact related party transactions and large loans due to increased loan loss provisioning.
(i) Liquidity The low through high stress ‘Liquidity’ shock scenarios assumes that a run on the international banks would cause demand deposit outflows at the rate of 5%, 10%and15%perdayandtimedepositoutflowsof 1%, 2%, and 3% per day, respectively. In 2014, the international banking system would have become illiquid after 41, 21 and 14 days for the low to high stress scenarios
9.4 9.7
111.5
10.7
47.5
7.2 9.0
111.5
8.0
47.5
5.9 8.4
111.5
6.4
47.5
0
20
40
60
80
100
120
Bank A Bank B Bank C Bank D Bank E
Post
Sho
k Ca
pita
l Ade
quac
y Ra
tio (%
)
Low Stress CAR Medium Stress CAR High Stress CAR
and would breach the legal requirement after 19, 10 and 7 days. In 2015, there was a deterioration due to the impact of the de-risking phenomena which spurred significant outflows from the banks andnegatively affected their liquidity. The situation at the end of September 2016 was that the system would become illiquid after 25, 13 and 9 days for the low to high stress scenarios and would breach the legal requirement after 13, 7 and 5 days, respectively.
Chart 5.2: Impact of Liquidity Shock showing no. of days till illiquid
Chart 5.3: No. of Days until Liquidity Shock breaches system's legal requirement
(ii) Loan Portfolio DeteriorationThe banks have improved in resiliency to loan portfolio shocks relative to 2014 when the CAR for the system remained above the 10% minimum requirement only under the low stress scenario. At the end of 2016, the system exceeded the minimum requirement under both the low and medium stress scenarios while the injections needed to restore undercapitalized banks under the high shock scenario fell from $30.1mn in December 2014 to $16.9mn in December 2016.
(iii) Other Credit ShocksThere was also an increase in resiliency to shocks applied to large loans. At the end of 2015, one bank fell below the requirement for all shock scenarios. At the end of 2016, however, only the medium and high stress scenario triggered a bank to fall below the requirement. Also, the level of capital injections required under the high stress scenario to regain compliance declined from $3.6mn in 2015 to $2.8mn at the end of 2016.
In both 2015 and 2016, the CAR for the international banking system showed strong resiliency against shocks to related party transactions under the three scenarios with system CAR remaining firmly above the minimum requirementand no individual bank falling below the threshold.
41
29
25
21
151314
10 9
0
5
10
15
20
25
30
35
40
45
Dec-14 Dec-15 Dec-16
No.
of D
ays
Low Medium High
19
15
13
10
877
65
0
2
4
6
8
10
12
14
16
18
20
Dec-14 Dec-15 Dec-16N
o. o
f Day
s
Low Medium High

42 Central Bank of BelizeAnnual Financial Stability Report
43Central Bank of BelizeAnnual Financial Stability Report
Chart 5.4: Impact of Large Loan Default on International Banks Capital Adequacy
5.3 Macro-stress tests (2017-2012)Using a forward looking model, the banking system’s strength in the event of a decline in economic activity was evaluated over a forecast period ranging from 2017 to 2021. The economic shocks are transmitted via reductions in return on assets and NPL growth and the model assumes that the level of non-performing loans is related to export performance and changes in the cash reserve ratio. In all scenarios, risk weighted assets increased in line with loan growth, while changes incapitalinthecurrentperiodreflectthesumof retainedprofits and capital fromthe previous period. The results of the analysis show that the domestic banking system is able to maintain the 9% minimum capital adequacy requirement at all levels of stress. However, one bank is highly vulnerable to macroeconomic shocks as its level of capitalization is severely impacted under all three scenarios.
Baseline ScenarioAfter adjustments to ensure that the minimum provisioning requirements are met, the entire domestic system remains adequately capitalized at an aggregate level, averaging 23.5% during the forecast period. However, without additional capital injections, one bank would be unable to meet the minimum 9% CAR after 2018 if conditions are adverse. Capital adequacy for the other three banks are in excess of 13% under the baseline scenario throughout the entire forecast period.
Low StressThe principal assumptions under the low stress scenario are reductions in export growth and return on assets of one standard deviation. This results in declines in the system’s CAR from 22.9% in 2016 to 18.5% by 2021. At the disaggregated level, capitalization of one bank remains extremely high, averaging 48.1% during
14.4
34.7
11.8
22.420.6
14.4
31.1
8.8
20.0
16.214.4
31.1
7.4
17.714.6
0
5
10
15
20
25
30
35
40
Bank A Bank B Bank C Bank D Bank E
Post
Sho
ck C
apita
l Ade
quac
y Rat
io (%
)
Low Stress CAR Medium Stress CAR High Stress CAR
the forecast period. On the other hand, the weakest bank in the system was unable to withstand low stress shocks as its CAR fell below the requirement from 14.5% in 2016 to 9.9% in 2017 and its capital levels turned negative from 2020.
High StressReductions in export growth and return on assets of two standard deviations were
assumed in the high stress scenario. At the aggregate level, the system remains resilient with CAR declining from 22.9% in 2016 to 11.8% by 2021. As in the case of the low stress scenario, one bank remains highly capitalized, however, capital for two weaker banks diminishes to precarious levels with their respective CARs averaging 10.0% and -5.8% during the forecast period.
Chart 5.5: Macro-stress Tests: Baseline Scenario
Chart 5.6: Macro-stress Tests: Low Stress Scenario
22.9 22.923.1
23.5
23.7
24.1
0123456789
22.0
22.4
22.8
23.2
23.6
24.0
24.4
2016 2017 2018 2019 2020 2021
Shor
tfall
in P
rovi
sioni
ng ($
mn)
Capi
tal A
dequ
acy
Ratio
(%)
Shortfall in Provisioning CAR
22.921.4
20.1 19.2 18.218.5
0
2
4
6
8
10
12
0
5
10
15
20
25
2016 2017 2018 2019 2020 2021
Shor
tfall
in P
rovi
sioni
ng ($
mn)
Capi
tal A
dequ
acy
Ratio
(%)
Shortfall CAR

44 Central Bank of BelizeAnnual Financial Stability Report
45Central Bank of BelizeAnnual Financial Stability Report
Chart 5.7: Macro-stress Tests: High Stress Scenario
22.9 20.2
17.7 15.7
13.7 11.8
0
2
4
6
8
10
12
0
5
10
15
20
25
2016 2017 2018 2019 2020 2021
Shor
tfall
in P
rovi
sioni
ng ($
mn)
Capi
tal A
dequ
acy
Ratio
(%)
Shortfall CAR
Chapter 6
Performance of the Insurance Sector
Chart 6.1: Premium Income for Domestic Insurance Sector
6.1 Sectoral Performance
(i) Gross Premium IncomeGross premium income continued its upward trend for the domestic insurance industry with a 3.1% increase in 2015 that accelerated to 8.0% in 2016 partly due to higher rates for certain classes of insurance, more aggressive marketing and relaxed payment arrangements that supported increased access to insurance coverage. Property, motor, health and ordinary insurance continue to be the largest sectors, accounting for an average of81%oftotalGPIoverthelastfiveyears.
Health and motor insurance posted robust
growth rates averaging 8.9% and 8.1%, respectively. In the case of the former, this was partly due to a heightening in the premium due to rising medical costs. GPI from property insurance experienced an upward surge of 6.3% in 2016 primarily due to transactions involving two large corporate clients. In comparison, there was a 2.3% increase in 2015 and an annual average increase of only 1.5% since 2012. The notable exception to the steady expansion was the ordinary life insurance sector which experienced a sharp increase in 2014 and 2015 due to an increase in premium rates and more aggressive marketing tactics.
-
20
40
60
80
100
120
140
160
2012 2013 2014 2015 2016
Prem
ium
Inco
me
($m
n)
Gross Premium Income

46 Central Bank of BelizeAnnual Financial Stability Report
47Central Bank of BelizeAnnual Financial Stability Report
Chart 6.2: Growth in Gross Premium Income for Major Classes of Insurance, 2013-2016
-2
0
2
4
6
8
10
12
14
2013 2014 2015 2016
Health & Medical Motor Property Ordinary Life
Table 6.1: Percentage Change in Gross Premium Income, 2013-2016
Chart 6.3: Insurance Sector Investment Mix, 2014 Chart 6.4: Insurance Sector Investment Mix, 2016
Cash on Hand and Savings
33%
Term Deposits38%
Gov't Securities
3%
Private Securities
17%
Secured Loans (incl.
Mortgages)4%
Policy Loans1%
Other Assets4%
Cash on Hand and Savings
25%
Term Deposits
21%
Gov't Securities
10%
Private Securities
25%
Secured Loans (incl. Mortgages)
12%
Policy Loans2%
Other Assets5%
Health & Medical Motor Property Ordinary Life
2013 8.1 4.5 0.2 -1.3
2014 7.7 5.8 2.1 7.7
2015 7.2 7.8 2.3 11.4
2016 10.6 8.4 6.3 3.2
Source: Office of the Supervisor of Insurance and Private Pensions
Chart 6.5: Life Insurance Sector Claims
-
5
10
15
20
25
- 0.5 1.0 1.5 2.0 2.5 3.0 3.5 4.0 4.5 5.0
20
10
20
11
20
12
20
13
20
14
20
15
20
16
Un
au
dit
ed
Incu
rre
d C
laim
s ($
mn
)
Re
insu
ran
ce R
eco
veri
es
($m
n)
Gross Incurred Claims Net Incurred Claims Reinsurance Recoveries
Table 6.2: Holdings of Certificates of Deposits and Cash
2012 2013 2014 20152016
UnauditedCD’s 90 80 76 73 43
Cash and Bank Deposits 40 53 65 46 51
Total CD’s and Cash/Bank Deposits 130 133 141 120 94Source: Office of the Supervisor of Insurance and Private Pensions
(ii) Investment Asset Mix There was a significant shift in thecomposition of the industry’s aggregate investments away from holdings with commercial banks due to high bank liquidity and low deposit rates. The share of investments held with domestic banks dropped from 70.7% to 46.0% in the two years under review with the amount held as term deposits plunging by 17 percentage points (from 38.2% to 21.0%). While the share comprised of government securities and company bonds rose by 14.8% percentage points to 35.0%, the value of investments being held in banks nevertheless continued to be significant,exceeding $93mn or some 34.6% of total assets at the end of 2016.
The insufficiency of long term securitiesand excessive liquidity in the domestic banking system constituted significantmarket risk for the insurance companies. In particular, life insurance companies were faced with asset-liability mismatches due to declining rates on fixed depositsand the occasional refusal of banks to roll over their CD’s.
(iii) Claims and Claims Provisions In 2016, Hurricane Earl negatively affectedtheprofitabilityof the insurancesector due to sizeable increases in gross claims and pay-outs. The negative impact was isolated to the non-life insurance sector, which experienced a tripling in gross claims due to the severe damages inflictedonpropertiesandmotorvehicles.In the case of the life sector, the impact of Hurricane Earl was negligible with no reported loss of life or other casualties. The sector’s loss ratio was fairly low with the level of claims paid and gross claims remaining stable over the two year period.

48 Central Bank of BelizeAnnual Financial Stability Report
49Central Bank of BelizeAnnual Financial Stability Report
Chart 6.6: Breakdown of General Insurance Sector Claims (Smn)
- 10 20 30 40 50 60 70 80
2010 2011 2012 2013 2014 2015 2016Unaudited
$mn
Reinsurance recoveries Net Incurred ClaimsGross Incurred Claims Claims paid
Table 6.3: Statutory Fund Requirements ($mn), 2014 - 2016
Dec 2014 Dec 2015 Dec 2016
Statutory Fund Requirements $75.9 $75.6 $73.0
Statutory Fund Asset Holdings $82.4 $90.3 $84.3
Statutory Fund Surplus/(Deficit) $6.5 $14.7 $11.3
Statutory Fund Holdings/Requirements 1.09 1.19 1.15
(iv) Statutory Fund The Insurance Act requires domestic underwriters to establish statutory funds for each class of insurance business in order to assure solvency and partial protection against investment losses. It is stipulated that 80% of the fund must be held in local assets denominated in Belizean currency and that the statutory fund can only be applied for the settlement of contracts for domestic policy holders. The fund must include a statutory deposit equal to 15% of net premium income. In 2015 and 2016, statutory fund holdings exceeded requirements by 19.4% and 15.5%, respectively.
While holdings exceed requirements, the industry has been experiencing problems in satisfying the requirement for liabilities at the longer end of the maturity spectrum due to the limited availability of domestic securities and low interest rates. New commercial bonds and Treasury notes were put on the market in 2016 that enabled life insurance companies to diversify their investment portfolio, although in some cases maturities were limited to 2 years instead of 5 to 10 years which would have been more ideal. Since 2007, the statutory funds have been mainly comprised of commercial bank certificates of deposits(CDs). While the share of the latter has
Chart 6.7: Composition of Statutory Fund (Smn)
declined from 81.7% in 2012 to 39.5% in 2016, CDs continue to account for a sizeable portion of the statutory funds. Notably, the level of interconnectedness between domestic banks and insurers is high and the concentration risk is significant with one bank accountingfor 60.5% of total fixed deposits held byinsurance companies in 2016. This poses a risk for both the domestic banking sector as well as the insurance sector. Government Treasury notes comprise approximately 36.0% of the total fund with commercial bonds occupying third place. In order to diversify, insurance companies have been investing in mortgages and have also
resorted to pledging real estate, though there are limitations on the quantity and period of time these can be held in the statutory funds.
The low interest rates are a particular challenge for the life insurance sector since any growth in underwriting currently requires additional injections by the industry to maintain the statutory funds at the legally required level.
-
10
20
30
40
50
60
2012 2013 2014 2015 2016
Hol
ding
s in
Sta
tuto
ry F
und
($m
n)
BEL Bonds
Government OfBelize US$ BondCash
Certificate of Deposit
Government OfJamaica BondMortgages
Municipal Bonds
Mutual Funds (US)
Preferred Shares
Promissory Note
Real Estate
SCA Bonds
GOB Treasury Bills
GOB Treasury Notes

50 Central Bank of BelizeAnnual Financial Stability Report
51Central Bank of BelizeAnnual Financial Stability Report
Chart 6.8: Capital Adequacy: Life Insurance Sector
0
30
60
90
120
150
180
210
2013 2014 2015 2016
perc
ent
Net Written Premium/Capital Capital/Total Assets
Capital/Invested Assets Capital/Technical Provisions
6.2 Life Insurance Sector: Financial Soundness Indicators
(i) Capital Adequacy A locally owned insurance company was required to inject capital when it took over the branches of two foreign insurance companies in 2015 and this drove the ratio of capital to total assets upward from 35.62% in 2015 to 55.77% in 2016. Technical provisions (comprised of the statutory funds and other reserves, which actuaries determine should be set aside for contingencies) also increased. The level of technical reserves typically grows in line with the aging of policies, however, the actuarial assessment determined that higher technical provisions were required as a result of the acquisition mentioned
above. The growth in technical provisions consequently outpaced capital, so that the ratio of capital to technical provisions fell from 185.50% in 2015 to 173.57% in 2016.
The industry fully satisfied thestatutorycapital requirements, however, it is duly noted that in assessing prudential compliance, insurance regulators in Belize place the highest priority on the level of holdings and performance of the statutory funds. As has been pointed out, statutory fund holdings were well above the requirements in 2015 and 2016, with the ratio of holdings to requirements registering 119% in 2015 and 115% in 2016.
Chart 6.10: Reinsurance for Life Insurance Sector
0102030405060708090
2013 2014 2015 2016
pe
rce
nt
(%)
Risk Retention Ratio (Net Written Premium/Gross Written Premium)
(Reinsurance Recoveries + Reinsurance Commissions)/ Reinsurance Ceded
Chart 6.9: Asset Quality for Life Insurance Sector
0
5
10
15
20
25
0
20
40
60
80
100
2013 2014 2015 2016 Ma
xim
um
De
po
sits
in
a S
ing
le B
an
k t
o
To
tal A
sse
ts (
%)
Ra
tio
to
To
tal A
sse
ts (
%)
Maximum Deposits in a Single Bank to Total Assets (%)Bank Deposits to Total Assets (%)(Cash + Bank Deposits + Gov't Securities) to Total Assets (%)
Chart 6.11: Profitability for Life insurance Sector
0
2
4
6
8
10
12
0
20
40
60
80
100
120
2013 2014 2015 2016
Re
turn
on
Asse
ts &
R
etu
rn
on
Eq
uit
y (
%)
Co
mb
ine
d R
ati
o &
Op
era
tin
g R
ati
o (
%)
Return on Assets Return on Equity Combined Ratio Operating Ratio
(ii) Asset QualityThe share of industry assets being held with the commercial banks more than halved from 67.9% to 30.2% over the two-year review period. Concentration risk is considered moderate with the ratio of deposits in a single bank to total assets amounting to 22.5% in 2015 and 21.3% in 2016 compared to the maximum threshold of 55.0%.
(iii) Reinsurance RiskThe ratio of net to gross premium income (an indicator of risk retention) has remained high and stable over the past four years and is forecasted to range between 77.0% and 80.0% in the near term. In 2016, the ratio stood at 79.31% as $10.3mn was ceded to reinsurers abroad. Because of the long term nature of their products, retention levels for the life insurance sector are typically higher than that for the non-life sector. In 2016, 45.2% of the amount ceded to reinsurers
was recovered which is above the average of 37.7% for the previous two years.
(iv)Earnings&ProfitabilityThe combined ratio is an indicator of capacity to cover claims and expenses from gross premium income. In 2016, the ratio for the life insurance sector stood at 87.2% and it has remained below the 100% threshold for all the years except 2015 when growth in claims

52 Central Bank of BelizeAnnual Financial Stability Report
53Central Bank of BelizeAnnual Financial Stability Report
Chart 6.12: Capital Adequacy for Non-Life Insurance Sector
0
50
100
150
200
2013 2014 2015 2016
pe
rce
nt
Net Written Premium/CapitalCapital/Total AssetsCapital/Invested Assets
and administrative expenses exceeded the growth in gross premium income. When investment income is included, the ratio (operating) falls to 73.8. Due to the low level of claims in 2016, the sector’s profits receivedanadditionalboost fromreinsurance discounts.
6.3 Non-Life Insurance Sector: Financial Soundness Indicators
(i) Capital AdequacyAfter a robust 13.9% increase in 2015, total capital for the general insurance sector declined by 6.4% with retained earnings shrinking as a result of the losses sustained from Hurricane Earl. While the ratio of capital to total assets consequently declined from 47.3% to 42.7%, it remained within the international benchmark range of 40% to 50%.
(ii) Asset QualityAlthough the ratio of bank deposits to total assets has declined, concentration
risk remains high as the maximum deposits in a single bank accounted for 45.45% of total asset holdings in 2016, slightly higher than the 45.06% registered in 2015.
(iii) Reinsurance RiskBecause their products have a higher probability of being impacted by catastrophic events, general insurance companies tend to cede more of their risk via payments to foreign reinsurers as compared to the local life insurance companies. Although on a slight upward trend, the level of the sector’s risk retention was fairly low at 42.2% in 2015 and 43.28% in 2016. However, while the level of risk retention was stable in the case of the larger insurance companies, it was noted that the smaller companies were retaining more risk in order to boost net earnings. For the sector as a whole, while less of the premium income was being ceded to international reinsurers in the period reviewed, there was a notable
Chart 6.13: Reinsurance for Non-Life Insurance Sector
0
20
40
60
80
100
120
2013 2014 2015 2016
pe
rce
nt
(%)
Axis Title
(Reinsurance Recoveries + Reinsurance Commissions)/ Reinsurance Ceded
Risk Retention Ratio
Chart 6.14: Profitability Indicators for Non-Life insurance Sector
-10
-5
0
5
10
15
0
20
40
60
80
100
120
2013 2014 2015 2016
Retu
rn on
Ass
ets &
Re
turn
on Eq
uity (
%)
Com
bined
Ratio
&
Op
erat
ing Ra
tio (%
)
Combined Ratio Operating Ratio
Return on Equity Return on Assets
jump in the reinsurance recoveries ratio from 27.9% in 2015 to 113.67% in 2016 mainly due to the settlement of the claims made after Hurricane Earl struck the country.
(iv)Earnings&ProfitabilityDespite relatively high levels of underwriting and gross premium receipts, the general insurance sector suffered a loss forthefirsttimeinsevenyearsdueto sizeable claims incurred as a result of
Hurricane Earl and the timing difference for processing of reinsurance recoveries. In 2016, the sector’s ROE and ROA turned negative at -5.24% and -2.24% and the combined ratio exceeded 100%, which meansthatnetpremiumswereinsufficientto cover claims as well as underwriting, administrative and operational expenses over that period. However, when investment earnings were factored in, the operating ratio stood at 97.8% indicating that all expenses could be covered. The
Table 6.2: Liquidity Indicators for Non-Life Sector
2013 2014 2015 2016
Liquid Assets/Current Liabilities (%) 223.31 221.56 227.28 249.98
Liquid Assets/Total Liabilities (%) 93.04 96.95 101.69 90.45
Liquid Assets/Total Assets (%) 52.66 53.39 53.64 51.82
Current Liabilities/Total Liabilities (%) 41.66 43.76 44.74 39.80
Due to related parties/Total Assets (%) 6.40 6.89 6.36 6.53

54 Central Bank of BelizeAnnual Financial Stability Report
55Central Bank of BelizeAnnual Financial Stability Report
industry’s losses in 2016 were typical for a period marked by catastrophe and are expected to be offset in 2017 when reinsuranceinflowsarefullyrealized.
(v) Liquidity Due to the short term span of the sector’s underwriting and claims, companies, which provide general insurance are expected to maintain a 2 to 1 ratio for liquid assets relative to their current liabilities. As a group, the sector has been fully compliant in this regard. In 2015 and 2016, the liquid asset holdings exceeded requirements by 27.3% and approximately 50.0% respectively.
A1: Financial System Structure
Number of Financial Institutions
Asset Size ($mn)
Share of Total Assets (%)
Dec 2014
Dec 2015
Dec 2016
Dec 2014
Dec 2015
Dec 2016
Dec 2014
Dec 2015
Dec 2016
Depository Institutions
Domestic Banks 6 6 5 2,967 3,249 3,228 52.5 57.6 58.0
International Banks 5 5 5 1,573 1,204 1,061 27.9 21.4 19.1
Credit Unions 12 12 12 768 831 903 13.6 14.7 16.2
Non-depository FIs
Development Financing 1 1 1 90 104 105 1.6 1.8 1.9
Insurance Companies
Life (Long Term) 6 3 3 162 164 176 2.9 2.9 3.2
Nonlife (General) 4 4 5 60 62 67 1.1 1.1 1.2
Composite 2 2 2 26 27 29 0.5 0.5 0.5Source: Central Bank of Belize & Supervisor of Insurance and Private Pension
ANNEX

56 Central Bank of BelizeAnnual Financial Stability Report
57Central Bank of BelizeAnnual Financial Stability Report
A2: Financial Soundness Indicators - Domestic Banks
2013 2014 2015 2016_Q1 2016_Q2 2016_Q3 2016_Q4
Capital Adequacy
Regulatory Capital to Risk-Weighted Assets (%)1 24.44 23.46 24.94 24.89 23.88 23.00 23.84
Regulatory Tier I Capital to Risk-Weighted Assets (%) 23.26 22.28 23.77 23.74 22.87 21.98 22.82
Non-performing Loans (net of provisions) to Regulatory Capital (%) 43.47 35.75 31.73 28.14 23.96 13.39 14.53
Large Exposures to Regulatory Capital (%)2 138.52 146.80 134.51 136.53 131.51 137.01 129.98
Asset Quality
Non-performing Loans to Total Gross Loans (%)3 14.77 14.31 14.02 13.85 12.33 10.49 10.45
Non-performing Loans (net of specific provisions) to Total Gross Loans (%) 8.84 7.02 6.70 5.94 4.87 2.67 3.01
Provisions/NPLs (%) 45.99 57.96 61.95 67.02 67.73 83.09 79.84
Profitability/Efficiency
Return on Equity (net income to average capital [equity]) (%)4 -0.31 0.03 7.34 4.69 2.96 4.15 4.80
Return on Assets (net income to average total assets) (%)4 -0.04 0.00 1.00 0.68 0.42 0.54 0.63
Interest Margin to Gross Income (%) 56.03 57.73 52.18 54.58 57.04 60.37 60.37
Non-interest expense to Gross Income (%) 48.86 50.41 52.27 46.88 44.25 50.41 56.74
Liquidity
Liquid Assets to Total Assets (%) 28.51 30.13 32.18 35.67 35.69 35.33 32.77
Liquid Assets to Short-term Liabilities (%) 50.11 50.67 52.43 56.74 56.60 53.66 49.43
Customer Deposits to Total (non-interbank) Loans (%) 124.28 128.09 132.36 136.51 138.19 139.31 132.401 Domestic banks are legally mandated to hold a minimum ratio of 9% for regulatory capital to risk weighted assets.2 Domestic banks' large exposure loans cannot exceed six times its holdings of regulatory capital. 3 The maximum benchmark for non-performing loans to total gross loans is 5%.4 The minimum benchmark for ROA and ROE is 1%.
A3: Financial Soundness Indicators - International Banks
2013 2014 20152016Qtr 1
2016Qtr 2
2016Qtr 3
2016Qtr 4
Capital AdequacyRegulatory Capital to Risk-Weighted Assets (%)1 17.37 19.26 26.50 26.64 23.79 22.46 24.60Regulatory Tier I Capital to Risk-Weighted Assets (%) 16.83 18.66 25.82 25.95 23.11 22.77 23.86Non-performing Loans (net of provisions) to Regulatory Capital (%) 64.13 31.92 23.72 23.89 20.67 24.72 17.54
Asset QualityNon-performing Loans to Total Loans(%)2 29.20 21.63 23.12 23.58 19.68 19.19 16.64Non-performing Loans (net of specific provisions) to Total Loans (%) 15.88 8.28 7.66 8.00 6.60 7.01 5.93
Profitability/EfficiencyReturn on Equity (net income to average capital [equity]) (%)3 8.15 50.07 6.21 -1.04 2.57 5.86 5.19Return on Assets (net income to average total assets) (%)3 0.78 4.56 0.77 -0.14 0.35 0.83 0.75Interest Margin to Gross Income (%) 38.94 21.12 38.99 45.14 44.78 44.22 47.05
LiquidityLiquid Assets to Total Assets (%) 46.13 45.11 34.73 26.67 30.59 29.02 33.52Liquid Assets to Short-term Liabilities (%) 51.35 51.19 43.10 31.31 36.78 35.24 51.05Customer Deposits to Total (non-interbank) Loans (%) 252.30 267.99 193.59 168.85 172.45 156.74 157.74
1 International banks are legally mandated to hold a minimum ratio of 10% for regulatory capital to risk weighted assets.2 The maximum benchmark for non-performing loans to total gross loans is 5%.3 The minimum benchmark for ROA and ROE is 1%.

58 Central Bank of BelizeAnnual Financial Stability Report
59Central Bank of BelizeAnnual Financial Stability Report
A4: Financial Soundness Indicators - Credit Unions
2013 2014 20152016Qtr 1
2016Qtr 2
2016Qtr 3
2016Qtr 4
Capital AdequacyNet Institutional Capital (Members’ Capital Reserves)/Assets (%) 8.68% 9.99% 10.30% 10.34% 10.83% 10.69% 10.61%Total Capital/Deposits (%) 22.17% 20.14% 20.11% 21.84% 18.36% 19.49% 20.70%Total Capital/Total Assets (%) 17.89% 16.60% 16.62% 17.76% 15.15% 15.76% 16.90%
Asset QualityNon-Performing Loans/Total Loans (%) 12.04% 10.26% 10.74% 8.89% 9.57% 10.50% 10.48%NPLs (Net of Specific Provisions) to Total Loans (%) 7.70% 3.24% 3.92% 2.48% 3.20% 3.84% 4.00%
Profitability/EfficiencyReturn on Assets (%) 5.53% 5.32% 4.18% 4.69% 4.72% 4.12% 4.26%Return on Equity (%) 30.23% 31.33% 24.36% 26.32% 28.36% 24.20% 24.50%
LiquidityExcess Liquid Assets to Liquid Assets Requirement (%) 281.31% 283.06% 280.47% 303.79% 289.23% 281.49% 261.68%Liquid Assets to Deposits (%) 36.49% 36.77% 38.69% 41.12% 39.37% 38.75% 37.29%Loans to Deposits (%) 84.63% 83.69% 82.53% 81.16% 79.90% 82.00% 83.84%
A5: Financial Soundness Indicators - Life Insurance Companies
2013 2014 2015 2016Capital adequacyNet written premium/capital 88.89 93.46 88.10 101.45Capital/total assets 43.40 44.93 47.25 42.71Capital/invested assets 96.20 94.33 96.16 93.99Capital/technical provisions 147.33 170.74 185.50 173.57Growth in capital 4.91 4.20 13.87 -6.43Asset quality(Real estate + unquoted equities + debtors)/total assets 3.59 2.22 2.13 2.11Debtors/(gross written premium + reinsurance recoveries) 1.99 1.98 2.01 3.27Bank deposits/total assets 43.09 45.94 47.57 42.70Maximum deposits in a single bank/total assets 0.00 50.62 45.06 45.45(Real estate + mortgages)/total assets 0.00 0.00 0.00 0.00(Cash + bank deposits + government securities)/total assets 45.12 47.63 49.14 43.96(Other debt securities + policy loans)/total assets 8.05 6.42 5.12 7.99Total Investments (Includes Cash & Bank Savings)/Total Assets 53.16 54.06 54.25 51.96Fixed assets/total assets 19.59 22.69 21.06 20.42Receivables/total assets 2.22 2.13 2.11 5.13All other assets/total assets 3.79 4.74 5.29 4.09ReinsuranceRisk retention ratio (net written premium/gross written premium) 38.63 40.89 42.24 43.28(Reinsurance recoveries + reinsurance commissions)/reinsurance ceded 33.51 23.86 27.90 113.67Management soundness
Personnel expenses/gross written premium 11.82 12.40 12.83 12.20Growth in gross written premium 100.00 3.39 3.76 4.91Growth in net written premium 100.00 8.73 6.85 7.19Growth in total assets 11.19 0.65 7.65 3.39Earnings and ProfitabilityLoss ratio (net incurred claims/net earned premium) 34.27 31.78 38.58 51.38Expense ratio (Exp + net commission/net earned premium) 54.85 51.53 48.61 51.18Combined ratio = loss ratio + expense ratio 89.11 83.31 87.19 102.56Investment income ratio (investment income/net earned premium) 5.32 4.20 4.55 4.77Operating ratio = combined ratio - investment income ratio 83.80 79.11 82.65 97.78Return on equity (ROE) (net income after tax/capital) 10.42 13.88 10.22 -5.24Return on assets (ROA) (net income after tax/total assets) 4.52 6.23 4.83 -2.24Ceding Discount/ Net Earned Premium 23.44 23.66 23.32 18.09Liquidity PositionLiquid assets/current liabilities 223.31 221.56 227.28 249.98Liquid assets/total liabilities 93.04 96.95 101.69 90.45Liquid assets/total assets 52.66 53.39 53.64 51.82Current liabilities/total liabilities 41.66 43.76 44.74 39.80
Due to related parties/total assets 6.40 6.89 6.36 6.53

60 Central Bank of BelizeAnnual Financial Stability Report
61Central Bank of BelizeAnnual Financial Stability Report
A6: Financial Soundness Indicators - Non-Life Insurance Companies
2013 2014 2015 2016Capital AdequacyNet written premium/capital 59.28 58.93 58.73 40.54
Capital/total assets 36.20 35.05 35.62 55.77Capital/invested assets 40.81 38.59 41.25 97.69Capital/technical provisions 147.33 170.74 185.50 173.57Growth in capital -0.01 5.30 5.89 62.78Asset quality(Real estate + unquoted equities + debtors)/total assets 1.42 1.13 2.15 2.08Debtors/(gross written premium + reinsurance recoveries) 0.91 2.19 4.52 16.79Bank deposits/total assets 72.13 67.89 44.94 30.15Maximum deposits in a single bank/total assets 0.00 23.23 22.46 21.27
(Cash + bank deposits + government securities)/total assets 83.06 82.63 75.59 40.31
(Other debt securities + policy loans)/total assets 6.13 5.50 3.18 28.83
Total Investments (Includes Cash & Bank Savings)/Total Assets 93.22 94.73 87.91 86.39
Fixed assets/total assets 2.03 1.16 3.68 3.67Receivables/total assets 0.26 0.62 1.25 5.10All other assets/total assets 0.49 0.36 3.71 3.33ReinsuranceRisk retention ratio (net written premium/gross written premium) 83.09 77.34 79.68 79.31
(Reinsurance recoveries + reinsurance commissions)/reinsurance ceded
64.47 36.70 38.70 45.23
Management soundnessPersonnel expenses/gross written premium 8.02 8.17 6.06 5.37Growth in gross written premium 98.97 11.08 2.36 11.43Growth in net written premium 98.83 4.47 5.23 11.01Growth in total assets 11.19 0.65 7.65 3.39Earnings and ProfitabilityLoss ratio (net incurred claims/net earned premium) 51.88 49.23 51.73 42.28Expense ratio (expenses+ Net Commissions Expense/net earned premium)
38.27 47.81 48.40 44.86
Combined ratio = loss ratio + expense ratio 90.15 97.05 100.13 87.15Investment income ratio (investment income/net earned premium) 15.77 12.98 8.91 13.30Operating ratio = combined ratio - investment income ratio 74.38 84.07 91.22 73.84
Return on equity (ROE) (net income after tax/capital) 10.32 5.49 8.57 9.13Return on assets (ROA) (net income after tax/total assets) 3.74 1.92 3.05 5.09Ceding Discount/ Net Earned Premium 23.44 23.66 23.32 18.09
Source: Office of the Supervisor of Insurance and Private Pensions
A7: Foreign Exchange Exposure(1), By Region
Domestic Banks ($’000) International Banks ($’000)
Dec 2014 Dec 2015 Sept 2016 Dec 2014 Dec 2015 Sept 2016
Total Foreign Country Exposure of which:
North America
Deposits 114,792 123,425 73,582 395,128 175,006 157,810
Investments 1,214 7,035 28,995 160,744 190,458 126,224
Europe
Deposits 16,853 7,548 6,141 87,130 92,081 74,147
Investments 2,466 1,221 3,784 4,032 6,020 2,684
CARICOM
Deposits 10,476 3,004 0 20,764 28,944 32,854
Investments 30,833 21,944 16,799 10,696 0 0
LATIN AMERICA
Deposits 146 206 1,170 23,451 34,308 19,535
Investments 22,992 15,139 785 7,826 0 0
OTHER
Deposits 4,500 0 9,229 20,876 10,080 16,280
Investments 3,028 0 3,021 0 4,018 2,000
TOTAL
Deposits 146,767 134,182 90,122 547,349 340,419 300,625
Investments 60,533 45,338 53,384 183,298 200,496 130,908
Total Foreign Country Exposure as a percent of Foreign Currency Assets
North America 56.0 72.7 71.5 76.1 67.6 65.8
Europe 9.3 4.9 6.9 12.5 18.1 17.8
CARICOM 19.9 13.9 11.7 4.3 5.4 7.6
Latin America 11.2 8.5 1.4 4.3 6.3 4.5
OTHER 3.6 0.0 8.5 2.9 2.6 4.2(1) Does not include non-resident loans from international banks.

62 Central Bank of BelizeAnnual Financial Stability Report
63Central Bank of BelizeAnnual Financial Stability Report
A8: Liquid Asset Holdings - Domestic Banks
2012 2013 2014 2015 2016Actual Average Liquid Assets(Bz$mn) 815.8 815.3 903.0 1,045.60 1,057.30
Statutory Requirement (Bz$mn) 505.7 521.7 564.2 594 613.7
Excess/(Deficit) Avg. Liquid Assets (Bz$mn) 310.1 293.6 338.8 451.6 443.7
Excess Liquid Assets to Liquid Assets Requirement (%) 61.3 56.3 60.1 76 72.3
Liquid Assets to Deposits (%) 35.6 35.4 36.5 39.8 39.7
Loans to Deposits (%) 85.1 80.5 78.1 75.6 75.5
A9: Liquid Asset Holdings - International Banks
2012 2013 2014 2015 2016
Actual Average Liquid Assets(US$mn) 285.0 308.8 354.9 209.2 179.8
Statutory Requirement (US$mn) 125.5 136.8 155.1 109.2 95.6
Excess/(Deficit) Average Liquid Assets (US$mn) 159.5 172 199.8 100 84.2
Excess Liquid Assets to Liquid Assets Requirement (%) 127.0 125.7 128.8 91.6 88.1
Liquid Assets to Deposits (%) 54.5 54.2 54.9 45.0 45.1
Loans to Deposits (%) 44.1 39.6 37.3 51.7 64.5
A10: Capital Adequacy - Credit Unions
Dec2012
Dec2013
Dec2014
Dec2015
Dec-2016
Net Institutional Capital/Total Assets (%) 10.70 8.70 9.99 10.30 10.60
Total Capital/Deposits (%) 22.00 22.20 20.10 19.90 20.70
Total Capital/Total Assets (%) 17.90 17.90 16.60 16.40 16.90
Total Capital ($mn) 118.00 129.70 127.60 137.30 153.10
A11: Liquid Asset Holdings - Credit Unions
2012 2013 2014 2015 2016Actual Average Liquid Assets(Bz$mn) 214.1 219 238.9 266.9 275.8
Statutory Requirement (Bz$mn) 53.9 59.2 64.3 70.2 76.3
Excess/(Deficit) Avg. Liquid Assets (Bz$mn) 160.1 159.8 174.6 196.8 199.6
Excess Liquid Assets to Liquid Assets Requirement (%) 296.90 270.20 271.60 280.50 261.70
Liquid Assets to Deposits (%) 40.00 37.40 37.70 38.70 37.30
Loans to Deposits (%) 80.99 84.63 83.69 82.53 83.80
A12: Stress Tests - Domestic Banks
Dec 2014 Dec 2015 Dec 2016
Current CAR (%) 23.1 24.75 23.89
Loan
Por
tfol
io D
eter
iora
tion
CAR Under Selected Shocks (%)
Low (5%) 21.33 23.78 23.74
Medium (15%) 17.84 20.87 20.5
High (25%) 14.35 17.96 17.27
Level of stress at which system’s CAR falls below 9% 40.37 55.9 50.57
No. of Banks Below Requirement & Capital Injection Needed
Low (5%) 0 0 0
Medium (15%) 3 banks -$12.6mn 1 bank-$10.1mn 0
High (25%) 3 banks -$46.3mn 1 bank-$25.7mn 2 banks - $17.22mn
Sect
or S
peci
fic
Loan
Sho
cks
CAR Under Selected Shocks (%)
Low (10%) 21.93 23.54 22.67
Medium (15%) 21.34 22.94 22.06
High (25%) 20.17 21.74 20.84
Level of stress at which system’s CAR fall below 9% At 100% shock, the system CAR is still above requirement.
No. of Banks Below Requirement/Capital Injection Needed
Low (10%) 0 0 0
Medium (15%) 1 bank-$0.6mn 0 0
High (25%) 1 bank-$7.9mn 1 bank-$7.2mn 1 bank-$1.7mn
Rel
ated
Par
ty T
rans
acti
ons
CAR Under Selected Shocks (%)
Low (50%) 22.09 23.07 21.45
Medium (75%) 21.59 22.24 20.23
High (100%) 21.09 21.4 19.01
Level of stress at which system’s CAR fall below 9% At 100% shock, the system CAR remains above the 9% requirement.
No. of Banks Below Requirement & Capital Injection Needed
Low (50%) 1 bank-$1.8mn 0 1 bank-$4.83mn
Medium (75%) 1 bank-$5.1mn 0 1 bank-$13.63mn
High (100%) 2 banks-$10.9mn 0 1 bank-$22.43mn
Liqu
idit
y Sh
ocks
Number of days till illiquid
Low (demand deposits of 5%, time deposits of 1%) 20 20 20
Medium (demand deposits of 10%, time deposits of 2%) 10 10 10
High (demand deposits of 15%, time deposits of 3%) 7 7 7
Number of days till breach of legal requirement
Low (demand deposits of 5%, time deposits of 1%) 8 9 9
Medium (demand deposits of 10%, time deposits of 2%) 5 5 5
High (demand deposits of 15%, time deposits of 3%) 3 3 3

64 Central Bank of BelizeAnnual Financial Stability Report
65Central Bank of BelizeAnnual Financial Stability Report
A13: Stress Tests - International Banks
Dec 2014 Dec 2015 Dec 2016
Current CAR (%) 19.60 27.17 21.7
Gene
ric/
Mig
ratio
n Sh
ock
CAR Under Selected Shocks (%)
Low (15%) 10.1 21.64 16.00
Medium (25%) 6.29 18.15 12.11
High (35%) 2.48 14.66 8.22
Breakpoint (level of stress at which system’s CAR fall below 10%) 15.3 48.4 30.45
No. of Banks Below Requirement & Capital Injection Needed
Low (15%) 3 banks-$6.13mn 1 bank-$3.89mn 2 banks-$2.89mn
Medium (25%) 4 banks-$17.67mn 1 bank-$7.69mn 2 banks-$9.87mn
High (35%) 4 banks-$30.06mn 1 bank-$11.51mn 2 banks-$16.85mn
Rela
ted
Part
y Sh
ock
CAR Under Selected Shocks (%)
Low (50%) 18.19 25.55 20.34
Medium (75%) 17.49 24.74 19.66
High (100%) 17.22 23.93 18.98
Breakpoint (level of stress at which system’s CAR fall below 10%) At 100% shock, the system CAR is still above the requirement.
No. of Banks Below Requirement & Capital Injection Needed
Low (50%) 0 0 0
Medium (75%) 0 0 0
High (100%) 0 0 0
Liqu
idity
Sho
ck
Number of days till illiquid
Low (demand deposits of 5%, time deposits of 1%) 41 29 25
Medium (demand deposits of 10%, time deposits of 2%) 21 15 13
High (demand deposits of 15%, time deposits of 3%) 14 10 9
Number of days till breach of legal requirement
Low (demand deposits of 5%, time deposits of 1%) 19 15 13
Medium (demand deposits of 10%, time deposits of 2%) 10 8 7
High (demand deposits of 15%, time deposits of 3%) 7 6 5
A14: Results of Multi-Period Macro-Linked Stress Test - Domestic Banks
2016 2017 2018 2019 2020 2021
Pre-Shock ($’000)
Assets 3,180,319 3,414,640 3,572,346 3,763,692 3,994,918 3,558,125
Loans 1,976,397 2,122,015 2,220,021 2,338,932 2,482,626 2,315,120
NPLs 159,346 236,238 247,362 262,829 282,221 252,242
Regulatory Capital 395,210 425,241 456,660 489,761 524,895 501,592
RWA 1,729,564 1,856,996 1,942,762 2,046,822 2,172,570 2,037,540
CAR (%) 22.9 22.9 23.5 23.9 24.2 24.6
Baseline
Excess/(Shortfall) - - (6,762) (7,140) (7,627) (8,203)
CAR 22.9 22.9 23.1 23.5 23.7 24.1
Change CAR 0.0 0.0 -0.4 -0.4 -0.4 -0.5
Low Stress
Excess/(Shortfall) - - (8,086) (8,736) (9,447) (10,212)
CAR 22.9 21.4 20.1 19.2 18.2 18.5
Change CAR 0.0 -1.5 -3.4 -4.7 -5.9 -6.1
High Stress
Excess/(Shortfall) - - (8,452) (9,192) (10,016) (10,976)
CAR 22.9 20.2 17.7 15.7 13.7 11.8
Change CAR 0.0 -2.7 -5.8 -8.2 -10.5 -12.8

66 Central Bank of BelizeAnnual Financial Stability Report
67Central Bank of BelizeAnnual Financial Stability Report
A15: Insurance Sector: Composition of Statutory Fund
Type of Securities 2012 2013 2014 2015 2016
BEL Bonds 55,000 55,000 6,055,000 6,055,000 6,105,000
Government Of Belize US$ Bond - 2,964,459 3,543,356 - -
Cash 238,895 239,008 239,151 - -
Certificate of Deposit 53,106,921 53,005,185 51,926,477 52,430,551 35,133,783
Government Of Jamaica Bond 2,031,353 - - - -
Mortgages - - - - 2,808,750
Municipal Bonds - 3,500,000 6,500,000 5,800,000 5,800,000
Mutual Funds (US) - - - - 691,412
Preferred Shares 500,000 - - - -
Promissory Note 1,000,000 - - - -
Real Estate - 88,887 8,887 2,988,887 6,198,809
SCA Bonds - - - - 250,000
GOB Treasury Bills 1,112,600 3,212,600 8,308,200 - -
GOB Treasury Notes 6,926,000 6,926,000 6,926,000 21,926,000 32,026,000
TOTAL 64,970,769 69,991,139 83,507,070 89,200,437 89,013,754
Source: Office of the Supervisor of Insurance and Private Pensions
A16: Insurance Sector: Gross Premium Income
2012 2013 2014 20152016
Unaudited
Gross Premium Income 119,458,400 123,355,782 131,138,623 135,231,496 146,067,539
Reinsurance 57,064,447 58,545,195 61,697,086 61,663,270 64,772,589
Net Premium Income 62,393,953 64,810,587 69,441,537 73,568,226 81,294,950
Reserve for Unearned Premium B/F 16,324,531 39,482,838 37,434,818 36,524,982 136,317,269
Reserve for Unearned Premium C/F 16,848,954 36,253,571 38,982,965 40,157,836 140,883,062
Earned Premium Income 61,869,530 68,039,855 67,893,390 69,935,372 76,729,157
Source: Office of the Supervisor of Insurance and Private Pensions
A17: Non-Life Insurance Sector: Gross Premium Income, By Class
Accident Sickness Aviation
Bond andFidelity
Health and Medical
Liability and Miscellaneous Marine Motor Property Title
2012 682,010 680,429 1,473,264 15,079,444 7,577,638 3,290,566 22,883,177 43,483,281 922,124
2013 544,307 957,540 1,355,913 16,302,379 9,940,910 2,202,472 23,909,009 43,588,302 92,500
2014 795,386 1,192,430 1,421,071 17,562,474 10,074,184 2,095,478 25,286,950 44,503,324 47,269
2015 875,238 967,038 1,671,219 18,829,911 10,175,675 2,163,929 27,262,173 45,525,866 4,870
2016 902,852 1,183,650 5,942,814 20,754,947 4,754,490 2,787,392 29,547,872 48,391,527 3,765
Source: Office of the Supervisor of Insurance and Private Pensions
A18: Life Insurance Sector: Gross Premium Income, By Class
Annuities and Pensions Creditor Life
Industrial Life Ordinary Life
2016 1,073,190 11,162,255 208,715 19,354,072
2015 1,462,321 7,267,483 280,313 18,745,461
2014 1,104,085 7,662,167 279,450 19,114,354
2013 1,491,276 7,105,148 245,650 15,620,376
2012 1,002,189 6,329,555 225,005 15,829,718
Source: Office of the Supervisor of Insurance and Private Pensions
A19: Insurance Sector: Investment Mix
2012 2013 2014 20152016
Unaudited
Cash on Hand and Savings 39,972,953 53,123,237 65,104,668 46,447,507 51,273,414
Term Deposits 90,035,846 80,080,643 76,383,164 73,392,429 42,691,567
Government Securities 4,768,568 5,124,569 5,944,822 53,334,549 19,084,912
Company Bonds, Debentures and Other Company Securities 20,986,866 31,467,733 34,464,648 3,248,452 51,341,651
Secured Loans (Including Mortgages) 5,315,532 4,717,177 8,237,424 14,071,343 23,628,589
Investments in Real Estate 608,300 669,840 1,834,840 1,900,828 2,787,328
Shares (Preferred or Ordinary Shares) 1,407,355 1,449,895 1,484,270 1,484,270 1,484,270
Equities (stock) 631,506 641,618 652,354 124,611 124,611
Investments in Related Parties 7,328,118 4,769,612 3,402,536 2,000,000 1,157,663
Policy Loans 2,184,012 2,414,506 2,592,952 2,762,362 4,421,063
Other Investments - - - 3,835,354
Total Loans and Investments 173,239,056 184,458,830 200,101,678 198,766,351 201,830,422
Source: Office of the Supervisor of Insurance and Private Pensions

68 Central Bank of BelizeAnnual Financial Stability Report
69Central Bank of BelizeAnnual Financial Stability Report
A20: Life Insurance Sector: Claims Paid and Incurred
A21: Non-Life Insurance Sector: Claims Paid and Incurred
2010 2011 2012 2013 2014 20152016
Unaudited
Claims paid 18,140,089 14,478,095 20,145,303 21,210,068 18,521,272 19,687,801 19,484,047
Claims Outstanding B/F 606,532 955,070 246,142 553,683 564,714 41,275 3,557,693
Claims Outstanding C/F 955,071 1,596,035 (605,700) 1,203,754 346,489 288,329 2,793,533
Claims IBNR B/F 313,882 227,560 2,041,505 49,955 28,871 628,832 306,324
Claims IBNR C/F 227,560 74,370 1,903,982 447,241 18,100 644,785 91,583
Incurred Claims (Gross) 18,488,628 15,119,060 19,293,461 21,860,139 18,303,047 19,934,855 18,719,887
Reinsurance Recoveries 4,625,879 3,550,547 4,082,639 2,912,712 2,385,649 2,635,647 3,320,836
Net Incurred Claims 13,514,210 10,927,548 16,062,664 18,297,356 16,135,623 17,052,154 16,163,211
Source: Office of the Supervisor of Insurance and Private Pensions
2010 2011 2012 2013 2014 20152016
Unaudited
Claims paid 32,088,615 19,562,431 13,682,350 16,252,743 18,976,131 19,092,793 69,469,474
Claims Outstanding B/F 5,707,432 10,884,368 5,913,073 6,414,891 10,183,476 5,536,412 70,113,644
Claims Outstanding C/F 28,673,233 15,479,315 14,206,951 10,536,471 6,774,391 6,136,555 75,590,533
Claims IBNR B/F 584,731 824,860 707,247 605,149 1,027,112 626,893 4,494,601
Claims IBNR C/F 695,016 679,730 661,529 1,025,735 721,780 754,430 4,878,759
Incurred Claims (Gross) 55,054,416 24,157,378 21,976,228 20,374,323 15,567,045 19,692,936 74,946,363
Reinsurance recoveries 18,350,316 5,858,227 2,369,362 7,754,186 3,951,784 5,674,735 54,477,188
Net Incurred Claims 13,738,299 13,704,204 11,312,988 8,498,557 15,024,347 13,418,058 14,992,286
Source: Office of the Supervisor of Insurance and Private Pensions
GLOSSARY
Capital Adequacy RatioA measure of a bank's level of capital relative to its risk. It is calculated by adding tier 1 capital to tier 2 capital and dividing by risk-weighted assets. It is the measure of solvency of a bank indicating the level of buffers available to absorb potential losses. In Belize, domestic banks are legally required to maintain a minimum ratio of 9%.
Concentration Risk The risk associated with the possibility that any single exposure produces losses large enough to adversely affect an institution’s ability to carry out their core operations.
ContagionA situation whereby instability in a specific market or institution is transmitted to one or several other markets or institutions.
Corporate riskA category of risk management that looks at ensuring an organization meets its corporate governance responsibilities takes appropriate actions and identifies and manages emerging risks.
Correspondent Banks A correspondent banking arrangement involves one bank (the correspondent) providing a deposit account or other liability accounts, and related services, to another bank (the respondent), often including its affiliates.
Credit Risk The risk that a counterparty will be unable to settle payment of all obligations when due or in the future.
Credit spreads The spread between benchmark securities and other debt securities that are comparable in all respects except for credit quality.
Credit to GDP Gap A measure of the risk associated with the credit extended to households and businesses in a country. It is calcualted by taking the difference between the credit-to-GDP ratio and its long-run trend. A positive and increasing gap signals a build up in credit risk in the financial system, while a decrease in the gap suggests a reduction in risk.
DeleveragingA process consisting of the reduction of leverage, i.e. the reduction of indebtedness, which decreases the profitability of economic agents, but also the degree of risk associated with them.

70 Central Bank of BelizeAnnual Financial Stability Report
71Central Bank of BelizeAnnual Financial Stability Report
De-riskingThe phenomenon of financial institutions terminating or restricting business relationships with clients or categories of clients to avoid, rather than manage, risk.
Domestic Bank Stability IndexAn aggregate measure of financial stability for the domestic banking system, which combines the following financial soundness indicators: asset quality, capital adequacy, profitability, liquidity and foreign exchange stability. An increase in the ratio indicates an improvement in the banking system’s stability, while a reduction in the ratio indicates a heightening of risk in the system.
Fiscal solvency The ability for the public sector to satisfy the intertemporal budget constraint.
Foreign Exchange RiskThe risk of potential losses which arise from adverse movements in the exchange rate incurred by an institution holding foreign currency denominated instruments.
General ProvisionsProvision for future non-apparent (unrevealed) losses of assets
HedgingStrategy designed to reduce investment risk or financial risk. For example, taking positions that offset each other in case of market price movements.
Institutional CapitalCapital in the form of retained earnings and reserves.
Interest MarginThe dollar amount of interest earned on assets (interest income) minus the dollar amount of interest paid on liabilities (interest expense).
Liquidity RiskThe risk that a counterparty will be unable to settle payment of all obligations when due.
Market Risk Market risk is the risk that movements in market prices will adversely affect the value of on or off-balance sheet positions.
Non-Performing LoansLoans whose payments of interest and principal are past due by 90 days or more.
Operational RiskThe risk of loss resulting from inadequate or failed internal processes, people and systems, or from external events.
Payment SystemA payment system consist of the mechanisms - including payment instruments, institutions, procedures, and technologies - used to communicate information from payer to payee to settle payment obligations.
ProvisioningWhen a loan loss becomes likely, a bank will make a charge to the profit and loss statement (“provision”) to create a loan loss reserve that is shown on the balance sheet. When the full amount of principal and interest on the loan becomes uncollectible, the loan balance is reduced through a charge to the loan loss reserve.
Regulatory CapitalConsists of tier 1 and tier 2 capital and is the total amount of capital a bank or other financial institution has to hold as required by its financial regulator. The CBB requires every bank to maintain a minimum ratio of total regulatory capital to total risk weighted assets plus weighted off-balance sheet items of 9% for domestic bank and 10% for international banks. The Central Bank may at any time require any particular bank to maintain a ratio higher if it considers such higher percentage appropriate with regard to the financial condition of the licensee. Resilience Ability of a market to function in an efficient, liquid and orderly manner at times of great price uncertainty and market stress.
Risk Weighted Assets Assets are weighted by factors representing their riskiness and potential for default, based on capital adequacy concepts.
Specific Provisions Provision for apparent (revealed) losses of problematic assets
Statutory Funds Funds within each insurer to which policies and related premiums and expenses are allocated.
Stress Test A quantitative test to determine the loss exposure of an institution using assumptions of abnormal but plausible shocks to market conditions.
Systemic Risk The risk that the inability of one or more participants to perform as expected will cause other participants to be unable to meet their obligations when due.
Tier 1 Capital The core capital supporting the lending and deposit activities of a bank. It consists primarily of common stock, retained earnings, and perpetual preferred stock.