acquisition of rugby architectural building products · acquisition of rugby architectural building...
TRANSCRIPT

Acquisition of Rugby Architectural
Building Products
“Creating the leading diversified hardwood lumber, panel and interior
architectural building materials distributor in North America”
Investor Presentation
June 13, 2016

Prospectus Information PROSPECTUS INFORMATION A preliminary short form prospectus containing important information relating to the securities described in this document has not yet been filed with the securities regulatory authorities in each of the provinces of Canada (other than Quebec). A
copy of the preliminary short form prospectus is required to be delivered to any investor that received this document and expressed an interest in acquiring the securities.
There will not be any sale or any acceptance of an offer to buy the securities until a receipt for the final short form prospectus has been issued.
This document does not provide full disclosure of all material facts relating to the securities offered. Investors should read the preliminary short form prospectus, final short form prospectus and any amendment, for disclosure of those facts,
especially risk factors relating to the securities offered, before making an investment decision.
The short form prospectus will constitute a public offering of the securities described therein and herein only in those jurisdictions where they may be lawfully offered for sale and therein only by persons authorized to sell such securities. The
securities which will be offered by the short form prospectus have not been and will not be registered under the United States Securities Act of 1933, as amended (the "1933 Act"), or any state securities laws and may not be offered or sold in
the United States, except in transactions exempt from the registration requirements of the 1933 Act and any applicable state securities laws. This presentation does not and the short form prospectus will not constitute an offer to sell or a
solicitation of an offer to buy any of these securities within the United States.
1

Forward Looking Statements
2
FORWARD LOOKING STATEMENTS Certain statements in this presentation may constitute “forward-looking information” or “financial outlook” within the meaning of applicable securities laws that involve known and unknown risks, uncertainties and other factors that may cause
actual results, performance or achievements or industry results to be materially different from any future results, performance or achievements or industry results expressed or implied by such forward-looking information or financial outlook.
Forward-looking information and financial outlook are identified by the use of terms and phrases such as “anticipate”, “believe”, “could”, “estimate”, “expect”, “intend”, “may”, “plan”, “predict”, “project”, “will”, “would”, and similar terms and
phrases, including references to assumptions. Such information may involve, but is not limited to, comments with respect to strategies, expectations, planned operations or future actions. Forward-looking information in this presentation
includes, without limitation, statements with respect to: Hardwoods’ anticipated business prospects; Hardwoods’ financial and operational performance, including the performance of its subsidiaries; the planned acquisition, including the
expected terms and closing thereof; plans regarding financing for the acquisition; contingent consideration for the acquisition; expectations or projections about strategies and goals for growth and expansion; expectations regarding realization
of synergies and accretion following the acquisition, and the timing thereof; expected impacts of the acquisition on EBITDA, Adjusted EBITDA, Pro Forma Adjusted EBITDA, sales, Adjusted Sales, Pro Forma Sales, earnings, cash flow, Payout
Ratio, Pro Forma Payout Ratio and dividend growth, as well as on Hardwoods’ future ability to reduce leverage levels; Rugby’s employees; planned changes in Hardwoods’ business, including the addition of new lines of business; expected
operating and financial results; and expected industry, market and economic conditions.
The forecasts and projections that make up the forward-looking information and financial outlook in this presentation are based on management’s expectations and assumptions regarding historical trends, current conditions and expected
future developments, which include, but are not limited to: the satisfactory timing and receipt of regulatory approval with respect to the acquisition and all related transactions; the completion of the acquisition; Hardwoods realizing the expected
benefits and synergies of the acquisition; no undisclosed liabilities associated with the acquisition; no material adverse changes occur in respect of the assets to be acquired before the completion of the acquisition; Hardwoods can comply with
the restrictive conditions required by the debt financing to be completed for the acquisition; there are no material exchange rate fluctuations between the Canadian and US dollar that affect Hardwoods’ performance; the general state of the
economy does not worsen.
The forward-looking information and financial outlook in this presentation is subject to risks, uncertainties and other factors that could cause actual results to differ materially from historical results or results anticipated by the forward-looking
information. The factors which could cause results to differ from current expectations include, but are not limited to: failure to raise the funds necessary to complete the acquisition; failure to close the acquisition; failure to realize the expected
returns and synergies of the acquisition; potential undisclosed liabilities associated with the acquisition; no control by Hardwoods over the assets to be acquired until completion of the acquisition; the acquisition debt financing will be subject to
certain restrictive conditions that limit the discretion of management; Hardwoods’ high dependency on the assets and business acquired from the vendors, if the acquisition closes; exchange rate fluctuations between the Canadian and US
dollar could affect Hardwoods’ performance; Hardwoods’ results are dependent upon the general state of the economy. More information about the risks and uncertainties affecting Hardwoods’ business can be found in the “Risk Factors”
section of its Annual Information Form dated March 11, 2016 which is available under Hardwoods’ profile on SEDAR at www.sedar.com.
To the extent any forward-looking information or statements in this presentation constitute a “financial outlook” within the meaning of securities laws, such information is being provided to demonstrate the potential benefits of the transaction and
management’s estimate of the future financial performance of Rugby, and readers are cautioned that this information may not be appropriate for any other purpose and that they should not place undue reliance on such information.
Although Hardwoods has attempted to identify factors that would cause actual actions, events or results to differ materially from those disclosed in the forward-looking statements or information or financial outlook, there may be other factors
that cause actions, events or results not to be as anticipated, estimated or intended. Also, many of the factors are beyond the control of Hardwoods. Accordingly, readers should not place undue reliance on forward-looking statements or
information. The forward-looking information is made as of the date of this presentation (or in the case of information contained in a document incorporated by reference herein, as of the date of such document), and Hardwoods assumes no
obligation to publicly update or revise such forward-looking information to reflect new information, subsequent or otherwise, except as may be required by applicable securities law. The forward-looking information contained herein is expressly
qualified in its entirety by this cautionary statement.
For the last twelve months (“LTM”) period ended March 31, 2016 all dollar amounts converted from US dollars to Canadian dollars using an average exchange rate of US$1.00 = C$1.3114.
See Appendix A, B and C to this presentation for non-IFRS and non-U.S. GAAP reconciliations.

Non-IFRS and Non-U.S. GAAP Measures
3
NON-IFRS AND NON-U.S. GAAP MEASURES This presentation makes reference to certain non-IFRS financial measures, in the case of the Company, or non-U.S. GAAP financial measures, in the case of Rugby. These non-IFRS and non-U.S. GAAP financial measures are not recognized
measures under IFRS and U.S. GAAP, as applicable, do not have a standardized meaning prescribed by IFRS or U.S. GAAP, as appl icable, and are therefore unlikely to be comparable to similar measures presented by other publicly traded
companies, and should not be construed as an alternative to other financial measures determined in accordance with IFRS and U.S. GAAP, as applicable. Rather, these financial measures are provided as additional information to complement
IFRS and U.S. GAAP financial measures by providing further understanding of operations from management’s perspective. Accordingly, non-IFRS and non-U.S. GAAP financial measures should never be considered in isolation nor as a
substitute to using net income as a measure of profitability or as an alternative to the IFRS consolidated statements of income or other IFRS or U.S. GAAP statements. Management presents non-IFRS and non-U.S. GAAP financial measures,
specifically Adjusted Sales, EBITDA, Adjusted EBITDA, Pro Forma Adjusted EBITDA, Payout Ratio and Pro Forma Payout Ratio as i t believes these supplementary disclosures provide useful additional information related to the operating
results and financial condition of the Company and uses these measures of financial performance and financial condition as a supplement to the consolidated statements of income and statements of financial position of the Company and
Rugby.
The definitions of the non-IFRS and non-U.S. GAAP measures contained in this presentation are as follows: (i) “Adjusted Sales” means sales including the full year results from acquisitions completed during the period and elimination of sales
from locations closed during the period; (ii) “EBITDA” means earnings before interest, taxes, depreciation and amortization; (iii) “Adjusted EBITDA” means earnings before interest, taxes, depreciation and amortization with adjustments for
owner costs and one-time expenses, adjustment to reflect full-year results from acquisitions completed during the period and elimination of results from locations closed during the period, as well as anticipated net benefits from ongoing
initiatives; (iv) “Pro Forma Adjusted EBITDA” means Rugby’s Adjusted EBITDA combined with Hardwoods’ EBITDA; (v) “Payout Ratio” means total dividends paid for the period divided by cash flow from operations before changes to working
capital and less maintenance capital expenditures for the period; and (v) “Pro Forma Payout Ratio” means Pro Forma total dividends paid for the period divided by Pro Forma cash flow from operations before changes to working capital less
maintenance capital expenditures for the period.
For the LTM period ended March 31, 2016 all dollar amounts converted from US dollars to Canadian dollars using an average exchange rate of US$1.00 = C$1.3114.
See Appendix A, B and C to this presentation for non-IFRS and non-U.S. GAAP reconciliations, as well as management’s discussion and analysis of Hardwoods dated May 12, 2016 for the three month period ended March 31, 2016 and
management’s discussion and analysis of Hardwoods dated March 11, 2016 for the year ended December 31, 2015.

Transaction Highlights
4
• Significantly enhances the financial scale of Hardwoods
• Increases Hardwoods’ presence in the commercial end-market, a key strategic objective for the
Company
• Positions Hardwoods for further US expansion and growth
• Establishes Hardwoods as the number one North American distributor of hardwood lumber, panel
and interior architectural building materials
• Diversifies Hardwoods’ customer and product concentration
• Expands Hardwoods’ US geographic footprint with significantly increased presence in the Eastern
US
• Aligned and incentivized management, and accretive earn-out structure
(1) “Payout Ratio”, “Pro Forma Payout Ratio” and “Pro Forma Adjusted EBITDA” are Non-IFRS and Non-U.S. GAAP
measures, see “Non-IFRS and Non-U.S. GAAP measures”
(2) See “Appendix C – Payout Ratio Buildup”
(3) See “Appendix B – Adjusted EBITDA Buildup”
• Enables a ~14% increase to the annual dividend while reducing the Q1 2016 Payout Ratio(1)(2) from
20.3% to a Pro Forma Payout Ratio(1)(2) of 17.8%
• Efficient use of Hardwoods’ debt capacity; debt to LTM Pro Forma Adjusted EBITDA(1)(3) of 2.3x
• Immediately accretive with further upside from expected synergies
1
2
3
4
5
6
7
8
9
10

Transaction Overview
5
Purchase Price Purchase of 100% of the assets of Rugby(1) for US$107 MM
- Additional consideration through earn-out of up to US$13 MM based on achieving certain
performance targets above internal budgets over a two year period after closing
Form of
Consideration
US$100 MM cash consideration, subject to traditional purchase price adjustments
US$7 MM equity subject to contractual restrictions on transfer
Up to an additional US$13 MM in cash or equity, with the amount to be determined and paid upon
achievement of certain performance targets
Financial
Impact
Expected to be accretive to both earnings per share (“EPS”) and cash flow per share (“CFPS”) prior to
any synergies
Identified synergies, include operational, structural and revenue efficiencies
Dividend increase(2) to $0.25 / year (~14% increase) while reducing the Q1 2016 Payout Ratio(3)(4) from
20.3% to a Pro Forma Payout Ratio(3)(4) of 17.8% (~12% reduction)
Transaction
Financing
Combined debt / Pro Forma Adjusted EBITDA(3)(5) of 2.3x
US$107 MM in fully committed financing with the acquisition; ~US$65 MM via increased debt facility,
~US$35 MM equity raise, US$7 MM equity to Rugby
Conditions and
Timing
Subject to third-party approvals, including approval of the TSX and US antitrust approval
Anticipated closing – July 2016
(1) “Rugby” means Rugby Acquisition, LLC and its subsidiaries, collectively doing business as
Rugby Architectural Building Products
(2) Expected to be effective for Q3 2016 dividend, subject to closing of the Transaction
(3) “Payout Ratio”, “Pro Forma Payout Ratio” and “Pro Forma Adjusted EBITDA” are Non-IFRS
and Non-U.S. GAAP measures, see “Non-IFRS and Non-U.S. GAAP Measures”
(4) See “Appendix C – Payout Ratio Buildup”
(5) See “Appendix B – Adjusted EBITDA Buildup”

Overview of Rugby Nationally-recognized industry leader in the one-step distribution of non-structural,
architectural-grade interior building products
6
One-Step Distribution Model Positioned as a critical link between customers
and suppliers
Leading Market Position 31 locations in the US
- 15 on the East coast
Full Product Offering Offers ~30,000 stocking SKUs
- ~6,000 non-stock SKUs
Diversified Customer / Supplier Base Approx. 800 suppliers and 22,000 customers
Strong Financial Performance US$282 MM in LTM(1) Adjusted Sales(2)(3) and
US$12.5 MM in LTM Adjusted EBITDA(2)(4)
Proven M&A Strategy 17 completed acquisitions since 2009
Track record of effective integration
(1) “LTM” means last twelve months ended March 31, 2016
(2) “Adjusted Sales” and “Adjusted EBITDA” are Non-IFRS and Non-U.S. GAAP measures, see “Non-IFRS and Non-U.S. GAAP Measures”
(3) See “Appendix A – Adjusted Sales Buildup”
(4) See “Appendix B – Adjusted EBITDA Buildup”

History of Rugby Through various initiatives, current management of Rugby has transformed their business
into a leading distributor of building products in the U.S.
7
2005
2009
2015
Spun out from
RMC plc
following MBO
Acquires 2
Facilities
Acquires
Northern
Pacific Group
2012 2013
2014
2010
2011
Acquired by
Current
Management
Acquires 11
Facilities
Leading Ridge
Invests
Acquires 13
Facilities
Acquires
Walden’s
Distributing
2016
Acquires 4
Facilities
Note: Acquisitions prior to closures

6%4%
5%
85%
Top 10 11-25 26-50 Others
46%
18%
14%
22%
Top 10 11-25 26-50 Others
Supply Chain
8
• Approximately 800 supplier
relationships
• Average tenure of ~12 years
across top 10 suppliers
• Supplies branded and non-
branded products
• Approximately 22,000 customer
relationships
• Average tenure of ~20 years
across top 10 customers
• Customers include: contractors,
retailers, manufacturers, etc.
Like Hardwoods, Rugby’s distribution model positions the Company as a critical link
connecting suppliers and customers for the distribution of building materials
Suppliers Customers
Supplier Concentration(1) Customer Concentration(1)
(1) Rugby Management estimate for the LTM period ended March 31, 2016

Products Offered
9
LTM Contribution(1)
US$168 million of Adjusted Sales(2)
~60% of total sales
~24% gross margin
Key Products
• Doors • Plywood
• Components • Lumber
• Hardware • Panels
LTM Contribution(1)
US$53 million of Adjusted Sales(2)
~19% of total sales
~19% gross margin
Key Products
• Interior Doors • Door Jambs
• Exterior Doors • Hardware
• Mouldings • Lights
LTM Contribution(1)
US$60 million of Adjusted Sales(2)
~21% of total sales
~26% gross margin
Key Products
• Laminate • Sinks / Faucets
• Countertops • Solid Surfacing
• Panels • Adhesives
Rugby offers a full line of non-structural, architectural-grade building products
Cabinets & Casework Decorative Surfacing Doors & Millwork
(1) Rugby Management estimate for the LTM period ended March 31, 2016
(2) “Adjusted Sales” is a Non-IFRS and Non-U.S. GAAP measure, see “Non-IFRS and Non-U.S. GAAP Measures”;
See “Appendix A – Adjusted Sales Buildup”
Note: Differences in Adjusted Sales to Appendix A are due to rounding

Key Benefits
10
Establishes a Leading
North American Distributor
Enhances Financial
Scale
Immediately Accretive
Increase to Dividend
1
2
3
4
Results in expanded national footprint with the addition of 31 facilities
Improves Balance Sheet
Efficiency
Increased Eastern US
Presence
5
6
(1) “Adjusted Sales”, “Adjusted EBITDA”, “EBITDA”, “Pro Forma Payout Ratio” and “Payout Ratio” are Non-IFRS and
Non-U.S. GAAP measures, see “Non-IFRS and Non-U.S. GAAP Measures”
(2) See “Appendix A – Adjusted Sales Buildup”
(3) See “Appendix B – Adjusted EBITDA Buildup”
(4) See “Appendix C – Payout Ratio Buildup”
Diversifies Platform
Aligned Management
Positioned for Further
Growth
7
8
9 Rugby has completed and integrated 17 acquisitions since 2009 and
has a robust acquisition pipeline
Earned US$282 MM in LTM Adjusted Sales(1)(2) and US$12.5 MM in
LTM Adjusted EBITDA(1)(3) – management is targeting EBITDA(1) for
Rugby of between US$13 MM and US$14 MM for 2016
Expected to be immediately accretive to EPS and CFPS pre-synergies
A ~14% increase to the annual dividend while reducing the Q1 2016
Payout Ratio(1)(4) from 20.3% to a Pro Forma Payout Ratio(1)(4) of 17.8%
Approximately 60% funded with debt; combined debt to LTM Pro Forma
Adjusted EBITDA(1) of 2.3x
~40% of Rugby’s LTM sales and 15 of Rugby’s locations are in the US
Northeast and Southeast markets
Increases presence in the commercial end market and adds
approximately 22,000 customers, diversifying Hardwoods’ customer
and product concentration
Management team has an established track record; CEO and COO will
own Hardwoods’ shares and participate in earn-out

11
Expanded National Footprint More than doubles the existing US branch location footprint, including significant East coast
presence, with minimal geographic overlap with Hardwoods existing locations
Northeastern and Southern
markets represent ~60%(1) of
total housing starts
Hardwoods Facility
Rugby Facility
(1) Per National Association of Home Builders, as at April 29, 2016
Triples number of locations in
these regions

13%
31%
27%
30%
48%
23%
29%24%
15%
30%
30%
Enhances Diversification
12
Geographic Concentration(1)
End Market Concentration(2)
61%
39%
20%
60%
20% 20%
60%
20%
Commercial Residential Other
36%
52%
12%
22%
17%33%
28%
Canada East U.S. West U.S. Central U.S.
(1) By number of branches
(2) By sales, for the LTM period ended March 31, 2016

52%38%
10%
Complementary Product Additions
13
Product Concentration(1)
Acquisition significantly broadens and diversifies Hardwoods’ product offering
Interior Doors Catches Hardware Faucets
40%
26%
12%
8%
7%6%
40%
26%
12%
8%
7%
6%
Sheets Lumber Other Casework Surfacing Doors & Millwork Other
Cabinets Coating
(1) For the LTM period ended March 31, 2016; based on Adjusted Sales; “Adjusted Sales” is a Non-IFRS and Non-
U.S. GAAP measure, see “Non-IFRS and Non-U.S. GAAP Measures”; See “Appendix A – Adjusted Sales Buildup”
Exterior Doors
20%
8%
31%
21%
19%
Sheets Lumber

14
Acquisition increases Hardwoods’ exposure to the improving U.S. housing market
Housing Starts (000s)(1)
Spending on Non-Residential Construction (US$B)(2)
Positioned for Further Growth
1,569 1,6031,705
1,8481,956
2,068
1,801
1,355
906
554 587 609781
925 1,0031,112 1,175
1,353
2000 2001 2002 2003 2004 2005 2006 2007 2008 2009 2010 2011 2012 2013 2014 2015 2016E 2017E
Long-Term Avg: ~1,450
$342 $347 $319 $309 $324 $346$390
$463$500
$437
$348 $337 $355 $360$389
$450$483 $510
2000 2001 2002 2003 2004 2005 2006 2007 2008 2009 2010 2011 2012 2013 2014 2015 2016E 2017E
(1) Per National Association of Home Builders, as at April 29, 2016
(2) Per FMI Consulting; FMI's Construction Outlook First Quarter Report (2016)

$594
$370
$964
$0
$500
$1,000
$1,500
Sale
s (
C$)
$37
$16
$53
$0
$25
$50
$75
EB
ITD
A (
C$)
15
Acquisition significantly enhances Hardwoods’ financial profile
Pro Forma Financials (C$)
LTM Pro Forma Sales(1)(2)(4)
LTM Pro Forma Adjusted EBITDA(1)(2)(5)
Financial Leverage(3)
Current Debt ~C$35 MM
Acquisition Debt ~C$85 MM
Pro Forma Total Debt ~C$120 MM
~2.3x Combined Debt to LTM Pro Forma Adjusted EBITDA(1)
(1) “Pro Forma Sales” and “Pro Forma Adjusted EBITDA” are Non-IFRS and Non-U.S. GAAP
measures, see “Non-IFRS and Non-U.S. GAAP Measures”
(2) Utilizes an average USD / CAD exchange rate of ~$1.31
(3) Utilizes a USD / CAD exchange rate of ~$1.30 (March 31, 2016)
(4) See “Appendix A – Adjusted Sales Buildup”
(5) See “Appendix B – Adjusted EBITDA Buildup”
16
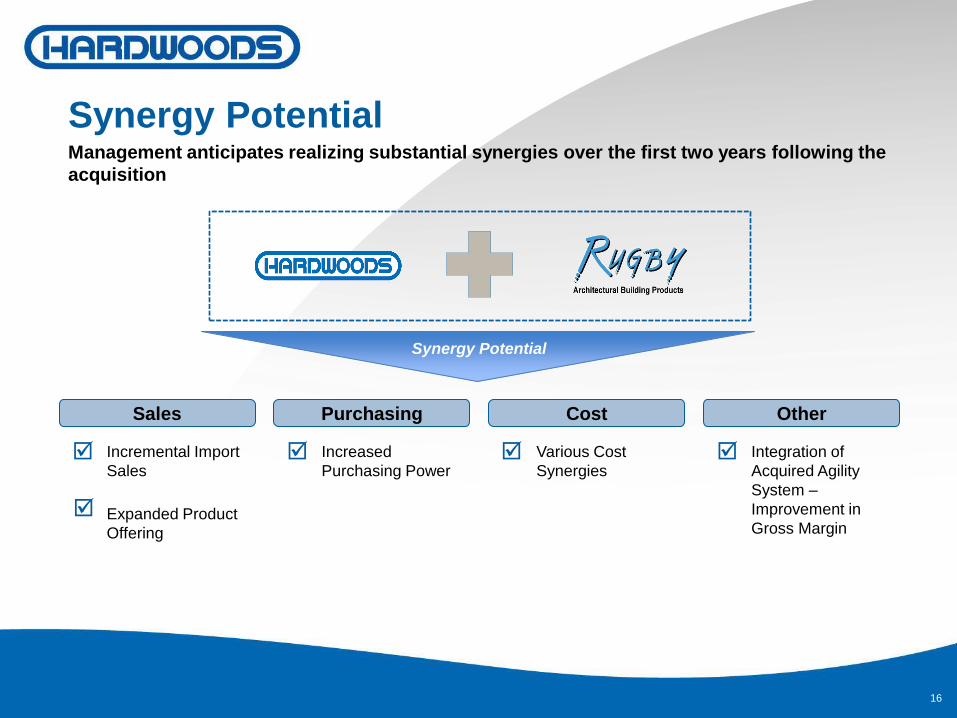
Synergy Potential
Sales
Synergy Potential Management anticipates realizing substantial synergies over the first two years following the
acquisition
Purchasing Cost Other
Incremental Import
Sales
Expanded Product
Offering
Increased
Purchasing Power
Various Cost
Synergies
Integration of
Acquired Agility
System –
Improvement in
Gross Margin

17
Financing and Capital Markets Impact
Equity
~C$50 MM bought deal financing led by Cormark Securities
US$7 MM of equity issued as partial consideration
- Float expected to increase by ~30%(1)
Debt U.S. chartered bank to fund US$65 MM debt requirement
- 5 year term at competitive rates
Positioning
Pro forma market capitalization and enterprise value of ~C$303 MM(2) and ~C$424 MM(2),
respectively
Expected to be accretive to EPS and CFPS before operating and structural synergies
Annual dividend increase to $0.25 / share (~14% increase) from $0.22 / share
Payout Ratio(3)(4) reduces from 20.3% to a Pro Forma Payout Ratio(3)(4) of 17.8% (Q1 2016
basis)
Clean balance sheet and current financing environment provides an opportunity to secure
favourable financing terms
(1) Float calculated as total shares outstanding less insider holdings
(2) Market capitalization based on a C$14.50 Hardwoods’ share price and includes the dilutive securities from
Hardwoods’ long-term incentive plan; enterprise value utilizes pro forma balance sheet items as of March 31, 2016
(3) “Payout Ratio” and “Pro Forma Payout Ratio” are Non-IFRS measures, see “Non-IFRS and Non-U.S. GAAP
measures”
(4) See “Appendix C – Payout Ratio Buildup”

18
Pro Forma Summary
Op
era
tio
nal
Facilities 33 31 64
Customers 10,000 22,000 32,000
Fin
an
cia
l LTM Adjusted
Sales(2) C$594 MM C$370 MM C$964 MM
LTM Adjusted
EBITDA(2) C$37 MM C$16 MM C$53 MM
Sc
ale
Market Cap(5) C$245 MM C$58 MM C$303 MM
Enterprise(5)
Value C$281 MM C$142 MM C$424 MM
(1)
(3)
(4)
(1) Market capitalization based on a C$14.50 Hardwoods’ share price and includes the dilutive securities from Hardwoods’ long-term incentive plan; enterprise value utilizes pro forma balance sheet items as of March 31, 2016
(1) LTM Sales and EBITDA converted utilizing an average USD / CAD exchange rate
of ~$1.31; any debt outstanding converted at a USD / CAD FX rate of $1.30
(2) “Adjusted Sales” and “Adjusted EBITDA” are Non-IFRS and Non-U.S. GAAP
measures, see “Non-IFRS and Non-U.S. GAAP Measures”
(3) See “Appendix A – Adjusted Sales Buildup”
(4) See “Appendix B – Adjusted EBITDA Buildup”
(5)
(3)
(4)

19
Summary
• Adds LTM Adjusted EBITDA(1)(2)(3) of US$12.5 million, bringing LTM Pro Forma
Adjusted EBITDA(1)(2)(3) to C$53 million
• ~14% increase to dividend while reducing Payout Ratio(2)(4) by 12%
• Establishes Hardwoods as the leading North American hardwood distribution
company
• Expected to be immediately accretive to both CFPS and EPS
• Adds 31 new US locations, more than doubling the existing US branch
location footprint, including significant East coast presence
(1) LTM Sales and EBITDA and any debt outstanding converted at a USD / CAD FX rate of $1.31 (March 31, 2016)
(2) “Adjusted EBITDA”, “Pro Forma Adjusted EBITDA” and “Payout Ratio” are Non-IFRS and Non-U.S. GAAP
measures, see “Non-IFRS and Non-U.S. GAAP Measures”
(3) See “Appendix B – Adjusted EBITDA Buildup”
(4) See “Appendix C – Payout Ratio Buildup”

20
Appendix A – Adjusted Sales Buildup
Sales Reconciliation
(Year Ended December 31) (Quarter Ended March 31) (Year Ended March 31)
(US$MM, unless otherwise specified) 2015 Q1/15 Q1/16 LTM
Rugby Sales $271.6 $65.5 $68.2 $274.3
Net Facility Increase (Acquisitions) $6.8 $1.0 $2.3 $8.0
Rugby Adjusted Sales $278.3 $66.5 $70.4 $282.3
FX Rate (C$ / US$) $1.2787 $1.2412 $1.3732 $1.3114
Rugby Adjusted Sales (C$) $355.9 $82.5 $96.7 $370.2
Hardwoods’ Sales (C$) $571.6 $135.1 $157.4 $593.9
Pro Forma Sales (C$) $927.5 $217.6 $254.1 $964.1
Note: Differences due to rounding

21
Appendix B – Adjusted EBITDA Buildup
(Year Ended December 31) (Quarter Ended March 31) (Year Ended March 31)
(US$MM, unless specified otherwise) 2015 Q1/15 Q1/16 LTM
Rugby Net Earnings $3.1 $0.6 $1.6 $4.2
Provision for Income Taxes $0.9 $0.2 $0.0 $0.7
Interest Expense $1.3 $0.4 $0.3 $1.2
Depreciation and Amortization $2.9 $0.7 $0.7 $2.9
Amortization of Loan Origination Costs $0.1 $0.0 $0.0 $0.1
Miscellaneous and Other Income ($0.2) $0.0 ($0.1) ($0.3)
Rugby EBITDA $8.1 $1.9 $2.6 $8.8
Normalizations
Net Facility Increase (Acquisitions) $1.6 $0.4 $0.3 $1.6
Owner Costs and One-Time Expenses $1.1 $0.3 $0.3 $1.1
Ongoing Initiatives $1.4 $0.4 $0.0 $1.0
Rugby Adjusted EBITDA $12.2 $3.0 $3.3 $12.5
FX Rate (C$ / US$) $1.2787 $1.2412 $1.3732 $1.3114
Rugby Adjusted EBITDA (C$) $15.6 $3.7 $4.5 $16.4
Hardwoods EBITDA (C$) $34.8 $7.6 $9.4 $36.6
Pro Forma Adjusted EBITDA (C$) $50.4 $11.3 $13.9 $53.0
EBITDA Reconciliation
Note: Differences due to rounding
22
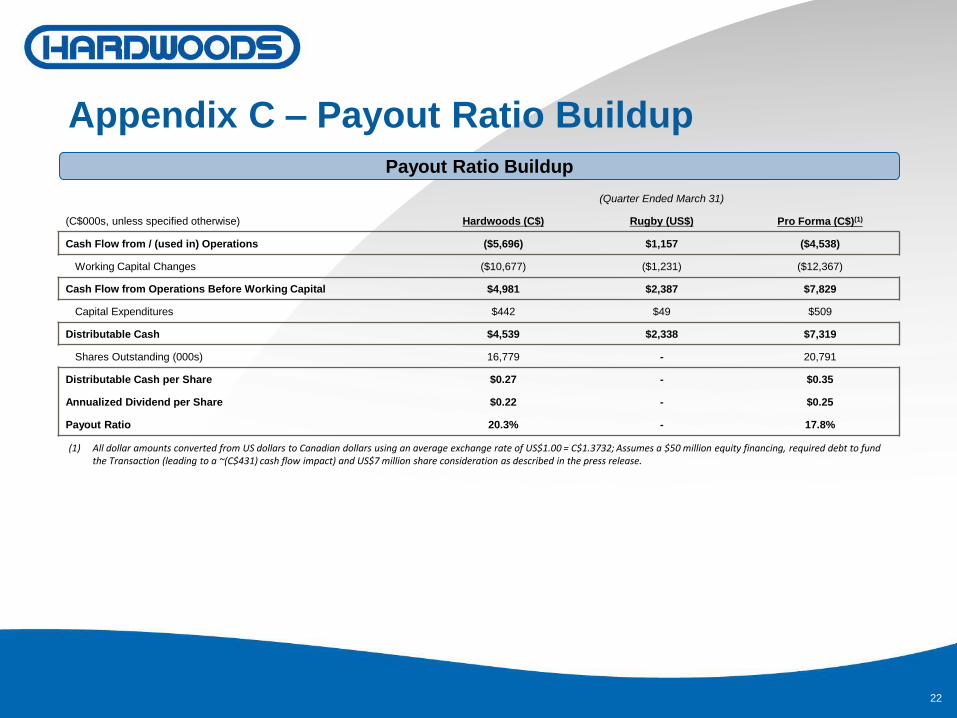
Appendix C – Payout Ratio Buildup
Payout Ratio Buildup
(Quarter Ended March 31)
(C$000s, unless specified otherwise) Hardwoods (C$) Rugby (US$) Pro Forma (C$)(1)
Cash Flow from / (used in) Operations ($5,696) $1,157 ($4,538)
Working Capital Changes ($10,677) ($1,231) ($12,367)
Cash Flow from Operations Before Working Capital $4,981 $2,387 $7,829
Capital Expenditures $442 $49 $509
Distributable Cash $4,539 $2,338 $7,319
Shares Outstanding (000s) 16,779 - 20,791
Distributable Cash per Share $0.27 - $0.35
Annualized Dividend per Share $0.22 - $0.25
Payout Ratio 20.3% - 17.8%
(1) All dollar amounts converted from US dollars to Canadian dollars using an average exchange rate of US$1.00 = C$1.3732; Assumes a $50 million equity financing, required debt to fund the Transaction (leading to a ~(C$431) cash flow impact) and US$7 million share consideration as described in the press release.