acoustically modulated magnetic resonance imaging of … · 6 supplementary figure 7 |...
TRANSCRIPT

Articleshttps://doi.org/10.1038/s41563-018-0023-7
Acoustically modulated magnetic resonance imaging of gas-filled protein nanostructuresGeorge J. Lu 1, Arash Farhadi 2, Jerzy O. Szablowski1, Audrey Lee-Gosselin1, Samuel R. Barnes 3, Anupama Lakshmanan2, Raymond W. Bourdeau 1 and Mikhail G. Shapiro 1*
1Division of Chemistry and Chemical Engineering, California Institute of Technology, Pasadena, CA, USA. 2Division of Biology and Biological Engineering, California Institute of Technology, Pasadena, CA, USA. 3Department of Radiology, Loma Linda University, Loma Linda, CA, USA. *e-mail: [email protected]
© 2018 Macmillan Publishers Limited, part of Springer Nature. All rights reserved.
SUPPLEMENTARY INFORMATION
In the format provided by the authors and unedited.
NAtuRe MAteRiALS | www.nature.com/naturematerials

1
Acoustically modulated magnetic resonance imaging of gas-filled protein nanostructures George J. Lu1, Arash Farhadi2, Jerzy O. Szablowski1, Audrey Lee-Gosselin1, Samuel R. Barnes3, Anupama Lakshmanan2, Raymond W. Bourdeau1, Mikhail G. Shapiro1*
1Division of Chemistry and Chemical Engineering, 2Division of Biology and Biological Engineering, California Institute of Technology, Pasadena, CA 91125, USA. 3Department of Radiology, Loma Linda University, Loma Linda, CA.
* Correspondence should be addressed to M.G.S. ([email protected])
Supplementary Information
Theoretical consideration of the T2/T2* relaxation produced by gas vesicles
Relaxation theory1-7 describes the T2/T2* relaxation of water near a contrast agent in three primary regimes: (1)
the motional averaging regime, where 𝛥𝜔# ∙ 𝜏& ≪ 1; (2) the static dephasing regime, where 𝛥𝜔# ∙ 𝜏& ≫ 1; and (3)
the intermediate regime, where 𝛥𝜔# ∙ 𝜏&~1. Here Δωr is the root-mean-square frequency shift at the surface of the
contrast agent and τD is the time for a water molecule to diffuse across the distance of the contrast agent’s radius.
Considering a single gas vesicle (GV) at high field (Fig. 1b), we obtain 𝛥𝜔# ≈ 𝛥𝜒 ∙ 𝛾𝐵0 ≈ 102𝐻𝑧 and 𝜏& ≈
1056𝑠𝑒𝑐; therefore T2/T2* relaxation on the nanoscale (e.g., everywhere inside an agarose well containing GVs)
occurs in the motional averaging regime. At the same time, the macroscale ΔB field around a millimetre-sized
agarose well containing GVs (at a volume fraction of ~ 0.01%) (Fig. 1d) has a predicted 𝛥𝜔# ≈ 105:𝐻𝑧 and 𝜏& ≈
102𝑠𝑒𝑐, resulting in T2/T2* relaxation in the static dephasing regime.
These relaxation regimes are manifest in the T2-weighted and T2*-weighted images shown in Supplementary
Fig. 1. The spin relaxation at the centre of the well is predominantly a result of the nanoscale ΔB field, while the
spin relaxation near the rim of the wells results from the macroscale ΔB field. The rim usually appears darker than
the centre of the well in T2*-weighted images because of the more efficient relaxation of water 1H in the static
dephasing regime than in the motional averaging regime. On the other hand, the rim of the wells lacks hypointense
contrast in T2-weighted images, since π pulses can effectively refocus the dephasing of 1H spins in the static
dephasing regime.
Relaxation theory also sheds light on the behaviour of clustered GVs. The micron-size GV clusters are
predicted to have 𝜏& ≈ 1052𝑠𝑒𝑐 and are therefore shifting the water 1H relaxation from the motional averaging
regime to the intermediate regime, resulting in strong enhancement of both T2* and T2 relaxation (Fig. 6).

2
Supplementary Figure 1 | Representative images of GV-containing well in the agarose phantom. a, T2*-
weighted (T2*w) and b, T2-weighted (T2w) images at echo time TE = 45 msec. c. T2* and T2 map, where pixel-wise T2/T2*
relaxation times are plotted. The rim of the wells is marked by the hypointense contrast in the T2*w image and T2* map (a, c)
and the absence of the contrast in the T2w image and T2 map (b, d). In all the images, B0 fields are along the vertical
direction, and the well contained 1.42 nM Halo GVs.
3
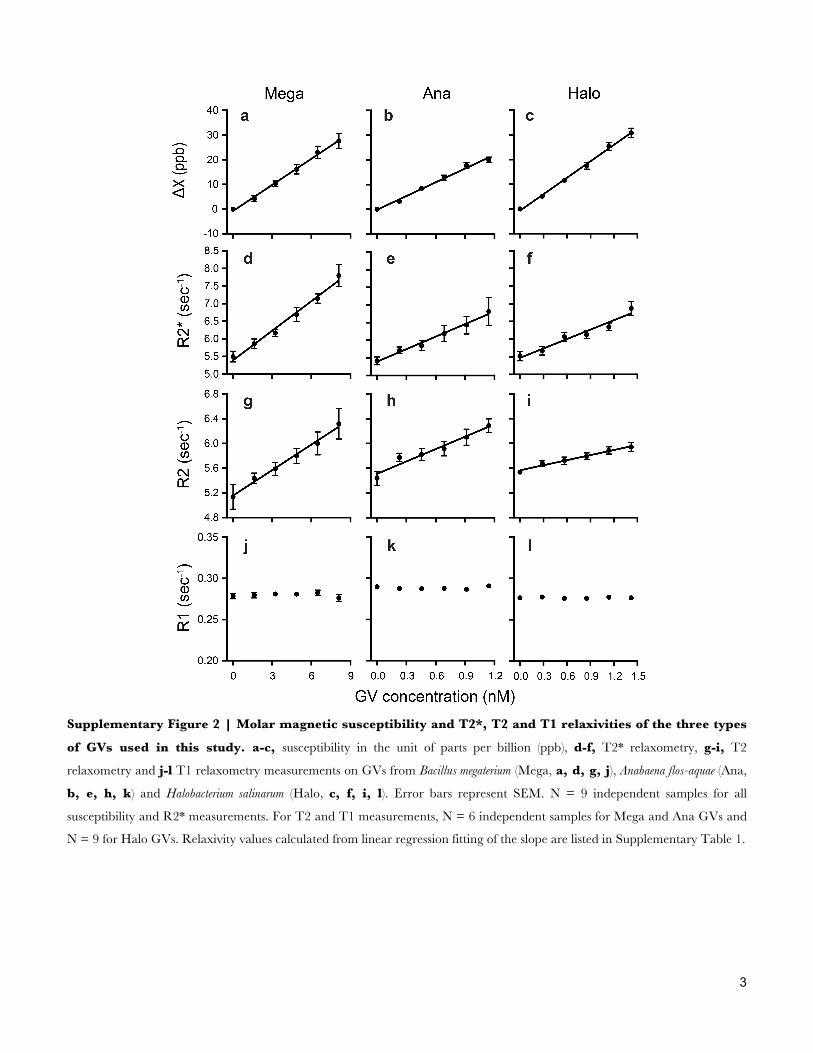
Supplementary Figure 2 | Molar magnetic susceptibility and T2*, T2 and T1 relaxivities of the three types
of GVs used in this study. a-c, susceptibility in the unit of parts per billion (ppb), d-f, T2* relaxometry, g-i, T2
relaxometry and j-l T1 relaxometry measurements on GVs from Bacillus megaterium (Mega, a, d, g, j), Anabaena flos-aquae (Ana,
b, e, h, k) and Halobacterium salinarum (Halo, c, f, i, l). Error bars represent SEM. N = 9 independent samples for all
susceptibility and R2* measurements. For T2 and T1 measurements, N = 6 independent samples for Mega and Ana GVs and
N = 9 for Halo GVs. Relaxivity values calculated from linear regression fitting of the slope are listed in Supplementary Table 1.

4
Supplementary Figure 3 | Quantitative susceptibility mapping (QSM) of GV contrast in vivo. a, T2*-weighted
image of a coronal slice from a 3D multi gradient echo (MGE) image of the mouse brain. The hypointense contrast inside the
brain tissue corresponds to the site of GV injection. b, The same slice rendered from QSM processing of the 3D image.
Supplementary Figure 4 | Acoustic collapse measurement of clustered AnaΔC and E. coli expressing A2C
GVs. Ultrasound images were acquired after sequentially exposing the samples to insonation at increasing acoustic pressures,
and the collapse of GVs were monitored as a decrease of the image intensity. N = 3 independent samples, and the error bars
represent SEM. Sigmoidal collapse curve was obtained by nonlinear least-square fitting.
Supplementary Figure 5 | Monte Carlo simulation of error distributions in the two multiplexing methods.
a-b, Simulated distribution of apparent GV concentrations calculated by (a) simple acoustic multiplexing or (b) acoustic
multiplexing with the help of spectral unmixing, based on experimental values in Fig. 5 c-d. c, Simulated distribution of
apparent GV concentrations by multiparametric multiplexing using the inputs derived from the experimentally measured
values in Fig. 6, b-c. Black plus signs represent true values of GV concentrations, and individual dots (magenta, cyan or black)
represent individual simulations with randomized input of errors. Details of the simulation are provided in Methods.
5
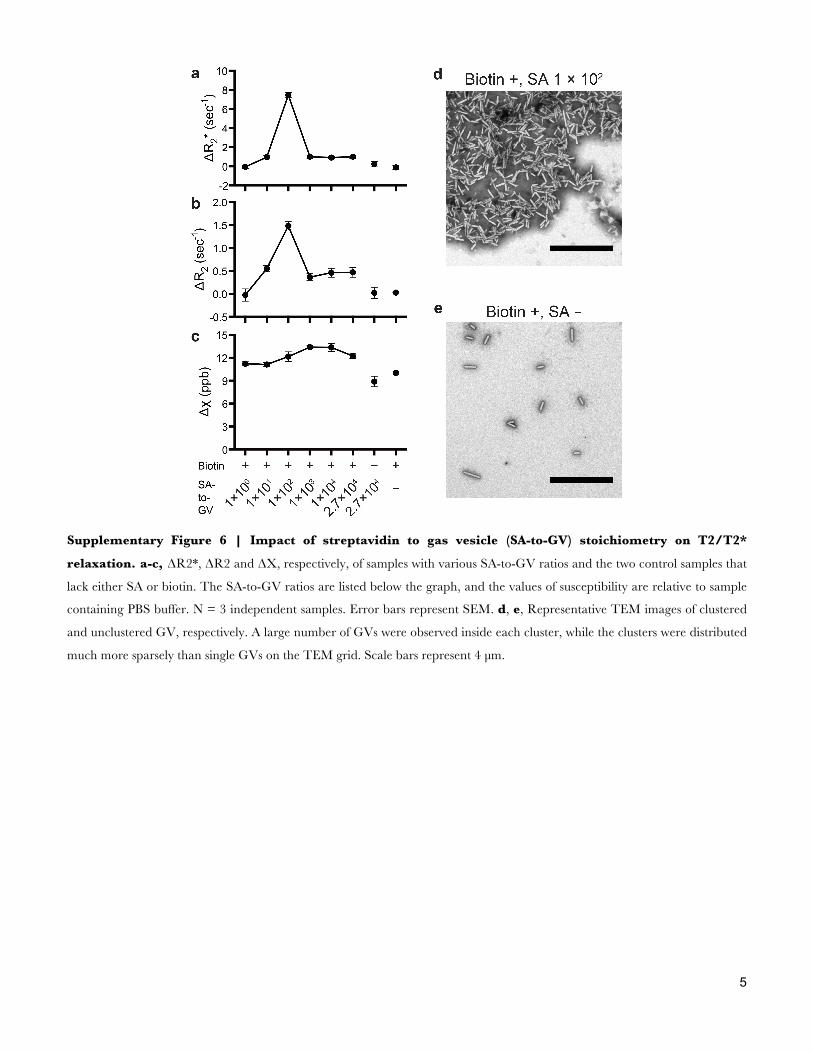
Supplementary Figure 6 | Impact of streptavidin to gas vesicle (SA-to-GV) stoichiometry on T2/T2*
relaxation. a-c, ΔR2*, ΔR2 and ΔΧ, respectively, of samples with various SA-to-GV ratios and the two control samples that
lack either SA or biotin. The SA-to-GV ratios are listed below the graph, and the values of susceptibility are relative to sample
containing PBS buffer. N = 3 independent samples. Error bars represent SEM. d, e, Representative TEM images of clustered
and unclustered GV, respectively. A large number of GVs were observed inside each cluster, while the clusters were distributed
much more sparsely than single GVs on the TEM grid. Scale bars represent 4 µm.
6
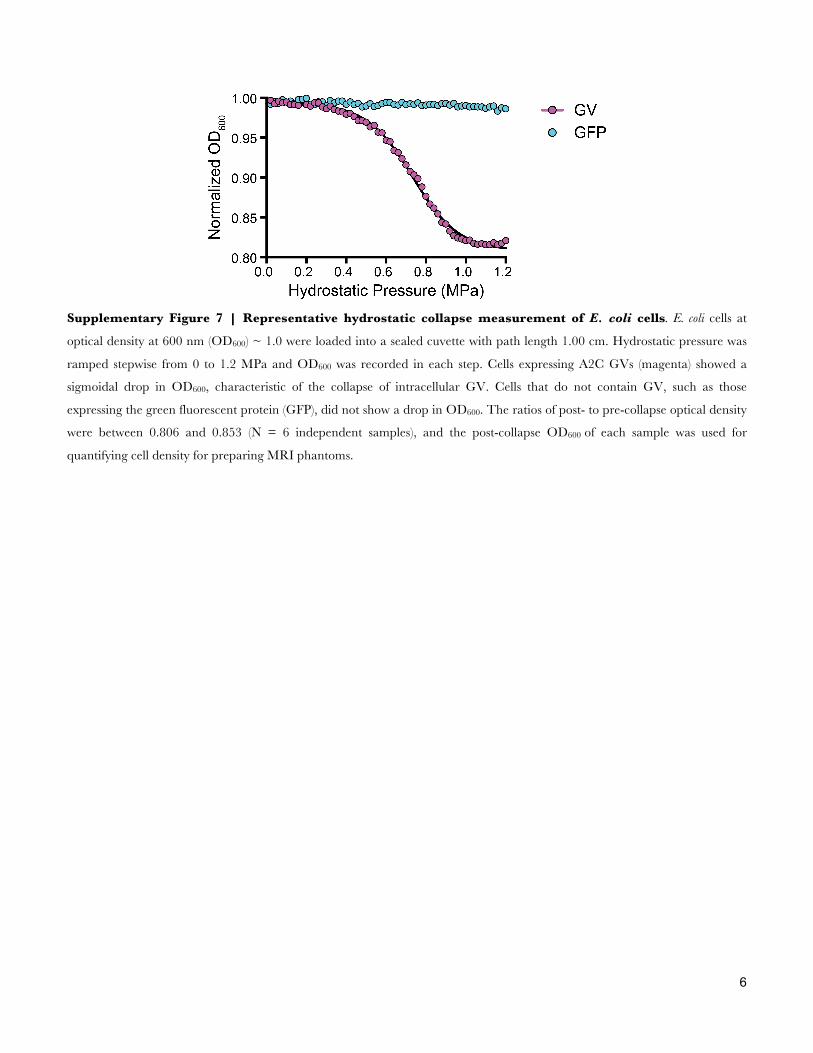
Supplementary Figure 7 | Representative hydrostatic collapse measurement of E. coli cells. E. coli cells at
optical density at 600 nm (OD600) ~ 1.0 were loaded into a sealed cuvette with path length 1.00 cm. Hydrostatic pressure was
ramped stepwise from 0 to 1.2 MPa and OD600 was recorded in each step. Cells expressing A2C GVs (magenta) showed a
sigmoidal drop in OD600, characteristic of the collapse of intracellular GV. Cells that do not contain GV, such as those
expressing the green fluorescent protein (GFP), did not show a drop in OD600. The ratios of post- to pre-collapse optical density
were between 0.806 and 0.853 (N = 6 independent samples), and the post-collapse OD600 of each sample was used for
quantifying cell density for preparing MRI phantoms.

7
Mega Ana Halo
GV geometry
Length (nm) 249 ± 13 519 ± 15 400 ± 10
Width (nm) 72.5 ± 1.7 136.3 ± 2.0 250.8 ± 4.6
Number of particles measured N=61 N=107 N=125
GV concentration relationships
Protein concentration to OD500 ratio ([μg/mL] / OD) 145.5 ± 6.4 36.6 ± 2.6 13.4 ± 2.2
Estimated molecular weight (MDa) 71.7 320 282
Molar protein concentration to OD500 ratio (pM / OD) 2,030 114 47.3
GV MRI properties
Molar susceptibility (ppb / nM) 3.52 ± 0.27 18.53 ± 0.91 22.2 ± 1.0
Mass susceptibility (ppb / [mg/mL]) 39.2 ± 3.0 57.2 ± 2.8 80.9 ± 3.8
Relaxivity r2* (sec-1 / nM) 0.280 ± 0.027 1.19 ± 0.23 0.89 ± 0.11
Relaxivity r2* (sec-1 / [mg/mL]) 3.11 ± 0.30 3.66 ± 0.71 3.24 ± 0.42
Relaxivity r2 (sec-1 / nM) 0.138 ± 0.023 0.67 ± 0.11 0.273 ± 0.045
Relaxivity r2 (sec-1 / [mg/mL]) 1.53 ± 0.26 2.06 ± 0.34 1.00 ± 0.16
Supplementary Table 1. Summary of the geometrical, optical and magnetic properties of three types of gas
vesicles (GVs). Although the size and shape of GVs are determined primarily by the genotype, each type possesses certain
degree of heterogeneity. For example, Ana GVs has length distribution with a standard deviation of 35% of the mean9. Errors
of GV geometry represent SEM. The protein concentrations of GVs were measured by Pierce 660nm protein assay (N = 4, 5, 3
measurements of independent samples of Mega, Ana and Halo GVs, respectively). Molar susceptibility and relaxivity
correspond to the slopes from linear regression fitting of the MRI measurements in Supplementary Fig. 2, and the errors are
the standard error of the slope. r2* relaxivity was quantified from the center of the agarose wells and excluded the high contrast
at the rim of the wells (Supplementary Figure 1).
8
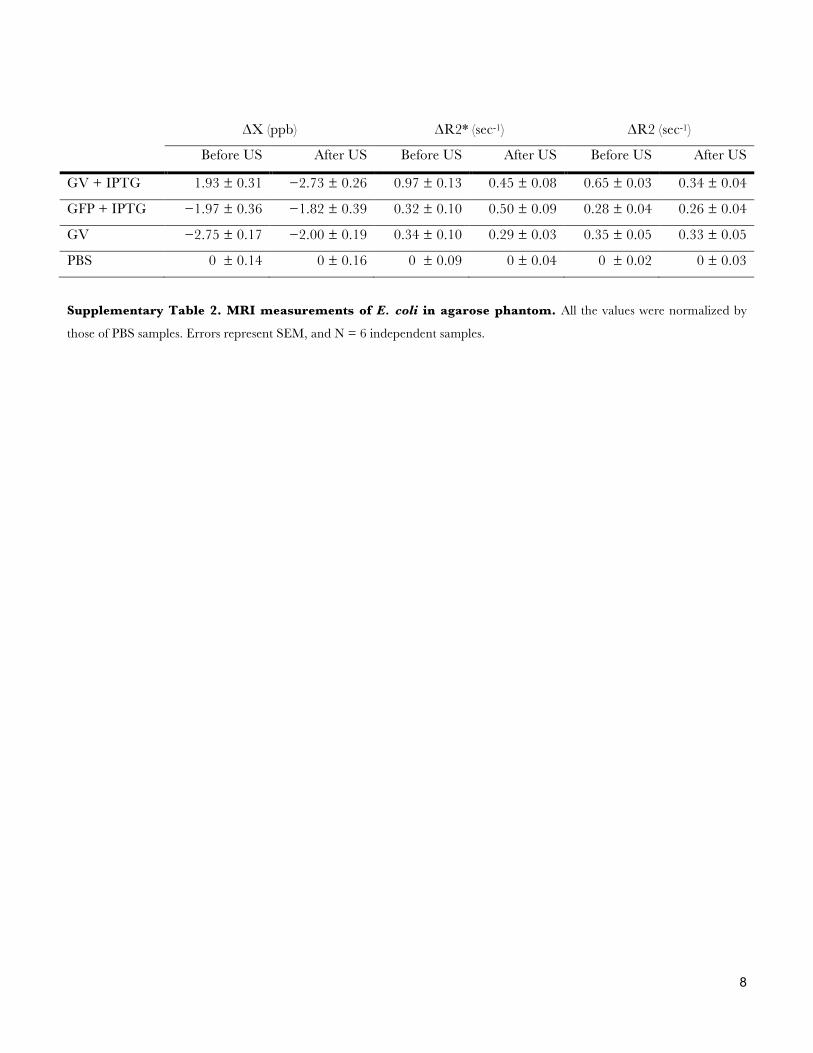
ΔΧ (ppb) ΔR2* (sec-1) ΔR2 (sec-1)
Before US After US Before US After US Before US After US
GV + IPTG 1.93 ± 0.31 −2.73 ± 0.26 0.97 ± 0.13 0.45 ± 0.08 0.65 ± 0.03 0.34 ± 0.04
GFP + IPTG −1.97 ± 0.36 −1.82 ± 0.39 0.32 ± 0.10 0.50 ± 0.09 0.28 ± 0.04 0.26 ± 0.04
GV −2.75 ± 0.17 −2.00 ± 0.19 0.34 ± 0.10 0.29 ± 0.03 0.35 ± 0.05 0.33 ± 0.05
PBS 0 ± 0.14 0 ± 0.16 0 ± 0.09 0 ± 0.04 0 ± 0.02 0 ± 0.03
Supplementary Table 2. MRI measurements of E. coli in agarose phantom. All the values were normalized by
those of PBS samples. Errors represent SEM, and N = 6 independent samples.

9
Supplementary References
1. Yablonskiy, D.A. & Haacke, E.M. Theory of NMR signal behavior in magnetically inhomogeneous tissues: The static dephasing regime. Magn. Reson. Med. 32, 749-763 (1994).
2. Gillis, P., Moiny, F. & Brooks, R.A. On T2-shortening by strongly magnetized spheres: A partial refocusing model. Magn. Reson. Med. 47, 257-263 (2002).
3. Gillis, P. & Koenig, S.H. Transverse relaxation of solvent protons induced by magnetized spheres: Application to ferritin, erythrocytes, and magnetite. Magn. Reson. Med. 5, 323-345 (1987).
4. Jensen, J.H. & Chandra, R. NMR relaxation in tissues with weak magnetic inhomogeneities. Magn. Reson. Med. 44, 144-156 (2000).
5. Matsumoto, Y. & Jasanoff, A. T2 relaxation induced by clusters of superparamagnetic nanoparticles: Monte Carlo simulations. Magn. Reson. Imaging 26, 994-998 (2008).
6. Bowen, C.V., Zhang, X., Saab, G., Gareau, P.J. & Rutt, B.K. Application of the static dephasing regime theory to superparamagnetic iron-oxide loaded cells. Magn. Reson. Med. 48, 52-61 (2002).
7. Brooks, R.A., Moiny, F. & Gillis, P. On T2-shortening by weakly magnetized particles: The chemical exchange model. Magn. Reson. Med. 45, 1014-1020 (2001).
8. Shaner, N.C. et al. A bright monomeric green fluorescent protein derived from Branchiostoma lanceolatum. Nat Meth 10, 407-409 (2013).
9. Walsby, A.E. Gas vesicles. Microbiological Reviews 58, 94-144 (1994).