acoustical monitoring report 2009 · · 2018-04-24this report received informal peer review by...
TRANSCRIPT

National Park Service U.S. Department of the Interior Natural Resource Stewardship and Science
Mount Rainier National Park Acoustical Monitoring Report 2009 Natural Sounds Program Report NPS/NRSS/NRTR—2011/495

Notice
This document is disseminated under the sponsorship of the National Park Service in the interest of information exchange. The United States Government assumes no liability for its contents or use thereof.
Notice
The United States Government does not endorse products or manufacturers. Trade or manufacturers’ names appear herein solely because they are considered essential to the objective of this report.
ON THE COVER Mount Rainier National Park, taken at MORA in 2009 Volpe Center Photo
Mount Rainier National Park Acoustical Monitoring Report 2009 Natural Sounds Program Report NPS/NRSS/NRTR—2011/495
Prepared For: U.S. Department of the Interior National Park Service Natural Resource Stewardship and Science Natural Sounds and Night Skies Division 1201 Oakridge Drive, Suite 100 Fort Collins, CO 80525
Prepared By: U.S. Department of Transportation Research and Innovative Technology Administration John A. Volpe National Transportation Systems Center Environmental Measurement and Modeling Division, RVT-41
December 2011 U.S. Department of the Interior National Park Service Natural Resource Stewardship and Science Fort Collins, Colorado

ii
The National Park Service, Natural Resource Stewardship and Science office in Fort Collins, Colorado publishes a range of reports that address natural resource topics of interest and applicability to a broad audience in the National Park Service and others in natural resource management, including scientists, conservation and environmental constituencies, and the public.
The Natural Resource Technical Report Series is used to disseminate results of scientific studies in the physical, biological, and social sciences for both the advancement of science and the achievement of the National Park Service mission. The series provides contributors with a forum for displaying comprehensive data that are often deleted from journals because of page limitations.
All manuscripts in the series receive the appropriate level of peer review to ensure that the information is scientifically credible, technically accurate, appropriately written for the intended audience, and designed and published in a professional manner.
This report received informal peer review by subject-matter experts who were not directly involved in the collection, analysis, or reporting of the data. Data in this report were collected and analyzed using methods based on established, peer-reviewed protocols and were analyzed and interpreted within the guidelines of the protocols.
Views, statements, findings, conclusions, recommendations, and data in this report do not necessarily reflect views and policies of the National Park Service, U.S. Department of the Interior. Mention of trade names or commercial products does not constitute endorsement or recommendation for use by the U.S. Government.
Printed copies of reports in these series may be produced in a limited quantity and they are only available as long as the supply lasts. This report is also available from the Natural Resource Publications Management website (http://www.nature.nps.gov/publications/nrpm/) on the Internet or by sending a request to the address on the back cover.
Please cite this publication as:
National Park Service. 2011. Mount Rainier National Park: Acoustical monitoring report 2009. Natural Resource Technical Report NPS/NRSS/NRTR—2011/495. National Park Service, Fort Collins, Colorado.
NPS 105/110604, December 2011

iii
Form Approved
OMB No. 0704-0188 REPORT DOCUMENTATION PAGE
Public reporting burden for this collection of information is estimated to average 1 hour per response, including the time for reviewing instructions, searching existing data sources, gathering and maintaining the data needed, and completing and reviewing the collection of information. Send comments regarding this burden estimate or any other aspect of this collection of information, including suggestions for reducing this burden, to Washington Headquarters Services, Directorate for Information Operations and Reports, 1215 Jefferson Davis Highway, Suite 1204, Arlington, VA 22202-4302, and to the Office of Management and Budget, Paperwork Reduction Project (0704-0188), Washington, DC 20503.
3. REPORT TYPE AND DATES COVERED
Final Report
1. AGENCY USE ONLY (Leave blank)
2. REPORT DATE
December 2011 4. TITLE AND SUBTITLE Mount Rainier National Park: Acoustical Monitoring Report 2009
5. FUNDING NUMBERS
VX-82/JM518
6. AUTHOR(S) Cynthia Lee and John MacDonald
7. PERFORMING ORGANIZATION NAME(S) AND ADDRESS(ES) U.S. Department of Transportation Research and Innovative Technology Administration John A. Volpe National Transportation Systems Center Environmental Measurement and Modeling Division, RVT-41 Cambridge, MA 02142-1093
8. PERFORMING ORGANIZATION REPORT NUMBER DOT-VNTSC-NPS-11-09
9. SPONSORING/MONITORING AGENCY NAME(S) AND ADDRESS(ES) U.S. Department of the Interior National Park Service Natural Resource Stewardship and Science Natural Sounds and Night Skies Division 1201 Oakridge Drive, Suite 100 Fort Collins, CO 80525
10.SPONSORING/MONITORING
AGENCY REPORT NUMBER NPS/NRSS/NRTR—2011/495
11. SUPPLEMENTARY NOTES NPS Program Manager: Vicki McCusker
12a. DISTRIBUTION/AVAILABILITY STATEMENT 12b. DISTRIBUTION CODE
13. ABSTRACT (Maximum 200 words) During the summer (July – September 2009), baseline acoustical data were collected for approximately one month at two sites deployed by NPS personnel in Mount Rainier National Park (MORA). The purpose of the monitoring effort was to supplement prior ambient data collected by NPS in 2006-2007. The data will help park managers and planners estimate the effects of future noise impacts and will help to inform future park planning objectives such as creating soundscape management plans, as well as the development of an Air Tour Management Plan (ATMP), which provides for the regulation of commercial air tours over National Parks. This report provides a summary of results of these measurements, representing MORA’s summer season.
14. SUBJECT TERMS Aircraft noise, air tours, ambient, acoustic zones, noise impact, noise, Air Tour Management Plan, ATMP, National Park
15. NUMBER OF PAGES: 52 16. PRICE CODE
17. SECURITY CLASSIFICATION OF REPORT Unclassified
18. SECURITY CLASSIFICATION OF THIS PAGE Unclassified
19. SECURITY CLASSIFICATION OF ABSTRACT Unclassified
20. LIMITATION OF ABSTRACT
Standard Form 298 (Rev. 2-89) NSN 7540-01-280-5500 Prescribed by ANSI Std. 239-18
298-102


v
Table of Contents Page
EXECUTIVE SUMMARY ............................................................................................................ 1
1. INTRODUCTION ................................................................................................................... 3
2. STUDY AREA ........................................................................................................................ 5
3. METHODS .............................................................................................................................. 7
3.1 Automatic Monitoring .................................................................................................. 7
3.2 Source Identification/Observer Logging ...................................................................... 7
3.3 Calculation of Sound Level Descriptors ....................................................................... 8
3.4 Definitions of Ambient ................................................................................................. 8
3.5 Calculation of Ambients ............................................................................................... 9
4. RESULTS .............................................................................................................................. 11
4.1 Summary Results ........................................................................................................ 11
4.2 Time Above Results ................................................................................................... 16
4.3 Temporal Trends ......................................................................................................... 17
4.4 Acoustic Observer Logging Results ........................................................................... 18
5 AMBIENT MAPPING .......................................................................................................... 20
5.1 Define Acoustic Zones and Assignment of Ambient Data ......................................... 21
5.2 Ambient Mapping of Localized Sound Sources ......................................................... 23
5.3 Final Ambient Maps ................................................................................................... 24
6. DATA FOR INDIVIDUAL SITES ....................................................................................... 27
6.1 Site MORA008 – Summerland................................................................................... 28
6.2 Site MORA009 – Van Trump .................................................................................... 32
7. GLOSSARY OF ACOUSTICAL TERMS ........................................................................... 36
8. LITERATURE CITED .......................................................................................................... 38


vii
List of Tables Page
Table 1. Percent Time Above Metrics ............................................................................................ 1
Table 2. Summary of acoustic observer log data (in situ and office listening combined) for non-natural and aircraft sounds for all sites for the summer season ......................................... 2
Table 3. Measurement site locations ............................................................................................... 5
Table 4. Matrix of twelve potential ambient descriptors ................................................................ 8
Table 5. Summary of summer ambient sound level data .............................................................. 13
Table 6. Summary of measured, daytime (7 am to 7 pm), ambient sound level spectral data for the summer season ........................................................................................................... 14
Table 7. Percent Time Above Metrics .......................................................................................... 16
Table 8. Summary of acoustic observer log data (in situ and office listening combined) for all sites for the summer season ................................................................................................ 19
Table 9. Assignment of ambient data to acoustic zones ............................................................... 22
Table 10. Composite ambient maps .............................................................................................. 23
Table 11. Estimated hourly roadway traffic volume and speed for the summer season .............. 24


ix
List of Figures Page
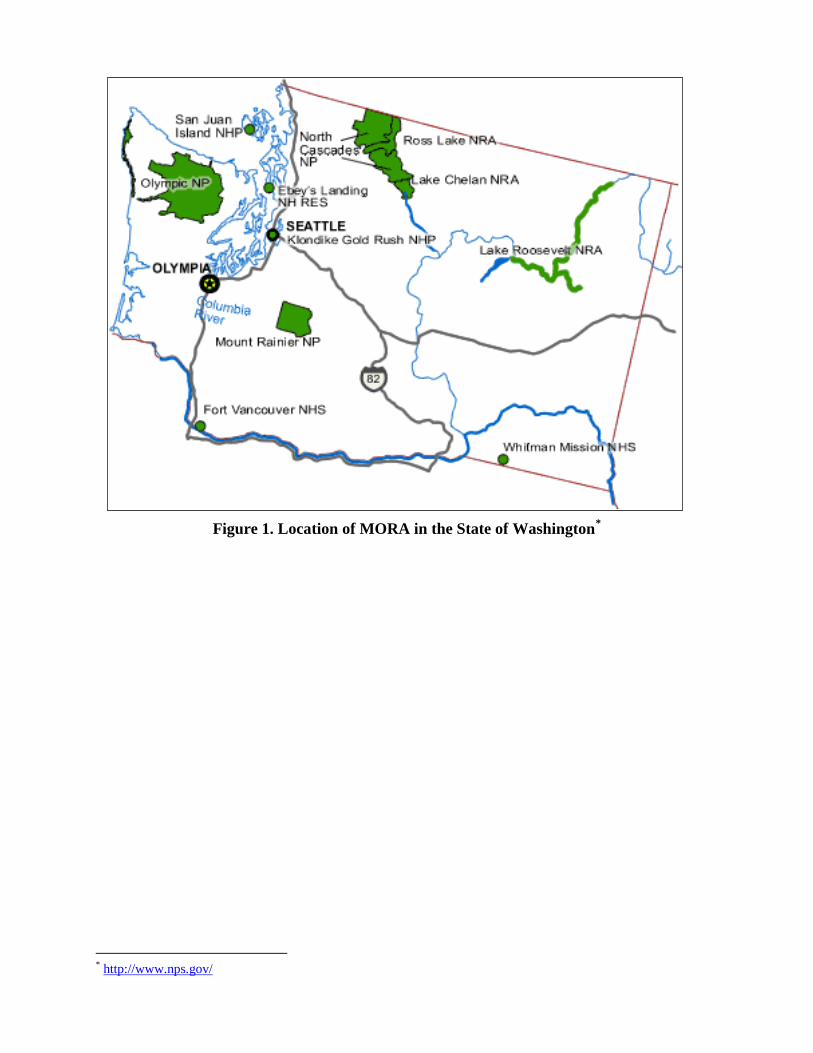
Figure 1. Location of MORA in the State of Washington .............................................................. 4
Figure 2. Acoustic zones and measurement sites for MORA ......................................................... 6
Figure 3. Comparison of overall daytime L10, L50, and L90 sound levels for all sites .................. 12
Figure 4. Spectral data for the Existing Ambient Without Air Tours (L50) for each site for the summer season .................................................................................................................. 15
Figure 5. Spectral data for the Natural Ambient (L50) determined for each site for the summer season* ............................................................................................................................. 15
Figure 6. Comparison of daily L50 sound levels for MORA008 and MORA009 for the summer season .............................................................................................................................. 17
Figure 7. Comparison of hourly L50 sound levels for all sites for the summer season ................. 18
Figure 8. Summary of acoustic observer log data (in situ and office listening combined) for all sites for the summer season ................................................................................................ 19
Figure 9. Acoustic zones and measurement sites for MORA ....................................................... 22
Figure 10. Baseline ambient map: Existing Ambient Without Air Tours (L50) for the summer season .............................................................................................................................. 25
Figure 11. Baseline ambient map: Natural Ambient (L50) for the summer season ....................... 26
Figure 12. Photograph of Site MORA008 .................................................................................... 28
Figure 13. Distribution of sound sources audible (in situ and office listening combined) for Site MORA008 for the summer season................................................................................... 29
Figure 14. Distribution of data for Site MORA008 for the summer season ................................ 29
Figure 15. Daily sound levels and wind speeds for Site MORA008 for the summer season ............................................................................................................................................ 30
Figure 16. Hourly sound levels and wind speeds for Site MORA008 for the summer season ............................................................................................................................................ 30
Figure 17. Sound spectrum for MORA008 for the summer season ............................................. 31
Figure 18. Photograph of Site MORA009 (arrow points to system location) .............................. 32
Figure 19. Distribution of sound sources audible (in situ and office listening combined) for Site MORA009 for the summer season................................................................................... 33
Figure 20. Distribution of data for Site MORA009 for the summer season ................................ 33

Figure 21. Daily sound levels and wind speeds for Site MORA009 for the summer season ............................................................................................................................................ 34
Figure 22. Hourly sound levels and wind speeds for Site MORA009 for the summer season* .......................................................................................................................................... 34
Figure 23. Sound spectrum for MORA009 for the summer season ............................................. 35

USDOT Research & Innovative Technology Administration December 2011 Environmental Measurement and Modeling Division
1
EXECUTIVE SUMMARY
During the summer (July to September 2009), baseline acoustical data were collected for approximately one month at two sites deployed by NPS personnel in Mount Rainier National Park (MORA). The purpose of the monitoring effort was to supplement prior ambient data collected by NPS at six sites in 2006-2007. Results reported by NPS from the earlier effort are included in this report as both data sets were used in developing the final ambient maps shown in Section 5. The data will help park managers and planners estimate the effects of future noise impacts and will help to inform future park planning efforts such as a soundscape management plan, as well as the Air Tour Management Plan (ATMP), which provides for the regulation of commercial air tours over National Parks. This report provides a summary of results of both sets of measurements, representing MORA’s summer season.
One of the ways the NPS determines the current conditions of an acoustical environment is to examine how often sound pressure levels exceed certain decibel values that relate to human health and speech. The NPS uses these values for making comparisons, but should not be construed as thresholds of impact. Table 1 reports the percent of time that measured levels were above four decibels values at each of the MORA measurement locations for summer season. The first decibel value, 35 dBA, addresses the health effects of sleep interruption.1 The second value addresses the World Health Organization’s recommendations that noise levels inside bedrooms remain below 45 dBA.2 The third value, 52 dBA, is based on the Environmental Protection Agency’s3 speech interference threshold for speaking in a raised voice to an audience at 10 meters. This value addresses the effects of sound on interpretive presentations in parks. The final value, 60 dBA, provides a basis for estimating impacts on normal voice communications at 1 m (3 ft). Hikers and visitors viewing scenic vistas in the park would likely be conducting such conversations.
*Table 1. Percent Time Above Metrics
Site ID Site Name
% Time above sound level: % Time above sound level:
7 am to 7 pm 7 pm to 7 am
35 dBA 45 dBA 52 dBA 60 dBA 35 dBA 45 dBA 52 dBA 60 dBA
MORA001 Trail of
Shadows
52.81 1.5 0.1 0.0 14.4 0.3 0.0 0.0
62.42 1.9 0.2 0.0 25.3 0.4 0.0 0.0
MORA002 Green Lake
73.7 0.3 0.1 0.0 89.6 0.1 0.0 0.0
90.8 0.8 0.1 0.0 96.1 0.2 0.0 0.0
MORA003 Crystal
Mountain
1.6 0.2 0.0 0.0 0.4 0.0 0.0 0.0
2.0 0.3 0.1 0.0 5.3 0.1 0.0 0.0
MORA004 Shriner’s Trail 44.9 0.8 0.0 0.0 29.6 0.1 0.0 0.0
52.1 1.6 0.0 0.0 55.1 15.2 5.8 0.1
MORA005 Lakes Trail 4.1 0.5 0.1 0.0 0.6 0.1 0.0 0.0
* Data for sites MORA001 through MORA006 were reported previously by NPS in Mount Rainier National Park Acoustical Monitoring 2006-2007 (Natural Resources Report NPS/NRPC/NRTR-2009/001).

5.4 0.6 0.1 0.0 19.2 0.5 0.0 0.0
MORA006 Sunrise Ridge
0.8 0.1 0.0 0.0 0.1 0.0 0.0 0.0
3.8 0.6 0.1 0.0 17.6 0.3 0.0 0.0
MORA008 Summerland
100.0 1.1 0.0 0.0 100.0 1.1 0.0 0.0
100.0 18.8 1.3 0.1 100.0 18.3 1.5 0.2
MORA009 Van Trump
100.0 99.9 0.3 0.0 100.0 99.9 0.1 0.0
100.0 98.6 9.8 0.0 100.0 98.2 24.6 4.4 1. NPS uses the top value in each cell to focus on frequencies affected by transportation, which approximately correspond to 20-1250 hertz. This range does not correspond to a specific vehicle or type of transportation. 2. The bottom value in each cell uses the full frequency spectrum, from 12.5-20,000 hertz. Table 2 summarizes the acoustic observer log data (office listening and in-situ logging combined) and provides an indication of the amount of time that certain sources are present at each site. The in-situ logging is performed during visits to the site itself; office listening is performed in the office using audio files that were collected at each site. As with the NPS study for sites MORA001-006, this study found that human-caused sounds are heard a moderate amount of the time in MORA. However, the natural ambient levels in the park are inherently high due to the presence of flowing water and wind.
Table 2. Summary of acoustic observer log data (in situ and office listening combined) for non-natural and aircraft sounds for all sites for the summer season*
Site ID Site Name
% Time Audible Median A-
Weighted Existing Ambient
Median A-Weighted
Natural Ambient
All Non-Natural Sounds
All Aircraft Sounds
Fixed-Wing Aircraft and Helicopters
Sounds
Day Night Day Night
MORA001 Trail of Shadows 44.5 9.2 1.6 36.5 33.5 34.4 31.1
MORA002 Green Lake 25.6 22.2 2.8 37.3 38.2 37.1 38.1
MORA003 Crystal Mountain 17.1 12.2 10.9 23.4 24.5 23.0 24.4
MORA004 Shriner’s Trail 13.7 10.4 3.6 34.6 35.3 34.2 35.2
MORA005 Lakes Trail 29.6 22.5 3.8 25.8 23.7 24.9 22.6
MORA006 Sunrise Ridge 24.8 18.7 11.4 23.2 21.2 22.4 20.4
MORA008 Summerland 4.2 2.9 1.3 43.4 43.3 43.3 43.4 MORA009 Van Trump 11.5 10.8 3.5 49.6 50.4 49.3 50.4
* Data for sites MORA001 through MORA006 was reported previously by NPS in Mount Rainier National Park Acoustical Monitoring 2006-2007 (Natural Resources Report NPS/NRPC/NRTR-2009/001).
1. INTRODUCTION
An important part of the National Park Service (NPS) mission is to preserve and/or restore the natural resources of the parks, including the natural soundscapes associated with units of the national park system. The collection of ambient sound level data provides valuable information about a park’s acoustic conditions for use in developing soundscape management plans.
Ambient data are also required to establish a baseline from which noise impacts can be assessed. The National Parks Air Tour Management Act of 2000 provides for the regulation of commercial air tour operations over units of the national park system through air tour management plans (ATMPs). The objective of an ATMP is to develop acceptable and effective measures to mitigate or prevent significant adverse impacts, if any, of commercial air tour operations upon the natural and cultural resources of and visitor experiences in national park units as well as tribal lands (those included in or abutting a national park).
The U.S. Department of Transportation, Research and Innovative Technology Administration, John A. Volpe National Transportation Systems Center (Volpe Center) is supporting the Federal Aviation Administration (FAA), Western-Pacific Region (AWP) and NPS, Natural Sounds and Night Skies Division (NSNSD) in the development of ATMPs.
Ambient data were collected at two sites by NPS personnel in Mount Rainier National Park (MORA) during July to September 2009. A map showing the location of MORA in the State of Washington is shown in Figure 1. The purpose of the monitoring effort was to supplement prior ambient data collected by NPS at six sites in 2006-2007. Results reported by NPS from the earlier effort are included in this report as both data sets were used in developing the final ambient maps shown in Section 5. This report provides a summary of results of both sets of measurements and will be used to represent MORA’s summer season.

USDOT Research & Innovative Technology Administration December 2011 Environmental Measurement and Modeling Division
5
2. STUDY AREA
Six acoustical monitoring systems (MORA001 through MORA006) were deployed during the summer and winter of 2006 and the summer of 2007. Two acoustical monitoring systems (MORA008 and MORA009) were deployed during summer of 2009. The primary goal of the site selection process was to identify the minimum number of field-measurement sites, which would allow for characterization of the ambient sound levels for different vegetation zones, management zones, and span different elevations/climate conditions (see Table 3). Acoustically representative regions for which data could be collected and stratified are referred to as “acoustic zones” (see Figure 2).
Table 3. Measurement site locations*
Site ID Site Name # Days of Data
Acoustic Zone (NLCD† Classification)
Coordinates (latitude/longitude in
decimal degrees)
Elevation (m)
MORA001 Trail of Shadows 30 days Moderately Wet Forest (Evergreen Forest)
46.752277° / -121.814901°
851 (2,800 ft)
MORA002 Green Lake 30 days Wet Forest (Evergreen Forest)
46.97857° / -121.85757°
999 (3,280 ft)
MORA003 Crystal Mountain 30 days Subalpine (Evergreen Forest)
46.93457° / -121.50273°
1,951 (6,400 ft)
MORA004 Shriner’s Trail 30 days Dry Forest (Evergreen Forest)
46.80028° / -121.55295°
750 (2,460 ft)
MORA005 Lake Trail 30 days Subalpine (Evergreen Forest)
46.77542° / -121.71903°
1,538 (5,050 ft)
MORA006 Sunrise Ridge 30 days Subalpine (Evergreen Forest)
46.92060° / -121.58393°
1,746 (5,730 ft)
MORA008 Summerland 34 days Glacier/Alpine (Transitional)
46.863193° / -121.658732°
1,865 (6,120 ft)
MORA009 Van Trump 38 days Glacier/Alpine (Transitional)
46.804500° / -121.768369°
1,786 (5,860 ft)
* Sites MORA001 through MORA006 were reported previously by NPS in Mount Rainier National Park Acoustical Monitoring 2006-2007 (Natural Resources Report NPS/NRPC/NRTR-2009/001). † With the goal of potentially facilitating future data transferability between parks, all baseline acoustic data collected for the ATMP program have been organized/classified in accordance with the National Land Cover Database (NLCD). Developed by the U.S. Geological Survey (USGS), the NLCD is the only nationally consistent land cover data set in existence and is comprised of twenty-one NLCD subclass categories for the entire U.S. (Vogelmann, J.E., S.M. Howard, L. Yang, C.R. Larson, B.K. Wylie, N. Van Driel, Completion of the 1990s National Land Cover Data Set for the Conterminous United States from Landsat Thematic Mapper Data and Ancillary Data Sources, Photogrammetric Engineering and Remote Sensing, 67:650-652, 2001.)

Figure 2. Acoustic zones and measurement sites for MORA

USDOT Research & Innovative Technology Administration December 2011 Environmental Measurement and Modeling Division
7
3. METHODS
3.1 Automatic Monitoring
Larson Davis 831 sound level meters (SLM) were employed at MORA. The Larson Davis SLM is a hardware-based, real-time analyzer which constantly records one second sound pressure level (SPL) and 1/3 octave band data, and exports these data to a portable storage device (thumb drive). These Larson Davis-based sites met American National Standards Institute (ANSI) Type 1 standards.
Each Larson Davis sampling station at MORA consisted of:
• Microphone with environmental shroud • Preamplifier • Multiple 12V NiMH rechargeable battery packs • Anemometer • MP3 recorder • Meteorological data logger • Photo voltaic panels
Each acoustic sampling station collected:
• Sound level data in the form of A-weighted decibel readings (dBA) every second • Continuous digital audio recordings • One third octave band data every second ranging from 12.5 Hz – 20,000 Hz • Meteorological data
3.2 Source Identification/Observer Logging
In characterizing natural and non-natural acoustic conditions in a park, knowledge of the intensity, duration, and distribution of the sound sources is essential. Thus, during sound-level data collection, FAA and NPS have agreed that periods of observer logging “in situ” (i.e., on site and in real-time) and/or post measurements using high-quality digital recordings will be conducted in order to discern the type, timing, and duration of different sound sources. In situ observer logging takes full advantage of human binaural hearing capabilities, allows identification of sound source origin, simultaneous sound sources, and directionality, and closely matches the experience of park visitors. Off-site audio playback observer logging allows for sampling periodically throughout the entire measurement period (e.g., 10 seconds every 2 minutes) and repeated playback of the recordings (e.g. when the sound is difficult to identify). Bose Quiet Comfort Noise Canceling headphones were used for off-site audio playback to minimize limitations imposed by the office acoustical environment.

8
3.3 Calculation of Sound Level Descriptors
All sound-level data were analyzed in terms of the following metrics (refer to the Terminology section for definitions):
• LAeq: The equivalent sound level determined by the logarithmic average of sound levels of a specific time period;
• L50: A statistical descriptor describing the sound level exceeded 50 percent of a specific time period (i.e., the median); and
• L90: A statistical descriptor describing the sound level exceeded 90 percent of a specific time period and only the quietest 10 percent of the sample can be found below this point.
3.4 Definitions of Ambient
Using the observer logging results, different types of “ambient” can be computed from the data. A comprehensive grid of ambient sound levels throughout the park is referred to as an ambient map. Ambient maps are useful to graphically characterize the ambient environment throughout an entire study area.
The following four types of “ambient” characterizations generally used and considered sufficient by the FAA and NPS in environmental analyses related to transportation noise: 4,5,6
• Existing Ambient: The composite, all-inclusive sound associated with a given environment, excluding only the analysis system’s electrical noise (i.e., aircraft-related sounds are included);
• Existing Ambient Without Source of Interest: The composite, all-inclusive sound associated with a given environment, excluding the analysis system’s electrical noise and the sound source of interest, in this case, commercial air tour aircraft;
• Existing Ambient Without All Aircraft (for use in assessing cumulative impacts): The composite, all-inclusive sound associated with a given environment, excluding the analysis system’s electrical noise and the sounds produced by the sound source of interest, in this case, all types of aircraft (i.e. commercial air tours, commercial jets, general aviation aircraft, military aircraft, and agricultural operations);* and
• Natural Ambient: The natural sound conditions found in a study area, including all sounds of nature (i.e., wind, streams, wildlife, etc.), and excluding all human and mechanical sounds.
If one considers the three sound level descriptors presented in Section 3.3 and the four types of ambient characterizations above, twelve ambient descriptors could potentially be computed as shown in Table 4.
Table 4. Matrix of twelve potential ambient descriptors
* The definition of Existing Ambient Without All Aircraft used in this report is consistent with FAA’s historical approach for cumulative impact analysis.

9
Metric Ambient Type
Existing Existing Without Air Tours
Existing Without All Aircraft Natural
LAeq 1 4 7 10 L50 2 5 8 11 L90 3 6 9 12
From the above twelve potential ambient descriptors, only the first three can be readily computed. The computation of ambient types other than Existing Ambient is more challenging because different sound sources often overlap in both frequency and amplitude; there is currently no practical method to separate out acoustic energy of different sound sources (i.e., human-caused sounds imbedded with natural sounds). Section 3.5 discusses the computation of ambients in further detail. The two ambient descriptors agreed upon for use in ATMP analyses are:
• Existing Ambient Without Source of Interest (LExistw/oTours) – Descriptor 5 from the table above; and
• Natural Ambient (LNat)– Descriptor 11 from the table above.
These two ambient are used to establish baseline, or background values in computer modeling from which various noise-related descriptors may be computed (e.g., percentage of time aircraft sounds are above the ambient). The descriptors could then be used in the assessment of potential noise impacts due to aircraft operations.
3.5 Calculation of Ambients
Using the data in the acoustic observer logs, different characterizations of ambient can be estimated from the sound level data. This method was developed by performing a detailed data analyses conducted by the Volpe Center, working closely with the NPS, in comparing several approaches of estimating of the Natural Ambient and is comprised of the following steps:7
1. From the short-term in situ and off-site logging, determine the percent time human-caused sounds are audible.
2. Sort, high-to-low, the A-weighted level data, derived from the short-term, one-second, one-third octave-band data (regardless of acoustic state), and remove the loudest percentage (determined from the percent time audible of human-caused sounds in the short-term observer logs) of sound-level data. For example, if from Step 1 above, it is determined that at a particular site, the percent time audible of all human-caused sounds is 40 percent, then the loudest 40 percent of the A-weighted level data is removed. The L50 computed from the remaining data is the estimated A-weighted natural ambient. This L50, computed from the remaining data, can be mathematically expressed as an Lx of the entire dataset, where the x is computed as follows (%TA is the percent of time human-caused sounds are audible in the short-term observer logs):
%TAx = 50 + 2

10
For example, if non-natural sounds are audible for 40% of the time, L0 to L40 corresponds to the loudest (generally non-natural) sounds, and L40 to L100 corresponds to the quietest (generally natural) sounds. The median of L40 to L100 data is L70. Therefore, the A-weighted decibel value at L70, the sound level exceeded 70 percent of the time, would be used for the entire dataset to characterize the natural ambient sound level.
3. The associated one-third octave-band un-weighted spectrum from 12.5 to 20,000 Hz is constructed similarly, except the L50 is computed from the remaining data for each one-third octave-band. The 33 un-weighted one-third octave-band sound levels (12.5 to 20,000 Hz) define the un-weighted sound level spectrum. This method of constructing the sound level spectrum means it is not an actual measured ⅓-octave band spectrum associated with a particular measurement sample, but a composite spectrum using the computed descriptor for each ⅓-octave-band.
This method for estimating the natural ambient is conceptually straightforward – as percent time audible approaches 0 percent, the Lx approaches L50; as it approaches 100 percent, the Lx approaches L100. A concern with this approach is that loud natural sounds, such as thunder, could be removed from the data before calculating natural ambient sound levels, and the resulting calculated natural ambient sound levels could be an under-estimate of natural ambient sound levels. Although this is a valid concern, such events are rare relative to the entire measurement period (>25 days). Therefore, removing these data should not likely have a significant impact on calculations of natural ambient sound levels. This method also eliminates the possibility of having an estimated natural ambient level that exceeds the existing ambient level.
Based on the concept of the above method, the computation of the other ambient types (Existing Without Sound Source of Interest using the percentage of time sounds from the source of interest, e.g., air tour aircraft, are audible from short-term in situ and off-site observer logging, and Existing Ambient Without All Aircraft using the percentage of time all aircraft are audible from the observer logging) is a similar process.

USDOT Research & Innovative Technology Administration December 2011 Environmental Measurement and Modeling Division
11
4. RESULTS
This section summarizes the results of the study. Included is an overall summary of the final, ambient sound levels for each measurement site, Time Above analysis, temporal trends, and the acoustic observer data logged at each measurement site.
4.1 Summary Results
The following figures and tables are presented to show overall site-to-site comparisons:
• Figure 3: A plot of the overall daytime* L50 sound level (shown by the green box) computed for each site with all days included (a few points of interest outside the parks are also shown for comparison purposes only). The figure also shows a dark line above and below each plotting symbol, which indicate the L10 and L90 sound levels, respectively on the results†;
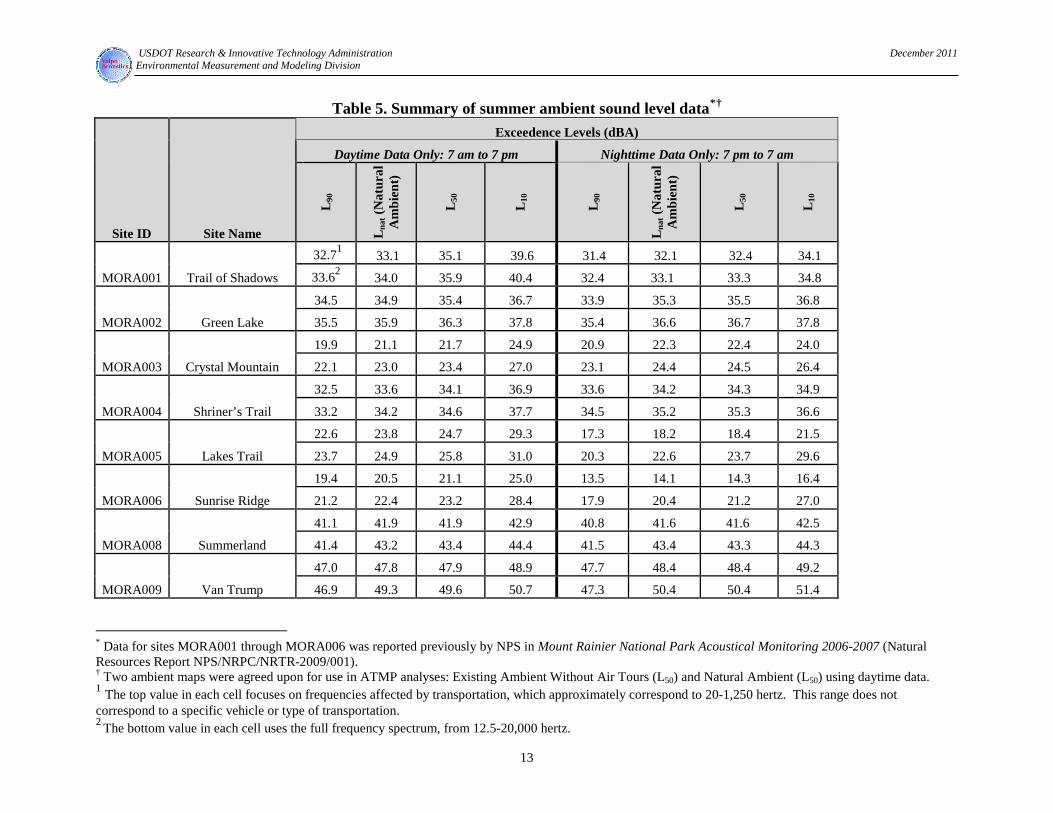
• Table 5 presents a tabular summary of daytime, nighttime and computed ambients, including L90, Lnat, L50, and L10 values; and
• Table 6, Figure 4, and Figure 5 present the associated spectral data for the ambient data.
* For most parks, the majority of air tour operations occur during the day, the NPS and FAA have agreed that the impact assessment will be conducted using ambient sound levels during the time that the air tour operations occur. Accordingly, all ATMP analyses are based on daytime ambient data. In general, daytime refers to the time period of 7 am to 7 pm unless otherwise specified by the NPS and FAA. † The L10 statistical descriptor describes the sound level exceeded 10 percent of a specific time period – that is the loudest 10 percent of the sample. The L90 statistical descriptor describes the sound level exceeded 90 percent of a specific time period – that is the quietest 10 percent of the sample.

12
Figure 3. Comparison of overall daytime L10, L50, and L90 sound levels for all sites
USDOT Research & Innovative Technology Administration December 2011 Environmental Measurement and Modeling Division
13
Table 5. Summary of summer ambient sound level data*†
Site ID Site Name
Exceedence Levels (dBA)
Daytime Data Only: 7 am to 7 pm Nighttime Data Only: 7 pm to 7 am
L90
Lna
t (N
atur
al
Am
bien
t)
L50
L10
L90
Lna
t (N
atur
al
Am
bien
t)
L50
L10
MORA001 Trail of Shadows
32.71 33.1 35.1 39.6 31.4 32.1 32.4 34.1 33.62 34.0 35.9 40.4 32.4 33.1 33.3 34.8
MORA002 Green Lake
34.5 34.9 35.4 36.7 33.9 35.3 35.5 36.8
35.5 35.9 36.3 37.8 35.4 36.6 36.7 37.8
MORA003 Crystal Mountain
19.9 21.1 21.7 24.9 20.9 22.3 22.4 24.0
22.1 23.0 23.4 27.0 23.1 24.4 24.5 26.4
MORA004 Shriner’s Trail
32.5 33.6 34.1 36.9 33.6 34.2 34.3 34.9
33.2 34.2 34.6 37.7 34.5 35.2 35.3 36.6
MORA005 Lakes Trail
22.6 23.8 24.7 29.3 17.3 18.2 18.4 21.5
23.7 24.9 25.8 31.0 20.3 22.6 23.7 29.6
MORA006 Sunrise Ridge
19.4 20.5 21.1 25.0 13.5 14.1 14.3 16.4
21.2 22.4 23.2 28.4 17.9 20.4 21.2 27.0
MORA008 Summerland
41.1 41.9 41.9 42.9 40.8 41.6 41.6 42.5
41.4 43.2 43.4 44.4 41.5 43.4 43.3 44.3
MORA009 Van Trump
47.0 47.8 47.9 48.9 47.7 48.4 48.4 49.2
46.9 49.3 49.6 50.7 47.3 50.4 50.4 51.4 * Data for sites MORA001 through MORA006 was reported previously by NPS in Mount Rainier National Park Acoustical Monitoring 2006-2007 (Natural Resources Report NPS/NRPC/NRTR-2009/001). † Two ambient maps were agreed upon for use in ATMP analyses: Existing Ambient Without Air Tours (L50) and Natural Ambient (L50) using daytime data. 1 The top value in each cell focuses on frequencies affected by transportation, which approximately correspond to 20-1,250 hertz. This range does not correspond to a specific vehicle or type of transportation. 2 The bottom value in each cell uses the full frequency spectrum, from 12.5-20,000 hertz.

USDOT Research & Innovative Technology Administration December 2011 Environmental Measurement and Modeling Division
14
Table 6. Summary of measured, daytime (7 am to 7 pm), ambient sound level spectral data for the summer season*
Frequency (Hz)
Natural Ambient L50 (dB)
MO
RA
00
1
MO
RA
00
2
MO
RA
00
3
MO
RA
00
4
MO
RA
00
5
MO
RA
00
6
MO
RA
00
8
MO
RA
00
9
MO
RA
00
1
MO
RA
00
2
MO
RA
00
3
MO
RA
00
4
MO
RA
00
5
MO
RA
00
6
MO
RA
00
8
MO
RA
00
9
12.5 33.3
Existing Ambient Without Air Tours L (dB) 50
31.1 32.2 37.8 32.4 28.2 42.6 39.9 29.0 29.8 31.1 37.4 31.2 27.6 42.6 39.6 16 34.3 31.1 30.8 35.7 30.9 26.6 42.8 38.7 29.8 30.1 29.7 35.3 29.9 26.0 42.7 38.3 20 35.1 30.2 28.7 34.0 29.4 25.3 42.7 38.7 31.6 29.2 28.0 33.6 28.3 24.7 42.7 38.5 25 34.6 28.6 27.1 34.1 28.0 24.0 42.1 38.8 29.6 27.7 26.3 33.7 26.8 23.6 42.0 38.5 31 33.7 26.8 26.2 33.1 27.1 22.7 39.5 39.3 28.4 25.9 25.5 32.8 25.9 22.1 39.4 39.1 40 33.2 26.5 24.2 32.3 26.2 21.4 37.3 39.9 27.8 25.6 23.5 32.0 24.6 20.6 37.3 39.7 50 30.9 26.3 23.0 31.2 25.4 19.7 36.7 39.0 25.1 25.6 21.9 30.9 23.7 19.3 36.7 38.8 63 30.0 24.7 21.0 29.6 24.8 17.7 36.0 37.7 25.1 24.0 20.1 29.4 22.9 17.1 36.0 37.5 80 29.0 24.5 19.0 28.5 23.1 17.0 35.7 36.6 24.6 23.9 18.2 28.3 21.2 16.2 35.6 36.5
100 27.7 24.2 17.9 26.9 19.3 13.5 33.7 34.8 24.2 23.7 17.3 26.6 17.7 13.0 33.7 34.7 125 26.6 24.7 15.0 24.4 15.7 10.9 33.1 33.0 23.6 24.2 14.4 24.1 14.5 10.3 33.0 32.8 160 28.2 26.2 16.3 24.2 15.2 11.8 33.6 32.5 25.4 25.7 15.9 24.0 14.2 11.3 33.6 32.4 200 29.6 29.1 18.1 24.7 18.9 15.8 34.0 33.3 27.4 28.7 17.8 24.6 18.1 15.5 34.0 33.2 250 29.6 30.3 18.7 26.1 15.7 12.7 33.7 37.8 27.7 29.9 18.4 25.8 14.9 12.3 33.6 37.7 315 30.0 30.8 18.5 27.1 16.7 12.6 35.8 39.9 28.2 30.4 18.3 26.9 16.0 12.2 35.8 39.8 400 29.8 30.4 18.3 28.1 20.7 17.8 36.0 40.1 28.3 30.0 18.1 27.9 20.0 17.5 36.0 40.0 500 29.1 29.7 16.0 28.7 17.4 13.4 36.4 41.7 27.5 29.4 15.7 28.4 16.7 13.0 36.4 41.6 630 28.5 30.1 14.5 28.5 17.5 13.6 36.5 39.9 26.8 29.8 14.0 28.2 16.9 13.4 36.5 39.8 800 28.7 30.0 12.3 27.6 16.7 12.7 35.8 42.1 26.5 29.7 12.0 27.4 16.0 12.5 35.8 42.0
1000 27.8 29.3 10.2 26.0 16.7 13.0 35.3 41.9 25.5 29.0 9.8 25.6 15.9 12.6 35.3 41.8 1250 26.0 27.8 8.0 23.9 15.2 12.0 34.0 40.5 23.9 27.6 7.6 23.7 14.4 11.8 34.0 40.5 1600 23.7 25.6 5.9 21.4 13.2 10.6 32.3 39.8 21.8 25.4 5.6 21.2 12.6 10.4 32.3 39.7 2000 20.9 22.7 5.0 18.1 11.8 10.0 30.3 38.0 19.3 22.5 4.8 17.9 11.4 9.9 30.3 37.9 2500 17.6 18.7 5.0 14.2 11.3 10.2 27.1 35.9 16.5 18.6 4.8 14.0 11.0 10.1 27.1 35.8 3150 14.2 14.6 5.4 10.6 11.5 10.9 23.1 32.8 13.4 14.5 5.2 10.3 11.3 10.8 23.1 32.8 4000 11.5 11.6 6.0 8.6 12.1 11.8 19.1 29.2 10.9 11.4 5.9 8.3 12.0 11.7 19.1 29.1 5000 10.0 10.4 6.7 8.3 13.3 13.1 15.5 25.1 9.6 10.0 6.6 8.1 13.1 13.1 15.5 24.9 6300 9.6 9.8 7.5 8.6 14.5 13.9 11.7 18.0 9.3 9.4 7.4 8.5 14.4 13.8 11.7 17.9 8000 10.2 10.2 8.4 9.4 15.1 14.8 8.8 10.1 10.0 9.6 8.3 9.2 15.0 14.8 8.7 10.0 10000 11.0 10.7 9.4 10.0 16.1 15.7 7.5 7.1 10.6 10.6 9.4 9.9 16.0 15.7 7.5 7.0 12500 11.6 11.5 10.6 11.0 17.0 16.6 6.9 5.9 11.4 11.4 10.6 11.0 17.0 16.6 6.9 5.8 16000 12.4 12.3 11.6 12.1 17.7 17.4 5.3 2.5 12.3 12.3 11.5 12.0 17.7 17.4 5.3 2.4 20000 13.5 12.7 12.0 12.8 19.4 19.0 2.4 -0.1 13.3 12.7 12.0 12.7 19.4 19.0 2.3 -0.1
* As discussed in Section 3.5, the spectral data associated with the L50 exceedence level is constructed by determining the L50 from each one-third octave-band; therefore, it is not an actual measured one-third octave-band spectrum associated with a particular measurement sample.
USDOT Research & Innovative Technology Administration December 2011 Environmental Measurement and Modeling Division
15
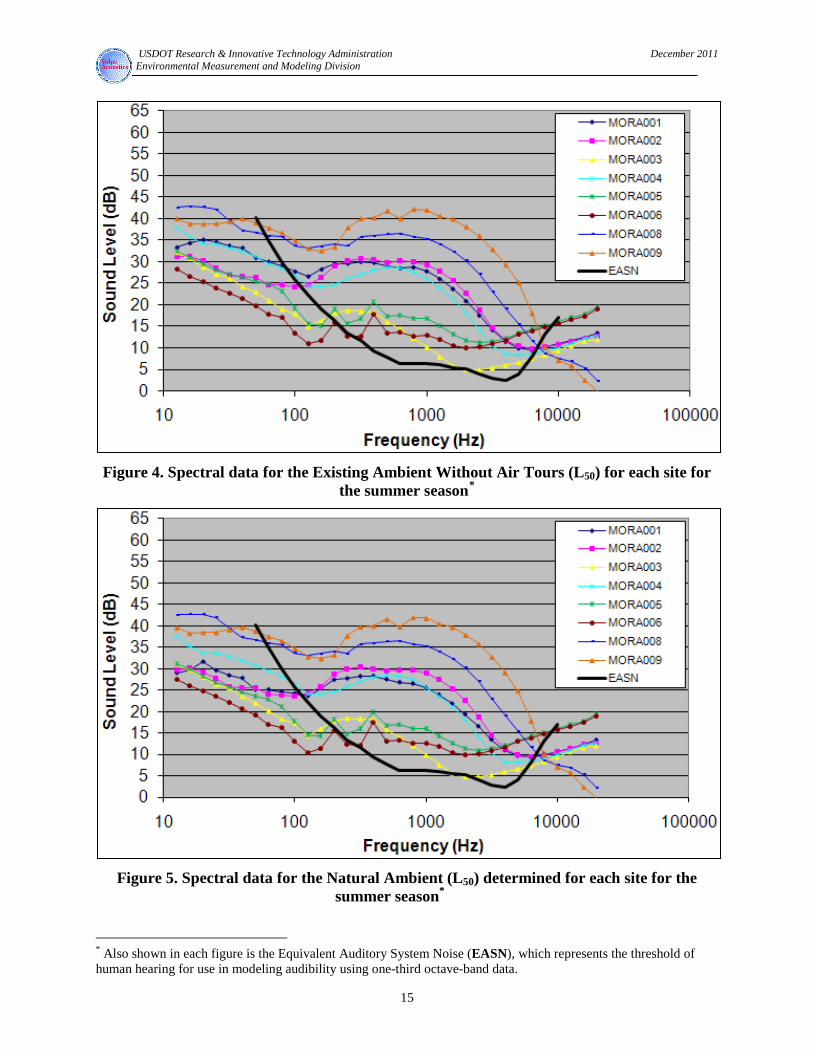
Figure 4. Spectral data for the Existing Ambient Without Air Tours (L50) for each site for
the summer season*
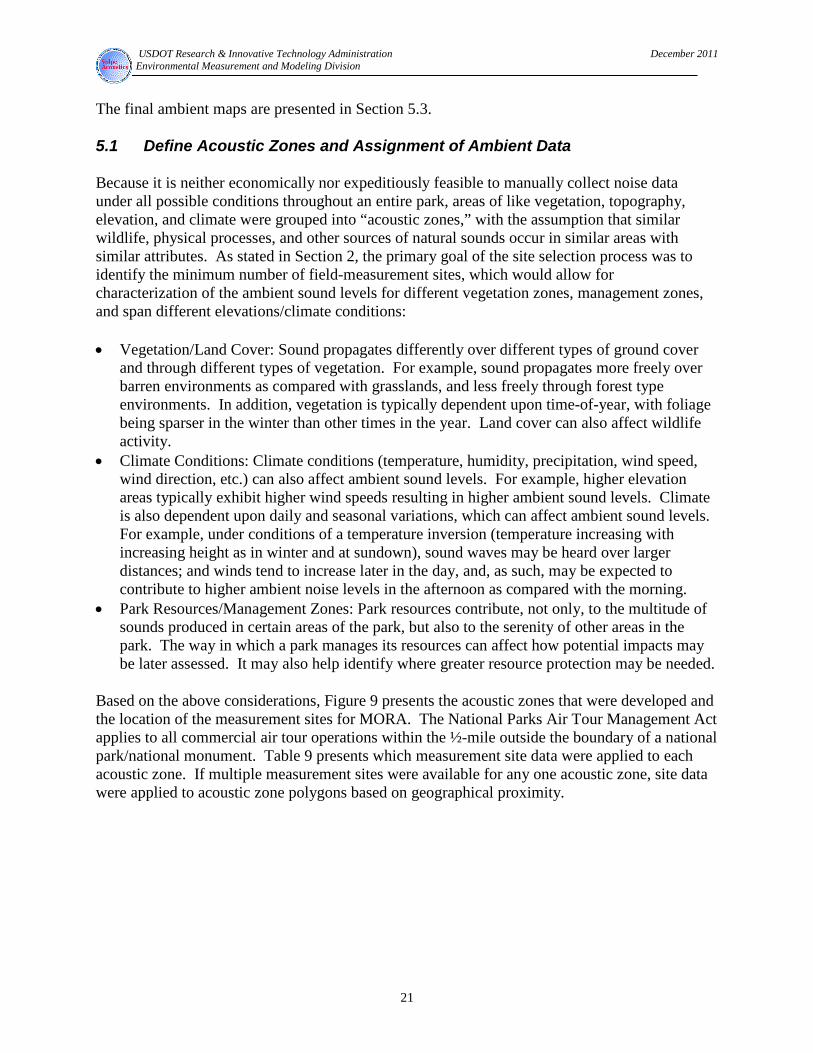
Figure 5. Spectral data for the Natural Ambient (L50) determined for each site for the
summer season*
* Also shown in each figure is the Equivalent Auditory System Noise (EASN), which represents the threshold of human hearing for use in modeling audibility using one-third octave-band data.

USDOT Research & Innovative Technology Administration December 2011 Environmental Measurement and Modeling Division
16
4.2 Time Above Results
The Time Above metric indicates the amount of time that the sound level exceeds specified decibel values. One of the ways the NPS determines the current conditions of an acoustical environment is to examine how often sound pressure levels exceed certain decibel values that relate to human health and speech. The NPS uses these values for making comparisons, but should not be construed as thresholds of impact. Table 7 presents the percent of time that measured levels were above four decibels values at each of the MORA measurement locations for the summer season, respectively. The first decibel value, 35 dBA, addresses the health effects of sleep interruption.1 The second value addresses the World Health Organization’s recommendations that noise levels inside bedrooms remain below 45 dBA.2 The third value, 52 dBA, is based on the Environmental Protection Agency’s3 speech interference threshold for speaking in a raised voice to an audience at 10 meters. This value addresses the effects of sound on interpretive presentations in parks. The final value, 60 dBA, provides a basis for estimating impacts on normal voice communications at 1 m (3 ft). Hikers and visitors viewing scenic vistas in the park would likely be conducting such conversations.
Table 7. Percent Time Above Metrics*
Site ID Site Name
% Time above sound level: % Time above sound level:
7 am to 7 pm 7 pm to 7 am
35 dBA 45 dBA 52 dBA 60 dBA 35 dBA 45 dBA 52 dBA 60 dBA
MORA001 Trail of
Shadows
52.81 1.5 0.1 0.0 14.4 0.3 0.0 0.0
62.42 1.9 0.2 0.0 25.3 0.4 0.0 0.0
MORA002 Green Lake
73.7 0.3 0.1 0.0 89.6 0.1 0.0 0.0
90.8 0.8 0.1 0.0 96.1 0.2 0.0 0.0
MORA003 Crystal
Mountain
1.6 0.2 0.0 0.0 0.4 0.0 0.0 0.0
2.0 0.3 0.1 0.0 5.3 0.1 0.0 0.0
MORA004 Shriner’s Trail
44.9 0.8 0.0 0.0 29.6 0.1 0.0 0.0
52.1 1.6 0.0 0.0 55.1 15.2 5.8 0.1
MORA005 Lakes Trail
4.1 0.5 0.1 0.0 0.6 0.1 0.0 0.0
5.4 0.6 0.1 0.0 19.2 0.5 0.0 0.0
MORA006 Sunrise Ridge
0.8 0.1 0.0 0.0 0.1 0.0 0.0 0.0
3.8 0.6 0.1 0.0 17.6 0.3 0.0 0.0
MORA008 Summerland
100.0 1.1 0.0 0.0 100.0 1.1 0.0 0.0
100.0 18.8 1.3 0.1 100.0 18.3 1.5 0.2
MORA009 Van Trump
100.0 99.9 0.3 0.0 100.0 99.9 0.1 0.0
100.0 98.6 9.8 0.0 100.0 98.2 24.6 4.4 1. NPS uses the top value in each cell to focus on frequencies affected by transportation, which approximately correspond to 20-1250 hertz. This range does not correspond to a specific vehicle or type of transportation. 2. The bottom value in each cell uses the full frequency spectrum, from 12.5-20,000 hertz.
* Data for sites MORA001 through MORA006 was reported previously by NPS in Mount Rainier National Park Acoustical Monitoring 2006-2007 (Natural Resources Report NPS/NRPC/NRTR-2009/001).

USDOT Research & Innovative Technology Administration December 2011 Environmental Measurement and Modeling Division
17
4.3 Temporal Trends
This section discusses the daily and diurnal trends of the data. Daily trends are shown on a 24-hour basis. Figure 6 presents the daily daytime median Existing Ambient (i.e., the L50 with all sounds included) for the summer season for MORA008 and MORA009.* For the purpose of assessing daily trends in the data, sound level descriptors are computed for each individual hour; then the median from the 24 hours each day is determined. Dips and increases in daily sound levels are usually an indication of passing inclement weather and localized events (e.g., thunder storm). This data is useful in visually identifying potential anomalies in the data. Data anomalies would then be further examined from data recorded by the sound level meter and/or recorded audio samples.
Diurnal trends are shown on an hourly basis (see Figure 7). Sites with a strong daytime diurnal pattern typically indicate the presence of human activity largely influencing the sound levels at those sites. Sites with a nighttime pattern typically indicate the presence of insect activity. Sites with little discernable pattern (e.g., somewhat constant across all hours) typically indicates a constant sound source. Examples of constant sound sources include nearby generators or a river/stream. This data is also useful in visually identifying potential anomalies in the data.
Figure 6. Comparison of daily L50 sound levels for MORA008 and MORA009 for the
summer season
* Daily data for sites MORA001 through MORA006 were not available.

USDOT Research & Innovative Technology Administration December 2011 Environmental Measurement and Modeling Division
18
Figure 7. Comparison of hourly L50 sound levels for all sites for the summer season
4.4 Acoustic Observer Logging Results
Table 8 and Figure 8 summarize the office listening and in-situ logging results for summer and winter measurements, respectively. These results provide an indication of the amount of time that certain sources are present at each site. The in-situ logging occurs live at the site itself and consists of an observer that logs the time and duration of sounds that they hear at the site. Typically a limited amount of in-situ logging is available due to logistics of the measurement and the days that the acoustic team is in the area. The office listening results are from a review of the audio files that were collected at each site. Continuous audio files were collected for the entire measurement and this allows a greater ability to listen and log sound sources for several days and any time period.

USDOT Research & Innovative Technology Administration December 2011 Environmental Measurement and Modeling Division
19
Table 8. Summary of acoustic observer log data (in situ and office listening combined) for all sites for the summer season*
Site ID Site Name
% Time Audible: 7 am to 7 pm Fixed-Wing Aircraft and
Helicopter Sounds
Other Aircraft Sounds
Other Human Sounds
Natural Sounds
MORA001 Trail of Shadows 1.6 7.6 35.3 55.5 MORA002 Green Lake 2.8 19.5 3.4 74.4 MORA003 Crystal Mountain 10.9 1.3 4.9 82.9 MORA004 Shriner’s Trail 3.6 6.9 3.2 86.3 MORA005 Lakes Trail 3.8 18.8 7.1 70.4 MORA006 Sunrise Ridge 11.4 7.3 6.1 75.2 MORA008 Summerland 1.3 1.6 1.3 95.8 MORA009 Van Trump 3.5 7.3 0.7 88.5
Figure 8. Summary of acoustic observer log data (in situ and office listening combined) for all sites for the summer season
* Data for sites MORA001 through MORA006 was reported previously by NPS in Mount Rainier National Park Acoustical Monitoring 2006-2007 (Natural Resources Report NPS/NRPC/NRTR-2009/001).

USDOT Research & Innovative Technology Administration December 2011 Environmental Measurement and Modeling Division
20
5 AMBIENT MAPPING
Using the ambient data measured at each site, a comprehensive grid of ambient sound levels throughout the park (i.e., an ambient “map”) is developed. Ambient maps are useful to: (1) graphically characterize the ambient environment throughout an entire study area; and (2) to establish baseline, or background values in computer modeling. For ATMPs, the FAA’s INM* will be used to model air tour aircraft activities and compute various noise-related descriptors (e.g., percentage of time aircraft sounds are above the ambient) and generate the sound-level contours that will be used in the assessment of potential noise impacts due to air tour operations.
The development of ambient maps is accomplished using Geographic Information System (GIS). In GIS, the following actions are performed:
• Define the input “objects”: o Define the park boundary in Universal Transverse Mercator (UTM) † coordinates to set
the initial grid area boundary. ‡ o Divide the park into a regular grid of points at a desired spacing using a Digital Elevation
Model (DEM), which is a digital representation of a topographic surface typically used in GIS applications. Each point is assigned an elevation value and UTM coordinates from the DEM. For MORA, a grid spacing of 500 ft (152.4 m) was used.
o Define the acoustic zone boundaries in UTM coordinates (see Section 5.1). o Define the location of each measurement site.
• Assign a “measured” ambient sound level (and its associated one-third octave-band, unweighted spectrum) computed in Section 4.1, to each acoustic zone.
For development of all ambient maps, except for Natural Ambient, three additional steps are performed:
• Define the location of localized noise sources, primarily vehicles on roads, but may also include trains, waterfalls, and river rapids. The closest distance to each source is calculated and assigned to each grid point.
• Assign an ambient sound level (and its associated one-third octave-band, unweighted spectrum) for each roadway to each grid point using the drop-off rates determined by computer modeling discussed in Section 5.2.
• Compute a combined measured and roadway ambient (and spectra). This is performed by using energy-addition (i.e., sound levels in decibels were converted to energy prior to addition).
* For ATMPs, the FAA and NPS have agreed to use the INM. The INM is a computer program used by over 700 organizations in over 50 countries to assess changes in noise impact. Requirements for INM use are defined in FAA Order 1050.1E, Environmental Impacts: Policies and Procedures, and Federal Aviation Regulations (FAR) Part 150, Airport Noise Compatibility Planning. In accordance with the results of the Federal Interagency Committee on Aviation Noise (FICAN) review (“Findings and Recommendations on Tools for Modeling Aircraft Noise in National Parks”), INM Version 6.2 is the best-practice modeling methodology currently available for evaluating aircraft noise in national parks and will be the model used for ATMP development. † The UTM system provides coordinates on a worldwide flat grid for easy manipulation in GIS applications. ‡ Because the ATMP Act applies to all commercial air tour operations within the ½-mile outside the boundary of a national park, the park boundary includes a ½-mile buffer.
USDOT Research & Innovative Technology Administration December 2011 Environmental Measurement and Modeling Division
21
The final ambient maps are presented in Section 5.3.
5.1 Define Acoustic Zones and Assignment of Ambient Data
Because it is neither economically nor expeditiously feasible to manually collect noise data under all possible conditions throughout an entire park, areas of like vegetation, topography, elevation, and climate were grouped into “acoustic zones,” with the assumption that similar wildlife, physical processes, and other sources of natural sounds occur in similar areas with similar attributes. As stated in Section 2, the primary goal of the site selection process was to identify the minimum number of field-measurement sites, which would allow for characterization of the ambient sound levels for different vegetation zones, management zones, and span different elevations/climate conditions:
• Vegetation/Land Cover: Sound propagates differently over different types of ground cover and through different types of vegetation. For example, sound propagates more freely over barren environments as compared with grasslands, and less freely through forest type environments. In addition, vegetation is typically dependent upon time-of-year, with foliage being sparser in the winter than other times in the year. Land cover can also affect wildlife activity.
• Climate Conditions: Climate conditions (temperature, humidity, precipitation, wind speed, wind direction, etc.) can also affect ambient sound levels. For example, higher elevation areas typically exhibit higher wind speeds resulting in higher ambient sound levels. Climate is also dependent upon daily and seasonal variations, which can affect ambient sound levels. For example, under conditions of a temperature inversion (temperature increasing with increasing height as in winter and at sundown), sound waves may be heard over larger distances; and winds tend to increase later in the day, and, as such, may be expected to contribute to higher ambient noise levels in the afternoon as compared with the morning.
• Park Resources/Management Zones: Park resources contribute, not only, to the multitude of sounds produced in certain areas of the park, but also to the serenity of other areas in the park. The way in which a park manages its resources can affect how potential impacts may be later assessed. It may also help identify where greater resource protection may be needed.
Based on the above considerations, Figure 9 presents the acoustic zones that were developed and the location of the measurement sites for MORA. The National Parks Air Tour Management Act applies to all commercial air tour operations within the ½-mile outside the boundary of a national park/national monument. Table 9 presents which measurement site data were applied to each acoustic zone. If multiple measurement sites were available for any one acoustic zone, site data were applied to acoustic zone polygons based on geographical proximity.

USDOT Research & Innovative Technology Administration December 2011 Environmental Measurement and Modeling Division
22
Figure 9. Acoustic zones and measurement sites for MORA
Table 9. Assignment of ambient data to acoustic zones
Acoustic Zone Site ID Site Name
Moderately Wet Forest (Evergreen Forest) MORA001 Trail of Shadows
Wet Forest (Evergreen Forest) MORA002 Green Lake
Subalpine (Evergreen Forest) MORA003, MORA005, MORA006 Crystal Mountain, Lakes Trail, Sunrise Ridge
Dry Forest (Evergreen Forest) MORA004 Shriner’s Trail
Moderately Dry Forest (Evergreen Forest) MORA004* Shriner’s Trail
Glacier/Alpine (Transitional) MORA008, MORA009 Summerland, Van Trump
* No measurement sites were located within the “Moderately Dry Forest” acoustic zone. As such, data from Site MORA004 were used as best available.

USDOT Research & Innovative Technology Administration December 2011 Environmental Measurement and Modeling Division
23
5.2 Ambient Mapping of Localized Sound Sources
The contributing effect of localized noise sources, primarily vehicles on roads, but may also include trains, waterfalls, and river rapids, are typically modeled and combined with the measured sound levels to develop a composite, baseline, ambient “map” of a park for all ambient maps, except natural ambient (see Table 10). The combined (measured plus roadway, for example) ambient are computed by using energy-addition (i.e., sound levels in decibels were converted to energy prior to addition). Roadway sound sources were modeled using the Federal Highway Administration’s Traffic Noise Model® (TNM),8 where the estimated drop-off rate, reflecting a continuous decrease in sound level as a function of increasing distance from each sound source, was computed. For a non-time-varying source, such as roadway noise, the TNM-computed LAeq sound level parameters may be conservatively assumed to be equivalent to the L50 and L90 and, thus, used interchangeably as the “roadway” ambient.
Table 10. Composite ambient maps
Metric Ambient Type
Existing Existing Without Air Tours
Existing Without All Aircraft Natural
L50 Measured + Localized
Noise Source(s) Measured + Localized
Noise Source(s) Measured + Localized
Noise Source(s) Measured
In the vicinity of and within MORA, there were a number of roadways. The following general assumptions were made in the modeling:
• Roadway Traffic Volumes – Annual traffic volume on each roadway was determined using data collected by the State of Washington Department of Transportation (WSDOT). The WSDOT Annual Traffic Report provided AADT (http://www.wsdot.wa.gov/mapsdata/tdo/annualtrafficreport.htm). Where data are available for multiple years, the most current year was chosen. The traffic volume for an average day during the peak summer month (July) and the peak winter month (November) was obtained by using monthly visitation data obtained from the NPS Public Use Statistics Office website (http://www2.nature.nps.gov/stats/) to apportion the WSDOT annual traffic. Hourly volume is estimated by dividing the month’s volume by the number of days in the month (31) and by 12 hours per day, which assumes the majority of traffic for MORA occurs between 7 am and 7 pm – typical commute hours.
• Roadway Traffic Mix and Speeds –The traffic mix and speeds on a given roadway were based on three sources: (1) State Washington registered vehicle statistics (http://www.fhwa.dot.gov/policyinformation/statistics/2008/mv1.cfm); (2) National Park Service 2004 Traffic Data Report data for Mount Rainier National Park (http://www.efl.fhwa.dot.gov/files/programs/nps-traffic-data/2004_NPS_Traffic_Data_Report.pdf); and (3) observations by field personnel during site visits.
In some cases, a specific speed limit was determined using Google Maps using the “street view” to view an actual speed limit sign. When multiple speed limit signs showed varying speeds over a single road segment, an average speed was used. An average speed of 35 mph

USDOT Research & Innovative Technology Administration December 2011 Environmental Measurement and Modeling Division
24
was assumed as the default within the park when another more specific speed limit could not be determined.
• Ground Impedance – An effective flow resistivity of 1000 cgs/rayls was used in MORA.
Table 11. Estimated hourly roadway traffic volume and speed for the summer season Roadway Estimated Hourly Volume
# Name Average
Speed (mph)
Autos Medium Trucks
Heavy Trucks Buses Motor-
cycles
1 Carbon River Road (Fairfax Forest Reserve Rd E) 25 8 0 0 0 0
2 Mowich Lake Rd (SR-165/ Mountain Meadows Rd closed winters) 40 32 1 0 1 2
3 Westside Road 25 20 0 0 1 1
4 SR 706/ Paradise Longmire Rd (west of park boundary - 304th Ave) 35 498 1 21 18 10
5 SR 706/ Paradise Longmire Rd (west of park boundary 304th Ave to Kernahan Rd) 35 281 1 12 10 6
6 SR 706/ Paradise Longmire Rd (SW corner of park to 387th Ave Ct E) 35 199 0 8 7 4
7 123 (south of park at SR-12) 45 171 0 7 6 4
8 Ohanapecosh Visitor Center 35 40 0 2 1 1
9 Mather Memorial Parkway/ 410 (East of SR 123) 35 173 0 7 6 4
10 Mather Memorial Parkway/ 410 (North of SR 123 to Crystal Mountain Blvd) 35 260 1 11 9 5
11 Mather Memorial Parkway/ 410 (North of Crystal Mountain Blvd.) 40 368 1 15 13 8
12 National Forest Development Rd 7166/Crystal Mountain Blvd. 25 43 0 2 2 1
13 National Forest Development Rd 52 25 216 1 9 8 5
14 Paradise Valley Rd S 25 20 0 1 1 0
15 Steven Canyon Rd 25 28 0 1 1 1
5.3 Final Ambient Maps
The two ambient maps agreed upon for use in ATMP analyses are:
• Existing Ambient Without Air Tours (i.e., the Source of Interest); and • Natural Ambient.
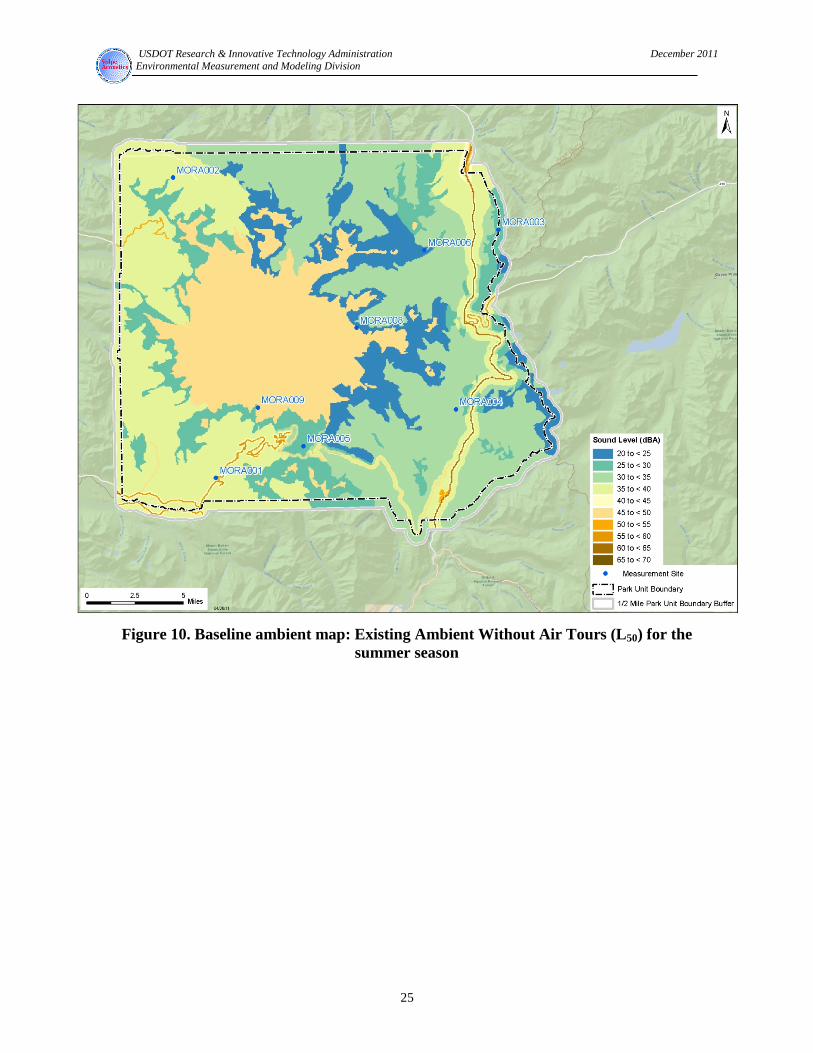
Figure 10 and Figure 11 present the ambient maps for the summer seasons.
USDOT Research & Innovative Technology Administration December 2011 Environmental Measurement and Modeling Division
25
Figure 10. Baseline ambient map: Existing Ambient Without Air Tours (L50) for the
summer season

USDOT Research & Innovative Technology Administration December 2011 Environmental Measurement and Modeling Division
26
Figure 11. Baseline ambient map: Natural Ambient (L50) for the summer season

USDOT Research & Innovative Technology Administration December 2011 Environmental Measurement and Modeling Division
27
6. DATA FOR INDIVIDUAL SITES
This section provides more detailed information for Sites MORA008 and MORA009. Results previously reported by NPS from the earlier effort (i.e., Sites MORA001-MRA006) are not included in this report. For each site, the following are included:
• A photograph of the measurement site and a brief discussion of preliminary observations; • A pie chart presenting a comparison of types of sound sources that were audible during
observer logging; • A graphic presenting distribution plots of the number of 1-second samples of each sound
pressure level measured during daytime and nighttime hours, and daytime/nighttime combined;
• A graphic presenting the daily sound levels using three hourly A-weighted metrics (LAeq, L50, and L90 - refer to Section 3 for definitions), as well as average daily wind speeds over the entire measurement period;
• A graphic presenting the hourly sound levels using three hourly A-weighted metrics (LAeq, L50, and L90 - refer to Section 3 for definitions), as well as average hourly wind speeds over the entire measurement period; and
• A graphic presenting the dB levels for each of 33 one-third octave band frequencies over the day and night periods using three hourly A-weighted metrics (L10, L50, and L90). The L10 exceedence level represents the dB exceeded 10 percent of the time and 90 percent of the measurements are quieter than the L10. Refer to Section 3 for definitions of L50 and L90. The grayed area represents sound levels outside of the typical range of human hearing.
USDOT Research & Innovative Technology Administration December 2011 Environmental Measurement and Modeling Division
28
6.1 Site MORA008 – Summerland
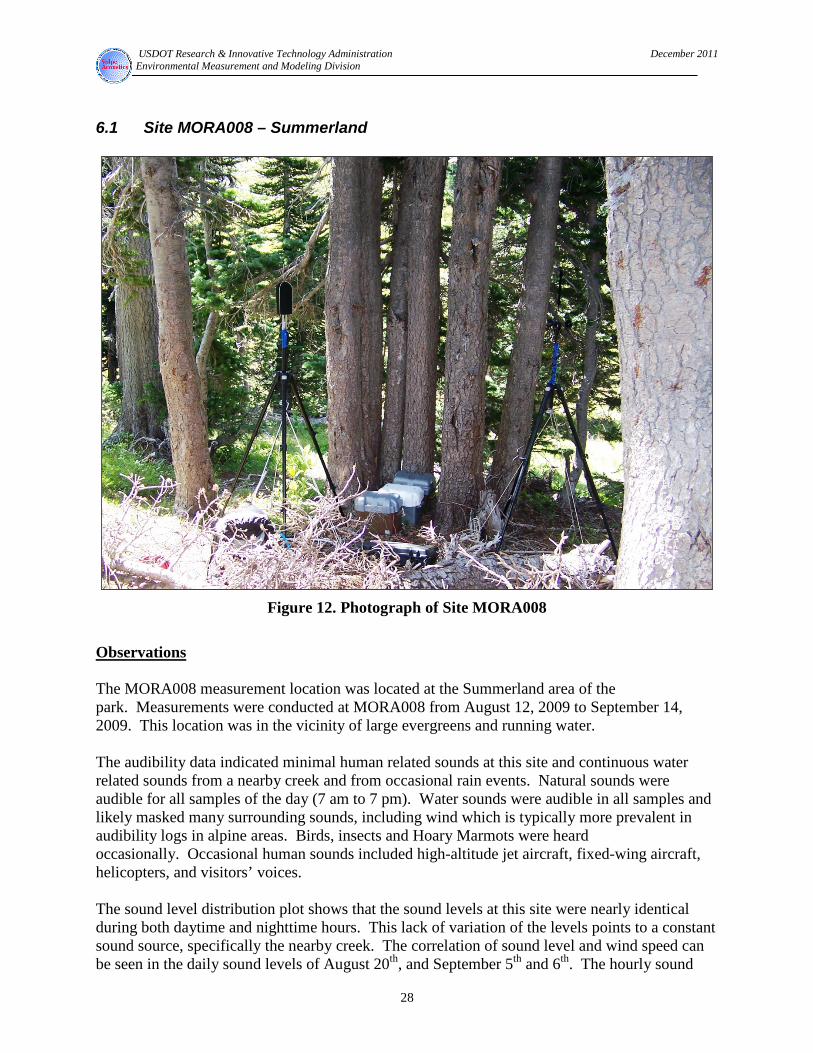
Figure 12. Photograph of Site MORA008
Observations The MORA008 measurement location was located at the Summerland area of the park. Measurements were conducted at MORA008 from August 12, 2009 to September 14, 2009. This location was in the vicinity of large evergreens and running water. The audibility data indicated minimal human related sounds at this site and continuous water related sounds from a nearby creek and from occasional rain events. Natural sounds were audible for all samples of the day (7 am to 7 pm). Water sounds were audible in all samples and likely masked many surrounding sounds, including wind which is typically more prevalent in audibility logs in alpine areas. Birds, insects and Hoary Marmots were heard occasionally. Occasional human sounds included high-altitude jet aircraft, fixed-wing aircraft, helicopters, and visitors’ voices. The sound level distribution plot shows that the sound levels at this site were nearly identical during both daytime and nighttime hours. This lack of variation of the levels points to a constant sound source, specifically the nearby creek. The correlation of sound level and wind speed can be seen in the daily sound levels of August 20th, and September 5th and 6th. The hourly sound

USDOT Research & Innovative Technology Administration December 2011 Environmental Measurement and Modeling Division
29
level plot shows steady sound levels across a twenty-four hour period with elevated levels at the 1200 and 1400 hours - these were due to loud helicopter activity during that time period on September 3, 2009.
Figure 13. Distribution of sound sources audible (in situ and office listening combined) for
Site MORA008 for the summer season
Figure 14. Distribution of data for Site MORA008 for the summer season
0
10000
20000
30000
40000
50000
60000
70000
80000
0 10 20 30 40 50 60 70 80
# Sa
mpl
es
Sound Level (dBA)Overall Daytime Nighttime

USDOT Research & Innovative Technology Administration December 2011 Environmental Measurement and Modeling Division
30
Figure 15. Daily sound levels and wind speeds for Site MORA008 for the summer season
Figure 16. Hourly sound levels and wind speeds for Site MORA008 for the summer season
0
1
2
3
4
5
6
0
5
10
15
20
25
30
35
40
45
50
55
60
7/30/2009 8/4/2009 8/9/2009 8/14/2009 8/19/2009 8/24/2009 8/29/2009 9/3/2009 9/8/2009 9/13/2009
Win
d Sp
eed
(m/s
)
Soun
d Le
vel (
dBA
)
DateLAeq L50 L90 Wind
0
1
2
3
4
5
6
0
5
10
15
20
25
30
35
40
45
50
55
60
0 1 2 3 4 5 6 7 8 9 10 11 12 13 14 15 16 17 18 19 20 21 22 23
Win
d Sp
eed
(m/s
)
Soun
d Le
vel (
dBA
)
Hour of the Day
LAeq L50 L90 Wind

USDOT Research & Innovative Technology Administration December 2011 Environmental Measurement and Modeling Division
31
Figure 17. Sound spectrum for MORA008 for the summer season

USDOT Research & Innovative Technology Administration April 2011 Environmental Measurement and Modeling Division
32
6.2 Site MORA009 – Van Trump
Figure 18. Photograph of Site MORA009 (arrow points to system location)
Observations The MORA009 measurement location was in the Van Trump area of the park. This location was in the vicinity of large evergreens. Measurements were conducted at MORA009 from July 31, 2009 to September 6, 2009. The audibility data indicated minimal human related sounds at this site. Running water sounds and occasional rain were audible in all samples and likely masked many surrounding sounds. Wind, birds and insects were heard occasionally. The only human-related audible sounds were an occasional high-altitude jet, fixed-wing aircraft, and helicopter. Aircraft audibility was higher at this location (10.8% audibility) as compared to MORA008 (2.9% audibility). Birds, insects and unidentified animal sounds were heard occasionally. The sound level distribution plot shows that the sound levels at this site were very similar during both daytime and nighttime hours. This lack of variation of the levels points to a constant sound source, specifically the nearby creek. Overall sound levels for this location were approximately 6 dBA higher as compared to MORA008. The daily sound level plot indicates elevated sound levels on August 5th, 19th, 30th, 31st, and September 1st. These days experienced either frequent

USDOT Research & Innovative Technology Administration December 2011 Environmental Measurement and Modeling Division
33
aircraft activity, loud individual military jet overflights, or helicopter events. The hourly sound level plot shows steady sound levels across a twenty-four hour period, due to the constant sound source of running water.
Figure 19. Distribution of sound sources audible (in situ and office listening combined) for Site MORA009 for the summer season
Figure 20. Distribution of data for Site MORA009 for the summer season
0
10000
20000
30000
40000
50000
60000
70000
0 10 20 30 40 50 60 70 80
# Sa
mpl
es
Sound Level (dBA)
Total Overall Daily Night

USDOT Research & Innovative Technology Administration December 2011 Environmental Measurement and Modeling Division
34
Figure 21. Daily sound levels and wind speeds for Site MORA009 for the summer season*
Figure 22. Hourly sound levels and wind speeds for Site MORA009 for the summer
season*
* The flat line of wind data indicates a possible equipment malfunction.
0
1
2
3
4
5
6
0
5
10
15
20
25
30
35
40
45
50
55
60
7/30/2009 8/4/2009 8/9/2009 8/14/2009 8/19/2009 8/24/2009 8/29/2009 9/3/2009 9/8/2009 9/13/2009
Win
d Sp
eed
(m/s
)
Soun
d Le
vel (
dBA
)
Date
LAeq L50 L90 Wind
0
1
2
3
4
5
6
0
5
10
15
20
25
30
35
40
45
50
55
60
0 1 2 3 4 5 6 7 8 9 10 11 12 13 14 15 16 17 18 19 20 21 22 23
Win
d Sp
eed
(m/s
)
Soun
d Le
vel (
dBA
)
Hour of the Day
LAeq L50 L90 Wind

USDOT Research & Innovative Technology Administration December 2011 Environmental Measurement and Modeling Division
35
Figure 23. Sound spectrum for MORA009 for the summer season

USDOT Research & Innovative Technology Administration December 2011 Environmental Measurement and Modeling Division
36
7. GLOSSARY OF ACOUSTICAL TERMS
Acoustical Environment The actual physical sound resources, regardless of audibility, at a particular location.
Amplitude The instantaneous magnitude of an oscillating quantity such as sound pressure. The peak amplitude is the maximum value.
Audibility The ability of animals with normal hearing, including humans, to hear a given sound. Audibility is affected by the hearing ability of the animal, the masking effects of other sound sources, and by the frequency content and amplitude of the sound.
dBA A-weighted decibel. A-Weighted sum of sound energy across the range of human hearing. Humans do not hear well at very low or very high frequencies. Weighting adjusts for this.
Decibel A logarithmic measure of acoustic or electrical signals. The formula for computing decibels is: 10(Log10(sound level/reference sound level)). 0 dB represents the lowest sound level that can be perceived by a human with healthy hearing. Conversational speech is about 65 dB.
Extrinsic Sound Any sound not forming an essential part of the park unit, or a sound originating from outside the park boundary.
Frequency The number of times per second that the sine wave of sound repeats itself. It can be expressed in cycles per second, or Hertz (Hz). Frequency equals Speed of Sound/ Wavelength.
Hearing Range (frequency) By convention, an average, healthy, young person is said to hear frequencies from approximately 20Hz to 20000 Hz.
Hertz A measure of frequency, or the number of pressure variations per second. A person with normal hearing can hear between 20 Hz and 20,000 Hz.
Human-Caused Sound Any sound that is attributable to a human source.
Intrinsic sound A sound which belongs to a park by its very nature, based on the park unit purposes, values, and establishing legislation. The term “intrinsic sounds” has replaced “natural sounds” in order to incorporate both cultural and historic sounds as part of the acoustic environment of a park.

USDOT Research & Innovative Technology Administration December 2011 Environmental Measurement and Modeling Division
37
Leq Energy Equivalent Sound Level. The level of a constant sound over a specific time period that has the same sound energy as the actual (unsteady) sound over the same period.
Lx A metric used to describe acoustic data. It represents the level of sound exceeded x percent of the time during the given measurement period.
Masking The process by which the threshold of audibility for a sound is raised by the presence of another sound.
Noise-Free Interval The period of time between noise events (not silence).
Noise Sound which is unwanted, either because of its effects on humans, its effect on fatigue or malfunction of physical equipment, or its interference with the perception or detection of other sounds (Source: McGraw Hill Dictionary of Scientific and Technical Terms).
Off-site Listening The systematic identification of sound sources using digital recordings previously collected in the field.

USDOT Research & Innovative Technology Administration December 2011 Environmental Measurement and Modeling Division
38
8. LITERATURE CITED
1. Haralabidis Alexandros S., et. al., “Acute effects of night-time noise exposure on blood pressure in populations living near airports” European Heart Journal Advance Access, Published online February 12, 2008.
2. Berglund, B., Lindvall, T. and Schwela, D.H (Eds.). Guidelines for Community Noise, World Health Organization, Geneva: 1999.
3. Environmental Protection Agency. Information on Levels of Noise Requisite to Protect the Public Health and Welfare with an Adequate Margin of Safety, March 1974. http://www.fican.org/pages/noise_speech.html
4. Fleming, G., et. al., Ambient Sound Levels at Four Department of Interior Conservation Units in Support of Homestead Air Base Reuse Supplemental Environmental Impact Statement, Report Nos. DOT-VNTSC-FAA-99-3, FAA-AEE-99-02, Cambridge, MA: John A. Volpe National Transportation Systems Center, June 1999.
5. Fleming, G., et. al., Development of Noise Dose/Visitor Response Relationships for the National Parks Overflight Rule: Bryce Canyon National Park Study, Report Nos. DOT-VNTSC-FAA-98-6, FAA-AEE-98-01, Cambridge, MA: John A. Volpe National Transportation Systems Center, July 1998.
6. Plotkin, Kenneth J., Review of Technical Acoustical Issues Regarding Noise Measurements in National Parks, Draft Report WR 01-20, Arlington, VA: Wyle Laboratories, January 2002.
7. Rapoza, et. al., Development of Improved Ambient Computation Methods in Support of the National Parks Air Tour Management Act, Cambridge, MA: John A. Volpe National Transportation Systems Center, October 2008.
8. Lee, et. al., FHWA Traffic Noise Model® (FHWA TNM®) User’s Guide Version 2.5 Addendum to the User’s Guide Version 1.0, Report No. FHWA-PD-96-009, Washington, D.C.: Federal Highway Administration, April 2004.

The Department of the Interior protects and manages the nation’s natural resources and cultural heritage; provides scientific and other information about those resources; and honors its special responsibilities to American Indians, Alaska Natives, and affiliated Island Communities. NPS 105/110604, December 2011
National Park Service U.S. Department of the Interior
Natural Resource Stewardship and Science 1201 Oakridge Drive, Suite 150 Fort Collins, CO 80525 www.nature.nps.gov
EXPERIENCE YOUR AMERICA TM