acoustic transmission loss through perforated...
TRANSCRIPT

Acoustic Transmission Loss of Perforated Plates Vincent Phong1 and Dimitri Papamoschou2
University of California, Irvine, CA 92697, USA
A study has been conducted on the acoustic response of perforated plates at normal incidence. The investigation includes a theoretical analysis of the problem, with validation through experimentation. The acoustic response was quantified through the transmission loss and absorption coefficient of the perforate. The theoretical analysis is based on planar wave propagation through a single contraction/expansion chamber, with modifications to account for hole interaction effects. The resulting formula for transmission loss yields superior predictions over past theories. The theoretical model is validated through rigorous parametric experimentation. Eleven perforated plates with different thickness, hole size, and porosity were tested. Deviations between experiment measurements and theoretical predictions of transmission loss are shown to be less than about one decibel for dimensionless hole diameter d/λ < 0.5. The accuracy of the model does not show a strong dependency on plate thickness or porosity.
Nomenclature
A = area c = speed of sound d = perforation diameter f = frequency h = aperture depth
I = incident pressure amplitude k = acoustic wave number LT = transmission loss l = plate thickness p’ = acoustic pressure Rπ = reflection coefficient RP = perforation resistance R = reflected wave amplitude Rm1m2 = cross correlation of microphones 1 and 2 SPL = sound pressure level S = area of unit element containing perforation T = transmitted pressure amplitude t = time u = particle velocity Z = acoustic impedance ZP = perforation impedance Z0 = characteristic impedance α = absorption coefficient β = perforation porosity γ2 = coherence ΔLT = difference in modeled and experimental transmission loss ε = perforation thickness correction θ = polar angle
λ = acoustic wavelength μ = coefficient of viscosity ρ0 = density of air τ = time lag
1 Graduate Student Researcher, Department of Mechanical and Aerospace Engineering, [email protected], AIAA Student Member. 2 Professor, Department of Mechanical and Aerospace Engineering, [email protected], AIAA Fellow.
1
18th AIAA/CEAS Aeroacoustics Conference (33rd AIAA Aeroacoustics Conference)04 - 06 June 2012, Colorado Springs, CO
AIAA 2012-2071
Copyright © 2012 by D. Papamoschou. Published by the American Institute of Aeronautics and Astronautics, Inc., with permission.
ψ = Fok’s function ω = angular frequency Subscripts 1 = region outside contraction 2 = region inside contraction
I. Introduction Perforated material has long been a critical design component in various noise control applications, such as ducts, vehicle and aircraft exhaust systems, hearing protection devices, and acoustic panels. It is common for such noise controlling devices to consist of perforated facing backed by a porous material. Very early designs of these composite systems focused on the absorption characteristics of the porous material, where the perforated facing was used primarily to hold the porous material in place. The hole diameters of the facings were also very large, contributing very little acoustic resistance in comparison to the porous material. The introduction of the micro-perforated plate (MPP) eliminated the need for porous material. The rationale behind the MPP was to design sub millimeter perforation hole radii. This would increase the net effect of viscous loses over the holes in the panel, and therefore increase the overall acoustic resistance of the perforated plate. The advantage of this design is that it eliminates the need to include porous material, which are subject to deterioration, contamination, and overall decreased performance and efficiency of the acoustic panel [1, 2, 3].
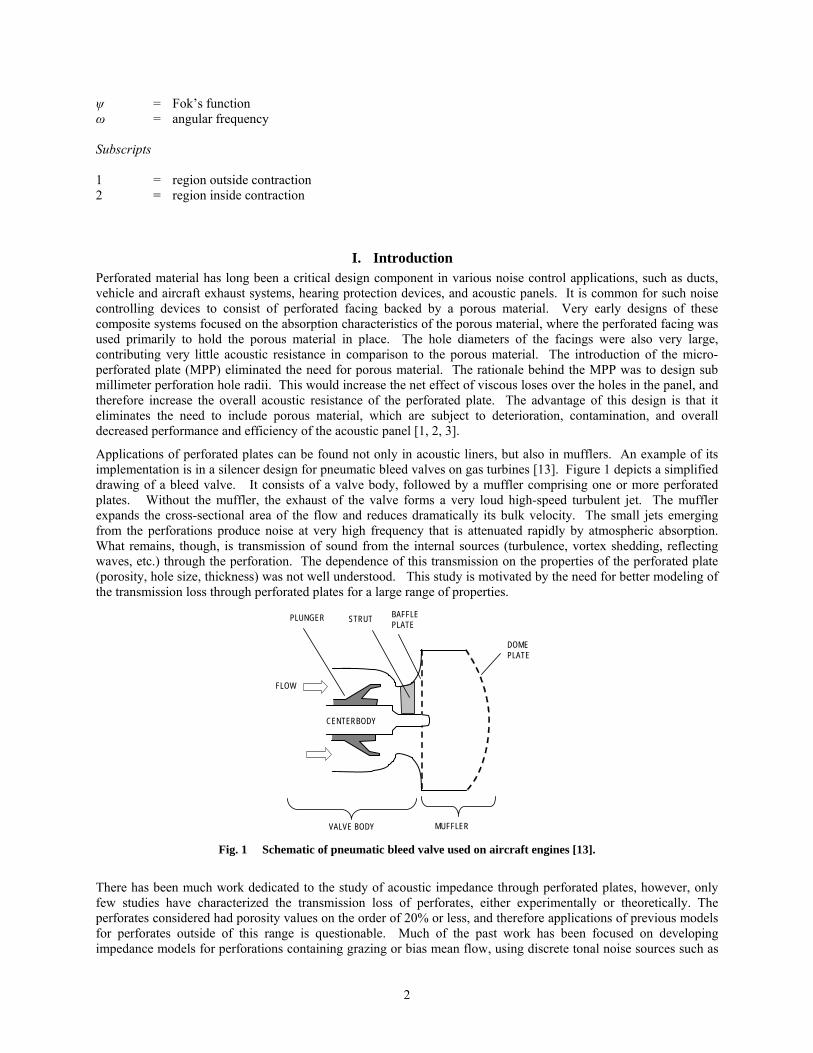
Applications of perforated plates can be found not only in acoustic liners, but also in mufflers. An example of its implementation is in a silencer design for pneumatic bleed valves on gas turbines [13]. Figure 1 depicts a simplified drawing of a bleed valve. It consists of a valve body, followed by a muffler comprising one or more perforated plates. Without the muffler, the exhaust of the valve forms a very loud high-speed turbulent jet. The muffler expands the cross-sectional area of the flow and reduces dramatically its bulk velocity. The small jets emerging from the perforations produce noise at very high frequency that is attenuated rapidly by atmospheric absorption. What remains, though, is transmission of sound from the internal sources (turbulence, vortex shedding, reflecting waves, etc.) through the perforation. The dependence of this transmission on the properties of the perforated plate (porosity, hole size, thickness) was not well understood. This study is motivated by the need for better modeling of the transmission loss through perforated plates for a large range of properties.
STRUT BAFFLE PLATE
DOME PLATE
VALVE BODY MUFFLER
PLUNGER
FLOW
CENTERBODY
Fig. 1 Schematic of pneumatic bleed valve used on aircraft engines [13].
There has been much work dedicated to the study of acoustic impedance through perforated plates, however, only few studies have characterized the transmission loss of perforates, either experimentally or theoretically. The perforates considered had porosity values on the order of 20% or less, and therefore applications of previous models for perforates outside of this range is questionable. Much of the past work has been focused on developing impedance models for perforations containing grazing or bias mean flow, using discrete tonal noise sources such as
2

loudspeakers. The current investigation focuses on attenuation characteristics of perforations without mean flow, utilizes a broadband noise source, and will focus on the development of an semi-empirical model which will incorporate the effect of key parameters such as plate thickness, perforation hole diameter, porosity, and hole interaction effects. The model will be validated with experimental results.
II. Theoretical Formulations A. Previous Work
Chen [3] proposed a theoretical model with experimental validation for the transmission loss through a perforated plate under the assumption of a two dimensional planar wave incident on a rigid screen. The screen dimensions were assumed to be large in comparison to the wavelength. Mass continuity was preserved such that all of the air inside the perforation moves in phase, behaving like a rigid piston. Viscous losses were neglected, and the momentum of the particle velocity was conserved through the pressure gradient across the perforation. An end correction was applied to the screen thickness under the constraint that the ratio of perforation radius to the unit element of the screen is less than 0.2. The theoretical transmission loss from this work was provided from 125 to 4000 Hz, and was shown to agree very well with experiments. Chen accounted for the directivity of transmission loss by averaging over a hemisphere upstream from the perforated screen, resulting in the following expression:
2/
0
2
, 2sin1cos2
)(log10
dc
liL ChenT
(1)
Chen states that the value of ε, which is an end correction factor for the plate thickness, l, is empirically equal to 1.6 times the perforation radius if the ratio of perforation radius to the distance between the holes is less than 0.2.
The incorporation of “end corrections” to the plate thickness, was first introduced by Rayleigh [4]. The effective thickness was conceived based on the interaction between the vibration of the air inside the aperture and the air external to the hole. Ingard [5] proved that the end correction effect is strongly dependent on the hole separation distance. He concluded that the pressure radiated from an orifice will exert an additional force on nearby orifices. This acoustic interaction, also known as the hole interaction effect (HIE), results in a correction for the impedance of these nearby orifices. The HIE was further investigated by Fok [6], who developed an analytical expression for the case of an infinitely thin plate. This expression, now known as the Fok function ψ, can be expressed as a function of plate porosity, and scales Rayleigh’s end correction term. Fok proved that an increase in the porosity corresponds to a reduction in the end correction for thickness. Tayong et al. [7] and Melling [8] developed models for impedance which incorporate Fok’s function, and provide experimental validation. Using the lumped acoustic impedance model formulated by Ingard [5], Tayong accounted for HIE in the reactance term of the impedance expression:
)(3
8122 00
dli
d
lZ P
(2)
where μ and ρ0 are the coefficient of viscosity and density of air, respectively, and ξ is a function of the porosity of the perforate. Eq. 2 is related to the reflection coefficient (the amplitude of the reflected wave to the amplitude of the incident wave) by
0
0
ZZ
ZZR
p
p
(3)
where Z0=ρ0c, is the characteristic impedance of air.
Lee [9] also characterized the acoustics of perforations theoretically and experimentally through impedance measurements. He related the particle velocity outside and inside the perforation through mass continuity and the perforation porosity. Using impedance expressions at the surface and inside the perforated plate, the resulting expression for the perforation impedance is
3

)(
85.0
0
dlikR
cZP
P (4)
Here k is the wavenumber, Rp is the perforation resistance, and l, d, ψ, and β are the same parameters previously specified in this section. The perforation impedance was determined experimentally using an impedance tube setup, and was used to determine the resistance term in Eq. 4 as a function of porosity. The author concluded through experiment that for sufficiently high porosity, the resistance is not a strong function of frequency. This expression for the perforation impedance was applied to Eq. 3 to determine the reflection coefficient.
B. Present Theoretical Formulation
In the present study, the transmission loss of the perforate is modeled theoretically by considering a duct containing a single contraction chamber, as illustrated in Fig. 2. The development follows the model proposed by Ffowcs Williams and Dowling [10] with some important modifications.
Fig. 2 Contraction chamber used for one-dimensional modeling of transmission [10].
The assumptions in this model are that the wavelength of sound is larger than the contraction diameter, and that the sound waves throughout the pipe are one dimensional [10]. The acoustic pressures throughout the domain can be expressed as:
lxeTp
lxeCeBp
xeReIp
cxti
cxticxti
cxticxti
, '
0 , '
0 , '
)(
)()(
)()(
(5)
where I, R, and T are the amplitudes of the incident, reflected, and transmitted waves, respectively. The amplitudes B and C of the pressure waves inside the contraction are determined by application of the conservation equations. The condition of continuity requires that the mass flux into the contraction interface (x = 0) must equal the mass flux out of the contraction.
220110 uAuA (6)
Also, the energy flux into the contraction interface must be equal to the energy flux out of the contraction.
222111 '' upAupA (7)
Combining Eqs. 6 and 7 shows that the energy flux condition is a statement of continuity in the acoustic pressure at the contraction interface, p’1=p’2. The same conditions of mass and energy flux apply at the expansion (x = l). These conditions yield a set of algebraic equation in which R and T can be expressed in terms of I. The transmission loss LT is defined as
4
2
2
10log10T
ILT
(8)
The resulting equation governing the transmission loss of the contraction chamber can be expressed as:
c
l
A
A
A
ALT
2
2
1
2
2
110 sin
4
11log10 (9)
In applying this equation to our experiments, the plate porosity is = A2/A1 and the plate thickness is l. It is noted that the transmission loss in Eq. 9 is symmetric in A1 and A2 and is thus the same whether the chamber is expanding (A2 > A1) or contracting (A2 < A1). With these substitutions, Eq. 9 becomes
klLT
2
2
10 sin1
4
11log10
(10)
with k=/c being the acoustic wavenumber.
Previous studies have shown that an end correction for the thickness must be applied to account for the effect of acoustic interaction between the holes of the perforated plate [4, 5, 6]. The thickness of the plate is replaced with an effective thickness
dlleff (11)
where d is the hole diameter, ε is a correction factor defined as
)(3
8
(12)
and ψ(β) is Fok’s function6:
14273252321 01641.003015.002287.006793.033818.040925.11)(
(13)
Incorporating the effective thickness, Eq. 10 becomes:
)(3
8sin
1
4
11log10 2
2
10
D
lkLT (14)
Equation 14 is a variant of the original equation by Ffowcs Williams and Dowling [10], modified to include end corrections and HIE. Its predictions will be compared to experimental results of transmission loss, and to the previous theoretical models noted in Section II.A.
To compare with the theoretical results from Tayong and Lee [7, 9], it can be shown through algebraic manipulation of Eqs. 5-7, and inclusion of the effective thickness (Eq. 11), that the reflection coefficient is
)sin(1
)cos(2
)sin(1
effeff
eff
klikl
kli
R
(15)
The absorption coefficient can then be computed from the reflection coefficient:
21 R (16)
5

III. Experimental Setup A. Perforations
We investigated 11 perforated plates of varying porosity, hole size, and thickness. Table 1 lists the perforation properties. All the plates were made of sheet metal, either brass or steel. The test matrix includes a solid perforated plate (Experiment S) and the free-field, baseline case (Experiment 0).
Table 1 Properties of Perforated Sheets
Experiment Porosity β
Thickness l, mm
Hole Diameter d, mm
S 0.00 0.6096 -- 0 1.00 -- -- 1 0.37 0.6096 1.1430 2 0.48 0.4064 2.6162 3 0.37 0.4064 1.1430 4 0.29 0.4064 1.0160 5 0.45 0.7620 1.7526 6 0.23 0.7620 1.5875 7 0.23 0.9144 1.5875 8 0.23 0.4064 0.6858 9 0.23 0.4064 0.6096
10 0.22 0.4064 0.5080 11 0.22 0.4064 0.4064
B. Acoustic Measurement
Acoustic measurements were conducted inside an anechoic facility shown in Fig. 3a. Two 3.2-mm condenser microphones (Brüel & Kjaer, Model 4138, with frequency response of 140 kHz) were mounted in a separate small anechoic box located within the anechoic facility (Fig. 3a). The anechoic box is schematically detailed in Fig. 3b. The anechoic box had one open side which allowed the mounting of perforated sheets. The microphones were held on an arm at the opposite end of the box, and were separated from each other by a distance of 76 mm. The distance between the microphone tips and the perforated plate was approximately 76 mm. A localized, broadband acoustic source (“point source”), similar to that used by Gerhold and Clark [11], was generated through the use of four small impinging jets, each with 2.54-mm diameter. The distance between the impinging jet source and the perforated plate was 1.480 m. At this distance, the wavefronts arriving at the perforated plate are nearly planar. The perforated sheets were attached to the open end of the box using spring clamps. The box was hinged in one corner to allow variation of the incidence angle relative to the wave front. In the present experiments, the incidence angle was normal.
a)
Anechoic Box
Compressed air
Anechoic Chamber 1.9 x 2.2 x 2.2 m
Impinging Jet “Point Source”
PC with PCI-6143 1.2 MS/s DAQ Board
Nexus 2690-A-OS4Conditioning Amplifier
b) Hinge
Perforated Plated = hole diameter
l = thicknessß = porosity
7.6 cmTwo BK-4138 Microphones
15.2 cm
30.5 cm
7.6 cm
Fig. 3 Schematic of experiment: a) setup inside anechoic chamber; b) detail of measurement setup.
6

Simultaneous data acquisition at a sampling rate of 250 kHz per channel was performed using two analogue-to-digital boards (National Instruments PCI-6143) installed in a Dell Precision T7400 computer with a Xeon quad-core processor. The resulting signals were conditioned with a high-pass filter set at 300 Hz and a low-pass filter set at 140 kHz. Narrowband sound pressure level (SPL) spectra were computed using a 4096-point (Δf = 61 Hz) Fast Fourier Transform and were corrected for microphone frequency response, free field response and atmospheric absorption. The simultaneous acquisition enabled cross-correlations between the two microphones. For the purpose of measuring the SPL relevant to transmission, the SPLs of the two microphones were averaged. To facilitate the interpretation of the transmission loss data, the spurious wiggles from the spectra were removed by using a Savitzky-Golay filter [14]. As illustrated in Fig. 4, the filter removes the wiggles but does not alter the fundamental shape of the spectrum.
20 40 60 80 100 12030
40
50
60
70S
PL(d
B/H
z)
f (kHz)
RawSmooth
Fig. 4 Raw and smoothed power spectra.
The transmission loss LT of the perforated plate is defined as the difference in SPL between the open box (baseline case) and the box covered with the perforated plate.
IV. Results The results are presented in three parts. The first part evaluates the robustness of the experimental setup to accurately measure transmission loss. In the second part we examine the cross-correlations of the two microphones for ascertaining the plane-wave assumptions underpinning our model. The results on transmission loss, and comparisons to theoretical models, are presented in the third section
A. Robustness of Setup
In order to accurately quantify the transmission loss through the perforations, it was necessary to check for any possible sources of error in the experiment setup. Acoustic contamination could result from leaks due to inadequate sealing of the contact area between the perforated plate and the structure of the anechoic box. An additional source of concern is vibrations of the plate itself, which could lead to discrepancies in the transmission loss measurement. In order to assess these possible sources of error, experiments were conducted with a solid plate, and the results were compared to a perforated plate of equal thickness.
Figure 5 shows the raw SPL spectra (before smoothing) comparisons between three cases. The black and red lines represent the SPL spectra for the solid and perforated plates, respectively. The blue line is the background noise with the source turned off and the solid plate installed. First we note that the spectrum for the solid plate is well below the spectrum of the perforated plate. The difference is 20 dB at low frequency increasing to 50 dB at high frequency. This shows that the effects of vibration and leakage are very small and do not have any impact on the measured transmission loss. We note that the spectrum for the solid plate is higher than the background spectrum, indicating some transmission of sound through the sealed anechoic box. It is natural that some sound will be transmitted through the box, particularly though the un-insulated solid plate. However, this transmission is extremely weak to influence the results.
7
20 40 60 80 10080
90
100
110
120
130
140
150
f (kHz)S
PL(d
B/H
z)
Plate 1Plate S (Background Noise)Plate S
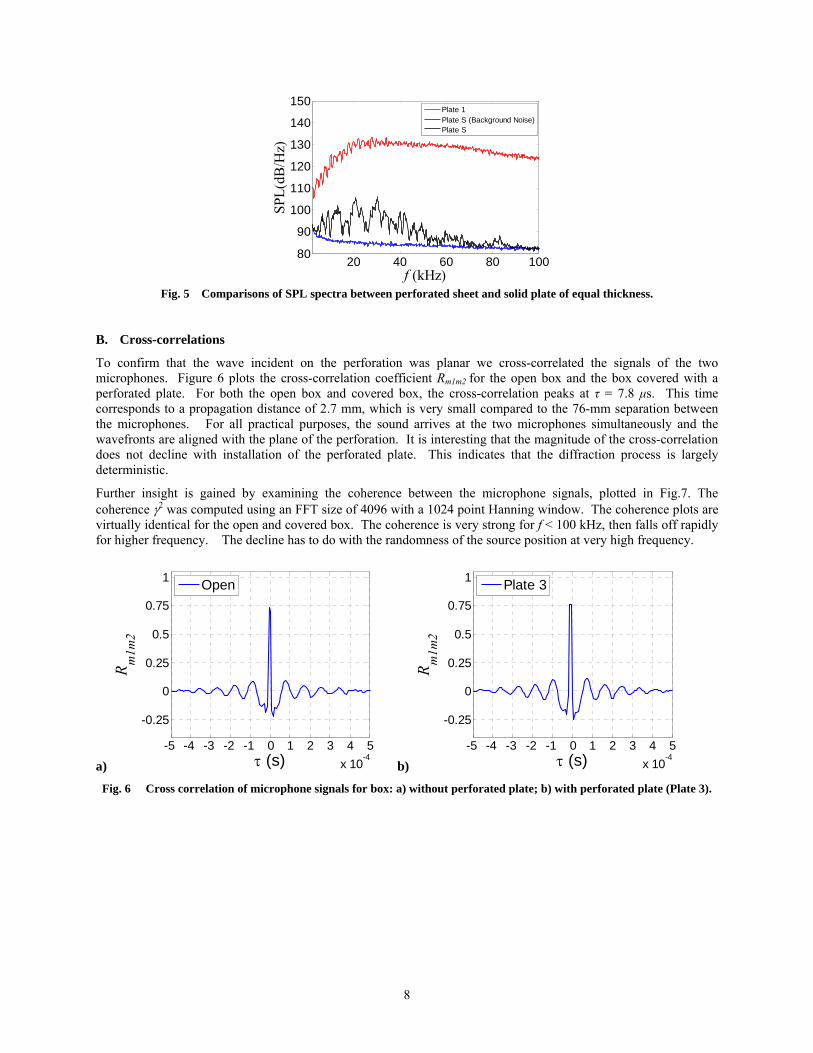
Fig. 5 Comparisons of SPL spectra between perforated sheet and solid plate of equal thickness.
B. Cross-correlations
To confirm that the wave incident on the perforation was planar we cross-correlated the signals of the two microphones. Figure 6 plots the cross-correlation coefficient Rm1m2 for the open box and the box covered with a perforated plate. For both the open box and covered box, the cross-correlation peaks at τ = 7.8 μs. This time corresponds to a propagation distance of 2.7 mm, which is very small compared to the 76-mm separation between the microphones. For all practical purposes, the sound arrives at the two microphones simultaneously and the wavefronts are aligned with the plane of the perforation. It is interesting that the magnitude of the cross-correlation does not decline with installation of the perforated plate. This indicates that the diffraction process is largely deterministic.
Further insight is gained by examining the coherence between the microphone signals, plotted in Fig.7. The coherence 2 was computed using an FFT size of 4096 with a 1024 point Hanning window. The coherence plots are virtually identical for the open and covered box. The coherence is very strong for f < 100 kHz, then falls off rapidly for higher frequency. The decline has to do with the randomness of the source position at very high frequency.
a)
-5 -4 -3 -2 -1 0 1 2 3 4 5
x 10-4
-0.25
0
0.25
0.5
0.75
1
(s)
Rm
1m2
Open
b)
-5 -4 -3 -2 -1 0 1 2 3 4 5
x 10-4
-0.25
0
0.25
0.5
0.75
1
(s)
Rm
1m2
Plate 3
Fig. 6 Cross correlation of microphone signals for box: a) without perforated plate; b) with perforated plate (Plate 3).
8
a) 25 50 75 100 125
0
0.2
0.4
0.6
0.8
1
f (kHz)
2
Open
b)
25 50 75 100 1250
0.2
0.4
0.6
0.8
1
f (kHz)
2
Plate 3
Fig. 7 Coherence between microphone signals: a) without perforated plate; b) with perforated plate (Plate 3).
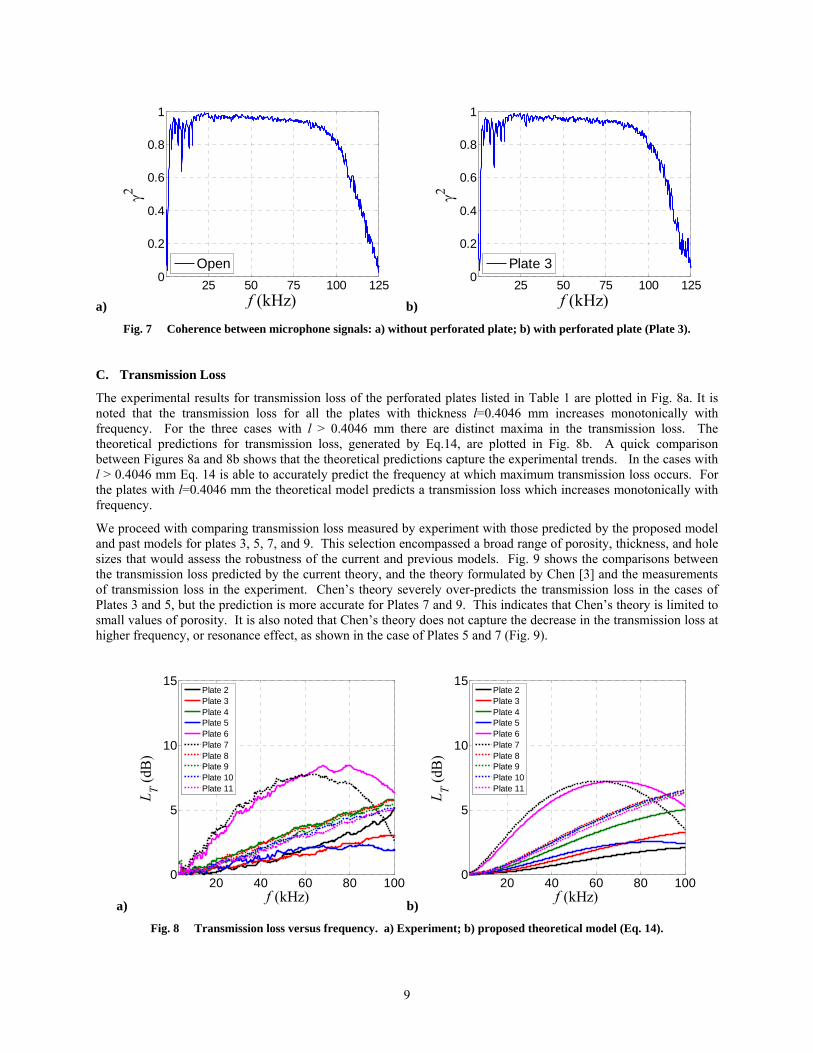
C. Transmission Loss
The experimental results for transmission loss of the perforated plates listed in Table 1 are plotted in Fig. 8a. It is noted that the transmission loss for all the plates with thickness l=0.4046 mm increases monotonically with frequency. For the three cases with l > 0.4046 mm there are distinct maxima in the transmission loss. The theoretical predictions for transmission loss, generated by Eq.14, are plotted in Fig. 8b. A quick comparison between Figures 8a and 8b shows that the theoretical predictions capture the experimental trends. In the cases with l > 0.4046 mm Eq. 14 is able to accurately predict the frequency at which maximum transmission loss occurs. For the plates with l=0.4046 mm the theoretical model predicts a transmission loss which increases monotonically with frequency.
We proceed with comparing transmission loss measured by experiment with those predicted by the proposed model and past models for plates 3, 5, 7, and 9. This selection encompassed a broad range of porosity, thickness, and hole sizes that would assess the robustness of the current and previous models. Fig. 9 shows the comparisons between the transmission loss predicted by the current theory, and the theory formulated by Chen [3] and the measurements of transmission loss in the experiment. Chen’s theory severely over-predicts the transmission loss in the cases of Plates 3 and 5, but the prediction is more accurate for Plates 7 and 9. This indicates that Chen’s theory is limited to small values of porosity. It is also noted that Chen’s theory does not capture the decrease in the transmission loss at higher frequency, or resonance effect, as shown in the case of Plates 5 and 7 (Fig. 9).
a)
20 40 60 80 1000
5
10
15
LT (
dB)
f (kHz)
Plate 2Plate 3Plate 4Plate 5Plate 6Plate 7Plate 8Plate 9Plate 10Plate 11
b)
20 40 60 80 1000
5
10
15
LT (
dB)
f (kHz)
Plate 2Plate 3Plate 4Plate 5Plate 6Plate 7Plate 8Plate 9Plate 10Plate 11
Fig. 8 Transmission loss versus frequency. a) Experiment; b) proposed theoretical model (Eq. 14).
9

PLATE 3
20 40 60 80 100-2
0
2
4
6
8
10L T
(dB
)
f (kHz)
ExperimentCurrent ModelChen
PLATE 5
20 40 60 80 100-2
0
2
4
6
8
10
L T (
dB)
f (kHz)
ExperimentCurrent ModelChen
PLATE 7
20 40 60 80 100-2
0
2
4
6
8
10
L T (
dB)
f (kHz)
ExperimentCurrent ModelChen
PLATE 9
20 40 60 80 100-2
0
2
4
6
8
10
L T (
dB)
f (kHz)
ExperimentCurrent ModelChen
Fig. 9 Comparison of transmission loss between experiment, current model, and Chen’s model [3].
D. Absorption Coefficient
More recent works address hole interaction effects in the characterization of the acoustic properties of perforations using theoretical models and experimental measurements of the impedance of the perforations [7,9]. Since the impedance was not directly measured in the current study, comparisons were instead made for the absorption coefficient. The absorption coefficient, defined in Eq. 16, is a qualitative measure of the amount of the incident wave that is transmitted, or “absorbed” through the perforation. It assigns a real value to the amount of transmittance between 0 and 1, 0 being no transmittance while 1 being perfect transmittance. Fig. 10 shows comparisons between the absorption coefficient of the current experiments, and the current and previous theoretical formulations. The previous theoretical formulations are shown to severely under-predict the absorption coefficient.
10

PLATE 3
20 40 60 80 1000
0.2
0.4
0.6
0.8
1
f (kHz)
=
1-|
R|2
ExperimentCurrent ModelTayongLee
PLATE 5
20 40 60 80 1000
0.2
0.4
0.6
0.8
1
f (kHz)
=
1-|
R|2
ExperimentCurrent ModelTayongLee
PLATE 7
20 40 60 80 1000
0.2
0.4
0.6
0.8
1
f (kHz)
=
1-|R
|2
ExperimentCurrent ModelTayongLee
PLATE 9
20 40 60 80 1000
0.2
0.4
0.6
0.8
1
f (kHz)
=
1-|
R|2
ExperimentCurrent ModelTayongLee
Fig. 10 Comparison of absorption coefficient between experiment, current model, and earlier models [7, 9].
E. Accuracy of Current Prediction
To assess the range of validity of the current predictive model, Eq. 14, we examine systematically the deviation of the prediction from the experiment. We define the error in transmission loss as
ExperimentTModelTT LLL ,, (17)
and plot it versus the relevant non-dimensional parameters of the problem. In the formulation of the current theory it was assumed that the wavelength of sound is much greater than the perforation diameter. To examine the effect of this assumption, Fig. 11 plots ΔLT against the ratio of perforation diameter to wavelength of sound, d/λ, for all the plates examined. We note a very modest increase of ΔLT with increasing d/λ, the deviation being less than about 1 dB for d/λ < 0.5. For d/λ above this value, ΔLT increases significantly, as shown in the case of Plate 2. It is concluded that the assumption of large wavelength holds satisfactorily for d/λ < 0.5.
Next we examine the effects of thickness and porosity on the model accuracy, for d/λ < 0.5. The effect of dimensionless thickness, l/d, on the transmission-loss error is shown in Fig. 12 for several values of d/λ. The trends of Fig. 12 indicate that the transmission loss error is not a strong function of l/d. The magnitude of the error is less than 1.2 dB. Similarly, Fig. 13 plots ΔLT against the range of perforation porosities tested, 0.22 < β < 0.48. The results of Fig. 13 show that the current model predicts the transmission loss within an error of about 1.2 dB or less for all the porosities tested.
11

0 0.2 0.4 0.6 0.8-5
-4
-3
-2
-1
0
1
2
3
4
5
L T (
dB)
d/
Plate 2Plate 3Plate 4Plate 5Plate 6Plate 7Plate 8Plate 9Plate 10Plate 11
Fig. 11 Transmission loss error versus perforation hole diameter scaled by acoustic wavelength.
0 0.2 0.4 0.6 0.8 1-5
-4
-3
-2
-1
0
1
2
3
4
5
L
T (
dB)
l/d
d/ = 0.02
d/ = 0.05
d/ = 0.1
d/ = 0.2
d/ = 0.5
Fig. 12 Transmission loss error versus non-dimensional plate thickness for varying d/.
0.2 0.3 0.4 0.5-5
-4
-3
-2
-1
0
1
2
3
4
5
L
T (
dB)
d/ = 0.02
d/ = 0.05
d/ = 0.1
d/ = 0.2
d/ = 0.5
Fig. 13 Transmission loss error versus perforate porosity for varying d/.
12

13
V. Conclusions We conducted an experimental and theoretical parametric investigation of acoustic transmission through perforated plates at normal incidence. The experiments utilized a broadband point source to evaluate the transmission loss of 11 perforated plates with varying porosity, hole size, and thickness. The experimental matrix covered porosities 0.22 ≤≤ 0.48, non-dimensional hole size 0 ≤ d≤ 0.75, and non-dimensional thickness 0.15 ≤ ld ≤ 1.0. A theoretical model for the transmission loss combines one-dimensional planar wave theory with end corrections for hole interaction effects. The model is based on the acoustic wavelength being much larger than the hole size. The predicted transmission loss is in very good agreement with the experimental measurement, with the error around 1 dB or less, for d≤ 0.5. Further, the present model provides much higher fidelity than theories of past works over the range of the experiments. A systematic analysis of the error between present model and experiment does not show any specific trends versus plate thickness or porosity. The perforations used in this study have practical use, as shown in Ref. 13, and characterization of their attenuation capabilities provides important design guidance. The present model did not address the effect of flow through the perforation. This aspect will be investigated in the future using numerical approaches such as the boundary element method.
References
1. Maa, D.Y. “Potential of Microperforated Panel Absorber,” Journal of Acoustical Society of America, Vol. 104, No. 5, 1998, pp. 2861-2866.
2. Lee, S.H., Ih, J.G., and Peat, K.S., “A Model of Acoustic Impedance of Perforated Plates with Bias Flow Considering the Interaction Effect,” Journal of Sound and Vibration, Vol. 303, 2007, pp. 741-752.
3. Chen, K.T., “Study on the Acoustic Transmission Loss of a Rigid Perforated Screen,” Applied Acoustics, Vol. 47, No. 4, 1996, pp. 303-318.
4. Rayleigh, “The Theory of Sound, Volume II,” MacMillan, New York, 1945 ed., p. 180-183. 5. Ingard, U., “On the Theory and Design of Acoustic Resonators,” Journal of the Acoustical Society of
America, Vol. 26, No. 6, 1953, pp. 1037-1061. 6. Fok, V.A., Doklady Akademii Nauk SSSR 31, 1941. 7. Tayong, R., and Leclaire, P., “Hole Interaction Effects under High and Medium Sound Intensities for
Micro-Perforated Panels Design,”10eme Congres Francais d’Acoustique, 2011 8. Melling, T.H., “The Acoustic Impedance of Perforates at Medium and High Sound Pressure Levels”,
Journal of Sound and Vibration, Vol. 29, No. 1, 1973, pp. 1-65. 9. Lee, I., “Acoustic Characteristics of Perforated Dissipative and Hybrid Silencers,” Ph.D. Dissertation, Ohio
State University, 2005. 10. Ffowcs Williams, J.E., and Dowling, A.P., “Sound and Sources of Sound,” Ellis Horwood Ltd, 1983. 11. Gerhold, C.H., and Clark, L.R., “Database of Inlet and Exhaust Noise Shielding for Wedge-Shaped
Airframe,” NASA/TM-2001-210840, April 2001. 12. Kinsler, L. E., Frey, A. R., Coppens, A. B., and Sanders, J. V., “Fundamentals of Acoustics: Third
Edition,” John Wiley & Sons, 1982. 13. Phong, V., Taghavi Nezhad, S., Liu, F., and Papamoschou, D., “Noise Reduction of a Turbofan Bleed
Valve,” AIAA Paper 2012-0681, January 2012. 14. Savitsky, A., and Golay, M.J.E., “Smoothing and Differentiation of Data by Simplified Least Squares
Procedures,” Analytical Chemistry, Vol. 36, 1964, pp. 1627-1639.