acoustic emission monitoring from a lab scale high …eprints.whiterose.ac.uk/89611/2/acoustic...
TRANSCRIPT
This is a repository copy of Acoustic emission monitoring from a lab scale high shear granulator - A novel approach.
White Rose Research Online URL for this paper:http://eprints.whiterose.ac.uk/89611/
Version: Accepted Version
Article:
Watson, NJ, Povey, MJW, Reynolds, GK et al. (2 more authors) (2014) Acoustic emission monitoring from a lab scale high shear granulator - A novel approach. International Journalof Pharmaceutics, 465 (1-2). pp. 262-274. ISSN 0378-5173
https://doi.org/10.1016/j.ijpharm.2014.01.032
© 2014, Elsevier. Licensed under the Creative Commons Attribution-NonCommercial-NoDerivatives 4.0 International http://creativecommons.org/licenses/by-nc-nd/4.0/
[email protected]://eprints.whiterose.ac.uk/
Reuse
Unless indicated otherwise, fulltext items are protected by copyright with all rights reserved. The copyright exception in section 29 of the Copyright, Designs and Patents Act 1988 allows the making of a single copy solely for the purpose of non-commercial research or private study within the limits of fair dealing. The publisher or other rights-holder may allow further reproduction and re-use of this version - refer to the White Rose Research Online record for this item. Where records identify the publisher as the copyright holder, users can verify any specific terms of use on the publisher’s website.
Takedown
If you consider content in White Rose Research Online to be in breach of UK law, please notify us by emailing [email protected] including the URL of the record and the reason for the withdrawal request.

Acoustic emission monitoring from a lab scale high shear granulator – a novel approach
N. J. Watson1*, M. J. W. Povey1, G.K. Reynolds2, B. H. Xu3 Y. Ding3
1Department of Food Science and Nutrition, University of Leeds, Woodhouse lane, Leeds LS2 9JT, UK 2Pharmaceutical development, AstraZeneca, Silk Road Business Park, Macclesfield, SK10 2NA, UK 3Institute of Particle Science and Engineering, University of Leeds, Woodhouse lane, Leeds LS2 9JT, UK.
*Corresponding Author. Address: Dr Nicholas James Watson. Room 2.24a Parkinson Building, School of Food Science and Nutrition, University of Leeds, Leeds, UK, LS2 9JT Email: [email protected] Phone: (+44) 113 343 7724
ABSTRACT
A new approach to the monitoring of granulation processes using passive acoustics together with precise control over the granulation process has highlighted the importance of particle-particle and particle-bowl collisions in acoustic emission. The results have shown that repeatable acoustic results could be obtained but only when a spray nozzle water addition system was used. Acoustic emissions were recorded from a transducer attached to the bowl and an airborne transducer. It was found that the airborne transducer detected very little from the granulation and only experienced small changes throughout the process. The results from the bowl transducer showed that during granulation the frequency content of the acoustic emission shifted towards the lower frequencies. Discrete element modelling of the granulator system show that when the particles increase in size and reduce in number the number of collisions the particles experience reduces. These simulation results coupled with previous theoretical work on the frequency content of an impacting sphere explain why the frequency content of the acoustic emissions reduces during granule growth. The acoustic system used was also clearly able to identify when large over-wetted granules were present in the system, highlighting its benefit for detecting undesirable operational conditions. High-speed photography was used to study if visual changes in the granule properties could be linked with the changing acoustic emissions. The high speed photography was only possible towards the latter stages of the granulation process and it was found that larger granules produced a higher magnitude of acoustic emission across a broader frequency range.
Key words: Granulation, high shear mixer, process monitoring, passive acoustic monitoring, high speed photography, discrete element monitoring.

1 Introduction
Granulation is the process of agglomerating particles together into larger, semi-permanent granules in which the original particles can still be distinguished (Ennis and Litster, 1997). The granules are semi-permanent in nature as their properties can change during granulation. Wet granulation occurs by a liquid binder being sprayed or poured onto a powder bed; the liquid binder initially bonds the particles together by capillary and viscous forces and this forms the initial agglomeration process. These bonds are made more permanent as the process continues. There are many different types of granulators, with the most common forms being tumbling, fluidised and mixer granulators. Granulation is routinely used in many different industries including mineral processing, agricultural products, detergents, pharmaceutical, foodstuffs and speciality chemicals (Iveson et al., 2001). Some of the benefits gained from granulating powders are; control of dust liberation, ease of transport, improved product appearance, improved flow characteristics, greater control of dispersion and solubility, and a reduced chance of segregation within compounds. Granulation is often one stage of an industrial process, hence poor granulation may significantly affect final product quality. For example, poor granule quality could result in tablets having an unacceptable variation of active components. Granulation is affected by formulation and process with different factors affecting the size and material properties of the final granules. This results in a process which is difficult to control and predict.
Granulation occurs in high shear granulators (HSG) by the mechanical motion of an impeller which can be mounted vertically or horizontally. Other granulators can have impellers but only industrial scale granulators with an impeller tip speed of 10 m/s or higher are termed HSG. Some HSG include a rotational chopper to break up any large agglomerates which may form. HSG produce smaller and denser granules and are used extensively in pharmaceutical, ceramics and chemical industries. HSG are difficult to control due to the variety of geometries and different operating conditions resulting in complex flow patterns, all of which can affect the granules’ final properties. Many granulation mechanisms occur in HSG so it is important to study each system individually to understand how the granulation process occurs within it.
Process monitoring is an important issue in granulation as the process often operates in an empirical manner due to the lack of an understanding of the specific granulation mechanisms within the equipment. Many different techniques have been used to monitor granulation such as power consumption (Holm et al., 1985, Sato et al., 2005), probes detecting granule impacts (Staniforth et al., 1986, Staniforth and Quincey, 1986, Talu et al., 2001), granule imaging (Watano and Miyanami, 1995) and Near Infrared (NIR) spectroscopy (Watano et al., 1991, Rantanen et al., 1998). Although these different techniques have given invaluable information on the granulation process their use is still limited. The techniques are often invasive in nature, do not give real-time results and are also limited by sampling only a small section of the equipment.
In this work, we present a new approach to passive acoustic monitoring of granulation processes which is more informative. We interpret the Acoustic Emission (AE) recordings by performing simultaneous high speed photography and computationally studying the effect of granule properties on contacts within the system. The high speed photography will allow us to understand what visual properties of the granules are changing during different stages of granulation and the computational models allow us to understand how changing granule properties will affect the contact events which generate the AE. We use a well defined operational scheme for the granulation operation and well controlled experiments, amenable to discrete element modelling focussing on how particle properties affect the flow patterns and granule interactions in the test equipment. Several granulation runs were performed with the same formulations and operational settings to study the issue of acoustic repeatability which has shown to be an issue in the literature. Granulations were performed with varying impeller speeds and bowl sizes to understand how these process variables affect the AE. Many process factors such as scale, binder quantity, binder addition method and impeller speed are known to affect the granulation process and the final granule properties, such as size and density. In

this work we studied the effects of scale and impeller speed. For the two granulator bowl sizes used different binder addition methods had to be utilised so this variable was also studied.
1.1 Passive acoustic monitoring of granulation
Passive acoustic techniques record the sound emitted from a system and analyses the relationship between the AE and the state of the system. Signal processing and data analysis are required to retrieve information on the systems from the recorded AE. A benefit of an acoustic system is that they are often non-invasive, since the sensor can be attached to the outside of the granulator. The technique can also be used on opaque systems and can also be used on-line in real time systems. Although passive acoustics may seem to be an ideal monitoring solution the primary challenge is in interpreting the recorded AE to give useful information on the system. The AE will often be a combination of numerous acoustic events all propagating to the sensor via different paths. Some commercial systems simplify the interpretation of AE by recording a simple ‘hit rate’, this is the number of events which exceed a given acoustic pressure level. AE systems in general can be classified in terms of (a) their acoustic bandwidth, (b) coupling method (bonded to the bowl or some other solid component of the granulator or using air transmission, (c) transducer type (piezo-electric, condenser microphone etc), (d) data acquisition rate and capacity and (e) method of data reduction – hit rate, fast Fourier transform frequency analysis.
Researchers have used passive acoustics to monitor granulation in HSG (Whitaker et al., 2000; Briens et al., 2007; Daniher et al., 2008; Hansuld et al., 2009; Papp et al., 2008; and Gamble et al., 2009; Hansuld et al., 2011;) and are reviewed in Watson (2010). The majority of all the previous research attempted to identify the granulation end point or granules’ properties using complex statistical methods. Findings correlated the granules’ growth rates and changes in physical properties with changes in the AE signatures, however, the precise causal relationships were not fully understood. It is difficult to quantitatively compare the work in the literature as they all utilised different granulators and AE monitoring equipment, recorded the AE in different frequency ranges and processed the acoustic signals differently. However, the results of our studies are more promising, with the generation of repeatable acoustic profiles that may be used to interpret the granulation process.
It has been shown in various theoretical and experimental works (Thorne and Foden (1988), Carson et al., 2008, Leach et al., 1977, Leach et al., 1978a, Leach et al., 1978b) that the frequency of the AE from spherical impacting particles is inversely proportional to the size of the impacting objects. Hansuld et al. (2012) found that for a particular 10 Hz frequency band the power of the AE reduced with particle size. Importantly, they also state that motion in a granulator does not involve many head-on contacts so the size of impacting particles may not affect the frequency of the AE in this manner.
To successfully monitor wet granulation using AE it is important to understand what is responsible for generating the AE from the process. These are classified into the following:
Particle - particle contacts Particle - bowl contacts Particle - blade contacts Friction between blade and bowl Impeller motor and ambient noise
The three types of particle contacts will be the most important to detect for any AE monitoring system as these will contain information on the number of granules in the system and also the properties of the granules (such as size, density and moisture content). Transducers located in different regions of the equipment may be more suitable for detecting the different contact types, for example an airborne transducer would be more suitable for detecting particle - particle contacts whereas a bowl mounted

transducer would be more suitable for detecting particle - bowl contacts. As well as the nature of the contacts the propagation path from the acoustic event to the transducer should be considered, especially as high frequency AE is greatly attenuated in air. The DEM model we have developed of the Mi-Pro granulator will generate important information on the number of the different type of contacts which occur in the Mi-Pro during granulation. The friction between the blade and the bowl will be related to the initial states of the granules. The impeller motor and ambient laboratory noise are unavoidable. The motor noise should be predictive for any HSG operating at a fixed speed so can be removed from subsequent data analysis. Ambient noise in the laboratory environment was insignificant unlike in a factory environment. Ambient noise decays roughly proportionally to the frequency squared and is generally insignificant above approximately 25 KHz. Thus, the frequency region above 25 kHz is advantageous if process changes can be monitored in this region
1.2 Discrete element modelling
Discrete Element Method (DEM) is a numerical technique which tracks the positions and velocities of all individual particles in a granular system. DEM was originally developed by Cundall and Strack (1979) to study granular behaviour in the field of soil mechanics. DEM is a modelling technique which allows all the particles in the system to move individually and interact at contact points. The advantage of the technique is that all the data for every particle is accessible at any stage of the simulation. The limitation of the technique is however the number of particles which can be modelled or length of a simulation, due to the large number of calculations performed and the small time steps used.
When particles interact in a DEM model they are allowed to overlap each other, a contact model is then used to calculate the forces involved in these contacts. Once all the contacts are resolved for a given particle the resultant force on that particle can be found. This force is used to calculate the acceleration, velocity and displacement of the particle. The key assumption underpinning DEM is that within a sufficiently small time step disturbances cannot propagate from any particle further than its immediate neighbouring particles (Cundall and Strack, 1979). The forces acting on a particle are calculated in the normal and tangential directions using suitable contact models.
Due to the number of calculations required in a simulation time step DEM models limit the number of particles that can be simulated as well as the duration of the simulation. Despite these limitations DEM has been used successfully to model the particle flow in mixers and granulators (Stewart et al., 2001; Sinnott and Cleary, 2003; Zhou et al., 2003; Zhou et al., 2004; Kuo et al., 2004; Sato et al., 2008; Chandratilleke et al., 2009; Nakamura et al., 2009). Most of these previous work have focussed on the flow patterns within granulators and Watson et al. (2009) have shown these for the Mi-Pro.
The focus of this work is to study the AE from a granulator so the DEM model of the Mi-Pro will be used to calculate the frequency of the different types of contacts in the granulator. These contacts are acoustic events which generate AE. Simulations were performed varying relevant particle properties to represent granules at different stages and studying how these will affect the contact frequencies.
2 Materials and Methods
2.1 Materials
For all granulations Avicel PH-101 MCC (microcrystalline cellulose) was used as the powder and water was used as the binder in the ratio 1:1 by weight. The overall quantity of powder and binder did change for the different sized bowls but was scaled according to bowl volume.
2.2 Granulation equipment

For all of the granulations a Mi-Pro lab scale granulator was used (ProCepT Belgium) see Figure 1. 1900 ml and 900 ml bowls were used to study the effect of scale. Throughout the granulations the chopper was not used for the following two reasons. Firstly, the chopper usually operates at high speeds (typically 1,500 RPM) and therefore generates sound within the system. The fewer devices creating sound result in a signal that is constructed from fewer inputs and is therefore easier to analyse. Secondly, the effect of choppers during granulation is not fully understood. It is believed that choppers break up any large agglomerates formed or, in some granulators actually performs the granulation process whilst the impeller simply moves the solids around. As the binder is introduced through a spray nozzle in our experiment in a controlled manner, it is believed that large agglomerates will not form and the use of a chopper is not necessary.
When the 1900 ml bowl was used, binder was added to the Mi -Pro using a spray nozzle. This was used as the spray is the most effective way of adding binder to a system when steady granulation with a narrow final granule size distribution is required. The nozzle can be adjusted to create a spray zone where each droplet is absorbed into the moving bed before more is presented. This reduces the chance of over wetted or areas of dry powder and should increase the chances of uniform growth (Iveson et al., 2001). For the 900 ml bowl the spray nozzle could not be fitted so a dripping system was implemented. (Metrohm Dosimat 765). In the literature, impeller speed scaling in high shear granulators was achieved using tip speed and the associated Froude number (Rahmanian et al., 2008) although this is not widely accepted. In this study therefore the same impeller speeds were used for both sized bowls in our experiments.
Figure 1: Mi -Pro lab scale granulator with AE recording equipment. 1: Mi-Pro bowl, 2: Acoustic transducer, 3: LeCroy oscilloscope, 4: Pressurised water pump, 5: Spray nozzle, 6: airborne microphone and amplifier.
2.3 Granulation process
The issue of repeatability is important in the granulation process. Repeatability is critical for the characterisation of AE and its useful application in granulation processes. If the variance of the AE with the same formulation and operating conditions is too high it would render the technique unusable. However assuming that the variance of the AE are within a range which permits an acceptable correlation with operating conditions then the problem becomes one of reducing the uncertainties to a level where we may adequately control the process. With this is mind several granulations with identical operating conditions were performed.
To study the effect of impeller speed on the acoustic emissions a range of impeller speeds were used, these are listed in Table 1. Granulation scale is also an important factor, accordingly, AE were recorded for two different bowl sizes, 1900 ml and 900 ml. For the 1900 ml bowl, 150 g of powder
1
5
2 4
3
6

and 150 ml of binder was used. For the 900 ml bowl 71 g of powder and 71 ml of binder was used. All of the granulation process variables are listed in Table 1.
Table 1: Variables and their values used during the granulation experiments.
Bowl volume 900 ml 1900 ml
Impeller speeds 150, 250, 350 RPM 150, 250, 350 RPM
Dry powder quantity 71 g 150 g
Liquid binder (water) quantity 71 ml 150 ml
Binder flow rate 25 ml/min 25 ml/min
Granulation time 12 minutes 12 minutes
Nominal particle size 50 たm 50 たm
Loose bulk density 260-310 kg/m3 260-310 kg/m3
The granulation procedure entails appropriate weighing of dry powder (Model KERN EW 4200-2nm), this is transferred to the granulator bowl, which was then attached to the rest of the granulator. The initial starting time of the granulation process commenced with the binder addition. This was performed by connecting the binder container to a compressed airline set at a constant pressure of 0.5 bar. It was important that the pressure was kept constant to avoid varying binder flow rates. A pressure of 0.5 bar gave a flow rate of approximately 25 ml/min. A low value of binder flow rate is desirable as it increases the probability of the granulator operating within the drop controlled nucleation regime (Hapgood et al., 2003). This should result in a uniform nuclei size distribution and a more controlled and reproducible granulation. Once 150 ml of binder had been added, the spray nozzle was closed. After a total of 720 seconds from the beginning of binder addition the granulation was stopped. For the granulations in the 900 ml bowl where the dropper system was implemented, the flow rate was set at 25 ml/min so it was consistent with granulations in the 1900 ml bowl. Different binder addition methods are known to affect the granulation process. Knight et al. (1998) used a pouring system for binder addition in a high shear wet granulator and found this would result in the formation of large coarse granules. The initial wetting and nucleation stage is generally considered to be one of the most important aspects of granulation and spray nozzles are usually preferred as they produce a controlled nucleation stage resulting in a more controllable granule size distribution (Iveson et al., 2001). Unfortunately in this study we could not investigate the effect of binder addition independently as each size of bowl required a different binder addition method.
2.4 AE recording equipment and procedure
Two passive acoustic systems were used to monitor AE during the granulations. I n one system a transducer was glued to the base of the granulator bowl and the second was an airborne system with the transducer placed in an open probe port in the top of the granulator. For the bowl system a Physical Acoustics limited AE transducer, with an operating frequency range between 10 and 100 KHz was connected directly to the 1Mっ input of a LeCroy digital oscilloscope (LeCroy Wave Surfer 44XS). The signals were displayed and processed on the oscilloscope in real time and the data was stored at 30 second intervals onto a laptop. The oscilloscope was operated in trigger mode which records 200 ms of AE once the signal exceeds the trigger level of 1.8 mV and at a sampling frequency of 500 KHz. Once a segment of AE was recorded, a Fast Fourier transform (FFT) was performed on the signal and the average FFT was displayed on the scope. The frequency bandwidth for the FFT was
set to 50 kHz as preliminary results showed little AE above this frequency. Primarily, it was decided to analyse the acoustic emissions in the frequency domain as previous work has shown it to be more sensitive to changes during the granulation process (Briens et al., 2007).
The airborne system utilised a Larson Davies 2520 Free-Field microphone attached to a Larson Davies PRM902 preamplifier and a Larson Davies 2221 preamplifier power supply. This system gives 40 dB of signal gain to the detected AE. This transducer has almost flat frequency response between 4 Hz and 80 KHz. The transducer was held by a clamp stand and clamp so that the transducer was in one of the spare probe points available in the top of the equipment. The preamplifier was attached to the 50っ input of the same LeCroy and the signal was processed in the same way as the bowl transducer. There was only one trigger on the LeCroy and this was activated on the bowl transducer.
2.5 Analysis of AE data
AE spectra were saved every 30 seconds during the granulations. MATLAB was used to combine all of these individual sections into a waterfall plot. These display the change in the frequency content of the AE during the granulations. An average frequency was calculated as the power weighted arithmetic mean of each frequency spectrum. Each point on the average frequency figures will represent a rolling average over 60 seconds. This will include all average frequency results 30 seconds before and 30 seconds after the plotted time point. A rolling average was used to remove sudden temporal changes in the data and highlight the general trends in the average frequency of the AE. An average frequency was calculated for the low and high frequency content of the AE. The cut off point between low and high frequencies was chosen as an estimate of the fundamental resonant frequency of the Mi-Pro's bowls. The rationale was that the particle contact frequency started at high frequency and then reduces to lower levels as the numbers of particles fell. So there should be a component in the frequency spectrum which reflected this which would most simply be analysed by taking an average ‘high frequency’ measure. The low frequency region was defined by the integrating properties of the bowl, in which contacts with the bowl excited the bowl fundamental frequency and a few harmonics. The fundamental resonant frequency was calculated based on the geometric and material properties of the Mi-Pro's bowl using the methodology presented by French (1983) in the study of wineglass acoustics. Terwagne and Bush (2011) used this methodology to calculate the fundamental resonant frequency of Tibetan singing bowls and found that the theoretical frequencies were comparable to the ones recorded using microphones. The fundamental resonance frequency of the 900 ml and 1900 ml bowl's were found to be approximately 1.6 and 1.3 KHz respectively. These values must be taken as estimates since the curved geometry of the Mi-Pro's bowl is not identical to the geometry for which the equations were originally developed. However, this is not critical as they are being used to locate an otherwise arbitrary cut off point. When granulations were performed using the 900 ml bowl, the Root Mean Squared (RMS) voltage of the AE, i.e. the magnitude of the acoustic emissions was also recorded to permit comparison with data from the high speed camera.
2.6 Recording of granules using high speed camera
The primary hypothesis behind this research is that the evolving granular properties are temporally correlated with the acoustic emissions during granulation. However, many factors can affect AE generation and propagation e.g. acoustic resonances in the bowl. With this in mind it was decided to image the granules during the process, this could be used to study how their visual properties i.e. size and shape change during granulation relate to the AE. A Vision Research Phantom V710 (colour) high speed camera was supplied from the EPSRC equipment loan pool.
The visual frame of Phantom V710 was set so that the entire bowl of the Mi -Pro was viewed to ensure that a scale could be established for granule size calculations. Particle motion was recorded every 30

seconds to coincide with AE acquisition. This was performed by manually triggering the camera. Once triggered, one entire revolution of the impeller blade was saved.
Image processing and granule sizes calculations were conducted using ImageJ (Abramoff et al., 2004). Images were selected at regular time intervals during granulation. The size of the granules were calculated from each image. At the selected time point a section of the image was cropped and the image was converted to a grey scale image. Next contrast enhancement was performed on the image so the individual granules could be identified more clearly. The image was then converted to binary and the watershed function was used to separate any granules which appeared to be stuck together in the 2D image. The particle sizing function was then used to find the size distribution of the granules. The size and circularity settings were chosen so that the results best represented the granules in the image. The results from ImageJ generate a particle area; this was then converted to a particle radius upon the assumption that all the granules are circular in the 2D image. Discrete element model of Mi-Pro
An existing DEM code (Xu and Yu, 1997) was developed to model the MiPro granulator. To accurately recreate the geometry of the MiPro granulator, measurements were taken of the equipment and a CAD (Computer Aided Design) model was constructed. The granulator bowl has a height of 53mm and an inner diameter of 88mm with a rounded bottom. This geometry was a smaller scaled version of the 900 ml bowl used for the acoustic experiments. It was not possible to simulate the actual scale geometry of either bowl due to the large number of particles which would be required to fill then and the computational resources available. The granulator has an impeller which consists of three identical blades, each blade has a horizontal section running along the bottom of the bowl and a vertical section which runs partway up the side of the bowl. Each blade is inclined at 45º. A finite element mesh of the CAD model (Figure 2A) was created, this mesh was incorporated into the existing code using the Finite Wall method (Kremmer and Favier, 2001). To validate the DEM model of the MiPro granulator, dry mixing experiments were performed using high-speed video camera to record the motion of particles; this is possible as the MiPro has a clear bowl. APG Molsiv adsorbent beads were used. These beads were coated with magnesium stearate to improve their flowability and prevent trapping under the blades. The bowl was filled with 50g of these beads and 10 seconds of mixing was recorded (Watson et al., 2009).
Although cohesive forces are crucial in the granulation process these were not considered in this model instead simulations were performed with different particle size and density to represent typical granulation stages. Table 2 shows the simulation properties used. When particle size was changed the total volume of particles was kept constant, resulting in a changing number of particles in the system.
Table 2: Simulation input parameters.
Particle radius 0.5, 0.75, 1, 1.25 mm Particle number 140000, 42000, 18000, 9100 Particle density 1000,1750, 2500 kg/m3 Spring constant 10000 N/m Coefficient of restitution 0.9 Coefficient of friction 0.3 Time step 1.0415 E-6 s Impeller speed 250 RPM Time simulated 2 s

Figure 2: Discrete element model of Mi-Pro. A: finite element mesh. B: particle motion 0.034 seconds after the start of the simulation. Particle radius 1mm, Particle number 18000, particle density 1750 kg/m3.
2.7 Contact frequency
The contact frequencies produce information on how many particle-particle, particle-bowl, and particle-impeller contacts are occurring during the simulation. The contact frequencies will be presented as the number of new contacts occurring in the system against simulation duration. The unit for the contact frequencies is Hz, as they are the number of new contacts occurring per second. The contact frequencies are calculated by summing the number of new contacts that have taken place between two simulation save points, this number is then divided by the time between the two save points to generate the value for the contact frequency. Contact frequencies are calculated for the three different type of contacts listed above. The contact frequencies will be presented as the average value after the first 0.5 seconds of simulation when the system is steady.
3 Results
3.1 AE analysis during granulations in the 1900 ml bowl
A B
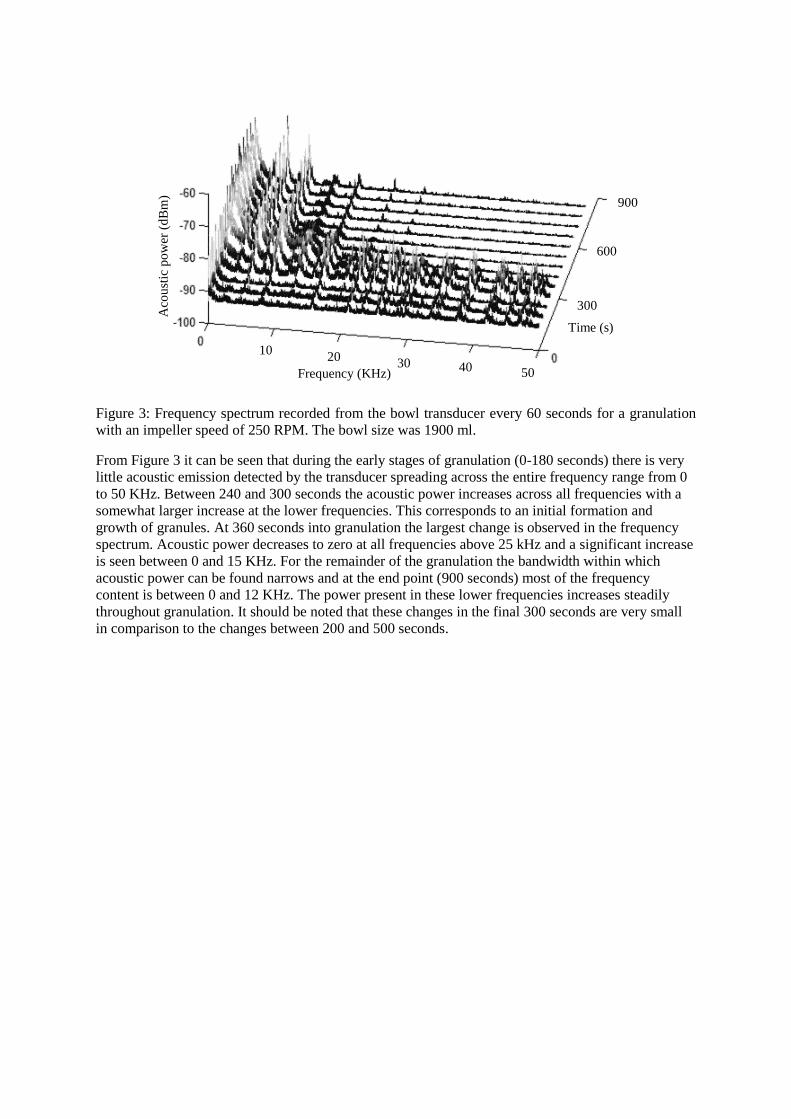
Figure 3: Frequency spectrum recorded from the bowl transducer every 60 seconds for a granulation with an impeller speed of 250 RPM. The bowl size was 1900 ml.
From Figure 3 it can be seen that during the early stages of granulation (0-180 seconds) there is very little acoustic emission detected by the transducer spreading across the entire frequency range from 0 to 50 KHz. Between 240 and 300 seconds the acoustic power increases across all frequencies with a somewhat larger increase at the lower frequencies. This corresponds to an initial formation and growth of granules. At 360 seconds into granulation the largest change is observed in the frequency spectrum. Acoustic power decreases to zero at all frequencies above 25 kHz and a significant increase is seen between 0 and 15 KHz. For the remainder of the granulation the bandwidth within which acoustic power can be found narrows and at the end point (900 seconds) most of the frequency content is between 0 and 12 KHz. The power present in these lower frequencies increases steadily throughout granulation. It should be noted that these changes in the final 300 seconds are very small in comparison to the changes between 200 and 500 seconds.
900
600
300
50 40 30 20 10
Time (s)
Frequency (KHz)
Aco
ust
ic p
ow
er (
dB
m)

Figure 4: Frequency spectrum recorded from the airborne transducer every 60 seconds for a granulation with an impeller speed of 250 RPM. The bowl size was 1900 ml.
Figure 4 shows very little change in the frequency content of the AE recorded from the airborne transducer during the granulation. The most noticeable feature of this figure is the lack of any AE detected except for large spikes at 13, 23, 28 and 38 KHz. These peaks do not vary during the granulation and it is believed they are electromagnetic interference being detected during the granulation. This electromagnetic signal most likely was due to the electronic speed control of the synchronous impeller motor and disappeared when the motor control was switched off. The only other noticeable change in the frequency spectrum is between 300 and 500 seconds but this is all below 5 KHz. This time coincides with when the majority of the change was identified from the bowl transducer. However, this change is not as clear or well defined as the results from the bowl transducer. In general AE experience more attenuation in air than solids which could explain this result. Due to the fewer features in the AE detected from the airborne transducer in comparison to that from the bowl, all of the subsequent AE results will be presented from the bowl transducer.
3.2 Effect of repeatability and impeller speed
For any useful predictive AE system, clearly having an experimental system capable of producing repeatable results is crucial for the process control. Repeatability, and importantly, characterisation of the measurement uncertainties is important to clearly define the operational precision which may be achieved. Figure 5 shows the AE waterfall plots for two granulations under same conditions at three different impeller speeds. From this figure it can be seen that for each impeller speed, the waterfall plots for each granulation are qualitatively very similar. One can note an increasing acoustic power is correlated with a faster impeller speed indicating a higher magnitude of AE. This is not surprising as it is generally expected that systems moving and impacting at higher speeds would produce louder sounds. All impeller speeds show that there is little emission during the early stages of granulation. The power shift to lower frequencies is present for all impeller speeds although the shift does have different features relative to the impeller speed. Faster impeller speed is correlated with a quicker initial onset of the granulation and is accompanied by a larger frequency response. These results indicate that the impeller speed does have an effect on the granulation process although it does not necessaril y imply it has an effect on the final granule properties. It could be speculated that the earlier changes in the waterfall plot indicates that the different stages of granulation occur earlier at the
300
600
900
0 10 0 20 30 40 50
-100
-90
-80
-70
-60
Time (s)
Frequency (KHz)
Aco
ust
ic p
ow
er (
dB
m)

higher impeller speeds. Carson et al. (2008) suggest that the size of impacting particles affect the frequency of the acoustic emission produced. If this hypothesis is adopted the results of Figure 5 would indicate that the slower impeller speed should produce granules of a narrower size distribution as the bandwidth of the frequency content is smaller, this aspect can be further investigated. It is possible that it is not simply the size of the granules which affect the resulting acoustic emission from an impact but, all of the properties of the granule; so the effect of impeller speed on the granules properties is still an issue which is open for debate.
Figure 5: Frequency spectrum of the AE for the same conditions in the 1900 ml bowl during granulation. A and B impeller speed 150 RPM, C and D impeller speed 250 RPM, E and F impeller speed 350 RPM.

Figure 6: Average low frequency against granulation time using the 1900 ml bowl. Impeller speeds; A: 150 RPM, B: 250 RPM, C: 350 RPM. The squares and crosses represent two granulations with identical operating conditions.
Figure 7: Average high frequency against granulation time using the 1900 ml bowl. Impeller speeds. A: 150 RPM, B: 250 RPM, C: 350 RPM. The squares and crosses represent two granulations with identical operating conditions.
Waterfall plots are a useful technique to visually present a great deal of changing acoustic frequency information. However, they are not the best technique for displaying quantitative results of the frequency content of AE. The average frequency is a simple value to represent an entire spectrum and was calculated for the low and high frequency component of the AE. The results in Figures 6 and 7 support our comments that for a given impeller speed the acoustic emissions are repeatable. There is however a significant difference in the results for different impeller speeds and for high and low frequencies.
For the low frequency content of the AE (Figure 6) it was found that at 150 RPM the average frequency generally increased during granulation, whereas for 250 and 350 RPM it was found to reduce. For the high frequency content the average frequency was found to reduce during the first 300
A B C
A B C

seconds of granulation for all impeller speeds. After 300 seconds the average frequency increased at by different amounts at particular times for all impeller speeds, although the results were different for each impeller speed.
The average frequency results suggest that the impeller speed does affect the granulation process within the bowl. If higher frequency is representative of small particles this would suggest that the average frequency will reduce during granulation which was found during the early stages of granulation in the high frequency content. The fact that after this initial stage the average frequencies changed with no general trend for each impeller speed indicates that particle size is not the only factor that affects AE from a granulator.
Table 3: Linear correlation coefficient r between mean frequency data recorded during two separate granulations with identical conditions at a given impeller speed.
150 RPM 250 RPM 350 RPM
Low Frequency 0.918 0.695 0.569
High Frequency 0.845 0.957 0.996
Table 3 Shows that there is moderate to high levels of correlation between the average frequency results for particular impeller speeds. This indicates high levels of repeatability in the AE with lower impeller speeds achieving higher levels of correlation. This indicates that the higher impeller speed might result in a more variable granulation process and would possibly have a wider granule size distribution at all stages of the process. However, it is reasonable to think that the particle contact rate will feature in the AE spectrum and this will fall as particles grow, a consistent feature in all our data. An interesting feature of these results is that correlation increased with faster impeller speeds for the high frequency content yet reduced with faster impeller speeds for the low frequency content.
Between 240 and 360 seconds clear changes were seen in the waterfall plots for all granulations. In their review of the granulation process Iveson et al. (2001) state that the wetted powder form nuclei which coalesce into granules before a steady state regime is reached where granules consolidate and grow. The acoustic results would indicate that in the first 360 seconds the granules are still in the early stages of formation and after this they have all formed and enter into a steady growth regime. This highlights that an AE technique could be used to identify the point at which the granules enter the steady growth regime by looking for the drop to emission in the lower frequency range and the changes in the signal level.
For all impeller speeds studied, the AE had similar features; all showed the broadband noise between 240 and 360 seconds and a shift towards lower frequencies as the granulations continued. Generally the faster impeller speeds had higher magnitude AE. The bandwidth of the AE during the second stage of granulation was wider for the higher impeller speeds. From the work of Leach et al. (1978a) this would suggest a wider granule size distribution although the image analysis results in section 3.4 did not support this finding.
Gamble et al. (2009) also varied impeller speed during granulation in a Mi-Pro. Their results showed that the faster impeller speeds resulted in a larger granule sizes in agreement with our results. They stated that the AE do not fit their prediction model but unfortunately did not comment on how the actual acoustics changed.
The results from the airborne system showed very little AE above 5 KHz most likely due to the attenuation of the signal. Several researchers (Briens et al., 2007; Daniher et al., 2008; Hansuld et al., 2009) found that they could detect changes using airborne systems, possibly as they had the transducers closer to the moving granules or were working in less noisy environments. This issue of

transducer type and location should be given careful consideration as ultimately passive acoustic monitoring systems will be required to operate in noisy industrial environments.
3.3 AE analysis during granulations in the 900 ml bowl
Figure 8: Waterfall plot for two experiments (A and B) both with an impeller speed of 250 RPM in the 900 ml bowl.
Figure 9: Average low frequency against time for the 900 ml bowl at different impeller speeds. A: 150 RPM, B: 250 RPM, C: 350 RPM. Squares and crosses are from two different runs under identical conditions.
B
0 10 20 30 40 50 0 10 20 30 40 50
Time (s) Time (s)
Aco
ust
ic p
ow
er (
dB
m)
Aco
ust
ic p
ow
er (
dB
m)
Frequency (KHz) Frequency (KHz)
A
A B C

Figure 10: Average high frequency against time for the 900 ml bowl at different impeller speeds. A: 150 RPM, B: 250 RPM, C: 350 RPM. Squares and crosses are from two separate experiments under similar conditions.
Qualitatively the waterfall plots for two granulations at 250 RPM in the 900 ml bowl appear very similar (Figure 8). They both highlight that the majority of the AE are in the lower frequency range (less than 5 KHz). Both granulations show an increase in acoustic emissions in this lower range as the granulations progress. Between 180 and 300 seconds the AE has frequency content across the entire range studied. For both runs there is also a large rise in the frequency content at approximately 40 KHz which is present for the entire granulations. This was caused by electromagnetic interference from the synchronous impeller motor. It should be noted that different motors were used for granulations in the different sized bowls.
When making a comparison between the waterfall plots for the 1900 ml and 900 ml bowls there are several features to note; Both have the majority of the acoustic emissions in the lower frequency range, for the 900 ml bowl this is below 7 KHz whilst as for the 1900 ml bowl this is extended to over 10 KHz. the changes in the frequency content of the AE is significantly more noticeable for the 1900 ml bowl. Both of the bowls show broadband emissions between 240 and 360 seconds. The frequency content at 40 KHz seen in the 900 ml bowl was not present in the 1900 ml bowl. Both bowl sizes show that the average frequency of the emissions increases in the later stages of granulations although the actual values for the average frequencies do not appear similar.
The average frequency of the low frequency content of the AE in the 900 ml bowl is between 5 and 20 Hz for all of the granulations for the first 300 seconds (Figure 9). After this time the average frequency of the low frequency content increases and fluctuates although there is no general trend or repeatability between any of the granulations. In contrast the average frequency of the high frequency content of the AE in the 900 ml shows most change during the first 300 to 500 seconds after which it reaches a stable value (Figure 10). During this initial stage the average frequency is found to be higher than for the rest of the granulation. Although this feature is found in all of the average frequency results from these granulations the actual values and nature of the fluctuations are different for all of the granulations. These results indicate that during the early stages of granulation the high frequency range is the most suitable range to monitor the granulation whereas after the granules have formed and are growing the lower frequency range would be more appropriate.
The correlation coefficient r was calculated for the average low frequency and the average high frequency for the two granulations at 250 RPM. The correlation coefficient for the average low frequency was 0.0995 and the correlation coefficient for the average high frequency was 0.0520.
A B C

These values indicate that the average frequency results for the granulations in the 900 ml bowl at an impeller speed of 250 RPM have no correlation. This is in contrast to the results from the 1900 ml bowl which showed in some cases a high level of correlation and repeatability.
It should be remembered that with the 900 ml it was not possible to use the spray nozzle and instead the water was added by slow rate water droplet deposition. This may result in localised over wetted regions and result in a wide granule size distribution and an unrepeatable granulation method.
Figure 11: RMS voltage of the acoustic emission against granulation time in the 900 ml bowl. Impeller speeds A: 250 RPM, B: 250 RPM, C: 150 RPM, D: 350 RPM.
The RMS voltage of the emission is a measure of the magnitude of the AE and was measured for the granulations from the 900 ml bowl (Figure 11). For all of the granulations in the 900 ml bowl the RMS voltage of the AE show some similar trends. From the start of the granulation the RMS voltage increases until peaking at around 100 seconds. The RMS voltage then reduces until around 300 seconds where after the change does not appear to be consistent for any of the different granulations. For the first granulation at 250 RPM and the granulation at 350 RPM after this minimum at 300 seconds the RMS voltage steadily rises throughout granulation, for the first 250 RPM run this increase stops just before 600 seconds when it suddenly reduces. It is interesting to note that the average frequency results for the first 250 RPM run and the 350 RPM run were very similar suggesting a possible link between the RMS voltage and the average frequency of the AE. The second granulation at 250 RPM and the granulation at 150 RPM both have a second peak in the RMS voltage around 450 seconds. It is interesting that all granulations have this first peak, which coincides with the time where the broadband emission is observed in the waterfall plots. Research had shown (Iveson et al., 2001)
A B
C D

that during the early stages of granulation once a quantity of liquid is available the granules begin growing offering a potential explanation.
The RMS voltage results also show that the magnitude of the first RMS peak voltage is approximately 0.6 mV for all of the granulations but the values of the RMS voltage towards the end of the granulation is impeller speed dependent. Generally the faster the impeller speed the higher the RMS voltage of the emission towards the end of the granulation, however there is a noticeable difference for the two identical granulations at 250 RPM.
The RMS voltage of the AE is averaged over 50 sections of recorded emission and the mean is presented. The standard deviation is displayed in the error bars. It can be seen from Figure 11 that the standard deviation is greater in the final stages of granulation; this is particularly the case for the 350 RPM granulation. This change shows that there is a greater variation in the emission once the granules have actually formed. If the transducer is detecting granule contacts on the bowl in close proximity, the variance would indicate a large variety in the types of contacts occurring at this location. These variable contacts could be due to either different types of contacts or granules with varying properties and suggest that the granules in the 350 RPM granulation have more variability in size and properties. Our results share some similarities with research conducted by Whitaker et al. (2000) and Gamble et al. (2009) who found an increase in the magnitude of the AE during granulation. Papp et al. (2008) found a peak in the RMS voltage during the early stages of granulation for the two granulators they studied.
Rahmanian et al. (2008) found that a faster impeller speed resulted in stronger granules which could be responsible for the higher RMS voltage of the AE. Using a different granulator and powder combination, Mangwandi et al. (2010) found that an increase in impeller speed also resulted in an increase in granule size but only when a high viscosity binder was used. When they used water as a binder, an increase in impeller speed resulted in smaller granules.
For the two bowl sizes studied, the acoustic results appeared similar although more features and changes were identifiable in the 1900 ml bowl. From these results it is difficult to make any clear statements of the effect that bowl size has on AE. One surprising result is the large variation in AE from granulations with identical operating conditions in the 900 ml bowl. It is the authors’ belief that this is primarily due to the different binder addition method. It is generally accepted (Iveson et al., 2001) that spray nozzles are the most suitable binder addition method, with the correct operating parameters, this should lead to uniform wetting of the powder bed resulting in a narrow final size distribution. A droplet deposition method can lead to localised over wetted regions resulting in granules with more available liquid. Granules with more available liquid will grow quicker resulting in some extremely large granules in the final size distribution (Mort and Tardos, 1999). Briens et al. (2007) also studied the effect of bowl size on AE from granulators and in agreement with our work found that a larger bowl size had more distinct changes in the AE during granulation. This is encouraging and shows potential for the scaling up of an AE monitoring technique.
3.4 High speed camera work 900 ml bowl
A B C

Figure 12: Images of granulation at impeller speed 350 RPM in the 900 ml bowl. A: 300 seconds, B: 600 seconds. C: final granules in bowl.
Figure 13: Average particle radius against granulation time for the 900 ml bowl. Impeller speed, A: 150 RPM, B: 250 RPM, C: 350 RPM.
The intention of the high speed camera recording was to capture the formation and growth of the granules during an entire granulation. Unfortunately this was not possible as during the early stages the powder stuck to the internal wall of the bowl. This can be seen in the top part of the bowl in Figure 12 a. Only once this powder had been removed by the flowing granules could they be imaged and subsequently sized. The time it took for the granules to become visible was different for the impeller speeds used and can be seen as the starting time of the results in Figure 13. In general, the faster impeller speed resulted in the stuck powder being removed from the bowl wall earlier in the process.
Figure 12 (b and c) show that during the granulations, some extremely large and undesirable granules are present. It is believed that these are due to large, initially over wetted granules due to the dripping method of water addition. These large granules were only observed for the granulation at 350 RPM and could explain the increase in the variance in the RMS AE level (Figure 11). The results for the average particle radius show that 250 and 150 RPM have granules of approximately 0.7 to 0.75 mm in radius whereas the 350 RPM granulations have a larger radii of around 1.1 to 1.2 mm. For the 250 and 150 RPM granulations there is a slight trend towards increasing particle radius with time. For the granulation at 350 RPM the granules are largest at 350 seconds and then reduce. It is not possible to compare these results with the granulations with the other impeller speed as the granules could not be seen at this point in time. Qualitatively linking the high speed photography and RMS voltage of the AE would show that the larger granules produce a higher magnitude of AE. This result is not surprising as you would expect larger objects to generate louder sound upon impact as long as the rest of their properties (e.g. density) remained unchanged.
The image analysis did show the presence of large granules. These would be caused by over wetting of a small number of granules and would explain the large amount of variability in the AE results in the 900 ml bowl. The large granules were most common for the 350 RPM impeller speed where the largest variation was seen in the RMS voltage of the AE. The fact that a small number of large granules had a significant effect on the AE is important as it suggests that AE monitoring could be an easy way of identifying the presence of large undesirable granules in the process.
This work is the first to attempt to link AE features from high shear granulators to granule size recorded online using high speed photography. Although high speed photography was not useful for
A B C

the earlier stages of granulation due to the sticking of the powder to the internal surface of the bowl, it has demonstrated the benefits that this technique could offer with further well designed experiments. The image results were mainly collected towards the end of granulation and no clear increase or decrease in granule size was identified. This result is not surprising as it is known that granules often reach a steady state where growth rates are balanced with breakage and attrition rates and no net increase in overall size is observed. The results show that the faster impeller speeds generally produced large granules.
3.5 Contact frequencies
Figure 14: Particle bowl contact frequencies for 1 mm size, density 1750 Kg/m3, impeller speed 250 RPM.
Table 4: Contact frequencies from simulations with varying particle radius and density
Particle Size (mm)
Particle Density (Kg/m3)
Particle-particle Contact frequency (MHZ)
Particle-bowl Contact frequency (MHZ)
Particle-impeller Contact frequency (MHZ)
0.5 1750 1000 20 2.2
0.75 1750 190 6 0.6
1 1750 45 2.2 0.3
1.25 1750 15 1.1 0.2
1 1000 58 2.8 0.3
1 2500 48 2.1 0.22
At the start of the simulation the particle-bowl contact frequency rises to 2.3 MHz before dropping the 1.6 MHZ and then settling around a value of 2.35 MHz (Figure 14). This sudden rise and fall is the result of the initial impeller motion moving the particles to the upper region of the Mi-Pro and out of contact with the bottom of the bowl. Once the particles fall a steady state system is reached and the contact frequency settles around a steady value. The DEM simulation results presented in Table 4
Time (s)
Con
tact
Fre
que
ncy
(MH
z)
0 2 4 6 8 100.0
0.5
1.0
1.5
2.0
2.5

indicate that the particle-particle contacts are the highest during the simulations followed by the particle-bowl and finally particle-impeller. This result is due to the fact that the particles will always be in contact with other particles whereas particle-bowl and particle impeller contacts only occur when the particles are touching this part of the equipment. The particle size was found to have a larger effect on the contact frequency than the particle density. With smaller particles all types of contact frequencies would increase due to the larger number of particles in the system. An increase in particle density resulted in a reduction in all type of contact frequencies. The particle size and density had the greatest effect on the particle-particle contact frequencies mainly due to the larger number of these types of contacts.
It is noticeable that the contact frequencies in all cases except particle - impeller are well above the upper limit of detection for our AE systems. At 220kHz, it is possible that we are seeing low frequency components from particle impeller contacts in our measurements but this component is unlikely to be transmitted to the transducer on the bowl due to attenuation in the air, however a component involving a particle-impeller contact, followed by a particle bowl contact would be transmitted to the bowl sensor and if this is the case, we would expect to see more emission above 20KHz at the higher impeller speeds, which is consistent with the data presented in Figure 5.
4 Conclusion
Acoustic emission monitoring of high shear granulators is an economic and non invasive method which can yield a vast amount of information on the process if intelligent experimental and data analysis procedures are followed, together with careful control over the operating parameters of the granulator. The literature has shown that there is no general accepted method for either data acquisition or analysis in this sector. This work has studied the frequency content and signal level of the AE detected by a contact transducer whilst recording the granules size online using high speed photography. A computational model was built using the discrete element method and used to present information relating to the number of contacts in the system. The high speed photography and computational modelling are used to understand the recorded changes in the AE. Without the combination of the computational modelling and the high speed photography it would be difficult to interpret the AE from the complex granulation process. The computational model was used to produce information relating to how granule size and density would affect the number of contacts in the system. These granule properties are known to change during granulation and the individual contacts are events which generate the AE. Understanding how these contacts change during granulation will help interpret the AE results. To gain greater insight into the process high speed photography was used to image the granules adjacent to the bowls walls. This visual information of granule size and location at different stages of the granulation process again produced information which could be used to interpret the AE results and allow us to assess the effectiveness of this process monitoring technique.
The AE results for frequency content show two clear stages up to and after 360 seconds. It is believed that this is the initial wetting of the powder and the granule formation followed by more steady growth period. A high level of repeatability was obtained for the 1900 ml bowl although this was not achieved for the 900 ml bowl where the spray nozzle was not used. Our results have shown that when very large granules are present, the variation in the AE changes significantly, suggesting that a system could be developed to identify when large granules are present in an industrial granulator. Scale is always an important issue in granulation as experiments are often performed on small lab or pilot scale equipment where the system is ultimately required for a full scale system. Our results for scale are promising as similar features are observed for both size bowls at all impeller speeds studied and in fact improved repeatability was observed for the larger bowl size.
Transducer type, location and operating frequency become important with scale and although there are many contradicting opinions on the most suitable configuration, a sensible approach would be to use multiple transducers with wider frequency ranges to collect as much information as possible and reveal more about the granulation process whilst minimising noise. The most suitable frequency range

to record and analyse the AE from granulation is still a topic for debate. The results of this study would suggest that using different frequencies ranges for different stages of the process may be appropriate. During the early stages of granulation where the dry powder is wetted and the nuclei form, the higher frequency range may be best. Once the granules have begun growing then the lower frequency range becomes more sensitive to the changing properties of the granules. Our computational modelling work also supports this theory as it was found that the number of contacts in the system would reduce as the particles increase in size and density.
The high speed photography work demonstrated the benefits of this technique although it could only view the granules at the later stage of the process. Generally larger granules produce a high magnitude of AE across a broader frequency range. Further work in the area should continue with the combination of AE monitoring and online high speed photography as the technique shows promise for understanding what is responsible for the AE from a high shear granulator. With appropriate experimental design it should be possible to develop a method where the granule size can be monitored throughout the entire process and help to further understand the changes observed in the AE. This should lead to the development of a process monitoring tool that can be used in industry. It should not be forgotten that ultimately, industry requires a process monitoring tool which can be used at full scale in noisy environments; this should always be considered when performing further research in this area.
The effect that bowl size, impeller speed and binder addition method had on the AE was studied in this work. For all process variable studied the passive acoustic monitoring system was capable of identifying the initial wetting and then granule growth stages of granulation. The results indicated that the bowl size and binder addition method had a greater effect on the acoustic emissions that the impeller speed. By linking the high speed photography with the AE a monitoring system has been developed which can be used to study the effect of process variables on granulation.
This work has shown that AE monitoring can be beneficial for process monitoring of wet granulation. Although no clear link was identified between granule size and AE, the technique was capable for identify different stages of the process. For example there were clear changes in the AE between the initial wetting and nucleation stage and the granule growth stage. When localised over wetting occurred and resulted in a small number of very large granules (as identified form the high speed photography images) large changes in the variation of the recorded AE were present. This highlights the benefit of AE techniques for identifying these large undesirable granules or other faults in the process. The combination of computational modelling with high speed photography resulted in a greater understanding of the AE results. With further modifications and appropriate statistical analysis the technique could be developed further to, monitor actual granule properties and be used as a more effective granulation monitoring system.
Acknowledgements
The author would like to thank the EPSRC and AstraZeneca for the financial support of this project, and the EPSRC equipment loan pool for the high speed camera used.
References
Abramoff, M.D., Magalhaes, P.J., Ram, S.J. (2004) "Image Processing with ImageJ". Biophotonics International, volume 11, issue 7, 36-42.Ennis, B. J. & Litster, J. D (1997) Particle size enlargement. Perry’s Chemical Engineers handbook 7th edition, 20-89.
Briens, L., Daniher, D. & Tallevi, A. (2007) Monitoring high-shear granulation using sound and vibration measurements. International Journal of Pharmaceutics, 331, 54-60.
Carson, G., Mulholland, A. J., Nordon, A., Tramontana, M., Gachagan, A. & Hayward, G. (2008) Particle sizing using passive ultrasonic measurement of particle–wall impact vibrations. Journal of Sound and Vibration, 317, 142–157.
Chandratilleke, G. R., Yu, A. B., Stewart, R. L. & Bridgwater, J. (2009) Effects of blade rake angle and gap on the particle mixing in a cylindrical mixer. Powder Technology, 193, 303-311.

Cundall, P.A. & Strack, O.D.L. (1979) Discrete numerical-model for granular assemblies. Geotechnique, 29, 47-65.
Daniher, D., Briens, L. & Tallevi, A. (2008) End-point detection in high-shear granulation using sound and vibration signal analysis. Powder Technology, 181, 130-136.
French, A. P. (1983) In vino veritas: A study of wineglass acoustics. American journal of Physics, 5, 688-694.
Gamble, J. F., Dennis, A. B. & Tobyn, M. (2009) Monitoring and end-point prediction of a small scale wet granulation process using acoustic emission. Pharmaceutical Development and Technology, 14, 3, 299-304.
Hansuld, E. R., Briens, L., McCann, J. A. B. & Sayani, A. (2009) Audible acoustic in high-shear wet granulation: Application of frequency filtering. International Journal of Pharmaceutics, 378, 37-44.
Hansuld, E. M., Briens, L., Sayani, A. & McCann, J. A. B. (2011) Monitoring quality attributes for high-shear wet granulation with audible acoustic emissions. Powder Technology, 215-216, 117-123.
Hansuld, E. M., Briens, L., Sayani, A. & McCann, J. A. B. (2012) An investigation of the relationship between acoustic emissions and particle size. Powder Technology, 219, 111-117.
Holm, P., Schaefer, T. & Kristensen, H. G. (1985) Granulation in high-speed mixers Part VI. Effects of process conditions on power consumption and granule growth. Powder Technology, 43, 225-233.
Iveson, S. M., Litster, J. D., Hapgood, K. & Ennis, B. J. (2001) Nucleation, growth and breakage Phenomena in agitated wet granulation processes: a review. Powder Technology, 117, 3-39.
Knight, P. C., Instone, T., Pearson, J. M. K. & Hounslow, M. J. (1998) An investigation into the kinetics of liquid distribution and growth in high shear mixer agglomeration. Powder Technology, 97, 246-257.
Kremmer, M. & Favier, J. F. (2001) A method for representing boundaries in discrete element modelling - part 1: Geometry and contact detection. International Journal for Numerical Methods in Engineering, 51, 1407-1421.
Kuo, H. P., Knight, P. C., Parker, D. J., Adams, M. J. & Seville, J. P. K. (2004) Discrete element simulation of a high shear mixer. Advanced Powder Technology, 15, 3, 297-309.
Leach, M. F., Rubin, G. A. & Williams, J. C. (1978a) Analysis of a gaussian size distribution of rigid particles from their acoustic emission. Powder Technology, 19, 189-195.
Leach, M. F., Rubin, G. A. & Williams, J. C. (1978b) Particle size characterisation from acoustic emissions. Powder Technology, 19, 157-167.
Mangwandi, C., Adams, M. J., Hounslow, M. J. & Salman, A. D. (2010) Effect of impeller speed on mechanical and dissolution properties of high-shear granules. Chemical Engineering Journal, 164, 305–315.
Mort, P. R. & Tardos, G. (1999) Scale-up of agglomeration processes using transformations. Kona, 17, 64-75.
Nakamura, H., Miyazaki, Y., Sato, Y., Iwasaki, T. & Watano, S. (2009) Numerical analysis of similarities of particle behaviour in high shear mixer granulators with different vessel sizes. Advanced Powder Technology, 20, 5, 493 – 501.
Papp, M. K., Pujara, C. P. & Pinal, R. (2008) Monitoring of high-shear granulation using acoustic emission: Predicting granule properties. Journal of Pharmaceutical Innovation, 3, 113-122.
Rahmanian, N., Ghadiri, M. & Ding, Y. (2008) Effect of scale of operation on granule strength in high shear granulators. Chemical Engineering Science, 63, 915 – 923.
Rantanen, J., Lehtola, S., Ramet, P., Mannermaa, J. & Yliruusi, J. (1998) On-line monitoring of moisture content in an instrumented fluidised bed granulator with a multi-channel NIR moisture sensor. Powder Technology, 99, 2, 163-170.
Sato, Y., Okamoto, T. & Watano, S. (2005) Scale-up of high shear granulation based on agitation power. Chemical and Pharmaceutical Bulletin, 53, 1547-1550.
Sato, Y., Nakumura, H. & Watano, S. (2008) Numerical analysis of agitation torque and particle motion in a high shear mixer. Powder Technology, 186, 130-136.

Sinnott, M. & Cleary, P. (2003) 3D DEM simulations of a high shear mixer. Third International Conference on CFD in the minerals and Process Industries CSIRO, Melbourne, Australia.
Staniforth, J. N., Walker, S. & Flanders, P. (1986) Granulation monitoring in a high speed mixer/processor using a probe vibration analysis technique. International Journal of Pharmaceutics, 31, 277-280.
Staniforth, J. N. & Quincey, S. M. (1986) Granulation monitoring in a planetary mixer using a probe vibration analysis technique. International journal of pharmaceutics, 32, 177-185.
Stewart, R. L., Bridgwater., J, Zhou, Y. C. & Yu, A. B. (2001) Simulated and measured flow of granules in a bladed mixer – a detailed comparison. Chemical Engineering Science, 56, 5457-5471.
Talu, I., Tardos, G. I. & Ruud van Ommen, J. (2001) Use of stress fluctuations to monitor wet granulation of powders. Powder Technology, 117, 149-162.
Thorne, P. D. & Foden, D. J. (1988) Generation of underwater sound by colliding spheres. Journal of the Acoustical Society of America, 84, 6, 2144 - 2152.
Watano, S., Terashita, K. & Miyanami, K. (1991) Determination of end point with a complex granulation applying infrared moisture sensor. Chemical and Pharmaceutical Bulletin, 39, 1013-1017.
Watson, N., Xu, B. H., Ding, Y., Povey, M. J. W., Reynolds, G. K., Claybourn, M. & Weir, S. (2009) DEM simulation of particle motion in a MiPro granulator. Proceedings of the 6th international conference on micromechanics of granular media. AIP conference proceedings, 1145, 679-682.
Watson, N (2010) Discrete element analysis of granular flows in a MiPro lab scale granulator. PhD Thesis, University of Leeds.
Whitaker, M., Baker, G. R., Westrup, J., Goulding, P. A., Rudd, D. R., Belchamber, R. M. & Collins, M. P. (2000) Application of acoustic emission to monitoring and end point determination of a high shear granulation process. International Journal of Pharmaceutics, 205, 79-91.
Xu, B. H. & Yu, A. B. (1997) Numerical simulation of the gas-solid flow in a fluidized bed by combining discrete particle method with computational fluid dynamics. Chemical Engineering Science, (16), 2785-2809.
Zhou, Y. C., Yu, A. B. & Bridgwater, J. (2003) Segregation of binary mixture of particles in a bladed mixer. Journal of Chemical Technology and Biotechnology, 78, 187-193.
Zhou, Y. C., Yu, A. B., Stewart, R. L. & Bridgwater, J. (2004) Microdynamic analysis of the particle flow in a cylindrical bladed mixer. Chemical Engineering Science, 59, 1343-1364.