acoustic characterization of turbochargers and pipe
TRANSCRIPT

I
KTH CCGEx
Acoustic Characterization of Turbochargers and Pipe Terminations
Heiki Tiikoja
Licentiate Thesis
Stockholm, Sweden 2012 KTH CCGEx
The Marcus Wallenberg Laboratory for Sound and Vibration Research Department of Aeronautical and Vehicle Engineering
Postal address Visiting address Contact Royal Institute of Technology Teknikringen 8 +372 5153464 MWL/AVE Stockholm [email protected] SE-10044 Stockholm Sweden

II
Akademisk avhandling som med tillstånd av Kungliga Tekniska Högskolan i Stockholm framlägges till offentlig granskning för avläggande av teknologie licentiatexamen måndag den 13 april 2012 kl 10 i Seminarierum Mekanik, Brinellvägen 32, Kungliga Tekniska Högskolan, Vallhallavägen 79, Stockholm. TRITA-AVE 2012:07 ISSN 1651-7660 ISBN 978-91-7415-828-1 © Heiki Tiikoja 2012 Universitetsservice US-AB, Stockholm 2012

III
Abstract In search for quieter engines there is a need for a better understanding of the acoustic properties of engine intake and exhaust system components. Besides mufflers which have the purpose of reducing pressure pulses originating from the internal combustion (IC) engine, there are many components in a modern car exhaust and intake system, e.g., air-filters, coolers, catalytic converters, particulate filters - all having an effect on the pressure pulses or sound field in the system. In this work the focus is on the turbocharged IC-engine where both, sound scattering (reflection and transmission) and sound generation from automotive turbochargers are studied. In addition, sound reflection from an open ended pipe, such as the tailpipe of an IC-engine exhaust is investigated. Accurate and efficient methods to fully characterize turbochargers by measuring the acoustic two-port have been developed. Compared to earlier work, a number of modifications are suggested for improving the quality of the results. A study on three different automotive turbochargers is also presented, including data for sound scattering for both the compressor and turbine. The results for the transmission of sound, which is of interest for the ability of a turbocharger to reduce noise coming from the engine, is plotted for all tested cases against a dimensionless frequency scale (Helmholtz-number). This makes it possible to generalize the result in order to draw conclusions about the behavior for any turbocharger. The sound generation was also studied and three different methods to estimate the sound power are suggested. The methods were used to investigate sound generation at different operating points and identify source mechanisms for a turbocharger compressor. An accurate method for measuring the reflection of plane acoustic waves from a pipe termination in a duct with hot gas flow has been developed and tested. Representing the acoustical conditions at an exhaust tail-pipe, the data obtained is important for effective modeling of exhaust systems. The experimental results of the reflection coefficient were compared with Munt`s theory on flow duct openings. The measurements were carried out for air jet velocities up to Mach 0.4 and for flow temperatures up to 100°C in order to study temperature effects on the reflection properties. It was concluded, that the experimental results agree well with the Munt theory. Keywords: acoustical two-port, turbocharger, transmission loss, sound generation, compressor, turbine, IC-engine, inlet system, exhaust system, flow duct, duct termination, reflection coefficient.

IV
Licentiate thesis This licentiate thesis consists of an introduction with a summary and the following papers: Paper I H. Tiikoja, H. Rämmal, M. Åbom and H. Bodén “Sound Transmission in Automotive Turbochargers”, Society of Automotive Engineers (SAE) Technical Paper Series, Paper no. 2011-01-1525, 2011. Paper II H. Tiikoja, H. Rämmal, M. Åbom and H. Bodén “Investigations of Automotive Turbocharger Acoustics” SAE International Journal of Engines, 4:2531-2542; doi:10.4271/2011-24-0221, Print ISSN: 1946-3936, August 2011. Paper III H. Tiikoja, H. Rämmal, J. Lavrentjev, M. Åbom “Investigation of Sound Reflection from a Hot and Subsonic Flow Duct Termination”, submitted to Journal of Sound and Vibration, March 2012. Other related publications (not included in the thesis): J. Lavrentjev, H. Tiikoja “Investigation of Wave Propagation and Radiation in Ducts with Arbitrary Environment by Using the Three-microphone Method”, Proceedings of the 37th International Congress and Exposition on Noise Control Engineering (INTER-NOISE 2008), Shanghai, 26-29 October , 2008, China. H. Rämmal, H. Tiikoja, M. Åbom, H. Bodén “Experimental Facility for the Complete Determination of Sound Transmission in Turbochargers”, Society of Automotive Engineers (SAE) Technical Paper Series, Paper no. 2010-01-1424, 2010. H. Tiikoja, H. Rämmal, M. Åbom, H. Bodén “Testrig for Complete Acoustic Characterization of Turbochargers”, Proceedings of the 31th International AIAA Aeroacoustics Conference, Stockholm, 07-09 June, 2010, Sweden. H. Rämmal, J. Lavrentjev, H. Tiikoja „On the Acoustic Reflection at Pipe Opening”, Proceedings of the 17th International Congress on Sound and Vibration (ICSV 17), Cairo, 18-22 July, 2010, Egypt. J. Lavrentjev, H. Rämmal, H. Tiikoja “The Passive Acoustic Effect of Automotive Catalytic Converters”, Society of Automotive Engineers (SAE) Technical Paper Series, Paper no. 2011-24-0219, 2011.

V
Division of work between the authors: The methodology to carry out the acoustic characterization of turbochargers was proposed by M. Åbom and H. Bodén. The measurements and data analysis was carried out by H. Tiikoja. Development of the rig, including all the LabVIEW coding and the creation of a automated measurement process and data collection system, was performed by H. Tiikoja. Rig improvements to increase the quality of the data were suggested developed and tested by H. Tiikoja. H. Tiikoja wrote the papers under the supervision of H. Rämmal (TUT & KTH), M. Åbom (KTH), H. Bodén (KTH) and J. Lavrentjev (TUT). The work in this thesis was supported by: Support from the Competence Centre for Gas Exchange (CCGEx) at KTH in Stockholm is acknowledged. Volvo Car Corporation and GM Powertrain are acknowledged for providing turbochargers for the investigations. Also support from the Estonian Science Foundation (Grant nr 7913) is acknowledged.

VI
Table of Contents
1 Introduction ....................................................................................................................... 1
2 Turbochargers ................................................................................................................... 2
2.1 Turbocharger acoustics ......................................................................................................... 5
2.2 Measurement techniques ....................................................................................................... 5
2.2.1 Passive properties of the turbocharger ........................................................................... 6
2.2.2 Active properties of the turbocharger ............................................................................. 7
2.3 Virtual operating system for turbocharger test facility at KTH .............................................. 7
2.4 Improvements of measurement techniques ........................................................................... 9
2.4.1 Anechoic terminations ................................................................................................... 9
2.4.2 Strong acoustic excitation source .................................................................................. 10
2.4.3 Two source method with simultaneous excitation ........................................................ 13
2.5 Results for acoustic characterization of turbochargers ......................................................... 14
2.5.1 Passive part .................................................................................................................. 15
2.5.2 Active part ................................................................................................................... 16
3 Open pipe terminations ................................................................................................... 17
3.1 Test-rig for measuring acoustic reflections under hot flow conditions ................................. 17
3.2 Method to determine reflections ......................................................................................... 19
3.3 Results ................................................................................................................................ 20
4 Summary of the papers .................................................................................................... 21
4.1 Paper I. Sound Transmission in Automotive Turbochargers ................................................ 21
4.2 Paper II. Investigation of Automotive Turbocharger Acoustics ............................................ 21
4.3 Paper III. Investigation of Sound Reflection from a Hot and Subsonic Flow Duct Termination ............................................................................................................................. 21
5. Conclusions and future research ..................................................................................... 22
6. Acknowledgments ........................................................................................................... 22
References .......................................................................................................................... 23
1
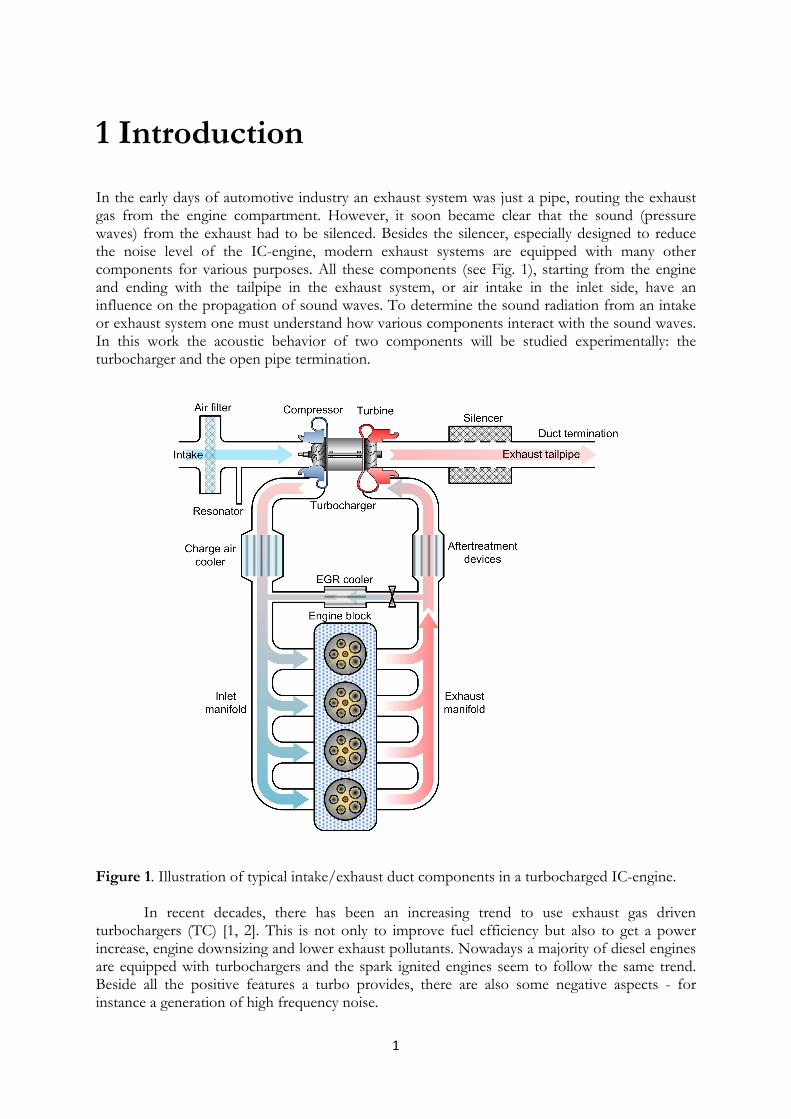
1 Introduction In the early days of automotive industry an exhaust system was just a pipe, routing the exhaust gas from the engine compartment. However, it soon became clear that the sound (pressure waves) from the exhaust had to be silenced. Besides the silencer, especially designed to reduce the noise level of the IC-engine, modern exhaust systems are equipped with many other components for various purposes. All these components (see Fig. 1), starting from the engine and ending with the tailpipe in the exhaust system, or air intake in the inlet side, have an influence on the propagation of sound waves. To determine the sound radiation from an intake or exhaust system one must understand how various components interact with the sound waves. In this work the acoustic behavior of two components will be studied experimentally: the turbocharger and the open pipe termination.
Figure 1. Illustration of typical intake/exhaust duct components in a turbocharged IC-engine. In recent decades, there has been an increasing trend to use exhaust gas driven turbochargers (TC) [1, 2]. This is not only to improve fuel efficiency but also to get a power increase, engine downsizing and lower exhaust pollutants. Nowadays a majority of diesel engines are equipped with turbochargers and the spark ignited engines seem to follow the same trend. Beside all the positive features a turbo provides, there are also some negative aspects - for instance a generation of high frequency noise.

2
Commonly, studies about TC mainly concentrate on efficiency, thermodynamics and fluid dynamics; the acoustics of these devices have often been left out of consideration. Noise is of important for heavy duty vehicles where the compressor whine, related to the blade passing frequency, has been reported as a problem. Also other noise related issues originating from critical flow conditions (surge) can cause problems motivating research on this issue. Another motivation for experimental investigation is to validate existing TC numerical models to predict passive acoustic properties. There have been attempts to model the passive acoustic affect for a turbocharger [3,4]. The measurement and models gave relatively good correlation up to a mid-frequency range. In order to improve existing models for higher frequencies and to understand the acoustical behavior for turbochargers there is a need for further investigation. Reflection from the open pipe termination is a classical problem in acoustics and a theoretical model for the case with flow was published in 1990 by Munt [5]. This problem is important since the reflection properties of such a pipe are exactly what determine the sound radiation from an exhaust tailpipe. Still there is a lack of accurate experimental data for validating Munt´s model, which is the motivation for the study presented here.
2 Turbochargers The main parts of an exhaust driven turbocharger are shown in figure 2, where the compressor consists of the compressor housing (volute) to collect compressed air and direct it to the engine by using the compressor wheel. The turbine wheel is used to convert exhaust energy into shaft power to drive the compressor and is surrounded by the turbine housing that collects exhaust gases and directs them to the turbine wheel.
Figure 2. Turbocharger with a centrifugal compressor (left) and a radial turbine (right).

3
Figure 3. Turbocharger rotor assembly with the characteristic parameters. The main components of the rotor assembly are impeller, rotor and connecting rod (see Fig. 3). The inducer diameter is defined as the diameter where the air enters the wheel and the exducer diameter where the air exits the wheel. Based on aerodynamics and air entry paths the inducer for a compressor wheel is the smaller diameter, whereas for a turbine wheel the inducer is the larger diameter. Trim is a common term used to describe the turbocharger. More accurately, it is an area ratio to express the relationship between the inducer and exducer and for both turbine and compressor wheels is calculated as: 2( / ) 100Trim Inducer Exducer= ⋅ (1)
Another geometric characteristic used to describe turbocharger housing size is A/R (Area/Radius) ratio, defined as the inlet (for compressors discharge) cross-sectional area divided by the radius from the turbo connecting rod centerline to the centroid (perpendicular of that area).
Figure 4. Illustration of housing showing A/R ratio.

4
Figure 5. Parts of the compressor map. In order to describe the performance characteristics of a particular turbocharger, the compressor and turbine maps are introduced. In figure 5 an example of typical compressor map with the main components is shown. Corrected mass flow rate on the x-axis of the compressor map in figure 5 represents the mass of air flowing through a compressor per second and can be calculated as
*1 1( 273.15) / 302.78 / ( / 96.17)c cW W T p= + , where 1cT is the temperature and 1cp is the
absolute pressure in compressor inlet respectively. Pressure ratio on the y-axis is defined as the absolute outlet pressure (compressor discharge pressure) divided by the absolute inlet pressure. Turbocharger speed lines are lines of constant speed and between these lines, speed can be estimated by interpolation. By increasing the turbocharger rotational speed, the pressure ratio- and/or mass flow rate increases. These three parameters have mainly been used in this thesis to describe the operational points of the turbocharger during the acoustic measurement. The surge line is defined as the left hand boundary (see Fig. 5) of the compressor map. The region on the left of this line represents flow instabilities and can lead to premature turbocharger failure due to heavy thrust loading. To keep the compressor out of surge bypass or blow-off valves are used. These valves allow the airflow, at critical conditions, to be re-circulated back to the compressor inlet or directed to the atmosphere. The choke line is the right hand boundary of the compressor map (see Fig. 5). Choke is typically defined by the line where the efficiency drops below a certain level but also related to the fact that choked flow conditions are reached. Beside the surge line on the left and choke line on the right, the compressor map is also limited by the maximum rotational speed line on the top.
5
Finally, efficiency lines are concentric regions on the maps where the line near the center represents peak efficiency and as the rings move out from center, the efficiency drops until the surge and choke limits are reached. 2.1 Turbocharger acoustics The acoustics of any fluid machine [6] for instance a turbocharger can be separated in to the active and passive part. The passive properties (reflection and transmission) refer to the scattering of acoustic waves while the active represents the sound generation of the machine. The reflection and transmission at a fluid machine will be affected both by variations in geometry (area changes) as well as changes in temperature (speed of sound) and density, in addition flow related losses will create acoustics losses. The transmission part of the scattering, often expressed in dB-s as a so called transmission loss (TL), can be directly related to the damping of sound waves passing the machine. For turbochargers one issue of interest is the added damping for pressure waves originating from the engine. This means that for the turbine the transmission loss in the downstream direction and for the compressor in the upstream is of interest. A turbocharger is also a sound source, producing high frequency aerodynamic noise. Because of the relatively good damping characteristics of modern mufflers on the exhaust side, the noise of the turbocharger is believed to mainly originate from the intake side. Although the noise from the compressor can effectively be reduced by air intake filters, high frequency tones can still radiate from the pipes connected to the compressor. Relatively few studies have been performed in the field of centrifugal compressors and much of the theory of the sound generation mechanisms comes from the study of axial fans. In the overview of turbocharger acoustics [7] Rämmal and Åbom included a summary of the aerodynamic sound generation mechanisms in rotating machines. In [8] Raitor and Neise performed an experimental study on a larger centrifugal compressor and measured the radiated sound field up to 50.000 rpm. It was concluded, that the main aerodynamic noise generating mechanisms are tonal noise at blade passing frequencies, buzz-saw noise and blade tip clearance noise. For normal operation the blade passing frequency is normally dominating the noise from turbochargers, in particular on the compressor side. This is true for heavy duty vehicles, but for light duty vehicles, because of the high rpm of the turbochargers, the blade passing frequency will be above the audible range. The buzz-saw noise appears at supersonic tip speeds and is associated with shock waves moving with the blades. This produces a set of harmonics at multiples of the rpm [8]. Tip clearance noise is associated with secondary flow effects around the blade tip or flow separation at the blade [8]. These effects are in particular important at low mass flow rates and close to the surge line and will cause a broad band peak typically at around 50% of the blade passing frequency. 2.2 Measurement techniques The experimental study in this work can be regarded as a continuation of the turbocharger investigations made by Rämmal [9], where the main focus was on the compressor side. In the rest of this chapter the theory for the experimental technique is summarized and the improvements made in the procedure as compared to the earlier work are explained.

6
2.2.1 Passive properties of the turbocharger Measurement techniques to determine plane wave acoustic scattering properties as a function of frequency can be important in many applications. In this study, an acoustical two-port measurement technique [10] was implemented to study automotive TC compressors and turbines (see Fig. 6).
Figure 6. Schematic representation of a turbocharger tested as an acoustic two-port. The acoustic pressure p is measured at four positions and A and B are external sources (loudspeakers) used to excite the system from the up- or downstream side. The plane wave acoustic two-port [6] contains 4 complex quantities at each frequency describing how incoming acoustic waves are reflected and transmitted through the acoustic element (“passive part”). In addition the two-port contains an active part describing the sound generation. To experimentally determine these unknowns at least two microphones in the inlet and outlet side must be used to decompose acoustic pressure waves propagating in positive p+ and negative p− direction so the two-port can be represented as:
Active partPassive part
11 12
21 22
s
sa a a
sb b bp pS p
p p pS SS Sp p p
++
+ − +
+ − +
−
⎡ ⎤⎡ ⎤ ⎡ ⎤⎡ ⎤= ⋅ + ⎢ ⎥⎢ ⎥ ⎢ ⎥⎢ ⎥
⎢ ⎥⎣ ⎦⎣ ⎦ ⎣ ⎦ ⎣ ⎦ (2)
where a refers to the inlet and b to the outlet side of the two-port, the superscript s refers to source strength (“active part”), the plus and minus signs indicate propagation outwards and into the two-port respectively, 11 22, S S and 12 21, S S describe the reflection and transmission of the incoming waves respectively. To obtain the S matrix elements the acoustic state variables on the inlet and outlet side must be measured for two independent test cases. These test cases are created by using acoustic sources on the inlet and outlet side leading to the so-called two-source technique [10]. By performing the two different test cases, we can express Eq. 2 in measurable quantities as:
11 12
21 22
I II I IIea ea ea eaI II I IIeb eb eb eb
S SH H H HS SH H H H
+ + − −
+ + − −
⎡ ⎤ ⎡ ⎤⎡ ⎤=⎢ ⎥ ⎢ ⎥⎢ ⎥⎣ ⎦⎣ ⎦ ⎣ ⎦
(3)

7
where eH is the transfer function taken between the microphone signal and a reference signal, e.g. loudspeaker voltage, and the superscript indicates the loudspeaker signal used (I – loudspeaker A used as a reference, II – loudspeaker B used as a reference). It can be noted that the contribution from the uncorrelated source in the turbocharger itself will cancel out in Eq. (3). As the transmission loss (reduction of acoustic power) is one suitable property describing the damping of sound when passing an object, it is widely used in engineering to characterize intake and exhaust system components. The transmission loss is directly related to the transmission part of the S-matrix elements and can be calculated as follows:
( )( )( )
( )
2
2 212
2
2 221
1, upstream
110 log 10 log
1, downstream
1
b b a a
a a b bin
tr a a b b
b b a a
M A c
M A c SWTLW M A c
M A c S
ρ
ρ
ρ
ρ
⎧ +⎪
+⎪⎛ ⎞ ⎪= ⋅ = ⋅ ⎨⎜ ⎟⎝ ⎠ +⎪
⎪+⎪⎩
(4)
where ρ is the air density, M is the Mach number, A is the cross-sectional area of the pipe, c is the speed of sound and inW , trW are the incident and transmitted acoustic powers respectively. 2.2.2 Active properties of the turbocharger Beside damping or attenuating sound a turbocharger is also a source of sound, generating high frequency narrow band sound related to the rotational speed of the impeller. The sound generation in the plane wave range, which normally is well below the range of the harmonics produced, is mainly of interest for conditions close to surge where low frequency noise can be produced. By following the procedure described by Lavrentjev et al. [11] the source strength part of the two-part can be determined. Here another approach was adopted to also capture the source strength beyond the plane wave range. Assuming that the reflections in the test rig terminations are small or can be surpressed by spatial averaging, it is suggested that the strength of acoustic modesG++ propagating in the duct away from the source can be estimated as:
Re /mnm n
G G N++→
⎡ ⎤= ⎢ ⎥
⎣ ⎦∑ (5)
where mn is the pressure cross-spectrums between a pair of pressure transducers and N is the number of spectra.
2.3 Virtual operating system for turbocharger test facility at KTH Due to the complexity of the measurement process, it was decided to develop a purpose built data acquisition (DAQ) and control program for the turbocharger experiments (see Fig. 7). The DAQ and control of the test-rig was operated via a National Instruments (NI) cRIO DAQ board and PC based virtual instruments programmed in LabVIEW.

8
Figure 7. Graphical user interface for the acoustic turbocharger test-rig at KTH/CCGEx lab. For acoustic- and static pressure signals acquisition NI 9234 and NI 9205 modules were used. The NI 9211 module was used to read thermocouple signals by using K-type thermocouples, centrally mounted into both the compressor and turbine inlet and outlet pipes. In order to monitor turbo rotational speed an eddy-current turbocharger speed measurement system (DZ135) together with the NI 9401 module was used. To control the loudspeakers, sine wave and random acoustic excitation were provided by software based signal generators in the NI cRIO through the NI 9263 module. To adjust the boost pressure in the compressor outlet duct an electronically controlled and pneumatically driven throttle valve was implemented. The entire measurement process was computer-based and fully automated. Final results were plotted in real time - directly after the measured data was available. Besides acoustic data, all the turbocharger measurement condition parameters were monitored in real time and saved for later analysis (see Fig. 8 and Fig. 9). In addition, it was also possible to follow the operation point measured on the compressor and turbo map in real time.
0 500 1000 1500 2000 2500 3000 3500 400020.6
20.7
20.8
20.9
21
21.1
21.2
21.3
Time [sec]
Com
pres
sor i
nlet
tem
p. [d
eg]
Figure 8. Temperature drift in the compressor inlet duct: measured temperature (blue solid line) and averaged temperature (red dashed line).

9
1.4 1.45 1.5 1.55 1.60.05
0.055
0.06
0.065
0.07
Pressure Ratio (tot/stat) P1T/P2T
Cor
rect
ed g
as tu
rbin
e flo
w [k
g/s]
Figure 9. Deviation of the turbine operating point during a measurement. 2.4 Improvements of measurement techniques Experimental characterization of the acoustical properties of turbochargers is a challenging task, especially at the operating conditions where devices like turbochargers are designed to work. To improve the measurement technique developed earlier by Rämmal [9] a number of aspects had to be considered. Because of the harsh environment inside the pipe, stronger acoustic excitation had to be developed in order to improve the signal-to-noise ratio, especially for turbine measurements. Other improvements were related to the quality of the measured data by implementing a two-source method with simultaneous excitation and better anechoic terminations. 2.4.1 Anechoic terminations The passive two-port measurement technique (Eq. 3) does not assume anechoic terminations, but the quality of the active results will improve if the terminations are as reflection free as possible. In practice, it is unfortunately challenging to build perfect anechoic terminations. It requires horns that become quite large in dimensions for low frequencies. For the KTH-CCGEx rig a termination with some absorption was first obtained by simply using a commercial dissipative car silencer. In order to handle the increased pressure on the compressor outlet and turbine inlet the silencers at these positions were reinforced. The reflection coefficient for this type of termination, which was used in all the measurements reported by Rämmal [9], is shown in figure 10.

10
500 1000 1500 2000 2500 30000
0.2
0.4
0.6
0.8
1
Frequency [Hz]
Mag
nitu
de o
f ref
lect
ion
coef
ficie
nt [-
]
Figure 10. Anechoic termination measurement results: black dotted line is dissipative muffler, red and blue solid lines represent rubber hose with length of 4.7 m and 18.7 m respectively. In order to reduce the reflections further it was decided to test rubber hoses as terminations and the results are also shown in figure 10. As can be seen, a very good result could be obtained from an 18.7 m rubber hose, where the oscillations in the result correspond to the length of the hose. In order to get the best anechoic terminations for the TC test-rig it was decided to combine a 20 m rubber hose with the dissipative mufflers. It must be noted here that during the measurement session there are also loudspeaker sections connected via side-branches to the inlet and outlet pipes giving an extra reflection. This is the reason why these side branches should be designed as short as possible or be removed when the loudspeakers are not used. 2.4.2 Strong acoustic excitation source Measurement of acoustic two-port data is a difficult task when the flow velocity in the measurement duct is high because of the flow noise contamination of the measured pressure signals. Here, similarly to in the Johnson and Fuller paper [12] a number of electro-dynamic drivers were used in order to maximize sound pressure level. An acoustic excitation was provided by an electro-dynamic driver (DAS ND-8) driven by a software-based signal generator trough the amplifier. It was important to choose loudspeakers powerful enough to dominate over the noise level inside the pipe. The loudspeakers used were equipped with titanium diaphragm to avoid dome fracture due to mechanical fatigue which is common in other diaphragm materials. Also, titanium diaphragms were selected to withstand the high temperatures encountered in the test sections. Finally, choosing neodymium magnets guarantees negligible magnetic strength loss at the highest operating temperatures. To avoid nodes and antinodes at the source cross-section it was decided to use three excitation sources simultaneously. The separation between the loudspeakers was chosen by using the golden cut ratio, to guarantee that there is always at least one loudspeaker that could excite the system. The loudspeakers were connected via side branches where the connecting area was perforated (>30% to be acoustically transparent) and to reduce flow separation and instabilities. The length of the side branch was designed as short as possible to reduce any reflections. The loudspeakers were modified to operate in high pressure conditions. It was vital to remove all leakages trough the loudspeaker casing especially with high temperature conditions, where the flow through the casing can heat up the driver. Some modifications made to avoid such problems were replacing the driver housing with gaskets and, to avoid damage to the

11
membrane due to sudden static pressure changes, connecting the driver back and front with a narrow tube to equalize the pressure.
Figure 11. Picture showing the loudspeakers with modifications. The drivers were also designed to resist high temperature, going up to 160 °C during the measurements. Cooling was arranged via a water-cooled gasket placed between pipe and loudspeaker (see Fig. 11). With this solution there was enough cooling capacity to keep the temperature in a normal range over a long period of time. Beside the loudspeakers, all pressure transducers used were water-cooled as well. Because of the separation between the loudspeakers, wave cancellation will occur unless the signals are phase shifted so that the resulting waves all interfere constructively. For each frequency in the measurement, one loudspeaker was taken as reference and the phase difference relative to the other two was measured by comparing the transfer functions from the loudspeaker input voltage to the microphone response. This phase difference was then applied during the actual measurement, to phase shift the signals fed to the loudspeakers.
200 400 600 800 1000 1200 1400 16000
50
100
150
200
250
300
350
400
Frequency [Hz]
Pha
se c
orre
ctio
n [d
eg]
Figure 12. Phase shift measured between two loudspeakers relative to the first loudspeaker. The results before and after applying the phase compensation can be seen in figure 13. By using all three loudspeakers and the phase shift technique the sound wave amplitude propagating in the positive direction is maximized as expected.

12
200 400 600 800 1000 1200 1400 160070
75
80
85
90
95
100
Frequency [Hz]
Tran
sfer
func
tion
p+/e
[dB
]
Figure 13. Pressure wave amplitude propagating in positive direction (p+) relative loudspeaker voltage (e): one loudspeaker was playing (green dashed line), three loudspeakers without phase shift calibration (red dotted line) and three loudspeakers by applying phase shift (blue solid line).
Figure 14. Test rig to find maximum p+ value. In order to get the maximum sound pressure level (SPL) from the loudspeakers, it was important to run these drives close to maximum excitation level. Here, this was defined as a certain maximum electric power fed to the loudspeakers, which will guarantee that they are not overloaded and damaged. To measure the power output fed to each speaker, a custom made power meter was used (see Fig. 14). Due to the variation in input (radiation) impedance at the different loudspeaker positions the actual power fed to the speakers can vary significantly (see Fig. 16). To keep a constant level for all excitation frequencies as close as possible to the maximum allowed, a Proportional-Integral-Derivative (PID) feedback loop was set using the NI cRIO unit. As the name suggests, a PID algorithm consists of three basic parts; multiplication with a constant, integration and derivativation, where the constant and the time scales for integration and derivation are set to minimize the error (see Fig. 15). The error, being the difference between the actual output and the desired of the system under control, was here the power fed to a loudspeaker. The PID output signal was then used to modify the voltage signal output from the NI cRIO unit which via the amplifier drives the loudspeakers (see Fig. 14).
13
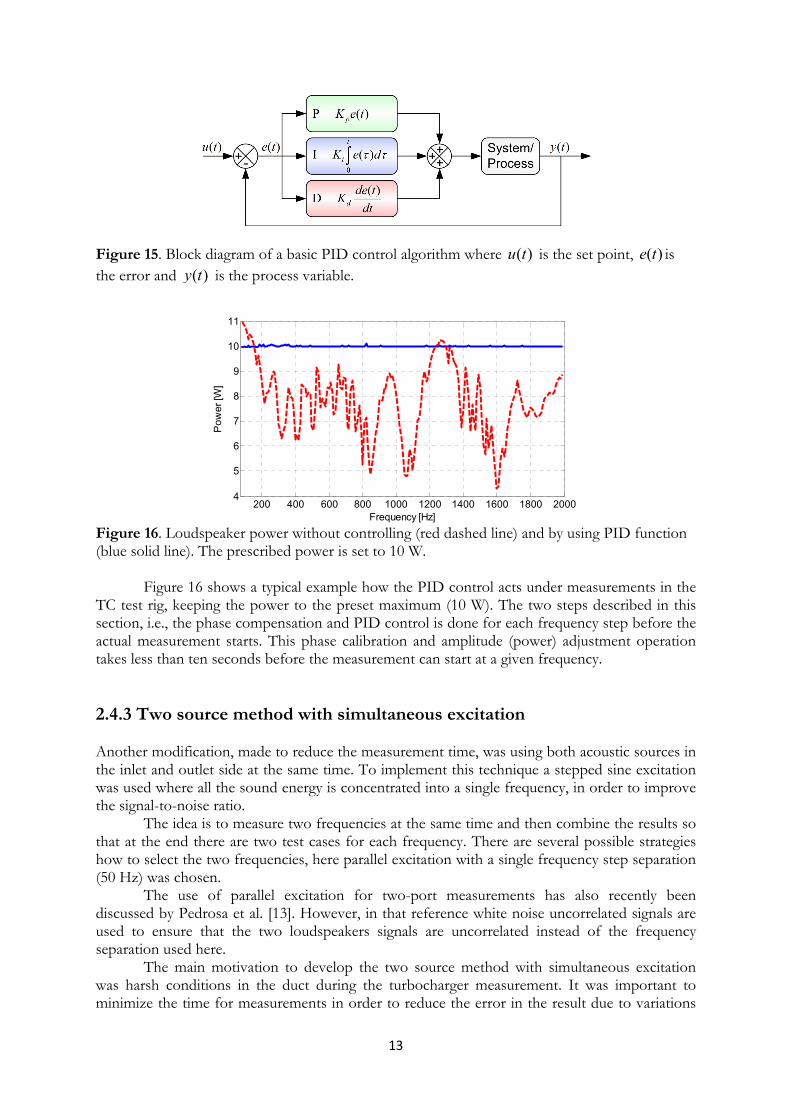
Figure 15. Block diagram of a basic PID control algorithm where ( )u t is the set point, ( )e t is the error and ( )y t is the process variable.
200 400 600 800 1000 1200 1400 1600 1800 20004
5
6
7
8
9
10
11
Frequency [Hz]
Pow
er [W
]
Figure 16. Loudspeaker power without controlling (red dashed line) and by using PID function (blue solid line). The prescribed power is set to 10 W. Figure 16 shows a typical example how the PID control acts under measurements in the TC test rig, keeping the power to the preset maximum (10 W). The two steps described in this section, i.e., the phase compensation and PID control is done for each frequency step before the actual measurement starts. This phase calibration and amplitude (power) adjustment operation takes less than ten seconds before the measurement can start at a given frequency. 2.4.3 Two source method with simultaneous excitation Another modification, made to reduce the measurement time, was using both acoustic sources in the inlet and outlet side at the same time. To implement this technique a stepped sine excitation was used where all the sound energy is concentrated into a single frequency, in order to improve the signal-to-noise ratio. The idea is to measure two frequencies at the same time and then combine the results so that at the end there are two test cases for each frequency. There are several possible strategies how to select the two frequencies, here parallel excitation with a single frequency step separation (50 Hz) was chosen. The use of parallel excitation for two-port measurements has also recently been discussed by Pedrosa et al. [13]. However, in that reference white noise uncorrelated signals are used to ensure that the two loudspeakers signals are uncorrelated instead of the frequency separation used here. The main motivation to develop the two source method with simultaneous excitation was harsh conditions in the duct during the turbocharger measurement. It was important to minimize the time for measurements in order to reduce the error in the result due to variations

14
of the operating point (see Fig. 9). By using the simultaneous excitation method, it was possible to reduce the time for a measurement by a factor two or alternatively take twice as many averages. In article [12] it was also stated that the problem of excessively long experiments in flow ducts is the variation of experimental conditions and by using the method suggested it was possible to reduce the error. Using the stepped sine and loudspeaker excitation method described above, it is possible to measure conditions like temperature (see Fig. 8) and pressure for each frequency point separately and minimize the error in the final result even more, making this method preferable for these kind of measurements. 2.5 Results for acoustic characterization of turbochargers In Paper I and Paper II an investigation of automotive turbochargers acoustics are presented. In Paper I results for the passive acoustic effect are presented for three turbocharger compressors (A, B and C, see below) and turbocharger B and C turbines. In Paper II analysis of active measurement results of the turbocharger B compressor are also presented.
Turbocharger CTurbine Compressor
Turbocharger BTurbine Compressor
Turbocharger ATurbine Compressor
Figure 17. Photos of the turbine and compressor of turbochargers A, B and C.
Turbocharger KKK K24 Garret GT1752 Garret GT1749VA B C
TurbineA/R ratio 0,41 0,47 0,42Scroll inlet diameter [mm] 52 40 43Approximate scroll length [mm] 300 285 380Number of rotor blades 12 9 9Radius of the rotor [mm] 29 22 21Rotor length [mm] 21 20 25CompressorScroll outlet diameter [mm] 41 43 38Approximate scroll length [mm] 460 358 370Number of rotor blades 6+6 6+6 5+5Radius of the rotor [mm] 31 26 25Rotor length [mm] 25 20 18
Figure 18. Technical data of the three turbochargers investigated. Turbocharger A was a Volvo car turbocharger KKK K24 also used for the compressor passive measurements performed by Rämmal [9]. Compared to turbocharger A, turbocharger B was smaller in dimensions.

15
Turbocharger C was a variable turbine geometry (VTG) type and both compressor and turbine passive properties were characterized. Three different turbine inlet geometry settings (VTG positions) were tested. First, the VTG was kept closed which is used in practice to raise the pressure upstream the turbine, thus the exhaust gas energy is raised at low engine speeds. Secondly, a fully opened VTG position was used corresponding to high engine speeds to avoid over-boosting and high engine backpressure. Third, a position was chosen where the VTG was kept 50% opened. 2.5.1 Passive part In order to determine the working conditions of the turbocharger an operating map provided by the manufacturers was followed. Different static operating points were selected to systematically cover the region of the map where the turbocharger is normally operated. Transmission loss data up to the cut-on frequency at different operating points (OP) for turbocharger B compressor can be seen in figure 19.
500 1000 1500 2000 2500 30000
5
10
15
20
25
30
35
40
Frequency [Hz]
Tran
smis
sion
Los
s [d
B]
500 1000 1500 2000 2500 30000
5
10
15
20
25
30
35
40
Frequency [Hz]
Tran
smis
sion
Los
s [d
B]
Figure 19. The transmission loss for the turbocharger B compressor where red line represents OP1, blue line is OP2, green line is OP3, grey line is OP4 and purple line is OP5, respectively. All the results for the passive acoustic effect for turbocharger turbines and compressors are presented in Paper I and Paper II. In order to generalize and make results useful for any turbocharger independent of size, it can be plotted against the Helmholtz-number:
0.1 0.2 0.3 0.4 0.5 0.6 0.70
5
10
15
20
25
30
35
40
45
Helmholz number (ka)
Tran
smis
sion
loss
(dB
)
Figure 20. The transmission loss results for different turbocharger compressors (upstream direction) and turbines (downstream direction) as a function of the Helmholtz-number.

16
2 /He k a fa cπ= ⋅ = , where f is the frequency, a is the radius and c is the speed of sound. To calculate the Helmholtz number an average value of the inlet and outlet duct data was used for the radius and the speed of sound. In Paper I, based on figure 20 it was concluded that for the low frequency region ( 0.2)He < the transmission loss (TL) level, which is almost constant, is determined by the losses and the value will increase with mass flow. The mid-frequency region (0.2 0.35)He< < gives an increase, which is determined by the inner free air volume of the unit that acts as a small expansion chamber muffler. This means, the larger the volume, the faster the increase. In the high frequency range ( 0.35)He > TL peaks start to appear, associated with resonances due to open/closed bypass gates and with cancellation associated with different sound paths through the blade sections [4]. 2.5.2 Active part In Paper II the sound generated by the compressor has been investigated. Experiments were performed on the turbocharger B compressor to obtain the radiated pressure spectra. In figure 21 a comparison of sound pressure spectral densities between OP3 and OP4 is shown. Two operating points have been measured by using the same mass flow rate but the RPM level was different. The difference between the results is mainly a shift in the blade passing frequency (BPF) peaks: / 60BPF n RPM= ⋅ (6) where RPM is rotational speed per minute and n is number of blades. Besides the impeller BPF, which was the main source of noise, RPM harmonics can be detected and the second highest mode was at double BPF. The broadband noise is more or less unchanged except for a 5 dB increase for OP3 on the outlet side.
0 0.5 1 1.5 2 2.5x 10⁴
20
40
60
80
100
120
140
Frequency (Hz)
Sou
nd p
ress
ure
(dB
)
0 0.5 1 1.5 2 2.5x 10⁴
20
40
60
80
100
120
140
Frequency (Hz)
Sou
nd p
ress
ure
(dB
)
Figure 21. Comparison of sound pressure spectral densities between OP3 (blue line) and OP4 (red line) in inlet side (left) and outlet side (right).

17
0 0.5 1 1.5 2 2.5x 10⁴
20
40
60
80
100
120
140
Frequency (Hz)
Sou
nd p
ress
ure
(dB
)
0 0.5 1 1.5 2 2.5x 10⁴
20
40
60
80
100
120
140
Frequency (Hz)
Sou
nd p
ress
ure
(dB
)
1st BPF
2nd BPF
1st BPF 2nd BPFTCN
TCN
0.20
1.0
3.0
80000
120000140000
3
4
5
21
Figure 22. Comparison of sound pressure spectral densities between OP4 (red line) and OP5 (blue line) in inlet side (left) and outlet side (right). A comparison of sound pressure spectra densities between OP4 and OP5 (constant RPM) is shown in Fig. 22. Close to the surge line (OP5) the tip clearance noise becomes more dominant. Up to 10000 Hz the average difference between the OP4 and OP5 auto-spectrum levels is as large as 20 dB.
3 Open pipe terminations In Paper III experimental investigations of the acoustic plane wave reflection have been carried out in order to validate an existing theory on sound reflection and radiation from pipe or duct openings. The influence of the Mach number on the sound reflection properties at the pipe termination was analytically studied by Munt in [5] using a linear theory and by including a so called Kutta condition. Munt’s model was first to predict values for the plane wave (pressure) reflection coefficient, that exceed unity at low frequencies with a flow (jet) out from the pipe. Although it is believed that the Munt model [5] is presently the most accurate available and the model often is used for predictions of acoustical properties of duct terminations, it has still only partly been validated by published experimental data. Some earlier experimental investigations show a good agreement with Munt´s model under cold jet conditions, see e.g., Allam and Åbom [14]. In that reference data was published for mean flow conditions up to 0.2M < and 1.3k a⋅ < for room temperature air flow. In addition, a successful validation of the Munt theory was performed by Rämmal and Lavrentjev [15] up to 500 °C for very low flow speeds (<5 m/s). In [16] the same authors extended the flow speed range and reported measurements for a hot jet up to 200 °C and flow speeds up to 100 m/s. The purpose of the study in Paper III was to further extend the data range reported in Refs. [14-16] and to improve the accuracy of the measurements. This was achieved by further developing the standard two-microphone technique for experiments in hot environments. 3.1 Test-rig for measuring acoustic reflections under hot flow conditions A dedicated test-rig (see Fig. 23) was built in Tallinn University of Technology (TUT) to investigate the acoustic wave reflection in air jets with temperatures ranging from room

18
temperature up to 100 °C and flow speeds up to 130 m/s. For the pressure transducers it was decided, to improve the signal-to-noise ratio, to work with ½ inch condenser microphones rather than the often used ¼ inch ones. The microphones were modified with water cooling jackets to be able to use them under high temperature conditions. Heat exchange between the pipe and the water-cooled microphone holders was reduced by using a thermal isolation layer. A random acoustic excitation was provided by an electro-dynamic driver (DAS ND-8) mounted 1.7 m away from the duct opening. The driver vas controlled by software based signal generator in LabVIEW. Signal acquisition was performed by a NI signal analyzer PCI-4474 and a purpose built PC based virtual instrument in LabVIEW.
Figure 23. A sketch of the experimental set-up for the measurements in TUT.
Figure 24. A photo of the experimental set-up used for the measurements of acoustic wave reflection at the duct termination. A stainless steel duct with a total length of 2.0 m was used as a test section. In order to approach the assumption of infinitely thin wall thickness used in Munt’s theoretical model a duct with relatively larger inner radius (a=48.8 mm) was used. The thickness of the wall was 2 mm which leads to a ratio a/a0>0.96 (where a is the inner- and a0 is the outer radius of the pipe).

19
3.2 Method to determine reflections By following the three-microphone method with the reference position 1( 0)x = at microphone 1, the sound field at the microphones can be represented by solving the nonlinear system of equations expressed as: 1 1 1( ) ( ) ( )p f p f p f+ −= + (7)
2 1 2 1 2( ) ( )exp( i ) ( )exp(i )p f p f k x p f k x+ + − −= − + (8)
3 1 3 1 3( ) ( )exp(i ) ( )exp( i )p f p f k x p f k x+ + − −= + − (9) where, 1p , 2p and 3p are the Fourier transforms of the acoustic pressure at microphone cross-sections, x represents the microphone positions (see Fig. 23), k is the wave number and can be obtained as 2 / ( (1 ))k f c Mπ± = ⋅ ± , f is the frequency, c is the speed of sound and M is the Mach number, − and + denotes propagation in negative and positive x-axis direction. In order to have the same frequency range, the same microphone separation 2 1 1 3x x x x s− = − = was used. The nonlinear system of equations was solved in MATLAB by using the fsolve function and three unknowns p+ , p− and c . In order to avoid large sensitivity to errors in the input data the method was used in a frequency range suggested by Boden and Åbom in [17]:
( ) ( )2 20.1 1 0.8 1M ks Mπ π− < < − (10) The cut-on frequency for the circular duct was calculated by using the equation: 1.841 / (2 )cf c aπ= ⋅ ⋅ ⋅ (11) The model, proposed by Dokumachi [18] was used to include the effect of visco-thermal damping and the wave numbers was obtained from:
0
0
21Kfk
c K Mπ
± = ± (12)
Here the coefficient K0 is given by:
0 2 2
(1 i) ( 1) i 1 11 1 122
Kss
γ γ γ γξ ξ ξ
⎛ ⎞ ⎛ ⎞− − − −= + + − + −⎜ ⎟ ⎜ ⎟
⎝ ⎠ ⎝ ⎠ (13)
where γ is the ratio of specific heats, 2 /p thCξ μ κ= is the Prandtl number, μ is the dynamic
viscosity, pC is the specific heat coefficient, thκ is the thermal conductivity, 0 /s a ρ ω μ= is the shear wave number, a is the duct radius, 0ρ is the ambient density and ω is the angular frequency.

20
The reflection coefficient at reference cross section 1( 0)x = was obtained as:
)()()(
1
10 fH
fHfR+
−= (14)
Finally the reflection coefficient R0 is transferred to the duct termination 4 1( )x x l− = cross-section: 0 exp(i( ) )lR R k k l+ −= + (15) 3.3 Results In figure 25, measurement results for the magnitude and phase of the reflection coefficient are plotted as a function of the Helmholtz number ( )2 /ka fa cπ= and compared with Munt`s theory [5]. A good correlation between the measured and calculated values was achieved up to a Helmholtz number 1.8. The reflection coefficient values above unity ( )1R > in figure 25 were explained in [5] by the interaction between the acoustic wave and an unstable vortex sheet leaving the duct opening. The Kutta condition, applied at the edge of the pipe, determines the strength of this interaction.
0 0.2 0.4 0.6 0.8 1 1.2 1.4 1.6 1.80
0.2
0.4
0.6
0.8
1
1.2
Helmholtz number, ka
Mag
nitu
de o
f ref
lect
ion
coef
ficie
nt
0 0.2 0.4 0.6 0.8 1 1.2 1.4 1.6 1.850
100
150
200
Helmholtz number, ka
Pha
se o
f ref
lect
ion
coef
ficie
nt
Figure 25. The magnitude and phase of the reflection coefficient for an open duct termination as a function of the Helmholtz number ka=2πfa/c for different flow speeds and jet temperatures; Experiments: 40°C, 130m/s (green squares); 35°C, 100m/s (blue circles); 27°C, 60m/s (red stars); 21°C, 0m/s (black triangels). Munt’s theory: 40°C, 130m/s (green line); 35°C, 100m/s (blue line); 27°C, 60m/s (red line); 21°C, 0m/s (black line).

21
4 Summary of the papers 4.1 Paper I. Sound Transmission in Automotive Turbochargers In this paper the results of an experimental study of the passive acoustic properties for three different automotive turbochargers are presented. The unique experimental test facility at KTH/CCGEx is presented and used to study sound transmission through automotive turbocharger turbines and compressors at different operating conditions. Experimental procedures to determine the acoustic two-port data, together with techniques such as phase matching the loudspeaker outputs to improve the quality of data are introduced. Results for the passive acoustic effect from a number of experiments on three different modern automotive turbochargers are presented. Moreover, the results are re-plotted against the Helmholtz number and conclusions on the behavior of the transmission loss curves are drawn in order to make them useful for any turbocharger independent of the size. 4.2 Paper II. Investigation of Automotive Turbocharger Acoustics Compared to Paper I, this paper includes studies of both the passive and active acoustic effect. For the passive part also scattering matrix results are presented and discussed. Furthermore, a simple quasi-stationary model is proposed to explain the unsymmetrical behavior of the transmission loss (up- versus downstream). It is argued that it is related to the losses in the system. It is also suggested to apply a power balance [19] in future works to study if there are regions, for instance close to surge, where the compressor can amplify incident sound waves. The active part or the sound generation is also studied by using an average based on measured pressure cross-spectra. This method is applied to study sound produced by a compressor at various operating points and the results are discussed and compared with earlier published work [8]. 4.3 Paper III. Investigation of Sound Reflection from a Hot and Subsonic Flow Duct Termination A three-microphone procedure for measurements in hot flow ducts with temperature gradients is proposed and applied to study an open termination. Measurements to determine the plane wave (pressure) reflection coefficient and phase for a circular duct is then performed up to Mach 0.4 and jet temperatures up to 100°C. The results are presented in the full plane wave range and all together, Paper III extends the parameter range of previous published data [14-16]. The results are compared with the theory of Munt [5] widely used in aeronautical applications and a good agreement is found. Similar to earlier investigations [14] a better agreement with the theory is achieved, by using the maximum flow speed value for the theory of Munt rather than the cross-section average.

22
5. Conclusions and future research Concerning the investigation of turbocharger acoustics the technique for measuring the passive data in the plane wave range in form of a two-port or scattering matrix has been perfected with the work presented here (Paper I). The next step would be to extend the test range to include high amplitude (> 150 dB) pulsation levels for the incident pressure waves in order to study non-linear wave interaction effects. This cannot be done using electrodynamic drivers, instead other more powerful pulsation sources, e.g. oscillating valves, must be used. Concerning the active part or sound generation from turbochargers only the first steps have been taken with the results presented in Paper II. In that paper a method based on an average of pressure cross-spectra was proposed to estimate the auto-spectrum of the modes propagating out from the source. This quantity is related to the acoustic power propagating, but the relation depends on how the acoustic energy is distributed over the propagating modes, which is unknown. Therefore more studies are needed to validate and determine the accuracy of this method. The method should then be applied to study in more detail how phenomena such as surge affect the emitted noise signature. The last part of the thesis concerns a method for accurate measurements of reflection coefficient data in hot flow ducts using a three microphone approach. The next step in this would be to extend the range for the experiments to higher temperatures, which requires a much more powerful heat source. Also one part of Munt´s model that is still not validated with accurate measurements is the radiated field outside the duct.
6. Acknowledgments This work was financially supported by the Competence Centre for Gas Exchange (CCGEx) through the Swedish Energy Agency, Swedish vehicle industry and KTH. This study would not have been possible without the support of many people. I am very grateful to my supervisors Prof. Mats Åbom and Prof. Hans Bodén from MWL for the guidance and help during the work and giving me the opportunity to participate in this work. My third supervisor and also the head of the CCGEx lab Dr. Nils Tillmark is greatly acknowledged for his support and for making sure the lab always is well organized. I sincerely thank Prof. Jüri Lavrentjev from TUT for supervising me since my Bachelor’s degree up to now. Dr. Hans Rämmal is also greatly acknowledged – without his assistance this study would not have been successful. Special thanks for technical help go to Danilo Prelevic and Kent Lindgren from MWL and I would also like to thank Kim Karlström and Göran Rådberg from the Mechanics department for their help and advice in building the rig. All the seniors at MWL and CCGEx for the courses given are also acknowledged. I would like to thank PhD students from CCGEx and MWL for interesting discussions and invaluable assistance, also the traditional “fika” times, Grease-Tuesdays and “innebandy”. Not to forget Fredrik Laurantzon and Malte Kjellander for introducing me to the Swedish classic circuit. It was great to share this memorable experience with you. Finally, and most importantly, I would like to thank my wife Kertu for her support and comprehension through the duration of my studies.

23
References [1] Watson, N., Janota, M. S., “Turbocharging the Internal Combustion Engine,” Macmillan Publishers Ltd., London, 1982. [2] Baines, N., “Fundamentals of Turbocharging,” Concepts NREC, White River Junction, 2005.
[3] Rämmal, H., Galindo, J., “The Passive Acoustic Effect of Turbo-Compressors,” presented at the 9th International Conference on Turbochargers and Turbocharging, UK, May 19-20, 2010. [4] Peat, K. S., Torregrosa, A. J., Broach, A., Fernandez, T., “An Investigation into the Passive Acoustic Effect of the Turbine in Automotive Turbocharger,” Journal of Sound and Vibration, 295: 60-75, 2005.
[5] Munt, R. M., “Acoustic transmission properties of a jet pipe with subsonic jet flow: 1. The cold jet reflection coefficient,” Journal of Sound and Vibration, 142, 413-436, 1990. [6] Bodén, H., Åbom, M., “Modelling of Fluid Machines as Sources of Sound in Duct and Pipe Systems,” Acta Acustica, 3: 1-12, 1995. [7] Rämmal, H., Åbom, M., “Acoustics of Turbochargers,” SAE Technical Paper no. 2007-01-2205, 2007. [8] Raitor, T., Neise, W., 2008, “Sound generation in centrifugal compressors”, Journal of Sound and Vibration, Vol. 314, 738-756, 2008. [9] Rämmal, H., “Studies of Flow Duct Acoustics with Application to Turbocharged Engines”, Doctoral Thesis, TRITA-AVE 2009:29. [10] Åbom, M., “Measurement of the Scattering-Matrix of Acoustical Two-Ports,” Mech. Systems and Signal Proc 5(2): 89-104, 1991. [11] Lavrentjev, J., Åbom, M., Bodén, H.,“A measurement Method for Determining the Source Data of Acoustic Two-Port Sources,” Journal of Sound and Vibration 183(3): 517-531, 1995.
[12] Johnson, M.E., Fuller, C.R., “Creating high level sound in a duct using an axial array of sources,” Journal of Sound and Vibration 277: 101–122, 2004. [13] Pedrosa, A.M., Denia, F.D., Fuenmayor, F. J., Åbom, M., “Experimental measurement of acoustic properties by a two-sourse method with simultaneous excitation”, ICSV18, Rio de Janeiro, July 10-14, 2011. [14] Allam, S., Åbom, M., “Investigation of damping and radiation using full plane wave decomposition in ducts,” Journal of Sound and Vibration, 292, 519-534, 2006. [15] Rämmal, H., Lavrentjev, J., “Sound Reflection from Subsonic Flow Duct Termination Exhausting Hot Jet”, Proceedings of the 37th International Congress and Exhibition on Noise Control Engineering (INTER-NOISE 2008), Shanghai, China, October 26-29, 2008.

24
[16] Rämmal, H., and Lavrentjev, J., “Sound reflection at an open end of a circular duct exhausting hot gas”, Noise Control Eng. Journal, 56 (2), 107-114, 2008. [17] Åbom, M., Bodén, H., ”Error analysis of two-microphone measurements in ducts with flow”, Journal of the Acoustical Society of America, 83, No6, pp. 2429-2438, 1988. [18] Dokumaci, E., “A note on transmission of sound in a wide pipe with mean flow and viscothermal attenuation”, Journal of Sound and Vibration, 208, No 4, pp. 653-655, 1997
[19] Testud, P., Aurégan, Y., Moussou, P., Hirschberg, A., “The whistling potentiality of an orifice in a confined flow using an energetic criterion” Journal of Sound and Vibration, 325, No 4, pp. 769-780, 2009.