acknowledgements - simerr.une.edu.au · quicksmart numeracy annual report for 2018 i table of...
TRANSCRIPT
Acknowledgements
This report was compiled by Dr Stefan Horarik (Research Fellow – Data Analysis), Ambrose McDermott (QuickSmart Project Officer) and June Billings (Executive Assistant). It would not be possible to do this reporting without the support of the rest of the QuickSmart team in SiMERR who have assisted with proof reading and interpretation of data.
We also acknowledge the work of staff in QuickSmart schools in collecting the data and entering into the SiMERR data system.

QuickSmart Numeracy Annual Report for 2018 i
Table Of Contents
1 QuickSmart Executive Summary in 2018 1
2 Background 4 2.1 Purpose of QuickSmart 4 2.2 QuickSmart Program Description 4
3 QuickSmart Tests –– 2018 5 3.1 Introduction 5 3.2 Background to Test Interpretation 5
4 Results on the OZCAAS Assessments 7 4.1 Introduction 7 4.2 Combined OZCAAS Analysis 7
4.2.1 Division 7 4.2.2 Basic Division 9 4.2.3 Multiplication 9 4.2.4 Basic Multiplication 10 4.2.5 Subtraction 10 4.2.6 Basic Subtraction 11 4.2.7 Addition 12 4.2.8 Basic Addition 12
4.3 OZCAAS By Demographics 14 4.3.1 Division by Gender 14 4.3.2 Basic Division by Gender 14 4.3.3 Multiplication by Gender 15 4.3.4 Basic Multiplication by Gender 15 4.3.5 Subtraction by Gender 16 4.3.6 Basic Subtraction by Gender 16 4.3.7 Addition by Gender 17 4.3.8 Basic Addition by Gender 17 4.3.9 Indigenous Students 18
4.5 Students Who Were Unable to Complete the Pre-Intervention Test 21 4.6 Conclusion on OZCAAS Testing 22
5 Independent Assessments 23 5.1 Why They are Used 23 5.2 Results on the PATM Assessments 23
6 Conclusion to Report 25
7 APPENDIX A: Independent Assessment Results 26 7.1 PAT Results by Region (Scale Scores) 2018 26 7.2 PAT Results by Demographic (Scale Scores) 2018 27 7.3 PAT Results by State (Scale Scores) 2018 28 7.4 QuickSmart Students by Year (Scale Scores) 2018 29 7.5 PATM Stanine Improvement for QuickSmart Students 30 7.6 PAT Results by Percentile 31
8 APPENDIX B: SiMERR’s Response to RCT 32

QuickSmart Numeracy Annual Report for 2018 ii
LIST of Tables Table 1: OZCAAS division – all students 2018 7 Table 2: OZCAAS basic division – all students 2018 9 Table 3: OZCAAS multiplication – all students 2018 9 Table 4: OZCAAS basic multiplication – all students 2018 10 Table 5: OZCAAS subtraction – all students 2018 10 Table 6: OZCAAS basic subtraction – all students 2018 11 Table 7: OZCAAS addition – all students 2018 12 Table 8: OZCAAS Basic Addition results – all students 2018 12 Table 9: OZCAAS division results – all students by gender 2018 14 Table 10: OZCAAS basic division results – all students by gender 2018 14 Table 11: OZCAAS multiplication results – all students by gender 2018 15 Table 12: OZCAAS Basic multiplication results – all students by gender 2018 15 Table 13: OZCAAS subtraction results – all students by gender 2018 16 Table 14: OZCAAS Basic subtraction results – all students by gender 2018 16 Table 15: OZCAAS addition results – all students by gender 2018 17 Table 16: OZCAAS basic addition results – all students by gender 2018 17 Table 17: OZCAAS results – Indigenous students 2018 18 Table 18: OZCAAS results where no pre-test data was available – 2018 21 Table 19: PATM results – (Scale scores) 2018 23 Table 20: PATM results – By Gender (Scale scores) 2018 23 Table 21: PATM results – Indigenous (Scale scores) 2018 24 Table 22: Percentage students with PAT Gain 24
QuickSmart Numeracy Annual Report for 2018 1
1 QuickSmart Executive Summary in 2018
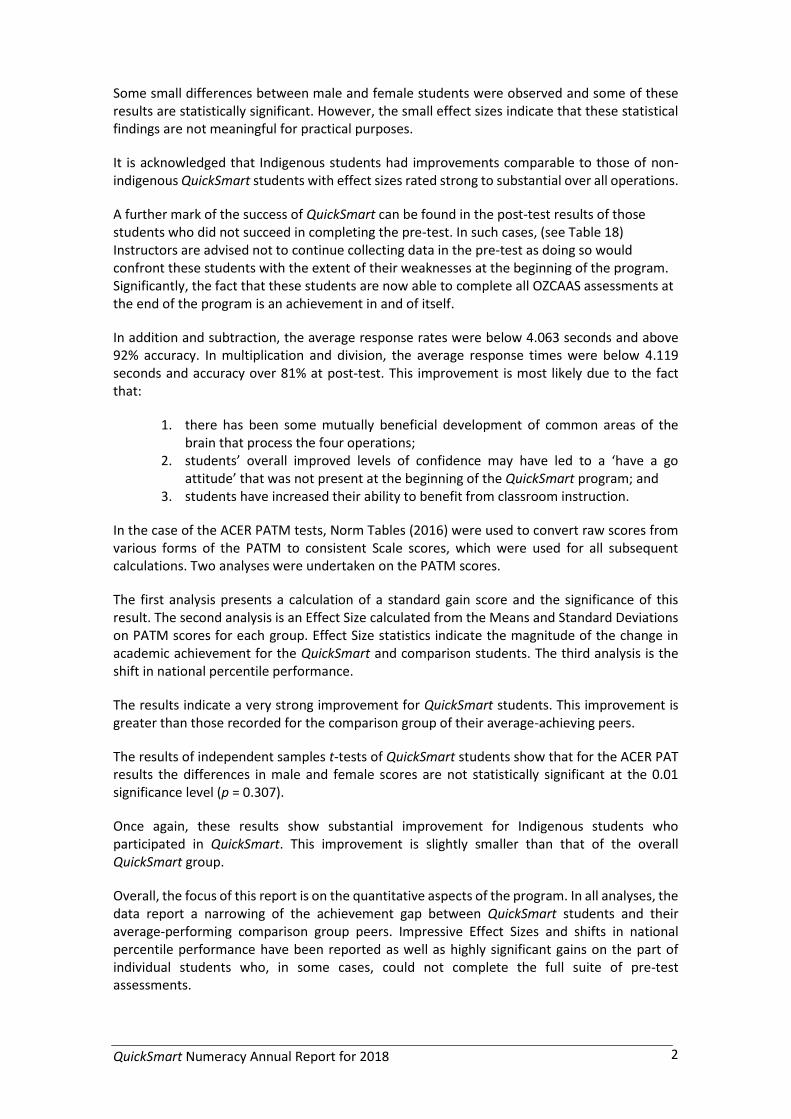
Students who experience ongoing failure in upper-primary and lower-secondary school face a myriad of difficulties in pursuing post-school options and contributing to society through employment and aware citizenship. Those who exhibit consistent weaknesses in basic skills, such as the recall of number facts, or who experience difficulty with reading and comprehension are particularly vulnerable. These students are usually caught in a cycle of continued failure, as it is particularly difficult to bring about sustainable change within the usual classroom environments for students who by Year 4 are persistently at or below national benchmarks.
Three issues confront schools in Australia with regard to addressing the needs of at-risk students.
1. Too many Australian Indigenous and non-Indigenous students have shown to be resistant to improvements in learning despite large investments of funds to overcome their problems. Longitudinal national data indicate that low-achieving students have not drawn lasting benefits from most current in-class and withdrawal instructional activities.
2. Teaching assistants are an underutilised, poorly supported, and seldom recognised resource in school education. With appropriate training these adults are highly motivated, and offer cost-effective, long-term sustainable ways to close the achievement gap for low-achieving students. In remote and rural areas, trained Indigenous teaching assistants (as QuickSmart Instructors) are a resource able to enrich their whole community.
3. Educational support programs need to be sustainable in the short- and long-term without large drains on the public purse. Sustainability means cost-efficient, clear exit criteria, proven longitudinal results, documented ongoing benefits for students and instructors, and replicability (including quality assurance) across all regions of Australia.
The analyses presented in this report provide information about students’ performance in the QuickSmart Numeracy program. In particular, the focus here is on the Cognitive Aptitude Assessment System, Australian version (OZCAAS) and on standardised test measures, specifically the Progressive Achievement Tests in Mathematics (ACER, 2016). Some schools provided data for other independent tests, however, there was insufficient use of these tests for inclusion in this report. Further investigation of the data in this report examines the results in terms of gender and for participating Indigenous students.
In 2018, the QuickSmart team at the University of New England received matched data from 4,439 students who participated in QuickSmart Numeracy lessons and 1,213 average-achieving comparison peers. These students were drawn from schools from 28 regions around Australia.
In terms of the OZCAAS (a random number computer generated testing approach that measures the reaction time (speed) and the accuracy of basic arithmetic computation) the results for the four operations offered at each of two levels indicate a very strong to substantial improvement for the QuickSmart students in terms of accuracy and response time. The evidence provided illustrates that QuickSmart students narrowed the achievement gap by improving to such an extent that there was either no substantial difference between them and the comparison students or they had reached a slightly better level of performance than their average-achieving comparison group peers.
Such growth is a critical requirement for these QuickSmart students as number facts are a vital skill underpinning mathematics functioning in general. This improvement provides the necessary foundation for students to improve in other areas of mathematics, particularly those linked to higher-order thinking, that are not specifically taught in QuickSmart.
QuickSmart Numeracy Annual Report for 2018 2
Some small differences between male and female students were observed and some of these results are statistically significant. However, the small effect sizes indicate that these statistical findings are not meaningful for practical purposes.
It is acknowledged that Indigenous students had improvements comparable to those of non-indigenous QuickSmart students with effect sizes rated strong to substantial over all operations.
A further mark of the success of QuickSmart can be found in the post-test results of those students who did not succeed in completing the pre-test. In such cases, (see Table 18) Instructors are advised not to continue collecting data in the pre-test as doing so would confront these students with the extent of their weaknesses at the beginning of the program. Significantly, the fact that these students are now able to complete all OZCAAS assessments at the end of the program is an achievement in and of itself.
In addition and subtraction, the average response rates were below 4.063 seconds and above 92% accuracy. In multiplication and division, the average response times were below 4.119 seconds and accuracy over 81% at post-test. This improvement is most likely due to the fact that:
1. there has been some mutually beneficial development of common areas of the brain that process the four operations;
2. students’ overall improved levels of confidence may have led to a ‘have a go attitude’ that was not present at the beginning of the QuickSmart program; and
3. students have increased their ability to benefit from classroom instruction.
In the case of the ACER PATM tests, Norm Tables (2016) were used to convert raw scores from various forms of the PATM to consistent Scale scores, which were used for all subsequent calculations. Two analyses were undertaken on the PATM scores.
The first analysis presents a calculation of a standard gain score and the significance of this result. The second analysis is an Effect Size calculated from the Means and Standard Deviations on PATM scores for each group. Effect Size statistics indicate the magnitude of the change in academic achievement for the QuickSmart and comparison students. The third analysis is the shift in national percentile performance.
The results indicate a very strong improvement for QuickSmart students. This improvement is greater than those recorded for the comparison group of their average-achieving peers.
The results of independent samples t-tests of QuickSmart students show that for the ACER PAT results the differences in male and female scores are not statistically significant at the 0.01 significance level (p = 0.307).
Once again, these results show substantial improvement for Indigenous students who participated in QuickSmart. This improvement is slightly smaller than that of the overall QuickSmart group.
Overall, the focus of this report is on the quantitative aspects of the program. In all analyses, the data report a narrowing of the achievement gap between QuickSmart students and their average-performing comparison group peers. Impressive Effect Sizes and shifts in national percentile performance have been reported as well as highly significant gains on the part of individual students who, in some cases, could not complete the full suite of pre-test assessments.

QuickSmart Numeracy Annual Report for 2018 3
Additionally, substantial qualitative data (reported in school presentations during professional workshops 2 and 3) indicate that QuickSmart students gained a new confidence in the area of mathematics. Many stories within the corpus of qualitative data document improvements for QuickSmart students not only in relation to their performance in class, but also with regard to students’ attitudes to school, their attendance rates and levels of academic confidence both inside and outside the classroom.
The data collected to date from many tens of thousands of QuickSmart students indicate that the narrowing of the achievement gap between QuickSmart and comparison students results in low-achieving students proceeding with their studies more successfully by learning to ‘trust their heads’ in the same ways that effective learners do. Importantly, previous QuickSmart studies demonstrate that QuickSmart students can maintain the gains made during the program for years after they completed the program. Analyses have consistently identified impressive statistically significant end-of-program and longitudinal gains in terms of probability measures and effect sizes that mirror the qualitative improvements reported by teachers, paraprofessionals, parents and QuickSmart students.

QuickSmart Numeracy Annual Report for 2018 4
2 Background
2.1 Purpose of QuickSmart
The prime purpose of the QuickSmart in Schools program is to reverse the trend of ongoing poor academic performance for students who have been struggling at school and who are caught in a cycle of continued failure. These targeted students experience significant and sustained difficulties in basic mathematics and/or literacy, and have a profile of low progress despite attempts to overcome their learning problems. Many such students have not drawn lasting benefits from other in-class and withdrawal instructional activities.
A second purpose concerns the professional learning program designed for classroom teachers, special needs support teachers, and paraprofessionals to learn how to work with, and significantly improve, the learning outcomes in basic mathematics and/or literacy of under-achieving middle-school students. The program features professional learning and support for working in a small-class instructional setting with two students, using a specially constructed teaching program supported by extensive material and computer-based resources.
2.2 QuickSmart Program Description
The QuickSmart Numeracy and Literacy interventions were developed through the National Centre of Science, Information and Communication Technology and Mathematics Education for Rural and Regional Australia (SiMERR) at the University of New England, Armidale. The QuickSmart programs have been under continuous development and improvement since 2001, based on the results of many tens of thousands of students.
The intervention is called QuickSmart to encourage students to become quick in their response time and smart in their understanding and the strategic use of mental and other resources. In QuickSmart, the aim is to improve students’ information retrieval times to levels that free working-memory capacity from an excessive focus on mundane or routine tasks. In this way, students are able to engage meaningfully with more demanding cognitive activities. In these interventions, automaticity is fostered; time, accuracy and understanding are incorporated as key dimensions of learning; and an emphasis is placed on ensuring maximum student on-task time. QuickSmart lessons develop learners’ abilities to monitor their academic learning and set realistic goals for themselves.

QuickSmart Numeracy Annual Report for 2018 5
3 QuickSmart Tests –– 2018
3.1 Introduction
Three major sets of analyses help quantify the academic benefits of the QuickSmart program. These analyses are presented in this report and provide information about students’ performance:
(i) on the Cognitive Aptitude Assessment System, Australian version (OZCAAS); (ii) on standardised test measures, specifically the Progressive Achievement Tests in
Mathematics (ACER, 2005); and (iii) in terms of gender and participating Indigenous students.
The first set of analyses examine data from response time and accuracy OZCAAS measures, related to arithmetic operations, collected at the beginning and end of the QuickSmart program. These results are a direct measure of the work of QuickSmart instructors and reflect the primary focus of the QuickSmart lessons.
Eight tests measured students’ response time and accuracy both before QuickSmart began and at the end of the program. The tests were:
1. Basic Addition facts; 2. Addition facts; 3. Basic Subtraction facts; 4. Subtraction facts; 5. Basic Multiplication facts; 6. Multiplication facts; 7. Basic Division facts; and 8. Division facts.
The second set of analyses concerns the results of independent tests in mathematics. Most schools utilise the Progressive Achievement Test Mathematics (PATM) assessment for this purpose. This is a standardised test developed by the Australian Council for Education Research (ACER). The PATM is an independent test taken prior to commencement of QuickSmart and at the completion of the program. Students’ PATM results provide information about how the knowledge, skills and attitudes developed in QuickSmart are used, and how they transfer to other broad areas of mathematics, which are not the target of QuickSmart instruction.
The third set of analyses includes further analyses of the data by gender, and participating Indigenous students.
The results from these analyses are reported below in separate sections. (Note: Some schools provided data for other independent tests, however, there was insufficient use of these tests for inclusion in this report.)
3.2 Background to Test Interpretation
For all tests in this study (OZCAAS and PATM) the comparison group represents average-achieving students selected from the same class as QuickSmart students. The comparison students did the pre-intervention and post-intervention tests but did not receive any QuickSmart small-class instruction. It is important to note that the comparison students do not represent a ‘true’ control group because they do not share the same achievement starting points with the QuickSmart students. The former were average-achieving students, the latter were low-achieving students. This point is demonstrated in all tables of results in this report with
QuickSmart Numeracy Annual Report for 2018 6
comparison students achieving better average pre-intervention scores than students in the QuickSmart group.
As is often the case in educational studies of this nature, to obtain a ‘true’ control group could be ethically problematic since this would potentially deprive a selected group of low-achieving students of the educational benefits that other low-achieving students, (often) in the same class would receive. Thus, even though the results in this report consistently show that the QuickSmart students improve more than the comparison students, it has to be borne in mind that, if the comparison group consisted of low-achieving students, it is most likely that the QuickSmart students would show a greater margin of improvement relative to that group of comparison students.
Additionally, as QuickSmart programs become established in schools, sometimes even within the first year of operation, it becomes increasingly difficult to establish even a true ‘comparison’ group. This occurs as more and more QuickSmart practitioners are sharing QuickSmart teaching practices, resources and activities throughout their schools. Our information from school reports is that a majority of Principals begin this school-wide implementation of QuickSmart in their schools within the first two years. While this attests to the impact that QuickSmart is having in schools, it does not allow a straightforward interpretation of results. Specifically, in many schools, average-achieving comparison students are receiving some experience with QuickSmart approaches, activities and resources in their classrooms, and consequently their scores are higher at post-test because of this exposure.
It should also be noted that in order to obtain the difference between the improvement of QuickSmart students and comparison students we analysed the data using paired-samples t-tests. To protect against the cascading Type I error associated with multiple t-tests we lowered the significance level from the customary 0.05 to 0.01. (The reason for this is to adjust for the situation where t-tests are repeated many times. This repetition means that, on average, the decision that the means of two groups are significantly different would be incorrect one time in every one hundred replications.) This means that in our analysis for any two means to be judged significantly different from each other, there has to be a less than 1% chance that the result was obtained by chance.

QuickSmart Numeracy Annual Report for 2018 7
4 Results on the OZCAAS Assessments
4.1 Introduction
In 2018, the QuickSmart team at the SiMERR National Research Centre at the University of New England received matched data from 4,439 students who participated in QuickSmart Numeracy lessons and 1,213 ‘average-achieving’ comparison peers. These students were drawn from schools from 28 regions around Australia.
To assist with interpretation of OZCAAS results, the tests are shown below in reverse order as often the most revealing results are shown in the operations which are at first weakest, in this case division. A detailed analysis of division is also provided. It is important to note that interpretation of results in some other operations (e.g., basic addition) can be impacted by a ‘ceiling effect’ as many students record strong results at pre-test and this does not leave much room for improvement. The OZCAAS results recorded for average-achieving comparison students should also be interpreted with the knowledge that many of these students’ results were constrained by a ceiling effect.
The results of our analyses of data related to OZCAAS are presented in Tables 1 to 8 below. A detailed discussion of Table 1 is provided for clarification purposes and as a model for understanding the results in Tables 2 to 8.
4.2 Combined OZCAAS Analysis
4.2.1 Division
Table 1 below summarises the data submitted for OZCAAS division.
Table 1: OZCAAS division – all students 2018
Division Pre-
Mean Pre-SD Post-Mean
Post-SD
Gain p Effect size
Res Time (secs) QS 6.413 3.021 3.920 2.446 -2.493 <0.001* 0.907
Res Time (secs) Comp 5.248 2.764 4.666 2.473 -0.582 <0.001* 0.222
Accuracy (%) QS 56.526 27.201 85.172 20.110 28.646 <0.001* 1.198
Accuracy (%) Comp 72.217 25.441 79.599 21.912 7.382 <0.001* 0.311
Division Response Time Division Accuracy
The desired criterion for response time on the OZCAAS assessments is between 1 and 2 seconds as an indication of automaticity. The decrease in time for QuickSmart students is 2.493 seconds, which is a strong result (Note: The negative number in the table means that the post-test time

QuickSmart Numeracy Annual Report for 2018 8
is lower than the pre-test time which is the desired pattern of improvement.) The effect size for this result is 0.907, which indicates substantial improvement.
Effect size statistics can be understood based on the work of Hattie (Hattie, J. 2009. Visible Learning: A synthesis of over 800 meta-analyses relating to achievement. London: Routledge) such that over an academic year for a student cohort:
Effect sizes below 0.2 are considered poor; Effect sizes within the range of 0.2 to 0.4 are considered appropriate; Effect sizes within the range of 0.4 to 0.6 are considered strong; Effect sizes within the range of 0.6 and 0.8 are considered very strong; and Effect sizes above 0.8 are considered substantial improvement of the order of
nearly two-to-three years’ growth.
In terms of accuracy, the QuickSmart students’ average scores have improved by over 28 percentage points, which is a very strong result. The effect size for this result is 1.198, which again indicates substantial improvement for the QuickSmart group.
Division is typically (but not always) the final focus of the QuickSmart program for students. As a result, a number of students may not reach the lessons that focus on division facts. Interestingly, students still appear to make important gains even if lessons on division had not been undertaken. It appears that there is some residual benefit from other earlier aspects of QuickSmart learning that has been transferred.
In summary, Table 1 shows that when compared to the scores of the comparison students, QuickSmart students’ scores indicate substantial improvement for both response time and accuracy. The diagrams illustrate that QuickSmart students improved to reach better levels than their comparison average-achieving peers.

QuickSmart Numeracy Annual Report for 2018 9
4.2.2 Basic Division
Table 2: OZCAAS basic division – all students 2018
Basic Division Pre-
Mean Pre-SD
Post-Mean
Post-SD
Gain p Effect size
Res Time (secs) QS 5.188 2.661 3.017 2.025 -2.171 <0.001* 0.918
Res Time (secs) Comp 3.997 2.209 3.150 1.960 -0.847 <0.001* 0.406
Accuracy (%) QS 74.254 25.453 93.356 12.834 19.102 <0.001* 0.948
Accuracy (%) Comp 84.354 19.973 91.538 15.487 7.184 <0.001* 0.402
Basic Division Response Time Basic Division Accuracy
In summary, the results for basic division indicate a substantial improvement for the QuickSmart students in both response time and accuracy. The diagrams illustrate that the QuickSmart students improved to reach a slightly better level of performance than the comparison students.
4.2.3 Multiplication
Table 3: OZCAAS multiplication – all students 2018
Multiplication Pre-
Mean Pre-SD
Post-Mean
Post-SD
Gain p Effect size
Res Time (secs) QS 6.046 2.818 3.563 2.235 -2.483 <0.001* 0.976
Res Time (secs) Comp 4.826 2.622 4.279 2.352 -0.547 <0.001* 0.22
Accuracy (%) QS 65.224 22.507 89.151 16.393 23.927 <0.001* 1.215
Accuracy (%) Comp 77.922 20.077 83.683 17.628 5.761 <0.001* 0.305
Multiplication Response Time Multiplication Accuracy

QuickSmart Numeracy Annual Report for 2018 10
In summary, the results for multiplication indicate a substantial improvement in both response time and accuracy. The diagrams illustrate that the QuickSmart students improved to reach a better level of performance than the comparison students.
4.2.4 Basic Multiplication
Table 4: OZCAAS basic multiplication – all students 2018
Basic Multiplication
Pre-Mean
Pre-SD
Post-Mean
Post-SD
Gain p Effect size
Res Time (secs) QS 3.675 2.250 2.121 1.411 -1.554 <0.001* 0.827
Res Time (secs) Comp 2.735 1.594 2.147 1.265 -0.588 <0.001* 0.409
Accuracy (%) QS 88.528 16.546 97.301 6.930 8.773 <0.001* 0.692
Accuracy (%) Comp 93.603 12.876 96.741 7.859 3.138 <0.001* 0.294
Basic Multiplication Response Time Basic Multiplication Accuracy
In summary, the results for basic multiplication indicate a substantial improvement for the QuickSmart students in response time and a very strong improvement in accuracy. The diagrams illustrate that the QuickSmart students improved to reach a slightly better level of performance than the comparison students.
4.2.5 Subtraction
Table 5: OZCAAS subtraction – all students 2018
Subtraction Pre-
Mean Pre-SD
Post-Mean
Post-SD
Gain p Effect size
Res Time (secs) QS 5.461 2.763 3.217 1.886 -2.244 <0.001* 0.949
Res Time (secs) Comp 3.869 2.199 3.307 1.767 -0.562 <0.001* 0.282
Accuracy (%) QS 83.484 16.765 95.392 8.978 11.908 <0.001* 0.886
Accuracy (%) Comp 90.659 12.378 93.310 11.162 2.651 <0.001* 0.225

QuickSmart Numeracy Annual Report for 2018 11
Subtraction Response Time Subtraction Accuracy
In summary, the results for subtraction indicate a substantial improvement for the QuickSmart students in both response time and accuracy. The diagrams illustrate that the QuickSmart students improved to reach a slightly better level of performance than the comparison students.
4.2.6 Basic Subtraction
Table 6: OZCAAS basic subtraction – all students 2018
Basic Subtraction
Pre-Mean
Pre-SD Post-Mean
Post-SD
Gain p Effect size
Res Time (secs) QS 4.821 2.693 2.854 1.780 -1.967 <0.001* 0.862
Res Time (secs) Comp 3.510 2.068 2.880 1.625 -0.63 <0.001* 0.339
Accuracy (%) QS 87.343 14.319 96.356 6.975 9.013 <0.001* 0.8
Accuracy (%) Comp 91.703 13.938 95.348 10.274 3.645 <0.001* 0.298
Basic Subtraction Response Time Basic Subtraction Accuracy
In summary, the results for basic subtraction indicate a substantial improvement for the QuickSmart students in both response time and accuracy. The diagrams illustrate that the QuickSmart students improved to such an extent that there was no substantial difference between them and the comparison students.

QuickSmart Numeracy Annual Report for 2018 12
4.2.7 Addition
Table 7: OZCAAS addition – all students 2018
Addition Pre-
Mean Pre-SD Post-Mean Post-SD Gain p
Effect size
Res Time (secs) QS 3.518 1.789 2.178 1.059 -1.34 <0.001* 0.912
Res Time (secs) Comp 2.548 1.343 2.169 1.056 -0.379 <0.001* 0.314
Accuracy (%) QS 93.819 9.101 98.788 3.573 4.969 <0.001* 0.719
Accuracy (%) Comp 96.673 7.184 97.790 6.001 1.117 <0.001* 0.169
Addition Response Time Addition Accuracy
In summary, the results for addition indicate a substantial improvement for the QuickSmart students in response time and a very strong improvement in accuracy. The diagrams illustrate that the QuickSmart students improved to reach a slightly better level of performance than the comparison students in accuracy and a similar level in response time. In accuracy, both QuickSmart and comparison students exhibit a strong ceiling effect.
4.2.8 Basic Addition
Table 8: OZCAAS Basic Addition results – all students 2018
Basic Addition Pre-
Mean Pre-SD
Post-Mean
Post-SD
Gain p Effect size
Res Time (secs) QS 2.921 1.637 1.799 0.859 -1.122 <0.001* 0.858
Res Time (secs) Comp 2.193 1.077 1.920 0.928 -0.273 <0.001* 0.272
Accuracy (%) QS 94.646 9.088 99.114 2.706 4.468 <0.001* 0.666
Accuracy (%) Comp 97.315 6.374 98.250 5.092 0.935 0.021 0.162
QuickSmart Numeracy Annual Report for 2018 13
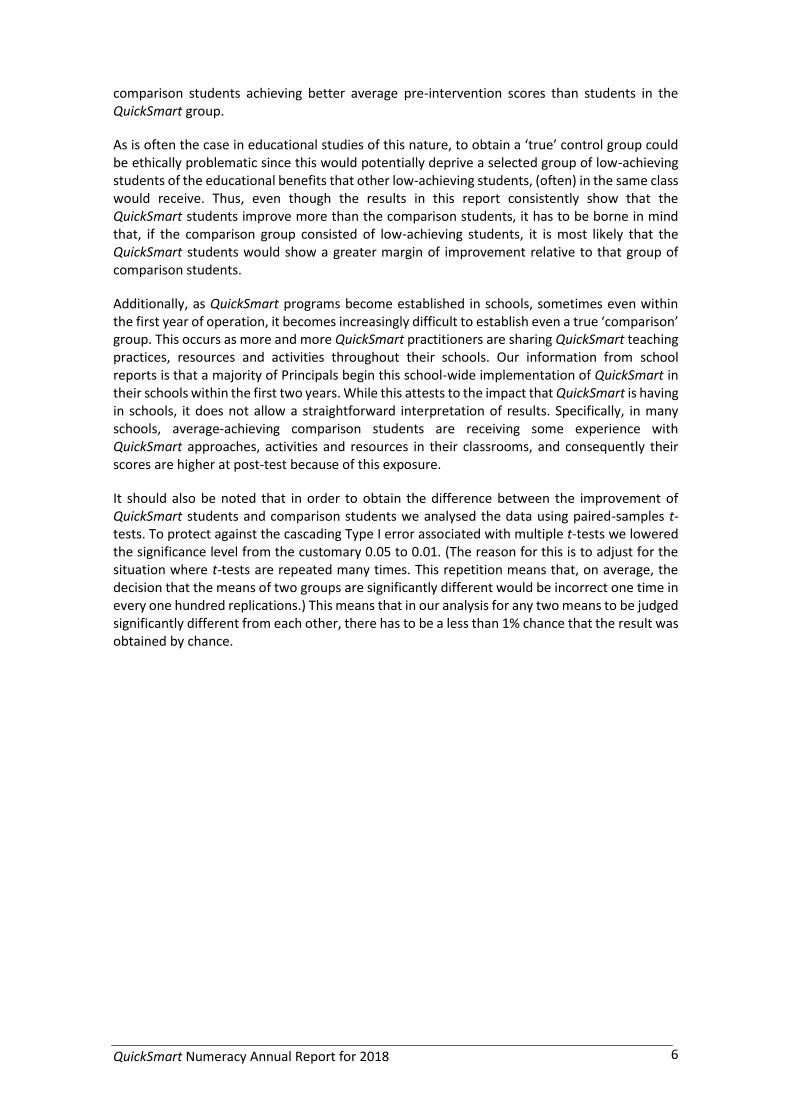
Basic Addition Response Time Basic Addition Accuracy
In summary, the results for basic addition indicate a very strong improvement for the QuickSmart students in accuracy and a substantial improvement in response time. The diagrams illustrate that the QuickSmart students improved to such an extent that there was no substantial difference between them and the comparison students. In accuracy, both QuickSmart and comparison students exhibit a strong ceiling effect.
QuickSmart Numeracy Annual Report for 2018 14
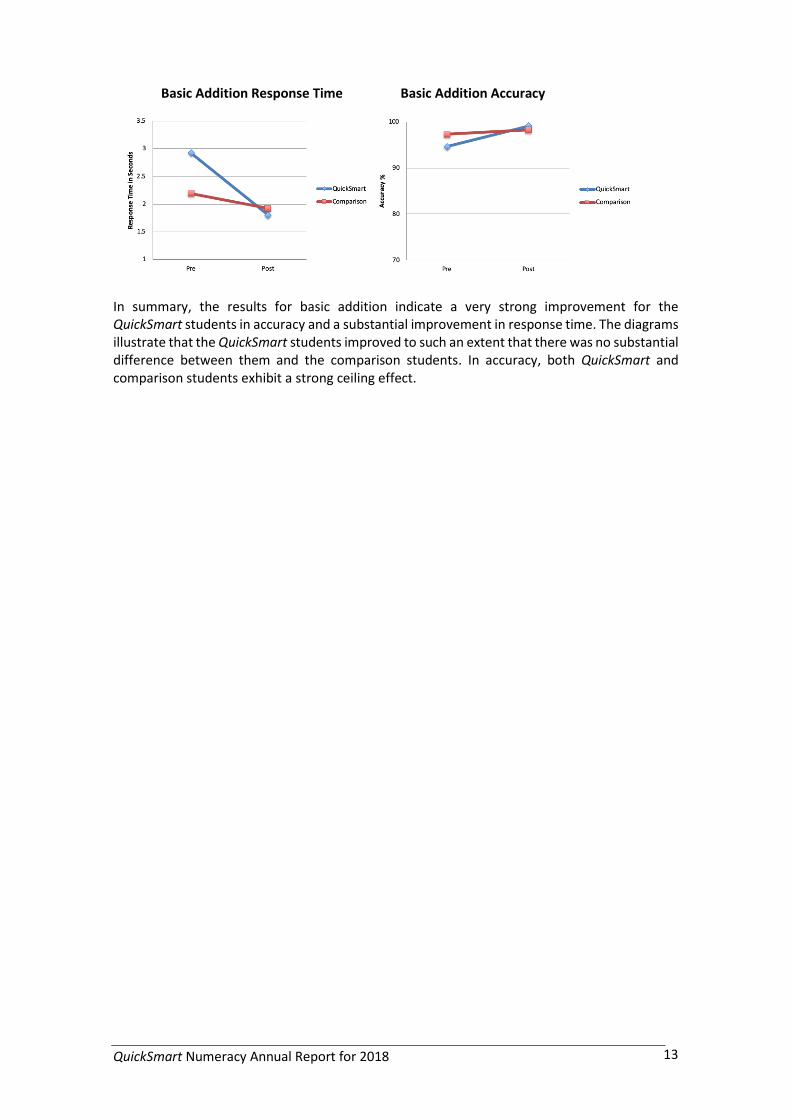
4.3 OZCAAS By Demographics
4.3.1 Division by Gender
The following tables show an analysis of OZCAAS results for each operation by gender (Tables 9, 10, 11, 12, 13, 14, 15, 16) and for Indigenous students (Table 17).
Table 9: OZCAAS division results – all students by gender 2018
Group Pre-Mean
Pre-SD Post-Mean
Post-SD
Gain p Effect size
Response Time (seconds)
Male QuickSmart 6.218 2.921 3.801 2.388 -2.417 <0.001* 0.906
Male Comparison 5.040 2.693 4.456 2.439 -0.584 <0.001* 0.227
Female QuickSmart 6.586 3.097 4.027 2.493 -2.559 <0.001* 0.91
Female Comparison 5.454 2.821 4.874 2.492 -0.58 <0.001* 0.218
Accuracy (%)
Male QuickSmart 57.338 27.388 85.268 20.138 27.93 <0.001* 1.162
Male Comparison 72.644 26.045 79.617 22.294 6.973 <0.001* 0.288
Female QuickSmart 55.805 27.023 85.087 20.092 29.282 <0.001* 1.23
Female Comparison 71.792 24.848 79.581 21.551 7.789 <0.001* 0.335
These results indicate that females did slightly better than males in both response time and accuracy. The results of independent samples t-tests of QuickSmart students show that these differences are not statistically significant at the 0.01 significance level (p = 0.233 for response time and 0.124 for accuracy).
4.3.2 Basic Division by Gender
Table 10: OZCAAS basic division results – all students by gender 2018
Group Pre-Mean
Pre-SD Post-Mean
Post-SD
Gain p Effect size
Response Time (seconds)
Male QuickSmart 4.980 2.560 2.952 1.977 -2.028 <0.001* 0.887
Male Comparison 3.829 2.055 2.898 1.638 -0.931 <0.001* 0.501
Female QuickSmart 5.344 2.726 3.066 2.060 -2.278 <0.001* 0.943
Female Comparison 4.134 2.323 3.355 2.170 -0.778 <0.001* 0.346
Accuracy (%)
Male QuickSmart 74.095 26.874 93.564 12.575 19.469 <0.001* 0.928
Male Comparison 84.673 18.584 90.853 16.589 6.180 <0.001* 0.351
Female QuickSmart 74.374 24.349 93.201 13.031 18.827 <0.001* 0.964
Female Comparison 84.095 21.082 92.095 14.555 8.0 <0.001* 0.442
These results indicate that males did marginally better than females in accuracy and females did slightly better in response time. The results of independent samples t-tests of QuickSmart students show that in accuracy the differences are not statistically significant at the 0.01 significance level (p = 0.073 for response time and 0.599 for accuracy).

QuickSmart Numeracy Annual Report for 2018 15
4.3.3 Multiplication by Gender
Table 11: OZCAAS multiplication results – all students by gender 2018
Group Pre-Mean
Pre-SD Post-Mean
Post-SD
Gain p Effect size
Response Time (seconds)
Male QuickSmart 5.993 2.801 3.503 2.211 -2.49 <0.001* 0.987
Male Comparison 4.762 2.633 4.160 2.381 -0.602 <0.001* 0.24
Female QuickSmart 6.093 2.833 3.617 2.255 -2.476 <0.001* 0.967
Female Comparison 4.890 2.612 4.396 2.320 -0.494 <0.001* 0.2
Accuracy (%)
Male QuickSmart 65.456 22.848 89.151 16.345 23.695 <0.001* 1.193
Male Comparison 78.049 20.912 83.503 17.966 5.454 <0.001* 0.28
Female QuickSmart 65.018 22.206 89.152 16.439 24.134 <0.001* 1.235
Female Comparison 77.797 19.240 83.861 17.305 6.064 <0.001* 0.331
These results indicate that, based on gain, males did slightly better than females in both response time and accuracy. The results of independent samples t-tests of QuickSmart students show that these differences are not statistically significant at the 0.01 significance level (p = 0.888 in response time and 0.524 in accuracy).
4.3.4 Basic Multiplication by Gender
Table 12: OZCAAS Basic multiplication results – all students by gender 2018
Group Pre-Mean
Pre-SD Post-Mean
Post-SD
Gain p Effect size
Response Time (seconds)
Male QuickSmart 3.680 2.359 2.116 1.512 -1.564 <0.001* 0.79
Male Comparison 2.639 1.324 2.039 1.144 -0.6 <0.001* 0.485
Female QuickSmart 3.671 2.169 2.126 1.334 -1.545 <0.001* 0.858
Female Comparison 2.812 1.783 2.234 1.352 -0.578 <0.001* 0.365
Accuracy (%)
Male QuickSmart 87.464 18.351 97.217 6.757 9.753 <0.001* 0.705
Male Comparison 93.796 12.132 96.894 7.657 3.098 <0.001* 0.305
Female QuickSmart 89.300 15.067 97.362 7.056 8.062 <0.001* 0.685
Female Comparison 93.446 13.481 96.617 8.040 3.171 <0.001* 0.286
These results indicate that males did slightly better than females in both response time and accuracy. The results of independent samples t-tests of QuickSmart students show that in response time the differences are not statistically significant at the 0.01 significance level (p = 0.854) but they are close to being significant in accuracy (p = 0.032). However, the small effect size for accuracy (Cohen’s d = 0.118) indicates that this statistical finding is not meaningful for practical purposes.

QuickSmart Numeracy Annual Report for 2018 16
4.3.5 Subtraction by Gender
Table 13: OZCAAS subtraction results – all students by gender 2018
Group Pre-Mean
Pre-SD Post-Mean
Post-SD
Gain p Effect size
Response Time (seconds)
Male QuickSmart 5.013 2.596 2.999 1.791 -2.014 <0.001* 0.903
Male Comparison 3.550 2.077 2.982 1.600 -0.568 <0.001* 0.306
Female QuickSmart 5.844 2.842 3.403 1.945 -2.441 <0.001* 1.002
Female Comparison 4.182 2.271 3.626 1.864 -0.556 <0.001* 0.268
Accuracy (%)
Male QuickSmart 84.367 16.333 95.586 8.715 11.219 <0.001* 0.857
Male Comparison 91.398 12.508 93.433 11.490 2.035 <0.001* 0.169
Female QuickSmart 82.731 17.092 95.226 9.195 12.495 <0.001* 0.91
Female Comparison 89.933 12.217 93.188 10.840 3.255 <0.001* 0.282
These results indicate that females did better than males in both response time and accuracy. The independent samples t-tests of QuickSmart students show that these results are statistically significant at the 0.01 significance level (p < 0.001 for response time and 0.013 in accuracy). However, the small effect sizes (Cohen’s d = 0.184 for response time and 0.082 for accuracy) indicate that these statistical findings are not meaningful for practical purposes.
4.3.6 Basic Subtraction by Gender
Table 14: OZCAAS Basic subtraction results – all students by gender 2018
Group Pre-Mean
Pre-SD Post-Mean
Post-SD
Gain p Effect size
Response Time (seconds)
Male QuickSmart 4.575 2.664 2.731 1.867 -1.844 <0.001* 0.802
Male Comparison 3.320 2.043 2.701 1.567 -0.619 <0.001* 0.34
Female QuickSmart 5.021 2.702 2.954 1.702 -2.067 <0.001* 0.916
Female Comparison 3.658 2.084 3.019 1.661 -0.639 <0.001* 0.339
Accuracy (%)
Male QuickSmart 86.746 14.659 96.180 6.906 9.434 <0.001* 0.823
Male Comparison 91.361 14.343 94.731 12.424 3.37 0.003 0.251
Female QuickSmart 87.828 14.030 96.498 7.032 8.67 <0.001* 0.781
Female Comparison 91.967 13.665 95.826 8.254 3.859 <0.001* 0.342
These results indicate that males did better than females in accuracy and females did slightly better in response time. The results of independent samples t-tests of QuickSmart students show that these differences are not statistically significant at the 0.01 significance level (p = 0.085 in response time and 0.335 in accuracy).

QuickSmart Numeracy Annual Report for 2018 17
4.3.7 Addition by Gender
Table 15: OZCAAS addition results – all students by gender 2018
Group Pre-Mean
Pre-SD
Post-Mean
Post-SD
Gain p Effect size
Response Time (seconds)
Male QuickSmart 3.338 1.735 2.102 1.066 -1.236 <0.001* 0.859
Male Comparison 2.441 1.358 2.056 1.030 -0.385 <0.001* 0.319
Female QuickSmart 3.669 1.821 2.242 1.050 -1.427 <0.001* 0.96
Female Comparison 2.652 1.321 2.278 1.070 -0.374 <0.001* 0.312
Accuracy (%)
Male QuickSmart 93.848 8.833 98.660 3.975 4.812 <0.001* 0.703
Male Comparison 96.797 7.431 97.879 6.016 1.082 <0.001* 0.16
Female QuickSmart 93.795 9.322 98.894 3.194 5.099 <0.001* 0.732
Female Comparison 96.554 6.942 97.704 5.991 1.15 <0.001* 0.177
These results indicate that females did better than males in both response time and accuracy. The results of independent samples t-tests of QuickSmart students show that in accuracy the differences are not statistically significant at the 0.01 significance level (p = 0.319) but they are significant in response time (p <0.001). However, the small effect size for response time (Cohen’s d = 0.125) indicates that this statistical finding is not meaningful for practical purposes.
4.3.8 Basic Addition by Gender
Table 16: OZCAAS basic addition results – all students by gender 2018
Group Pre-Mean
Pre-SD Post-Mean
Post-SD
Gain p Effect size
Response Time (seconds)
Male QuickSmart 2.901 1.739 1.759 0.196 -1.142 <0.001* 0.923
Male Comparison 2.248 1.230 1.892 0.963 -0.356 <0.001* 0.322
Female QuickSmart 2.936 1.548 1.831 0.808 -1.105 <0.001* 0.895
Female Comparison 2.149 0.939 1.942 0.902 -0.207 0.001 0.224
Accuracy (%)
Male QuickSmart 94.177 9.411 99.12 2.715 4.943 <0.001* 0.714
Male Comparison 97.242 5.537 98.439 3.777 1.197 0.013 0.253
Female QuickSmart 95.032 8.802 99.109 2.701 4.077 <0.001* 0.626
Female Comparison 97.373 6.996 98.098 5.952 0.725 0.243 0.112
These results indicate that males did better than females in both response time and accuracy. The results of independent samples t-tests of QuickSmart students show that in both response time and accuracy the differences are not statistically significant at the 0.01 significance level (p = 0.635 for response time and 0.108 for accuracy).

QuickSmart Numeracy Annual Report for 2018 18
4.3.9 Indigenous Students
Table 17: OZCAAS results – Indigenous students 2018 Test N Pre-
Mean Pre-SD Post-
Mean Post-SD Gain p Effect
size
Basic Addition
Response time (seconds) 3.348 2.392 1.952 1.010 -1.396 <0.001* 0.76
Accuracy (%) 93.260 11.093 98.753 3.181 5.493 <0.001* 0.673
Addition
Response time (seconds) 3.922 2.309 2.513 1.414 -1.409 <0.001* 0.736
Accuracy (%) 93.740 8.577 97.831 5.533 4.091 <0.001* 0.567
Basic Subtraction
Response time (seconds) 5.753 3.424 3.656 2.351 -2.097 <0.001* 0.714
Accuracy (%) 85.888 15.156 95.463 7.889 9.575 <0.001* 0.793
Subtraction
Response time (seconds) 5.689 2.891 3.871 2.520 -1.818 <0.001* 0.67
Accuracy (%) 81.839 18.057 93.441 11.106 11.602 <0.001* 0.774
Basic Multiplication
Response time (seconds) 3.852 2.347 2.214 1.369 -1.639 <0.001* 0.853
Accuracy (%) 85.253 21.619 97.230 6.083 11.977 <0.001* 0.754
Multiplication
Response time (seconds) 6.025 2.626 3.996 2.560 -2.029 <0.001* 0.782
Accuracy (%) 64.704 21.625 86.106 17.625 21.402 <0.001* 1.085
Basic Division
Response time (seconds) 5.121 2.513 3.443 2.571 -1.678 <0.001* 0.66
Accuracy (%) 70.747 30.169 91.389 14.837 20.642 <0.001* 0.868
Division
Response time (seconds) 6.562 3.063 4.543 2.795 -2.019 <0.001* 0.688
Accuracy (%) 51.911 27.366 80.843 22.292 28.932 <0.001* 1.159
These results indicate that in most instances the Indigenous students’ improvement was very similar to that of the overall QuickSmart group. For addition, the accuracy results exhibit the ceiling effect (the pre-intervention scores were so high that the students did not have much room for further improvement).
The following graphs illustrate how the Indigenous students (green) have performed in each operation compared to the whole QuickSmart group (blue) as well as the comparison students (red).

QuickSmart Numeracy Annual Report for 2018 19
Basic Addition Response Time Basic Addition Accuracy
Addition Response Time Addition Accuracy
Basic Subtraction Response Time Basic Subtraction Accuracy
Subtraction Response Time Subtraction Accuracy

QuickSmart Numeracy Annual Report for 2018 20
Basic Multiplication Response Time Basic Multiplication Accuracy
Multiplication Response Time Multiplication Accuracy
Basic Division Response Time Basic Division Accuracy
Division Response Time Division Accuracy

QuickSmart Numeracy Annual Report for 2018 21
4.5 Students Who Were Unable to Complete the Pre-Intervention Test
To complete this section on OZCAAS results, it is important to note that there were students who the instructors confirmed were not able to complete all the OZCAAS pre-tests. In such cases Instructors were advised not to continue collecting data as doing so would have confronted these students dramatically with their weaknesses at the beginning of the program.
A mark of the success of QuickSmart is that many of these students were able to complete all OZCAAS assessments at the end of the program. These students’ results could not be included in the previous analyses and are presented in Table 18 below.
Table 18: OZCAAS results where no pre-test data was available – 2018
Mean Std. Deviation Basic Addition
Response time (seconds) 2.400 1.914
Accuracy (%) 96.943 5.267
Addition
Response time (seconds) 1.823 1.673
Accuracy (%) 97.123 6.555
Basic Subtraction
Response time (seconds) 4.063 3.702
Accuracy (%) 97.496 4.299
Subtraction
Response time (seconds) 3.382 2.826
Accuracy (%) 92.801 14.139
Basic Multiplication
Response time (seconds) 2.287 1.500
Accuracy (%) 97.235 6.025
Multiplication
Response time (seconds) 4.073 2.829
Accuracy (%) 86.295 17.143
Basic Division
Response time (seconds) 2.978 2.091
Accuracy (%) 91.751 13.441
Division
Response time (seconds) 4.119 2.586
Accuracy (%) 81.876 23.125
The results in Table 18 are impressive given that these students did not have the skills or confidence to complete the OZCAAS pre-tests initially. In addition and subtraction, the average response rates were below 4.063 seconds and above 92% accuracy. In multiplication and division, the average response times were below 4.119 seconds and accuracy over 81% at post-test. Even though some of these students may not have progressed to multiplication and division during QuickSmart lessons, their results are encouraging. It is likely that part of this improvement may be due to the fact that:
1. there has been some mutually beneficial development of the common areas of the brain that process the four operations;
2. students’ overall improved levels of confidence may have led to a ‘have a go attitude’ that was not present at the beginning of the QuickSmart program; and
3. students have increased their ability to benefit from classroom instruction.

QuickSmart Numeracy Annual Report for 2018 22
4.6 Conclusion on OZCAAS Testing
Overall, the QuickSmart students showed very strong growth in their understanding and use of number facts. In all four mathematical operations, they either closed the gap between them and the comparison group of average-achieving peers or narrowed this gap to a very small margin. Such growth is critical for these students as number facts are a vital skill underpinning mathematics functioning in general. This improvement provides the necessary foundation for students to improve in other areas of mathematics that are not specifically taught in QuickSmart.
Some small differences between male and female students were observed and some of these results are statistically significant. However, the small effect sizes indicate that these statistical findings are not meaningful for practical purposes. As a result, these data do not warrant further investigation.
It is acknowledged that Indigenous students’ improvements were comparable to those of the overall QuickSmart group with effect sizes rated strong to substantial over all operations.
QuickSmart Numeracy Annual Report for 2018 23
5 Independent Assessments
5.1 Why They are Used
The QuickSmart pre- and post-assessments include use of independent tests in order to demonstrate whether the students are able to take the basic facts and problem-solving strategies taught in QuickSmart and apply these to higher-level mathematical concepts.
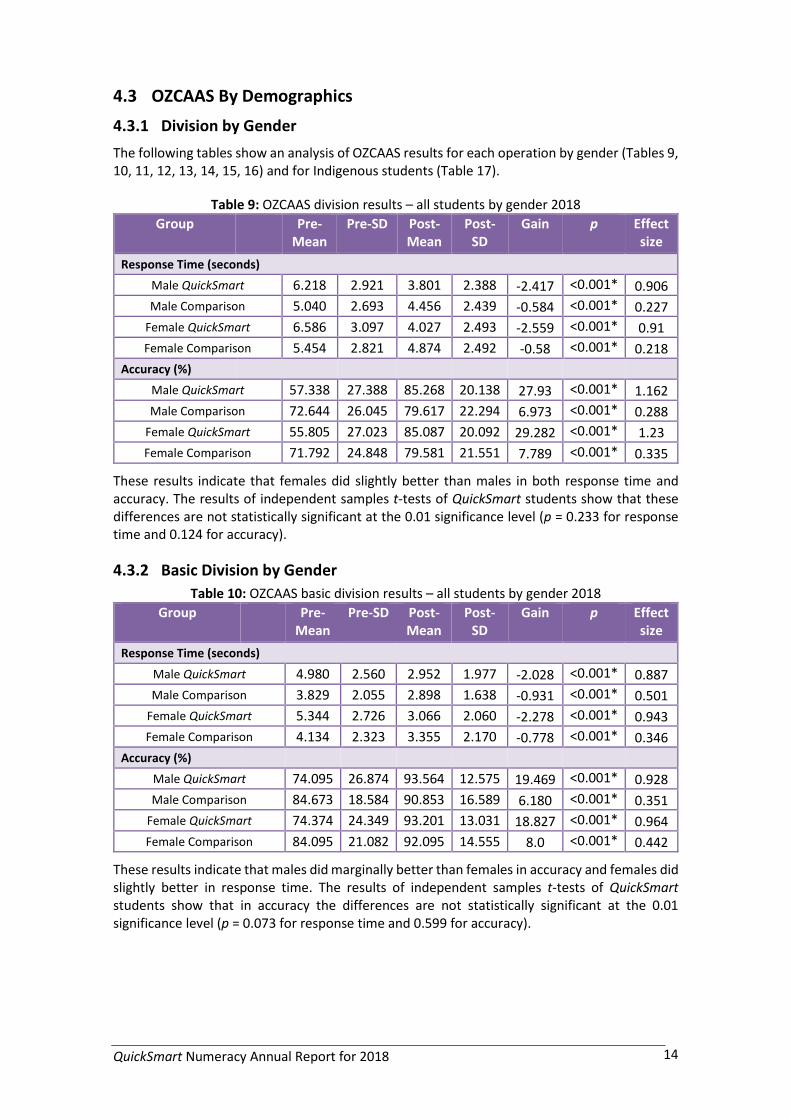
5.2 Results on the PATM Assessments
Table 19 reports the paired-samples t-tests analysis of the PATM data for all students for whom paired data were available. PATM analyses for individual clusters are provided in an Appendix to this report. (Note: Students who were absent at the end of the year were not included in the analysis.)
The PATM Norm Tables were used to convert raw scores from various forms of the PATM to consistent Scale scores, which were used for all subsequent calculations. Two analyses are reported in Table 19. The first analysis presents a calculation of a standard gain score and the significance of this result. The second analysis is an Effect Size calculated from the Means and Standard Deviations on PATM scores for each group. Effect Size statistics indicate the magnitude of the change in academic achievement for the QuickSmart and comparison students.
Table 19: PATM results – (Scale scores) 2018
Average Gain score
Significance Effect size
All QuickSmart 6.442 <0.001* 0.657
All comparison 4.369 <0.001* 0.415
The results indicate a very strong improvement for QuickSmart students. This improvement is greater than those recorded for the comparison group of their average-achieving peers.
Table 20 reports the same information as Table 19 but shows a comparison of males and females included in the QuickSmart program.
Table 20: PATM results – By Gender (Scale scores) 2018
Gender Average Gain score
Significance Effect size
Male
QuickSmart Students 6.622 <0.001* 0.667
Comparison Students 4.613 <0.001* 0.422 Female
QuickSmart Students 6.303 <0.001* 0.649
Comparison Students 4.137 <0.001* 0.407
These results indicate that QuickSmart males did slightly better than females in PATM assessment. However, the results of independent samples t-tests of QuickSmart students show that for the ACER PAT results the differences are not statistically significant at the 0.01 significance level (p = 0.307).
Table 21 reports the same information as Table 19 but does so for the scores of Indigenous students included in the QuickSmart program.

QuickSmart Numeracy Annual Report for 2018 24
Table 21: PATM results – Indigenous (Scale scores) 2018
Indigenous students Average Gain score
Significance Effect size
Indigenous QuickSmart 5.567 <0.001* 0.636
All QuickSmart 6.442 <0.001* 0.657
Once again, these results show very strong improvement for the Indigenous students who participated in QuickSmart. This improvement is slightly smaller than that of the overall QuickSmart group.
The following figure shows that the QuickSmart students consistently achieve the gains in PAT across the middle school years targeted by the program, that is Year 4 through to Year 9. The tables of figures for these graphs are available in the Appendices. Note: Other grades were excluded from the analyses as they had fewer than 15 QuickSmart students.
Figure 1: PAT by Year
The following table shows the percentage of QuickSmart students that achieved a gain on the PATM results
Table 22: Percentage students with PAT Gain
Student Type Percentage with Gain
QuickSmart 78.3
Indigenous QuickSmart 73.6
Comparison 68.5
These results show that in the QuickSmart group, a greater percentage of students achieved gain in PAT than in the comparison group of their average-achieving peers.
QuickSmart Numeracy Annual Report for 2018 25
6 Conclusion to Report
The support provided by the Schools and Clusters has been critical in making more positive the hopes and aspirations of students participating in the QuickSmart program. This report has focused on the quantitative aspects of the program. In all analyses, the data report a narrowing of the achievement gap between QuickSmart students and their average-performing comparison group peers. Impressive Effect Sizes have been reported as well as highly significant gains on the part of individual students who, in some cases, could not complete the full suite of pre-test assessments.
Additionally, substantial qualitative data (reported in school presentations during professional workshops 2 and 3) indicate that QuickSmart students gained a new confidence in the area of mathematics. Many stories within the corpus of qualitative data document improvements for QuickSmart students not only in relation to their performance in class, but also with regard to students’ attitudes to school, their attendance rates and levels of academic confidence both inside and outside the classroom.
The data collected to date from thousands of QuickSmart students indicate that the narrowing of the achievement gap between QuickSmart and comparison students results in low-achieving students proceeding with their studies more successfully by learning to ‘trust their heads’ in the same ways that effective learners do. Importantly, previous QuickSmart studies (references at http://www.une.edu.au/simerr/quicksmart/pages/qsresearchpublications.php) demonstrate that QuickSmart students can maintain the gains made during the program for years after they completed the program. Analyses have consistently identified impressive statistically significant end-of-program and longitudinal gains in terms of probability measures and effect sizes that mirror the qualitative improvements reported by teachers, paraprofessionals, parents and QuickSmart students.
If you have any questions concerning this report or QuickSmart please contact us at the SiMERR National Centre at UNE on (02) 6773 5067.
Professor John Pegg

QuickSmart Numeracy Annual Report for 2018 26
7 APPENDIX A: Independent Assessment Results
7.1 PAT Results by Region (Scale Scores) 2018
School Region Pre-Intervention Post-Intervention
Mean SD Mean SD Gain p Effect size
Adelaide QS Students 109.908 9.544 116.497 9.150 6.589 <0.001* 0.705
Ballarat QS Students 117.847 7.637 121.598 8.613 3.751 <0.001* 0.461
Eyre Peninsula QS Students 104.022 5.262 108.964 8.133 4.942 <0.001* 0.722
Geelong QS Students 113.457 9.577 121.532 11.412 8.075 <0.001* 0.767
Gippsland QS Students 109.506 5.309 115.347 8.756 5.841 0.003 0.807
Goulbourn QS Students 117.267 6.033 118.391 5.712 1.124 0.256 0.191
Horsham QS Students 118.708 6.935 120.281 7.468 1.573 0.215 0.218
Hunter QS Students 111.642 8.932 119.008 10.945 7.366 <0.001* 0.737
Limestone Coast QS Students 110.083 7.383 116.979 8.183 6.896 <0.001* 0.885
Melbourne QS Students 117.286 8.243 125.021 11.048 7.735 <0.001* 0.794
Mid-West QS Students 114.243 9.971 121.261 6.988 7.018 <0.001* 0.815
Mornington QS Students 115.863 9.332 118.725 9.973 2.862 0.188 0.296
Murray/Mallee QS Students 116.741 9.218 119.376 6.429 2.635 0.192 0.332
New England QS Students 115.147 10.688 122.220 9.193 7.073 0.002 0.71
North Coast QS Students 112.169 7.209 122.625 10.561 10.456 <0.001* 1.156
North Tas QS Students 115.562 7.069 117.286 8.001 1.724 0.161 0.228
North West QS Students 112.582 5.965 118.501 8.718 5.919 <0.001* 0.792
Port Pirie QS Students 115.317 7.213 124.073 11.102 8.756 <0.001* 0.935
Queensland QS Students 112.279 12.935 120.777 15.720 8.498 <0.001* 0.59
Remote QS Students 113.057 8.388 120.257 10.162 7.2 <0.001* 0.773
Riverina QS Students 117.683 8.925 121.098 8.226 3.415 <0.001* 0.398
South Tas QS Students 118.350 6.121 121.975 5.152 3.625 0.099 0.641
Southern Sydney QS Students 114.278 8.428 120.313 9.390 6.035 <0.001* 0.676
Sydney QS Students 113.418 8.891 119.380 9.172 5.962 <0.001* 0.66
Warrnambool QS Students 118.952 7.676 123.992 7.912 5.04 <0.001* 0.647
Western QS Students 107.983 8.277 112.335 7.265 4.352 <0.001* 0.559
Western Syd QS Students 110.974 9.877 117.355 10.208 6.381 <0.001* 0.635
Yorke Peninsula/Mid North QS Students 111.015 8.981 120.820 7.421 9.805 <0.001* 1.19
Note 1: only students who did both ‘pre’ and ‘post’ test are included in the table.

QuickSmart Numeracy Annual Report for 2018 27
7.2 PAT Results by Demographic (Scale Scores) 2018
Demographic Pre-Intervention Post-Intervention
Mean SD Mean SD Gain p Effect size
All QS Students 113.163 9.359 119.605 10.240 6.442 <0.001* 0.657
All comparison students 119.553 10.258 123.922 10.806 4.369 <0.001* 0.415
Indigenous QS Students 110.216 8.291 115.783 9.193 5.567 <0.001* 0.636
Male QS Students 113.191 9.611 119.813 10.250 6.622 <0.001* 0.667
Male comparison students 119.465 10.647 124.078 11.213 4.613 <0.001* 0.422
Female QS Students 113.141 9.163 119.444 10.233 6.303 <0.001* 0.649
Female comparison Students 119.636 9.887 123.773 10.417 4.137 <0.001* 0.407
Male Indigenous QS Students 110.003 8.720 116.176 9.063 6.173 <0.001* 0.694
Female Indigenous QS Students 110.398 7.943 115.446 9.333 5.048 <0.001* 0.583
Note: only students who did both ‘pre’ and ‘post’ test are included in the table.

QuickSmart Numeracy Annual Report for 2018 28
7.3 PAT Results by State (Scale Scores) 2018
State Pre-Intervention Post-Intervention
Mean SD Mean SD Gain p Effect size All QuickSmart Students 113.163 9.359 119.605 10.240 6.442 <0.001* 0.657
All comparison students 119.553 10.258 123.922 10.806 4.369 <0.001* 0.415
New South Wales
QuickSmart 112.748 8.846 119.577 9.837 6.829 <0.001* 0.73
Indigenous QuickSmart 110.236 7.855 116.185 8.907 5.949 <0.001* 0.708
Comparison 119.246 9.402 125.080 9.446 5.834 <0.001* 0.619
Queensland
QuickSmart 112.279 12.935 120.777 15.720 8.498 <0.001* 0.59
Indigenous QuickSmart 108.967 14.813 114.733 12.559 5.766 0.065 0.42
Comparison 122.476 8.114 127.373 10.699 4.897 0.001 0.516
South Australia
QuickSmart 110.232 9.326 116.901 9.593 6.669 <0.001* 0.705
Indigenous QuickSmart 105.360 8.491 110.087 11.760 4.727 0.146 0.461
Comparison 116.587 9.541 122.154 9.289 5.567 <0.001* 0.591
Tasmania
QuickSmart 116.245 6.894 118.435 7.632 2.19 0.039 0.301
Indigenous QuickSmart 118.550 1.100 121.400 1.953 2.85 0.104 1.798
Comparison 121.325 7.025 121.217 6.842 -0.108 no improvement
Victoria
QuickSmart 117.382 8.028 122.552 9.472 5.17 <0.001* 0.589
Indigenous QuickSmart 114.200 8.041 116.345 6.822 2.145 0.238 0.288
Comparison 122.240 11.059 124.543 12.815 2.303 <0.001* 0.192 Note: only students who did both ‘pre’ and ‘post’ test are included in the table.

QuickSmart Numeracy Annual Report for 2018 29
7.4 QuickSmart Students by Year (Scale Scores) 2018
Year Pre-Intervention Post-Intervention
Mean SD Mean SD Gain p Effect size Year 4
QuickSmart 106.790 8.486 115.177 9.650 8.387 <0.001 0.923
Indigenous QuickSmart 107.072 7.731 112.058 9.449 4.986 <0.001 0.578
Comparison 112.506 9.411 119.513 9.440 7.007 <0.001 0.743
Year 5
QuickSmart 110.883 8.297 116.923 9.461 6.04 <0.001 0.679
Indigenous QuickSmart 107.545 7.323 115.157 9.970 7.612 <0.001 0.87
Comparison 117.882 8.864 121.632 9.858 3.75 <0.001 0.4
Year 6
QuickSmart 114.451 7.869 121.678 8.851 7.227 <0.001 0.863
Indigenous QuickSmart 109.313 9.365 117.840 7.102 8.527 <0.001 1.026
Comparison 120.883 8.541 126.109 11.040 5.226 <0.001 0.529
Year 7
QuickSmart 115.972 8.055 121.231 9.838 5.259 <0.001 0.585
Indigenous QuickSmart 111.544 6.799 115.695 7.809 4.151 <0.001 0.567
Comparison 123.887 8.056 126.239 10.385 2.352 <0.001 0.253
Year 8
QuickSmart 118.229 8.822 123.969 10.434 5.74 <0.001 0.594
Indigenous QuickSmart 116.445 7.870 120.687 8.938 4.242 0.003 0.504
Comparison 125.518 9.223 128.164 11.240 2.646 0.006 0.257
Year 9
QuickSmart 114.015 19.038 121.347 15.814 7.332 <0.001 0.419
Indigenous QuickSmart 110.933 18.546 112.200 9.154 1.267 0.837 0.087
Comparison 124.900 17.051 131.067 9.218 6.167 0.243 0.45
All Schools
QuickSmart 113.163 9.359 119.605 10.240 6.442 <0.001 0.657
Indigenous QuickSmart 110.216 8.291 115.783 9.193 5.567 <0.001 0.636
Comparison 119.553 10.258 123.922 10.806 4.369 <0.001 0.415

QuickSmart Numeracy Annual Report for 2018 30
7.5 PATM Stanine Improvement for QuickSmart Students
The Australian Council for Educational Research (ACER) PAT tests use a framework for describing results against national Australian norms. This technique applies stanine scores that divide the population using a scale of 1 to 9.
A stanine score of:
1 represents performance below the bottom 4% of the population 2 represents performance in the lower 4-10% of the population 3 represents performance in the lower 11-22% of the population 4 represents performance in the lower 23-39% of the population 5 represents performance in middle 40-59% of the population 6 represents performance in the higher 60-76% of the population 7 represents performance in the higher 77-88% of the population 8 represents performance in the higher 89-96% of the population 9 represents performance above the top 4% of the population.
It is particularly difficult to move students out of the lower stanine bands. The results above show that QuickSmart has been quite successful in moving students into higher bands, as measured by the various PAT.
QuickSmart Numeracy Annual Report for 2018 31
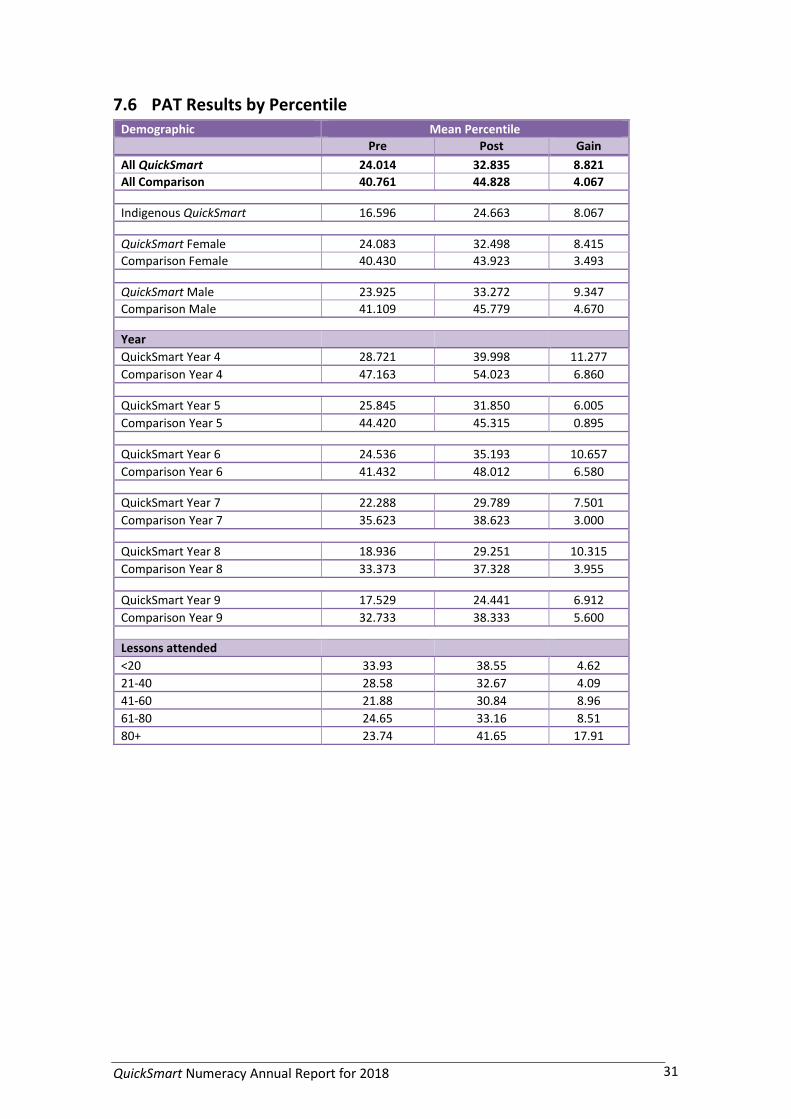
7.6 PAT Results by Percentile Demographic Mean Percentile
Pre Post Gain
All QuickSmart 24.014 32.835 8.821
All Comparison 40.761 44.828 4.067
Indigenous QuickSmart 16.596 24.663 8.067
QuickSmart Female 24.083 32.498 8.415
Comparison Female 40.430 43.923 3.493
QuickSmart Male 23.925 33.272 9.347
Comparison Male 41.109 45.779 4.670 Mean Percentile
Year
QuickSmart Year 4 28.721 39.998 11.277
Comparison Year 4 47.163 54.023 6.860
QuickSmart Year 5 25.845 31.850 6.005
Comparison Year 5 44.420 45.315 0.895
QuickSmart Year 6 24.536 35.193 10.657
Comparison Year 6 41.432 48.012 6.580
QuickSmart Year 7 22.288 29.789 7.501
Comparison Year 7 35.623 38.623 3.000
QuickSmart Year 8 18.936 29.251 10.315
Comparison Year 8 33.373 37.328 3.955
QuickSmart Year 9 17.529 24.441 6.912
Comparison Year 9 32.733 38.333 5.600
Lessons attended
<20 33.93 38.55 4.62
21-40 28.58 32.67 4.09
41-60 21.88 30.84 8.96
61-80 24.65 33.16 8.51
80+ 23.74 41.65 17.91

QuickSmart Numeracy Annual Report for 2018 32
8 APPENDIX B: SiMERR’s Response to RCT
This is SiMERR’s response to the Evaluation Report (Report) of the Evidence for Learning Randomised Controlled Trial of QuickSmart Numeracy (the Trial) evaluated by the Teachers and Teaching Research Centre, University of Newcastle (the Evaluator).
Executive Summary
Data collected by the Evaluator in the Trial and analysed by SiMERR using approved Australian Council for Educational Research (ACER) procedures showed students who undertook 75% or more of the QuickSmart lessons achieved on average 2.5-to-3 times expected one-year’s growth. These results are consistent with that reported by SiMERR, education jurisdictions, principals, schools and parents over the past two decades.
Using Trial data, ACER procedures also show national percentile progress in the 14 months of the Trial for students who achieved:
(i) 90%+ lesson participation in QuickSmart, progressed 38 percentiles from the 11th percentile to the 49th percentile; and
(ii) 75%+ lesson participation progressed 33 percentiles from the 16th percentile to the 49th percentile.
The critical concern of the SiMERR/QuickSmart Team of the Trial is that important data are not clearly revealed in the Report. The analysis in the Report, while technically correct, does not include within-group analysis, which reveals crucial information not made evident in the Report.
Also, not revealed fully or discussed carefully in the Report, are important details on how implementation aspects of the Trial design, including obtaining parent permissions for student participation, pre-and post-testing using PATMaths and randomising students into groups, meant that at least 25%-to-38% of the school year was not available to school for QuickSmart setup and lesson participation.
This loss of school weeks precluded the possibility for schools to offer 30 weeks of QuickSmart instruction. For schools, this meant a late start, early finish, no setup time and no flexibility for them to cover student or Instructor absences, or any competing in-school activities or excursions. The impact of these normal/typical school functions, with no room for schools to manoeuvre, resulted in further reductions in QuickSmart lesson rates that were beyond the control of schools to address.
Because of concerns with these limitations to the Trial, SiMERR conducted additional analyses of the Trial data (i) using the instrument-based national Australian norms of the PAT-Maths test, and (ii) incorporating lesson participation using sub-groups defined by their levels of lesson participation. We argue that a more appropriate analysis procedure is through the Australian Council for Educational Research (ACER), developers of the PAT-Maths test series. ACER’s approach is robust, statistically valid, and widely used and understood throughout Australia and Internationally. The ACER approach is employed currently across Australia involving many 100,000s of students, and operates at national, state, school, sub-school group, and individual-student levels.
Students… with 75%+ lesson participation… achieved on
average 2.5-to-3 times expected one-year’s growth
at least 25%-to-38% of the school year was not available to schools for QuickSmart setup and lesson
participation