acknowledgement - bureau of energy efficiency · acknowledgement deloitte touche tohmatsu india...
TRANSCRIPT


Acknowledgement
Deloitte Touche Tohmatsu India Pvt. Ltd is thankful to Bureau of Energy Efficiency
(BEE), Ministry of Power, Government of India for entrusting us the assignment of study
of Technology gap assessment at Paper Mills located at Muzaffarnagar, Uttar Pradesh.
.
Deloitte Touche Tohmatsu India Pvt. Ltd is also thankful to the all the Muzaffarnagar
paper mill owners and their employees for showing interest to conduct of Energy Audit
study in their plant as a part of program of BEE SME Program and supporting us for the
same.
We also acknowledge support given by Shri Pankaj Agarwal for his continued help, co-
ordination and cooperation throughout the study.
Deloitte Touche Tohmatsu India Pvt. Ltd. Gurgaon

MANUAL ON ENERGY CONSERVATION MEASURES IN PAPER CLUSTER, MUZAFFARNAGAR
CONTENTS
1 About BEE’s SME program .............................................................................................. 1
1.1 Project objectives ........................................................................................................1
1.2 Expected project outcome ...........................................................................................3
1.3 Project duration ...........................................................................................................3
1.4 Identified clusters under the program .........................................................................3
2 Cluster scenario .................................................................................................................. 6
2.1 Overview of SME cluster............................................................................................6
2.1.1 Paper Industry ................................................................................................. 6
2.1.2 Cluster background ......................................................................................... 8
2.1.3 Product manufactured ..................................................................................... 9
2.1.4 Classification of units ................................................................................... 10
2.1.5 Production capacity detail ............................................................................. 10
2.1.6 Raw materials used ....................................................................................... 11
2.2 Energy Situation in the Cluster .................................................................................11
2.2.1 Types of Fuels Used and Prices .................................................................... 16
2.2.2 Energy Consumption in Typical Paper Unit ................................................. 16
2.2.3 Value of Specific Energy Consumption of Typical Paper unit in Muzaffarnagar Paper cluster ......................................................................... 18
2.3 Manufacturing process/technology overview ..........................................................19
2.3.1 Process technology........................................................................................ 19
2.3.2 Process flow diagram .................................................................................... 25
2.4 Issues related to energy usage and conservation and barrier in technology up gradation ...................................................................................................................26
2.4.1 Technological Barrier – Lack of awareness on energy efficiency ................ 26
2.4.2 Financial Barrier – Non availability of funds to implement energy conservation measures .................................................................................. 26
2.4.3 Limited technical manpower ......................................................................... 27
2.5 Cluster Association Details .......................................................................................28
3 Energy Audit and Technology Assessment ................................................................ 29
3.1 Methodology Adopted for Energy Use and Technology Assessment ......................29
3.2 Boundary Parameters ................................................................................................29
3.3 General Methodology ...............................................................................................30
3.3.1 Preliminary Audit.......................................................................................... 30
3.3.2 Detailed Audit ............................................................................................... 31
3.3.3 Post Audit Off–site Work ............................................................................. 32
3.4 Observations Made During the Energy Use and Technology Study ........................32
3.4.1 Manufacturing process and technology/equipments installed ...................... 32
3.4.2 Housekeeping Practices ................................................................................ 34
3.4.3 Availability of Data and Information ............................................................ 35
3.5 Technology Gap Analysis .........................................................................................35
3.6 Energy Conservation Measures Identified ................................................................39
MANUAL ON ENERGY CONSERVATION MEASURES IN PAPER CLUSTER, MUZAFFARNAGAR
3.6.1 ECM 1 – Boiler Efficiency Improvement ..................................................... 39
3.6.2 ECM 2 – Boiler Feed Water Pump Efficiency Improvement ....................... 42
3.6.3 ECM 3 – Boiler Feed Water Pump Pressure Drop Reduction ...................... 43
3.6.4 ECM 4 – Boiler Fans Efficiency Improvement ............................................ 46
3.6.5 ECM 5 – Flash Steam Recovery ................................................................... 48
3.6.6 ECM 6 – Digester Blow Heat Recovery ....................................................... 51
3.6.7 ECM 7 – Steam Consumption Reduction by Efficient Condensate Evacuation from Dryers ................................................................................ 54
3.6.8 ECM 8 – Energy Efficiency Improvement in Process Pumps ...................... 56
3.6.9 ECM 9 – Installation of Screw Press ............................................................ 58
3.6.10 ECM 10 – Installation of High Consistency Pulper ...................................... 60
3.6.11 ECM 11 – Installation of Pocket Ventilation System ................................... 61
3.6.12 ECM 12 – Installation of Pressurized Head Box .......................................... 63
3.7 Barriers in Implementation .......................................................................................64
3.8 AVailability of technlogy suppliers/local service PROVIDERS for identified energy CONSERVATION proposals .......................................................................65
3.9 Identification of technologies for DPR Preparation ..................................................65
4 Environmental Benefits .................................................................................................. 67
5 Small Group Activities/Total Energy Management .................................................. 68
5.1 Introduction ...............................................................................................................68
5.1.1 Economic Factors of Energy Conservation .................................................. 68
5.1.2 Environmental impacts of Energy Conservation .......................................... 69
5.2 Small Group Activities (SGA) ..................................................................................69
5.2.1 Importance of SGA ....................................................................................... 70
5.2.2 How SGA leads to Energy Conservation? .................................................... 70
5.2.3 Steps of Small Group Activities for Energy Conservation ........................... 74
5.2.4 Tools that are Used Often for Small Group Activities for Energy Conservation ................................................................................................. 79
6 Conclusion ......................................................................................................................... 82
6.1 All Energy Saving Measures Identified ....................................................................82
6.2 Techno-economics of Energy Saving Measures Identified ......................................83
6.3 Summary of level of awareness on energy efficiency and energy conservation Potential in the cluster ...............................................................................................85

MANUAL ON ENERGY CONSERVATION MEASURES IN PAPER CLUSTER, MUZAFFARNAGAR
ANNEXS
Annexure 1: List of Paper Mills in Muzaffarnagar Paper Cluster
Annexure 2: Detailed Technology Assessment Report
Annexure 3: Details of Technology / Service Providers in Muzaffarnagar Paper Cluster
Annexure 4: Techno Commercial Bids from Service/Technology Provider
Annexure 5: Financial schemes available for improving energy efficiency in cluster

MANUAL ON ENERGY CONSERVATION MEASURES IN PAPER CLUSTER, MUZAFFARNAGAR
LIST OF TABLES
Table 1: List of BEE SME Energy Efficiency Program Clusters ....................................... 4
Table 2: Classification of Paper Mills .............................................................................. 10
Table 3: Energy Consumption in Indian Paper Mills ....................................................... 13
Table 4: Specific energy consumption norms for India .................................................... 13
Table 5: Fuel & Electricity Details in Muzaffarnagar Paper cluster ................................ 16
Table 6: Annual Energy consumption in different capacities of Agro Waste and Waste Paper based units............................................................................................................... 16
Table 7: Annual Energy consumption in different capacities of Waste Paper based units........................................................................................................................................... 17
Table 8: Annual Energy consumption in different type of Paper units ............................ 17
Table 9: Specific energy consumption .............................................................................. 19
Table 10: Housekeeping practices with associated benefits ............................................. 35
Table 11: Muzaffarnagar Paper Cluster Technology Gap Assessment ............................ 37
Table 12: ECM 1 cost & benefit details ............................................................................ 41
Table 13: Boiler Feed Water Pump Design Parameters ................................................... 42
Table 14: Boiler Feed Water Pump Operating Parameters ............................................... 42
Table 15: ECM 2 cost & benefit details ............................................................................ 43
Table 16: ECM 3 cost & benefit details ............................................................................ 45
Table 17: Boiler FD Fan Operating Parameters ............................................................... 47
Table 18: ECM 4 cost & benefit details ............................................................................ 47
Table 19: ECM 5 cost & benefit details ............................................................................ 51
Table 20: ECM 6 cost & benefit details ............................................................................ 53
Table 21: ECM 7 cost & benefit details ............................................................................ 55
Table 22: Details of pumps ............................................................................................... 56
Table 23: ECM 8 cost & benefit details ............................................................................ 57
Table 24: ECM 9 cost & benefit details ............................................................................ 59
Table 25: ECM 10 cost & benefit details .......................................................................... 61
Table 26: ECM 11 cost & benefit details .......................................................................... 62
Table 27: ECM 12 cost & benefit details .......................................................................... 63
Table 28: Details of Technology Upgradation Projects Identified in Cluster .................. 66
Table 29: GHG emission reduction potential ................................................................... 67
Table 30: List of Energy Conservation Measures Identified ............................................ 82
Table 31: Techno-Economics of Energy Saving Measures Identified ............................. 83
Table 32: Annual energy consumption of various energy sources in Muzaffarnagar Paper cluster ................................................................................................................................ 85
Table 33: List of Paper Mills in Cluster............................................................................ 86
Table 34: Boiler Efficiency Improvement Technological Assessment ............................ 89
Table 35: List of Technology/Service Providers .............................................................. 90

MANUAL ON ENERGY CONSERVATION MEASURES IN PAPER CLUSTER, MUZAFFARNAGAR
LIST OF FIGURES
Figure 1: Distribution of paper mills in Muzzaffarnagar ................................................... 8
Figure 2: Product wise classification of Paper Mills .......................................................... 9
Figure 3: Production capacity wise classification of Paper Mills ..................................... 10
Figure 4: Raw material wise classification of Paper Mills ............................................... 11
Figure 5: Energy Cost to the total cost in Indian Paper plants .......................................... 12
Figure 6: Percentage Contribution of Inputs in Paper Production .................................... 12
Figure 7: Energy Usage Vs Product type .......................................................................... 14
Figure 8: Specific Steam Consumption – Indian Paper Mills Vs International Mills ...... 15
Figure 9: Specific Electricity Consumption – Indian Paper Mills Vs International Mills 15
Figure 10: Percentage of total energy consumption in different type of units .................. 18
Figure 11: Agro-residue Chemical Pulping Process ......................................................... 21
Figure 12: Process Flow diagram representing waste paper & agro residue as raw material ............................................................................................................................. 25
Figure 13: General methodology followed by Deloitte .................................................... 30
Figure 14: Audit Methodology ......................................................................................... 31
Figure 15: Operating and proposed efficiency graph ....................................................... 40
Figure 16: Present Boiler feed water system .................................................................... 44
Figure 17: Proposed Boiler feed water system ................................................................. 44
Figure 18: FD Fan Schematic Diagram ............................................................................ 46
Figure 19: Existing System ............................................................................................... 48
Figure 20: Proposed Scheme for Heat Recovery– Option 1 ............................................. 49
Figure 21: Working of a Thermo Compressor .................................................................. 49
Figure 22: Proposed Scheme for Heat Recovery–Option 2 .............................................. 50
Figure 23: Present System ................................................................................................ 52
Figure 24: Proposed System ............................................................................................. 53
Figure 25: Stationary Syphon ........................................................................................... 55
Figure 26: Twin Drum Washer ......................................................................................... 58
Figure 27: Screw Press...................................................................................................... 59
Figure 28: High Consistency Pulper ................................................................................. 60
Figure 29: Relationship of SGA and energy saving ......................................................... 70
Figure 30: Example of Organizational Structure with Overlapping ................................. 71
Figure 31: Positioning of SGA in Main Job Structure ...................................................... 72
Figure 32: 10 Stages for Success ...................................................................................... 74
Figure 33: SGA Circle ...................................................................................................... 75
Figure 34: 10 Stages for Success ...................................................................................... 75
Figure 35: 5S’s .................................................................................................................. 79
Figure 36: Variation of Boiler Efficiency with Oxygen Level in Flue Gas...................... 88

MANUAL ON ENERGY CONSERVATION MEASURES IN PAPER CLUSTER, MUZAFFARNAGAR
ABBREVIATIONS
MSME Micro Small and Medium Enterprises
SMEs Small and Medium Enterprises
GOI Government of India
BEE Bureau of Energy Efficiency
EE Energy Efficiency
DPRs Detailed Project Reports
TPA Tonnes Per Annum
MTOE Metric Tonnes of Oil Equivalent
mn kJ Million Kilo Joules
kW Kilo Watt
hp Horsepower
kWh Kilo Watt Hour
GHGs Green House Gasses
LSPs Local Service Providers
MANUAL ON ENERGY CONSERVATION MEASURES IN PAPER CLUSTER, MUZAFFARNAGAR
P a g e | 1
11 AAbboouutt BBEEEE’’ss SSMMEE pprrooggrraamm
11..11 PPRROOJJEECCTT OOBBJJEECCTTIIVVEESS
Under the provisions of the Energy Conservation Act, 2001, Bureau of Energy Efficiency
has been established with effect from 1st March, 2002 by merging into it, the erstwhile
Energy Management Centre, being a society registered under the Societies Registration
Act, 1860, under the Ministry of Power. The mission of the Bureau of Energy Efficiency
is to assist in developing policies and strategies with a thrust on self-regulation and
market principles, within the overall framework of the Energy Conservation Act, 2001
with the primary objective of reducing energy intensity of the Indian economy.
The target growth for industry sector was put at 10% during 10th Plan consistent with an
overall GDP growth of 8%.The rate of growth of industry sector as measured in IIP
(Index of Industrial Production) was 7.8% during April – December 2005 compared to
8.6% in the corresponding period of 2004-05 (Economic Survey, GoI, 2005-06).
Manufacturing sector grew at 8.9% during this period, contributing for the overall growth
of the economy. Indian industry sector accounted for nearly 43% of commercial energy
consumption during 2003/04 (93 million tonnes of oil equivalent) with coal and lignite
meeting nearly 1/3rd of the consumption requirements Industry sector also offers
maximum potential for energy conservation. The Government of India has also
recognized this when a number of energy intensive industries were included as
designated consumers in the Energy Conservation Act, 2001. Under the provisions of
the EC Act, the identified energy intensive industries need to comply with the conduct of
regular energy audits and implementation of techno-economically viable
recommendations and establishment of energy management systems through
appointment of certified Energy Manager, and meeting of specific energy consumption
norms once developed. To bridge the efficiency gaps in the various units within the
same sub-sector, there is need to identify general and specific energy saving measures
to facilitate the industries in their faster implementation in their respective plants.
However the need for developing information and projects in much more in the SME
sector which usually cannot obtain or source the information needed with regard to
energy efficiency.

MANUAL ON ENERGY CONSERVATION MEASURES IN PAPER CLUSTER, MUZAFFARNAGAR
P a g e | 2
Large number of Small and Medium Enterprises (SMEs) like foundries, brass, textiles,
refractories, brick, ceramics, glass, utensils, rice mills, paper manufacturing units etc, are
said to have large potential for energy savings. Many of these units are in clusters
located in various states of the countries. In quantitative terms, there is not much
authentic information and data available with respect to their energy consumption and
energy saving opportunities. Majority of SMEs are typically run by entrepreneurs who
are leanly staffed with trained technical and managerial persons to deploy and capture
energy efficiency practice to reduce manufacturing cost and increase competitive edge.
Therefore, it will be useful to build their energy efficiency awareness by
funding/subsidizing need based studies in large number units in the SMEs and giving
energy conservation recommendations including technology up-gradation opportunities.
It is envisaged that such interventions supported by diagnostic studies and pilot projects
at cluster level focusing on energy/resource efficiency, energy conservation and
technology up gradation. This would help in addressing the cluster specific problems and
enhancing energy efficiency in SMEs.
BEE has decided to initiate diagnostic studies in 28 clusters to prepare cluster specific
energy efficiency manuals covering Specific energy consumption norms, energy efficient
process and technologies, best practices, case studies, etc. These studies would
provide information on technology status, best operating practices, gaps in skills and
knowledge, energy conservation opportunities, energy saving potential, etc for each of
the subsector in SMEs. The studies/projects will also be aimed to provide a direction for
designing sub-sector specific energy conservation programs in the SME sectors. BEE
will also undertake capacity building of local service providers and entrepreneurs/
managers of SMEs. The local service providers will be trained in order to be able to
provide the local services in the setting of energy efficiency projects in the clusters.
The programme will prepare detailed project reports for about 15 energy efficiency
projects in per cluster. These projects will be prepared in such a way that a minimum of
5 technologies are covered and about three sizes (scale) are considered
The global objective of the project is to improve the energy intensity of the Indian
economy by undertaking actions in the SME sector which directly or indirectly produces
60% of the GDP. The immediate objective of the project is to accelerate the adoption of
EE technologies and practices 28 chosen clusters in the SME sector through knowledge
sharing, capacity building and development of innovative financing mechanisms.

MANUAL ON ENERGY CONSERVATION MEASURES IN PAPER CLUSTER, MUZAFFARNAGAR
P a g e | 3
Program objectives will broadly cover 4 major activities which are part of this program.
1. Energy Use and Technology Analysis
2. Capacity Building,
3. Implementation of EE measures,
4. Facilitation of Innovative Financing Mechanisms
11..22 EEXXPPEECCTTEEDD PPRROOJJEECCTT OOUUTTCCOOMMEE
The outcome of the project will be the adoption of EE technologies and practices in
chosen clusters in the SME sector through knowledge sharing, capacity building and
generation of bankable energy efficiency (EE) project proposals for financing/co-
financing and focusing the cluster of projects with effective communication mechanism
to maximize the chances of getting bankable projects and development of innovative
financing mechanisms
The project will help in assessing total energy usage in cluster, a cluster manual for each
of the chosen SME cluster which will give an overview of the cluster, technologies in
use, potential for energy savings, EE measures applicable, Best Practices /
Technological Innovations in the cluster.
11..33 PPRROOJJEECCTT DDUURRAATTIIOONN
Duration of the project is around two and half years. Situation analysis which was the
first activity as part of this program was started in January 2009. The last activity of the
program is planned to get over by June- July 2011.
11..44 IIDDEENNTTIIFFIIEEDD CCLLUUSSTTEERRSS UUNNDDEERR TTHHEE PPRROOGGRRAAMM
BEE has rolled out SME Energy Efficiency program in phases. Phase 1 comprised of 7
clusters, Phase II consists of 18 clusters and now recently 3 clusters are added in Phase
III. In totality there are 28 clusters which are indentified by BEE for this study.
List of clusters with their product name and location is mentioned in the table below:

MANUAL ON ENERGY CONSERVATION MEASURES IN PAPER CLUSTER, MUZAFFARNAGAR
P a g e | 4
Table 1: List of BEE SME Energy Efficiency Program Clusters
Sr. No Cluster Product Name State
1 Jamnagar Brass Gujarat
2 Warangal Rice Milling Andhra Pradesh
3 Surat Textiles Gujarat
4 Pali Textiles Rajasthan
5 Morvi Ceramics Gujarat
6 Ahmedabad Chemical Industries Gujarat
7 Solapur Textiles Maharashtra
8 Alwar Oil Milling Rajasthan
9 Bangalore Machine Tools Karnataka
10 Batala, Jalandhar and
Ludhiana
Foundries Punjab
11 Bhimavaram Ice Making Andhra Pradesh
12 Bhubhneswar Brass Orissa
13 E & W Godavari Refractories Andhra Pradesh
14 Ganjam Rice Milling Orissa
15 Gujarat Dairy Gujarat
16 Howrah Galvanizing West Bengal
17 Jagadhri Brass and Aluminum Haryana
18 Jodhpur Limestone Rajasthan
19 Jorhat Tea Assam
20 Kochi Sea Food Processing Kerala
21 Muzaffarnagar Paper Uttar Pradesh
22 Orissa Sponge Iron Orissa
23 Vapi Chemicals & Dyes Gujarat
24 Varanasi Bricks Uttar Pradesh
25 Vellore Rice Milling Tamil Nadu

MANUAL ON ENERGY CONSERVATION MEASURES IN PAPER CLUSTER, MUZAFFARNAGAR
P a g e | 5
26 Alleppey Coir Kerala
27 Mangalore Tile Karnataka
28 Tiripur Textile Tamil Nadu

MANUAL ON ENERGY CONSERVATION MEASURES IN PAPER CLUSTER, MUZAFFARNAGAR
P a g e | 6
22 CClluusstteerr sscceennaarriioo
22..11 OOVVEERRVVIIEEWW OOFF SSMMEE CCLLUUSSTTEERR
2.1.1 Paper Industry
India’s economy has experienced remarkable growth in the last 5 years. There is a clear
demand growth in all-major sectors of the economy including the manufacturing sector.
The Indian paper industry is poised to grow and touch 11.5 million tonnes in 2011-12
from 9.18 million tonnes 2009-10 at the rate of 8% per annum1.
The Indian Paper Industry accounts for about 1.6% of the world’s production of paper
and paperboard. The estimated turnover of the industry is Rs 25,000 crore (USD 5.95
billion) approximately and its contribution to the exchequer is around Rs. 2918 crore
(USD 0.69 billion). The industry provides employment to more than 0.12 million people
directly and 0.34 million people indirectly. There are about 666 paper industries engaged
in the manufacture of pulp, paper, and paperboards, of which about 568 units with a total
installed capacity of 7.40 MT per annum are in operation, whereas 98 units with an
installed capacity of 1.1 MT have been closed down. About 38% of the total paper
production is based on recycled paper, 32% on wood, and the remaining 30% on agri-
residue. Production of paper and paperboards increased from 5.90 MT in 2005/06 to
6.14 MT in 2006/07 and was 4.15 MT in 2007/08 (up to November). The country is
almost self-sufficient in the manufacture of most varieties of paper and imports only
certain speciality papers such as coated and cheque papers from Singapore, USA, UK,
Japan, Germany, and Malaysia. Writing and printing grade paper, art paper, coated
paper, and so on are exported to neighboring countries like Sri Lanka, Bangladesh,
Nepal, and Middle East countries.
As per industry estimates, per capita paper consumption increased to 9.18 kg on 2009-
10 as compared to 8.3 kg during 2008-09. Increase in demand of paper has been
hovering around 8% for some time. India has emerged as the fastest growing market
when it comes to consumption, posting 10.6% growth in per capita consumption of paper
in 2009-10. So far, the growth in paper industry has mirrored the growth in GDP and has
grown on an average 6-7 per cent over the last few years. India is the fastest growing
1 Source - Associated Chambers of Commerce and Industry of India

MANUAL ON ENERGY CONSERVATION MEASURES IN PAPER CLUSTER, MUZAFFARNAGAR
P a g e | 7
market for paper globally and it presents an exciting scenario; paper consumption is
poised for a big leap forward in sync with the economic growth and is estimated to touch
13.95 million tons by 2015-16. The futuristic view is that growth in paper consumption
would be in multiples of GDP and hence an increase in consumption by one kg per
capita would lead to an increase in demand of 1 million tons. As per industry estimate,
paper production is likely to grow at a CAGR of 8.4% while paper consumption will grow
at a CAGR of 9% till 2012-13. The import of pulp & paper products is likely to show a
growing trend.
The increasing demand for paper brings with it new challenges of economies of scale,
efficient usage of resources, need to develop and expand sustainable use of fibre, and
value chain management, etc. Despite the fact that the Indian Paper Industry holds its
importance to the national economy, unfortunately it stands fragmented. The average
capacity of a paper mill in India is about 10,500 tonnes per annum (35 tonnes per day)
compared to 85,000 tonnes per annum (260 tonnes per day) in Asia and 300,000 tonnes
per annum (900 tonnes per day) in Europe and North America. The Indian pulp and
paper industry is highly fragmented, with top five producers accounting for 25% of the
total capacity. Several large integrated mills came onstream during the late 1970s. The
government policies in the 1980s and 1990s have led to the growth of a large number of
small capacity mills using agro-waste as raw material. The Indian paper industry is
highly energy-intensive. The share of energy costs in the total manufacturing cost is
close to 25%. Fuel and electricity are two major energy sources used in paper
production. There is a growing need to modernize the Indian mills and improve
productivity. Most of the paper mills operating in India, particularly small mills, are very
old using out-dated technology including plant & machinery. Being protected from
international competition for about four decades, Indian paper mills, in general, did not
keep up with the technological advancement in the other parts of the world. Hence there
is a need to adopt new and efficient technologies because of high product quality,
international competition, mounting pressure from environmental regulatory, rise in
energy prices, etc.

MANUAL ON ENERGY CONSERVATION MEASURES IN PAPER CLUSTER, MUZAFFARNAGAR
P a g e | 8
2.1.2 Cluster background
Muzaffarnagar is situated in Western Uttar Pradesh and is important industrial town with
paper, sugar and steel being the major products. Muzaffarnagar paper cluster has
around 29 paper units. The entire paper cluster is geographically divided into three
areas, namely Bhopa Road, Jansath Road and Shamli in Muzaffarnagar district. The
reason for such high concentration of mills is easy availability of raw material in the area.
Paper units are normally having out-dated technologies characterized by inefficient
energy and water management systems. In terms of raw material usage, mills can be
broadly put in two categories – waste paper based and agro-waste based. Similarly, for
finished products too, though bulk of the mills produces only kraft paper, a few of them
have started producing writing paper. These mills are quite closely networked and
successful development in one mill is very rapidly replicated in large number of similar
mills.
The total installed capacity of all the paper mills in Muzaffarnagar is approximately
542700 MTPA. These mills are a mix of waste paper & agro. While 12 mills under the
BEE SME Program are agro-cum waste paper based, 16 of them are solely waste paper
based and 1 mill which is recently established is agro based.
0
50000
100000
150000
200000
250000
300000
350000
waste/agro based waste based
Capacity (TPA)
Figure 1: Distribution of paper mills in Muzzaffarnagar
12
16

MANUAL ON ENERGY CONSERVATION MEASURES IN PAPER CLUSTER, MUZAFFARNAGAR
P a g e | 9
An important aspect of the mills here is that some of these units have a common
business operational structure due to fact that they share the same management. As
such the cluster based advantage is already being derived by most of these units. A
large percentage of these mills were set up in 80’s and 90’s in the small and medium
sector.
The capacity utilization of all these mills ranges from 20% to 90%. Out of the total mills,
43% are based upon both agro and waste material whereas 57% are waste paper
based. Classification can also be done based upon the product. While only 16% are
involved in the manufacture of only duplex board, a healthy 66% are into making Kraft
paper only & 22% make writing/printing paper along with small quantities of either duplex
board or Kraft paper.
2.1.3 Product manufactured
Majority of paper mills produce Kraft Paper of varying BF (Breaking Factor) and Duplex
Board. A few of them have started producing writing paper. In addition to Kraft paper and
writing paper some units also produces Printing paper, Filter paper, Gray Board, Poster
Paper and Hard tissue paper.
Figure 2: Product wise classification of Paper Mills

MANUAL ON ENERGY CONSERVATION MEASURES IN PAPER CLUSTER, MUZAFFARNAGAR
P a g e | 10
2.1.4 Classification of units
Units can be classified broadly with respect to size/capacity, raw material used and the
product
Table 2: Classification of Paper Mills Size Raw Material Product
75000 TPA to 3400 TPA Agro and Waste
Paper Based
Waste Paper Based
Agro Based
Kraft Paper
Writing Paper
Other
The list of units along with their product, capacity and raw material used is provided in
Annexure 1.
2.1.5 Production capacity detail
The paper mills in the cluster vary widely in capacity. There are mills with capacities as
low as 1750 TPA and as high as 87500 TPA. The variation with respect to capacity is
represented in the chart below.
Figure 3: Production capacity wise classification of Paper Mills
MANUAL ON ENERGY CONSERVATION MEASURES IN PAPER CLUSTER, MUZAFFARNAGAR
P a g e | 11
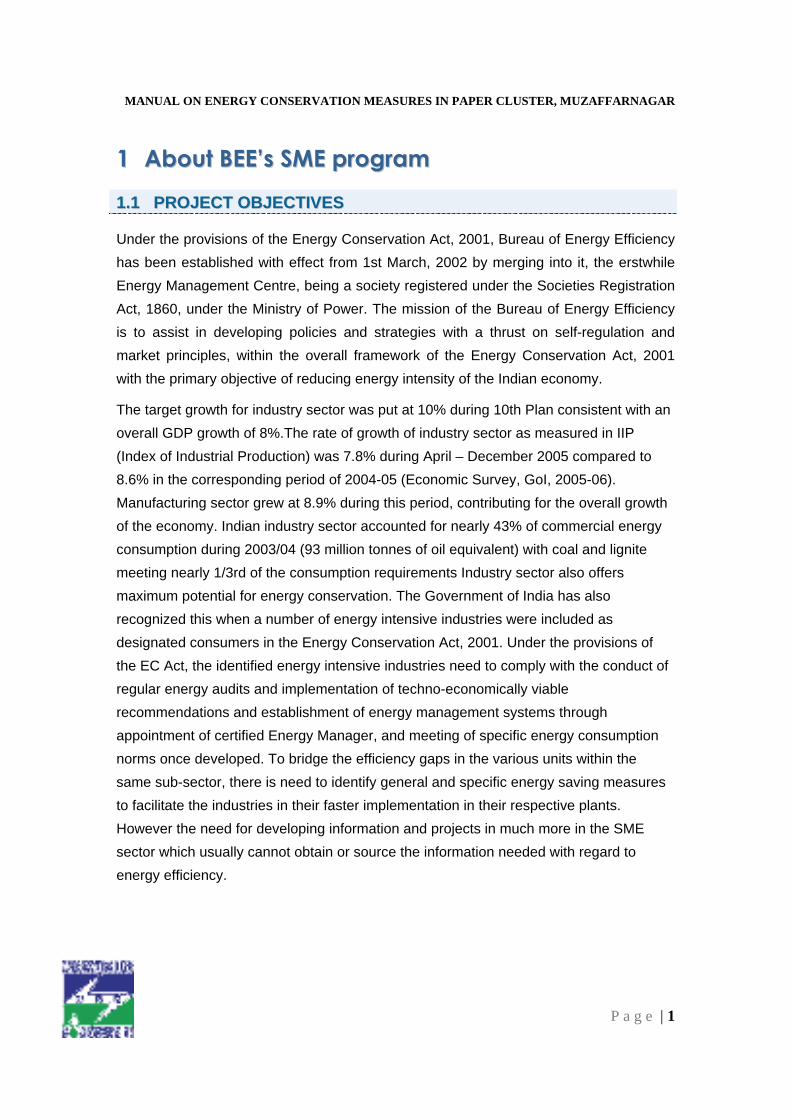
2.1.6 Raw materials used
The paper mills in Muzaffarnagar are either based on waste paper or agro residue.
While 12 mills under the BEE SME Program are agro-cum waste paper based, 16 of
them are solely waste paper based and 1 mill which is recently established is agro
based. The variation with respect to raw materials used is represented in the chart
below.
Figure 4: Raw material wise classification of Paper Mills
22..22 EENNEERRGGYY SSIITTUUAATTIIOONN IINN TTHHEE CCLLUUSSTTEERR
Energy is an essential input and a major cost driver in Paper manufacturing. Nearly 26%
of the Indian paper Plants have the energy cost to the total cost falling in the range of
20-30% as can be seen from Figure 5 below. However there are examples of world-
class paper mills in India with comparable energy consumption. From cursory analysis, it
can be stated that there is a possibility of 20-30% reduction in energy consumption of
the paper mills in the cluster.

MANUAL ON ENERGY CONSERVATION MEASURES IN PAPER CLUSTER, MUZAFFARNAGAR
P a g e | 12
Figure 5: Energy Cost to the total cost in Indian Paper plants
The input costs in manufacturing vary widely depending upon the location of the mill, raw
material usage and also finished product profile. Figure 6 below shows the figures for a
large section of mills in India.
Figure 6: Percentage Contribution of Inputs in Paper Production
However, as would be seen from a later analysis of some of the bigger integrated mills,
energy consumption constitutes about 20% of the manufacturing cost on an average.
Plants with energy cost to total cost falling in the range of 20 to 30 %
Low capacity but highly energy intensive
World-class standards

MANUAL ON ENERGY CONSERVATION MEASURES IN PAPER CLUSTER, MUZAFFARNAGAR
P a g e | 13
The figure may vary from mill to mill but it is quite evident that the industry is highly
energy intensive. The consumption of steam in a wood based paper mill is 10 to 11 tons/
ton of paper compared to international standards of 6.5 – 8.5 t/t while the power is 1500-
1700 kWh/ton of paper compared to 1150-1250 kWh achieved in more efficient units.
Almost the entire process of manufacturing is energy intensive as shown in Table below.
Table 3: Energy Consumption in Indian Paper Mills SN Section/Equipment Steam
(T/t of
paper)
Fuel
(GJ/t of
paper)
Electricity
(KWh/t of
paper)
Final
Energy
(GJ/t of
paper)
1. Chipper 112-128 0.4-0.5
2. Digester 2.7-3.9 12.5-18.0 58-62 12.7-18.2
3. Evaporator 2.5-4.0 11.5-185 11.5-18.5
4. Washing & Screening 145-155 0.5-0.6
5. Bleaching 0.35-0.4 1.6-1.8 88-92 1.9-2.2
6. Soda Recovery 0.5-1.1 2.3-5.1 170-190 2.9-5.8
7. Stock Preparation 275-286 0.99-1.03
8. Paper Machine 3.0-4.0 13.8-18.5 465-475 15.5-20.2
9. Deaerator 0.8-1.2 3.7-5.5 3.7-5.5
10. Utilities and Others 248-252 0.89-0.91
Total 10-16 46.2-73.8 1500-1700 51.6-80.0&&
Based on the available data, a number of mills have been analyzed and the specific
energy consumption determined as shown in Table below:
Table 4: Specific energy consumption norms for India Parameter Writing and
PrintingKraft Boards
Agro Waste Agro Waste Agro Waste Steam T/T 5.8 2.8 4.1 2.3 2.2 2.4
&& SOURCE: IPPTA
MANUAL ON ENERGY CONSERVATION MEASURES IN PAPER CLUSTER, MUZAFFARNAGAR
P a g e | 14
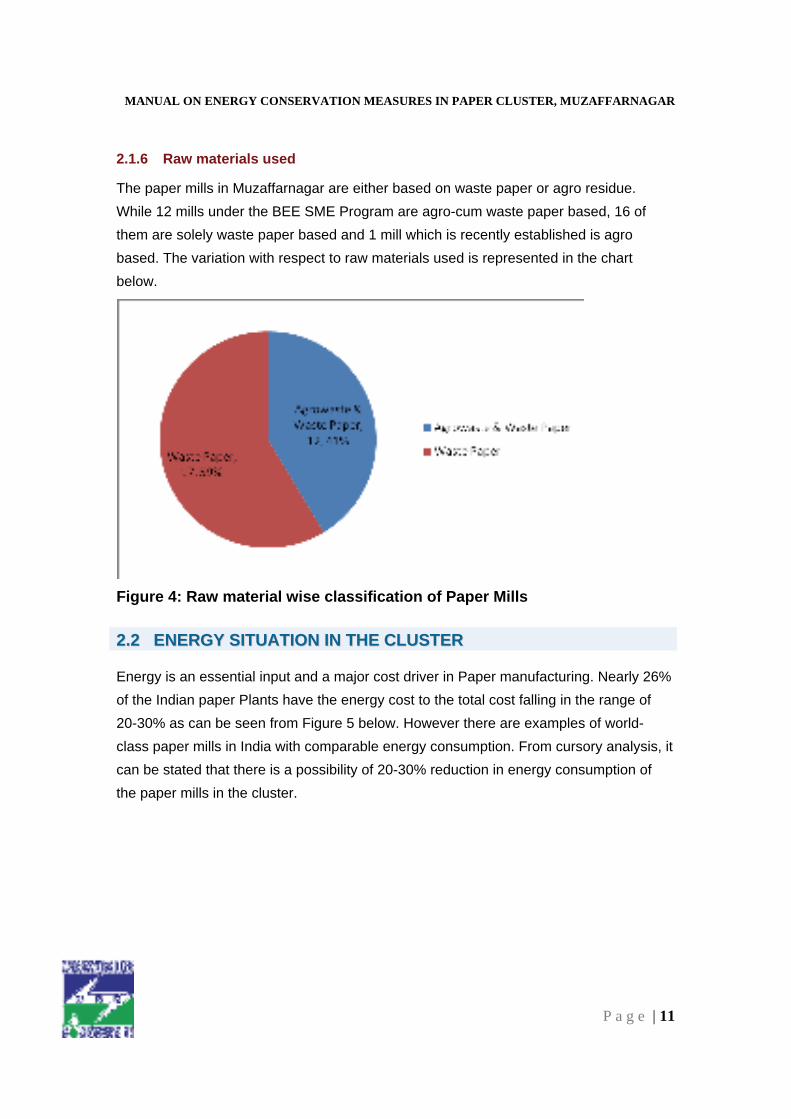
Power (kWh/T) 1200 700 650 550 615 685
Steam (GJ/T) 24.6 12 17.6 9.9 9.4 10.3
Power (GJ/T) 4.3 2.5 2.3 2 2.2 2.5
Final Energy (GJ/T) 29 14.5 19.9 11.8 11.6 12.8
++
These figures are by and large 25 to 30% higher compared to the best achieved by
number of mills in India and 30 to 40% higher compared to international benchmark.
This observation is also in line with findings from numerous audit reports carried out by
energy consulting firms from time to time and Governmental agencies like BICP etc.
75-85% of the energy requirement in the paper manufacturing process is in the form of
process heat (made available through steam) while 15-25% is needed as electrical
power. It is one of the most challenging tasks to benchmark energy cost due to the
various diversity factor and also significant difference in the delivered price of fuels due
to location factor. It is however, still possible to develop a model for each individual
factory for the specific power and steam consumptions. Figure 7 below shows typical
energy consumptions for some of the factories producing different kinds of papers.
Figure 7: Energy Usage Vs Product type
++SOURCE: INDIA’S PULP & PAPER: PRODUCTIVITY & ENERGY EFFICIENCY, LBNL, 1999

MANUAL ON ENERGY CONSERVATION MEASURES IN PAPER CLUSTER, MUZAFFARNAGAR
P a g e | 15
These figures compared to some of the international benchmark (Figure 8 and Figure 9)
indicate energy savings opportunity by 30 to 50%. Though like to like comparison may
not be very valid for reasons explained earlier, such comparison still provide a directional
approach for targeting energy efficiency improvement efforts.
Specific Steam Consumption - Indian Mills Vs Mills abroad
0
1
2
3
4
5
Digester Evaporator Paper machine Soda recoveryplant
Bleach plant Deaerator
Section of the paper Mill
To
n o
f st
ea
m u
sed
/ to
n o
f p
ap
er
pro
du
ced
Indian mills
Mills abroad
Figure 8: Specific Steam Consumption – Indian Paper Mills Vs International Mills
Specific Electricity Consumption - Indian Mills Vs Mills Abroad
0
100
200
300
400
500
Paper Machine Stockpreparation
Utilities andothers
Soda recoveryplant
Washing andScreening
Section
Chippers Bleach Plant Digesters
Section
kWh
/ To
n o
f p
ape
r
Indian mills
Mills abroad
Figure 9: Specific Electricity Consumption – Indian Paper Mills Vs International Mills**
** SOURCE: LAWRENCE BERKLEY STUDY

MANUAL ON ENERGY CONSERVATION MEASURES IN PAPER CLUSTER, MUZAFFARNAGAR
P a g e | 16
2.2.1 Types of Fuels Used and Prices
The paper mills in the Muzaffarnagar cluster use various types of fuels like coal,
biomass, pet coke etc. The primary fuel used in all the mills is coal and biomass. Rice
husk, pith and bagasse are the major biomass used in the cluster. In few mills wood
chips are also used as a supplementary fuel. The details are of the same are provided in
table below:
Table 5: Fuel & Electricity Details in Muzaffarnagar Paper cluster Sr.
No
Fuel Approx. Calorific Value of
Fuels, kCal/kg
Price
1 Coal 3,800 2,770 to 3,800 Rs/MT
2 Rice Husk 3,300 2,500 Rs/MT
3 Bagasse 2,000 550 to 750 Rs/MT
4 Wood 3,500 1,200 Rs/MT
5 Electricity - 3.00 to 4.45 Rs/kWh
2.2.2 Energy Consumption in Typical Paper Unit
Energy consumption (thermal energy & electrical energy) in Paper unit depends on
capacity of unit and raw material used in the unit. Annual Electrical energy and thermal
energy consumption in typical paper mill is presented in tables below:
Table 6: Annual Energy consumption in different capacities of Agro Waste and Waste Paper based units
Parameter Unit <= 10000TPA
10000 to 30000 TPA
> 30000 TPA
Electricity2
Annual Consumption kWh 6,165,556 9,387,530 - Rate Rs/kWh 4.23 3.72 -Fuel Annual Consumption MT 2,141 13,633 36,074Gross Calorific Value kCal/kg 2,877 2,664 3,727 Rate Rs/MT 1,622 2,124 3,217No. of Units - 2 6 4 Gross Electricity kWh 12,331,112 56,325,180 -
2 All paper units with capacity >30000 TPA have cogeneration units. As such the entire energy consumption is represented in terms of fuel only

MANUAL ON ENERGY CONSERVATION MEASURES IN PAPER CLUSTER, MUZAFFARNAGAR
P a g e | 17
ConsumptionGross Fuel Consumption Heat,
GJ51,561 912,290 2,250,896
Gross Energy Consumption
MTOE 2,288 26,564 53,593
Total Energy Consumption
MTOE 82,445
Table 7: Annual Energy consumption in different capacities of Waste Paper based units
Parameter Unit <= 10000TPA
10000 to 30000 TPA
Electricity Annual Consumption kWh 6,054,698 8,489,054Rate Rs/kWh 4.23 3.68Fuel Annual Consumption MT 1,082 5,384Gross Calorific Value kCal/kg 3,047 2,687Rate Rs/MT 2,761 1,188No. of Units - 11 5Gross Electricity Consumption
kWh 66,601,683 42,445,269
Gross Fuel Consumption Heat,GJ
151,793 302,805
Gross Energy Consumption
MTOE 9,341 10,859
Total Energy Consumption
MTOE 20,200
Annual energy consumption in different type of units is calculated and details of the
same are presented in same below:
Table 8: Annual Energy consumption in different type of Paper units
S. No Type of Unit Energy
consumption
(MTOE)
1 Agro Waste and
Waste Paper
Based
82,445
2 Waste Paper
Based
20,200

MANUAL ON ENERGY CONSERVATION MEASURES IN PAPER CLUSTER, MUZAFFARNAGAR
P a g e | 18
3 Total 102,645
Total annual energy consumption in cluster is around 102,645 MTOE (Metric Tonne of
oil equivalent). Percentage of total energy consumption in different type of units in
cluster is presented in figure below:
2.2.3 Value of Specific Energy Consumption of Typical Paper unit in
Muzaffarnagar Paper cluster
The electricity demand of the paper mills in Muzaffarnagar SME cluster is either met
through supply from electricity grid or in house generation. The paper mills with grid
connection only have DG set as a backup in the event of grid breakdown. Most of the
units are self dependant in terms of electricity and have in house facilities to meet the
electricity demand. The units have installed biomass/coal based thermal cogeneration
systems to meet the steam and power demand of the paper mill simultaneously. The
cumulative power generation capacity of the cluster is around 68.3 MW. While some of
these systems are efficient with high pressure configuration, there are still a few at
medium pressure ratings.
Figure 10: Percentage of total energy consumption in different type of units
MANUAL ON ENERGY CONSERVATION MEASURES IN PAPER CLUSTER, MUZAFFARNAGAR
P a g e | 19
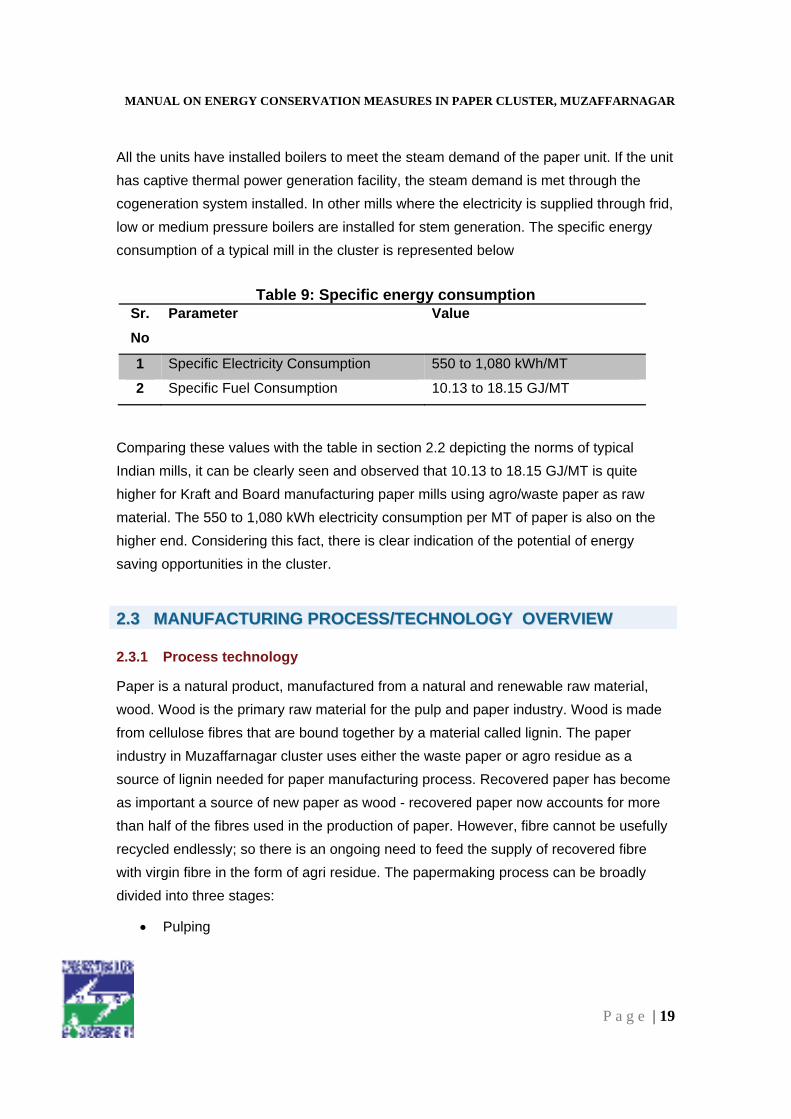
All the units have installed boilers to meet the steam demand of the paper unit. If the unit
has captive thermal power generation facility, the steam demand is met through the
cogeneration system installed. In other mills where the electricity is supplied through frid,
low or medium pressure boilers are installed for stem generation. The specific energy
consumption of a typical mill in the cluster is represented below
Table 9: Specific energy consumption Sr.
No
Parameter Value
1 Specific Electricity Consumption 550 to 1,080 kWh/MT
2 Specific Fuel Consumption 10.13 to 18.15 GJ/MT
Comparing these values with the table in section 2.2 depicting the norms of typical
Indian mills, it can be clearly seen and observed that 10.13 to 18.15 GJ/MT is quite
higher for Kraft and Board manufacturing paper mills using agro/waste paper as raw
material. The 550 to 1,080 kWh electricity consumption per MT of paper is also on the
higher end. Considering this fact, there is clear indication of the potential of energy
saving opportunities in the cluster.
22..33 MMAANNUUFFAACCTTUURRIINNGG PPRROOCCEESSSS//TTEECCHHNNOOLLOOGGYY OOVVEERRVVIIEEWW
2.3.1 Process technology
Paper is a natural product, manufactured from a natural and renewable raw material,
wood. Wood is the primary raw material for the pulp and paper industry. Wood is made
from cellulose fibres that are bound together by a material called lignin. The paper
industry in Muzaffarnagar cluster uses either the waste paper or agro residue as a
source of lignin needed for paper manufacturing process. Recovered paper has become
as important a source of new paper as wood - recovered paper now accounts for more
than half of the fibres used in the production of paper. However, fibre cannot be usefully
recycled endlessly; so there is an ongoing need to feed the supply of recovered fibre
with virgin fibre in the form of agri residue. The papermaking process can be broadly
divided into three stages:
� Pulping

MANUAL ON ENERGY CONSERVATION MEASURES IN PAPER CLUSTER, MUZAFFARNAGAR
P a g e | 20
� Papermaking
� Finishing
PULPING
Paper is made from the cellulose fibres that are present in hardwood and softwood
trees. In a pulp mill, the fibres are separated from one another into a mass of individual
fibres. Whether using wood or recovered paper, the first step is to dissolve the material
into pulp. Regardless of the type of pulping process used, the wood or recovered paper
is broken down into its component elements so that the fibres can be separated. After
separation, the fibres are washed and screened to remove any remaining fibre bundles.
The pulp may then be used directly to make unbleached papers, or bleached for white
papers. The water is then pressed out and the residue is dried. The pulping results in a
mass of individual fibres being produced. In an 'integrated paper mill' the pulp will be fed
directly to a paper machine. Alternatively, it will be dried and pressed into bales ready for
use as a raw material in paper mills.
The pulp-making process
1. Timber and debarking
2. Pulp is graded and classified according to: the method of the production (e.g.
chemical or mechanical pulp); the species of tree used (e.g. softwood or
hardwood); and by level of processing (e.g. bleached or unbleached). Pulp
generated from recovered paper is similarly graded.
Making Pulp from Agro residue
In chemical pulping, the Agro Residue (Baggasse)/Wood chips are cooked in a digester
with chemicals. Cooking removes lignin, breaking up the wood into fibres. The process
results in a slurry, where fibres are loose but intact and have maintained their strength.
Generally, chemical pulp is based on one of two processes: sulphate or sulphite. Most
chemical pulp is made by the alkaline kraft or sulphate process which uses caustic soda
and sodium sulphate to "cook" the wood chips. In the unbleached stage, a dark brown,
but very strong pulp results which can be bleached to a high brightness if required. The
cooking chemicals are recovered back to the process through evaporation and burning
plants. Cooked pulp is washed and screened to achieve more uniform quality.

MANUAL ON ENERGY CONSERVATION MEASURES IN PAPER CLUSTER, MUZAFFARNAGAR
P a g e | 21
Figure 11: Agro-residue Chemical Pulping Process
The alternative method is the sulphite pulping process. This method is based on an acid
cooking liquor process, and it is best suited for specialty pulp. The sulphite mills produce
easily bleached pulps, generally with hydrogen peroxide. These pulps fulfil today's
demand for "chlorine free" products in the disposables sector and also in printing and
writing papers.
The yield in both chemical processes is much lower than in the manufacture of ground
wood, as the lignin is completely dissolved and separated from the fibres. However, the
waste lignin from the sulphate and some sulphite processes, can be burnt as a fuel oil
substitute. In modern mills, recovery boiler operations and the controlled burning of bark
and other residues makes the chemical pulp mill a net energy producer which can often
supply power to the grid, or steam to local domestic heating plants.
Making pulp from recovered paper
Recycled paper is a type of paper that completely or partially consists of recycled fibres.
These fibres can have very different origins and therefore also very different
characteristics when it comes to being a component in new paper. Newsprint, tissue and
paperboard are the products primarily produced using recycled paper as raw material.
Collected paper must first be sorted into different categories. The sorting can take place
either directly in the paper mill or at special sorting stations. How the sorting takes place
depends to a large extent on how the collection of the paper takes place, which varies
from country to country. In most cases bales or loose paper waste is transported to the
pulper using conveyor belts. Before printed paper, such as office waste and

MANUAL ON ENERGY CONSERVATION MEASURES IN PAPER CLUSTER, MUZAFFARNAGAR
P a g e | 22
newspapers, can be processed into graphical paper grades, the ink needs to be
removed. There are two main processes for de-inking waste paper - washing and
flotation.
In the washing process the waste paper is placed in a pulper - a huge tank that liberates
the paper fibres from the paperweb by agitation with large quantities of water - and
broken down to slurry. Staples and other undesirable material are removed by using
centrifugal screens, thereby diminishing the risk of damage in the processes that follow.
Most of the water containing the dispersed ink is drained through slots or screens that
allow ink particles through. The pulp does not pass through. Adhesive particles, known
as ‘stickies', are removed by fine screening.
In the flotation process the waste is made into slurry and contaminants are removed.
Special surfactant chemicals are added to the slurry, which produces froth on the top of
the pulp. Air is then blown into the slurry. The ink adheres to the bubbles of air and rises
to the surface. As the bubbles reach the top, a foam layer is formed that traps the ink.
The foam is removed before the bubbles break so the ink does not go back into the pulp.
When completed, the clean, useful fibre is piped to a storage chest and consequently to
the papermaking machine, while the excess materials are skimmed off or dropped
through centrifugal force into a sludge that is then burned for fuel, otherwise used or
landfilled.
Pulpwood normally arrives at the paper mill in the form of very thick sheets and
recovered paper normally arrives in the form of large, compressed bales. Both these
materials have to be broken down so that the individual fibres they contain are
completely separated from each other. This process is performed in large vessels,
known as ‘pulpers', where the raw materials are diluted with up to 100 times their weight
of water and then subjected to violent mechanical action using steel rotor blades.
The resulting slurry (known as papermaking stock) is then passed to holding tanks.
During this preliminary stage, auxiliary chemicals and additives may be added. The
auxiliary chemicals are usually combined with the fibrous raw materials at levels from
below 1% to 2% and can be sizing agents, which reduce ink and water penetration, and
process anti-foaming agents. Common additives consist of clay, chalk or titanium dioxide
that are added to modify the optical properties of the paper and board or as a fibre
MANUAL ON ENERGY CONSERVATION MEASURES IN PAPER CLUSTER, MUZAFFARNAGAR
P a g e | 23
substitute. The stock is then pumped through various types of mechanical cleaning
equipment to the paper machine.
PAPER MAKING
In the pulp and papermaking industry 95% of the water used is cleaned and reused on-
site. On the paper machine, more water is added to produce a fibre suspension of as
little as 1-to-10 parts fibre to 1000 parts water and the resulting mixture is passed into a
head-box which squirts it through a thin, horizontal slit across the full machine width
(typically 2 - 6 m) on to a moving, endless wire mesh.
Raw material fibres and chemicals (and 99 % of water) are pumped to the head box,
which feeds the stock evenly onto the wire section. This is a woven plastic mesh
conveyor belt that can be 35 metres long and as wide as the machine. As the paper
stock flows from the head box onto the wire, water is removed on this wire section by a
mixture of gravity and suction in a process known as sheet formation where the fibres
start to spread and consolidate into a thin mat, which is almost recognisable as a layer of
paper on top of the wire mesh. The paper machine can travel at speeds of up to
2000m/minute and by the time the paper stock has traveled half way down the wire, a
high percentage of water has drained away. By the time the thin mat of fibres has
reached the end of the wire section, it has become a sheet of paper, although very moist
and of little strength. It then passes to the press section.
This consists of a number of sets of heavy cylinders through which the moist paper
passes. More moisture is squeezed out and drawn away by suction. The paper then
passes to the drier section. This consists of a large number of steam-heated drying
cylinders which have a temperature of slightly over 100°c. Synthetic drier fabrics carry
the web of paper round the cylinders until the paper is completely dry.
Part way down the bank of drying cylinders is the size press, where a solution of water
and starch can be added in order to improve the surface for printing purposes. Instead of
sizer, a coater can be used which is what happens when coated papers are produced.
At the end of the drying process, the paper is smoothed using an "ironing" method,
which consists of hot polished iron rollers mounted in pairs, one above the other
(calenders or soft calenders). This also helps to consolidate, polish and glaze the
surface of the paper.

MANUAL ON ENERGY CONSERVATION MEASURES IN PAPER CLUSTER, MUZAFFARNAGAR
P a g e | 24
Still traveling at very high speeds, the paper comes off the machine ready for reeling up
into large reels (also called parent reels), which can be cut or slit into smaller ones,
according to customer requirement. These large reels are produced and changed
without any interruption to the production process.
PAPER FINISHING
The characteristics, appearance and properties of paper and board are supplemented
and enhanced by their final treatments. These may be simple processes where the reel
is slit into a number of more narrow reels or cut into sheets or more complicated
processes such as coating.
Coating improves the opacity, lightness, surface smoothness, lustre and colour-
absorption ability of paper. It meets exacting quality demands regarding surface
smoothness. Coating means that a layer is applied to the paper, either directly in the
papermaking machine or separately. Varieties of coated paper range from pigmented to
cast-coated. The coat consists of a mix of pigments, extenders such as china clay and
chalk, and binders such as starch or latex. In addition, various chemicals are added to
give the paper the desired characteristics.
For even smoother paper surface, super-calendering is required. This is done primarily
for magazines and coated papers. The paper passes through rollers, which are
alternately hard and soft. Through a combination of heat, pressure and friction, the paper
acquires a high lustre surface. The paper becomes somewhat compressed during the
process and is therefore thinner than its matt finished equivalent.

MANUAL ON ENERGY CONSERVATION MEASURES IN PAPER CLUSTER, MUZAFFARNAGAR
P a g e | 25
2.3.2 Process flow diagram
Figure 12: Process Flow diagram representing waste paper & agro residue as raw material

MANUAL ON ENERGY CONSERVATION MEASURES IN PAPER CLUSTER, MUZAFFARNAGAR
P a g e | 26
22..44 IISSSSUUEESS RREELLAATTEEDD TTOO EENNEERRGGYY UUSSAAGGEE AANNDD CCOONNSSEERRVVAATTIIOONNAANNDD BBAARRRRIIEERR IINN TTEECCHHNNOOLLOOGGYY UUPP GGRRAADDAATTIIOONN
Typically second tier industrial establishments in India lack the technical expertise to
identify and evaluate energy efficiency technologies and products. They also do not
have internal financial resources and need external capital to fund EE projects. Further,
they need assistance in identifying and managing technical and financial risks. Major
barriers in up-gradation of technology in the cluster are:
a) Lack of awareness on energy efficiency
b) Energy efficiency not on priority list
c) Lack of instrumentation and non-availability of data
d) Limited technical manpower
e) Non availability of funds to implement energy conservation measures
Some of these barriers are detailed below.
2.4.1 Technological Barrier – Lack of awareness on energy efficiency
Majority of the entrepreneurs in paper cluster do not have any in depth technical
expertise and knowledge on energy efficiency. They are dependent on local technology
suppliers, service companies or limited in-house technical expertise, who normally also
rely on established and commonly used technology. The lack of technical know-how has
made it difficult for the paper unit owners to identify the most effective technical
measures.
2.4.2 Financial Barrier – Non availability of funds to implement energy
conservation measures
The entrepreneur in Muzaffarnagar paper cluster typically makes investments related to
business perspective. They are comfortable investing on project expansion for improving
the production capacity as they consider it a more viable proposition as it clearly shows
up in the sales ledger. Further, the energy conservation activities not being a common
practice in the cluster makes them feel that it is not a viable proposition for investment.
In view of this, and given the limited financial strength of paper mill entrepreneurs, they
would not take the risks to invest in energy efficiency measures.

MANUAL ON ENERGY CONSERVATION MEASURES IN PAPER CLUSTER, MUZAFFARNAGAR
P a g e | 27
2.4.3 Limited technical manpower
Skilled workers are locally available to run the paper mills in the cluster. However, there
are very few engineers employed in the mills and the production process remains
traditional. This is one of the lacunae of the Muzaffarnagar Paper Cluster.
Specialized training with local service providers for better operation and maintenance of
equipments, importance of the energy and its use will create awareness among
workforce. These programs should be organized with equipment suppliers.
Likewise in these small and medium sized paper mills the key external industry drivers
include technology and process innovations/ equipment that can drive efficiency and
access to capital. The cluster’s needs are likely to include access to technical expertise
and minimization of technical and financial risks. This project can provide them with
access to financing, increase awareness on how technology can serve as a driver for
profitability and build technical skills. Successful project implementation with effective
dissemination can enhance replication potential in other paper clusters. In the larger
perspective, this project can set a trend in helping small and medium paper mills
leverage donor funds and access private capital markets for investments in environment
friendly projects.
For the banks and financial institutions the needs include increasing awareness on
benefits of energy efficiency and opportunities for profitability improvement through
energy cost reduction, capacity building for appraising energy efficiency investments and
developing a pipeline for project financing. This project can help develop demonstration
projects, which can help banks design guidelines/ qualifications for bankable energy
efficiency projects, develop project pipeline through replication in other clusters and help
and design loan programs and financial products to address needs of 2nd tier industry.

MANUAL ON ENERGY CONSERVATION MEASURES IN PAPER CLUSTER, MUZAFFARNAGAR
P a g e | 28
22..55 CCLLUUSSTTEERR AASSSSOOCCIIAATTIIOONN DDEETTAAIILLSS
Name of the association UP Paper Mill Association
Contact Person Mr. Pankaj Aggarwal
Profile President-UP Paper Mill Association
Contact Details 179, Patel Nagar, New Mandi, Muzaffarnagar, 251001, Ph: 0131 2468589, email: [email protected]
UP Paper mill association is a body of large, dynamic paper manufactures with global
vision. This association presents a platform for development of mutual understanding
among the industries and discussion relating to common problems and solution of
problems. Association is actively engaged to promote the interest of local paper industry
and help it achieve the global competitiveness. Therefore the association readily agreed
to BEE SME program and has cooperated at all times in order to reap the benefits of this
program. The major objectives of this association are:
a) To promote the spirit of fraternity among its members to improve professional
efficiency.
b) To create the awareness about the fast changing technology of the world for better
productivity and quality.
c) To provide a common platform to its members to exchange their achievements
ideas, experience and problems
MANUAL ON ENERGY CONSERVATION MEASURES IN PAPER CLUSTER, MUZAFFARNAGAR
P a g e | 29
33 EEnneerrggyy AAuuddiitt aanndd TTeecchhnnoollooggyy AAsssseessssmmeenntt
33..11 MMEETTHHOODDOOLLOOGGYY AADDOOPPTTEEDD FFOORR EENNEERRGGYY UUSSEE AANNDDTTEECCHHNNOOLLOOGGYY AASSSSEESSSSMMEENNTT
A team of competitive engineers having experience in the paper sector was involved in
carrying out the study at a paper mill. The study was carried out in different phases.
The general scope was as follows:
� Identify areas of opportunity for energy saving and recommend the action plan to
bring down total energy cost
� Identify areas of energy wastages in various sections and suggest measures for
minimizing energy losses or suggest alternative energy saving measures that
can effectively replace inefficient process
� Conduct energy performance evaluation and process optimization study
� Conduct efficiency test of equipments and make recommendations for
replacement with more efficient equipment with projected benefits
� Suggest improved operation & maintenance practices
� Provide details of investment for all the proposals for improvement
� Evaluate benefits that accrue through investment and payback period
33..22 BBOOUUNNDDAARRYY PPAARRAAMMEETTEERRSS
Following boundary parameters were set on coverage of the audit
� Audit covered all possible energy intensive areas & equipments like paper
machine (vacuum pumps, machine drive, machine pumps, rewinders, process),
pulp mill (stock pumps, refiners, etc), power plant, steam and condensate
distribution, raw water pumps and distribution, other utilities etc.
� All appropriate measuring system including portable instruments was made use
of.
� The identified measures normally fall under short, medium and long-term
measures.

MANUAL ON ENERGY CONSERVATION MEASURES IN PAPER CLUSTER, MUZAFFARNAGAR
P a g e | 30
Obtaining
consent from
plant
Formation of
Project
Team(Off-site)
Preliminary
Audit(On-Site)
Detailed
Audit(On-site)
Analysis Final report
33..33 GGEENNEERRAALL MMEETTHHOODDOOLLOOGGYY
The general methodology followed is captured in the following chart
Figure 13: General methodology followed by DeloitteThe study was conducted in 3 stages:
� Stage 1: Preliminary energy audit (PEA) of the plant to understand process
energy drivers, assessment of the measurement system, assessment of scope,
measurability and formulation of audit plan.
� Stage 2: Detailed Energy audit (DEA)
� Stage 3: Off site work for data analysis and report preparation
The three stages of the study are discussed as follows:
3.3.1 Preliminary Audit
A total twenty numbers of Preliminary energy audit studies were conducted in cluster:
The purpose of preliminary audit was to
� Assess the energy conservation potential
� Make an assessment of the measurement system
� Finalize the schedule of equipments and systems for testing and measurement
� Arrange for the infrastructure requirements at site
� Ensure completion of the following measurement requirements
o Check all the existing measurement and analytical facilities and assess
additional requirements for measurement and testing needed for detailed
audit.
o Make arrangements for making available additional instruments where
portable instruments cannot be used
MANUAL ON ENERGY CONSERVATION MEASURES IN PAPER CLUSTER, MUZAFFARNAGAR
P a g e | 31
o Make arrangements for providing tapings and other connection points
required for connecting portable instruments
o Finalize the testing and measurement schedule
� Discuss and finalize the total project schedule.
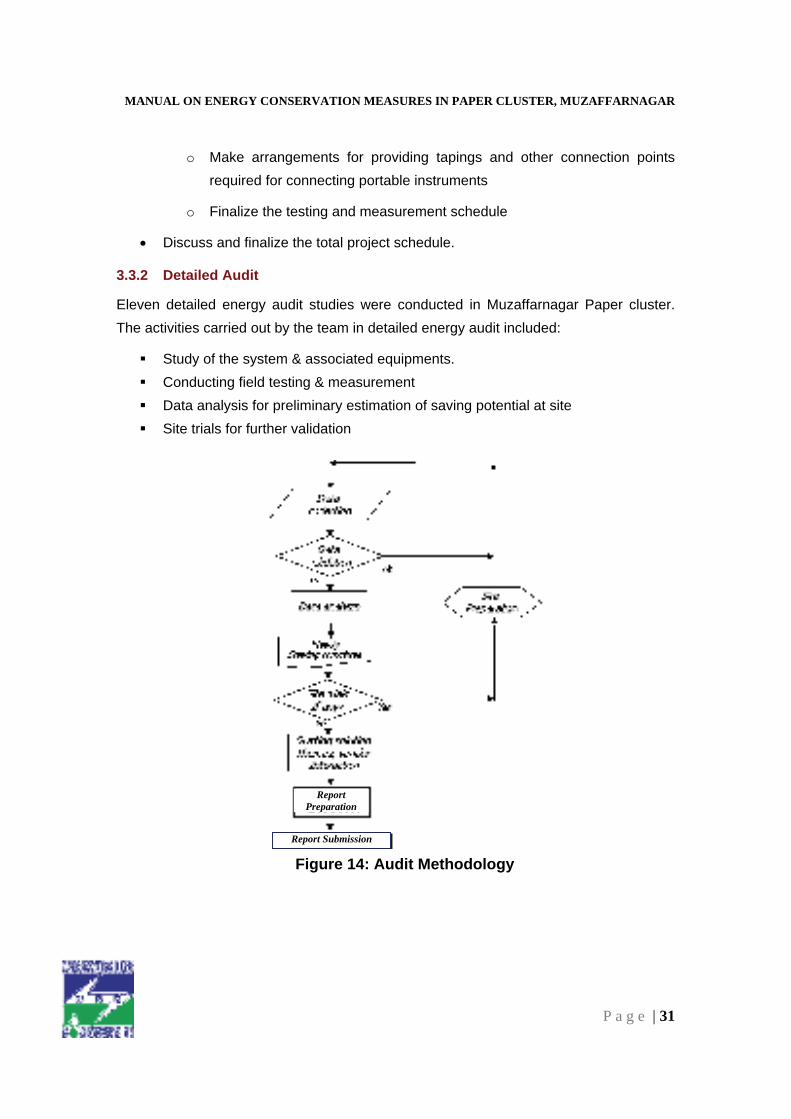
3.3.2 Detailed Audit
Eleven detailed energy audit studies were conducted in Muzaffarnagar Paper cluster.
The activities carried out by the team in detailed energy audit included:
� Study of the system & associated equipments.
� Conducting field testing & measurement
� Data analysis for preliminary estimation of saving potential at site
� Site trials for further validation
ReportPreparation
Report Submission
Figure 14: Audit Methodology

MANUAL ON ENERGY CONSERVATION MEASURES IN PAPER CLUSTER, MUZAFFARNAGAR
P a g e | 32
The detailed audit consisted of system study to identify the energy losses (thermal/
electrical) and then to find solutions to minimize the same. This involved data collection,
measurements/ testing of the system using calibrated, portable instruments, analyzing
the data/ test results and identifying the approach to improve the efficiency. All the above
were done by following standard codes. Audit methodology is depicted in figure 11 as
shown above.
3.3.3 Post Audit Off–site Work
Post audit off-site work carried out included
� Revalidation of all the calculations for arriving at the final savings potential,
identify and articulate individual energy saving projects.
� Financial analysis of the various options to arrive at the best approach
� Vendor interaction
� Report preparation/compilation and acquiring client’s acceptance.
� Outlining procurement specifications for replacement hardware
� Energy saving project costing
� Prioritization of projects for implementation
33..44 OOBBSSEERRVVAATTIIOONNSS MMAADDEE DDUURRIINNGG TTHHEE EENNEERRGGYY UUSSEE AANNDDTTEECCHHNNOOLLOOGGYY SSTTUUDDYY
3.4.1 Manufacturing process and technology/equipments installed
The paper mills in Muzaffarnagar cluster have energy saving opportunities both in the
process and utility side. During the energy audit carried out, it was observed that a few
paper mills were performing fairly well in terms of energy efficiency. These mills have
adopted the latest and energy efficient technologies available both on the process and
utility side. Still there are fairly large numbers of unit that have potential to improve
energy efficiency.
The technology for basic paper manufacturing is available in the country and there are
several vendors, some of the prominent ones being L&T, Eicher, Servall Engineering,
Jessop & Co, Mechano Paper Machines etc. Many of these companies are also having

MANUAL ON ENERGY CONSERVATION MEASURES IN PAPER CLUSTER, MUZAFFARNAGAR
P a g e | 33
tie-up with reputed global technology suppliers. There are three aspects of the present
paper technology in India so far. These are
� Options which have largely been implemented by industry
� Commercially available technologies which are under active consideration
� Advanced technologies
The major technology improvements have been largely made possible due to the
following:
� Material improvement
� Instrument improvement
� Technology transfer
� Global trends
� High competitiveness
A number of mills have taken initiatives for technology up gradation with support from
vendors in quite a few areas like:
� Pulping to achieve better quality of pulp, besides deriving cost reduction benefits
in terms of energy, water, chemical and also space saving
� Paper machines for increased productivity, better product quality and higher
energy efficiency.
� Waste paper treatment plants for utilizing various grades of waste paper to obtain
speck-free pulp. The use of waste paper is expected to go up to 35% or more in
the future.
� Self-sufficiency in power generation with improved steam power cycle efficiency
thereby reducing input energy cost.
Most of the paper mills in Muzaffarnagar cluster are using old equipments and in the
event of breakdown get them replaced either internally or locally. As such the
equipments installed:
� Do not meet the best efficiency levels available
� Are mostly over designed capacities leading to inefficient operating levels

MANUAL ON ENERGY CONSERVATION MEASURES IN PAPER CLUSTER, MUZAFFARNAGAR
P a g e | 34
3.4.2 Housekeeping Practices
Housekeeping practices were poorly maintained in the majority of paper mills. There
were no specific guidelines or procedure mentioned in any of the units for the operation
of machines/equipments. Records were poorly maintained and there is no proper
monitoring of parameters such as fuel consumption, steam leakage etc. It was seen the
spillage of the bagasse from the belt conveyors when transferring the bagasse from the
depither to a digestor. The leaking and overflow of water taps in the mill leading to water
consumption amount was increased. The insulation of steam pipeline has been in bad
condition.
By improving the housekeeping/operational practices in Paper units, efficiency will
improve by around 1-5%. Some of the suggested house-keeping practices are
mentioned below:
a) A major fraction of solid waste generated can be minimized by practicing good
housekeeping. The various in house approaches to reduce the generation of
solid waste are:
i. Good management of raw material storage facilities..
ii. Application of cleaner technologies.
iii. Use of efficient save all for maximum fibre recovery.
iv. Adoption of proper retention aids.
v. Maximum recycling of streams – closure of screening and washing
system , paper machine back water etc to an extent that it does not affect
the efficiency of the system and product quality.
vi. Proper combustion of fuels.
b) Adequate oil circulation and lubrication can be done which is critical to assure
proper fluid film thickness, to assure contaminants are removed from machine-
lubricated contact surfaces for less paper breakage and uniform consistency of
paper produced.
c) Repairing all leakage, keeping taps closed when they are not in use and cleaning
rolls in paper machines.

MANUAL ON ENERGY CONSERVATION MEASURES IN PAPER CLUSTER, MUZAFFARNAGAR
P a g e | 35
Table 10: Housekeeping practices with associated benefits Sr. No Good Housekeeping
praticesAnticipated benefits Environmental
Impacts 1 Screening of fine piths
and dust in the depithed bagasse
Reduction in cooking Chemicals and steam. Decrease in power consumption
Marginal reduced pollution load
2 Repairing the belt conveyor to prevent the bagasse spillage.
Reduction in input material
Reduced pollution load
3 Replacing old water taps to avoid water leakage
Reduction in water leaking
Reduced water consumption
4 Installation of self closing valves for the pressurized raw water to minimize water wastage
Reduction in water leaking
Reduce water consumption
5 Insulation of the steam pipeline and digester
Reduced steam requirement
Reduce air pollution
6 Cleaning the roll in the paper machines to avoid breakage paper
Reducedbreakage paper amount
Reduce polution load, Better Production.
3.4.3 Availability of Data and Information
A majority of the paper mills in Muzaffarnagar cluster do not have any instrumentation or
data monitoring systems to monitor various operational parameters in
processes/equipments/utilities. Few instruments are installed in some of the units in the
cluster for monitoring of operational parameters in their units. Accuracy of readings from
these instruments is also poor.
Most of entrepreneurs in cluster are not interested in sharing the energy consumption
data, due to various reasons. Very few entrepreneurs share their energy consumption
against production data in the respective months.
33..55 TTEECCHHNNOOLLOOGGYY GGAAPP AANNAALLYYSSIISS
The awareness for energy conservation has reached a stage where the paper mills
should take the initiative adopt energy efficient technologies. With the increase in global
competition energy conservation and optimization is a good tool to bring down their
energy cost and thus the overall manufacturing costs. Most of the small-scale paper
MANUAL ON ENERGY CONSERVATION MEASURES IN PAPER CLUSTER, MUZAFFARNAGAR
P a g e | 36
mills have out-dated technologies; better and efficient technologies are available. Energy
efficiency measures can be broadly classified into two categories.
Generic EE Measures
� Pumps, fans, compressors and associated system
� Piping
� Boiler efficiency and fuel management
� Turbo-generator efficiency improvement
� Lighting
� Heat recovery
� Energy measurement, instrumentation and control system
� Load optimization & rationalization
� Rationalizing Distribution system
� Fuel Substitution
� Power factor and harmonics
Process EE Measures
� Technology up gradation
� Process synthesis
� Process optimization
� Process up gradation
� Co-generation
� Automation
� Work rationalization
� Process integration including Cogeneration
� Heat recovery including heat exchanger networking
� SCADA and DCS for process monitoring and control
The table below provides the technology gap analysis of the paper units in the cluster
with respect to the present status in the cluster and the better technology available for
improving the energy efficiency.

MANUAL ON ENERGY CONSERVATION MEASURES IN PAPER CLUSTER, MUZAFFARNAGAR
P a g e | 37
Table 11: Muzaffarnagar Paper Cluster Technology Gap Assessment S.
No.
Technology /
Equipment
Present Status Options Available for EE
Improvement
1 Boiler Generally operating on low
efficiency level because of
lack of monitoring and
control systems.
Monitoring and control
systems like oxygen control
in flue gas, etc. are available
readily that contribute to
overall efficiency
improvement of boiler.
2 Boiler Auxiliaries The operating efficiency of
fans and pumps are being
used in boilers is generally
on the lower side.
Lack of monitoring and
control systems also lead to
loss of energy.
High efficiency boiler
auxiliaries are available.
Installation of the same will
lead to energy savings.
Adequate monitoring and
control systems are
available to optimize the
performance of boiler
auxiliaries leading to energy
savings.
3 Condensate
Recovery System
Most of the mills have poor
condensate recovery
systems leading to
tremendous heat loss
through flash steam and
radiation.
Smart and efficient
condensate recovery
systems are available to
recover entire heat energy
being lost from steam
condensate.
4 Digester Blow
Down Heat
Flash steam generated
during digester blow down is
not recovered and the heat
is lost to atmosphere.
There is a possibility to
recover the heat lost in flash
steam and use it to generate
hot water for use in process.
5 Steam Dryers Traditional condensate Efficient condensate
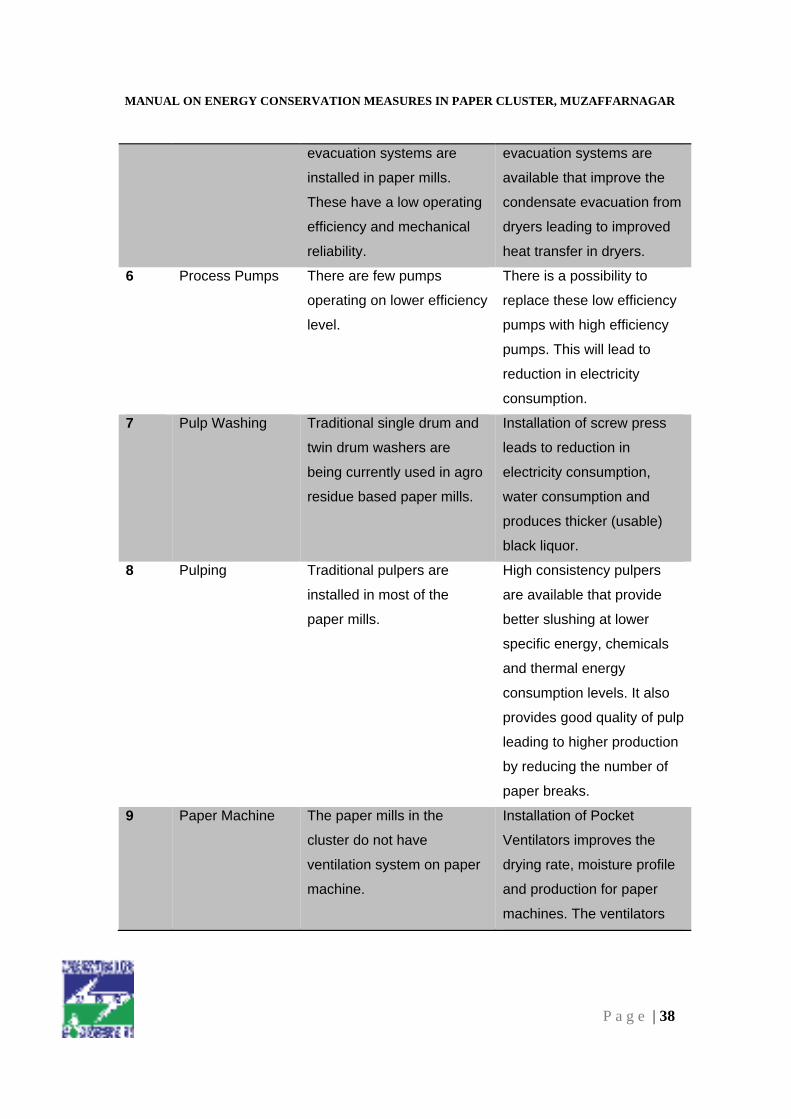
MANUAL ON ENERGY CONSERVATION MEASURES IN PAPER CLUSTER, MUZAFFARNAGAR
P a g e | 38
evacuation systems are
installed in paper mills.
These have a low operating
efficiency and mechanical
reliability.
evacuation systems are
available that improve the
condensate evacuation from
dryers leading to improved
heat transfer in dryers.
6 Process Pumps There are few pumps
operating on lower efficiency
level.
There is a possibility to
replace these low efficiency
pumps with high efficiency
pumps. This will lead to
reduction in electricity
consumption.
7 Pulp Washing Traditional single drum and
twin drum washers are
being currently used in agro
residue based paper mills.
Installation of screw press
leads to reduction in
electricity consumption,
water consumption and
produces thicker (usable)
black liquor.
8 Pulping Traditional pulpers are
installed in most of the
paper mills.
High consistency pulpers
are available that provide
better slushing at lower
specific energy, chemicals
and thermal energy
consumption levels. It also
provides good quality of pulp
leading to higher production
by reducing the number of
paper breaks.
9 Paper Machine The paper mills in the
cluster do not have
ventilation system on paper
machine.
Installation of Pocket
Ventilators improves the
drying rate, moisture profile
and production for paper
machines. The ventilators

MANUAL ON ENERGY CONSERVATION MEASURES IN PAPER CLUSTER, MUZAFFARNAGAR
P a g e | 39
prevent sweating, corrosion
and fibre build up.
10 Paper Machine Most of the paper mills have
conventional head box
installed that provide head
by naturally depending on
the level of pulp maintained
in the head box.
Pressurized head box is
available. They provide
better quality of paper and
ease the operation at high
speeds. The overall
productivity of the paper mill
increase leading to reduced
specific energy
consumption.
33..66 EENNEERRGGYY CCOONNSSEERRVVAATTIIOONN MMEEAASSUURREESS IIDDEENNTTIIFFIIEEDD
3.6.1 ECM 1 – Boiler Efficiency Improvement
3.6.1.1 Description
Maintaining an optimum air to fuel ratio in the boiler is key to improved boiler operating
efficiency. A stable combustion condition requires the right amounts of fuels and oxygen.
The combustion products are heat energy, carbon dioxide, water vapor, nitrogen, and
other gases (excluding oxygen). In theory there is a specific amount of oxygen needed
to completely burn a given amount of fuel. In practice, burning conditions are never
ideal. Therefore, more air than ideal must be supplied to burn all fuel completely. The
amount of air more than the theoretical requirement is referred to as excess air. Boilers
normally run at about 10 to 20 percent excess air. Failing to maintain adequate excess
air levels and supplying high air to fuel ratio in the boiler leads to tremendous energy
losses in terms of heat generated by fuel being taken away with nitrogen and unused
oxygen.
Measurements were carried out to observe the oxygen level in the exit flue gases. The
oxygen level in most of the boilers in the paper mills of Muzaffarnagar cluster was found
to be on the higher side. The high level of oxygen in flue gas indicates surplus supply of
air in the boiler for combustion of fuel. Consequently the unused air comes out from the
boiler along with the flue gas and indicates high level of oxygen in the flue gas. For the
boiler under consideration in the study, the oxygen level in the flue gas was observed to

MANUAL ON ENERGY CONSERVATION MEASURES IN PAPER CLUSTER, MUZAFFARNAGAR
P a g e | 40
be in the range of 13% corresponding to an efficiency level of 61.1%. With adequate
instrumentation and control this oxygen level can be brought down to the range of 5% -
7% corresponding to an efficiency level of 70%. The graph below represents the current
efficiency level of the boiler with reference to the oxygen level in flue gas and the
efficiency level that can be achieved.
Figure 15: Operating and proposed efficiency graph
The proposed efficiency level can be achieved by installing a flue gas oxygen controller,
which consists of an oxygen sensor with PID controller. This system will work more
efficiently if it is coupled with a combustion control loop consisting of steam transmitter
and controller.
3.6.1.2 Benefits
Optimization of the air to fuel ratio in boiler will lead to intake of optimum amount of air
required for complete combustion. This will lead to reduction in the amount of heat loss,
which was being carried away with the surplus amount of air present in the flue gas.
Reduction of heat loss in flue gas will lead to overall efficiency improvement of the boiler
and consequently less amount of fuel will be required to generate an equivalent. In
addition to the direct saving of fuel, installation of flue gas oxygen control will lead to
reduced electricity consumption in the FD and ID fans of the boiler. This is merely
because of the fact that less amount of air will be supplied by the ID fans and less
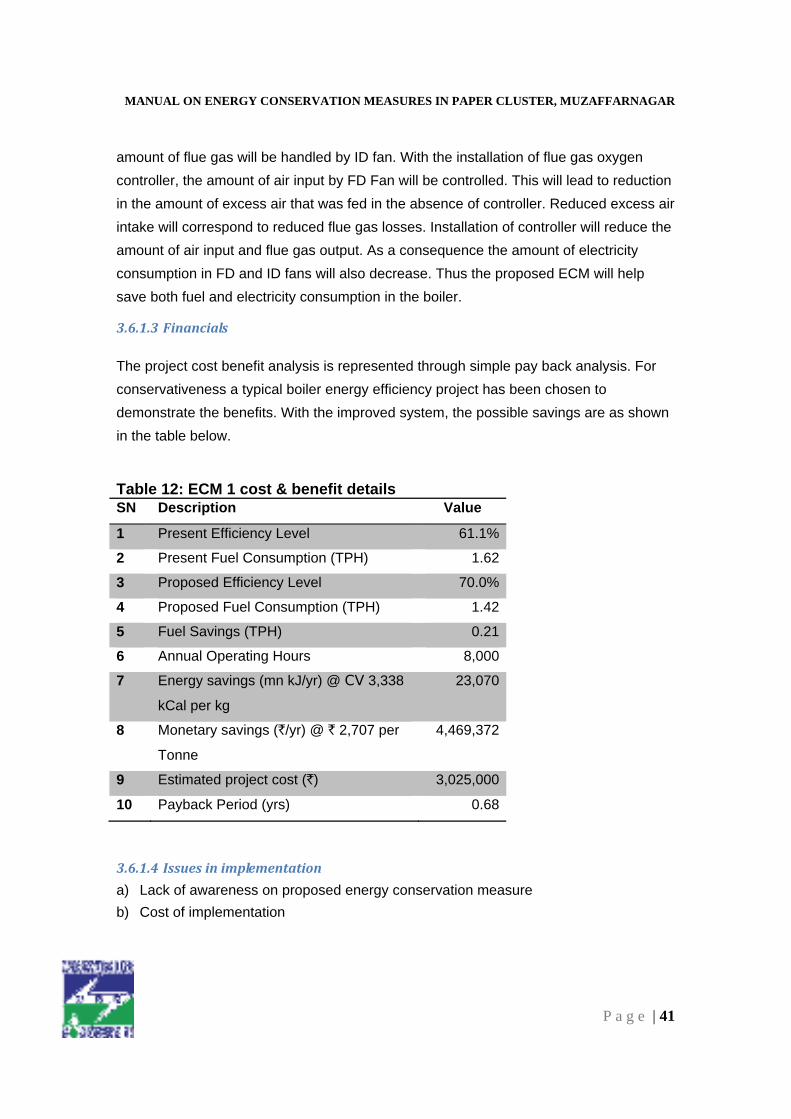
MANUAL ON ENERGY CONSERVATION MEASURES IN PAPER CLUSTER, MUZAFFARNAGAR
P a g e | 41
amount of flue gas will be handled by ID fan. With the installation of flue gas oxygen
controller, the amount of air input by FD Fan will be controlled. This will lead to reduction
in the amount of excess air that was fed in the absence of controller. Reduced excess air
intake will correspond to reduced flue gas losses. Installation of controller will reduce the
amount of air input and flue gas output. As a consequence the amount of electricity
consumption in FD and ID fans will also decrease. Thus the proposed ECM will help
save both fuel and electricity consumption in the boiler.
3.6.1.3 Financials
The project cost benefit analysis is represented through simple pay back analysis. For
conservativeness a typical boiler energy efficiency project has been chosen to
demonstrate the benefits. With the improved system, the possible savings are as shown
in the table below.
Table 12: ECM 1 cost & benefit details SN Description Value
1 Present Efficiency Level 61.1%
2 Present Fuel Consumption (TPH) 1.62
3 Proposed Efficiency Level 70.0%
4 Proposed Fuel Consumption (TPH) 1.42
5 Fuel Savings (TPH) 0.21
6 Annual Operating Hours 8,000
7 Energy savings (mn kJ/yr) @ CV 3,338
kCal per kg
23,070
8 Monetary savings (`/yr) @ ` 2,707 per
Tonne
4,469,372
9 Estimated project cost (`) 3,025,000
10 Payback Period (yrs) 0.68
3.6.1.4 Issues in implementation
a) Lack of awareness on proposed energy conservation measure
b) Cost of implementation

MANUAL ON ENERGY CONSERVATION MEASURES IN PAPER CLUSTER, MUZAFFARNAGAR
P a g e | 42
3.6.2 ECM 2 – Boiler Feed Water Pump Efficiency Improvement
3.6.2.1 Description
The boiler feed water-pumping system was studied in detail and analyzed for energy
efficiency improvement. The study involved measurement of boiler feed water flow, head
delivered by the pump, power consumption and pressure drop. At many instances it was
observed that the pump is operating on lower efficiency range. The pumps installed are
old and new high efficiency pumps are available. The boiler feed water pump considered
under the study was a high pressure pump with following specifications:
Table 13: Boiler Feed Water Pump Design ParametersFlow m3/hr 60
Suction Pr M +veDischarge Pr M 900Rated Capacity of Drive kW 250
The boiler feed water pump operating parameters were observed as follows:
Table 14: Boiler Feed Water Pump Operating ParametersFlow m3/hr 44.9
Suction Pr m 12Discharge Pr m 900Power Consumption kW 261
The boiler feed water pump operating efficiency was estimated to be 46%. Higher
efficiency pumps are available for the same application. Replacement of this pump with
new efficient pump will lead to electricity savings.
3.6.2.2 Benefits
Replacement of the present low efficiency pump with a higher efficiency pump will lead
to energy savings. The high efficiency pump will consume less electricity as compared to
the present low efficiency pump. It is possible to operate the new efficient pump at an
efficiency level of around 60% which is available up to 68% Design efficiency. This will
lead to an energy saving of approximately 60 kW.

MANUAL ON ENERGY CONSERVATION MEASURES IN PAPER CLUSTER, MUZAFFARNAGAR
P a g e | 43
3.6.2.3 Financials
The project cost benefit analysis is represented through simple pay back analysis. For
conservativeness a typical boiler energy efficiency project has been chosen to
demonstrate the benefits. With the improved system, the possible savings are as shown
in the table below.
Table 15: ECM 2 cost & benefit details SN Description Value
1 Present Efficiency Level 46%
2 Present Electricity Consumption (kW) 261
3 Proposed Efficiency Level 60%
4 Proposed Electricity Consumption (kW) 201
5 Electricity Savings (kW) 60
6 Annual Operating Hours 8,000
7 Energy savings (kWh/yr) 477,736
8 Monetary savings (`/yr) @ ` 3.91 per
kWh
1,867,948
9 Estimated project cost (`) 2,250,000
10 Payback Period (yrs) 1.20
3.6.2.4 Issues in implementation
a) Lack of awareness on proposed energy conservation measure
b) Cost of implementation
3.6.3 ECM 3 – Boiler Feed Water Pump Pressure Drop Reduction
3.6.3.1 Description
The boiler feed water-pumping system was studied in detail and analyzed for energy
efficiency improvement. It was observed that there is considerable pressure drop across
the main control valve that amounts to a loss of 10% to 20% of total power consumption.
A typical system representing pressure drop at control valve is shown in the schematic
below
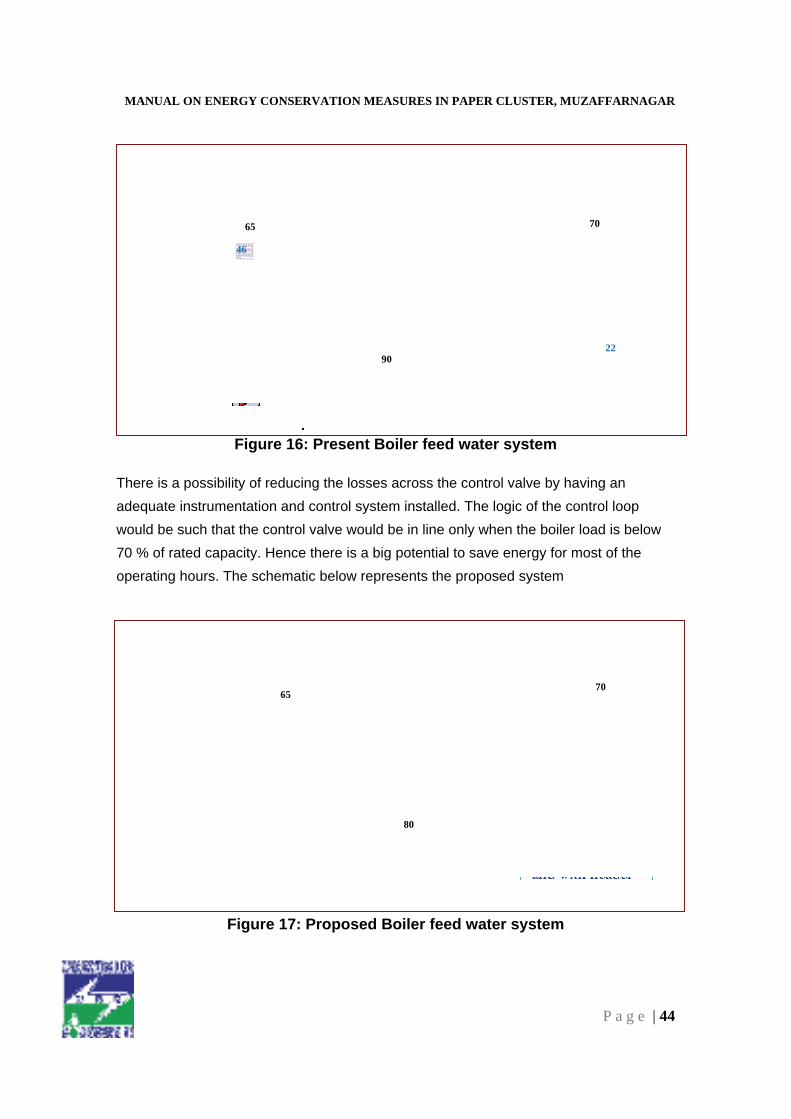
MANUAL ON ENERGY CONSERVATION MEASURES IN PAPER CLUSTER, MUZAFFARNAGAR
P a g e | 44
Figure 16: Present Boiler feed water system
There is a possibility of reducing the losses across the control valve by having an
adequate instrumentation and control system installed. The logic of the control loop
would be such that the control valve would be in line only when the boiler load is below
70 % of rated capacity. Hence there is a big potential to save energy for most of the
operating hours. The schematic below represents the proposed system
Figure 17: Proposed Boiler feed water system
46
22 90
70 65
65 70
80
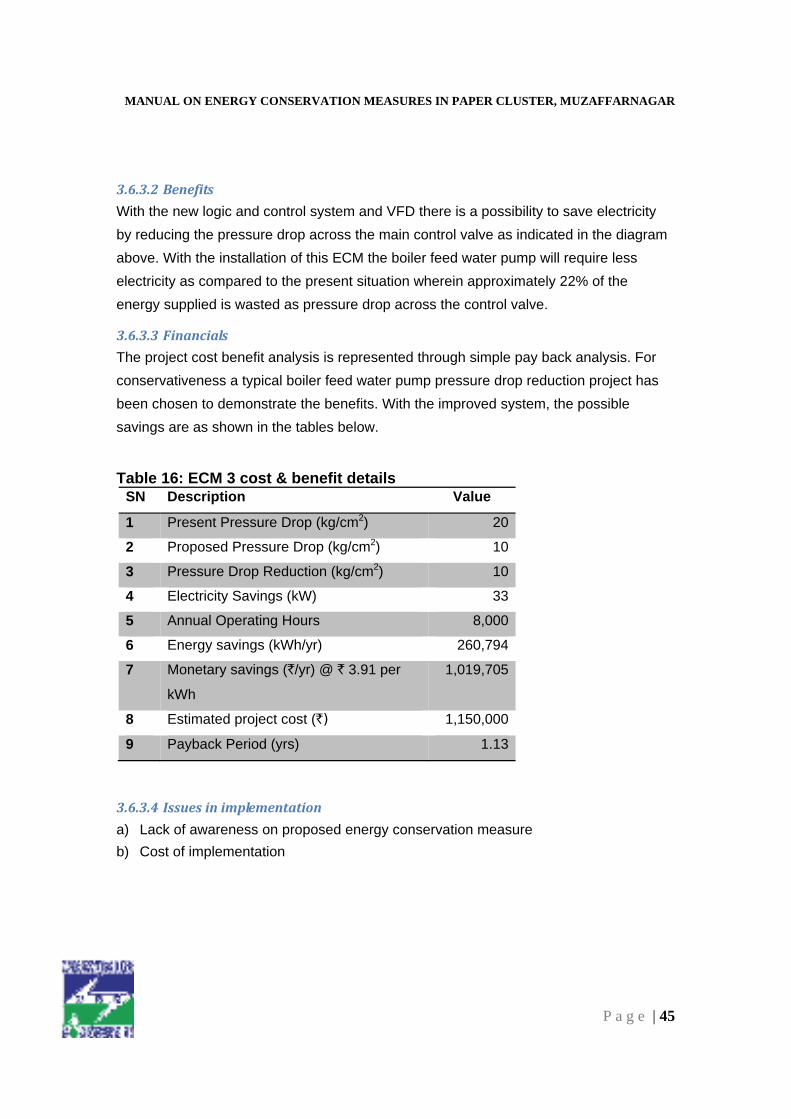
MANUAL ON ENERGY CONSERVATION MEASURES IN PAPER CLUSTER, MUZAFFARNAGAR
P a g e | 45
3.6.3.2 Benefits
With the new logic and control system and VFD there is a possibility to save electricity
by reducing the pressure drop across the main control valve as indicated in the diagram
above. With the installation of this ECM the boiler feed water pump will require less
electricity as compared to the present situation wherein approximately 22% of the
energy supplied is wasted as pressure drop across the control valve.
3.6.3.3 Financials
The project cost benefit analysis is represented through simple pay back analysis. For
conservativeness a typical boiler feed water pump pressure drop reduction project has
been chosen to demonstrate the benefits. With the improved system, the possible
savings are as shown in the tables below.
Table 16: ECM 3 cost & benefit details SN Description Value
1 Present Pressure Drop (kg/cm2) 20
2 Proposed Pressure Drop (kg/cm2) 10
3 Pressure Drop Reduction (kg/cm2) 10
4 Electricity Savings (kW) 33
5 Annual Operating Hours 8,000
6 Energy savings (kWh/yr) 260,794
7 Monetary savings (`/yr) @ ` 3.91 per
kWh
1,019,705
8 Estimated project cost (`) 1,150,000
9 Payback Period (yrs) 1.13
3.6.3.4 Issues in implementation
a) Lack of awareness on proposed energy conservation measure
b) Cost of implementation

MANUAL ON ENERGY CONSERVATION MEASURES IN PAPER CLUSTER, MUZAFFARNAGAR
P a g e | 46
3.6.4 ECM 4 – Boiler Fans Efficiency Improvement
3.6.4.1 Description
During the Detailed Energy Audit, Performance analysis for boiler fans – both FD & ID
was carried out. It was observed that the operating efficiencies were on the lower side.
In the absence of design details it is difficult to understand the reason for such low
efficiency. The possible reason for low efficiency could be system overdesign/mismatch
and machinery wear & tear. Higher efficiency fans are available that will considerably
reduce the power consumption in the fans. The schematic flow diagram of the FD fan is
provided below.
FD fan supplies air required for combustion in the boiler. Mostly the air is sucked from
outside and supplied with high positive draft in the boiler furnace. In many boilers with
waste heat recovery systems, the outlet air duct from FD fan passes through air pre-
heater (APH) taking the heat from exit flue gases before entering the boiler furnace.
Considering a typical unit the FD Fan efficiency was found out to be 35%. There is a
possibility to save energy by replacing the existing fan with high efficiency fan. It is
possible to operate the new efficient fan at an efficiency level of around 50% which is
available up to 75% Design efficiency. This will lead to an energy saving of
approximately 21 kW. The parameters observed during the study are:
APH
Boiler
Furnace
FD Fan 33% Efficiency
Figure 18: FD Fan Schematic Diagram

MANUAL ON ENERGY CONSERVATION MEASURES IN PAPER CLUSTER, MUZAFFARNAGAR
P a g e | 47
Table 17: Boiler FD Fan Operating ParametersFlow m3/hr 4.71
Suction Pr m 0Discharge Pr m 450Power Consumption kW 67
3.6.4.2 Benefits
Increase in efficiency level of the boiler F D Fan will lead to reduced power consumption.
Implementation of this ECM will lead to savings in electricity.
3.6.4.3 Financials
The project cost benefit analysis is represented through simple pay back analysis. For
conservativeness a typical boiler FD Fan improvement project has been chosen to
demonstrate the benefits. With the improved system, the possible savings are as shown
in the tables below.
Table 18: ECM 4 cost & benefit detailsSN Description Value
1 Present Efficiency Level 35%
2 Present Electricity Consumption (kW) 67
3 Proposed Efficiency Level 50%
4 Proposed Electricity Consumption (kW) 46
5 Electricity Savings (kW) 21
6 Annual Operating Hours 8,000
7 Energy savings (kWh/yr) 165,190
8 Monetary savings (`/yr) @ ` 3.91 per
kWh
645,892
9 Estimated project cost (`) 775,000
10 Payback Period (yrs) 1.20
3.6.4.4 Issues in implementation
a) Lack of awareness on proposed energy conservation measure
b) Non availability of products in local market

MANUAL ON ENERGY CONSERVATION MEASURES IN PAPER CLUSTER, MUZAFFARNAGAR
P a g e | 48
3.6.5 ECM 5 – Flash Steam Recovery
3.6.5.1 Description
During the study it was very commonly observed that in paper machine section, the flash
steam generated from the return condensate of dryers is not utilized properly and vented
into the atmosphere. Under the existing system condensate is collected into an open
vessel and the flash steam generated from hot condensate is lost to the atmosphere.
The schematic diagram of the present system is shown below:
The average steam consumption at the paper machine is 6.5 TPH at 3.8 kg/cm2. The
flash steam generated from the condensate is estimated to be 0.3 TPH. There are
possibilities to recover the heat which is presently lost in flash steam. One of the options
is to recover the heat in flash steam using a Heat Exchanger as shown below. The water
can be heated up to 75 deg C. The heat exchanger will be of direct contact type. The
arrangement is shown below:
Dryer
Condensate
Condensatetemperature: 95oC
Flash steam: 99oC
Steam
Figure 19: Existing System

MANUAL ON ENERGY CONSERVATION MEASURES IN PAPER CLUSTER, MUZAFFARNAGAR
P a g e | 49
Figure 20: Proposed Scheme for Heat Recovery– Option 1
The other option is to recover this steam with the installation of thermo compressor,
which again can be used for heating purpose. In a thermo compressor high pressure
motive steam accelerates through the nozzle. As it enters the suction chamber at
supersonic speeds, it entrains and mixes with low pressure steam from the suction inlet
(refer figure below).
Figure 21: Working of a Thermo Compressor
Dryer
Condensate tankCondensate temperature Temp : 95oC Condensate flow : 6 TPH
Steam consumption: 6.5 TPHSteam pressure: 3.8 kg/cm2
Flash steam : 99oCSteam flow : 0.5 TPH
Water Temperature: 75 Deg C
Water temperature: 35 Deg C
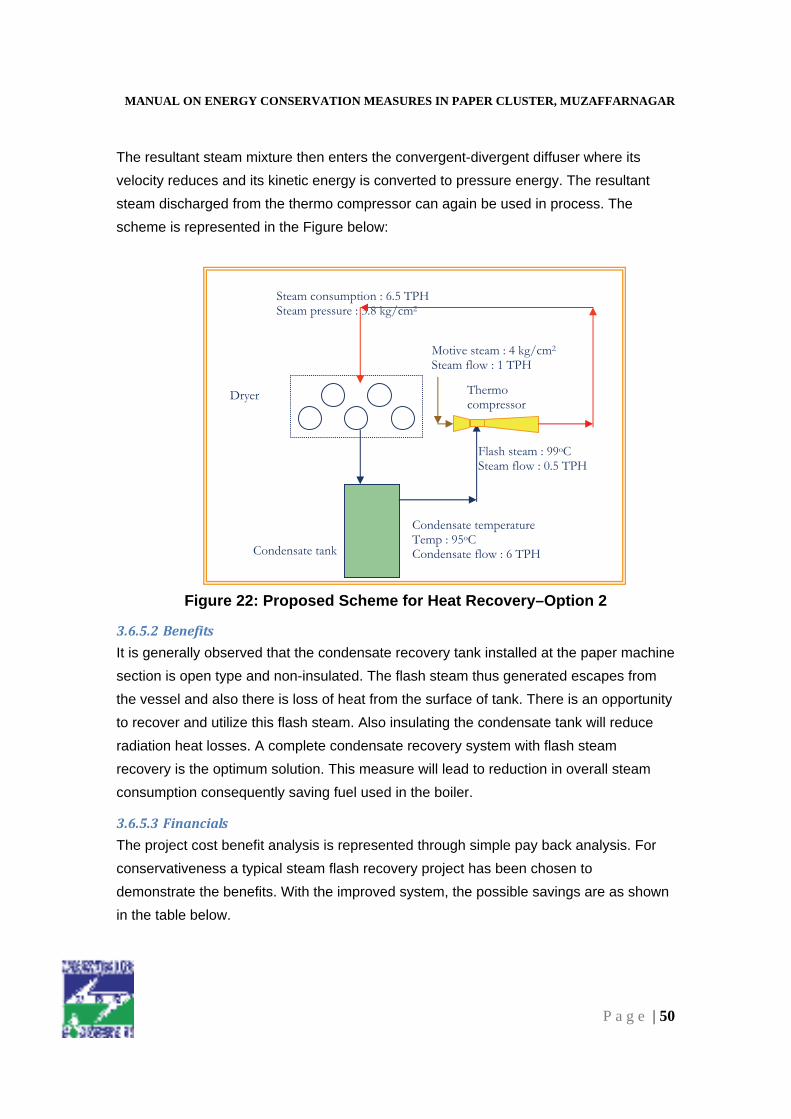
MANUAL ON ENERGY CONSERVATION MEASURES IN PAPER CLUSTER, MUZAFFARNAGAR
P a g e | 50
The resultant steam mixture then enters the convergent-divergent diffuser where its
velocity reduces and its kinetic energy is converted to pressure energy. The resultant
steam discharged from the thermo compressor can again be used in process. The
scheme is represented in the Figure below:
Figure 22: Proposed Scheme for Heat Recovery–Option 2
3.6.5.2 Benefits
It is generally observed that the condensate recovery tank installed at the paper machine
section is open type and non-insulated. The flash steam thus generated escapes from
the vessel and also there is loss of heat from the surface of tank. There is an opportunity
to recover and utilize this flash steam. Also insulating the condensate tank will reduce
radiation heat losses. A complete condensate recovery system with flash steam
recovery is the optimum solution. This measure will lead to reduction in overall steam
consumption consequently saving fuel used in the boiler.
3.6.5.3 Financials
The project cost benefit analysis is represented through simple pay back analysis. For
conservativeness a typical steam flash recovery project has been chosen to
demonstrate the benefits. With the improved system, the possible savings are as shown
in the table below.
Dryer
Condensate tank
Condensate temperature Temp : 95oC Condensate flow : 6 TPH
Thermo compressor
Steam consumption : 6.5 TPHSteam pressure : 3.8 kg/cm2
Flash steam : 99oC Steam flow : 0.5 TPH
Motive steam : 4 kg/cm2
Steam flow : 1 TPH
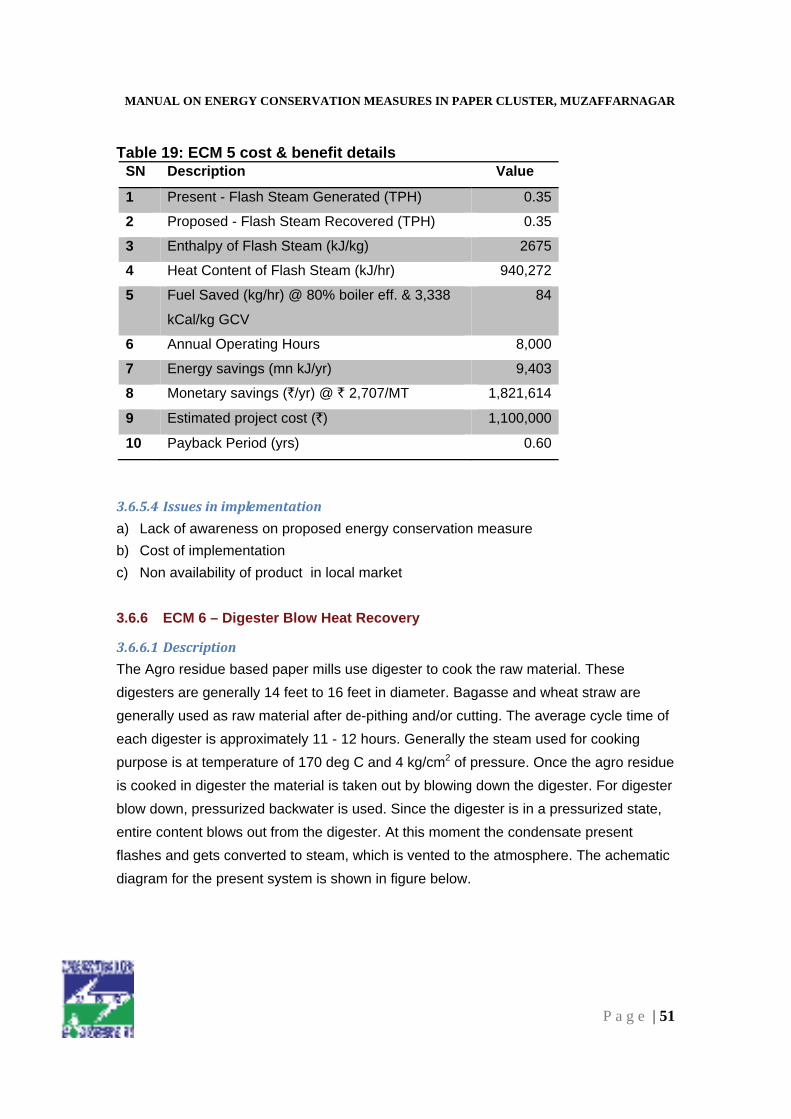
MANUAL ON ENERGY CONSERVATION MEASURES IN PAPER CLUSTER, MUZAFFARNAGAR
P a g e | 51
Table 19: ECM 5 cost & benefit details SN Description Value
1 Present - Flash Steam Generated (TPH) 0.35
2 Proposed - Flash Steam Recovered (TPH) 0.35
3 Enthalpy of Flash Steam (kJ/kg) 2675
4 Heat Content of Flash Steam (kJ/hr) 940,272
5 Fuel Saved (kg/hr) @ 80% boiler eff. & 3,338
kCal/kg GCV
84
6 Annual Operating Hours 8,000
7 Energy savings (mn kJ/yr) 9,403
8 Monetary savings (`/yr) @ ` 2,707/MT 1,821,614
9 Estimated project cost (`) 1,100,000
10 Payback Period (yrs) 0.60
3.6.5.4 Issues in implementation
a) Lack of awareness on proposed energy conservation measure
b) Cost of implementation
c) Non availability of product in local market
3.6.6 ECM 6 – Digester Blow Heat Recovery
3.6.6.1 Description
The Agro residue based paper mills use digester to cook the raw material. These
digesters are generally 14 feet to 16 feet in diameter. Bagasse and wheat straw are
generally used as raw material after de-pithing and/or cutting. The average cycle time of
each digester is approximately 11 - 12 hours. Generally the steam used for cooking
purpose is at temperature of 170 deg C and 4 kg/cm2 of pressure. Once the agro residue
is cooked in digester the material is taken out by blowing down the digester. For digester
blow down, pressurized backwater is used. Since the digester is in a pressurized state,
entire content blows out from the digester. At this moment the condensate present
flashes and gets converted to steam, which is vented to the atmosphere. The achematic
diagram for the present system is shown in figure below.

MANUAL ON ENERGY CONSERVATION MEASURES IN PAPER CLUSTER, MUZAFFARNAGAR
P a g e | 52
The flash steam from digester is not clean, hence it cannot be recovered with a thermo
compressor to use for other heating purposes. However, this heat can be recovered to
generate hot water which in turn can be used for the lye mixture tank, potcher, showers,
spray showers, hydropulpers and other hot water requirement areas. It is recommended
to install a heat recovery tank for collecting a flash steam and the hot water can be used
in process. The proposed system is represented in the figure below.
Blowtank
Venting
From digesters
REFINER
Cycle time : 12 hours No. of batches: 8-9 per day
4 kg/cm2
170 deg C
Figure 23: Present System

MANUAL ON ENERGY CONSERVATION MEASURES IN PAPER CLUSTER, MUZAFFARNAGAR
P a g e | 53
3.6.6.2 Benefits
It is generally observed that the flash steam generated, while the digester blows, is
vented to atmosphere. Recovery and utilization of this flash steam will lead to reduction
in overall steam consumption consequently saving fuel used in the boiler.
3.6.6.3 Financials
The project cost benefit analysis is represented through simple pay back analysis. For
conservativeness a typical steam flash recovery project from digester blow down has
been chosen to demonstrate the benefits. With the improved system, the possible
savings are as shown in the table below.
Table 20: ECM 6 cost & benefit details SN Description Value
1 Present - Flash Steam Generated (Tonne per batch) 0.89
2 Proposed - Flash Steam Recovered (Tonne per batch) 0.89
3 Enthalpy of Flash Steam (kJ/kg) 2,847
4 Heat Content of Flash Steam (kJ/Batch) 2,519
5 Fuel Saved (Tonne per batch) @ 80% boiler eff. & 3,338
kCal/kg GCV
0.18
6 Annual Operating Batches @ 10 Batch/day & 330 days/yr 3,300
7 Energy savings (mn kJ/yr) 8,314
Blowtank
From digesters
Heat recovery tank
Figure 24: Proposed System

MANUAL ON ENERGY CONSERVATION MEASURES IN PAPER CLUSTER, MUZAFFARNAGAR
P a g e | 54
8 Monetary savings (`/yr) @ ` 2,707/MT 1,610,685
9 Estimated project cost (`) 2,050,000
10 Payback Period (yrs) 1.27
3.6.6.4 Issues in implementation
a) Lack of awareness on proposed energy conservation measure
b) Cost of implementation
c) Non availability of product in local market
3.6.7 ECM 7 – Steam Consumption Reduction by Efficient Condensate
Evacuation from Dryers
3.6.7.1 Description
Traditional siphons require high differential steam pressures to evacuate condensate
from paper machine dryers. Stationary siphons are preferred for these applications,
because the differential pressure requirement remains quite low. Smooth condensate
flow into syphon pipe ensures optimal heat transfer. This reduces the steam
consumption by 5% to 10% in the dryer section and improves overall dryer operating
efficiency.
High speeds create mechanical problems for stationary syphons. All cantilever stationary
syphons are mounted and supported from outside the dryer cylinder. Because the
stationary syphon remains fixed in place, it must be able to withstand the impact of the
condensate that is rotating with the dryer. Stationary syphons with low stiffness will
deflect, vibrate, and eventually fail. This new cantilever stationary syphon is designed to
provide both improved operating efficiency and mechanical reliability as shown in figure
below.
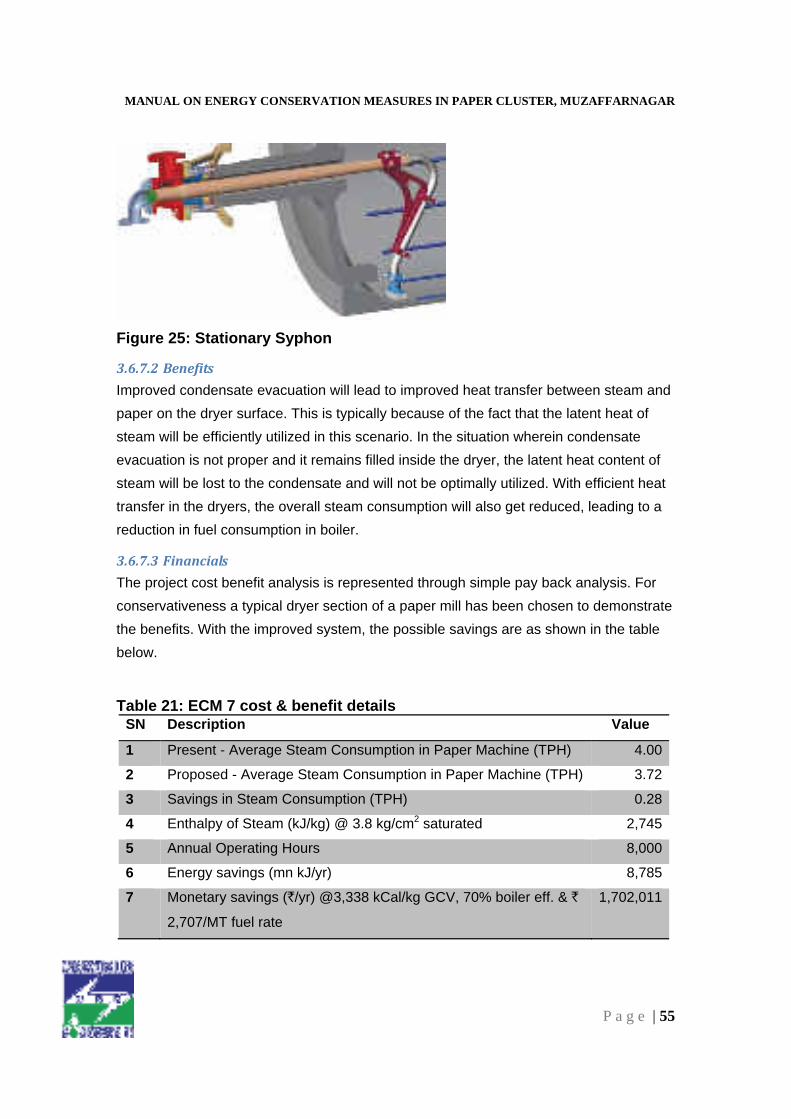
MANUAL ON ENERGY CONSERVATION MEASURES IN PAPER CLUSTER, MUZAFFARNAGAR
P a g e | 55
Figure 25: Stationary Syphon
3.6.7.2 Benefits
Improved condensate evacuation will lead to improved heat transfer between steam and
paper on the dryer surface. This is typically because of the fact that the latent heat of
steam will be efficiently utilized in this scenario. In the situation wherein condensate
evacuation is not proper and it remains filled inside the dryer, the latent heat content of
steam will be lost to the condensate and will not be optimally utilized. With efficient heat
transfer in the dryers, the overall steam consumption will also get reduced, leading to a
reduction in fuel consumption in boiler.
3.6.7.3 Financials
The project cost benefit analysis is represented through simple pay back analysis. For
conservativeness a typical dryer section of a paper mill has been chosen to demonstrate
the benefits. With the improved system, the possible savings are as shown in the table
below.
Table 21: ECM 7 cost & benefit details SN Description Value
1 Present - Average Steam Consumption in Paper Machine (TPH) 4.00
2 Proposed - Average Steam Consumption in Paper Machine (TPH) 3.72
3 Savings in Steam Consumption (TPH) 0.28
4 Enthalpy of Steam (kJ/kg) @ 3.8 kg/cm2 saturated 2,745
5 Annual Operating Hours 8,000
6 Energy savings (mn kJ/yr) 8,785
7 Monetary savings (`/yr) @3,338 kCal/kg GCV, 70% boiler eff. & `
2,707/MT fuel rate
1,702,011

MANUAL ON ENERGY CONSERVATION MEASURES IN PAPER CLUSTER, MUZAFFARNAGAR
P a g e | 56
8 Estimated project cost (`) 1,390,000
9 Payback Period (yrs) 0.82
3.6.7.4 Issues in implementation
a) Lack of awareness on proposed energy conservation measure
b) Cost of implementation
c) Non availability of product in nearby region
3.6.8 ECM 8 – Energy Efficiency Improvement in Process Pumps
3.6.8.1 Description
The performance evaluation of pumps in the paper mills was carried out to determine
their operating efficiencies. This involved the study of following operating parameters:
� Flow
� Suction
� Discharge head
� Power consumed by the pump motor
This data was then analyzed to determine the operating efficiencies of the pump. It was
observed that efficiency level of some of the pumps studied is on the lower side. There is
a possibility to replace these low efficiency pumps with high efficiency pumps. This will
lead to reduction in electricity consumption of the mill. The typical efficiency levels
observed were in the range of 20% to 60%. Depending on type of application the pump
efficiency levels can be improved upto 50% to 70%. The table below provides the details
of the pumps studied.
Table 22: Details of pumps Pump Fan
Pump
PM1
Fan
Pump
PM2
Submersible
Water Pump
Chest
Pump 3
High
Pr.
Pump
Flow (m3/hr) 58.63 395.83 180.00 120.00 8.00
Discharge Pr.
(kg/cm2)
3.5 3.5 5.0 3.0 13.8
Power Cons. (kW) 32.98 70.66 45.00 23.00 16.85

MANUAL ON ENERGY CONSERVATION MEASURES IN PAPER CLUSTER, MUZAFFARNAGAR
P a g e | 57
Operational
Efficiency (%)
18.83 59.33 60.52 47.36 19.83
3.6.8.2 Benefits
Improved pump efficiency will lead to reduced electricity consumption providing energy
saving. This is typically because of the fact that the power input for the same amount of
work performed would be reduces after installation of higher efficiency pumps.
3.6.8.3 Financials
The project cost benefit analysis is represented through simple pay back analysis. For
conservativeness a typical process pump improvement project has been chosen to
demonstrate the benefits. With the improved system, the possible savings are as shown
in the tables below.
Table 23: ECM 8 cost & benefit details SN Description Fan
Pump
PM1
Fan
Pump
PM2
Submersible
Water Pump
Chest
Pump 3
High
Pr.
Pump
1 Present Efficiency
(%)
18.83 59.33 60.52 47.36 19.83
2 Proposed Efficiency
(%)
70.0 70.0 70.0 70.0 55.0
3 Energy Saving (kW) 5.00 10.77 3.05 4.96 6.00
4 Annual Operating
Hours
8,000 8,000 8,000 8,000 8,000
5 Energy savings
(kWh/yr)
40,000 68,234 81,924 39,670 48,000
6 Monetary savings
(`/yr) @ `3.91/kWh
156,400 266,795 320,323 155,110 187,680
7 Estimated project
cost (`)
60,000 270,000 81,000 130,000 110,000
8 Payback Period (yrs) 0.38 1.01 0.25 0.84 0.59

MANUAL ON ENERGY CONSERVATION MEASURES IN PAPER CLUSTER, MUZAFFARNAGAR
P a g e | 58
3.6.8.4 Issues in implementation
a) Lack of awareness on proposed energy conservation measure
b) Non availability of product in nearby region
3.6.9 ECM 9 – Installation of Screw Press
3.6.9.1 Description
The twin drum washers arrangement is shown in the figure below. There is small
clearance between the two drums. The pulp squeezes between the two drums and pulp
is washed out.
Prior to twin drums, potchers were used in most of the mills. Bleaching is done at 5%
consistency in potchers, whereas with this system bleaching at 20% consistency is
possible. Some of the benefits of using twin drum washers over potchers are listed
below:
� Better washing of pulp can be achieved
� Quality of the duplex board is improved
� Due to quality improvement the higher gsm paper with high quality can be made.
� Water consumption in this case is 50% so the load on ETP reduces.
With the advancement of technology, now there is better washing equipment available
called screw washer, which replaces the present twin drum washing system of agro
based paper mills. The screw washer leads to reduced water consumption, produces
thicker (usable) black liquor and replaces 2 to 3 double drum washers with 1 screw
leading to reduced electricity consumption. A couple of mills in the cluster have already
adopted the technology and have saved considerable amount of energy.
Figure 26: Twin Drum Washer
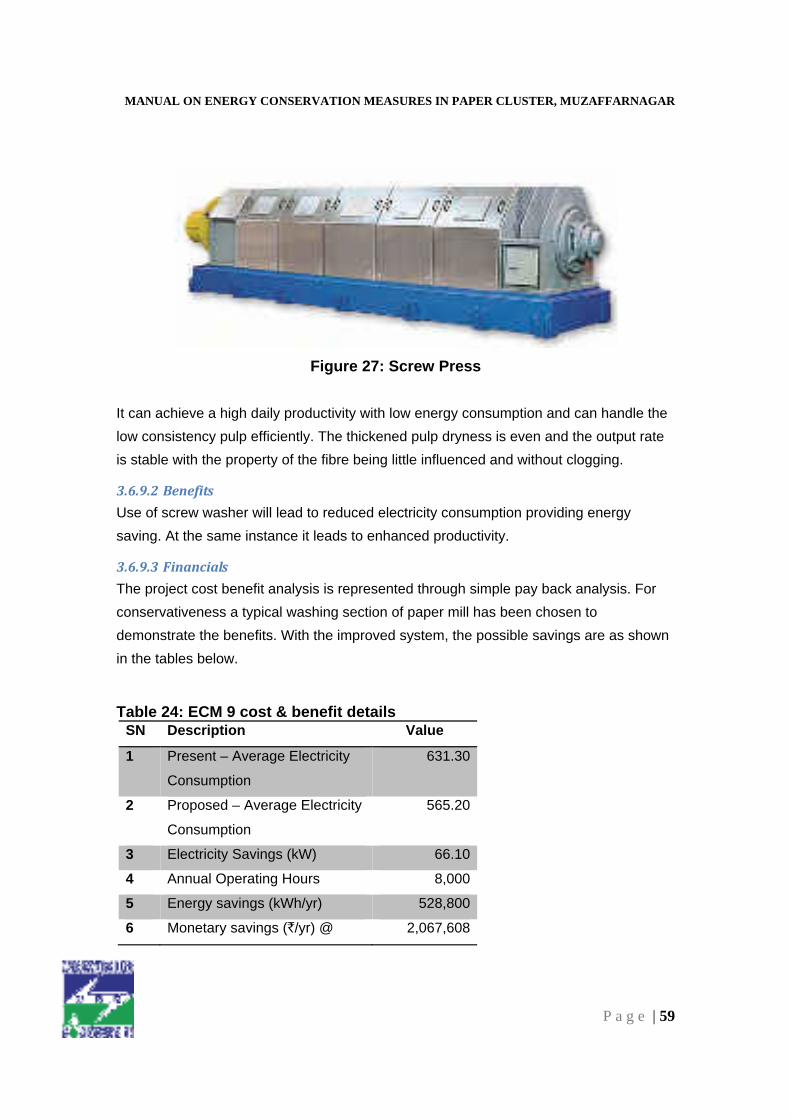
MANUAL ON ENERGY CONSERVATION MEASURES IN PAPER CLUSTER, MUZAFFARNAGAR
P a g e | 59
Figure 27: Screw Press
It can achieve a high daily productivity with low energy consumption and can handle the
low consistency pulp efficiently. The thickened pulp dryness is even and the output rate
is stable with the property of the fibre being little influenced and without clogging.
3.6.9.2 Benefits
Use of screw washer will lead to reduced electricity consumption providing energy
saving. At the same instance it leads to enhanced productivity.
3.6.9.3 Financials
The project cost benefit analysis is represented through simple pay back analysis. For
conservativeness a typical washing section of paper mill has been chosen to
demonstrate the benefits. With the improved system, the possible savings are as shown
in the tables below.
Table 24: ECM 9 cost & benefit details SN Description Value
1 Present – Average Electricity
Consumption
631.30
2 Proposed – Average Electricity
Consumption
565.20
3 Electricity Savings (kW) 66.10
4 Annual Operating Hours 8,000
5 Energy savings (kWh/yr) 528,800
6 Monetary savings (`/yr) @ 2,067,608

MANUAL ON ENERGY CONSERVATION MEASURES IN PAPER CLUSTER, MUZAFFARNAGAR
P a g e | 60
`3.91/kWh
7 Estimated project cost (`) 4,555,000
8 Payback Period (yrs) 2.20
3.6.9.4 Issues in implementation
a) Lack of awareness on proposed energy conservation measure
b) Cost of implementation
3.6.10 ECM 10 – Installation of High Consistency Pulper
3.6.10.1 Description
High consistency pulping gives better slushing at lower specific energy, chemicals, and
thermal energy consumption. The high consistency provides good quality of pulp since
there is less fibre cutting. This automatically increases the quality of paper leading to
higher production by reducing the number of paper breaks. Apart from production
increase high consistency pulper will also lead to reduced electricity consumption.
Figure 28: High Consistency Pulper
3.6.10.2 Benefits
Highly efficient separation of fibrous and non-fibrous materials such as plastics, films,
adhesives, latex book binding without breaking them and making their subsequent
removal easier, thus improving production. It also leads to savings in chemicals, steam
and energy consumption in deinking or in disintegrating wet strength grades and other
impregnated papers.

MANUAL ON ENERGY CONSERVATION MEASURES IN PAPER CLUSTER, MUZAFFARNAGAR
P a g e | 61
3.6.10.3 Financials
The project cost benefit analysis is represented through simple pay back analysis. For
conservativeness a typical paper mill has been chosen to demonstrate the benefits. With
the improved system, the possible savings are as shown in the tables below.
Table 25: ECM 10 cost & benefit details SN Description Value
1 Present – Average Electricity
Consumption (kW)
134
2 Proposed – Average
Electricity Consumption (kW)
116
3 Electricity Saving (kW) 18
4 Annual Operating Hours 8,000
5 Energy savings (kWh/yr) 144,000
6 Monetary savings (`/yr) @
`3.91/kWh
563,040
7 Estimated project cost (`) 2,000,000
8 Payback Period (yrs) 3.55
3.6.10.4 Issues in implementation
a) Lack of awareness on proposed energy conservation measure
b) Cost of implementation
c) Lack of availability in the region
3.6.11 ECM 11 – Installation of Pocket Ventilation System
3.6.11.1 Description
Pocket Ventilators improve the drying rate, moisture profile and production for paper
machines. The ventilators prevent sweating, corrosion and fibre build up. Pocket
ventilators are custom engineered for various quality of paper produced.

MANUAL ON ENERGY CONSERVATION MEASURES IN PAPER CLUSTER, MUZAFFARNAGAR
P a g e | 62
3.6.11.2 Benefits
The benefit of the Hood is to provide a consistent drying environment around the driers
and also recover heat from the exhaust. The colder the ambient temperature, the
benefits of a closed hood seem to be that much more accentuated not just from the
energy perspective but from the fear of condensate dripping onto paper web, while in
tropical climates the heat recovery benefit is restricted to essentially sensible enthalpy.
However a well designed hood with heat recovery can provide reduction in energy
consumption between 10-15%. A high velocity well controlled pocket ventilator can also
enhance heat and mass transfer in saturated moist pockets, and lead to lower energy
consumption. A good pocket ventilator can also lead to increased machine speeds up to
5%.
3.6.11.3 Financials
The project cost benefit analysis is represented through simple pay back analysis. For
conservativeness a typical paper mill has been chosen to demonstrate the benefits. With
the improved system, the possible savings are as shown in the tables below.
Table 26: ECM 11 cost & benefit details SN Description Value
1 Present - Average Steam Consumption in Paper Machine (TPH) 9.00
2 Proposed - Average Steam Consumption in Paper Machine (TPH) 8.55
3 Savings in Steam Consumption (TPH) 0.45
4 Enthalpy of Steam (kJ/kg) @ 3.8 kg/cm2 saturated 2,745
5 Fuel Savings (kg/h) @80% boiler eff. & 3,338 kCal/kg CV
6 Annual Operating Hours 8,000
7 Energy savings (mn kJ/yr) 12,354
8 Monetary savings (`/yr) @ 2,707 `/MT fuel cost 957,380
9 Estimated project cost (`) 2,000,000
10 Payback Period (yrs) 2.09
3.6.11.4 Issues in implementation
a) Lack of awareness on proposed energy conservation measure
b) Cost of implementation
c) Lack of availability in the region

MANUAL ON ENERGY CONSERVATION MEASURES IN PAPER CLUSTER, MUZAFFARNAGAR
P a g e | 63
3.6.12 ECM 12 – Installation of Pressurized Head Box
3.6.12.1 Description
Most of the paper mills have conventional head box installed that provide head by
naturally depending on the level of pulp maintained in the head box. Pressurized head
box is available that create and maintain the head by pressurized air over the pulp in the
chamber. The constant head provides better quality of paper and eases the operation at
high speeds. The overall productivity of the paper mill increase leading to reduced
specific energy consumption.
3.6.12.2 Benefits
Installation of pressurized head box on the paper machine will lead to improved paper
quality and reduced paper breakage leading to reduction in the production loss due to
paper breakage. The increase in the production level will lead to reduced specific energy
consumption of the paper machine. A good pressurized head box system can lead to
reduction in specific energy consumption of paper machine by 5%.
3.6.12.3 Financials
The project cost benefit analysis is represented through simple pay back analysis. For
conservativeness a typical paper mill has been chosen to demonstrate the benefits. With
the improved system, the possible savings are as shown in the tables below.
Table 27: ECM 12 cost & benefit details SN Description Value
1 Present - Average Steam Consumption in Paper Machine (TPH) 9.00
2 Proposed - Average Steam Consumption in Paper Machine (TPH) 8.73
3 Savings in Steam Consumption (TPH) 0.27
4 Present – Average Electricity Consumption (kW) 943
5 Proposed – Average Electricity Consumption (kW) 915
6 Electricity Saving (kW) 28
7 Enthalpy of Steam (kJ/kg) @ 3.8 kg/cm2 saturated 2,745
8 Fuel Savings (kg/h) @80% boiler eff. & 3,338 kCal/kg CV 66.30
9 Annual Operating Hours 8,000
10 Energy savings (mn kJ/yr) 7,411

MANUAL ON ENERGY CONSERVATION MEASURES IN PAPER CLUSTER, MUZAFFARNAGAR
P a g e | 64
11 Energy savings (kWh/yr) 226,320
12 Monetary savings (`/yr) @ 2,707 `/MT fuel cost & `3.91/kWh 2,320,760
13 Estimated project cost (`) 4,500,000
14 Payback Period (yrs) 1.94
3.6.12.4 Issues in implementation
a) Lack of awareness on proposed energy conservation measure
b) Cost of implementation
c) Lack of availability in the region
33..77 BBAARRRRIIEERRSS IINN IIMMPPLLEEMMEENNTTAATTIIOONN
The role of market failures and other barriers to improved energy efficiency is well-
studied and agencies are working to surpass the same. In spite of these efforts and
benefits of energy efficiency, the implementation of energy efficiency projects in India is
not wide spread, typically in the SME sector. Despite the huge replication potential
considering the fact that SMEs are mostly cluster based in India, Energy Efficiency
enhancement activity is still not the focus area for them. The barriers foreseen towards
the implementation of identified energy conservation measures are:
a) Technological Asymmetry
Technological Asymmetry is quite prevalent in developing countries like India. SMEs
generally have less access to EE technologies than their publically-owned
counterparts and other large private or multinational companies.
b) Information Barriers
The other barrier anticipated to adoption of energy conservation measures is the lack
of awareness among the industry managers of the potential gains from improved
efficiency. Information gaps are present in all aspects of the market, consumers lack
knowledge to procure efficient end-use equipment and the company’s decision
makers lack effective management tools and procedures to account for the economic
benefits of efficiency improvements.
c) Other Priority Areas
For most of the business owners, energy efficiency is not the priority area. For them
the priority is either production or some other activity with higher returns. One of the

MANUAL ON ENERGY CONSERVATION MEASURES IN PAPER CLUSTER, MUZAFFARNAGAR
P a g e | 65
reasons for non-priority can be the lack of awareness of benefits achieved from
implementation of energy conservation measures.
d) Barrier of Inertia
This is one of the most daunting barrier to this activity is that Energy Efficiency is not
a central concern for most businesses typically in the SME sector. This barrier
creates a strong inertia that is difficult for any EE effort to overcome and can be
result of a combination of the barriers described above.
33..88 AAVVAAIILLAABBIILLIITTYY OOFF TTEECCHHNNLLOOGGYY SSUUPPPPLLIIEERRSS//LLOOCCAALL SSEERRVVIICCEEPPRROOVVIIDDEERRSS FFOORR IIDDEENNTTIIFFIIEEDD EENNEERRGGYY CCOONNSSEERRVVAATTIIOONNPPRROOPPOOSSAALLSS
Technology suppliers/local service providers for identified major energy saving proposals
mentioned in above sections in cluster are available in cluster, except few of the new
developed proposals.
Details of the identified technology supplier/local service providers in Muzaffarnagar
paper cluster are furnished in Annexure and same is attached along with this report.
33..99 IIDDEENNTTIIFFIICCAATTIIOONN OOFF TTEECCHHNNOOLLOOGGIIEESS FFOORR DDPPRR PPRREEPPAARRAATTIIOONN
From energy use and technology audit studies carried out in Muzaffarnagar Paper
cluster, it became evident that there is considerable potential in all cluster units for
energy conservation by replacing the old/obsolete technology/equipments with energy
efficient technologies/equipments.
As the process and equipments are more or less similar in all cluster units, most of the
technologies/equipments identified can be replicated as per the requirement of the units
and detailed project reports for the specific technologies prepared also can be replicated
in different paper units as per the capacity requirement. The following
technologies/equipments were considered for preparation of detailed project report.
a) Boiler Efficiency Improvement
b) Boiler Feed Water Pump Efficiency Improvement
c) Boiler Fans Efficiency Improvement
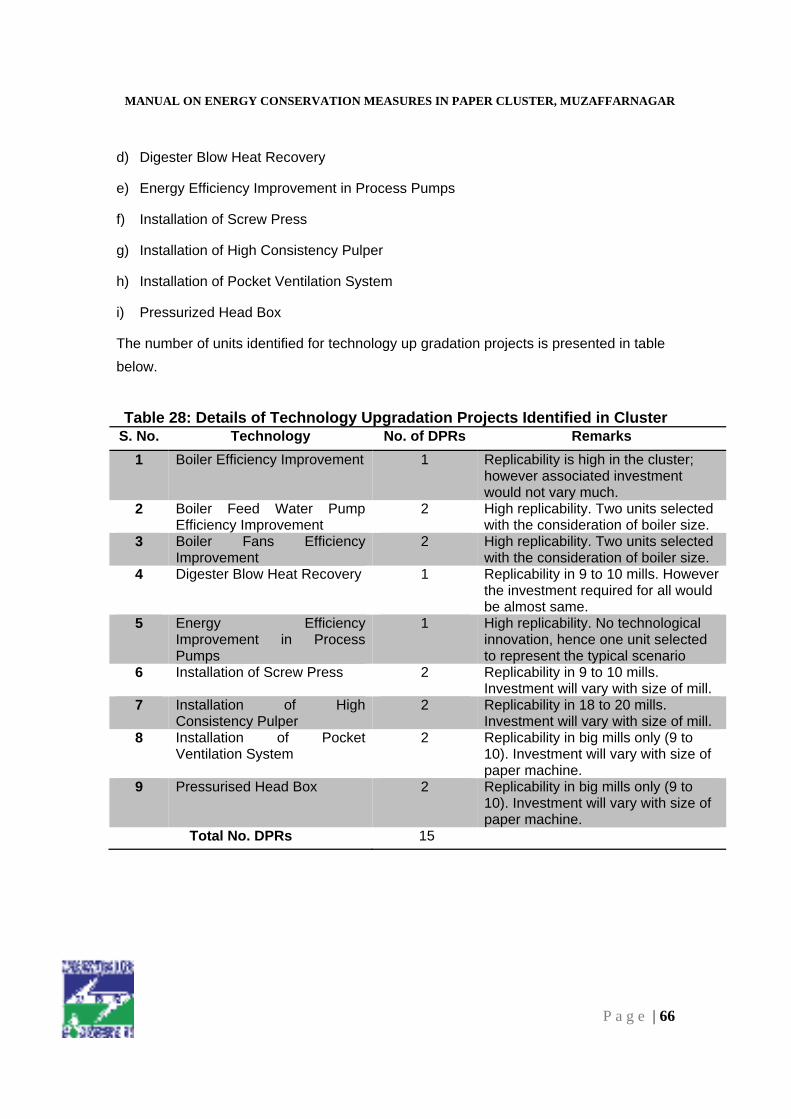
MANUAL ON ENERGY CONSERVATION MEASURES IN PAPER CLUSTER, MUZAFFARNAGAR
P a g e | 66
d) Digester Blow Heat Recovery
e) Energy Efficiency Improvement in Process Pumps
f) Installation of Screw Press
g) Installation of High Consistency Pulper
h) Installation of Pocket Ventilation System
i) Pressurized Head Box
The number of units identified for technology up gradation projects is presented in table
below.
Table 28: Details of Technology Upgradation Projects Identified in Cluster S. No. Technology No. of DPRs Remarks
1 Boiler Efficiency Improvement 1 Replicability is high in the cluster; however associated investment would not vary much.
2 Boiler Feed Water Pump Efficiency Improvement
2 High replicability. Two units selected with the consideration of boiler size.
3 Boiler Fans Efficiency Improvement
2 High replicability. Two units selected with the consideration of boiler size.
4 Digester Blow Heat Recovery 1 Replicability in 9 to 10 mills. However the investment required for all would be almost same.
5 Energy Efficiency Improvement in Process Pumps
1 High replicability. No technological innovation, hence one unit selected to represent the typical scenario
6 Installation of Screw Press 2 Replicability in 9 to 10 mills. Investment will vary with size of mill.
7 Installation of High Consistency Pulper
2 Replicability in 18 to 20 mills. Investment will vary with size of mill.
8 Installation of Pocket Ventilation System
2 Replicability in big mills only (9 to 10). Investment will vary with size of paper machine.
9 Pressurised Head Box 2 Replicability in big mills only (9 to 10). Investment will vary with size of paper machine.
Total No. DPRs 15

MANUAL ON ENERGY CONSERVATION MEASURES IN PAPER CLUSTER, MUZAFFARNAGAR
P a g e | 67
44 EEnnvviirroonnmmeennttaall BBeenneeffiittss The total energy saved after the implementation of project as demonstrated in the
section 6 is 9,537,288 kWh of electricity and 396,982 mn kJ of heat per year.
Considering that 50% of this electricity saved is from grid and rest is from biomass and
similarly 50% of heat is from coal and rest is from biomass, the total GHG emission
reduction potential of this activity amounts to 22,832 tons of CO2 emission reduction.
Table 29: GHG emission reduction potential SN Description Value, t CO2e
1 GHG emission reduction from electricity 3,815
2 GHG emission reduction from fuel 19,017
3 Total 22,832
Apart from the GHG emissions this energy conservation project will also reduce the Sox
& NOx emissions arising from use of fossil fuel.

MANUAL ON ENERGY CONSERVATION MEASURES IN PAPER CLUSTER, MUZAFFARNAGAR
P a g e | 68
55 SSmmaallll GGrroouupp AAccttiivviittiieess//TToottaall EEnneerrggyy
MMaannaaggeemmeenntt
55..11 IINNTTRROODDUUCCTTIIOONN
Energy is one of the most important resources to sustain our lives. At present we still
depend a lot on fossil fuels and other kinds of non-renewable energy. The extensive use
of renewable energy including solar energy needs more time for technology
development. In this situation Energy Conservation (EC) is the critical needs in any
countries in the world.
Of special importance of Energy Conservation are the following two aspects:
(1) Economic factors
(2) Environmental impacts
5.1.1 Economic Factors of Energy Conservation
Energy saving is important and effective at all levels of human organizations – in the
whole world, as a nation, as companies or individuals. Energy Conservation reduces the
energy costs and improves the profitability.
Notably, the wave of energy conservation had struck the Indian intelligentia 3 years
earlier when a Fuel Policy Committee was set up by the Government of India in 1970,
which finally bore fruits three decades hence in the form of enactment of the much
awaited Energy Conservation Act, 2001 by the Government of India. This Act made
provisions for setting up of the Bureau of Energy Efficiency, a body corporate
incorporated under the Act, for supervising and monitoring the efforts on energy
conservation in India.
Brief History of energy efficiency movement in India and associated major milestones
are as follows
� 1974: setting up of fuel efficiency team by IOC, NPC and DGTD (focus still on
industry)
� 1975: setting up of PCAG (NPC main support provider) : focus expanded to include
agriculture, domestic and transport
MANUAL ON ENERGY CONSERVATION MEASURES IN PAPER CLUSTER, MUZAFFARNAGAR
P a g e | 69
� 1978: Energy Policy Report of GOI: for the first time, EE as an integral part of
national energy policy – provided detailed investigation into options for promoting EE
� Post 1980, several organizations started working in EC area on specific programs
(conduct of audits, training, promotion, awareness creation, demonstration projects,
films, booklets, awareness campaigns, consultant/product directories)
o Some line Ministries and organizations like BICP, BIS, NPC, PCRA, REC,
Ministry of Agriculture, TERI, IGIDR, CSIR, PETS (NPTI)
o State energy development agencies
o Industry associations
o All India financial institutions
The Government of India set up Bureau of Energy Efficiency (BEE) on 1st March 2002
under the provisions of the Energy Conservation Act, 2001. The mission of the Bureau of
Energy Efficiency is to assist in developing policies and strategies with a thrust on self-
regulation and market principles, within the overall framework of the Energy
Conservation Act, 2001 with the primary objective of reducing energy intensity of the
Indian economy. This will be achieved with active participation of all stakeholders,
resulting in accelerated and sustained adoption of energy efficiency in all sectors
Private companies are also sensitive to energy costs, which directly affects their
profitability and even their viability in many cases. Especially factories in the industrial
sectors are of much concern, because reduced costs by Energy Conservation mean the
more competitive product prices in the world markets and that is good for the national
trade balance, too.
5.1.2 Environmental impacts of Energy Conservation
Energy Conservation is closely related also to the environmental issues. The problem of
global warming or climate change is caused by emission of carbon dioxide and other
Green House Gases (GHG). Energy Conservation, especially saving use of fossil fuels,
shall be the first among the various countermeasures of the problem, with due
considerations of the aforementioned economic factors.
55..22 SSMMAALLLL GGRROOUUPP AACCTTIIVVIITTIIEESS ((SSGGAA))
Small Group Activity (SGA) gives employees the problem solving tools they need to
eliminate obstacles to Total Productivity, the cumination of zero break-downs, zero
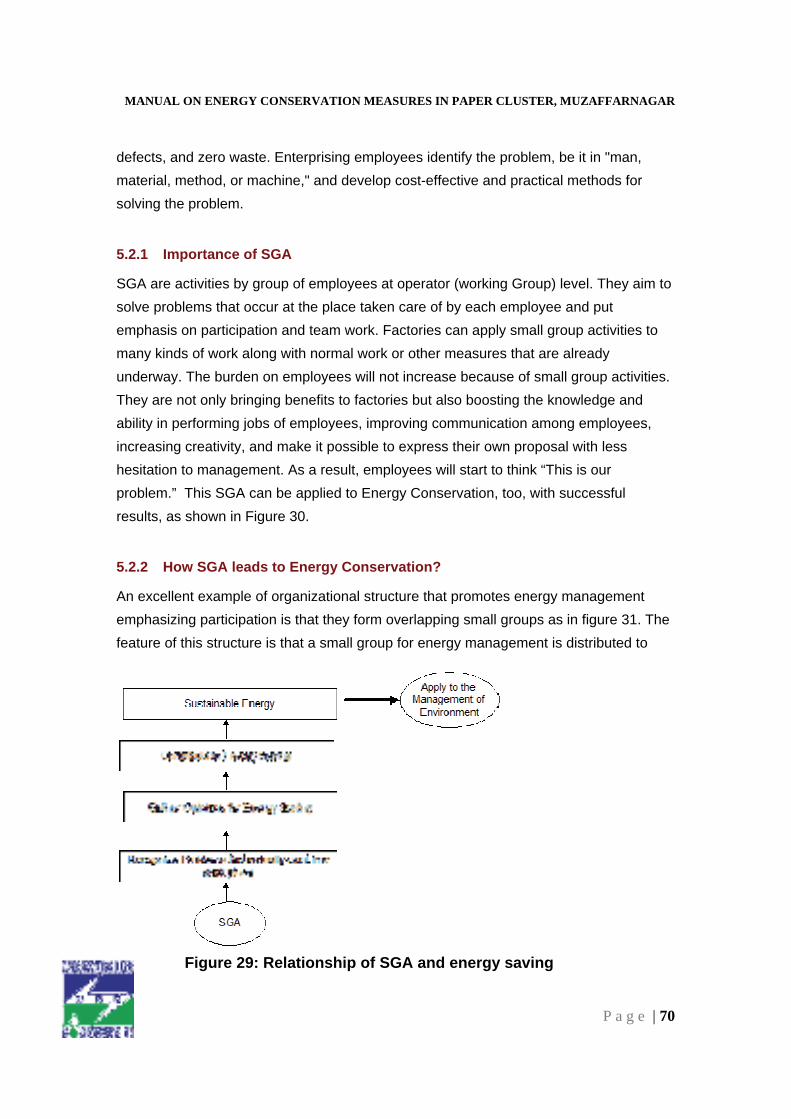
MANUAL ON ENERGY CONSERVATION MEASURES IN PAPER CLUSTER, MUZAFFARNAGAR
P a g e | 70
defects, and zero waste. Enterprising employees identify the problem, be it in "man,
material, method, or machine," and develop cost-effective and practical methods for
solving the problem.
5.2.1 Importance of SGA
SGA are activities by group of employees at operator (working Group) level. They aim to
solve problems that occur at the place taken care of by each employee and put
emphasis on participation and team work. Factories can apply small group activities to
many kinds of work along with normal work or other measures that are already
underway. The burden on employees will not increase because of small group activities.
They are not only bringing benefits to factories but also boosting the knowledge and
ability in performing jobs of employees, improving communication among employees,
increasing creativity, and make it possible to express their own proposal with less
hesitation to management. As a result, employees will start to think “This is our
problem.” This SGA can be applied to Energy Conservation, too, with successful
results, as shown in Figure 30.
5.2.2 How SGA leads to Energy Conservation?
An excellent example of organizational structure that promotes energy management
emphasizing participation is that they form overlapping small groups as in figure 31. The
feature of this structure is that a small group for energy management is distributed to
Figure 29: Relationship of SGA and energy saving
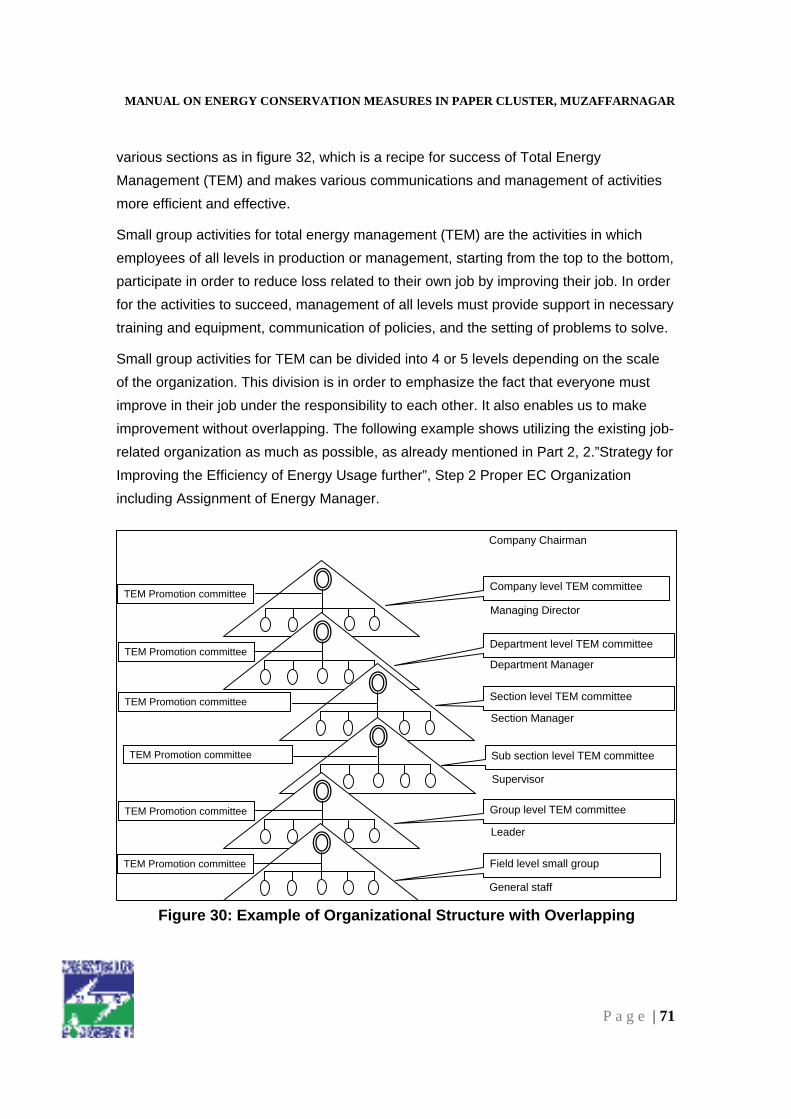
MANUAL ON ENERGY CONSERVATION MEASURES IN PAPER CLUSTER, MUZAFFARNAGAR
P a g e | 71
various sections as in figure 32, which is a recipe for success of Total Energy
Management (TEM) and makes various communications and management of activities
more efficient and effective.
Small group activities for total energy management (TEM) are the activities in which
employees of all levels in production or management, starting from the top to the bottom,
participate in order to reduce loss related to their own job by improving their job. In order
for the activities to succeed, management of all levels must provide support in necessary
training and equipment, communication of policies, and the setting of problems to solve.
Small group activities for TEM can be divided into 4 or 5 levels depending on the scale
of the organization. This division is in order to emphasize the fact that everyone must
improve in their job under the responsibility to each other. It also enables us to make
improvement without overlapping. The following example shows utilizing the existing job-
related organization as much as possible, as already mentioned in Part 2, 2.”Strategy for
Improving the Efficiency of Energy Usage further”, Step 2 Proper EC Organization
including Assignment of Energy Manager.
Field level small group
Group level TEM committee
Sub section level TEM committee
Section level TEM committee
Department level TEM committee
Company level TEM committee
Managing Director
Company Chairman
Department Manager
Section Manager
Supervisor
Leader
General staff
TEM Promotion committee
TEM Promotion committee
TEM Promotion committee
TEM Promotion committee
TEM Promotion committee
TEM Promotion committee
Figure 30: Example of Organizational Structure with Overlapping

MANUAL ON ENERGY CONSERVATION MEASURES IN PAPER CLUSTER, MUZAFFARNAGAR
P a g e | 72
5.2.2.1 Executives level
� Define the policy and target for Total Energy Management
� Follow-up and manage activities to make sure that activities are implemented
according to the policy
� Consider opinions and suggestions from the promotion office
� Consider reports from promotion committee from various levels
5.2.2.2 Level of Total Energy Management promotion office
� Make sure that whole activities are done in the correct direction, without delay and
smoothly
� Find a suitable method that makes it possible to implement activities continuously
and without slowdown
� Listen to opinions and suggestions from small groups in order to use for improving
Department
Team committee
Section 2 Section 1
SG1 SG2 SG3 SG4 SG5 SG6 SG7
SMALL GROUP ACTIVITY
Figure 31: Positioning of SGA in Main Job Structure

MANUAL ON ENERGY CONSERVATION MEASURES IN PAPER CLUSTER, MUZAFFARNAGAR
P a g e | 73
� Provide advice for Total Energy Management to various groups
� Persons in charge of the office must be those with good personal relationship,
friendly, and with spirit of good service
5.2.2.3 Medium level
� Define the policies of each department that are consistent with the policy of the Total
Energy Management and the target of the company
� Define numerical targets to sub-groups apart from the target of the company as a
whole
� Follow-up the progress in order to provide to sub-groups
� Report the progress along with suggestions and opinions to upper level committee
periodically
5.2.2.4 Workers/Operators level
� Implement small group activities with various themes and achieve target
� Report progress and problems encountered during implementation to upper level
committee periodically
� Ask for support, suggestions, and opinions from upper level committee
5.2.2.5 Responsibility of Energy Conservation committee
� Gather and analyze information on costs related to energy every month
� Analyze and solve problems related to energy
� Find a method for energy conservation
� Prepare energy conservation plan
� Follow-up the result of implementing the plan
� Perform activities such as public relationship for encouraging employees to
participate
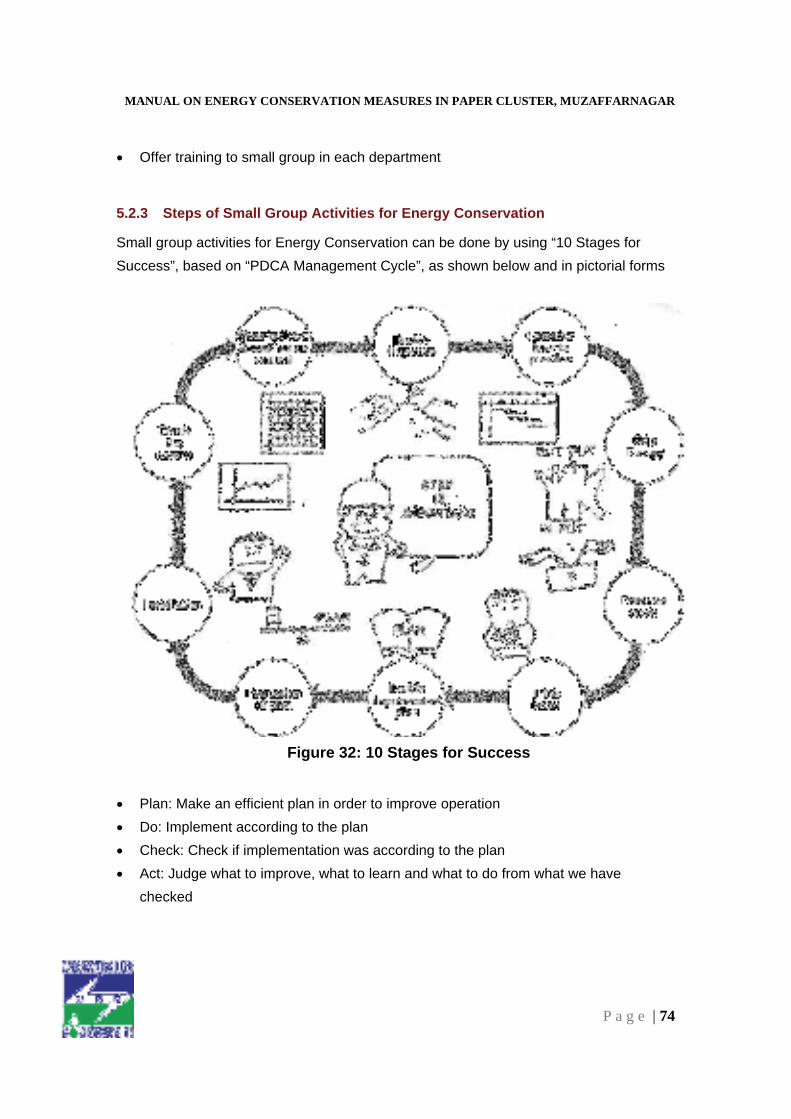
MANUAL ON ENERGY CONSERVATION MEASURES IN PAPER CLUSTER, MUZAFFARNAGAR
P a g e | 74
� Offer training to small group in each department
5.2.3 Steps of Small Group Activities for Energy Conservation
Small group activities for Energy Conservation can be done by using “10 Stages for
Success”, based on “PDCA Management Cycle”, as shown below and in pictorial forms
� Plan: Make an efficient plan in order to improve operation
� Do: Implement according to the plan
� Check: Check if implementation was according to the plan
� Act: Judge what to improve, what to learn and what to do from what we have
checked
Figure 32: 10 Stages for Success
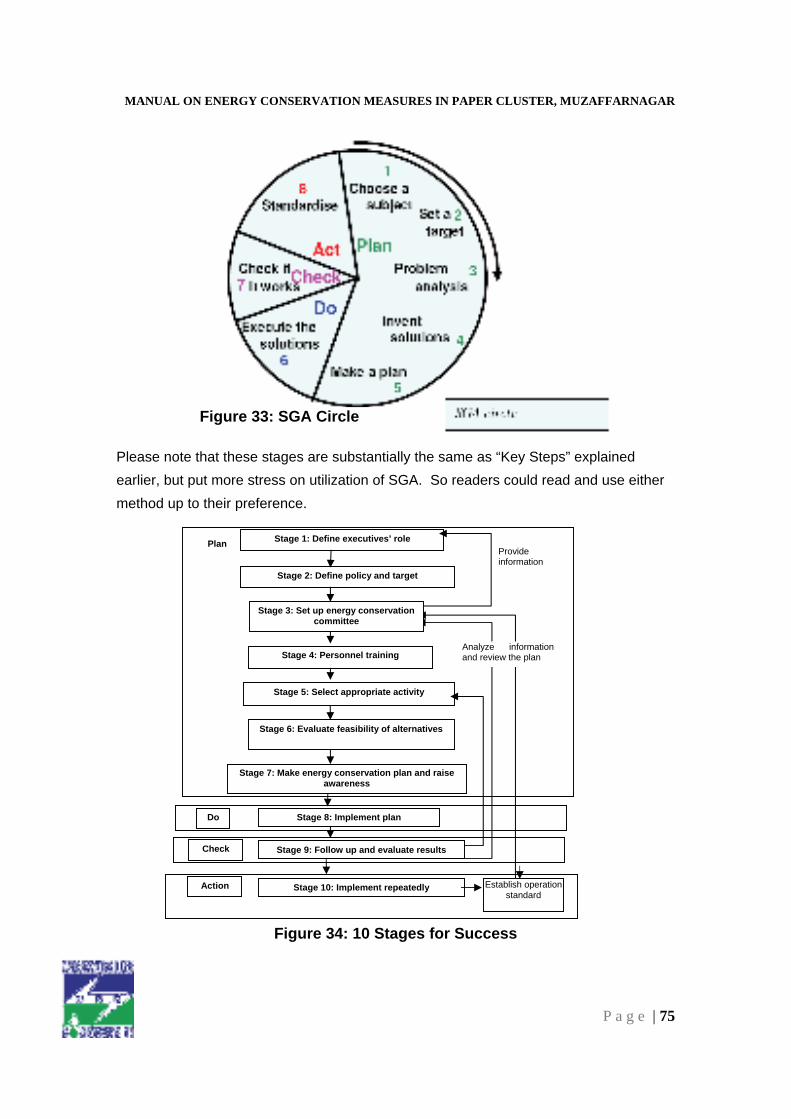
MANUAL ON ENERGY CONSERVATION MEASURES IN PAPER CLUSTER, MUZAFFARNAGAR
P a g e | 75
Please note that these stages are substantially the same as “Key Steps” explained
earlier, but put more stress on utilization of SGA. So readers could read and use either
method up to their preference.
Figure 33: SGA Circle
Provide information
Plan Stage 1: Define executives’ role
Stage 2: Define policy and target
Do
Check
Action
Stage 4: Personnel training
Stage 5: Select appropriate activity
Stage 6: Evaluate feasibility of alternatives
Stage 7: Make energy conservation plan and raise awareness
Stage 10: Implement repeatedly Establish operation standard
Stage 3: Set up energy conservation committee
Stage 9: Follow up and evaluate results
Stage 8: Implement plan
Analyze information and review the plan
Figure 34: 10 Stages for Success

MANUAL ON ENERGY CONSERVATION MEASURES IN PAPER CLUSTER, MUZAFFARNAGAR
P a g e | 76
5.2.3.1 Stage 1: Define Executive’s Role
In promoting small group activities, support must be provided such as basic
environmental support. Therefore, executives must provide follow up support to
employees of their companies.
� Establish a special unit that provides support to small group activities
� Prepare a system for managing small group activities in the company
� Prepare annual plan for small group activities
� Prepare a venue for meeting, consultation, advice or suggestion
� Establish a system for giving rewards to high achieving employees
� Establish a reporting system starting from informing what to do until reporting of the results
� Establish a fair system for evaluating results
� Establish a system for providing support and training to employees
5.2.3.2 Stage 2: Define Policy and Target
� Executives must announce a policy of supporting small group activities.
� Energy conservation committee must act as an advisor in order to set a numerical target that is consistent with total energy management (TEM) policy and the target of the organization. Specific targets must be set for each group.
We can see that responsibilities in stages 1 and 2 are mainly those of executives and
committee. Responsibility of employees will become clearer from stage 3 and
afterwards.
5.2.3.3 Stage 3: Set up Energy Conservation Committee
The principle of small group activities (SGA) is to divide into groups based on the scope
of responsibility. The size of the group will depend on the size of organization. However,
size of the group should not be too large. Usually a size of 5 to 10 persons is considered
appropriate. It is important to define responsibilities clearly so that every member of the
group can have their responsibility and participate in the activities.

MANUAL ON ENERGY CONSERVATION MEASURES IN PAPER CLUSTER, MUZAFFARNAGAR
P a g e | 77
5.2.3.4 Stage 4: Personnel Training
This stage will help employees to have more knowledge and understanding, have new
ideas, and have more belief in their own responsibility.
5.2.3.5 Stage 5: Select Appropriate Activity
In doing small group activities, each member must be able to think, express their own
ideas, and make decisions based on reality and by investigating electrical equipment,
machines, and office equipment that exist in the area of their responsibility. Items to
consider include size, number, where to use, situation of usage, current situation, and
the number of hours usage per day.
By this we can evaluate the current situation of energy usage. Also by judging if there
are more machines than needed, we can choose suitable activities and real problems for
the organization.
5.2.3.6 Stage 6: Evaluate feasibility of alternatives (Analyze problems and decide on the
measures and activities in each point)
Each group will gather ideas on the reasons for the problems, obstacles, and how to
solve problems in order to decide on the problems, measures, and importance of
activities and thus evaluate on the feasibility of activities to do based on advice from
department manager. Basically, the following activities are not suitable for small group
activities.
� Highly technical issues
� Issues that require a long time or many people to implement
We have identified the following problems through small group activities.
� Issues on material quality or production that influence energy usage
� Behavior on energy usage
� Efficiency of machines or equipment that uses energy
� Awareness toward environment and energy usage
� Safety costs for energy conservation
MANUAL ON ENERGY CONSERVATION MEASURES IN PAPER CLUSTER, MUZAFFARNAGAR
P a g e | 78
5.2.3.7 Stage 7: Make Energy Conservation Plan and Raise Awareness
Each group must prepare its activity plan. Generally, implementation for small group
activities takes 6 months to 1 year. Activities to be implemented should correspond to
the objectives of each group. Besides, it might help to listen to opinions of all
organizations in order to receive support from all other organizations.
5.2.3.8 Stage 8: Implement Plan
Implement according to the plan of each group.
5.2.3.9 Stage 9: Follow Up and Evaluate Results
After implementing the plan, each member of small groups will follow up and evaluate
the result by analyzing result, search for strong and weak points of activities, find a way
to improve the activities and report on general achievement.
5.2.3.10 Stage 10: Implement Repeatedly
Energy conservation is an activity that must be implemented repeatedly. Therefore, it is
necessary to implement each activity repeated and make improvement to each activity.
If we are satisfied with the results, by achieving the objectives of activities, we should
provide rewards in order to give motivation for continuing the small group activities and
implement creative activities.
Dos and Don’ts in Energy Conservation
Don’t Emphasize the mistakes in the past. It is better to talk about the present.
Don’t Be worried about the theory or principles. Don’t spend too much time in discussion or analysis of problems in meeting rooms.
Don’t Think that an activity can be done perfectly from the beginning. It is necessary to do the job continuously by having experiences and judging by ourselves.
� Do Start with an activity that requires small amount of investment.
� Do Raise awareness so that all employees understand the necessity and importance of energy conservation and participate in it.
� Do Start the activity now without postponing to tomorrow.

MANUAL ON ENERGY CONSERVATION MEASURES IN PAPER CLUSTER, MUZAFFARNAGAR
P a g e | 79
5.2.4 Tools that are Used Often for Small Group Activities for Energy
Conservation
5.2.4.1 5S
5S is a contraction derived from the Japanese words Seiri, Seito, Seiso, Seiketsu, and
Shitsuke. It is simple methodology that is also extremely useful in practical and realistic
life. 5S is a set of actions to be followed through every day activities to advance the
operational surroundings and circumstances. 5S is made in order to provide fortification
to every personage in diverse profitable and industrialized fields. 5S is an extremely
practical contrivance and skill set for anyone who wants to generate a more prolific
environment within the workplace or who wants to make it their profession to make other
people's businesses more proficient and productive. 5S occupy a list of products
including eyewear, ear protectors and safety gears. Look into these different products
that make up the significance of an industrialized security supply.
Figure 35: 5S’s

MANUAL ON ENERGY CONSERVATION MEASURES IN PAPER CLUSTER, MUZAFFARNAGAR
P a g e | 80
Lean Six Sigma experts promise or guarantee for the efficiency of 5S as an enlightening
enhancement to better working surroundings in an association. If you dig up Six Sigma
guidance that is paid for by your company, you will be in a position to work for your
company and make things better for you as well as for everyone. 5S is very useful in lots
of industries and job markets, but can often fail simply because of the lack of recognition
concerning changes in the office.
5S consists of five steps that are crucial for the completion of 5S. The 5S steps are
described as follows-
1. Seiri/Sort - This is very logical term in, which identification of the contents take place, data base of the products have been created and, then any kind of sorting take place just to arrange the products and removal of unwanted items. Classification of the products is necessary, which is called Red Tagging. It is important just to identify factors, right from whether it is needed, existing amount obligatory amount, occurrence of necessity, and so on.
2. Seito/Systemize - This step in 5S process consists of removal of unwanted items permanently and one more task that to be take place is decision that means you have to decide that what is required to be in what place. Place the items in such manner that you could retrieve them within 30 seconds of requirement.
3. Seiso/Brush away/Sweep - Examine all the items on the daily basis. The process is not that much time consuming, but essential to clean up your workplace and most required in 5S. The conscientiousness to keep the office clean should be circulated between everyone in the group.
4. Seiketsu /Homogenize - This important step of 5S involves the visual control, which is important to keep your organization well organized and clean. It is a complete evaluation to improve the working conditions.
5. Shitsuke/Self Control - This step is quite essential, but critical because it involves all the discipline to ensure the 5S standards, it also takes charge of dedication and commitment.
5.2.4.2 QCC (Quality Control Circle)
QCC (Quality control circle) means controlling quality through group activities. For this, it
is necessary to work hand in hand and achieve objective quality or customers’ request.
With this, we can find weak points, find the cause of problems, gather ideas for problem
solving and systematically prepare quality and thus, solve problems such as material
loss, production costs, working hours, or productivity. This is also a very useful tool to

MANUAL ON ENERGY CONSERVATION MEASURES IN PAPER CLUSTER, MUZAFFARNAGAR
P a g e | 81
tackle with Energy Conservation problem. So many factories or institutions are
encouraged to utilize this tool.

MANUAL ON ENERGY CONSERVATION MEASURES IN PAPER CLUSTER, MUZAFFARNAGAR
P a g e | 82
66 CCoonncclluussiioonn
66..11 AALLLL EENNEERRGGYY SSAAVVIINNGG MMEEAASSUURREESS IIDDEENNTTIIFFIIEEDD
Table 30: List of Energy Conservation Measures Identified Sr. No Energy Conservation Measure
1 Boiler Efficiency Improvement
2 Boiler Feed Water Pump Efficiency Improvement
3 Boiler Feed Water Pump Pressure Drop Reduction
4 Boiler Fans Efficiency Improvement
5 Flash Steam Recovery
6 Digester Blow Heat Recovery
7 Steam Consumption Reduction by Efficient Condensate
Evacuation from Dryers
8 Energy Efficiency Improvement in Process Pumps
9 Installation of Screw Press
10 Installation of High Consistency Pulper
11 Installation of Pocket Ventilation System
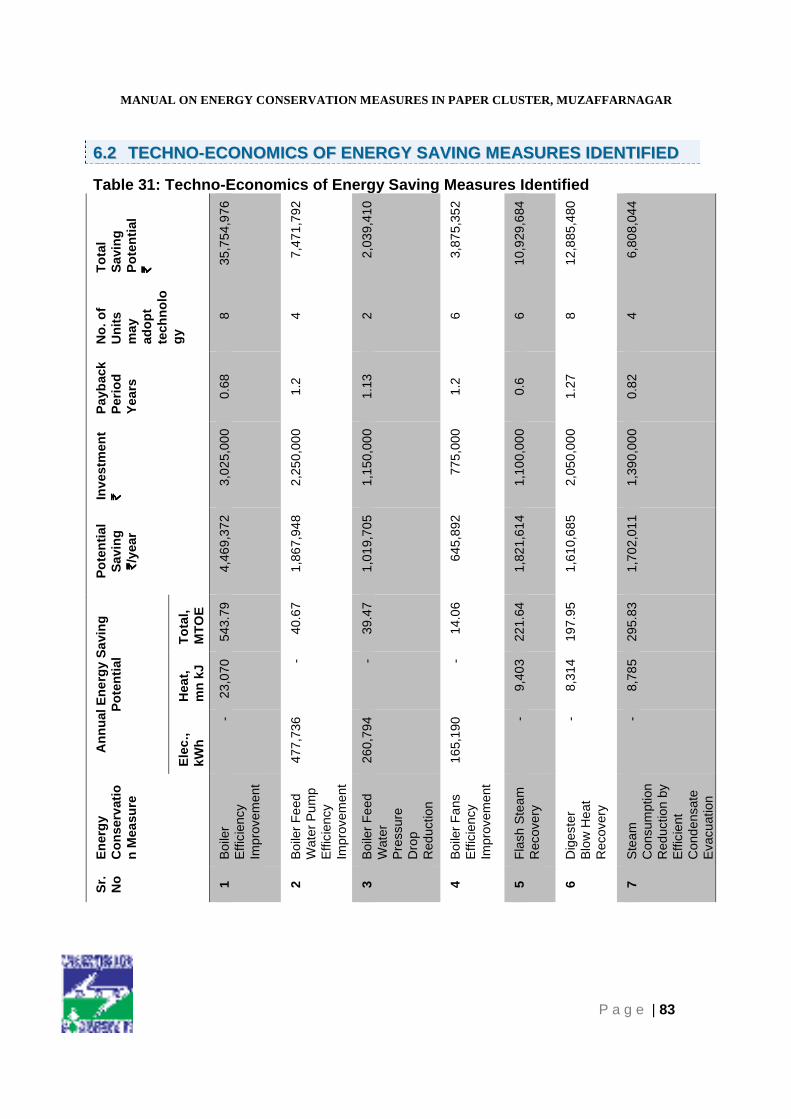
MANUAL ON ENERGY CONSERVATION MEASURES IN PAPER CLUSTER, MUZAFFARNAGAR
P a g e | 83
66..22 TTEECCHHNNOO--EECCOONNOOMMIICCSS OOFF EENNEERRGGYY SSAAVVIINNGG MMEEAASSUURREESS IIDDEENNTTIIFFIIEEDD
Table 31: Techno-Economics of Energy Saving Measures Identified
To
tal
Sav
ing
P
ote
nti
al
�� ���� �� 35
,754
,976
7,47
1,79
2
2,03
9,41
0
3,87
5,35
2
10,9
29,6
84
12,8
85,4
80
6,80
8,04
4
No
. of
Un
its
may
ad
op
t te
chn
olo
gy
8 4 2 6 6 8 4
Pay
bac
k P
erio
d
Yea
rs
0.68
1.2
1.13
1.2
0.6
1.27
0.82
Inve
stm
ent
�� ���� ��
3,02
5,00
0
2,25
0,00
0
1,15
0,00
0
775,
000
1,10
0,00
0
2,05
0,00
0
1,39
0,00
0
Po
ten
tial
S
avin
g
�� ��/y
ear
4,46
9,37
2
1,86
7,94
8
1,01
9,70
5
645,
892
1,82
1,61
4
1,61
0,68
5
1,70
2,01
1
An
nu
al E
ner
gy
Sav
ing
P
ote
nti
al
To
tal,
MT
OE
543.
79
40.6
7
39.4
7
14.0
6
221.
64
197.
95
295.
83
Hea
t,
mn
kJ
23,0
70 - - -
9,40
3
8,31
4
8,78
5
Ele
c.,
kWh
-
477,
736
260,
794
165,
190 - - -
En
erg
y C
on
serv
atio
n M
easu
re
Boi
ler
Effi
cien
cy
Impr
ovem
ent
Boi
ler
Fee
d W
ater
Pum
p E
ffici
ency
Im
prov
emen
t
Boi
ler
Fee
d W
ater
P
ress
ure
Dro
p R
educ
tion
Boi
ler
Fan
s E
ffici
ency
Im
prov
emen
t
Fla
sh S
team
R
ecov
ery
Dig
este
r B
low
Hea
t R
ecov
ery
Ste
am
Con
sum
ptio
n R
educ
tion
by
Effi
cien
t C
onde
nsat
e E
vacu
atio
n
Sr.
N
o
1 2 3 4 5 6 7

MANUAL ON ENERGY CONSERVATION MEASURES IN PAPER CLUSTER, MUZAFFARNAGAR
P a g e | 84
13,0
35,6
84
6,20
2,82
4
1,12
6,08
0
1,91
4,76
0
9,28
3,04
0
111,
327,
126
12
3 2 2 4 61
0.6
2.2
3.55
2.09
1.94
1.26
651,
000
4,55
5,00
0
2,00
0,00
0
2,00
0,00
0
4,50
0,00
0
25,4
46,0
00
1,08
6,30
7
2,06
7,60
8
563,
040
957,
380
2,32
0,76
0
20,1
32,3
22
7.33
84.1
23.2
2
291.
19 -
1,82
9.79
- - -
12,3
54
7,41
1
69,3
37
277,
828
528,
800
144,
000 -
226,
320
2,08
0,66
8
Ene
rgy
Effi
cien
cy
Impr
ovem
ent
in P
roce
ss
Pum
ps
Inst
alla
tion
of
Scr
ew P
ress
Inst
alla
tion
of
Hig
h C
onsi
sten
cy
Pul
per
Inst
alla
tion
of
Poc
ket
Ven
tilat
ion
Sys
tem
Inst
alla
tion
of
Pre
ssur
ized
H
ead
Box
Tot
al
8 9 10
11
12
13

MANUAL ON ENERGY CONSERVATION MEASURES IN PAPER CLUSTER, MUZAFFARNAGAR
P a g e | 85
66..33 SSUUMMMMAARRYY OOFF LLEEVVEELL OOFF AAWWAARREENNEESSSS OONN EENNEERRGGYYEEFFFFIICCIIEENNCCYY AANNDD EENNEERRGGYY CCOONNSSEERRVVAATTIIOONN PPOOTTEENNTTIIAALL IINN TTHHEECCLLUUSSTTEERR
Level of awareness on energy efficiency and energy conservation products in the
Muzaffarnagar Paper cluster is poor, due to below mentioned reasons.
� Lack of awareness on the Energy efficiency
� Lack of organizational commitment
� Narrow focus on Energy
� Not clear about their existing level of operations and efficiency, due to lack of
instrumentation & non availability of Energy consumption data
� Limited manpower
� Lack of trained manpower
� Limited information on new technologies
� Cost of Energy conservation options
Major energy sources being used in cluster are Coal, Biomass and Electrical energy.
Annual energy consumption of above mentioned sources in different type of operations in
Muzaffarnagar cluster is presented in table below:
Table 32: Annual energy consumption of various energy sources in Muzaffarnagar Paper cluster
S. No Type of Unit Electrical energy
consumption (kWh/annum)
FuelConsumption
(GJ)
Gross (MTOE)
1 Agro Waste & Waste Paper
68,656,291 3,214,746 82,445
2 Waster Paper 109,046,952 454,599 20,200
3 Total 177,703,243 3,669,345 102,645
Total Annual energy consumption in the cluster is around 102,645 MTOE (Tonnes of Oil
Equivalent). After implementation of proposed energy conservation measures will save
the 9,537,288 kWh of electrical energy and 396,982 mn kJ of fuel. Annual energy saving
potential identified in cluster is around 10,272 MTOE, which is around 10% of total energy
consumption.

MANUAL ON ENERGY CONSERVATION MEASURES IN PAPER CLUSTER, MUZAFFARNAGAR
P a g e | 86
Annexure 1
List of Paper Mills in Muzaffarnagar Paper Cluster
Table 33: List of Paper Mills in Cluster Sr. No Paper Mill Product Capacity Raw Material
1 Parijat Paper Mills Ltd Kraft Paper 14000 TPA Waste Paper
2 Bindlas Duplex Ltd MG Kraft
Paper, Duplex
Board
38000 TPA Agrowaste &
Waste Paper
3 Tehri Pulp and Paper Ltd Kraft Paper 75000 TPA Agrowaste &
Waste Paper
4 Tirupati Balaji Fibres
Limited
Writing &
Printing Paper
13200 TPA Waste Paper
5 Shree Sidhbali Paper Mills
Ltd
Kraft Paper 18000 TPA Agrowaste &
Waste Paper
6 Meenu Paper Mills(P) Ltd Media Kraft
Paper
5000 TPA Waste Paper
7 Silverton Papers Ltd Kraft Paper 25000 TPA Agrowaste &
Waste Paper
8 Garg Duplex and Paper
Mills (P) Ltd
Kraft Paper 15000 TPA Agrowaste &
Waste Paper
9 Silverton Pulp & Papers Pvt
Ltd
Writing &
Printing Paper
8250 TPA Waste Paper
10 Rana Papers Ltd Kraft Paper,
Kraft Liner
49500 TPA Agrowaste &
Waste Paper
11 Shalimar Krafts & Tissues
(P) Ltd
1st Grade
Product
10000 TPA Waste Paper
12 Shalimar Paper Mills (P)
Ltd
Kraft Paper 3500 TPA Waste Paper
13 Mahalxmi Crafts & Tissues
Pvt Ltd
Kraft Paper 8000 TPA Agrowaste &
Waste Paper
14 Shakti Krafts & Tissues Kraft Paper
Super Media
3500 TPA Waste Paper
15 KK Duplex & Paper Mills
(P) Ltd
Duplex, Gray
Board
3500 TPA Waste Paper

MANUAL ON ENERGY CONSERVATION MEASURES IN PAPER CLUSTER, MUZAFFARNAGAR
P a g e | 87
16 Orient Board & Paper Miils
Pvt Ltd
Super Media 3400 TPA Waste Paper
17 Taj Paper Pvt Ltd Kraft Paper 3500 TPA Waste Paper
18 Suyash Kraft & Paper Ltd. Kraft Paper 3600 TPA Waste Paper
19 Maruti Papers Ltd Kraft Paper 24000 TPA Agrowaste &
Waste Paper
20 Nikita Paper Ltd Kraft Paper 21000 TPA Agrowaste &
Waste Paper
21 Bhageshwari paper mills
(P) Ltd
Kraft Paper 10500 TPA Agrowaste &
Waste Paper
22 Sikka Papers Ltd Writing Paper
& Kraft Paper
35000 TPA Agrowaste &
Waste Paper
23 Bindal Papers Ltd Writing Paper 87500 TPA Agro waste
24 Aggarwal Duplex Board MiIls
(P) Ltd
Coated Duplex
Board, Poster
Paper & Hard
Tissue Paper
28000 TPA Waste Paper
25 Shakumbri Paper Mills(P) Ltd Kraft Paper 7000 TPA Agrowaste &
Waste Paper
26 Polymer Paper Ltd Filter Paper 1750 TPA Waste Paper
27 Siddheshwari Paper Mills(P)
Ltd
Kraft Paper 14000 TPA Waste Paper
28 Galaxy Paper Mill Gray Board 10500 TPA Waste Paper
29 Aristo Paper Mill Kraft Paper 3500 TPA Waste Paper
MANUAL ON ENERGY CONSERVATION MEASURES IN PAPER CLUSTER, MUZAFFARNAGAR
P a g e | 88
Annexure 2
Detailed Technology Assessment Report
The detailed technology assessment report is provided for the boiler efficiency
improvement Energy Conservation Measure. Maintaining an optimum air to fuel ratio in
the boiler is key to improved boiler operating efficiency. A stable combustion condition
requires the right amounts of fuels and oxygen. The combustion products are heat
energy, carbon dioxide, water vapor, nitrogen, and other gases (excluding oxygen). In
theory there is a specific amount of oxygen needed to completely burn a given amount of
fuel. In practice, burning conditions are never ideal. Therefore, more air than ideal must
be supplied to burn all fuel completely. The amount of air more than the theoretical
requirement is referred to as excess air. Boilers normally run at about 10 to 20 percent
excess air. Failing to maintain adequate excess air levels and supplying high air to fuel
ratio in the boiler leads to tremendous energy losses in terms of heat generated by fuel
being taken away with nitrogen and unused oxygen. The graph below represents the
variation of boiler efficiency level with reference to the change in the oxygen level in flue
gas, which directly corresponds to the excess air supplied.
Figure 36: Variation of Boiler Efficiency with Oxygen Level in Flue Gas
Optimization of the air to fuel ratio in boiler will lead to intake of optimum amount of air
required for complete combustion. This will lead to reduction in the amount of heat loss,
which was being carried away with the surplus amount of air present in the flue gas.
Reduction of heat loss in flue gas will lead to overall efficiency improvement of the boiler
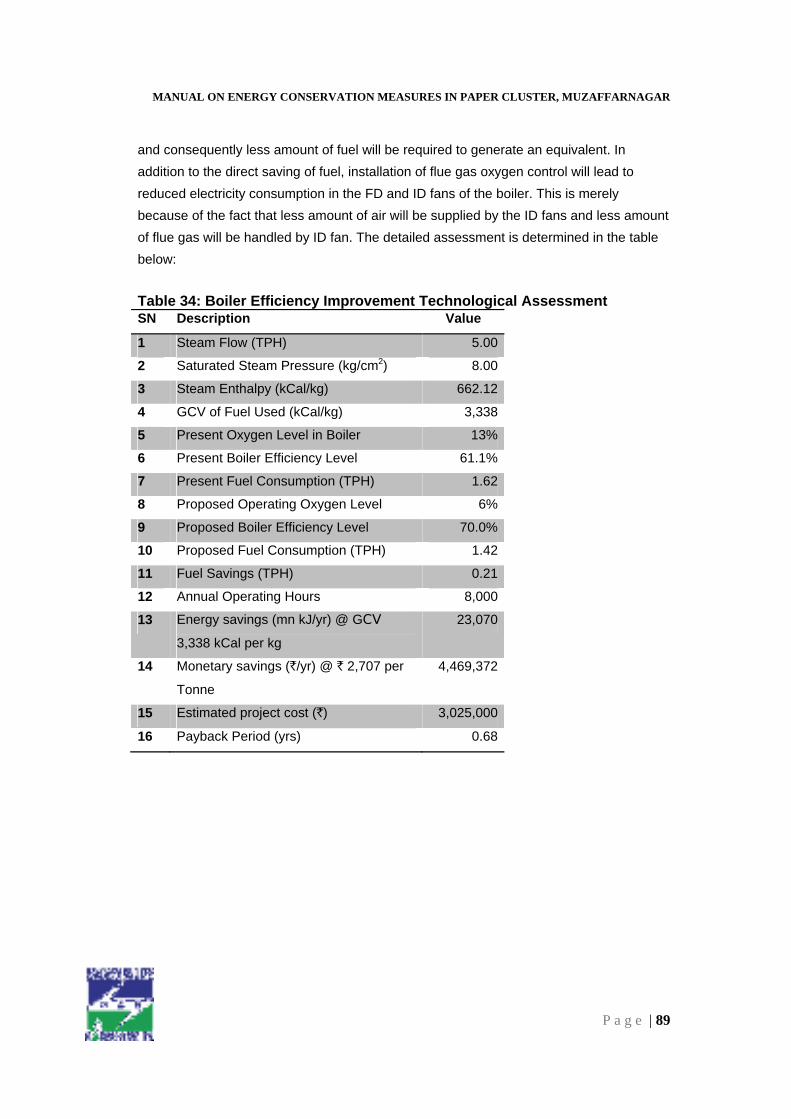
MANUAL ON ENERGY CONSERVATION MEASURES IN PAPER CLUSTER, MUZAFFARNAGAR
P a g e | 89
and consequently less amount of fuel will be required to generate an equivalent. In
addition to the direct saving of fuel, installation of flue gas oxygen control will lead to
reduced electricity consumption in the FD and ID fans of the boiler. This is merely
because of the fact that less amount of air will be supplied by the ID fans and less amount
of flue gas will be handled by ID fan. The detailed assessment is determined in the table
below:
Table 34: Boiler Efficiency Improvement Technological Assessment SN Description Value
1 Steam Flow (TPH) 5.00
2 Saturated Steam Pressure (kg/cm2) 8.00
3 Steam Enthalpy (kCal/kg) 662.12
4 GCV of Fuel Used (kCal/kg) 3,338
5 Present Oxygen Level in Boiler 13%
6 Present Boiler Efficiency Level 61.1%
7 Present Fuel Consumption (TPH) 1.62
8 Proposed Operating Oxygen Level 6%
9 Proposed Boiler Efficiency Level 70.0%
10 Proposed Fuel Consumption (TPH) 1.42
11 Fuel Savings (TPH) 0.21
12 Annual Operating Hours 8,000
13 Energy savings (mn kJ/yr) @ GCV
3,338 kCal per kg
23,070
14 Monetary savings (`/yr) @ ` 2,707 per
Tonne
4,469,372
15 Estimated project cost (`) 3,025,000
16 Payback Period (yrs) 0.68
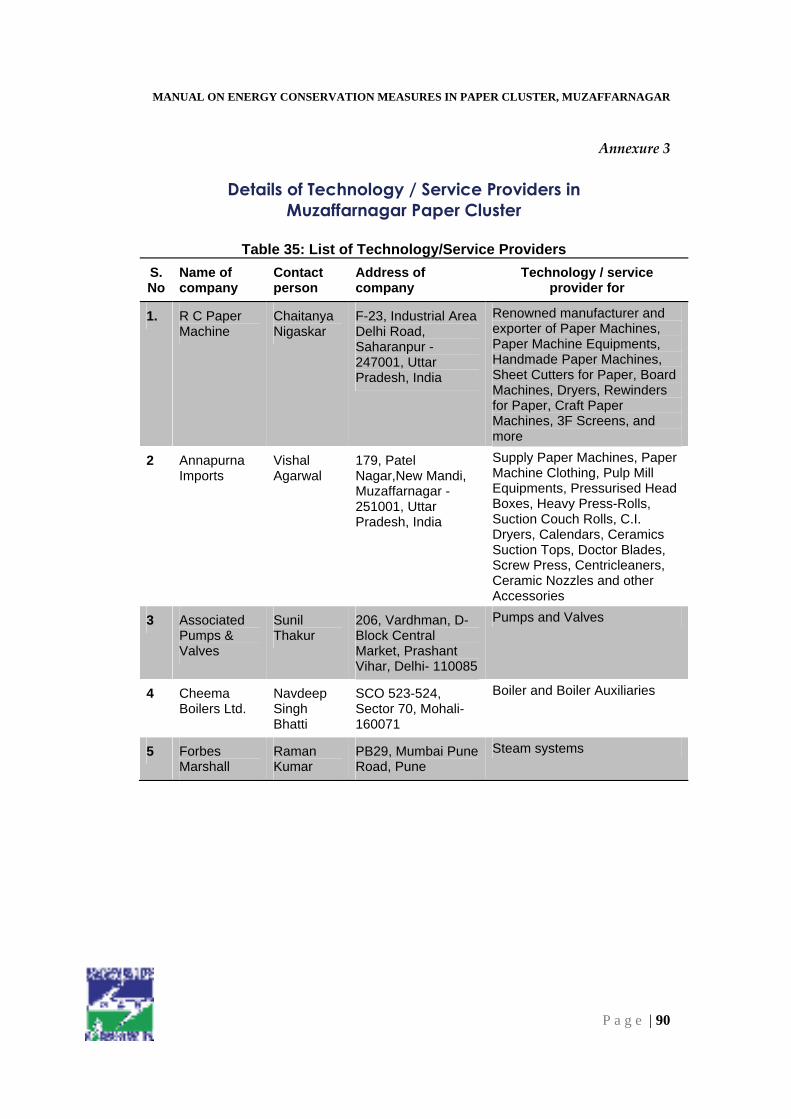
MANUAL ON ENERGY CONSERVATION MEASURES IN PAPER CLUSTER, MUZAFFARNAGAR
P a g e | 90
Annexure 3
Details of Technology / Service Providers in
Muzaffarnagar Paper Cluster
Table 35: List of Technology/Service Providers
S.No
Name of company
Contactperson
Address of company
Technology / service provider for
1. R C Paper Machine
ChaitanyaNigaskar
F-23, Industrial Area Delhi Road, Saharanpur - 247001, Uttar Pradesh, India
Renowned manufacturer and exporter of Paper Machines, Paper Machine Equipments, Handmade Paper Machines, Sheet Cutters for Paper, Board Machines, Dryers, Rewinders for Paper, Craft Paper Machines, 3F Screens, and more
2 AnnapurnaImports
Vishal Agarwal
179, Patel Nagar,New Mandi, Muzaffarnagar - 251001, Uttar Pradesh, India
Supply Paper Machines, Paper Machine Clothing, Pulp Mill Equipments, Pressurised Head Boxes, Heavy Press-Rolls, Suction Couch Rolls, C.I. Dryers, Calendars, Ceramics Suction Tops, Doctor Blades, Screw Press, Centricleaners, Ceramic Nozzles and other Accessories
3 AssociatedPumps & Valves
Sunil Thakur
206, Vardhman, D- Block Central Market, Prashant Vihar, Delhi- 110085
Pumps and Valves
4 CheemaBoilers Ltd.
Navdeep Singh Bhatti
SCO 523-524, Sector 70, Mohali-160071
Boiler and Boiler Auxiliaries
5 ForbesMarshall
RamanKumar
PB29, Mumbai Pune Road, Pune
Steam systems

MANUAL ON ENERGY CONSERVATION MEASURES IN PAPER CLUSTER, MUZAFFARNAGAR
P a g e | 91
Dyanamic Engineers Pvt. Ltd.
D-94, Sector-63, Noida-201301
Phone: 0120-4787400 (30 LINES) Fax: 0120-4787504
Annexure 4
Techno Commercial Bids from Service/Technology Provider
Ref. No.:- 17342/10-11
Date: September 10, 2010.
M/s Deloitte Touche Tohmatsu India Private Ltd
7th
Floor,Building 10,Tower B,DLF Cyber City Complex,
DLF City Phase-II, Gurgaon-122002, Haryana
Sub: - Offer for Screw Press-1200 & Hi-Con Pulper 15 m3
Kind Attn: Mr.Puneet Sethi
Dear Sir,
We thank you for your enquiry thru e-mail dated 31/8/10 for above mentioned subject. We are
pleased to quote our most competitive offer as under.
S.
No.
Products Price in INR
1 Boiler Flue Gas Control
system
2,635,000.00
2 Boiler Feed Water Control
System
1,001,500.00
1. Terms and Conditions:-
Price : CIF New Delhi. India.
Taxes & Duties : Extra As Applicable
Delivery : 2 Months
Payment : 40% Advance & Balance before Despatch
Site Supervision : Will be charged at INR 5000 per Manday
We hope the same is line with your requirement. Awaiting for your valued Order. In case of
any query please contact the undersigned.
Yours Sincerely,
Deepak Chauhan
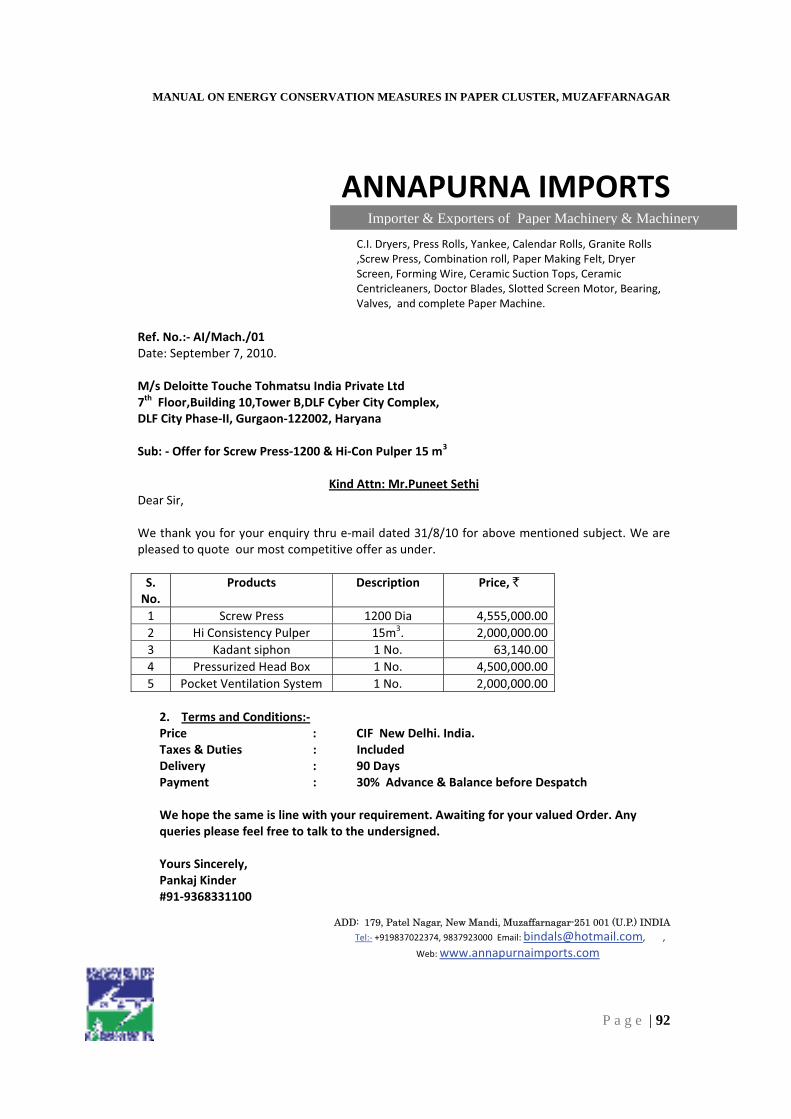
MANUAL ON ENERGY CONSERVATION MEASURES IN PAPER CLUSTER, MUZAFFARNAGAR
P a g e | 92
Importer & Exporters of Paper Machinery & Machinery
ANNAPURNA IMPORTS
C.I. Dryers, Press Rolls, Yankee, Calendar Rolls, Granite Rolls
,Screw Press, Combination roll, Paper Making Felt, Dryer
Screen, Forming Wire, Ceramic Suction Tops, Ceramic
Centricleaners, Doctor Blades, Slotted Screen Motor, Bearing,
Valves, and complete Paper Machine.
Ref. No.:- AI/Mach./01
Date: September 7, 2010.
M/s Deloitte Touche Tohmatsu India Private Ltd
7th Floor,Building 10,Tower B,DLF Cyber City Complex,
DLF City Phase-II, Gurgaon-122002, Haryana
Sub: - Offer for Screw Press-1200 & Hi-Con Pulper 15 m3
Kind Attn: Mr.Puneet Sethi
Dear Sir,
We thank you for your enquiry thru e-mail dated 31/8/10 for above mentioned subject. We are
pleased to quote our most competitive offer as under.
S.
No.
Products Description Price, `
1 Screw Press 1200 Dia 4,555,000.00
2 Hi Consistency Pulper 15m3. 2,000,000.00
3 Kadant siphon 1 No. 63,140.00
4 Pressurized Head Box 1 No. 4,500,000.00
5 Pocket Ventilation System 1 No. 2,000,000.00
2. Terms and Conditions:-
Price : CIF New Delhi. India.
Taxes & Duties : Included
Delivery : 90 Days
Payment : 30% Advance & Balance before Despatch
We hope the same is line with your requirement. Awaiting for your valued Order. Any
queries please feel free to talk to the undersigned.
Yours Sincerely,
Pankaj Kinder
#91-9368331100
ADD: 179, Patel Nagar, New Mandi, Muzaffarnagar-251 001 (U.P.) INDIA
Tel:- +919837022374, 9837923000 Email: [email protected], ,
Web: www.annapurnaimports.com

MANUAL ON ENERGY CONSERVATION MEASURES IN PAPER CLUSTER, MUZAFFARNAGAR
P a g e | 93
To
M/s. Deloitte Touche Tohmatsu India Pvt Ltd , Gurgaon
Offer No. 10439/2010, 9/9/2010
Kind Attn. Mr Puneet Sethi
Sub: Your requirement of KSB pumps
Dear Sir,
Please refer your enquiry, we are pleased to submit our offer as under.
No. PUMP PUMP
MODEL
CAP
(M3/HR)
SUC TION
PRESSURE
(KG/CM2)
DISCHARGE
PR
(KG/CM2)
QTY EFF% BKW MK
W RPM
UNIT
PRICE(Rs)
1 FAN PUMP PM1 MEGA-G-
50-160 58.63 1.1 3.5 1 77.07 4.93 7.5 2870
50077.00
2 FAN PUMP PM2 MEGA-G-
150-315 395.83 1.2 3.5 1 83.46 29.47 37 1470
233006.00
3 SUBMERSIBLE
WATER PUMP SUB 180 - 5 1 77.23 31.86 40 1440
68324.00
4 CHEST PUMP 3 MEGA-G-
80-315 120 0.3 3 1 76.61 11.43 15 1455
109035.00
5 HIGH PR PUMP
MOVITE
C VCF
10/16
8 0.2 13.8 1 60 4.94 5.5 2900
95523.00
6 BFW PUMP HAD
80/11 60 1.2 90 1 68 207 250 2980
1956521.00
Terms and conditions
Price for Delhi
Payment 100% against performa invoice.
Delivery within 4 weeks from the date of your po.
Sales tax/vat/ed extra as applicable at the time of despatch.
Warranty as per warranty card of manufacturer.
Hope you will find our offer in line with your requirement and shall look forward to receive your
valued order.
Thanking you,
SUNIL THAKUR
ASSOCIATED PUMPS & VALVES
206, VARDHMAN, D- BLOCK CENTRAL MARKET,
PRASHANT VIHAR - DELHI- 110085
CELL : +91 9818642009, PHONE : 01127867035/01127550030, TELEFAX – 01127867035
ASSOCIATED
PUMPS & VALVES Authorised
Dealer
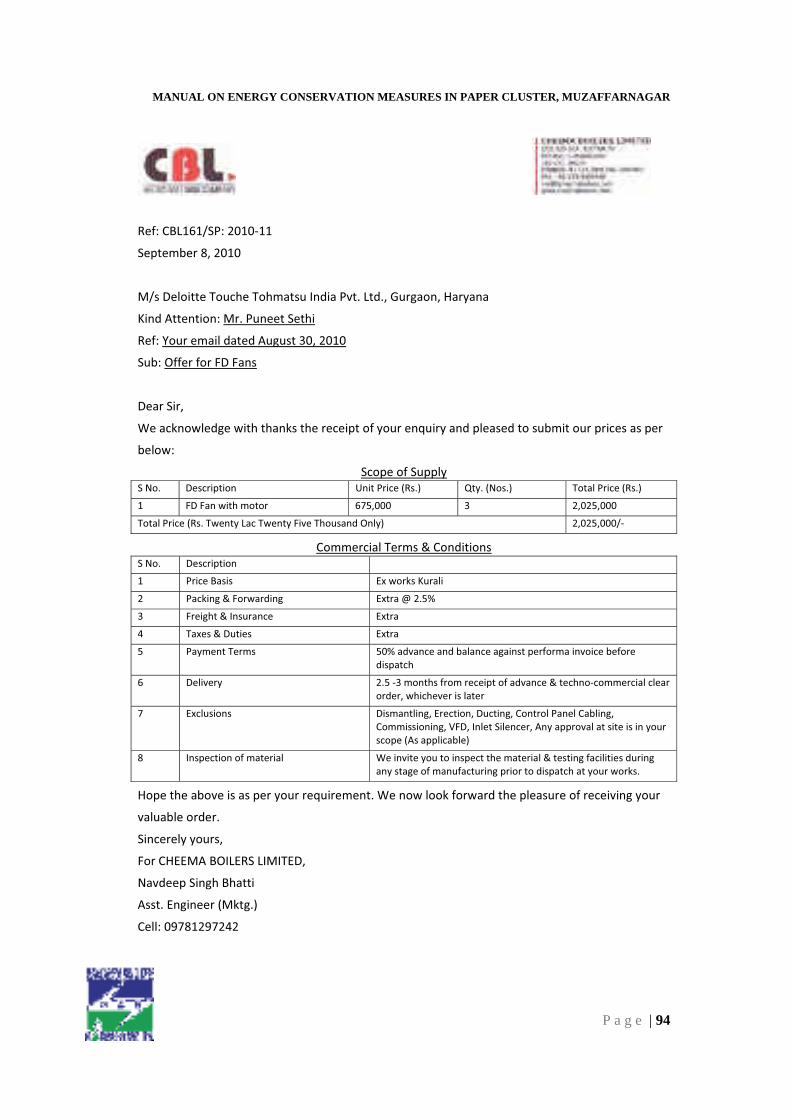
MANUAL ON ENERGY CONSERVATION MEASURES IN PAPER CLUSTER, MUZAFFARNAGAR
P a g e | 94
Ref: CBL161/SP: 2010-11
September 8, 2010
M/s Deloitte Touche Tohmatsu India Pvt. Ltd., Gurgaon, Haryana
Kind Attention: Mr. Puneet Sethi
Ref: Your email dated August 30, 2010
Sub: Offer for FD Fans
Dear Sir,
We acknowledge with thanks the receipt of your enquiry and pleased to submit our prices as per
below:
Scope of Supply
S No. Description Unit Price (Rs.) Qty. (Nos.) Total Price (Rs.)
1 FD Fan with motor 675,000 3 2,025,000
Total Price (Rs. Twenty Lac Twenty Five Thousand Only) 2,025,000/-
Commercial Terms & Conditions
S No. Description
1 Price Basis Ex works Kurali
2 Packing & Forwarding Extra @ 2.5%
3 Freight & Insurance Extra
4 Taxes & Duties Extra
5 Payment Terms 50% advance and balance against performa invoice before
dispatch
6 Delivery 2.5 -3 months from receipt of advance & techno-commercial clear
order, whichever is later
7 Exclusions Dismantling, Erection, Ducting, Control Panel Cabling,
Commissioning, VFD, Inlet Silencer, Any approval at site is in your
scope (As applicable)
8 Inspection of material We invite you to inspect the material & testing facilities during
any stage of manufacturing prior to dispatch at your works.
Hope the above is as per your requirement. We now look forward the pleasure of receiving your
valuable order.
Sincerely yours,
For CHEEMA BOILERS LIMITED,
Navdeep Singh Bhatti
Asst. Engineer (Mktg.)
Cell: 09781297242

MANUAL ON ENERGY CONSERVATION MEASURES IN PAPER CLUSTER, MUZAFFARNAGAR
P a g e | 95
Ref: RKK/10-11/47
M/s Deloitte Touche Tohmatsu India Pvt. Ltd., Gurgaon
Kind Attn: Mr. Charu Gupta
Subject: SPIRAX MAKE CONDENSATE RECOVERY SYSTEM
Dear Sir,
As per discussion and Refer to mail on dated 1st
September 2010, please find attached techno-
commercial offer for steam operated condensate and flash steam recovery system along with the
system to capture heat from Digester Blow down flash steam. We take this opportunity to thank
you for the interest shown in our products which will help you to save energy in your plant, hence
increase productivity and reduce fuel bills.
If you require any clarifications, then do get in touch with us.
Warm Regards,
For Spirax Marshall Pvt Ltd.
Raman Kumar Khunger
9953325727
Registered Office: P B # 29, Mumbai-Pune Road, Kasarwadi, Pune 411 034, INDIA TEL: 91 (0) 20-27145595 DID: 91 (0) 20-27149012 FAX: 91 (0) 20-27147413 URL: http:\\www.forbesmarshall.com

MANUAL ON ENERGY CONSERVATION MEASURES IN PAPER CLUSTER, MUZAFFARNAGAR
P a g e | 96
Techno-Commercial Offer
S No. ITEM Total Price (Rs.)
1 CONDENSATE RECOVERY SYSTEM
Pressure Powered Pump Package Unit
With insulation jacket and CRM
640,000/-
2 Flash Vessel FV 8 with all accessories to return flash
steam to Feed Water Tank (like IJ , FT , SG , SV and
Gauge etc.)
120,000/-
3 De – Aerator Head Size 200 NB 120,000/-
4 Digester Flash stem heat recovery system (By pass
system & plate heat exchanger)
1,780,000/-
Terms & Conditions
Prices : Ex- Works Pune, taxes and duties extra.
Terms : 30% advance balance 70 % Against Performa Invoice.
CED : Extra as applicable at the time of dispatch (Presently 10.3%)
CST : 2% against form “C”.
Delivery : 3 – 4 Weeks from date of receipt clear techno-commercial
P.O., Advance and road Permit.
Validity : 30 days
P & F : 2.5%
MANUAL ON ENERGY CONSERVATION MEASURES IN PAPER CLUSTER, MUZAFFARNAGAR
P a g e | 97
Annexure 5
Financial schemes available for improving energy efficiency in
cluster
1. Credit linked capital Subsidy scheme(CLCSS)
Under this scheme, the ministry of MSME is providing subsidy to upgrade technology
(Machinery/plant equipments). Subsidy limit per unit is Rs. 15 lakh or 15% of investment
in eligible machinery/Plant equipments whichever is lower. For more details of the
scheme visit:
www.laghu-udyog.com/scheme/sccredit.htm
2. SIDBI Financing Scheme for Energy Saving Projects in MSME sector under JICA
Line of Credit
The Japan International Corporation Agency (JICA) has extended a line of credit to SIDBI
for financing Energy Saving projects in Micro, Small and Medium Enterprises (MSMEs).
This project is expected to encourage MSME units to undertake energy saving investment
in plant and machinery to reduce energy consumption, enhance energy efficiency, reduce
CO2 emissions, and improve the profitability of units in the long run.
Eligible Sub Projects/ Energy Saving Equipment List under JICA line of Credit:
� Acquisition (including lease and rental) of energy saving equipments, including newly
installing, remodeling and upgrading of those existing
� Replacement of obsolete equipments and/or introduction of additional equipment
which would improve performance
� Equipments/ Machinery that meets energy performance standards/Acts
� Introduction of equipments that utilize alternative energy sources such as natural gas,
renewable energy etc., instead of fossil fuels such as Oil and Coal etc.
� Clean Development Mechanism (CDM) projects at cluster level that involves change
in process and technologies as a whole, duly supported by technical consultancy will
be eligible for coverage.
Financial parameters:
The financial parameters for appraising the project are:
MANUAL ON ENERGY CONSERVATION MEASURES IN PAPER CLUSTER, MUZAFFARNAGAR
P a g e | 98
Parameter Norms
Minimum Assistance Rs. 10 lakh
Minimum promoters
contribution
25% for existing units; 33% for new units
Interest rate The project expenditure eligible for coverage under the line will
carry a rate of interest rate of 9.5-10% p.a
Upfront fee Nonrefundable upfront fee of 1% of sanctioned loan plus
applicable service tax
Repayment period Need based. Normally the repayment period does not extend
beyond 7 years. However, a longer repayment period of more
than 7 years can be considered under the line if necessary
Eligibility criteria for units (Direct assistance):
� Existing units should have satisfactory track record of past performance and sound
financial position.
� Projects will be screened as per Energy Saving List, which is available in SIDBI
website.
� Units should have minimum investment grade rating of SIDBI.
� Projects which may result environmental impacts and negative social impacts are also
not eligible under this scheme.
For further details eligible energy saving equipments/machinery, projects can be financed
under this scheme and details of scheme, please contact the nearest SIDBI branch office
or refer to SIDBI website (www.sidbi.in)
3 . Scheme for Financing Energy Efficiency Projects
PURPOSE:
� Financing SMEs for acquisition of equipments, services and adopting measures for
enhancement of energy efficiency/conservation of energy.
ELIGIBILITY
� SME units financed by bank as also other units desirous of shifting their account to
Bank of Baroda.
LIMIT:
� Upto 75% of the total project cost, subject to maximum of Rs. 1/- crore. (Minimum
amount of loan Rs. 5/- Lakhs).
Project cost may include the following:

MANUAL ON ENERGY CONSERVATION MEASURES IN PAPER CLUSTER, MUZAFFARNAGAR
P a g e | 99
� Cost of acquisition/modification/renovation of equipment/software.
� Cost of alterations to existing machinery.
� Cost of structural / layout changes.
� Cost of energy audit/consultancy.
� Preparation of Detailed Project Report (DPR).
RATE OF INTEREST:
� Bank’s BPLR from time to time.
REPAYMENT :
� Maximum 5 years, including moratorium, if any.
SECURITY :
a. For Sole Banking Accounts :
Extension of first charge on all fixed assets.
b. For Consortium/Multiple Banking Accounts :
First charge on equipments acquired out of loan and collateral, if any, with the total
security coverage being not less than 1.25.
Grant from IREDA:
� IRDEA, at present, gives a grant of Rs. 25,000/- for projects costing Rs. 1/- crore or
below to meet partial cost of Energy Audit. This grant is available for the first 100
projects (SME Sectors only) approved by them.
