acidic soils in kenya: constraints and remedial...
TRANSCRIPT

1
Choice of fertilisers
KARI Technical Note No. 11 June 2002
Acidic soils in Kenya:
Constraints and remedial options
Technical Note Series
Kanyanjua, S.M., Ireri, L., Wambua, S. and Nandwa, S.M.

i
Choice of fertilisers
authored by Kanyanjua, S.M., Ireri, L. Wambua, S. and Nandwa, S.M., KARI-Kabete, P.O. Box 14733 Nairobi, Kenya ` science editing by J.O. Mugah copyediting by J. Ayemba production editing by M. Mwariri layout design by I. Kimani cover: Regions in Kenya with soils that are prone to acidification photographs by S. Kanyanjua Publications Unit KARI Headquarters P.O. Box 57811-00200 City Square, Nairobi, Kenya tel 254 02 4183301-20 fax 254 02 4183344 e-mail [email protected]

ii
Choice of fertilisers
Contents
Introduction .. .. .. .. .. .. .. 1
Crop tolerance to acidity .. .. .. .. .. .. 1
Research efforts and unresolved challenges .. .. .. 2
Development of acidity .. .. .. .. .. .. 5
Further research .. .. .. .. .. .. 5
Materials and methods .. .. .. .. .. .. 5
Soil samples .. .. .. .. .. .. 5
Fertiliser materials .. .. .. .. .. .. 6
Socioeconomic information .. .. .. .. .. 6
Glasshouse experiments .. .. .. .. 6
Results and discussions .. .. .. .. .. .. 7
Laboratory analytical data for MRP, agricultural lime and manure.. .. 11
Information from interview.. .. .. .. .. .. 12
Available options.. .. .. .. .. .. .. 12
Pot experiments.. .. .. .. .. .. .. 13
Dry matter yields .. .. .. .. .. 13
Results obtained, the status quo and recommendations.. .. .. 14
Dry matter yields of residual crop.. .. .. .. .. 16
Nutrient concentration in plant tissue.. .. .. .. .. 16
Change in nutrient concentration in soils after treatments and seasons.. 17
Conclusion .. .. .. .. .. .. .. 21
Acknowledgement.. .. .. .. .. .. .. 22
References.. .. .. .. .. .. .. .. 23

1
Choice of fertilisers
Introduction
Acidic soils are have less than 7.0 pH values and cover about 13% (7.5 million hectares) of agricultural land of Kenya. Areas covered by acidic soils contribute significantly to the Kenyan economy through cash crop and dairy production. In the traditional ecological zone map of Kenya, areas with acidic soils are referred to as 'tea–dairy', 'coffee–tea' and 'main coffee' climatic zones (Jaetzold and Schmidt, 1982). This reflects the high potential for cash cropping and dairy keeping. Most soils in the humid tropics are characteristically acidic (Kamprath, 1984).
Acidic soils can be identified when a soil sample is analysed in any soil laboratory. In soil laboratories within the Kenya Agricultural Research Institute (KARI), acidic soils are classified further according to severity of acidity (Table 1).
Crop tolerance to acidity
Different crops have various degrees of tolerance to acidity. Chillies, sweetpotatoes and irish potatoes are tolerant to acidity and can do well in soils with pH values below 5.5 (Plates 1 and 2). Most of the horticultural crops (onions, spinach, carrots, cabbages and cauliflower) do not tolerate acidity and can only grow well in soils with pH values above 6.0. Other crops like maize lie in the medium tolerance range and would do well in 5.5-6.0 pH values. Among the maize varieties, local cultivars like Githigu commonly found in central Kenya are adapted to the lower end of the tolerance range. Most of the flowers grown for export are sensitive to acidity. When crops are grown in soils with pH values below the lower limit, they give low yields and are of poor
Degree of acidity pH range
Extremely acidic <4.5
Strongly acidic 4.5-5.0
Moderately acidic 5.0-6.0
Slightly acidic 6.0-6.5
Near neutral 6.5-7.0
KARI–Kabete working manual
Table 1. Grading of levels of soil acidity at the KARI–Kabete

2
Choice of fertilisers
quality. This can only be improved by applying inputs including fertiliser, lime, composts and manure—which would require additional labour and costs.
Research efforts and unresolved challenges
In recognition of the problems of caused by soil acidity, KARI has undertaken research work to develop affordable and sustainable methods of improving acidic soils. The Fertiliser Use Recommendation
Plate 1. Irish potatoes thriving in acidic soils
Plate 2. Sweepotatoes thriving in acidic soils

3
Choice of fertilisers
Project (FURP) carried out trials between 1986 and 1991 and published area- and crop-specific fertiliser recommendations for various AEZ (KARI, 1994). These field trials were conducted in 65 locations in the high- and medium-potential areas (AEZ 1-4).
The trials covered 28 soil sub-orders and 14 crops. In some of the 65 FURP locations, results obtained after 5 years of experimentation could not be conclusively used to give fertiliser recommendations. Twenty-three sites (29%) where the trials failed had acidic soils with less than 5.5 pH values and would require to be amended if maize was to be grown profitably (Plates 3 and 4) (Table 2). Nitisols, Acrisols and Ferralsols are the most common acidic soils. At 3 sites—Kavutiri in Embu District, Chehe in
Plate 3. Maize crop neglected due to soil acidity
Plate 4. Bean plants with acid-related malformations

4
Choice of fertilisers
Table 3. FURP sites with pH values below 5.5
District Sites Elevation (m) AEZ pH r/Eo Soil type
Kisii Otamba
Kiamokama
NARS
1790
2020
1730
UM 1
LH 1
UM 1
5.25
4.63
4.75
0.92
0.98
1.18
Mollic Nitisols
Humic Nitisols
Mollic Nitisols
S. Nyanza Rongo 1440 LM 1 5.43 0.89 Humic Acrisols
Siaya Ukwala
Yala swamp
1200
1160
LM 2
LM 3
4.98
4.53
— Orthic Acrisols
Humic Gleysols
Busia Bukiri 1220 LM 3 5.38 0.80 Chromic Acrisols
Bungoma Kamokoiwa 1710 UM 2 4.93 1.02 Rhodic Ferralsols
Kakamega Mumias
WARS
Vihiga
1270
1520
1620
LM 1
UM 1
UM 1
4.25
5.35
5.22
0.94
1.09
1.03
Orthic Acrisols
Mollic Nitisols
Humic Nitisols
Kericho Sosiot 1890 UM 1 5.13 1.12 Mollic Nitisols
Uasin
Gishu
Moi TTC
Turbo
2140
1850
LH 3
UM 4
5.38
5.23
0.64
0.84
Ferralic Cambisols
Chromic Acrisols
K/Marakwet Bugar 2320 LH 2 5.27 0.88 Humic Nitisols
Baringo Ravine 2100 LH 3 5.45 0.88 Chromic Luvisols
Muranga Makuyu
Kareti
1430
1640
UM 4
UM 2
5.25
5.68
0.57
1.24
Dystric Nitisols
Humic Nitisols
Nyeri Muirungi
Chehe
2080
1920
LH 1
LH 1
5.0
4.6
1.18
1.32
Ando-humic
Nitisols
Embu Kavutiri
RRC
1700
1510
UM 1
UM 2
4.6
5.45
1.29
1.10
Ando-humic Nitsols
Humic Nitisols
Meru Kaguru
Tunyai
1460
880
UM 2
LM 4
5.36
5.43
1.12
0.57
Humic Nitisols
Rhodic Ferralsol
(FURP, 1988)
pH range No of sites1 (%)
<4.5
4.5-5.0
5.0-5.5
3
6
14
5
10
24
5.5-6.0
6.0-6.5
6.5-7.0
>7.0
15
15
2
3
26
26
4
5
Total 58 100
(FURP, 1987); 1—Data was obtained from 58 out of the 65 sites
Table 2. Distribution of FURP sites in the various pH ranges

5
Choice of fertilisers
Nyeri District and Mumias, formerly in Kakamega District, soils are extremely acidic. Location and other characteristics related to the sites with pH values below 5.5 are shown in Table 3.
Development of acidity
Soils developed on non-calcareous parent materials are inherently acidic. In humid regions soils become acidic naturally due to leaching of basic cations under high rainfall conditions. In addition, reclaimed swamps (peats) and soils fertilised with acidifying fertilisers can become acidic with time. Gleysols at Yala Swamp in the lake basin may be acidic due to peat in poorly drained conditions while most of the other areas are acidic due to leaching.
Further research
Due to the poor results obtained by FURP in the 1986-1991 field trials—and in recognition that no fertiliser recommendations were arrived at for many areas with acidic soils—laboratory and glasshouse studies with soil samples collected from Chehe (Nyeri District) in Central Province were carried out. This case study determined the most effective amendment option(s) for acidic soils that can be recommended to farmers. To achieve the purpose, 5 objectives were formulated thus—
▪ Determine the major soil fertility constraints in acidic soils with reference to
maize ▪ Identify and compare the available options for amending acidic soils
▪ Determine the lime requirement of acidic soils for growing maize
▪ Determine the soil chemical changes that occur when soils are amended in
various ways ▪ Develop and publish recommendations that can be adopted by farmers at
Chehe
Materials and methods
Soil samples
Soil samples were collected in November 1997 from 2 farms with different management histories for glasshouse studies. One field had been under pasture and had not received any fertilisers for many years while the other had been cropped for many years without applying chemical fertilisers. Samples were collected from a 2 x 2-m surface to a depth of 20 cm. In addition, composite soil samples were collected from plots that had been fertilised in various ways for fertility evaluation and

6
Choice of fertilisers
to compare results with samples intended for glasshouse studies. In the glasshouse, soil samples were spread evenly and air-dried for 2 weeks. Sub-samples were drawn for laboratory analysis and the rest was to form stock for various experiments.
Fertiliser materials
Farmyard manure (FYM) samples were collected from 2 heaps in farmers' fields at Chehe. All the fertiliser and amendment materials were bought from stockists in Nairobi. The materials were triple superphosphate (TSP), calcium ammonium nitrate (CAN), Mijingu rock phosphate (MRP) and 2 brands of lime; trade named agricultural lime and dolomite. Apart from TSP and CAN, all the other materials were analysed in the laboratory to determine the nutrient composition.
Socioeconomic information
Information on crop production and methods currently used to correct soil acidity was gathered through person to person interview of the farmers from whose farms the soil samples were collected. The information was used to short-list the available options.
Glasshouse experiments
The following studies were designed to generate outputs that would meet the objectives highlighted in above.
Comparison of different options of amending acidic soils: Nitrogen as CAN was blanket applied at 100 kg N ha-1 and P levels varied at 0, 22, 44, 66, 88 and 132 kg ha-1. Four different forms of P application were compared—
▪ TSP (20% total P)
▪ MRP (13% total P)
▪ TSP + agricultural lime at 4 t ha-1
▪ TSP+ FYM at 5 t ha-1
The air-dry soil was weighed into 48 pots which can hold a maximum of 4-kg of soil each. The pots were then arranged in a 2-factor randomised complete block design of 2 replications (one replicate for each of the 2 farms) (Plate 5). Three maize seeds were sown after mixing all the treatments with the soil and thinned to 2 after emergence. The crop was watered continuously to field capacity—water holding at field capacity determined by saturating a weighed amount of air dry soil with water and

7
Choice of fertilisers
allowing it to drain overnight from a funnel with 200 mm filter paper—for 10 weeks when above ground biomass was harvested. Shoot harvest was
then dried in the oven at 70 °C for 72 h, weighed and expressed as dry matter (DM) weight (g per pot). A residual crop was grown after collecting soil samples from each pot for laboratory analysis to determine chemical changes after application of treatments. Data collection for the residual crop was done as in the main crop and soil analysis in pots repeated after the 2nd crop. In each of the DM harvests, nutrient concentration in tissues was determined by the wet digestion method with H2SO4- Salicyclic- H2O2 (Okalebo et al., 1993).
Lime requirement studies: Air-dry soil was weighed into pots that can hold up to 4 kg of soil each and fertilised with 100 kg ha-1 of N from CAN and 44 kg P from TSP. Agricultural lime was added at 0, 2, 4, 6, 8, 10, 14, 16 and 20 t ha-1. The pots were arranged in 3 blocks (3 replicates) and treated equally (Plate 6). After thorough mixing, maize crop was planted and data collected explained above.
Results and discussions
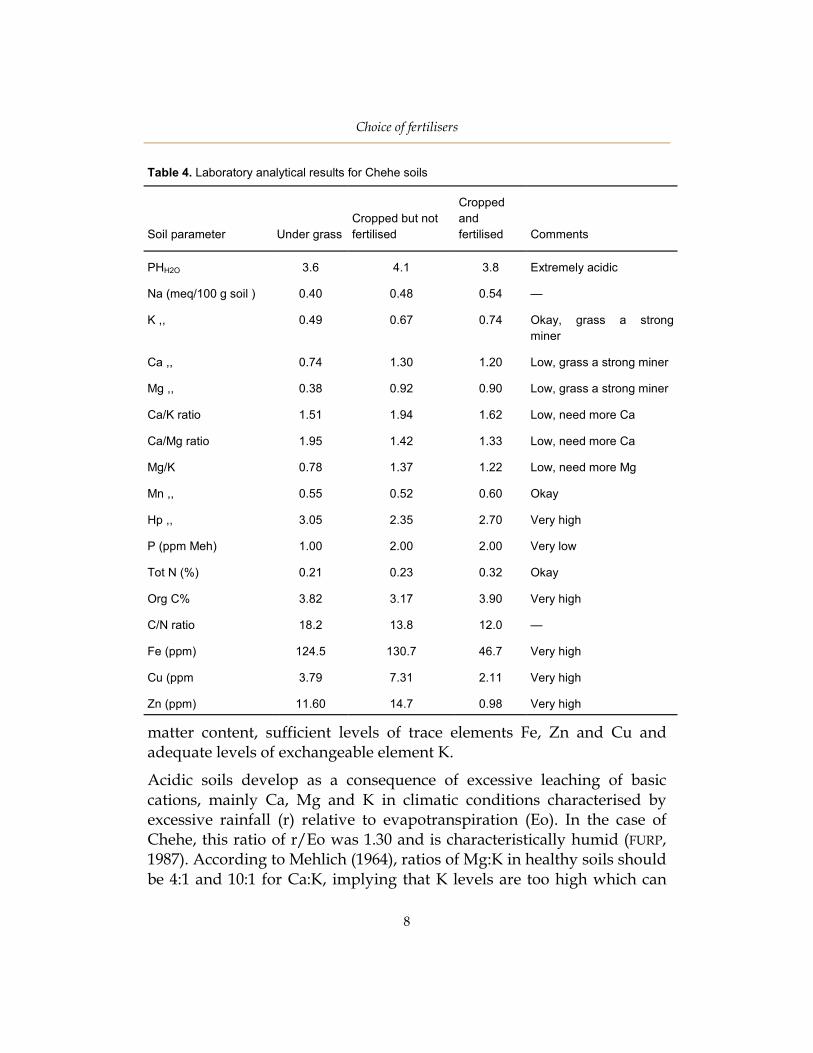
Laboratory analytical results for soils sampled from 3 differently managed plots are shown in Table 4. Soils from Chehe were extremely acidic, had high exchangeable acidity, low amounts of exchangeable cations Ca and Mg, and low extractable P. The soils had high organic
Plate 5. Greenhouse experimental set-up at KARI-Kabete
8
Choice of fertilisers
matter content, sufficient levels of trace elements Fe, Zn and Cu and adequate levels of exchangeable element K.
Acidic soils develop as a consequence of excessive leaching of basic cations, mainly Ca, Mg and K in climatic conditions characterised by excessive rainfall (r) relative to evapotranspiration (Eo). In the case of Chehe, this ratio of r/Eo was 1.30 and is characteristically humid (FURP, 1987). According to Mehlich (1964), ratios of Mg:K in healthy soils should be 4:1 and 10:1 for Ca:K, implying that K levels are too high which can
Soil parameter
Under grass
Cropped but not
fertilised
Cropped
and
fertilised
Comments
PHH2O 3.6 4.1 3.8 Extremely acidic
Na (meq/100 g soil ) 0.40 0.48 0.54 —
K ,, 0.49 0.67 0.74 Okay, grass a strong
miner
Ca ,, 0.74 1.30 1.20 Low, grass a strong miner
Mg ,, 0.38 0.92 0.90 Low, grass a strong miner
Ca/K ratio 1.51 1.94 1.62 Low, need more Ca
Ca/Mg ratio 1.95 1.42 1.33 Low, need more Ca
Mg/K 0.78 1.37 1.22 Low, need more Mg
Mn ,, 0.55 0.52 0.60 Okay
Hp ,, 3.05 2.35 2.70 Very high
P (ppm Meh) 1.00 2.00 2.00 Very low
Tot N (%) 0.21 0.23 0.32 Okay
Org C% 3.82 3.17 3.90 Very high
C/N ratio 18.2 13.8 12.0 —
Fe (ppm) 124.5 130.7 46.7 Very high
Cu (ppm 3.79 7.31 2.11 Very high
Zn (ppm) 11.60 14.7 0.98 Very high
Table 4. Laboratory analytical results for Chehe soils

9
Choice of fertilisers
cause Ca and Mg deficiency (Haby et al., 1990). Deficiencies, particularly of Mg are widely reported and has resulted in such ailments as grass tetany (hypomagnesaemia) in ruminant animals feeding on grass with K induced Mg deficiency (Haby et al., 1990).
In low pH conditions, there is usually high concentration of Al3+ in the soil solution. Al3+ binds with orthophosphate ions (H2PO4-, HPO4-2) and forms insoluble compounds resulting in low levels of extractable P. Excessive Al3+ concentrations cause low yields of non-acidic tolerant crops (Pearce and Sumner (1997), Evans and Kamprath, (1970). Besides the depressed P availability (P-fixation), high Al3+ concentrations are toxic to non-tolerant crops where it particularly affects the development of the root system that lowers the uptake of water and plant nutrients. Marschner (1990) reports that in pH values <4.0, the carrier system of K uptake is impaired resulting in loss of K from the roots (efflux) that is higher than influx.
Many soil advisory laboratories only determine the Total Exchangeable Acidity (TEA), also expressed as Hp which for soil samples analysed from Chehe (FURP, 1987) are related to the exchangeable Al (Fig. 1). Besides Al, TEA also incorporates H+ ions originating particularly from organic acids derived from soil organic matter. Al takes a bigger share of TEA as TEA increases in soils (Table 5).
High organic matter lowers the amount of exchangeable Al in soil solution. Exchangeable Al3+ complexes with organic acids that result
Fig. 1. Relationship between exch. Al and Hp

10
Choice of fertilisers
from mineralisation of organic matter thus lowering concentration of exchangeable Al3+ in soil solution. In addition, organic ligands complex with trace elements and improve on their availability. This may explain the high levels of Fe, Cu, Zn and Mn in the soils (Table 4). Accumulation of soil organic matter (SOM) is possibly due to low rates of mineralisation resulting from inactivity of the micro- organisms necessary for mineralisation due to either low pH or low temperatures in AEZ LH1 (Table 3).
Management influences the nutrient composition of soils in various ways. Soils under grass are more acidic, have high Fe, Hp and organic C%. On the other hand, they are low in K, Ca, Mg, P and N. This data suggests a higher rate of nutrient uptake under grass due to the continuous removal of biomass through grazing. Fertilisation with inorganic, organic or both types of fertilisers increases the level of K, P, N and organic C% but results in reduced levels of trace elements Fe, Cu and Zn. Trace elements are not routinely applied in food crops and high yields may result in excessive mining and deficiency. Non- fertilised soils have high Ca, Mg, P, Fe, Cu and Zn, possibly because they produce less, resulting in less mining of nutrients.
Sample numbers H + Al KCl (meq/100g) Al KCl (meq/100g) Al (%)
A 0.40 0.20 50.0
B 0.48 0.20 41.7
E 1.40 0.96 68.6
F 2.30 1.78 77.4
C 2.44 1.90 77.9
D 3.52 2.96 84.1
G 4.46 3.58 80.3
H 4.48 3.86 86.2
(FURP, 1987)
Table 5. Proportion of exchangeable Al in total exchangeable acidity for soils from Chehe

11
Choice of fertilisers
Laboratory analytical data for MRP, agricultural lime and manure
Table 6 shows the analytical results for MRP, dolomite and agricultural lime. In Kenya, there is no standard for liming materials and farmers would go for ground chalk or limestone from deposits close to their locality. In the UK, it is a legal requirement to state the CaO or CaCO3 content in lime and the granular size (Simson, 1986). Dolomite refers to a magnesian limestone with at least 3% Mg (5% MgO). The pure dolomite has a formula CaCO3.MgCO3 which contains by weight 54.3% CaCO3 (30% CaO) and 45.7% MgCO3 (22.5% MgO). The materials available in Nairobi were rich in CaO but slightly poor in MgO to qualify for pure
Material description Total nutrient content (%)
CaO MgO P2O5
MRP 28.4 2.1 28.3
Dolomite 47.5 18.5 —
Agric. lime 38.4 19.2 —
Table 6. Laboratory analytical results for MRP, dolomite and agricultural lime
Fertility index Farmer 1 Farmer 2 Mean Content (kg ha-1 from 5 t of FYM)
pH 7.9 8.1 7.9 —
Tot N (%) 1.81 2.29 2.0 90
Org C (%) 3.44 6.50 5.0 —
C/N ratio 1.90 2.80 2.3 -
P (%) 0.10 0.15 0.12 6
K (%) 0.93 0.90 0.91 40
Ca (%) 0.07 0.10 0.08 4
Mg (%) 0.13 0.17 0.18 7
Fe (%) 5.4 5.43 5.41 240
Mn (%) 0.15 0.15 0.15 7
Zn (%) 0.05 0.06 0.05 2
Na (%) 1.15 1.05 1.10 50
Table 7. Laboratory analytical report for manure from Chehe

12
Choice of fertilisers
dolomite. Both however qualify for magnesian limestones (MgO > 5%). Since both Ca and Mg are deficient in Chehe soils, either of the materials can be used as an ameliorant but agricultural lime was used in the experiment because it is readily associated with agriculture.
Table 7 shows the analytical results for manure samples from Chehe. The manure was of high quality and easily mineralisable due to low C/N ratio. Alkalinity in manure is desirable in neutralising the exchangeable acidity in soils. Assuming 10% moisture content in air dry manure, 5 t of the manure will give 4.5 t DM, 90 kg total N, 6 kg P and 40 kg K ha-1. The manure is a good source of N and K but a poor source of P. The nutrient release profile for the manure was not determined.
Information from interview
Farmers at Chehe applied large quantities of phosphatic fertilisers but the benefits realised were low. Only soluble forms of P were being used, with diammonium phosphate (DAP) being the most common planting fertiliser. Other varieties of mixed fertilisers of N:P2O:K2O grades including 20:20:0, 17:17:17 were widely used. Farmers also used the fertiliser 25:5:5 + 5S to topdress. Though not consciously, FYM was widely used to ameliorate the acidic soils.
Available options
From literature and other sources, soil acidity can be effectively neutralised by either liming or application of FYM. Calcium and Mg can be sourced from dolomitic limestones while P can be sourced from readily soluble sources (including superphosphates) or slowly soluble forms (including rock phosphates). Farmers had tried different combinations of inputs to improve the soils that led to the comparing of 4 options in this experiment. The options are—
▪ Application of high rates of soluble phosphate including TSP
▪ Application of a soluble P mixed with lime at planting
▪ Application of a soluble P mixed with FYM at planting
▪ Application of a less soluble P including MRP
Since P appeared in all the options, different rates of P in TSP and MRP were applied
13
Choice of fertilisers
Pot experiments
Dry matter yields
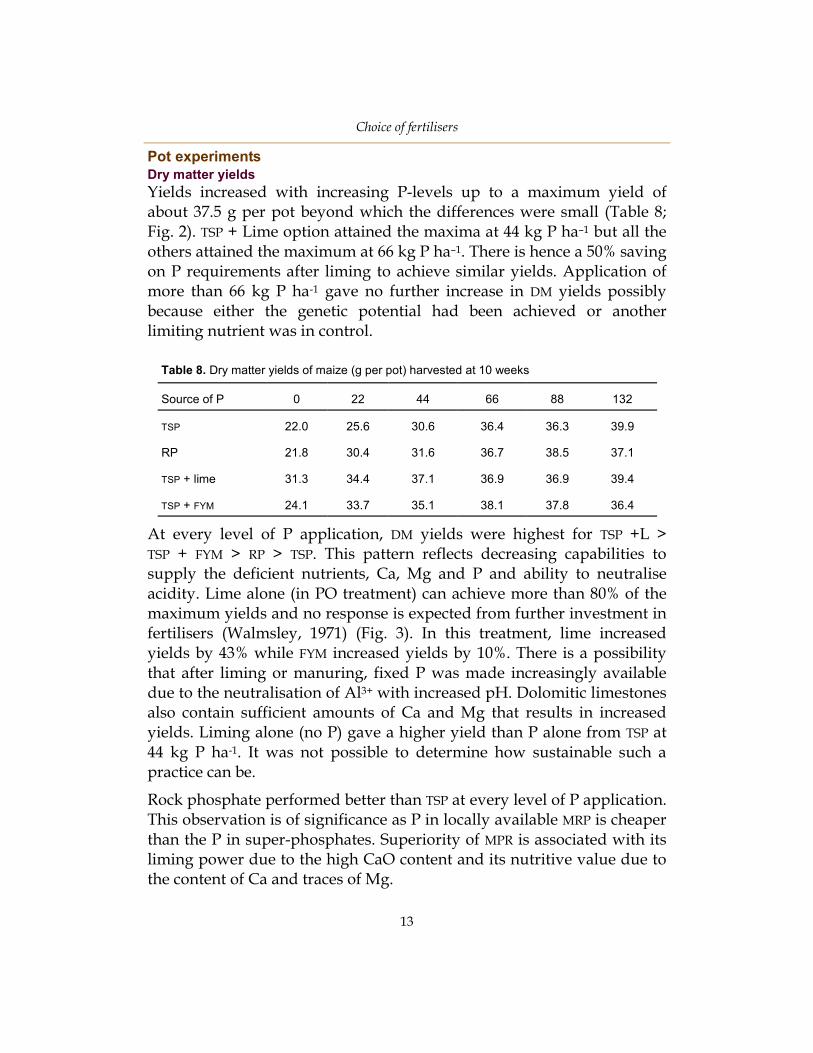
Yields increased with increasing P-levels up to a maximum yield of about 37.5 g per pot beyond which the differences were small (Table 8; Fig. 2). TSP + Lime option attained the maxima at 44 kg P ha–1 but all the others attained the maximum at 66 kg P ha–1. There is hence a 50% saving on P requirements after liming to achieve similar yields. Application of more than 66 kg P ha-1 gave no further increase in DM yields possibly because either the genetic potential had been achieved or another limiting nutrient was in control.
At every level of P application, DM yields were highest for TSP +L > TSP + FYM > RP > TSP. This pattern reflects decreasing capabilities to supply the deficient nutrients, Ca, Mg and P and ability to neutralise acidity. Lime alone (in PO treatment) can achieve more than 80% of the maximum yields and no response is expected from further investment in fertilisers (Walmsley, 1971) (Fig. 3). In this treatment, lime increased yields by 43% while FYM increased yields by 10%. There is a possibility that after liming or manuring, fixed P was made increasingly available due to the neutralisation of Al3+ with increased pH. Dolomitic limestones also contain sufficient amounts of Ca and Mg that results in increased yields. Liming alone (no P) gave a higher yield than P alone from TSP at 44 kg P ha-1. It was not possible to determine how sustainable such a practice can be.
Rock phosphate performed better than TSP at every level of P application. This observation is of significance as P in locally available MRP is cheaper than the P in super-phosphates. Superiority of MPR is associated with its liming power due to the high CaO content and its nutritive value due to the content of Ca and traces of Mg.
Source of P 0 22 44 66 88 132
TSP 22.0 25.6 30.6 36.4 36.3 39.9
RP 21.8 30.4 31.6 36.7 38.5 37.1
TSP + lime 31.3 34.4 37.1 36.9 36.9 39.4
TSP + FYM 24.1 33.7 35.1 38.1 37.8 36.4
Table 8. Dry matter yields of maize (g per pot) harvested at 10 weeks

14
Choice of fertilisers
Choice of what option to adopt will depend on many factors including crop response to application, purchase and transportation costs, availability of input in local market, environmental friendliness and the residual effects. Informal discussions with local marketing agents pointed to the fact that it is not cost-effective to transport lime and sell it at the current rate of KES 180 for a 50-kg bag. This may require intervention from government to have lime made available at highly subsidised rates as happened in the UK after the 2nd world war (Simpson, 1986). Marketing of MRP, the only slowly soluble P source in the market is not well established and farmers may not be able to get the material in their locality. Manure is also too bulky, variable in quality and sometimes very scarce at farm level.
Results obtained, the status quo and recommendations
Farmers from Chehe plant maize with compound fertiliser 20:20:0 at a P application rate of 35 kg ha-1 and topdress with either CAN or fertiliser 25:5:5 + 5S intended for tea. From the tea fertiliser, an extra 9 kg is topdressed to make up to a total of 44 kg P ha-1. From the results in this experiment (Figs. 2 and 3), the same yield level can be achieved by applying half the P rate (22 kg ha–1) but in form of MPR. Higher yields can be realised if the farmers apply lime only at 4 t ha-1 or better still, half the
Fig. 2. Change in maize yields with increasing P levels

15
Choice of fertilisers
current rate of P in form of super-phosphates but mix with either 5 t ha–1 of FYM or 4 t ha–1 of agricultural lime. It is difficult to make a prescription at this point due to the limitations highlighted earlier that are associated with each of the options. Forty-four kilogrammes of P ha-1 in TSP has a market value of KES 6 160 (USD 80) when compared to an equivalent amount from MRP that would cost KES 2 700 (USD 36), yet the yields realised are not significantly different.
Fig. 3. Variation of relative* DM yields for maize with treatments
* Relative yields = maximum DM yields (37.5 g)/treatment yields
0
5
10
15
20
25
0 22 44 66 88 132
TSP
RP
TSP + L
TSP + FYM
Fig. 4. Variation of DM yields with increasing P levels on residual crop

16
Choice of fertilisers
Dry matter yields of residual crop
Dry-matter yield data for the residual crop is shown in Figure 4. Apart from TSP, where DM yields increased with increasing P rates applied in season 1 by 70% (from 12.3-21.0 g per pot), other treatments in season 1 did not affect the residual crop significantly. Although TSP performed worst in season 1, the P fixed season one can be used in subsequent crops unlike other treatments where the residual effect is limited.
The overall mean DM yields were lower in season 2 than in season 1 by about 40% from 33.7-19.7 g per pot and a relative mean yield of 0.58. Drop in yield was possibly due to exhaustion of nutrients through uptake in initial crop. Residual yield correlated positively with initial yield and can be defined by the equation
Yr =-4.6 + 0.69 Yi, r2 = 0.79
indicating that where high yields had been obtained in the 1st season, the fertility status had been raised to a sustainable level. A unique case is that of limed and manured pots where effects of season 1 were completely suppressed. Thus, in every level of P application, losses through uptake balanced out with gains through fertilisers. The soil is hence well buffered as far as nutrients are concerned
Nutrient concentration in plant tissue
When the DM was analysed for nutrient content, concentrations were correlated with P levels and application forms. Nitrogen content in plant tissues varied from 0.89%-1.33% and a mean of 1.08%. Concentration declined exponentially with increasing P rates and DM yields, with a regression equation of the type
N = 1.2497e- 0.0026 P and r2 = 0.808
Mean N levels for the various P-sources were not significantly different. Considering that N was not a limiting factor in the soil, the low N concentration at high DM yields can be attributed to a reduced uptake efficiency due to a 2nd limiting nutrient. There are also possibilities of a luxurious N uptake in cases of low biomass yields as happens when N fertiliser is applied in excessive rates.
Phosphate concentration in the tissues averaged 0.09% and did not vary significantly with increasing P levels or DM yields. It can be assumed that P availability was not limited under the circumstances and a constant
17
Choice of fertilisers
proportion of P to DM was maintained. Potassium levels were 2.09-2.51% and a mean value of 2.19% DM. Concentration correlated negatively with P levels and DM yields with a correlation equation
K = 2.3753-0.0032 P, r2 = 0.683
Since K was not applied as a fertiliser, concentration was lower from high yielding pots because of dilution with increased biomass. There is a possibility of K levels in the plant tissues affecting N use efficiency and the growth rate (Kemmler and Hobt, 1986). Nitrogen and K are the likely nutrients that limited maize growth at high P application levels. Potassium concentration did not vary with different P sources significantly. Other nutrients—Ca and Mg—did not vary significantly in plant tissues.
Change in nutrient concentration in soils after treatments and seasons
Soil samples were analysed after harvest and macronutrient concentrations compared with concentrations before treatments were applied. In all the treatments, pH and P values went progressively higher with seasons while all the other nutrients (except Mg in TSP + L treatment) went down (Fig. 5). The behaviour of P in the soil and soil test values obtained at the start of a season should be studied further. It appears that after prolonged drying of some of these soils, P is transformed into compounds that cannot be solubilised by the extracting solution (Mehlich 1) resulting in erroneous results. After wetting of the soil however, as happens after the 1st rains, P availability improves through solubilisation of the same compounds. This is also observed in the field where the early crop shows the characteristic purple colour due to deficiencies but which disappear with time even where no P fertiliser is applied. The rise in pH can be associated with changes in Ca++ and H2PO4- balance in soil solution. Solubilisation of P would mean that there is more H2PO4- relative to Ca++ because Ca++ has been leached or taken up by the crop (Fig. 5). By anion exchange, there is a net excess of OH- ions resulting in a rise in pH (Reeve and Sumner, 1970). Negative nutrient balances in 2 successive seasons irrespective of options employed shows that it takes time before the after-effects of acidification are corrected (Table 9). The superiority of lime and manure can be attributed to the improved status of exchangeable cations Ca, Mg and K (Table 10).

18
Choice of fertilisers
Fig. 5. Seasonal changes in pH and other nutrients with different treatments

19
Choice of fertilisers
Table 9. Sum of cations Ca + Mg + K in soils after 2 seasons
Treatments
Sum of cations (Ca + Mg + K) in meq/100 g soil
season 1 Before
TSP 2.25 1.67 1.24
RP 2.25 1.36 1.30
TSP + Lime 2.25 1.34 2.06
TSP + FYM 2.25 1.69 1.62
season 2
Lime levels (t ha–1) DM yields (g per pot) Soil pH Exch acidity (Hp)
0 18.1 4.6 1.7
2 27.5 4.6 1.9
4 35.5 4.6 1.9
6 34.8 4.7 2.1
8 34.3 5.1 1.6
10 36.5 5.2 1.5
14 33.4 5.1 1.4
16 34.9 5.3 1.0
20 38.2 5.1 1.0
Table 10. Effect of increasing levels of lime on maize DM yields, soil pH and exch. acidity
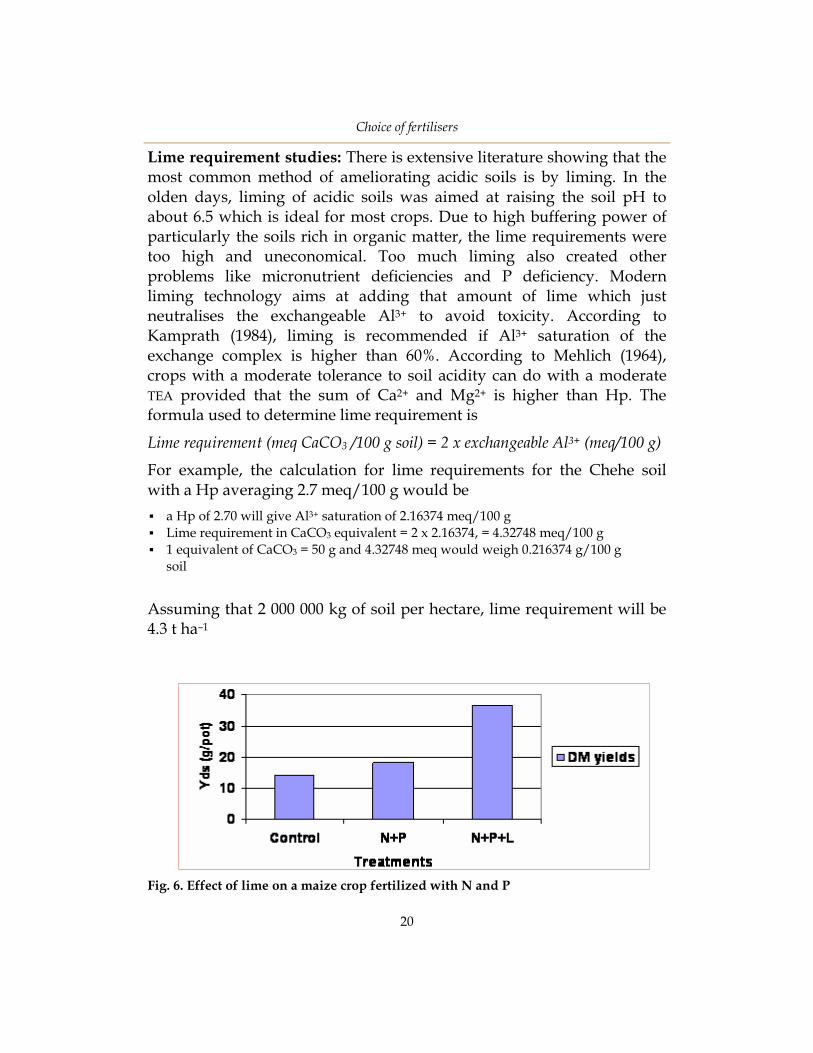
Plate 6. Maize response from lime and manure
20
Choice of fertilisers
Lime requirement studies: There is extensive literature showing that the most common method of ameliorating acidic soils is by liming. In the olden days, liming of acidic soils was aimed at raising the soil pH to about 6.5 which is ideal for most crops. Due to high buffering power of particularly the soils rich in organic matter, the lime requirements were too high and uneconomical. Too much liming also created other problems like micronutrient deficiencies and P deficiency. Modern liming technology aims at adding that amount of lime which just neutralises the exchangeable Al3+ to avoid toxicity. According to Kamprath (1984), liming is recommended if Al3+ saturation of the exchange complex is higher than 60%. According to Mehlich (1964), crops with a moderate tolerance to soil acidity can do with a moderate TEA provided that the sum of Ca2+ and Mg2+ is higher than Hp. The formula used to determine lime requirement is
Lime requirement (meq CaCO3 /100 g soil) = 2 x exchangeable Al3+ (meq/100 g)
For example, the calculation for lime requirements for the Chehe soil with a Hp averaging 2.7 meq/100 g would be
▪ a Hp of 2.70 will give Al3+ saturation of 2.16374 meq/100 g
▪ Lime requirement in CaCO3 equivalent = 2 x 2.16374, = 4.32748 meq/100 g
▪ 1 equivalent of CaCO3 = 50 g and 4.32748 meq would weigh 0.216374 g/100 g
soil
Assuming that 2 000 000 kg of soil per hectare, lime requirement will be 4.3 t ha–1
Fig. 6. Effect of lime on a maize crop fertilized with N and P

21
Choice of fertilisers
A 2nd method of determining lime requirement is by applying increasing rates of lime to a given quantity of soil and selecting the level that gives highest yield. Change in DM yields with increasing levels of lime is
shown in Table 10 and figures 6 and 7. Application of 100 kg of each N and P2O5 ha-1 increased DM yields by 28% from 14.04-18.07 g per pot (Fig. 6). Liming increased DM yields further to a maximum of about 37.5 g per pot at a liming rate of 4 t ha-1 (Fig. 6). Dry matter yields were positively correlated to the levels of lime (r2 = 0.74). Liming resulted in rise of pH of the soils from 4.4-5.3 and reduced exchangeable acidity that went down to 1.0 cmol kg-1 (Fig. 7).
Conclusions
These findings agree with reports from Reeve and Sumner (1970) that acidic soils have a low pH, low P, low base status, high P fixation and Al toxicity. The outputs expected from this greenhouse work were met to a large extent. Most of the limitations were identified, 4 options of ameliorating them identified and compared and optional solutions found. It was not possible to prescribe any of the options because some have low chances of adoption due to external factors that are more socioeconomical than agronomic. There is a big opportunity for state
Liming levels (t ha–1)
Fig. 7. Effect on increasing levels of lime on maize yields, soil pH and exch. acidity

22
Choice of fertilisers
intervention so that lime is made easily accessible to farmers. Bulk buying by farmer groups will benefit from economies of scale where lime is ferried in trucks and shared out in the villages. Packaging of lime in 50-kg bags is unrealistic for a material applied in tonnes and where the market value of quantities packaged is lower than the bag and labour that go with it. In the meantime, KARI will strive to calibrate soils from different regions that have different buffer power and hence lime requirements. Composting and other technologies that can be used to produce alternatives to FYM to stem the trend of declining availability at farm level should be encouraged. The current practice of using superphosphates at planting is both expensive and inefficient. At all levels of P application, MPR performed better than the TSP due to its high CaO content which limes and supplies needed Ca to the soil. Sourcing P from MPR reduced the P requirement from 44-22 kg ha-1, yet the cost of P in MPR is cheaper than the same P in TSP by 60%. The results presented here should be tested on-farm using participatory Learning And Research (PLAR) (Plate 7).
Acknowledgement
The authors are grateful to the European Union, through the Co-ordination Unit at KARI HQ for the financial support during the research work. Special thanks go to the Centre Director KARI–Kabete for a
Plate 7. Farmers’ training during a field day

23
Choice of fertilisers
conducive research environment at the station, and to all the laboratory staff for generating reliable analytical data. The authors are also grateful to the casuals who worked at the glasshouse during the trial.
References [1] Evans, C.E. and Kamprath, E.J. (1970). Lime response as related to percent Al saturation,
solution Al, and organic matter content. Soil Sci. Soc. Am. Proc., 34, 893-896.
[2] Fertiliser Use recommendation project, FURP. (1987). Description of the first priority trial site in the various districts, 1-32.
[3] Fertiliser Use Recommendation Project, FURP. Phase 1 (1988). Methodology and inventory of existing information. Main report
[4] Haby, V.A., Russelle, M.P. and Skogley, E.O. (1990). Testing soils for potassium, calcium and magnessium. In: Soil Testing and Plant analysis, 3rd ed. SSSA Book series, No. 3.
[5] Jaetzold, R. and Schmidt, H. (1982). Farm management handbook of Kenya. 1-3.
[6] Kamprath Eugene, J. (1984). Crop response to lime on soils in the tropics. Department of Soil Science, North Carolina State University. In: ASA-CSSA-SSSA, Soil Acidity and Liming. Agronomy Monograph No. 12 (2nd ed).
[7] Kanyanjua, S.M. (1988). Amendment of acid soils from central Kenya. Internal reports for the SFPNRP, NARL–Kabete.
[8] Kemmler, G. and Hobt, H. (1986). Potash: A product of nature. Kali und Salz AG, Kassel, Germany.
[9] Kenya Agricultural Research Laboratories, KARI. (1994). Fertiliser Use Recommendations for the various districts (1-24).
[10] Marschner, H. (1990). Mineral nutrition of higher plants. Academic press. London.
[11] Mehlich, A., Bellis, E. and Gitau, J.K. (1964). Fertilising and liming in relation to soil chemical properties. Scott laboratories. 339933399 Department of Agriculture, Kenya.
[12] Okalebo, J.R., Gathua, K.W. and Woomer, P.L. (1993). Laboratory methods of soil and Plant analysis. A working manual. TSBF, Nairobi, Kenya.
[13] Pearce, R.C. and Sumner, M.E. (1997). Apparent salt sorption reactions in unfertilised acid sub-soil. Soil Sci. Soc. Am. J. 61, 765-772.
[14] Reeve, N.G. and Sumner, M.E. (1970). Lime requirements of Natal Oxisols based on exchangeable Aluminium. Soil Sci Soc. Am. Proc. 34, 595-598.
[15] Simson, K. (1986). Fertilisers and manures. Longman, London and New York.

24
Choice of fertilisers
The KARI Technical Note Series provides an outlet for technical work generated by KARI that has not been published in any of the Institute's existing publications that include the East African Agricultural and Forestry Journal and the KARI annual report. The articles may be on completed or ongoing work. The Series carries advisory technical information intended to benefit various stakeholders on research findings generated by the Institute. Contribution to the Series is limited to KARI staff and collaborators. Manuscripts should be submitted to the director KARI.
Other Notes in this series
▪ Integrated helminth control (2)
▪ Water hyacinth: distribution, impact and control measures (3)
▪ Development of sustainable seed potato programme in Kenya (7)
▪ Improved management of indigenous chicken (8)
▪ Legume seed production in western Kenya (9)
▪ Biogas production (10)
▪ Acidic soils in Kenya: constraints and remedial options (11)
▪ Legume cover crops research in Kenya (12)
▪ Development of gladioli and lilies for local and export markets (15)
▪ Water harvesting technologies in Kenya (16)
▪ Indigenous chicken production manual (17)
www.kari.org