acdc special studies report 2009 table of...
TRANSCRIPT

Table of Contents
Page i
Acute Communicable Disease Control 2009 Special Studies Report
ACDC SPECIAL STUDIES REPORT 2009
TABLE OF CONTENTS Disease Trends/Summaries: Botulism Case Report Summary, 2009 ......................................................................................................... 1 David Dassey, MD, MPH Healthcare Associated Infectious Diseases: Lidocaine Poisoning Resulting from Medication Dosing Error in Outpatient Clinic……………………...……3 Cyrus Rangan, MD; Stella Fogleman, RN, MSN/MPH; Clara Tyson, RN, BSN, PHN; Moon Kim, MD, MPH; Marita Santos, RN, MSN Nosocomial Hepatitis C: A Cryptic Source for a Cryptic Disease……………………………………………....7 Elizabeth Bancroft, MD, SM Outbreak of Joint Infections Associated with Magnetic Resonance Arthrograms Performed at an Outpatient Radiology Center ……………………………………………………………………………………………………11 Moon Kim, MD, MPH; Clara Tyson, RN, BSN, PHN Infectious Disease Incidents/Clusters/Outbreaks: A Multi-State Vibriosis Outbreak Linked to Oysters Harvested from British Columbia …..………………….17 Soodtida Tangpraphaphorn, MPH Foodborne Illness Due to Inadvertent Ingestion of Marijuana ................................................................... .21 Stella Fogleman, RN, MSN/MPH; Cyrus Rangan, MD; Justine Kennedy, MPH; Marita Santos, RN, MSN; Moon Kim, MD, MPH; Roshan Reporter, MD, MPH; Steven Teutsch, MD; Jonathan Fielding, MD; Dickson Diamond, MD Legionella Outbreak at a Fitness Center ................................................................................................... .23 Tanya M. Phares, DO, MPH; Dawn Terashita, MD, MPH; Juliet Bugante, RN, PHN; Ashley Peterson, MPH Pandemic Influenza/H1N1: A Hospital-Based Aggregate Reporting System for H1N1 Pandemic Influenza Surveillance In Los Angeles County, 2009 ..................................................................................................................... .27 Ramon Guevara, MPH, PhD Characterization of Hospitalized Pandemic H1N1 2009 Influenza Cases, Los Angeles County, April 24, 2009-August 3, 2009……………………………………………………………………………………...............33 Melissa Higdon, MPH; Ashley Peterson, MPH Pre-Symptomatic Healthcare Worker Transmission of Pandemic (H1N1) 2009 Influenza in Acute Care Settings, Los Angeles, California, 2009………………………………………………………………….………39 Patricia Marquez, MPH; Dawn Terashita, MD, MPH; L’Tanya English, RN, MPH Rapid Assessment of Public Knowledge and Attitudes about Live Attenuated Influenza Vaccine (LAIV) at Mass H1N1 Influenza Vaccination Clinics………………………………………………………………….……43 Caitlin Reed, MD, MPH; Amy Lightstone, MPh; Susie Baldwin, MD, MPH; David Dassey, MD, MPH; Laurene Mascola, MD, MPH Use of Syndromic Surveillance During the 2009-2010 Influenza Season in Los Angeles County ............ .49 Patricia Araki, MPH; Bessie Hwang, MD, MPH

Table of Contents Page ii
Acute Communicable Disease Control 2009 Special Studies Report
Public Health Practice: Knowledge, Attitude, and Perception Regarding Listeriosis Education among Comprehensive Perinatal Service Program (CPSP) Providers in Los Angeles County, 2009……………………………………………55 Alan Wu, MPH; Ben Techagaiciyawanis, MPH Building Relationships with Early Childhood Education Providers to Prevent Infectious Disease ………..61 Elaine Waldman, Laurie Chow, MA, MPH Vaccine Preventable Disease & Vaccination: Varicella Disease Incidence and Clinical Presentation after Introduction of the Two-Dose Varicella Vaccine Schedule…………………………………………………………………………………………………..67 Amanuel Hussien, MSc; Rachel Civen, MD, MPH

Botulism Case Report Summary, 2009
Page 1
Acute Communicable Disease Control 2009 Special Studies Report
BOTULISM CASE REPORT SUMMARY, 2009
David Dassey, MD, MPH
Only four suspected botulism cases were reported in 2009 and one was confirmed; this excludes infant botulism cases. The confirmed case was a male injection drug user with a recent history of both intravenous and subcutaneous injections of black tar heroin. Type A botulinum toxin was detected in a serum sample, confirming the diagnosis of wound botulism. He recovered after treatment with antitoxin. An elderly woman was hospitalized with symptoms and signs consistent with botulism. She gave a history of eating home-canned green beans shortly before symptom onset; her husband did not consume any home-canned products and remained well. Bivalent AB and monovalent E botulinum antitoxins were released by Public Health for treatment. The couple resided in a neighboring county where the suspected food items were stored, therefore a joint investigation was conducted. Clinical specimens of serum, stool and gastric contents were tested by culture and toxin screen but failed to yield any positive results. Two samples of green beans were likewise tested by culture and toxin screening; all tests were negative. The case was closed as false for lack of laboratory confirmation. Remaining home-canned products were ordered destroyed as a precaution. A middle age woman was admitted to a hospital with progressive motor paralysis suggestive of botulism and on the seventh hospital day the hospital laboratory contacted the Los Angeles County Public Health Laboratory for guidance in submitting botulism diagnostic specimens. Acute Communicable Disease Control Program contacted the treating physician and infectious disease consultant; because the patient had been stabile neurologically for several days, botulinum antitoxin was withheld. Treatment with intravenous immune globulin was started and she responded clinically, making the diagnosis of Guillain-Barré syndrome. No clinical specimens were submitted, but a sample of home-made garlic oil was culture negative for Clostridium bacteria. The case was closed a false. A young woman with a history of recent cosmetic surgery to the scalp presented with headache and a bizarre set of neurological findings including multiple cranial nerve palsies (bilateral facial paralysis, double vision, ptosis, weak neck muscles), nystagmus, and “lock jaw.” There were paresthesias in both lower extremities. There was no sign of infection; cerebrospinal fluid examination and imaging studies of the head were unremarkable. The case was discussed with experts at the California Department of Public Health and the Centers for Disease Control and Prevention, and trivalent ABE antitoxin was administered. By the following morning, the patient had completely recovered from all neurological deficits, ruling out botulism. Cultures of stool and gastric contents were negative for Clostridium and serum was negative for botulinum toxin. The final diagnosis remained unknown. The California Infant Botulism Program reported five confirmed Los Angeles County cases of infant botulism in infants ranging from two weeks to six months of age. Five were male; three were Hispanic white, one was Asian and one was black. There were two cases with type A intoxication and two cases with type B. The fifth case demonstrated the unusual finding of both types A and B toxigenic organisms in the stool.

Botulism Case Report Summary, 2009 Page 2
Acute Communicable Disease Control 2009 Special Studies Report

Lidocaine Poisoning from Medication Error
Page 3
Acute Communicable Disease Control 2009 Special Studies Report
LIDOCAINE POISONING RESULTING FROM MEDICATION DOSING ERROR IN OUTPATIENT CLINIC
Cyrus Rangan, MD; Stella Fogleman RN, MSN/MPH; Clara Tyson, RN, BSN, PHN;
Moon Kim, MD; Marita Santos, RN, MSN
BACKGROUND The Los Angeles County (LAC) Department of Public Health (DPH), Acute Communicable Disease Control Program (ACDC) was notified by an emergency department (ED) physician at a local hospital of a cluster of two patients seen at two EDs on the same day, within a relatively short time frame. Each patient was transported to the ED after developing generalized tonic-clonic convulsions soon after conscious sedation and local anesthesia was administered for a therapeutic abortion (TAB) procedure at a local outpatient clinic. ACDC, LAC Health Facilities (HF) Inspection Division, and the U.S. Food and Drug Administration (FDA), conducted a joint site visit to the clinic the day following the incident. A meeting was held with the clinic medical director, physician, and administrative staff to determine the sequence of events leading to the patients’ convulsions, assess patient charts, review policies and procedures, observe medication preparation practices, and to recommend control and prevention measures. Subsequent site visits were made by ACDC and LAC DPH Toxics Epidemiology Program nurses to observe the medication preparation procedure for TAB and to conduct chart reviews of all patients who underwent TAB procedure on the same day as the incident. This report describes the collaborative investigation and the efforts of multidisciplinary agencies to identify the etiology of generalized convulsions occurring to patients undergoing local anesthesia at a local clinic, and to ensure that safety practices and procedures are implemented to prevent further incidents. METHODS ACDC conducted a joint site visit to the clinic with an evaluator from the HF Inspection Division and an inspector from the FDA. Interviews were completed with the clinic medical director, clinic physician, and clinic manager to assess procedures performed in the clinic and to elicit the sequence of events leading to the patients’ (Patient 1 and 2) convulsions. Patient 1 and 2’s charts were reviewed. The investigative team toured the clinic to view TAB preparation/procedure rooms. The team inspected the medication storage and preparation rooms, as well as the locked controlled medication area and medication inventory records. Policies and procedures for TAB were reviewed, including those for surgical abortion, analgesia, and sedation services; standards of care for local anesthesia; emergency procedures; medication error management; pharmaceutical services; controlled substances; and scope of practice for nurse practitioner and nurse midwife. Open vials and unused pre-filled syringes with medications prepared for anesthesia administration left over that day were retrieved and collected for testing by the FDA. Interview of clinician and observation of practice for lidocaine preparation for TAB was observed. A line list was obtained of the 20 patients who underwent TAB on the same day and their medical records were reviewed. HF Inspection Division made several follow-up visits, including one with the State Pharmacy Consultant, to review medication policies and procedures, give recommendations, and enforce corrective actions as deemed necessary for continued surgical procedures. A blood sample from Patient 1 was analyzed for lidocaine. RESULTS During site visit #1, ACDC conducted a chart review of the two patients who developed convulsions shortly after receiving local anesthesia and conscious sedation. Patient 1 received intravenous bolus injections of fentanyl and propofol and four paracervical injections of lidocaine (40 mLs total) with vasopressin. These medications were in compliance with the clinic’s standard protocol for conscious sedation and local anesthesia for patients undergoing TAB procedure. Approximately one hour and fifteen minutes later, Patient 2 received similar injections of fentanyl and propofol, and lidocaine paracervical injections without vasopressin. Almost immediately after receiving the paracervical injections, each

Lidocaine Poisoning from Medication Error Page 4
Acute Communicable Disease Control 2009 Special Studies Report
patient developed nystagmus for less than five seconds, followed by generalized tonic-clonic convulsion and hypoxemia. Clinic medical staff provided Patients 1 and 2 with oxygen, respiratory support, and intravenous midazolam with resolution of convulsions, and each patient was transported to local EDs by emergency medical services for further evaluation. Both patients recovered with observation in the ED and did not require hospital admission. After Patient 2 was transported to the ED, the clinic staff discovered an opened vial of lidocaine 2% in the medication preparation area. The clinic staff concluded that Patients 1 and 2 most likely received 2% lidocaine inadvertently instead of the 0.5% concentration, exceeding the recommended dose. According to the clinic’s Standards of Care for Local Anesthesia, the lidocaine dose for local anesthesia is not to exceed 2 mg per pound or 4.5 mg/kg, with a maximum dose per hour of 550 mg. For most patients, this is achieved with 20-40 mLs of 0.5% lidocaine. If Patients 1 and 2 had received 40 mLs of lidocaine 2%, their doses were 800 mg (250 mg above the maximum recommended dose) or 14.5 mg/kg for Patient 1 and 9.2 mg/kg for Patient 2. ACDC contacted both local EDs to inquire about stored blood samples. Blood for Patient 1 was sent to a private laboratory and revealed a lidocaine level of 4.2 mcg/mL, drawn 88 minutes after the lidocaine injections. Based on a half-life of 1.5-2 hours and a volume of distribution of 1.1 L/kg for lidocaine1, pharmacological extrapolation corresponded to an estimated peak lidocaine level of 8-12 mcg/mL for Patient 11. The therapeutic peak range for lidocaine is 1.5-5.0 mcg/mL. Signs of toxicity for lidocaine may be seen with serum levels of 7.3-12.0 mcg/mL1. Stored blood samples were not available for Patient 2. The FDA confirmed 1.98-2.03% lidocaine concentrations in syringe residuals retrieved on the day after the incident, exceeding the expected concentration of 0.5%. The staffing pattern for the TAB on the day of the incident included one certified registered nurse practitioner (CRNP) who performed pre-operation assessments; one CRNP who prepared the lidocaine syringes in the morning for the procedures and also monitored the post-operation and recovery room; one certified registered nurse anesthetist (CRNA) who prepared and administered anesthesia; one physician who administered paracervical lidocaine injections (prepared by the CRNP at the beginning of the day) and performed the procedures; and one reproductive health assistant (RHA) who prepared the patients for TAB and assisted the physician and nurses. Remaining scheduled TAB procedures for that day were immediately cancelled in the clinic after Patient 2 exhibited the same reaction as Patient 1. All medications utilized to administer local anesthesia for TAB and all leftover medications pre-drawn into syringes for subsequent procedures were sequestered by the clinic. The sequestered medications included an empty 50 mL vial of lidocaine 0.5%, a few mLs in a 50 mL vial of lidocaine 2%, three 50 mL bottles of propofol 1% with approximately 5-30 mL of medication left in the bottles, three 2 mL syringes of fentanyl, an empty 1 mL vial of vasopressin, and five unlabelled syringes filled with a white substance (ranging from 2 to 12 mLs). There were some syringes filled with lidocaine, labeled “20cc lidocaine (0.5%),” and some labeled “20cc lidocaine (0.5%) w. 4U Vasopressin.” The FDA took samples of the medications listed above for analysis. The clinic kept the controlled substances (narcotics) in a locked cabinet with entry by authorized licensed staff only, and maintained inventory records for each drug count and use. Lidocaine was kept inside the laboratory in a locked cabinet without documentation or records. The clinic’s formulary did not include lidocaine 2%. The clinic’s inventory order sheet indicated that 25 vials of 50 mL lidocaine 2% were ordered, and the clinic’s inventory control data sheet indicated that 22 vials of 50 mL lidocaine 2% were in the clinic. During site visit #1, the clinic reported having returned the stock of lidocaine 2% to central supply; however, administration was unable to produce the tracking invoices to confirm such a transaction. ACDC and Toxics Epidemiology nurses reviewed the medical records of all patients who underwent TAB procedure with local anesthesia on the day of the incident. Twenty charts were reviewed for demographic information, medical history, treatments and medications administered, and vital signs. There were no specific risk factors identified that were unique to Patients 1 and 2 that may have contributed to the onset of tonic-clonic convulsions.

Lidocaine Poisoning from Medication Error
Page 5
Acute Communicable Disease Control 2009 Special Studies Report
During site visit #2 to the clinic, an ACDC nurse met with the CRNP to review their routine practice of local anesthesia preparation of lidocaine for TAB procedures. The CRNP typically prepares the medications alone over a one hour time span just prior to the clinic services opening. The CRNP regularly prepares four 12 mL syringes of lidocaine for each scheduled TAB procedure. The CRNP reported that on the day of the incident, a combined total of ninety-six 12 mL syringes of lidocaine and lidocaine with vasopressin were pre-filled and prepared using sterile technique in the morning. Ninety-six syringes are usually prepared on the days TABs are performed: 40 syringes of lidocaine only and 56 syringes of lidocaine with vasopressin. The 12 mL syringes are filled between 11–12 mL to allow for waste by the physician prior to direct insertion into the patient. The CRNP obtains twenty-four 50 mL vials of lidocaine from a locked cabinet and five 1 mL vials of vasopressin (20 U/mL). Ninety-six syringes are placed onto a sterile field. The CRNP adds 0.5 mL of vasopressin into a 50 mL vial of lidocaine to obtain a reconstitution of 10 units vasopressin in 50 mL of lidocaine. This procedure is repeated for ten vials of lidocaine mixed with vasopressin. Each 50 mL vial of lidocaine combined with vasopressin is marked with a “V” prior to withdrawing medication into the syringes to distinguish from the vials with lidocaine only. Forty syringes with combined lidocaine/vasopressin are prepared first. Each syringe is identified with a blue and white label reading “20cc lidocaine (0.5%) w. 4U Vasopressin.” The remaining 56 syringes are filled with lidocaine only and identified with a white label reading “20cc lidocaine (0.5%).” After preparing the 96 syringes, they are separated, wrapped in a towel, and kept in two separate metal trays. Each tray is identified for type of medication utilizing the same labels placed on the syringes. The CRNP provides the metal trays to the RHA to keep in a centralized location (portable table in the hallway) for use during the day of TAB procedures. The RHA removes the appropriate syringes of lidocaine from the metal trays and sets them inside the procedure room on a sterile field for the physician to administer to the patients. During site visit #2, the RHA reported finding 22 empty vials of lidocaine by the trashcans just outside the facility. Of those 22 empty vials, 19 were lidocaine 2% and the other three were lidocaine 0.5%. Eight of the lidocaine 2% vials found were marked with a “V” on the bottle. According to the inventory control data sheet, the clinic had received 22 vials of 50 mL lidocaine 2%. The lidocaine 2% vials were stored next to the lidocaine 0.5% on the same shelf in the medication preparation room. Both concentrations of lidocaine are prepared by the same manufacturer and have a very similar appearance, including the same vial size, label markings, and blue-colored vial caps. Several clinical practices were of concern and several problems were identified during the medication preparation demonstration.
• Storage of lidocaine 2% (which is neither part of the clinic formulary nor regularly stocked) together with regularly-stocked lidocaine 0.5%.
• Improper storage of medications. Medications with similar appearance should be stored in different locations to prevent potential error, provided they are part of the formulary.
• Lack of documentation and record keeping of lot numbers of lidocaine and vasopressin administered.
• Inadequate labeling of pre-filled syringes with lidocaine used for TAB procedures. Although the concentration printed on the labels for each syringe was correct, each label should read exactly what each syringe contains, i.e., 10 mL lidocaine (0.5%) with 2U vasopressin or 10 mL lidocaine (0.5%).
• No verification of concentration of drugs used. The CRNP who prepared the lidocaine did not notice using lidocaine 2% verses lidocaine 0.5% during the medication preparation process.
• Lack of a written procedure for pre-filling lidocaine syringes for TAB procedures. • Placement of pre-filled lidocaine syringes in an open, unsecured area. • Lack of record-keeping of number of unused lidocaine syringes discarded at the end of the day.
In addition, during site visit #1, the CRNA who prepared the propofol on the day of the incident reported that the medication was prepared by pre-filling syringes for all patients scheduled for TAB at the beginning of the day; however, the syringes prepared for that day were neither labeled nor dated. The CRNA stated that sometimes the pre-filled propofol syringes are labeled and timed for two to three patients prior to surgery. It was discovered that after filling the syringes, the CRNA kept them in a lab coat pocket for storage for an undetermined length of time prior to administration. This practice allows for a

Lidocaine Poisoning from Medication Error Page 6
Acute Communicable Disease Control 2009 Special Studies Report
breach in aseptic technique, and is not supported by the clinic’s General Anesthesia and Deep Sedation Protocol. ACDC notified HF Inspection Division, Toxics Epidemiology, and the FDA of the retrieved empty vials of 2% lidocaine. Toxics Epidemiology and ACDC recommended that HF Inspection Division carefully review medication procedures and practices of the clinic (storage, preparation, and administration) and requested that a California State certified pharmacy consultant conduct a comprehensive assessment and recommend measures and practices to prevent medication errors. On the day following the incident, HF Inspection Division ceased operations of anesthesia-related procedures at the clinic until the completion of an audit of pharmacy practices and corrective actions were instituted. CONCLUSION Past case reports of fatal overdoses occurred in the 1970s, with hematomas noted at the paracervical injection sites, resulting in communication with the vascular system 2. Patients 1 and 2 in this investigation likely experienced a similar reaction. ACDC, HF Inspection Division, Toxics Epidemiology, and the FDA collaborated in the investigation of a cluster of two patients who developed tonic-clonic convulsions and hypoxemia shortly after administration of conscious sedation and paracervical local anesthesia for TAB procedure. The investigation included chart review, staff interviews, medication preparation observation, review of policies and procedures, and laboratory analysis. The investigation strongly suggested a medication dosing error evidenced by discovery of 19 empty 2% lidocaine vials, above expected lidocaine concentration levels in syringe residuals, and an elevated blood lidocaine level in Patient 1. Several contributing factors in the clinic processes which may have increased the risk of medication error were identified during this investigation. These included failure to return medication to the manufacturer which is not part of the clinic formulary, stocking the same medication of different concentration and similar appearance next to each other, non-adherence to all of the “Six Basic Rights of Medication Safety Practices” (drug, dose, patient, time, route, and documentation) during medication preparation, inappropriate labeling of medications, and finally, lack of written protocol and procedures for the verification of medication dosage prepared by one staff and administered by another, and the safe storage of medications prepared in advance for procedures. This case illustrates the risk of medication error in local facilities which lack formal protocols for anesthesia. This investigation also served to identify several practices throughout the clinic which may have contributed to the medication errors. This case demonstrates the benefit of multi-agency collaboration to investigate, identify and correct problems. REFERENCES 1. Caravati, E.M., et al., (2004). Medical Toxicology, 3rd ed. Philadelphia: Lippincott Williams & Wilkins,
980-981. 2. Grimes DA, Cates W. Deaths from paracervical anesthesia used for first-trimester abortion, 1972-
1975. New England Journal of Medicine 1976;295(25):1397-1399.

Hepatitis C Investigations
Page 7
Acute Communicable Disease Control 2009 Special Studies Report
NOSOCOMIAL HEPATITIS C: A CRYPTIC SOURCE FOR A CRYPTIC DISEASE
Elizabeth Bancroft, MD, SM BACKGROUND Hepatitis C is the most commonly diagnosed bloodborne pathogen in the United States. Approximately 3.2 million people in the United States are infected with hepatitis C and 75-85% of them will develop long-term complications, which may include cirrhosis, liver failure, and liver cancer.1 Most people will have no symptoms at the time of initial infection and their complications may only appear 20-30 years after initial infection. The majority of people who currently have chronic hepatitis C are thought to have acquired their infection in the 1970s and 1980s due to blood transfusions or sharing needles during injection drug use, though rarely the infection may also be acquired via sex or during the perinatal period. A test to detect hepatitis C antibodies was developed in the early 1990s, leading to a sharp reduction in transfusion related cases of hepatitis C. Since the 1990s, most new infections with hepatitis C are thought to be due to sharing needles for illicit injection drug use. However, there has been an increasing awareness of hepatitis C acquired due to healthcare exposure (often referred to as “nosocomial” hepatitis C). These infections have been associated with contaminated multi-use medication vials, re-use of medication syringes, or infection control breaches in hemodialysis centers.2 Determining the source of infection with hepatitis C can be very challenging for a variety of reasons. As stated above, most people do not have symptoms at the time of initial infection and may not know that they have been infected with hepatitis C until they develop liver failure. In this case, it is almost impossible to determine when and where they were exposed to the virus in the preceding years or decades. It is also hard to distinguish the acute onset of a new hepatitis C infection from a clinical flare of a longstanding infection; there is no single laboratory test that can distinguish acute hepatitis C from chronic hepatitis C. Both acute and chronic infection may present with abdominal pain, nausea, vomiting, diarrhea, jaundice, fatigue, fever, elevated liver function tests and serological evidence of hepatitis C. Therefore, unless a person has documentation of a negative hepatitis C test in the past, it is almost impossible to know if a patient with newly diagnosed hepatitis C has a newly acquired infection or a clinical flare of a previously acquired infection. The Council of State and Territorial Epidemiologists (CSTE) defines a case of acute hepatitis C as someone who has a discrete onset of clinical symptoms, has jaundice or highly elevated levels of specific liver function tests, and one or more specific blood tests positive for hepatitis C. Of the approximately 20,000 positive serological results reported each year to the Los Angeles County (LAC) Department of Public Health (DPH), only 3-8 each year are ultimately identified as acute hepatitis C cases. Since mid-2007 staff at the LAC DPH Acute Communicable Disease Control Program (ACDC) have routinely interviewed patients with documented acute hepatitis C to identify any nosocomial sources for their infection. Despite careful re-interviewing, unambiguous cases of nosocomial hepatitis C are rarely identified. However, of ten acute cases of hepatitis C reported to ACDC in 2009, five had traditional risk factors for hepatitis C, including IV drug use and sex with an infected partner, but five appeared to have only nosocomial healthcare exposure. In the spring of 2009, a patient was reported who newly seroconverted to hepatitis C in 2008 after being negative for hepatitis C for many years. In the summer and fall of 2009, four unrelated cases of acute hepatitis C were reported to ACDC; all the cases had significant healthcare exposures in the six months before the onset of their disease (the incubation period of hepatitis C is two weeks to six months) and no other “traditional” risk factors for hepatitis C such as drug use or sex with an infected partner. All five cases had been reported by physicians or the patients who believed that they acquired hepatitis C from a specific healthcare source or medical procedure. Therefore, ACDC conducted detailed investigations of each of the cases. The goal was to determine the patients’ source(s) of infection and to rectify any infection control breaches that may have resulted in the transmission of this infection.

Hepatitis C Investigations Page 8
Acute Communicable Disease Control 2009 Special Studies Report
METHODS Medical records were reviewed and a careful medical history was obtained from all the cases. A list of medical procedures and where they were performed during the incubation period for each of the patients was obtained. ACDC contacted medical facilities and obtained the names and birthdates of the patients who proceeded and followed the index patients for these discrete procedures and cross referenced those names to the LAC DPH hepatitis registry to identify previously reported hepatitis C cases from whom transmission of hepatitis C from patient to patient may have occurred at these facilities. Site visits were made to selected facilities where high risk medical procedures were performed. Diagnostic and infection control procedures were observed; records were reviewed, and personnel were questioned about infection control procedures at the facilities. All facilities where a site visit was conducted received a follow-up letter which detailed any significant findings and provided recommendations for improving infection control or public health practice. RESULTS All patients had multiple healthcare exposures during their incubation period that could have been a source of their infection. Medical procedures identified included surgery, cystoscopy, colonoscopy, radiological scans with injected contrast, receipt of intravenous fluids and nutrients, dental procedures, intramuscular and subcutaneous injections, and routine blood draws. Of note, no case had overlapping healthcare exposures with any other case. No other patients with hepatitis C who either preceded or followed the index patients were identified in the hepatitis registry. Site visits were made to a free-standing surgical center, two free-standing physician’s offices that operated medical spas, and two facilities associated with large hospitals where outpatient procedures are performed. Very little evidence of significant breaks in infection control was found in the facilities that were regulated (surgical center, those associated with large hospitals). The facilities were clean and well operated, had documented infection control policies, and provided ongoing education for personnel. In contrast, inspections made at the free-standing physician’s offices revealed several breaches in standard infection control procedures including using single-dose vials for multiple patients, not labeling or ensuring proper discarding of multi-dose vials, and using single syringe-needle combinations to serially enter several multi-dose vials. All of these practices can result in cross-contamination. Furthermore, both facilities lacked on-site written procedures for aseptic medication administration and medication storage, proper policies for infection control, and guidelines for employee exposures to bloodborne pathogens. Both offices also lacked duty statements for their medical assistants. This is important because the State of California clearly regulates what procedures medical assistants may or may not do.3 These physicians were provided with detailed letters documenting deficiencies and providing recommendations to meet infection control standards consistent published CDC recommendations. CONCLUSIONS Investigation results did not identify any single healthcare exposure as a cause of acute hepatitis C in the five patients that were reported to ACDC in 2009. There are several reasons for this: 1) The cases may have been chronic cases that had been infected with the disease years ago and just now are presenting with symptoms; in that case investigating healthcare exposures that took place only six months before their onset of symptoms would not be sufficient to identify a source, 2) These are acute cases that are due to healthcare exposure but the infection control breaches were so rare that no one else became ill or others who become ill have not been reported to ACDC, and 3) These are acute cases but the case has another unreported risk factor for acquiring hepatitis C. Each of the investigations was painstaking, requiring multiple interviews, chart reviews, obtaining other patients’ names and birthdates, reviewing hepatitis registries, lengthy and comprehensive site visits to facilities, and follow-up to site visits. Infection control breaches at some individual physician’s offices were identified and improved practices were implemented at these offices, none of the breaches was sufficient to recommend immediate cessation of activities. Based on the experience with these cases, ACDC has

Hepatitis C Investigations
Page 9
Acute Communicable Disease Control 2009 Special Studies Report
changed its protocol for investigating cases of acute hepatitis C. ACDC will continue to interview patients extensively for possible healthcare exposures. ACDC will document all such medical procedures in a database to detect common events; a site visit to the facility will be made only if another patient states the same medical procedure at the same facility, similar to the algorithm used by New York State to investigate cases of nosocomial hepatitis C.4 This protocol balances dwindling public health resources with the likelihood of identifying and stopping a source of ongoing hepatitis transmission. Though a source for these individual cases of hepatitis C was not determined, it was clear that there were breaches in infection control that occurred in the private physician’s offices. Such offices are not regulated by any authority other than the California Medical Board and there are few, if any, infection control standards that have been specifically written for this population. Currently there are no regularly scheduled inspections or licensing exams of the offices of individual physicians. Multiple outbreaks investigated by LAC DPH and other public health agencies have documented poor infection control and lack of oversight in private offices leading to a variety of nosocomial infections.5,6 Better oversight and education of physicians may decrease exposure to hepatitis C and other pathogens. REFERENCES 1 CDC. Hepatitis C Information for Health Professionals. http://www.cdc.gov/hepatitis/HCV/HCVfaq.htm#section1 Accessed 3/8/2010 2 Thompson ND, Perz JF, Moorman AC, Holmberg SD. Nonhospital health care-associated hepatitis B and C viral transmission: United States, 1998-2008. Ann Intern Med. 2009;150(1):33-9 3 Medical Board of California. Medical Assistants- Frequently Asked Questions. http://www.mbc.ca.gov/allied/medical_assistants_questions.html Accessed 3/8/2010 4 Joshua Schaffzin, MD, pers comm. 5 Kim MJ, Bancroft E, Lehnkering E, Dolan R, Mascola L. Alcaligenes xylosoxidans bloodstream infections in an outpatient oncology office. Emerg Infec Dis. 2008;14(7). http://www.cdc.gov/eid/content/14/7/1046.htm Accessed 3/8/2010 6 English L, Terashita D, Burwell L. Outpatient medical procedures and patient safety: Who’s minding the store? Acute Communicable Disease Control Program Special Reports 2007. http://lapublichealth.org/acd/reports/annual/2007%20Special%20Studies%20Report%20for%20Web%20Posting.pdf Accessed 3/8/2010

Hepatitis C Investigations Page 10
Acute Communicable Disease Control 2009 Special Studies Report

Outbreaks in an Outpatient Radiology Center
Page 11
Acute Communicable Disease Control 2009 Special Studies Report
OUTBREAK OF JOINT INFECTIONS ASSOCIATED WITH MAGNETIC RESONANCE ARTHROGRAMS PERFORMED AT AN OUTPATIENT RADIOLOGY CENTER
Moon Kim, MD, MPH; Clara Tyson, BSN, PHN
INTRODUCTION In 2009, the Los Angeles County (LAC) Department of Public Health’s (DPH) Acute Communicable Disease Control Program (ACDC) was notified of a possible cluster of patients with joint infections after receiving magnetic resonance (MR) arthrograms at a single outpatient radiology center, Facility A. ACDC personnel spoke with the Chief Radiologist at Facility A and learned that at least two patients may have had joint infections with Staphylococcus aureus following MR arthrograms performed at Facility A both within one week period. ACDC conducted an investigation to confirm the presence of an outbreak, conduct case finding, determine the source of infection, and recommend control and prevention measures. An ACDC team consisting of a physician and public health nurse conducted a site visit and chart review to investigate whether there were other cases of joint infections following MR arthrograms performed at Facility A, reviewed infection control practices and the pharmaceuticals used during MR arthrograms. A second site visit was made by ACDC personnel to observe medication and contrast media preparation procedures for MR arthrograms. ACDC consulted with the California Department of Public Health (CDPH) and the Centers for Disease Control and Prevention (CDC) Division of Healthcare Quality Promotion to discuss the methods and findings of this investigation and determine if other cases of joint infections following MR arthrogram procedures were reported in the state or nationally. METHODS A retrospective cohort study was conducted of patients who received MR arthrograms at Facility A to identify risk factors for joint infection. A confirmed case was defined as a patient who had an MR arthrogram procedure at Facility A, who developed signs and symptoms of joint infection with evidence of septic arthritis and microbiologic growth in the synovial fluid. A possible case was defined as a patient who had an MR arthrogram procedure at Facility A who had acute onset of new joint pain symptoms following the MR arthrogram procedure requiring further medical evaluation and had negative synovial fluid cultures. Case finding consisted of calling all patients who had received MR arthrograms during a two month period. Prospective surveillance was also performed by calling all patients who subsequently received MR arthrograms and inquiring about adverse events within one week following their procedure. Hospital inpatient and Facility A medical records of case-patients were reviewed. The chief radiologist and radiologic technologist (RT) staff were interviewed. Procedures for MR arthrograms were reviewed including infection control practices and pharmaceutical storage, preparation, and injection. An opened 10 mL single-dose vials of gadolinium contrast solution and an opened 100 mL single-dose vials of iodinated contrast solution were collected for testing by the public health laboratory. RESULTS Medical Record review/Case Characterization ACDC obtained a list of all patients who had MR arthrogram procedures at Facility A during the one week outbreak period. A total of 15 patients had this procedure done during this time period. ACDC contacted all 15 patients and/or their orthopedic surgeons by telephone. Medical records of those who were hospitalized or evaluated in an emergency department (ED) were reviewed. ACDC identified a total of seven case-patients (five confirmed, two possible) out of 16 MR arthrogram procedures performed on 15 patients (one patient had bilateral shoulder MR arthrograms) confirming the presence of an outbreak at Facility A (see Figure). Of the seven total case-patients, five presented initially to the ED or hospital with knee joint pain and two with shoulder joint pain, corresponding to the same joint that was injected during the MR arthrogram procedure (the case-patient with bilateral shoulder MR arthrograms had only one joint infected). No commonalities in the case-patients were found other than receiving an MR arthrogram at Facility A. All five confirmed case-patients were hospitalized at different medical centers for further

Outbreaks in an Outpatient Radiology Center Page 12
Acute Communicable Disease Control 2009 Special Studies Report
management and were diagnosed with septic arthritis. Bacterial cultures of synovial fluid for all five confirmed case-patients grew methicillin-sensitive Staphylococcus aureus (MSSA) with the same antibiotic sensitivity profile. The two possible case-patients were seen and evaluated in EDs and diagnosed with joint effusion and/or inflammatory reaction and were not hospitalized; one of these two case-patients received oral antibiotics on initial evaluation; synovial fluid gram stain and culture were negative for both of these patients. For the seven case-patients, average onset time of new acute joint pain symptoms following the MR arthrogram procedure was 1.1 days (range 1-2 days) and the average time to hospitalization or ED visit following the MR arthrogram procedure was 4.6 days (range 1-9 days). Average length of hospitalization for the five confirmed case-patients was 10.8 days (range 5-16 days). All five confirmed case-patients required surgical arthroscopic incision and drainage, peripherally inserted catheter placement, and six weeks of intravenous antibiotics for treatment of septic arthritis.
FIGURE
Infection Control/Aseptic Technique Procedure Review ACDC conducted a site visit and interviewed the chief radiologist and the RT staff regarding infection control procedures and the MR arthrogram procedure, including injectable medication and contrast media preparation. ACDC learned that intra-articular injectable medication and contrast media preparation is performed at Facility A by either of two radiologic technologists in one fluoroscopy room, which contains a sink. The chief radiologist is the only radiologist who performs MR arthrograms at this facility. ACDC was informed that the following pharmaceuticals were used for MR arthrogram procedures: (1) lidocaine from a 10 mL ampule is used for local anesthesia, 5 mL per patient, (2) approximately 5-10 mL of Optiray® 350 (iversol) is injected intra-articularly for either knee or shoulder MR arthrograms, (3) 10 mL of a 1:200 dilution of Magnevist® (gadopentetate dimeglumine) is injected intra-articularly for either knee or shoulder MR arthrograms, and (4) 10 mL of 0.9% sodium chloride solution (saline) from 10 mL single-dose vials is used to dilute the Magnevist®. The following infection control and pharmaceutical preparation issues were noted:

Outbreaks in an Outpatient Radiology Center
Page 13
Acute Communicable Disease Control 2009 Special Studies Report
1. No written office procedures or policies for infection control were in place and there were no
specific written procedures for injectable medication and contrast media preparation using aseptic technique.
2. There was no documentation of lot numbers of injectable medications and contrast media solutions (Optiray®, lidocaine, saline, Magnevist®) used for patients.
3. There was no documentation of the exact dosages of Optiray® and lidocaine used on each patient.
4. Open dates were not written on unsealed medication and contrast media vials. 5. Lidocaine syringes were prepared in advance for some patients and left on the procedure
tray but were not labeled with either the medication contained or the date and time of preparation.
ACDC conducted a second site visit specifically to observe injectable medication and contrast media preparation procedures. ACDC was informed that it is routine procedure at Facility A for two RTs to each prepare medications and contrast media for the MR arthrogram procedure. There were no duty statements for the RTs. There were no documented staff trainings or competency evaluations for staff on infection control practices or use of aseptic technique.
The injectable medication and contrast media preparation process involved both RTs. ACDC was informed that one RT was to maintain aseptic, sterile technique and the other RT provided assistance in performing non-sterile functions. The RTs were told by ACDC to prepare medications and contrast media in their usual fashion, so ACDC could observe both RTs performing each of their individual roles. ACDC observed multiple infection control deficiencies including breaches in aseptic technique when preparing contrast media (Magnevist® and Optiray®), and use of single-dose vials of the contrast media incorrectly as multi-dose vials for multiple patients. There were no written procedures for medication or contrast media preparation using aseptic technique. Retrospective Cohort Review and Active Surveillance To ascertain any other cases, ACDC attempted to contact all patients who had received MR arthrograms two months prior to the one week period. In addition, ACDC conducted active surveillance for all patients who had subsequently received MR arthrograms for one month after the one week period by telephoning these patients and querying if they developed new acute joint symptoms following their MR arthrogram that required further medical evaluation or hospitalization. During the three month study period there were 145 patients who received MR arthrograms at Facility A. Of these, 117 (81%) patients and/or their orthopedic surgeons were successfully contacted. Twenty-eight (19%) could not be contacted (there was no response to messages left with patient or orthopedic surgeon). No other case-patients were identified other than the seven case-patients identified above (five confirmed, two possible).
Microbiologic testing ACDC was informed by the chief radiologist that Facility A had independently submitted one vial of Optiray® and one vial of Magnevist® previously to a private laboratory. A copy of those results showed no organisms on gram stain and no bacterial growth on culture for both vials that were submitted. During the second site visit, ACDC obtained one open vial of Optiray® 350 and one open vial of Magnevist® (open dates illegible) from Facility A for testing at the Public Health Laboratory. Both vials were negative for growth of S. aureus on bacterial culture. Synovial fluid culture isolates from the five confirmed case-patients had been discarded prior to ACDC notification of the outbreak and were not available for further molecular epidemiologic analysis by the Public Health laboratory.
Notifications to federal and state agencies

Outbreaks in an Outpatient Radiology Center Page 14
Acute Communicable Disease Control 2009 Special Studies Report
The manufacturer of both Optiray® and Magnevist® were contacted and a MedWatch report was made by the manufacturer of Magnevist® to the Food and Drug Administration (FDA) regarding the five confirmed case-patients of MSSA joint infections following MR arthrograms performed at Facility A. It was noted that single-dose vials of both contrast media were being used incorrectly as multi-dose vials on multiple patients. It was also noted that other solutions in addition to the contrast media were administered (e.g., lidocaine ampule, saline single-dose vial) to the patients. The CDPH was notified of the outbreak. A report was also made to the CDC’s Epidemic Information Exchange (Epi-X). The CDC and the CDPH were consulted. No other case-patients were identified locally or nationally. CONCLUSIONS AND FINAL RECOMMENDATIONS Septic arthritis following arthrography is rare. One study in the medical literature reported that only three cases of septic arthritis (0.0024%) were found in 126,000 arthrographic procedures performed1. In another report, there were no infections associated with approximately 13,300 MR arthrograms performed2. In a recent prospective evaluation of 1085 patients who had MR arthrography, no patients had infection 3. In this outbreak investigation, ACDC identified that five of 15 patients (33%) developed septic arthritis during a five-day period following receipt of an MR arthrogram procedure at a single outpatient radiology center and seven of 15 (47%) required hospitalization or emergency department evaluation following the procedure. All case-patients were epidemiologically linked in place and time. ACDC concludes that this outbreak was more likely than not caused by a breakdown in infection control practices and/or aseptic technique during intra-articular contrast media preparation that could have provided the opportunity for extrinsic contamination of a single contrast media vial resulting in joint infections when injected intra-articularly. This is supported by the findings that: (1) the investigation demonstrated multiple breaches in infection control practices and aseptic technique during contrast media preparation where extrinsic contamination of a contrast media vial could have occurred, (2) single-dose contrast media vials were being used incorrectly as multi-dose vials on multiple patients, (3) during the five-day period in which the outbreak occurred, the use of ~1 mL or ~10 mL of either contrast media used per patient, Magnevist® or Optiray® respectively, is consistent with the use of a single 10 mL vial of Magnevist® or a single 100 mL vial of Optiray®, either of which would have been used on a maximum of ten patients, and (4) the case-patients were clustered temporally and no other case-patients were identified; the extent of the outbreak was limited, making a localized point source most likely. If the infections were due to a contaminated vial, depending on the amount of contamination to which these patients were exposed, patients would be affected with joint infection, joint inflammation or effusion, or may not have been affected during this five day-period. It is considered unlikely that the lidocaine or the saline was responsible for the outbreak particularly because (1) each 10 mL ampule of lidocaine was being used on one or tw patients maximum and then the ampule container was discarded and (2) the entire contents of the 10mL vial of saline was being used correctly as a single-dose vial, 10 mL per patient, and then discarded. Because of lack of documentation on the open date of vials, lack of documentation on which patient received which vials, and because the exact vials that were administered to the case-patients were not available for further testing, it is not possible to determine the exact circumstances which lead to the outbreak of joint infections at Facility A. However, outbreaks of S. aureus joint infections due to breakdown in aseptic technique or non-adherence to manufacturer’s instructions when using medication vials have been documented in the medical literature 4, 5. Because there was lack of documentation as to 1 Newberg AH, Munn CS, Robbins AH. Complications of Arthrography. Radiology 1985; 155: 605-606. 2 Hugo PC, Newberg AH, Newman JS, Wetzner SM. Complications of Arthrography. Semin Musculoskelet Radiol 1998; 2: 345-348. 3 Saupe N, Zanetti M, Pfirrmann CW, et al. Pain and other side effects after MR arthrography: prospective evaluation in 1085 patients. Radiology 2009 Mar;250(3):830-8. 4 Kirschke DL, Jones TF, Stratton CW, et al. Outbreak of Joint and Soft-Tissue Infections Associated with Injections from Multidose Medication Vial. Clin Infect Dis 2003; 36: 1369-73. 5 Murray RJ, Pearson JC, Coombs GW, et al. Outbreak of Invasive Methicillin-Resistant Staphylococcus aureus Infection Associated with Acupuncture and Joint Infection. Infect Control Hosp Epidemiol 2008; 29: 859-65.

Outbreaks in an Outpatient Radiology Center
Page 15
Acute Communicable Disease Control 2009 Special Studies Report
which patients received which contrast media vials, it is impossible to know if the vials that Facility A sent for testing were the vials used on the five confirmed case-patients during the one week outbreak period. Consultations with the CDC and CDPH indicated that breaks in infection control and/or aseptic technique are likely contributors to this outbreak. Although it is theoretically possible that an unidentified environmental source or breach in MR arthrogram injection technique was responsible for the outbreak, ACDC considers this unlikely as no other case-patients were identified other than during the one week outbreak period, supporting the conclusion that a breach in infection control or aseptic technique most likely occurred during that time period and suggests that no persistent source was present. Review of the medical literature revealed few studies looking at the risks of re-using single-dose contrast media vials. Citing the expensive cost of discarding unused portions of single-dose contrast media vials, two small reports in the medical literature have studied re-use of contrast media that is intended only for single-dose use 6, 7. However, this practice is not scientifically established nor can it be generalized as a standard of practice and it is against manufacturer’s recommendations for single-dose vials 8, 9. Single-use (single-dose) vials are not designed for multiple entries for withdrawal of contents and might pose a risk for contamination if they are punctured several times10. In addition, single-dose vials are frequently preservative-free. When products packaged in single-dose vials are used as multi-dose vials, the probability for contamination is increased. Therefore, products labeled as single-dose containers should be used to supply a dose for a single patient and any residual product should be discarded and not retained for use on other patients. Outbreaks have occurred when single-dose vials of drugs, including contrast solutions, were re-used on multiple patients 11, 12, 13. In a study testing antimicrobial properties of magnetic resonance imaging contrast media, all of the four contrast media that were tested (including gadopentetate dimeglumine) did not meet minimum compendia criteria (using official methodology and acceptance criteria from the United States, Great Britain, and Europe) for effectiveness of antimicrobial preservative and this study concluded that their findings do not support multidose use of magnetic resonance contrast media 14.
A recurrence of an outbreak of joint infections at Facility A should be prevented by strict adherence to proper infection control practices, use of aseptic technique when performing MR arthrograms, and following manufacturer’s instructions for contrast media use. Facility A was instructed to report any patients with possible joint infections following MR arthrograms to ACDC. ACDC recommended that Facility A keep logs of lot numbers, document dosages, label pre-filled syringes, and write open dates on multidose vials. ACDC emphasized with Facility A to follow strict adherence to the manufacturer’s recommendations for single-dose contrast media vial use; that single-dose vials should never be used for more than one patient and any residual product should be discarded and not retained for later use on other patients; develop procedures and follow proper infection control practices; review duties of radiologic technologists and ensure consistency with job duties and scope of practice, including preparing and diluting medications and contrast media for intra-articular injection; and to develop procedures and routine training and competency review for use aseptic technique when preparing injection medications and contrast media. 6 Green KA, Mustachi B, Schoer K, et al. Gadolinium-based MR Contrast Media: Potential for Growth of Microbial Contaminants When Single Vials Are Used for Multiple Patients. Am J Roentgenol 1995; 165: 669071. 7 Kamishima T, Scheweitzer ME, Awaya H, Abraham D. Utilization of “Used” Vials: Cost-Effective Technique for MR Arthrography. J Magn Reson Imaging 2000; 12: 953-955. 8 Magnevist package insert. Wayne, NJ: Bayer Healthcare Pharmaceuticals. 2007 June. http://berlex.bayerhealthcare.com/html/products/pi/Magnevist_PI.pdf?WT.mc_id=www.berlex.com 9 Optiray 350 package insert. Hazelwood, MO: Mallinckrodt Inc. Tyco Healthcare. 2008 March.
http://www.imaging.mallinckrodt.com/imageServer.aspx/doc133715.pdf?contentID=13542&contenttype=application/pdf 10 Centers for Disease Control and Prevention. Guidelines for the prevention of intravascular catheter-related infections. MMWR Recomm Rep 2002; 51: 1-29. 11 Cohen AL, Ridpath A, Noble-Wang J, et al. Outbreak of Serratia marcescens Bloodstream and Central Nervous System Infections After Interventional Pain Management Procedures. Clin J Pain 2008; 24: 374-380. 12 Pan A, Dolcetti L, Barosi C, et al. An Outbreak of Serratia marcescens Bloodstream Infections Associated with Misuse of Drug Vials in a Surgical Ward. Infect Control Hosp Epidemiol 2006; 27: 79-82. 13 Grohskopf LA, Roth VR, Feikin DR, et al. Serratia liquifaciens Bloodstream Infections from Contamination of Epoetin Alfa at a Hemodialysis Center. NEJM 2001; 344: 1491-1497. 14 Beussink DR, Godat JF, Seaton T. Antimicrobial Properties of Magnetic Resonance Imaging Contrast Media. Am J Health Sys Pharm 2007; 57: 48-50.

Outbreaks in an Outpatient Radiology Center Page 16
Acute Communicable Disease Control 2009 Special Studies Report
Vibriosis Outbreak
Page 17
Acute Communicable Disease Control 2009 Special Studies Report
A MULTI-STATE VIBRIOSIS OUTBREAK LINKED TO OYSTERS HARVESTED FROM BRITISH COLUMBIA
Soodtida Tangpraphaphorn, MPH
ABSTRACT In late July 2009, the Los Angeles County (LAC) Department of Public Health (DPH) Acute Communicable Disease Control Program (ACDC) received a greater-than-expected number of reports of gastrointestinal vibriosis, prompting an investigation of a possible outbreak. Epidemiological investigation found that all the cases had eaten raw oysters within 36 hours prior to onset. Environmental health investigations showed that every case had eaten oysters harvested from the same site during the 10-day period between July 27, 2009 and August 3, 2009. Laboratory testing identified the etiology of the infections as Vibrio parahæmolyticus. Further investigation found that jurisdictions outside of LAC had reported similar cases in the same time frame. A multi-jurisdiction outbreak investigation was conducted to determine the source and extent of the vibriosis outbreak. BACKGROUND Vibriosis is an infection caused by comma-shaped, Gram-negative bacteria of the genus Vibrio. Vibriosis most commonly presents as acute diarrhea, but may also occur as wound infection or septicemia. Vibriosis is transmitted by ingesting food or water contaminated with Vibrio, or by contact between open wounds and contaminated water. The most common species that cause vibriosis are V. parahæmolyticus, V. alginolyticus, V. vulnificus and V. choleræ1. Vibriosis is commonly associated with consumption of raw or undercooked seafood, particularly oysters. METHODS Surveillance: Cases were defined as persons with confirmed vibriosis due to V. parahæmolyticus infection who had a history of eating raw oysters between July 25 and August 5, 2009. ACDC received confidential morbidity reports (CMR) from healthcare providers reporting cases of vibriosis. ACDC contacted the cases, interviewing each case about his or her risk factors including: food and restaurant history, travel history and recreational water exposure. Cases citing raw oyster consumption were investigated further for links to the outbreak2. The California Department of Public Health (CDPH) contacted other jurisdictions to locate additional vibriosis cases via email and conference calls. A bulletin was posted to Epi-Aid, a restricted internet web site for public health agency epidemiologists, in an effort to find cases nationwide and in Canada. Environmental Health: LAC Environmental Health Services (EHS) Food & Milk Program (F&M) inspected restaurants cited by cases as their sources of raw oysters. F&M obtained shellfish harvest tags and seafood invoices corresponding to dates when oysters were eaten by cases. Food & Milk also inspected one of the seafood packing facilities that sold some of the implicated oysters obtaining specimens of oysters harvested from the suspected contaminated site. Laboratory: The LAC Public Health Laboratory (PHL) received bacterial isolates from cases’ medical providers and confirmed the bacterial identification as V. parahæmolyticus. PHL also cultured oysters collected by F&M. Pulse-field gel electrophoresis (PFGE) was used to determine whether V. parahæmolyticus cultured from oysters harvested on August 17 genetically matched the bacterial strains that infected the case-patients.

Vibriois Outbreak Page 18
Acute Communicable Disease Control 2009 Special Studies Report
Physical Geography: ACDC researched the geography of Western Canada, Canadian fisheries and aquaculture as well as regional climate conditions (e.g., air temperatures, cloudiness, precipitation). Research was done online. RESULTS Surveillance: CDPH identified 16 confirmed cases of V. parahæmolyticus vibriosis among people who had reportedly eaten oysters prior to their onsets of illness. Of these 16 cases, 13 fit the case definition of this outbreak. Seven of the cases were LAC residents. Two cases were Colorado residents. King County (WA), Orange County (CA), San Diego County and Napa County each had one case. Environmental Health: LAC EHS inspected five restaurants. The inspectors did not find any evidence of mishandling of the seafood. Oyster tags from the exposure period were obtained from all the restaurants. Santa Barbara County EHS inspected two restaurants. Oyster tags were obtained and sent to LAC. Southern Nevada Health District EHS inspected one restaurant and sent the oyster tags to LAC. A total of 15 tags from the outbreak period were collected. The four most commonly cited harvest regions are shown in Table 1 below.
Table 1. Number of vibriosis cases associated with shellfish harvest regions
British Columbia Washington State California Maine
# Cited 9 2 2 2
LAC EHS inspected a local seafood distribution facility that sold oysters to several of the restaurants implicated in the outbreak. Oysters harvested from the Canadian location BC-14-8 were collected and taken to the laboratory. These oysters were harvested after the outbreak period. EHS also obtained memoranda regarding oyster bed closures from the oyster harvesters in British Columbia sent to the seafood distribution company. According to the memoranda, the shellfish harvesters tested bacterial levels in the oyster and halted shipments of large oysters (the type most commonly served raw) on August 10, when levels exceed 105 colony forming units2. Harvest and shipments resumed on August 19. Laboratory: LAC PHL confirmed five cases of vibriosis in LAC residents from July 27 to August 5, 2009. One case could not be confirmed because the reporting laboratory lost the Vibrio isolate. PFGE testing found that four isolates were indistinguishable by a Sfi I restriction enzyme pattern. The fifth isolate differed by two bands, which is sufficiently genetically similar to link the isolate to the outbreak. LAC PHL also confirmed Vibrio in oysters collected by LAC EHS. The specimens contained 750 MPN/g V. parahæmolyticus and 150 MPN/g V. vulnificus. The threshold value for a positive result is 100 MPN/g. Oysters did not match genetically to cases by PFGE. Physical Geography: British Columbia Ministry of Environment, Oceans and Marine Fisheries Branch provided a map of Area 14 oyster harvest sites around Vancouver Island (Figure 1). On-line Canadian weather data archives3 revealed the high temperatures in the region for July 25 through August 4, 2009 shown in Table 2 with the previous year’s high temperatures for comparison. The average daily temperature (from 1971 to 2000) in July and August around Vancouver Island was 16.9ºC, ranging from 10.7ºC to 23.1ºC (standard deviation = 1.2)4 (data not shown).

Vibriosis Outbreak
Page 19
Acute Communicable Disease Control 2009 Special Studies Report
Figure 1. Area 14 oyster harvest sites.
*Image courtesy of British Columbia Ministry of Environment, Oceans and Marine Fisheries Branch
Table 2. Maximum outside air temperatures around Area 14-8 (Campbell River) by date and year
Date 7/25 7/26 7/27 7/28 7/29 7/30 7/31 8/1 8/2 8/3 8/4
2009 High Temp. ºC
28.7 31.0 33.3 36.4 33.5 31.6 28.3 30.4 29.8 26.6 24.2
2008 High Temp. ºC
21.5 18.7 19.9 17.5 15.6 18.0 13.8 18.2 20.4 24.3 26.6
DISCUSSION Vibrio is well-known for thriving in warm seawater, accounting for the adage, “Never eat oysters in a month without an ‘R’ in the name.” Likewise, vibriosis incidence increases the most during summer months. However because of an all-seasons consumer demand for raw oysters, restaurants try to reduce the risk of serving contaminated oysters by purchasing oysters harvested in typically cooler climates. Most of the oysters sold in California during the summer months are harvested in British Columbia and Washington State.

Vibriois Outbreak Page 20
Acute Communicable Disease Control 2009 Special Studies Report
According to the weather data collected by the Meteorological Service of Canada, Vancouver Island, BC experienced aberrantly hot temperatures and hit some record high temperatures during the week of July 27 to August 3, 2009. As the water temperature rose, increased proliferation of Vibrio contaminated the oysters, causing illness in many people who ate them. One troubling aspect of this vibriosis outbreak was its duration. Regulatory agencies could have played a greater role in restricting the harvesting and sale of oysters. Shellfish harvesting companies for the most part self-regulate the harvest and sale of oysters, independently testing the water and specimens for Vibrio. When bacterial counts are above a safe threshold, harvesters are supposed to cease operations voluntarily. But it can take a few days following the start of a heat wave for bacteria to proliferate to measurably unsafe levels in the water. By then the oysters may already have become contaminated, yet are still eligible for harvest and sale. In the interest of preventing vibriosis infections, it would be prudent to create enforceable protocols to suspend the harvesting of shellfish when water temperatures reach a threshold conducive to bacterial proliferation, regardless of bacterial cultures. Though the heat wave in 2009 was unprecedented, global changes in climate may result in similar heat waves in the future. Adding clauses that restrict shellfish harvests during hot weather to current shellfish harvesting regulations would address future climate change issues and likely prevent similar outbreaks in the future. CONCLUSION This outbreak of vibriosis was caused by infection with Vibrio parahæmolyticus from oysters harvested near Vancouver Island, British Columbia. The outbreak lasted from July 29 until August 5, affecting 16 people and encompassing multiple counties in California, Nevada and Colorado. LAC had the most cases; seven LAC residents were linked to the outbreak. While the bacterial strain isolated from oysters differed from those obtained from case patients, the harvest date was 12 days after the last case, which may have allowed proliferation of multiple strains in waters at the harvest sites. The oysters became contaminated when regional temperatures climbed to unprecedented highs in late July and early August 2009. The unusually warm temperatures allowed the naturally-occurring bacteria to proliferate in the seawater. More than a dozen people were already sickened before shellfish harvesters ceased shipments of oysters. The outbreak could have been limited in breadth if harvests would have been suspended at the onset of torrid weather conditions. Implementation of shellfish harvesting regulations that account for weather conditions in the future could prevent similar outbreaks from occurring and drastically reduce the incidence of vibriosis. REFERENCES 1. Heymann, David L. Control of Communicable Diseases Manual. 19th ed. Washington, DC: American
Public Health Association, 2008. Print. 2. Procedures to Investigate Foodborne Illness. 5th ed. Ames, Iowa: International Association of Milk,
Food, and Environmental Sanitarians, 1999. Print. 3. Canada's National Climate Archive - Archives Climatiques Nationales Du Canada | Meteorological
Service of Canada - Service M. Web. 19 Aug. 2009. <http://www.climate.weatheroffice.gc.ca>. 4. "Canadian Climate Normals and Averages 1971-2000 | Canada's National Climate Archive."
Canada's National Climate Archive - Archives Climatiques Nationales Du Canada | Meteorological Service of Canada - Service M. Web. 26 Mar. 2010. http://www.climate.weatheroffice.gc.ca/climate_normals/index_e.html.

Inadvertent Ingestion of Marijuana
Page 21
Acute Communicable Disease Control 2009 Special Studies Report
FOODBORNE ILLNESS DUE TO INADVERTENT INGESTION OF MARIJUANA
Stella Fogleman, RN, MSN/MPH; Cyrus Rangan, MD; Justine Kennedy, MPH; Marita Santos, RN, MSN; Moon Kim, MD, MPH; Roshan Reporter, MD, MPH; Steven Teutsch, MD, Jonathan Fielding, MD; Dickson
Diamond, MD BACKGROUND In April, 2009 the Los Angeles County (LAC) Department of Public Health (DPH) Toxics Epidemiology and Acute Communicable Disease Programs investigated a report of a group of preschool teachers with neurological and gastrointestinal symptoms that began within an hour after eating brownies purchased from a sidewalk vendor. The incident was initially reported to the Los Angeles Police Department, who subsequently notified the LAC DPH. The police and health department launched a collaborative investigation that revealed symptoms consistent with inadvertent ingestion of marijuana in the six affected persons. Cannabinoids were found in a recovered brownie sample and marijuana metabolites in the blood and urine of one of the affected persons. The case and investigation were described in detail in the September 4, 2009 issue of the Centers for Disease Control and Prevention’s Morbidity and Mortality Weekly Report [1]. Marijuana is the most commonly used illicit drug in the United States. Among persons aged > 12 years, an estimated 5.8% had used marijuana in the preceding month, 10.1% in the past year, and 40.6% in their lifetime, according to the 2007 National Survey of Drug Use and Health [2,3]. Previous, similar occurrences of inadvertent marijuana ingestion have been documented in Colorado in 1978 [4], and in California in 1981 [5], where persons unknowingly ingested marijuana in baked goods. Accidental marijuana ingestion has led to coma in children [6]. The widespread use of marijuana and the documented cases of accidental ingestion, particularly in children, make it important for clinicians to be aware of the signs and symptoms of accidental ingestion and the possibility of marijuana contamination in foodborne illness. REFERENCES 1. CDC (2009). Inadvertent Ingestion of Marijuana – Los Angeles, California. MMWR, 58(34): 947-50. 2. Substance Abuse and Mental Health Services Administration (2008). Results from the 2007 National
Survey on Drug Use and Health: national findings. Rockville, MD: US Department of Health and Human Services, Substance Abuse and Mental Health Services Administration. Available at http://www.oas.samhsa.gov/NSDUH/2k7NSDUH/2k7results.pdf.
3. Substance Abuse and Mental Health Services Administration (2007). [Tables of illicit drug use among persons 12 years and older in 2006 and 2007]. National Survey on Drug Use and Health 2006 and 2007. Rockville, MD: US Department of Health and Human Services, Substance Abuse and Mental Health Services Administration. Available at http://www.oas.samhsa.gov/NSDUH/2k7NSDUH/tabs/lotsect1pe.htm.
4. CDC (1978). Foodborne marijuana outbreak-Colorado. MMWR, 27: 404-5. 5. CDC (1980). Food-borne illness due to inadvertent consumption of marijuana-California. MMWR,
30:527-8, 533. 6. MacNab A, Anderson E, Susak L (1989). Ingestion of cannabis: a cause of coma in children.
Pediatric Emergency Care, 5: 238-9.

Inadvertent Ingestion of Marijuna Page 22
Acute Communicable Disease Control 2009 Special Studies Report

Legionella Outbreak at a Fitness Center
Page 23
Acute Communicable Disease Control 2009 Special Studies Report
LEGIONELLOSIS OUTBREAK AT A FITNESS CENTER
Tanya M. Phares, DO, MPH; Dawn Terashita, MD, MPH; Juliet Bugante, RN, PHN; Ashley Peterson, MPH
INTRODUCTION Legionella pneumophila is a common cause of infections in both hospital and community settings.1,2,3 Infections can manifest clinically as Legionnaires’ disease, a potentially fatal pneumonia, and Pontiac fever, a self-limited febrile illness3. It is not transmissible person-to-person. People, who are older, smoke, have other medical conditions or weak immune systems are more likely to develop infection4. Legionella ideally grow in warm water (between 95º and 115ºF) that is not well disinfected, and are often associated with water sources such as pools, steam rooms, hot tubs, showers or large plumbing systems1,5,6. In a majority of Legionnaires’ and Pontiac fever cases, a source is never found7. Both clinical manifestations can occur as clusters or isolated cases. BACKGROUND On August 10, 2009, Los Angeles County (LAC) Department of Public Health (DPH), Acute Communicable Disease Control Program (ACDC), began an investigation of two cases of Legionnaire’s disease due to L. pneumophila serogroup 1a (Lp1a), with onsets of pneumonia symptoms in July within two days of each other. Both cases were patrons of a local fitness center. Routine follow up demonstrated that both individuals had visited the spa, pool, and showers of the fitness center during the disease incubation period in early July. METHODS A case was defined as a patron who visited the facility between July 1, 2009 and July 14, 2009, with clinical symptoms including fever/chills and at least one other symptom of headache, myalgias, malaise, abdominal pain, diarrhea or cough, and a positive laboratory test for Legionella. Laboratory tests could include culture or direct fluorescent antibody of respiratory secretions, fourfold rise in serum antibody titer, or urine antigen. This definition was intended to capture both pneumonia and Pontiac fever. Heightened surveillance for additional cases was performed. A health alert message was sent via email to 20 acute care hospitals in the vicinity of the gym, requesting increased surveillance for community acquired pneumonia. All recently reported cases of legionellosis in LAC were reviewed for connection to this facility. Retrospective case finding also occurred by surveying a sample of fitness center patrons; electronic attendance data were used to select a random sample of facility patrons over the age of 59 who visited the center during the two-week exposure period in early July. Since legionellosis can present with a range of symptoms from mild Pontiac fever to more severe Legionnaire’s we decided to broadly base our case finding on Pontiac fever symptoms. Using an attack rate of 95% for Pontiac fever, a standard power calculation was done with Epi Info™ Version 6 Statcalc to determine an appropriate sample size to detect additional cases of legionellosis. SAS® 9.3 software was used to assign a random number to each patron and the lowest 100 numbers were chosen to survey. A clinical survey was designed and administered over the telephone between September 1 and September 15, 2009. Two attempts were made to reach patrons. Patrons who indicated they had fever or respiratory symptoms beginning July 1, 2009 were mailed test kits to collect urine for Lp1a antigen testing. Urine test kits were mailed to seven people reporting symptoms and four additional family members based on patron request. A joint inspection of the fitness center was conducted by ACDC and Environmental Health’s cross-connections, environmental hygiene, and recreational water programs. Water samples were taken from the spa, pool, steam room, and shower and tested by the LAC Public Health Laboratory. Chlorine and pH levels were tested. Pool and spa chlorination log books were reviewed.

Legionella Outbreak at a Fitness Center Page 24
Acute Communicable Disease Control 2009 Special Studies Report
RESULTS The two index cases were the only cases identified. No recently reported legionellosis cases in LAC appeared to have an affiliation with this outbreak. Active retrospective surveillance did not identify any additional cases of either Legionnaire’s disease or Pontiac fever associated with the fitness center. Both index cases were over 60 years old, with multiple pre-existing medical conditions, and were hospitalized as a result of their infections (Table 1). Both cases had good outcomes after their hospitalizations.
Table 1. Course of illness for index cases of Legionnaire’s disease
Index cases
Visited fitness center
Onset symptoms
Hospitalized Age Chronic medical conditions or health behavior
Case 1
7/8
7/15
7/21-7/25
64
Hypertension, gout, hepatitis B, smoker
Case 2
7/10
7/17
7/18-7/24
68
Chronic kidney disease, diabetes, hypertension, hyperlipidemia, coronary artery disease, smoker
A total of 33,728 visits from 10,730 patrons were made to the facility during the defined exposure period; 562 (5.2%) of these patrons were over age 59. Sample size calculations indicated 47 interviews were sufficient to detect cases of Pontiac fever at a 90% confidence level. The questionnaire was administered to a total of 55 people. Of the interviewees, 40-63% used the aquatic facilities regularly (Table 2.) Seven people had symptoms and submitted urine samples; all were negative for Lp1a.
All six environmental swab and water samples were negative for Legionella species by culture. Discussion with staff and pool and spa records confirmed that the pool and spa had been closed in mid-July due to low chlorine levels. During this investigation the spa was again closed temporarily, due to low chlorine levels as documented on the day of inspection.
There were no cross connection violations. Backflow devices were installed in the proper locations. The pool, spa, steam boiler, irrigation, meter protection and fire system were functioning properly. Cooling towers were not used at this facility or at other nearby businesses. The roof mounted air-handling units were inspected and no significant findings were observed.
DISCUSSION Legionnaire’s disease is rare, but given the high attack rate in outbreaks of Pontiac fever, a small sample size is sufficient to determine with high confidence that no infections are present in the population. By surveying only individuals at high risk for exposure and infection, as selected by age and exposure dates, the investigation team increased confidence that no other legionellosis infections occurred. Although the source of the outbreak could not be confirmed, both cases were exposed to the facility’s pool and spa which were both closed due to inadequate chlorination levels shortly following the exposure. Since no further cases were identified, all environmental specimens were negative, and problems with chlorination of the spa were addressed, the fitness center was allowed to continue operations due to lack of evidence of ongoing risk to the public.
Table 2. Survey results of fitness center patrons Facilities used regularly
Percent (n=55)
Pool 40% (22)
Spa 35% (19)
Steam room 30% (16)
Showers
63% (35)

Legionella Outbreak at a Fitness Center
Page 25
Acute Communicable Disease Control 2009 Special Studies Report
REFERENCES 1. Munder R., Yu V., Woo A., Mode of Transmission of Legionella pneumophila. Arch Intern Med. Vol
146, Aug 1986. 2. Burnsed L., et al., A Large Travel-Associated Outbreak of Legionellosis among Hotel Guests: Utility of
the Urine Antigen Assay in Confirming Pontiac Fever. Clinical Infectious Disease. 44:222-8, 2007. 3. Fields B, Benson R., Besser R., Legionella and Legionnaires’ Disease: 25 Years of Investigation.
Clinical Microbiology Reviews, Vol 15 (3): 506-526, 2002. 4. Legionellosis Resource Site: www.cdc.gov/legionella. 5. McEvoy M., et al., A cluster of cases of legionnaires’ disease associated with exposure to a spa pool
on display. Commun Dis Public Health. Mar;3(1):43-5, 2000. 6. Thomas D, Mundy L., Tucker P., Hot Tub Legionellosis, Legionnaires’ Disease and Pontiac Fever
After a Point-Source Exposure to Legionella pneumophila. Arch Intern Med. Vol 153, Nov 1993. 7. Lock, K., et al., Public health and economic costs of investigation a suspected outbreak of
Legionnaires’ disease. Epidemiol. Infect. 136; 1306-1314, 2008.
RESOURCE 1. Heyman, D., Control of Communicable Diseases Manual. American Public Health Association, 18th
edition, 2004.

Legionella Outbreak at a Fitness Center Page 26
Acute Communicable Disease Control 2009 Special Studies Report

Aggregate Influenza Reporting
Page 27
Acute Communicable Disease Control 2009 Special Studies Report
A HOSPITAL-BASED AGGREGATE REPORTING SYSTEM FOR H1N1 PANDEMIC INFLUENZA SURVEILLANCE IN LOS ANGELES COUNTY, 2009
Ramon Guevara, PhD, MPH
BACKGROUND The standard method of conducting disease surveillance involves collecting individual case information such as name, birth date, and address. When the H1N1 influenza pandemic emerged in April 2009, this method of individual case reporting and investigation was not feasible with such a highly infectious communicable disease. Theoretically, as the Centers for Diseases Control and Prevention (CDC) and other health agencies including the California Department Public Health (CDPH) and the Los Angeles County (LAC) Department of Public Health (DPH) agreed, aggregate reporting would allow efficient monitoring of influenza morbidity and mortality. Essentially unrealized in communicable disease surveillance before April 2009, the concept of aggregate reporting is to collect counts that represent a group of individuals. This report describes how the Acute Communicable Disease Control Program (ACDC) of LAC DPH established hospital-based aggregate reporting for influenza and the results of this surveillance system. METHODS In order to build a surveillance system that would feed into California and the national surveillance systems for H1N1 influenza, ACDC consulted with CDC, CDPH, Colorado Department of Public Health, and Iowa Department of Public Health. Although these agencies had limited experience with aggregate reporting, they shared ideas and recommendations. Data gathering methods were developed with an objective to obtain a high participation percentage from the 102 licensed hospitals in LAC. The professional account for SurveyMonkey™ was utilized to obtain weekly data on laboratory-confirmed influenza hospitalizations and deaths as entered by hospital infection preventionists (IPs). Collected data was analyzed by SAS®, summarized, and results were sent to CDPH on a weekly basis. The initial implementation of the aggregate reporting system faced challenges from the hospital IPs. For the period from end of July to beginning of August 2009, ACDC followed CDC and CDPH specifications for survey design and asked IPs to begin submitting weekly data such as number of influenza patients with intensive care unit (ICU) admission, non-ICU hospital admission, and death. Only two hospitals complied. Many IPs expressed that the length was too long (31 fields and 9 pages) and that there was lack of clarity and reasoning in terms of what to report and when. The IPs also felt pressured that the reports could not be late per CDPH specification. Basing the IPs’ feedback, the surveillance data collection methods were revised—simplified the language, shortened the survey (23 fields and 5 pages), and established a clearer methodology of when and what to report. The fields on ICU admission were omitted. Instructions explained to report hospital admissions and deaths of all types of laboratory-confirmed influenza occurring during the designated reporting week (Sunday to Saturday) by 5:00pm the following Tuesday. Specimen collection date of the first positive laboratory influenza result and date of death defined the occurrences of laboratory-confirmed influenza hospital admissions and deaths, respectively. Rather than having IPs enter a date, a drop down menu was made to allow IPs to select the reporting week. To alleviate the pressure of timely and accurate reporting, the revised protocol allowed the IPs to update reports from past weeks and enter reports even if they were late. Eight hospitals were excluded from reporting because they were under Pasadena, Long Beach, or federal jurisdictions. Weekly rates of total hospitalizations and total deaths accounted for the size (number of licensed beds) of hospitals that reported. The surveillance protocol was as follows. From Sunday to Tuesday, hospital IPs would report on SurveyMonkey™ the numbers of laboratory-confirmed influenza hospitalizations and deaths by age group during the previous Sunday-Saturday week. On Monday, the ACDC Epidemiology and Data Support team would identify which hospitals had not yet reported so that the ACDC Hospital Outreach Unit (HOU) would send a reminder to report by 5pm Tuesday. On Wednesday, the Epidemiology and Data Support

Aggregate Influenza Reporting Page 28
Acute Communicable Disease Control 2009 Special Studies Report
would review SurveyMonkey™ data, identify problems such as duplicates or missing data, report numbers of hospitalizations to CDPH, and report rates (per 1000 licensed hospital beds) of influenza hospitalizations and deaths to the ACDC Hepatitis, Antimicrobial Resistance, Invasive Bacteria (HARI) Unit which was responsible for reporting all influenza surveillance results to the Disaster Operations Center and for publishing the Influenza Watch weekly newsletter. From Wednesday to Friday, HOU nurses would investigate reporting problems and with HOU findings Epidemiology and Data Support would correct cumulative data to produce the weekly ACDC Report on Aggregate Reporting on Influenza. Summary reports for the IPs were sent in September 16 and November 2, 2009, and January 21 and April 22, 2010 to provide feedback and encourage continuous quality in reporting. For this report, age-specific rates were calculated by using population estimates from LAC DPH. Some of the original eight age groups defined by CDC and CDPH were combined to fit denominator data for rates. RESULTS From August 9, 2009 to April 17, 2010, there were 1,979 hospitalizations and 88 deaths from laboratory-confirmed influenza identified by hospital-based aggregate reporting. Of the 94 acute care hospitals under LAC DPH jurisdiction, the percentage reporting averaged 71.7% per week. The number of hospitals reporting for a given week ranged from 61 to 72 (64.9%-76.6%). Laboratory-confirmed influenza hospitalizations increased dramatically in October 2009, peaked during the week of November 1, 2009, and then drastically declined (Figure 1). The weekly number of laboratory-confirmed influenza hospitalizations ranged from one to 298. Laboratory-confirmed influenza deaths also peaked during the week of November 1, 2009 (n=12). The total number of laboratory-confirmed influenza deaths ranged from one to 12 per week. Figure 1. Weekly number of laboratory-confirmed influenza hospitalizations (N=1,979) and deaths (n=88) per 1,000 licensed hospital beds from hospital-based aggregate reporting, Los Angeles County, CA, August 9, 2009 – April 17, 2010.
0
2
4
6
8
10
12
14
16
9-Aug
-09
16-A
ug-0
9
23-A
ug-0
9
30-A
ug-0
9
6-Sep
-09
13-S
ep-0
9
20-S
ep-0
9
27-S
ep-0
9
4-Oct-
09
11-O
ct-09
18-O
ct-09
25-O
ct-09
1-Nov
-09
8-Nov
-09
15-N
ov-0
9
22-N
ov-0
9
29-N
ov-0
9
6-Dec
-09
13-D
ec-0
9
20-D
ec-0
9
27-D
ec-0
9
3-Ja
n-10
10-J
an-1
0
17-J
an-1
0
24-J
an-1
0
31-J
an-1
0
7-Feb
-10
14-F
eb-1
0
21-F
eb-1
0
28-F
eb-1
0
7-M
ar-1
0
14-M
ar-1
0
21-M
ar-1
0
28-M
ar-1
0
4-Apr
-10
11-A
pr-1
0
Week
Ho
spit
ali
zati
on
s p
er
1,00
0 h
osp
ital
bed
s
0
0.1
0.2
0.3
0.4
0.5
0.6
0.7
De
ath
s p
er 1
,00
0 h
osp
ita
l b
eds
Hospitalization rateCase-fatality rate

Aggregate Influenza Reporting
Page 29
Acute Communicable Disease Control 2009 Special Studies Report
Analysis by age found that children <1 year-old had much higher hospitalization rates throughout the surveillance period (Figure 2) and the second highest case-fatality rate (Figure 3). Compared to older age groups, children aged 1-4 years had higher hospitalization rates but had the lowest case-fatality rate of all age groups (Figures 2 and 3). Despite hospitalization rates, number of hospitalizations was greatest among people aged 5-49 years-old (Figure 3). Figure 2. Age-specific rates of laboratory-confirmed influenza hospitalizations from hospital-based aggregate reporting (N=1,979), August 9, 2009 – April 17, 2010, Los Angeles County, CA. Children less than five years old had the highest rates of hospitalization.
0
50
100
150
200
250
300
350
8/9/
2009
8/23
/200
9
9/6/
2009
9/20
/200
9
10/4
/200
9
10/1
8/20
09
11/1
/200
9
11/1
5/20
09
11/2
9/20
09
12/1
3/20
09
12/2
7/20
09
1/10
/201
0
1/24
/201
0
2/7/
2010
2/21
/201
0
3/7/
2010
3/21
/201
0
4/4/
2010
Week
Ho
spit
aliz
atio
ns
per
mill
ion
po
pu
lati
on
<1 year
1-4 years
5-64 years
≥65 years
Figure 3. Age-specific rates of laboratory-confirmed influenza hospitalizations and deaths from hospital-based aggregate reporting (N=1,979), August 9, 2009 – April 17, 2010, Los Angeles County, CA. Age group 25-49 years had the lowest hospitalization rate (147.8 influenza hospitalizations per million population) and age groups 50-64 years and <1 year had the highest case-fatality rates (15.7 and 14.6 deaths per million population, respectively). Age group 5-24 years had the most influenza hospitalizations.
0
200
400
600
800
1000
1200
1400
1600
<1 (n=203) 1-4 (n=184) 5-24 (n=552) 25-49 (n=527) 50-64 (n=346) ≥65 (n=176)
Age group (years)
Ho
spit
aliz
atio
ns
per
millio
n p
op
ula
tio
n
0.0
5.0
10.0
15.0
20.0
25.0
Dea
ths
per
millio
n p
op
ula
tio
n
Hospitalization rate Mortality rate

Aggregate Influenza Reporting Page 30
Acute Communicable Disease Control 2009 Special Studies Report
Differences between the data reported to CDPH, which represents the initial reports without de-duplication or correction of designated reporting week, and the data used by LAC, which represents updated data after HOU investigations, were greatest during the rise of influenza cases that started in September (the weeks of September 6 – October 11), the week after the peak occurred (November 8), and on the week of November 29, 2009 (Figure 4). The LA County method of allowing corrections and updating by reporting hospital IPs provided a more accurate measurement of the influenza outbreak. From September 6 to October 11, the LA County method showed consecutively greater numbers of 12, 13, 20, 20, 34, and 41 (32-100%) more hospitalizations than initially reported. For the week of November 8, following the influenza peak, the LA County method found 22 (12%) more hospitalized cases. For the week of November 29, the LA County method had 39 less cases than initially reported. A possible explanation for this is the rise in influenza cases presented in the November 2nd summary report to the IPs. After the summary report, previously non-reporting hospitals started reporting and some submitted data for multiple weeks. Providing greater flexibility for IPs, the LA County method found 99 (5.3%) more cases of laboratory-confirmed hospitalized influenza. Figure 4. Numbers of laboratory-confirmed hospitalized influenza cases from hospital-based aggregate reporting by method of reporting: California State method which lacks de-duplication or corrections (N=1,880) versus Los Angeles County method which allows for updating and corrections (N=1,979), Los Angeles County, CA, August 9, 2009 – April 17, 2010.
0
25
50
75
100
125
150
175
200
225
250
275
300
325
8/9/
09
8/23
/09
9/6/
09
9/20
/09
10/4
/09
10/1
8/09
11/1
/09
11/1
5/09
11/2
9/09
12/1
3/09
12/2
7/09
1/10
/10
1/24
/10
2/7/
10
2/21
/10
3/7/
10
3/21
/10
4/4/
10
Week
Nu
mb
er h
os
pit
aliz
ed
LA County method
CA State Method

Aggregate Influenza Reporting
Page 31
Acute Communicable Disease Control 2009 Special Studies Report
Figure 5. Similar epi-curves for number of pandemic H1N1 influenza Intensive Care Unit (ICU) admissions and deaths from individual case reporting (N=308) and for number of hospitalizations and deaths of all types of laboratory confirmed influenza cases from hospital-based aggregate reporting (N=2067), August 9, 2009 – April 17, 2010, Los Angeles County, CA.
0
5
10
15
20
25
30
35
40
9-Aug
-09
16-A
ug-0
9
23-A
ug-0
9
30-A
ug-0
9
6-Sep
-09
13-S
ep-0
9
20-S
ep-0
9
27-S
ep-0
9
4-Oct-
09
11-O
ct-09
18-O
ct-09
25-O
ct-09
1-Nov
-09
8-Nov
-09
15-N
ov-0
9
22-N
ov-0
9
29-N
ov-0
9
6-Dec
-09
13-D
ec-0
9
20-D
ec-0
9
27-D
ec-0
9
3-Ja
n-10
10-J
an-1
0
17-J
an-1
0
24-J
an-1
0
31-J
an-1
0
7-Feb
-10
14-F
eb-1
0
21-F
eb-1
0
28-F
eb-1
0
7-M
ar-1
0
14-M
ar-1
0
21-M
ar-1
0
28-M
ar-1
0
4-Apr
-10
11-A
pr-1
0
Week
Nu
mb
er
by
ind
ivid
ua
l c
ase
rep
ort
s
0
50
100
150
200
250
300
350
Nu
mb
er b
y a
gg
reg
ate
rep
ort
ing
H1N1 influenza ICU admissions and deaths(Individual)
All influenza hospitalizations and deaths(Aggregate)
DISCUSSION ACDC successfully developed a hospital-based aggregate reporting system and conducted population-based active surveillance of influenza during the H1N1 influenza pandemic of 2009-2010. The most important key to the success of this surveillance was its acceptance by the IPs. Understanding their concerns from the first attempt in aggregate reporting and making a clear methodology for IPs and LAC DPH staff to follow helped establish a sustainable high participation percentage of 65%-77% of all 94 non-federal hospitals in LAC DPH jurisdiction on a weekly basis. Other marks of success of the aggregate reporting system include specificity, sensitivity, accuracy, and adaptability of the surveillance system. In July 2009, CDC gave surveillance options of influenza-like illness or laboratory-confirmed influenza. Having chosen the latter, ACDC prevented the inclusion of other respiratory diseases in their surveillance and afforded greater specificity. While the epi-curves for influenza hospitalizations were similar between the CDPH method and the LAC method (Figure 4), the LAC method found 5.3% more hospitalizations and provided greater sensitivity, particularly during the increase of cases in September and October and during the week after the peak. There is no gold standard to measure the accuracy of the aggregate reporting surveillance system. However, based on data from the ACDC HARI Unit, the epi-curve for H1N1 influenza deaths and ICU admissions from individual case reporting is similar to that of all influenza hospitalizations and deaths from aggregate reporting (Figure 5). Finally, after the surveillance methodology was established, a weekly report for the Disaster Operations Center was imposed in the fall of 2009. Adaptations to meet this demand involved including more staff and minor changes to the protocol. Aggregate reporting for communicable disease involving so many hospitals and such a large population of approximately 10 million was an unfamiliar and most likely untried idea before August 2009. Much of the concern for CDC and CDPH involved what data elements to obtain. In the second attempt to make

Aggregate Influenza Reporting Page 32
Acute Communicable Disease Control 2009 Special Studies Report
the system work, ACDC actually dropped data elements requested by CDPH and CDC and focused on making an easy, streamlined process that would be minimally burdensome on IPs. In addition, ACDC put as much emphasis in analysis procedures so that updating, correcting initial reports, and quickly presenting weekly summaries would be possible and more accurate in measuring influenza morbidity and mortality. ACDC insisted on defining Sunday to Saturday reporting weeks as opposed to Tuesday to Tuesday weeks proposed by CDPH. As CDPH requested weekly counts of hospitalizations by noon on Wednesdays, the Sunday-to-Saturday week allowed some time to correct duplication and mistakes on reports submitted before Tuesday. After August 2009, ACDC was contacted by CDPH and individuals at different county health departments in California to describe and consult on influenza aggregate reporting. The influenza aggregate reporting system stopped on April 17, 2010 as the number of hospitalizations and deaths had continually been low since last January 2010 and the H1N1 pandemic emerged in April 2009. To monitor for resurgence in 2010-2011, ACDC may implement a hospital-based aggregate reporting surveillance system using sentinel hospitals that consistently reported, had the highest numbers of hospitalizations and deaths of laboratory-confirmed influenza, and represent a relatively wider geographic area of LAC.

Hospitalizations due to Pandemic Influenza
Page 33
Acute Communicable Disease Control 2009 Special Studies Report
CHARACTERIZATION OF HOSPITALIZED PANDEMIC H1N1 2009 INFLUENZA CASES, LOS ANGELES COUNTY, APRIL 24, 2009 – AUGUST 3, 2009
Melissa Higdon, MPH; Ashley Peterson, MPH
BACKGROUND The influenza virus is an enveloped RNA virus that spreads easily from person to person via respiratory droplet secretions.1 It causes an acute viral illness characterized by fever, muscle and joint pain, malaise, sore throat and runny nose.2 Severe outcomes, including pneumonia, secondary bacterial infections and death, occur predominantly in children under age 2, adults over age 65, persons with chronic heart, lung, kidney, liver or metabolic disorders, or weakened immune systems.2 The virus circulates throughout the world with seasonal increases during winter months; in Los Angeles County, flu season is typically between October and April with activity peaking around February.3 Prior to April 2009, only severe pediatric cases of influenza were reportable to the local public health department. In April of 2009, reports from Mexico indicated the emergence of a novel influenza virus strain causing severe morbidity and mortality.4 Two weeks later, the first two cases of pandemic influenza were identified in California5 and, at the end of April, the US Secretary of the Department of Health and Human Services declared an emergency. At that time, the Los Angeles County (LAC) Department of Public Health (DPH) moved into Incident Command Structure to respond to the potential pandemic. Seasonal influenza surveillance systems were enhanced, new influenza case definitions were developed and influenza reporting requirements were amended to include reporting of all hospitalized patients with influenza or patients who died of influenza. This report summarizes hospitalized/deceased pandemic H1N1influenza (pH1N1) cases with symptom onset between April 24, 2009, when the reporting requirements went into effect, and August 3, 2009, after which time only ICU cases or deaths were individually reportable. These cases represent a novel cohort of patients seeking care for influenza far outside the regular influenza season and during the early stages of a pandemic; their disease severity and utilization of health care resources are instructive in assessing the response of the public health system with respect to case surveillance and detection and in planning for future pandemic events. METHODS A case was defined as any person who died or was hospitalized with influenza-like-illness who either had a positive influenza A test which was not subtypeable or who had a confirmed positive test for pH1N1 with onset between April 24, 2009 and August 3, 2009. Cases were reported to LAC DPH Acute Communicable Disease Control Program by hospital infection preventionists, by the Public Health Laboratory, by the Office of the Coroner, and by other local health departments. Once reported, data were abstracted from case medical records using the LAC case report form.

Hospitalizations due to Pandemic Influenza Page 34
Acute Communicable Disease Control 2009 Special Studies Report
All case data were stored in a Microsoft® Office Access 2003 database and summarized and analyzed using SAS v9.2. RESULTS From detection of the first case of pH1N1 in LAC on April, 24, 2009 until August 3, 2009, 238 pH1N1 hospitalized/deceased cases were reported to LAC DPH (see Figure 1). Of the 234 hospitalized cases, 75 were hospitalized in the ICU. Outcomes were available for 200 (84%) of the reported cases. One hundred and fifty-eight of reported cases recovered while 42 died. Thirty-eight of the 42 deaths (90.5%) had been hospitalized in the ICU prior to death. Of cases hospitalized in the ICU with known outcomes, 38 (50.7%) died while 20 (26.7%) recovered. Four cases died without having been hospitalized prior to death (Figure 1). The overall rate of hospitalization due to pH1N1 during this time period was 2.44 per 100,000. Age The age of hospitalized cases ranged from 0-84 years with a median of 21.5 years. The age of fatal cases ranged from 0-62 with a median of 38.5 years. Persons aged less than 25 years (especially those aged 0-4 years) were overrepresented among cases when compared to the population distribution of LAC (Table 1). Persons aged 25 years and older (especially those aged 65 years and older) were underrepresented among cases (Table 1). The rate of hospitalization was highest in the 0-4 age group at 8.5 per 100,000 and lowest in persons aged 65 and older at 0.49 per 100,000 (Figure 2). The death rate due to H1N1 was highest among persons aged 50-64 years at 0.8 per 100,000 and lowest among persons aged 65 years and older in which group there were no deaths (Figure 2). Race Latinos constitute 47.9% of the population of LAC, however, they comprise 63.6% of cases. While Latinos were overrepresented among cases, Asians and whites were underrepresented (Table 1). The highest rate of hospitalization was seen among Latinos followed by blacks and then whites. Asians had the lowest rate of hospitalization (Figure 3).
Table 1: Characteristics of Hospitalized pH1N1 Cases Los Angeles County, 04/23/2009 - 08/06/2009
Number % of Cases % of LAC*
Age Group 0-4 60 25.2 7.2 5-24 75 31.5 29.5 25-49 68 28.6 37.1 50-64 30 12.6 15.8 65+ 5 2.1 10.4 Race Asian 10 4.9 13.3 Black 18 8.7 8.8 Latino 131 63.6 47.9 White 40 19.4 29.8 Other 7 3.4 0.3 Gender Male 125 52.7 49.6
Female 112 47.3 50.4
*The % of the population of LAC in specified demographic group
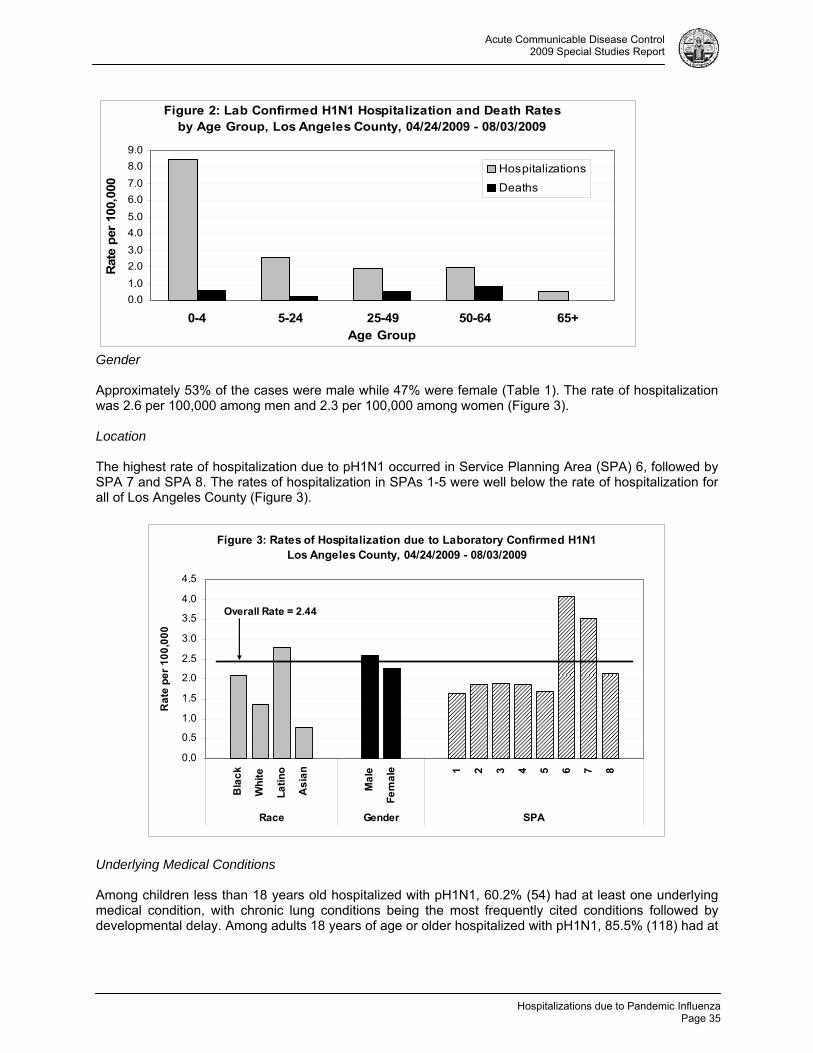
Hospitalizations due to Pandemic Influenza
Page 35
Acute Communicable Disease Control 2009 Special Studies Report
Figure 2: Lab Confirmed H1N1 Hospitalization and Death Rates by Age Group, Los Angeles County, 04/24/2009 - 08/03/2009
0.0
1.0
2.0
3.0
4.0
5.0
6.0
7.0
8.0
9.0
0-4 5-24 25-49 50-64 65+Age Group
Rat
e p
er 1
00,0
00
Hospitalizations
Deaths
Gender Approximately 53% of the cases were male while 47% were female (Table 1). The rate of hospitalization was 2.6 per 100,000 among men and 2.3 per 100,000 among women (Figure 3). Location The highest rate of hospitalization due to pH1N1 occurred in Service Planning Area (SPA) 6, followed by SPA 7 and SPA 8. The rates of hospitalization in SPAs 1-5 were well below the rate of hospitalization for all of Los Angeles County (Figure 3).
Figure 3: Rates of Hospitalization due to Laboratory Confirmed H1N1 Los Angeles County, 04/24/2009 - 08/03/2009
0.0
0.5
1.0
1.5
2.0
2.5
3.0
3.5
4.0
4.5
Bla
ck
Wh
ite
La
tin
o
As
ian
Ma
le
Fe
ma
le 1 2 3 4 5 6 7 8
Race Gender SPA
Ra
te p
er
10
0,0
00
Overall Rate = 2.44
Underlying Medical Conditions Among children less than 18 years old hospitalized with pH1N1, 60.2% (54) had at least one underlying medical condition, with chronic lung conditions being the most frequently cited conditions followed by developmental delay. Among adults 18 years of age or older hospitalized with pH1N1, 85.5% (118) had at

Hospitalizations due to Pandemic Influenza Page 36
Acute Communicable Disease Control 2009 Special Studies Report
least one underlying condition with obesity (body mass index ≥30) being the most frequently cited condition followed by metabolic disorders, pregnancy, and chronic lung and cardiac conditions (Table 2).
DISCUSSION Unlike seasonal influenza which disproportionately causes serious disease in the elderly and young children3, pH1N1 influenza predominantly affected children of all ages and young adults. Approximately 57% of hospitalized pH1N1 cases were younger than 25 years. The hospitalization rate among children aged 0-4 years was 17.3 times higher than that among persons aged 65 years and older. However, the death rate in this age group was comparable to other age groups. While these differences could be due to true differences in susceptibility to pH1N1, it is likely that children under the age of 5 may have been admitted to the hospital more readily than older cases or that older cases may have delayed seeking care until illness was severe. These differences in treatment and care seeking behavior could have led to selection bias resulting in higher numbers of pediatric hospitalizations and adult deaths. The pH1N1 hospitalization rate was highest for Latinos and lowest for Asians. While the rates in Figure 3 are not age-adjusted due to small numbers, analysis of more robust data on pH1N1 ICU admissions and deaths reveals little difference between un-age-adjusted and age-adjusted rates for all races. The differences in rates by race could be explained by several factors including differences in access to health care, treatment-seeking behavior, cultural and social behavior, knowledge of respiratory disease prevention, and prevalence of underlying medical conditions. SPAs 6 and 7 had substantially higher rates of hospitalization due to pH1N1 compared to other SPAs. These two SPAs have the highest percentage of Latinos of all the SPAs in LAC. Latinos make up 63.7% of the population of SPA 6 and 70.5% of the population of SPA 7. SPAs 1 and 5 where pH1N1 hospitalization rates were lowest have the lowest percentage of Latinos of all SPAs (18.1% and 17.5% respectively). The high rates in SPAs 6 and 7 were most likely due to the high proportion of Latinos residing there. However differential testing or reporting practices by hospitals may have played a role if hospitals in certain SPAs were more or less likely to obtain specific influenza testing or to report cases. Underlying medical conditions were a significant factor in both child and adult hospitalized cases of pH1N1. Of all children under 18 years old for which past medical history was known, 54 (60.2%) had a past medical history. The most frequently cited risk factors for hospitalization among patients under the age of 18 years were chronic lung conditions (including asthma, chronic lung disease, and cystic fibrosis) and developmental disability (including neuromuscular disorders, mental retardation, and seizure disorders). Of 138 patients aged 18 years and older for which past medical history was known, 118 (85.5%) had some kind of underlying condition. The most frequently cited underlying condition for adults was obesity. While 22.2% of LAC adults are obese, 42.5% of hospitalized pH1N1 cases with height and weight information were obese. Seventeen (31.5%) of the 54 obese adult patients had obesity as the only underlying medical condition while thirty-six (67%) had at least one additional concurrent medical
Table 2: Underlying Medical Conditions of Hospitalized pH1N1 Cases 04/24/2009 - 08/03/2009
<18 years (n=93) ≥18 years (n=139)
Underlying Condition N* # %** N* # %**
Cardiac condition 92 7 7.6 136 27 19.9 Chronic lung condition 92 33 35.9 137 31 22.6 Metabolic disorder 93 9 9.7 136 36 26.5 Developmental delay 93 22 23.7 136 8 5.9 Immunosuppression 93 6 6.7 135 15 11.1 Pregnancy† 5 1 20.0 88 23 26.1 Obesity 34± 2 5.9 127 54 42.5 *Denominator includes those cases for which information on that underlying condition was available. **As patients may have more than one medical condition, percentages may total over 100%. †Denominator includes females of childbearing age only (15-44 years). ‡ Denominator includes only children aged 2-17 years.

Hospitalizations due to Pandemic Influenza
Page 37
Acute Communicable Disease Control 2009 Special Studies Report
condition. (Information on additional underlying conditions was not available for one obese case). This raises the question whether obesity in and of itself is a significant risk factor for complications from pH1N1 infection.Metabolic disorders, pregnancy, chronic lung conditions, and cardiac conditions were also prominent risk factors for adults. Chronic lung conditions were present in both children and adults suggesting compromised lungs are a risk factor for more severe infection with pH1N1 at any age. Obesity was the most common underlying condition present in adults but the least common in children suggesting that adult obesity may indicate greater risk for more severe infection with pH1N1. However, obesity data were missing from a large proportion of child cases. Obesity data may be reported less frequently for children indicating a gap in knowledge for this potential risk group. Among women of child bearing age (15-44 years), pregnancy was a frequent underlying condition for both children (15-17 years) and adults (18 years and older) in hospitalized cases. Others have reported on a high morbidity of pH1N1 in pregnancy6 and this is consistent with published literature which indicates pregnant women experience significant morbidity from influenza and so should be an important target group for prevention and vaccination.7 CONCLUSION We present 238 hospitalized cases of pandemic H1N1 2009 influenza reported between symptom onset of the first case detected in Los Angeles County on April 24, 2009 and when hospitalized cases were no longer reportable on August 3, 2009. Hospitalized cases appeared to be younger than cases of seasonal influenza while death rates across all age groups were comparable. Latinos were disproportionately affected with the largest proportion of cases and highest rates with blacks having the second highest rates. The geographic distribution of cases appeared to follow racial distributions within LAC which has implications for resource distribution and health care utilization patterns, however, differences in reporting of cases between areas of LAC may have affected this observation. Presence of an underlying health condition was an important factor in disease severity in both child and adult hospitalized cases. Presence of obesity, various chronic lung conditions, metabolic disorders and cardiac conditions in adults, presence of chronic lung conditions and developmental delay in children, and pregnancy in women of childbearing age should all be considered when evaluating a case of pH1N1 as they are predictors of a more severe outcome. REFERENCES 1. CDC. Seasonal influenza information on spread of virus. Available at:
http://www.cdc.gov/flu/about/disease/spread.htm. 2. CDC. Seasonal influenza information on symptoms and severity of illness. Available at:
http://www.cdc.gov/flu/about/disease/symptoms.htm. 3. CDC. Seasonal influenza information on seasonality of the infection. Available at:
http://www.cdc.gov/flu/about/season/flu-season.htm. 4. CDC. Outbreak of Swine-Origin Influenza A (H1N1) Virus Infection --- Mexico, March—April 2009.
MMWR 2009;58(17);467-470. 5. CDC. Swine Influenza A (H1N1) Infection in Two Children---Southern California, March—April 2009.
MMWR 2009;58:400—2. 6. Louie JK, et. al. Severe 2009 H1N1 Influenza in Pregnant and Postpartum Women in California. N
Engl J Med 362:27. 7. CDC. Prevention and Control of Influenza. Recommendations of the Advisory Committee on
Immunization Practices (ACIP), 2008. MMWR 2008;57 (RR07);1-60. RESOURCES Thompson, W. et. al. Influenza-Associated Hospitalizations in the United States. JAMA. 2004;292:133-1340. CDC. Update: Influenza Activity --- United States, April – August 2009. MMWR 2009; 58(36): 1009-1012. Los Angeles County Acute Communicable Disease Control Influenza Watch Publications http://publichealth.lacounty.gov/acd/FluSurveillance.htm.

Hospitalizations due to Pandemic Influenza Page 38
Acute Communicable Disease Control 2009 Special Studies Report

Pre-Symptomatic Healthcare Worker Transmission
Page 39
Acute Communicable Disease Control 2009 Special Studies Report
PRE-SYMPTOMATIC HEALTHCARE WORKER TRANSMISSION OF PANDEMIC (H1N1) 2009 INFLUENZA IN ACUTE CARE SETTINGS
LOS ANGELES, CALIFORNIA, 2009
Patricia Marquez, MPH; Dawn Terashita, MD, MPH; L’Tanya English, RN, MPH BACKGROUND Nosocomial transmission of seasonal influenza resulting in outbreaks in healthcare settings has been previously documented in the literature [1]. Asymptomatic or pre-symptomatic transmission of influenza is not well understood [2]; however, it is believed to be possible and thus a concern in healthcare settings. Pandemic H1N1 influenza (pH1N1) was first seen in Los Angeles County in April of 2009. Los Angeles County (LAC) Department of Public Health (DPH) investigated outbreaks in two acute care facilities where it was hypothesized that influenza transmission occurred during the pre-symptomatic infectious period from a healthcare worker (HCW) to patients. Both outbreaks occurred in units with immunocompromised patients where HCWs are required to have higher skill competencies. In each situation, contact between a HCW and the index patient took place before the HCW’s symptom onset. According to the investigations, ill HCWs were not at their workplace while symptomatic. This report describes these two outbreaks, which occurred during a pandemic prior to vaccine availability. METHODS AND RESULTS Outbreak A The first influenza outbreak occurred in July 2009 on the hematology-oncology unit of facility A. The infection preventionist (IP) at the facility notified DPH of two cases of pH1N1 influenza on the same unit within five days of each other. A case was defined as a patient residing in the hematology-oncology unit who was positive for pH1N1 influenza via real-time reverse transcriptase polymerase chain reaction (rRT-PCR). Both cases were recently diagnosed leukemia patients who resided in adjacent rooms on the same unit and were admitted for chemotherapy treatment. Case 1 was admitted to the facility 27 days prior to symptom onset, and Case 2 was admitted seven days prior to symptom onset (Table 1). Interviews with facility staff revealed one symptomatic HCW (HCW 1) who had onset of influenza-like illness (ILI) the same day as Case 1. HCW 1 provided direct care to Case 1 for three days prior to Case 1 onset. Indirect contact occurred between both cases through the mother of Case 2, who had contact with the mother of Case 1 and would visit with Case 1 in their room while Case 1 was in isolation. Nursing staff believed the mother of Case 2 could be the source of transmission between Cases 1 and 2. No clinical information was available on the mother. Case 2 developed ILI five days after Case 1; HCW 1 did not have direct contact with Case 2. Neither case was exposed to any other known symptomatic or pre-symptomatic visitors or staff. Late in the investigation another case was identified, Case 0, who had been admitted to the facility with ILI seven days prior to the onset of illness in HCW 1. HCW 1 provided primary care to Case 0 for several days prior to HCW 1 symptom onset; HCW 1 could have contracted influenza from Case 0. HCW 1 was clinically diagnosed with influenza by an outside provider; no specimen was obtained for testing. No contact between HCW 1 and any patients occurred while HCW 1 was symptomatic. HCW 1 did not return to the workplace until symptoms resolved and completely treated with oseltamivir. Respiratory distress required all three case patients be transferred to the pediatric intensive care unit (PICU) for further care, where all were treated with oseltamivir. All cases subsequently expired in the PICU from complications of influenza.

Pre-Symptomatic Healthcare Worker Transmission Page 40
Acute Communicable Disease Control 2009 Special Studies Report
Table 1. Case Characteristics for Facility A Outbreak.
Case 0 Case 1 Case 2
Age 8 years 15 months 3 years
Underlying chronic condition
Chronic Langerhans histiocytosis
Down syndrome/ Acute myelogenous leukemia
Down syndrome/ Acute myelogenous
leukemia Admission diagnosis
Fever/neutropenia Chemotherapy
treatment Chemotherapy
treatment Days in facility prior to onset
0 27 7
Symptoms:
Cough Yes Yes Yes
Fever Yes Yes Yes
Respiratory distress
Yes Yes Yes
Diarrhea Yes Yes Yes
Vomiting No Yes No
Outbreak B A second H1N1 influenza outbreak was investigated in October 2009 in the neonatal intensive care unit (NICU) of facility B. The IP notified DPH of one infant symptomatic with ILI and two infants with non-specific symptoms, all in the NICU within a 24 hour period (Table 2). Two infants were rRT-PCR positive for pH1N1, the third was antigen positive for influenza A. A case was defined as a patient residing in the NICU who was positive for pH1N1 via rRT-PCR. Facility B has a strictly enforced visitor policy excluding sick visitors from the NICU; there were no known ill visitors. Prior to the outbreak, roll calls to assess HCWs for ILI were implemented in the NICU and maternity unit. Interviews with NICU staff revealed four HCWs who cared for the three cases who subsequently became ill. The index HCW (HCW 1) cared for index Case 1 and Case 2 during the two days prior to onset of ILI. This HCW experienced a mildly achy prodrome at the end of the shift on the second day and did not return to work the next day. She reported having fever during the course of illness.
Table 2. Case Characteristics for Facility B Outbreak.
Case 1 Case 2 Case 3
Gestational age (weeks)* 37 27 32
APGAR scoreº 7, 8, N/A 5, 6, 9 8, 9, N/A
Underlying medical condition Gastroschisis Respiratory
distress Respiratory distress
Ventilator dependent Yes Yes Yes
Days in NICU prior to onset 148 125 44
Symptoms:
Cough No Yes No
Fever Yes No No
Increased secretions No Yes Yes
Vomiting Yes No Yes
Poor feeding Yes Yes Yes
ºAt one, five and ten minutes

Pre-Symptomatic Healthcare Worker Transmission
Page 41
Acute Communicable Disease Control 2009 Special Studies Report
HCWs 2, 3, and 4, became symptomatic with ILI within 1-2 days after HCW 1. HCW 2 provided care to Case 1 and 2 while pre-symptomatic; HCWs 3 and 4 provided care to Case 3 while pre-symptomatic. No HCWs cared for patients while symptomatic. None of the ill HCWs was tested for influenza by facility B or their primary medical doctors. All infants and healthcare workers recovered from their illness. DISCUSSION Vaccination continues to be the primary method to prevent influenza infection and transmission each season [3]. Exposure of HCWs to ill patients, as well as the exposure of vulnerable patients to ill HCWs, is an occupational hazard that can be greatly reduced via influenza vaccination each season [4]. Despite this, seasonal influenza vaccination rates among HCWs remain below 40% worldwide [4]. The ability to transmit influenza to others while pre-symptomatic or asymptomatic may contribute to viral transmission in healthcare settings. As many as 50% of individuals have asymptomatic influenza infection or have mild symptoms; studies have shown approximately 20% of unvaccinated adults have serological evidence of infection each winter [5]. In addition, HCWs are apt to work while symptomatic, becoming a potential source of infection for patients and coworkers [3]. Influenza vaccination also prevents workplace disruption and staffing issues by limiting the number of HCWs out of work due to illness [6]. The beneficial effects of HCW vaccination on patient morbidity and mortality have a larger effect when the employee vaccination rate in facilities exceeds 50% [5]. The Centers for Disease Control and Prevention recommends a target rate for HCW compliance with vaccination of 80% [7]. Increased numbers of vaccinated HCWs contribute to herd immunity that protects unvaccinated HCWs and vulnerable high risk individuals treated in healthcare settings.
California enacted legislation in 2007 that requires all general acute care hospitals to provide on-site influenza vaccination to employees at no cost to the employees. It also requires reporting of the numbers employees vaccinated as well as the number of documented vaccination declinations. During the pandemic this regulation was interpreted to cover the new H1N1 vaccine. Unfortunately, the H1N1 vaccine was not available at the time of these outbreaks. Neither investigation showed any significant lapses in infection control. Both outbreaks demonstrate the possible transmission of influenza from pre-symptomatic HCWs and highlight that enhanced respiratory and hand hygiene is critical for HCWs in high-risk patient settings, especially during a pandemic in the absence of an effective vaccine. REFERENCES 1. Voirin N, Barret B, Metger MH. Hospital-acquired influenza: a synthesis using the Outbreak Reports
and Intervention Studies of Nosocomial Infection (ORION) statement. J Hosp Infect. 2009;71(1):1-14. 2. Patrozou E, Mermel LA. Does influenza transmission occur from asymptomatic infection or prior to
symptom onset? Public health reports. 2009;124(2):193-196. 3. Poland GA, Tosh P, Jacobson RM. Requiring influenza vaccination for healthcare workers: seven
truths we must accept. Vaccine. 2005;23(17-18):2251-2155. 4. McLennan S, Gillett G, Celi LA. Healer, health thyself: Healthcare workers and the influenza
vaccination. Am J Infect Control. 2008;36:1-4. 5. Stott DJ, Kerr G, Carman WF. Nosocomial transmission of influenza. Occup Med. 2002;52(5):249-
253. 6. Centers for Disease Control and Prevention. Immunization of Health-Care Workers:
recommendations of the Advisory Committee on Immunization Practices (ACIP) and the Hospital Infection Control Practices Advisory Committee (HICPAC). MMWR 1997;46(No. RR-18):16.
7. Salgado CD, Giannetta ET, Hayden FG, Farr BM. Preventing Nosocomial Influenza by Improving the Vaccine Acceptance Rate of Clinicians. Infec Control Hosp Epidemiol. 2004;25(11):923-928.

Pre-Symptomatic Healthcare Worker Transmission Page 42
Acute Communicable Disease Control 2009 Special Studies Report

LAIV Survey Summary
Page 43
Acute Communicable Disease Control 2009 Special Studies Report
RAPID ASSESSMENT OF PUBLIC KNOWLEDGE AND ATTITUDES ABOUT LIVE ATTENUATED INFLUENZA VACCINE (LAIV) AT MASS H1N1 INFLUENZA
VACCINATION CLINICS
Caitlin Reed, MD, MPH; Amy Lightstone, MPH; Susie Baldwin, MD, MPH; David Dassey, MD, MPH; Laurene Mascola, MD, MPH
BACKGROUND At Los Angeles County (LAC) Department of Public Health (DPH) pandemic H1N1 vaccination clinics in 2009, uptake of nasally-administered live attenuated influenza vaccine (LAIV) was lower than expected. At the first mass H1N1 vaccination clinics (aka Point of Dispensing clinics, PODs) 77% of the available injected monovalent vaccine (IMV) doses were used, in comparison of only 31% of LAIV. LAIV production may be more rapid and may produced higher yields compared with IMV, resulting in greater LAIV availability early in pandemics. A rapid assessment was performed to determine why LAIV uptake was low in the setting of an overall H1N1 vaccine shortage, and what interventions might improve LAIV uptake. Initially, LACDPH H1N1 vaccination clinics were targeted at persons in the following five priority groups:
1. children and young adults aged 6 months to 24 years 2. pregnant women 3. caregivers of infants aged <6 months 4. persons aged 25-64 years with chronic medical conditions 5. health care workers.
Certain of these groups have contraindications to receiving LAIV, including persons aged <2 years and >49 years, pregnant women, and persons with chronic medical conditions such as asthma, diabetes, and HIV. For this reason, children ages < 2 years in group 1 and all persons in groups 2 and 4 were offered only injected vaccine. However, persons in LAC DPH vaccine clinic priority groups 1 (except for children aged <2 years), 3, and 5 were eligible to be vaccinated with LAIV. Although these persons were eligible, poor uptake of LAIV was noted. The anecdotal impression of clinic staff was that parents and persons seeking to be vaccinated preferred IMV, even when eligible for LAIV. METHODS Formative Research LAC DPH Acute Communicable Disease Control Program (ACDC) conducted formative research by briefly interviewing persons standing in line at two mass H1N1 vaccination clinics regarding LAIV and IMV and observing the flow of patients through the vaccine clinic. 1) Several themes emerged from these interviews:
o some people had never heard of the nasal spray live attenuated influenza vaccine (LAIV), o many people had heard of LAIV, but most did not know much about it, o some knew that the nasal spray was a live virus and the injection (flu shot) was inactivated virus,
but did not know what the significance of live versus dead virus was, o common misperceptions among those who knew about LAIV were that 1) it doesn't work as well
as the flu shot 2) it is only for children and 3) that because it is a live virus it could possibly make you sick,
o another common concern was that live virus shedding from LAIV could make others sick o people felt more comfortable with the familiar injectable flu shot o some people preferred LAIV if they had the choice because they are afraid of needles o other people preferred a flu shot because they don't like having things sprayed in their nose

LAIV Survey Summary Page 44
Acute Communicable Disease Control 2009 Special Studies Report
2) Observations of patient flow through H1N1 clinics Observations noted busy clerical staff at the outdoor check-in tables with multiple demands on their attention. In this setting, there were some errors made in determining which persons should be offered LAIV. For example, a registration worker thought that children > 2 years old who are in childcare should not receive LAIV because of a possible risk of transmission of vaccine virus to other children at the childcare center. Clinical personnel were stationed inside the hall and were unable to observe these types of screening decisions occurring at the outdoor registration area. Both clinical and clerical personnel stated that although they had completed training modules, the guidelines for LAIV eligibility were confusing, particularly since persons eligible for LAIV were only a subset of the priority groups for influenza vaccination. Survey A survey was designed to assess public knowledge and attitudes toward LAIV, in collaboration with colleagues at the LAC DPH Health Assessment Unit. The following data were collected: basic demographic information, including age, sex, race/ethnicity, educational level, language group, household size and income, usual source of H1N1 vaccine information, most trusted source of vaccine information, and a series of true/false and yes/no knowledge and attitude questions about LAIV and IM vaccine (see Figure 1).
Figure 1. Knowledge and Attitude Questions from Survey
True-False Questions The H1N1 vaccine is available in a nasal spray (True/False/Don’t Know) The H1N1 nasal spray vaccine: (True/False/Don’t Know for each prompt)
- contains live weakened virus - is OK for everyone to get - is as good as the shot in preventing flu - could give me the flu - could make my friends or family get the flu
Yes or No Questions I am more comfortable getting vaccines in the form a shot than a nasal spray I am afraid of live vaccines I am afraid of shots I do not like having something sprayed in my nose Vaccine Preference Question If I could choose which type of H1N1 vaccine to get, I would choose the (choose one): Nasal spray/Shot/Whatever the doctor recommends/Don’t know The survey was conducted as a convenience sample (N=326) in English and Spanish of persons aged ≥18 years at four mass H1N1 vaccination clinics from November 11-14, 2009. People waiting in line to be vaccinated were given a paper-and-pencil survey prior to reaching the registration tables at the front of the line, where surveys were collected. Low LAIV knowledge scores was defined as two or fewer correct answers to four true/false questions (mean correct: 2.3 ± 1.4; median: 2). Chi-square was used to compare knowledge by age, sex, race, and education.

LAIV Survey Summary
Page 45
Acute Communicable Disease Control 2009 Special Studies Report
RESULTS Demographics A slight majority of respondents (54%) were female. Age distribution was fairly even (see Table 1) among persons aged <65 years. Educational levels in the surveyed group included elementary school only (6%), some high school (9%), high school graduate (18%), some college (24%), college graduate (28%), and advanced degrees (15%). A wide range of income levels were also represented, with 33% reporting < $25,000 in total household income, while 25% reported > $100,000. Fifty-eight percent of respondents were born in the United States. English was the primary home language in 66% of households, Spanish in 24%, and other languages 6%.
Table 1. Demographics of survey respondents (N=326)
No. respondents
%
Sex 318 Male 147 46 Female 171 54
Age (years) 326 18–29 51 16 30–39 87 27 40–49 87 27 50–65 82 25 > 65 19 6
Education 323 Elementary school 18 6 Some high school 30 9 High school graduate 59 18 Some college 77 24 College graduate 90 28 Advanced degree 49 15
Total Household income 297 < $25,000 100 34 $25,000-$50,000 61 21 $50,000-$100,000 61 21 > $100,000 75 25
US born Yes 185 57 No 138 43
Primary language at home 313 English 206 66 Spanish 75 24 Other 30 10
The racial/ethnic distribution of respondents is shown in Table 2. There were more Asians represented in this survey and among POD attendees, and fewer Hispanic survey respondents and POD attendees, than in LAC as a whole. Blacks were better represented in the survey (11%) than their overall attendance at the PODs (3%). Whites were overrepresented in the survey (34%) compared with their POD attendance (19%) or proportion of the LAC population.

LAIV Survey Summary Page 46
Acute Communicable Disease Control 2009 Special Studies Report
Table 2. Distribution of race/ethnicity in survey respondents compared with
overall POD attendees and LAC population overall Survey
(%) POD attendees†
(%) 2009 LAC population
estimate (%) Asian/Pacific Islander 23 30 10 Black 11 3 11 Hispanic 32 44 54 White 34 19 26 Other 1 2 <1 † as of 11/24/09, N=133,202
Knowledge and Vaccine Information Sources Of 326 respondents, 81% knew that H1N1 vaccine was available in a nasal spray, 50% that it contained live weakened virus, 49% that it was not indicated for everyone, and 54% that it was as effective in preventing influenza as injected vaccine. Persons with high school education or less were 3.1 (95% confidence interval [CI], 1.9–5.1) times more likely to have a low score than those with more education. Compared with whites, blacks were 6.2 (CI, 2.6–15.2) times and Hispanics 3.3 (CI, 1.9–5.8) times more likely to have a low score. Most blacks and Hispanics reported their primary vaccine information source was television (59% and 53%, respectively); whites reported relying more on the Internet (42%; P<.0001). Compared with whites, blacks were 9.5 (CI, 3.2–28.0) and Hispanics were 6.7 (CI, 2.8–15.5) times more likely to report television as their most trusted information source. Vaccine preferences The initial anecdotal reports of patient preference for IMV over LAIV were borne out by the survey responses. Figure 2. Response to the survey question “If I could choose which type of H1N1 vaccine to get, I would pick” (possible answers: nasal spray, shot, whatever the doctor recommends, don’t know).
Influenza Vaccine Preference Among Survey Respondents
0
10
20
30
40
50
60
Nasal spray Shot Whatever the doctorrecommends
Don't Know
Preferred Influenza Vaccine
% o
f S
urv
ey
Res
pondents

LAIV Survey Summary
Page 47
Acute Communicable Disease Control 2009 Special Studies Report
The majority of respondents preferred IMV (see Figure 2). More persons endorsed fear of live nasal spray vaccines (25%) than fear of injections (shots) (13%). Forty-one percent were unsure if LAIV “could give me the flu” and 63% reported “I am more comfortable with vaccines in the form of a shot than a nasal spray.” Persons who believed that LAIV could make them ill and those who reported feeling more comfortable with injected vaccines were more likely to prefer IMV (AOR=3.3, 95% CI=1.3–8.4 and AOR 15.1, 95% CI=6.5-35.5, respectively). After adjustment, age, sex, race, and education were not associated with preference for IMV. LIMITATIONS This survey was a convenience sample, not a demographically representative sample of all persons being served by LAC DPH mass H1N1 vaccination clinics. For practical reasons, the survey result could not link to individual information on whether the respondent was eligible to receive LAIV, or to which vaccine they ultimately received. However, the vaccine preference question was framed as “If I could choose”, to indicate a hypothetical choice. DISCUSSION Education level and racial/ethnic differences in knowledge about LAIV exist, although these did not emerge as the primary reasons driving the observed preference for IMV. The majority of patients attending a mass vaccination clinic preferred IMV to LAIV because of their comfort with injectable vaccines and uncertainty about whether LAIV could cause them to become ill with influenza. This suggests that an educational campaign aimed at the myth of LAIV reversion to virulence could be helpful in increasing uptake. Television was the most popular overall media information source, and physicians were the most trusted information source. This finding suggests that television coverage, particularly earned ‘free media’, could be of particular utility in communicating vaccine safety messages. Finally, shifting clinicians to the registration area to help with vaccine exclusion decisions, having LAIV inclusion and exclusion criteria printed on reference cards at the registration tables, and a switch to an ‘opt-out’ strategy to funnel medically eligible persons to LAIV could help to increase LAIV uptake. These findings might be applicable to future influenza vaccination campaigns.

LAIV Survey Summary Page 48
Acute Communicable Disease Control 2009 Special Studies Report

Syndromic Surveillance for Influenza Season 2009-2010
Page 49
Acute Communicable Disease Control 2009 Special Studies Report
USE OF SYNDROMIC SURVEILLANCE DURING THE 2009-2010 INFLUENZA SEASON IN LOS ANGELES COUNTY
Patricia Araki, MPH; Bessie Hwang, MD, MPH
In April of 2009, several media reports and notifications from neighboring health jurisdictions warned of the possible circulation of a novel strain of influenza near central Mexico and the Mexico/US border. Later that month, these suspicions were confirmed by the World Health Organization (WHO) as the first confirmed cases of Pandemic Influenza (H1N1). As a large metropolitan region in close proximity to the potential outbreak, the Los Angeles County (LAC) Department of Public Health (DPH) Automated Disease Surveillance Section (ADSS) of Acute Communicable Disease Control Program (ACDC) began conducting enhanced surveillance for Influenza-like illness (ILI) activity in LAC through its pre-existing syndromic surveillance and complementary systems. In addition to this, a daily ILI report was created to provide key public health stakeholders and Departmental Operations Center (DOC) staff with near real-time ILI-related analysis results, trend graphs and temporal-spatial statistics and maps. The LAC emergency department syndromic surveillance (EDSS) system analyzes data from approximately 60% of all emergency department (ED) visits throughout LAC. For every participating hospital, each ED visit is systematically classified into one of several syndrome categories based upon patient chief complaint. These include: rash, respiratory, gastrointestinal, neurological, and ILI. Each syndrome category is then tallied and compared to a threshold generated by the Centers for Disease Control and Prevention (CDC)-Early Aberration Reporting System (EARS) algorithm based upon the individual hospital’s previous data. During the period from April to May 2009, ILI- and fever- classified counts obtained from the syndromic surveillance system were utilized to produce overall and age-group stratified trend graphs for a daily ILI report which summarized and displayed analysis results from several surveillance systems (Figure 1).
Figure 1. Influenza-Like Illness (ILI) Daily Report

Syndromic Surveillance for Influenza Season 2009-2010 Page 50
Acute Communicable Disease Control 2009 Special Studies Report
Other data source results selected for the ILI report included information from SaTScan™, respiratory-classified nurse calls, respiratory-classified coroner’s deaths, respiratory-related 911-calls, and emergency department volume biosurveillance (total ED visits and total ICU admissions from the ED). Most results were generated by SAS® in Cary, North Carolina and presented in trend graph format, with the exception of the respiratory SaTScan™ cluster map. Data sources were selected based upon prior knowledge about the quality of information, timeliness and consistency of reporting, relevancy with respect to ILI early-event detection surveillance, and additional value gained by inclusion in the report. Since the pandemic was the first observed since the foundation of early-event detection surveillance in LAC, the circumstances served as an opportunity to assess the utility of each of the data sources utilized and presented in the report for inclusion in any future report related to ILI. For this assessment, retrospective evaluation of daily ILI reports from mid April through May 2009 was conducted. Each data source in the ILI report was retrospectively assessed for increasing trend from April through May, 2009, due to a known increase in confirmed cases of novel H1N1 influenza (H1N1) reported during this time period. From reviewing the reports, a sudden and significant increase in the proportion of total ED ILI visits (~8-10%) within the timeframe of a few days (Figure 2) is observed in combination with early signaling among EDSS fever-categorized visits during the same period (Figure 3), to suggest the possibility of an ILI outbreak in the community. Respiratory SaTScan™ cluster maps confirmed several clusters of local communities with significant respiratory activity during the analysis period (Figure 1). Age-stratified EDSS ILI data identified age categories in which the burden of illness was greatest (Figure 4), observing an increase in ILI ED visits among younger persons (<45 years old) and more specifically, those between the ages of 14-44 years old, with little to no difference in trend detected among those over 45 year old. Respiratory-classified nurse calls and total volume of ED visits biosurveillance data also confirmed increases in ILI-related encounters during the assessment period. In contrast, 911-calls and total ED-to-ICU transfers volume trend data remained static throughout the observation period and Coroner’s results were unreliable due to delayed data receipt. For future reports, these data sources may not be as useful an indicator for detecting ILI activity.
Figure 2. Total EDSS ILI-classified visits per day

Syndromic Surveillance for Influenza Season 2009-2010
Page 51
Acute Communicable Disease Control 2009 Special Studies Report
Total number of ILI-classified ED visits by Age groupLos Angeles County Emergency Department Syndromic Surveillance
0
50
100
150
200
250
300
350
400
450
Date of ED Visit
Vo
lum
e o
f IL
I-c
las
sif
ied
ED
vis
its
0-4 5-14 14-44 45-64 65+
Figure 3. Total EDSS fever-classified visits per day
Figure 4. Age-stratified EDSS ILI trend graph from April through May, 2009
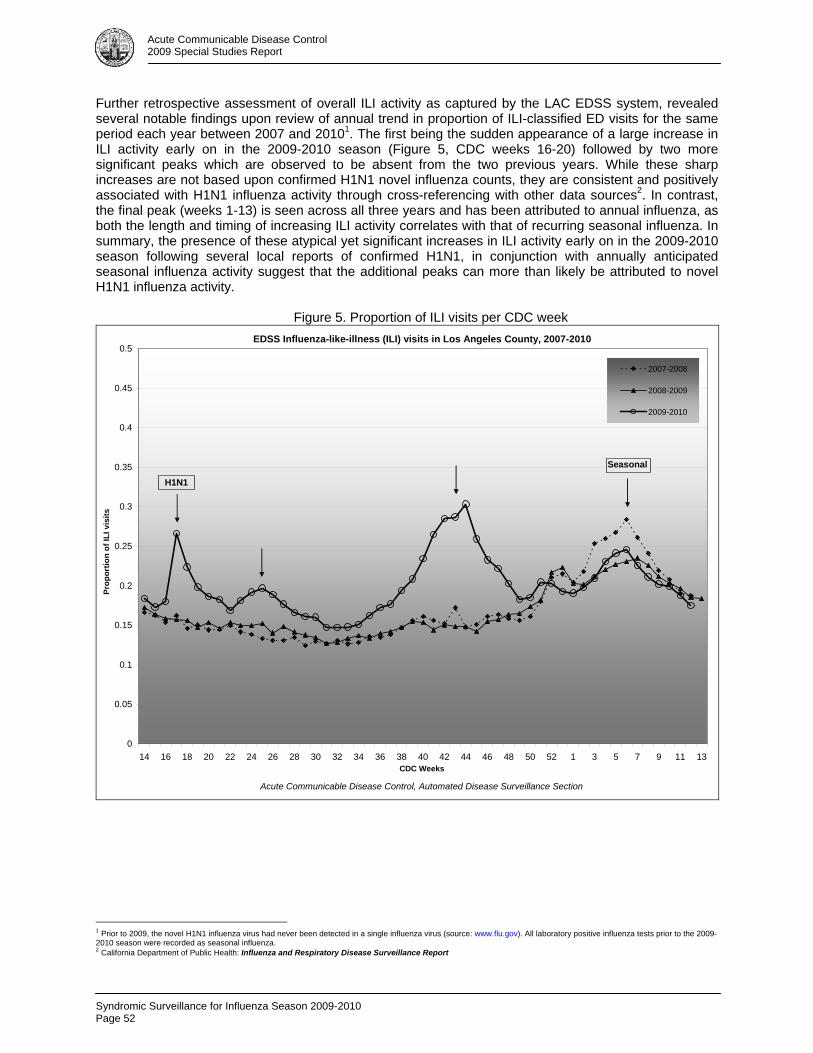
Syndromic Surveillance for Influenza Season 2009-2010 Page 52
Acute Communicable Disease Control 2009 Special Studies Report
Further retrospective assessment of overall ILI activity as captured by the LAC EDSS system, revealed several notable findings upon review of annual trend in proportion of ILI-classified ED visits for the same period each year between 2007 and 20101. The first being the sudden appearance of a large increase in ILI activity early on in the 2009-2010 season (Figure 5, CDC weeks 16-20) followed by two more significant peaks which are observed to be absent from the two previous years. While these sharp increases are not based upon confirmed H1N1 novel influenza counts, they are consistent and positively associated with H1N1 influenza activity through cross-referencing with other data sources2. In contrast, the final peak (weeks 1-13) is seen across all three years and has been attributed to annual influenza, as both the length and timing of increasing ILI activity correlates with that of recurring seasonal influenza. In summary, the presence of these atypical yet significant increases in ILI activity early on in the 2009-2010 season following several local reports of confirmed H1N1, in conjunction with annually anticipated seasonal influenza activity suggest that the additional peaks can more than likely be attributed to novel H1N1 influenza activity.
Figure 5. Proportion of ILI visits per CDC week
0
0.05
0.1
0.15
0.2
0.25
0.3
0.35
0.4
0.45
0.5
14 16 18 20 22 24 26 28 30 32 34 36 38 40 42 44 46 48 50 52 1 3 5 7 9 11 13CDC Weeks
Pro
po
rtio
n o
f IL
I vi
sits
2007-2008
2008-2009
2009-2010
EDSS Influenza-like-illness (ILI) visits in Los Angeles County, 2007-2010
Acute Communicable Disease Control, Automated Disease Surveillance Section
H1N1
Seasonal
1 Prior to 2009, the novel H1N1 influenza virus had never been detected in a single influenza virus (source: www.flu.gov). All laboratory positive influenza tests prior to the 2009-2010 season were recorded as seasonal influenza. 2 California Department of Public Health: Influenza and Respiratory Disease Surveillance Report
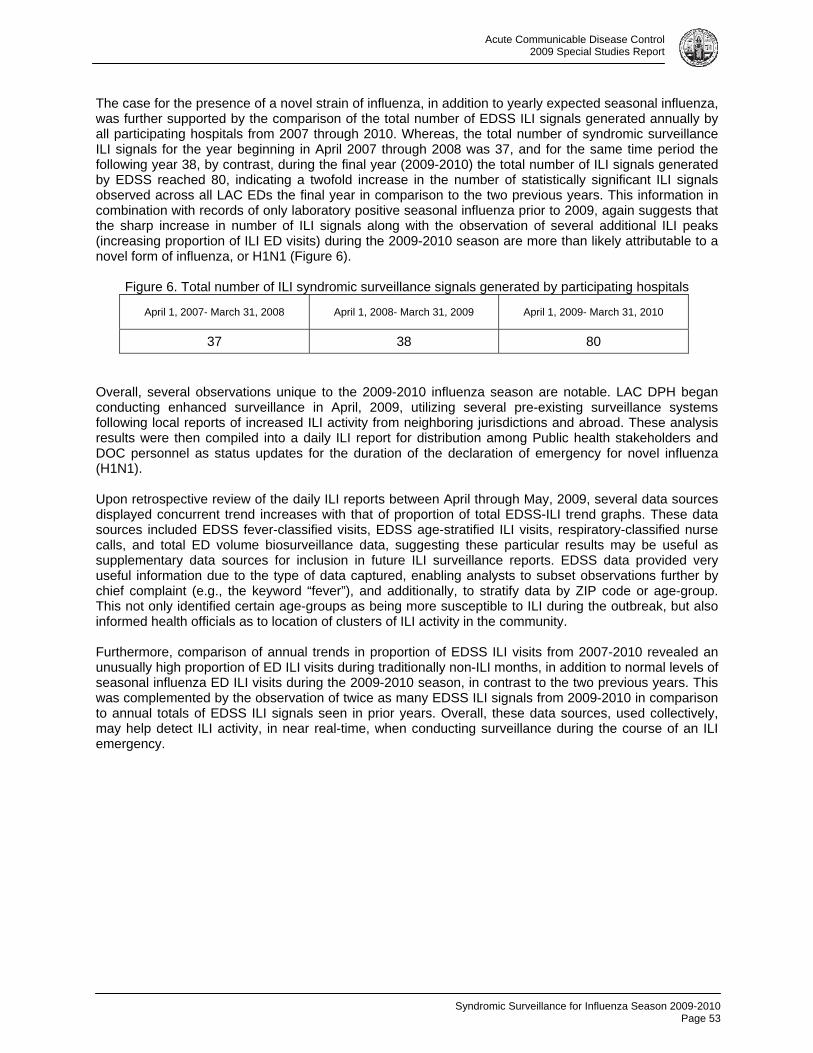
Syndromic Surveillance for Influenza Season 2009-2010
Page 53
Acute Communicable Disease Control 2009 Special Studies Report
The case for the presence of a novel strain of influenza, in addition to yearly expected seasonal influenza, was further supported by the comparison of the total number of EDSS ILI signals generated annually by all participating hospitals from 2007 through 2010. Whereas, the total number of syndromic surveillance ILI signals for the year beginning in April 2007 through 2008 was 37, and for the same time period the following year 38, by contrast, during the final year (2009-2010) the total number of ILI signals generated by EDSS reached 80, indicating a twofold increase in the number of statistically significant ILI signals observed across all LAC EDs the final year in comparison to the two previous years. This information in combination with records of only laboratory positive seasonal influenza prior to 2009, again suggests that the sharp increase in number of ILI signals along with the observation of several additional ILI peaks (increasing proportion of ILI ED visits) during the 2009-2010 season are more than likely attributable to a novel form of influenza, or H1N1 (Figure 6).
Figure 6. Total number of ILI syndromic surveillance signals generated by participating hospitals
April 1, 2007- March 31, 2008 April 1, 2008- March 31, 2009 April 1, 2009- March 31, 2010
37 38 80
Overall, several observations unique to the 2009-2010 influenza season are notable. LAC DPH began conducting enhanced surveillance in April, 2009, utilizing several pre-existing surveillance systems following local reports of increased ILI activity from neighboring jurisdictions and abroad. These analysis results were then compiled into a daily ILI report for distribution among Public health stakeholders and DOC personnel as status updates for the duration of the declaration of emergency for novel influenza (H1N1). Upon retrospective review of the daily ILI reports between April through May, 2009, several data sources displayed concurrent trend increases with that of proportion of total EDSS-ILI trend graphs. These data sources included EDSS fever-classified visits, EDSS age-stratified ILI visits, respiratory-classified nurse calls, and total ED volume biosurveillance data, suggesting these particular results may be useful as supplementary data sources for inclusion in future ILI surveillance reports. EDSS data provided very useful information due to the type of data captured, enabling analysts to subset observations further by chief complaint (e.g., the keyword “fever”), and additionally, to stratify data by ZIP code or age-group. This not only identified certain age-groups as being more susceptible to ILI during the outbreak, but also informed health officials as to location of clusters of ILI activity in the community. Furthermore, comparison of annual trends in proportion of EDSS ILI visits from 2007-2010 revealed an unusually high proportion of ED ILI visits during traditionally non-ILI months, in addition to normal levels of seasonal influenza ED ILI visits during the 2009-2010 season, in contrast to the two previous years. This was complemented by the observation of twice as many EDSS ILI signals from 2009-2010 in comparison to annual totals of EDSS ILI signals seen in prior years. Overall, these data sources, used collectively, may help detect ILI activity, in near real-time, when conducting surveillance during the course of an ILI emergency.

Syndromic Surveillance for Influenza Season 2009-2010 Page 54
Acute Communicable Disease Control 2009 Special Studies Report
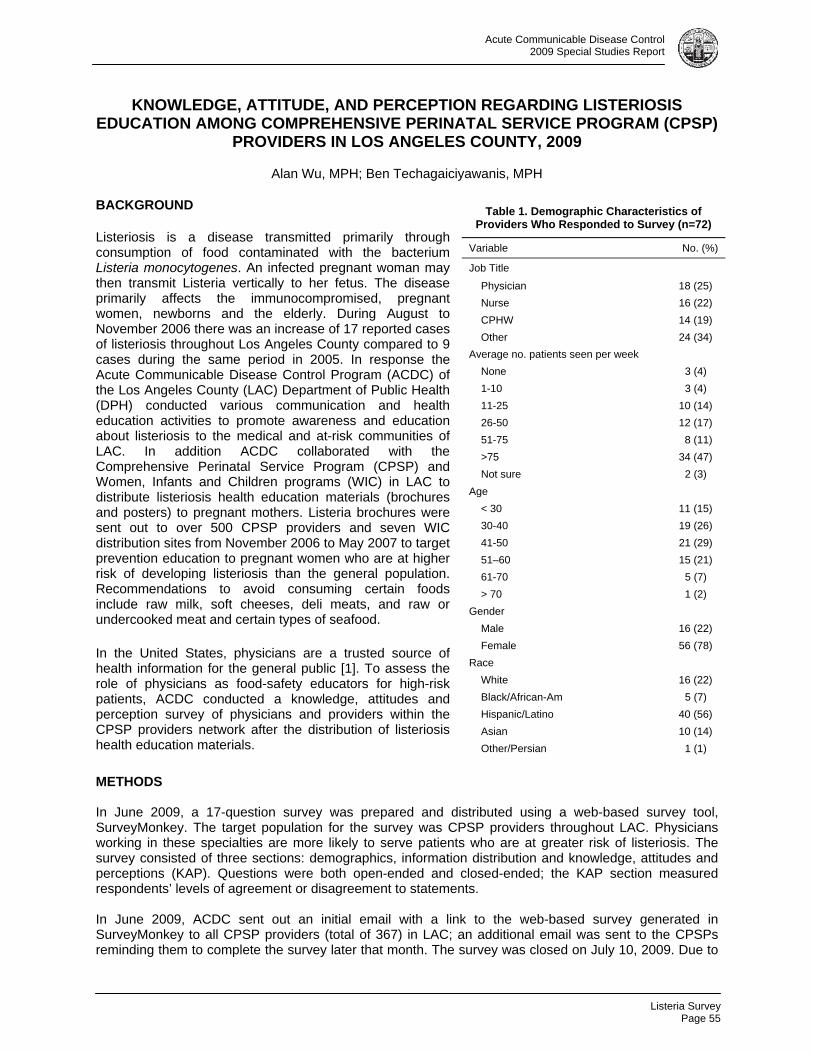
Listeria Survey
Page 55
Acute Communicable Disease Control 2009 Special Studies Report
KNOWLEDGE, ATTITUDE, AND PERCEPTION REGARDING LISTERIOSIS EDUCATION AMONG COMPREHENSIVE PERINATAL SERVICE PROGRAM (CPSP)
PROVIDERS IN LOS ANGELES COUNTY, 2009
Alan Wu, MPH; Ben Techagaiciyawanis, MPH BACKGROUND Listeriosis is a disease transmitted primarily through consumption of food contaminated with the bacterium Listeria monocytogenes. An infected pregnant woman may then transmit Listeria vertically to her fetus. The disease primarily affects the immunocompromised, pregnant women, newborns and the elderly. During August to November 2006 there was an increase of 17 reported cases of listeriosis throughout Los Angeles County compared to 9 cases during the same period in 2005. In response the Acute Communicable Disease Control Program (ACDC) of the Los Angeles County (LAC) Department of Public Health (DPH) conducted various communication and health education activities to promote awareness and education about listeriosis to the medical and at-risk communities of LAC. In addition ACDC collaborated with the Comprehensive Perinatal Service Program (CPSP) and Women, Infants and Children programs (WIC) in LAC to distribute listeriosis health education materials (brochures and posters) to pregnant mothers. Listeria brochures were sent out to over 500 CPSP providers and seven WIC distribution sites from November 2006 to May 2007 to target prevention education to pregnant women who are at higher risk of developing listeriosis than the general population. Recommendations to avoid consuming certain foods include raw milk, soft cheeses, deli meats, and raw or undercooked meat and certain types of seafood. In the United States, physicians are a trusted source of health information for the general public [1]. To assess the role of physicians as food-safety educators for high-risk patients, ACDC conducted a knowledge, attitudes and perception survey of physicians and providers within the CPSP providers network after the distribution of listeriosis health education materials.
METHODS In June 2009, a 17-question survey was prepared and distributed using a web-based survey tool, SurveyMonkey. The target population for the survey was CPSP providers throughout LAC. Physicians working in these specialties are more likely to serve patients who are at greater risk of listeriosis. The survey consisted of three sections: demographics, information distribution and knowledge, attitudes and perceptions (KAP). Questions were both open-ended and closed-ended; the KAP section measured respondents’ levels of agreement or disagreement to statements. In June 2009, ACDC sent out an initial email with a link to the web-based survey generated in SurveyMonkey to all CPSP providers (total of 367) in LAC; an additional email was sent to the CPSPs reminding them to complete the survey later that month. The survey was closed on July 10, 2009. Due to
Table 1. Demographic Characteristics of Providers Who Responded to Survey (n=72)
Variable No. (%)
Job Title
Physician 18 (25)
Nurse 16 (22)
CPHW 14 (19)
Other 24 (34)
Average no. patients seen per week
None 3 (4)
1-10 3 (4)
11-25 10 (14)
26-50 12 (17)
51-75 8 (11)
>75 34 (47)
Not sure 2 (3)
Age
< 30 11 (15)
30-40 19 (26)
41-50 21 (29)
51–60 15 (21)
61-70 5 (7)
> 70 1 (2)
Gender
Male 16 (22)
Female 56 (78)
Race
White 16 (22)
Black/African-Am 5 (7)
Hispanic/Latino 40 (56)
Asian 10 (14)
Other/Persian 1 (1)
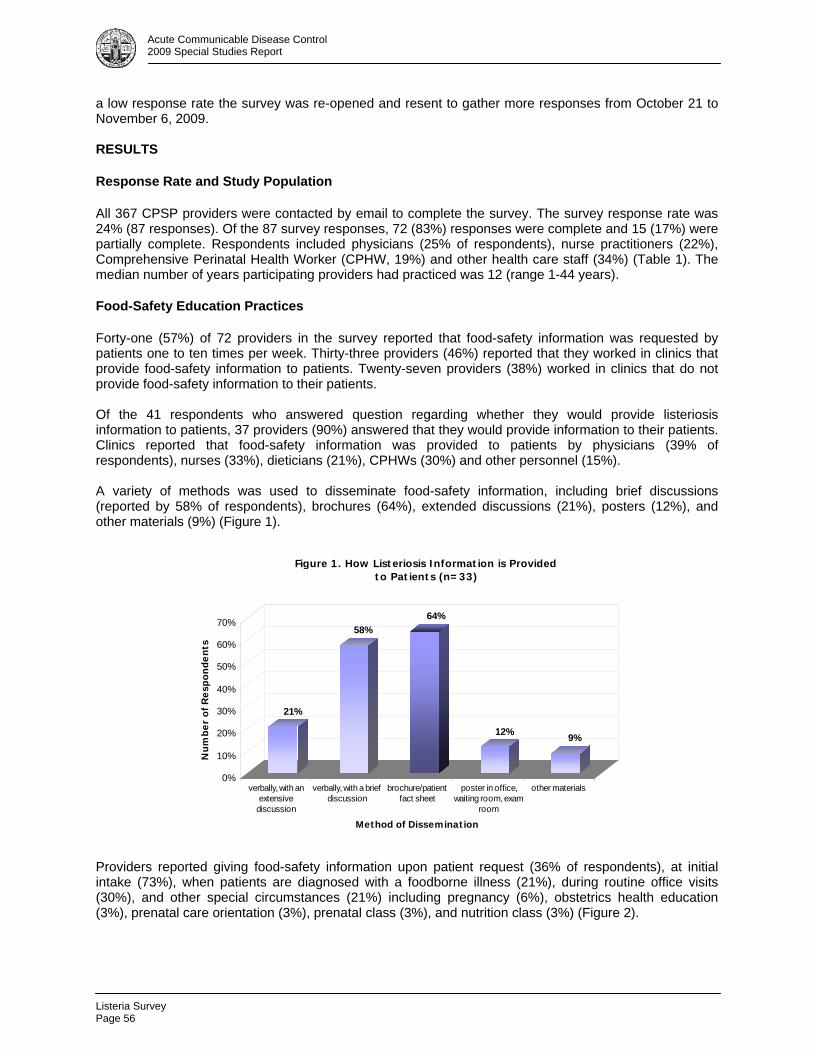
Listeria Survey Page 56
Acute Communicable Disease Control 2009 Special Studies Report
a low response rate the survey was re-opened and resent to gather more responses from October 21 to November 6, 2009. RESULTS Response Rate and Study Population All 367 CPSP providers were contacted by email to complete the survey. The survey response rate was 24% (87 responses). Of the 87 survey responses, 72 (83%) responses were complete and 15 (17%) were partially complete. Respondents included physicians (25% of respondents), nurse practitioners (22%), Comprehensive Perinatal Health Worker (CPHW, 19%) and other health care staff (34%) (Table 1). The median number of years participating providers had practiced was 12 (range 1-44 years). Food-Safety Education Practices Forty-one (57%) of 72 providers in the survey reported that food-safety information was requested by patients one to ten times per week. Thirty-three providers (46%) reported that they worked in clinics that provide food-safety information to patients. Twenty-seven providers (38%) worked in clinics that do not provide food-safety information to their patients. Of the 41 respondents who answered question regarding whether they would provide listeriosis information to patients, 37 providers (90%) answered that they would provide information to their patients. Clinics reported that food-safety information was provided to patients by physicians (39% of respondents), nurses (33%), dieticians (21%), CPHWs (30%) and other personnel (15%). A variety of methods was used to disseminate food-safety information, including brief discussions (reported by 58% of respondents), brochures (64%), extended discussions (21%), posters (12%), and other materials (9%) (Figure 1).
21%
58%
64%
12%9%
0%
10%
20%
30%
40%
50%
60%
70%
Nu
mb
er
of
Res
po
nd
en
ts
verbally, with anextensive
discussion
verbally, with a briefdiscussion
brochure/patientfact sheet
poster in office,waiting room, exam
room
other materials
Method of Dissemination
Figure 1. How Listeriosis Information is Provided to Patients (n=33)
Providers reported giving food-safety information upon patient request (36% of respondents), at initial intake (73%), when patients are diagnosed with a foodborne illness (21%), during routine office visits (30%), and other special circumstances (21%) including pregnancy (6%), obstetrics health education (3%), prenatal care orientation (3%), prenatal class (3%), and nutrition class (3%) (Figure 2).

Listeria Survey
Page 57
Acute Communicable Disease Control 2009 Special Studies Report
73%
30%36%
21% 21%
0%
10%
20%
30%
40%
50%
60%
70%
80%
Nu
mb
er
of
Re
spo
nd
en
ts
initial intake routine off icevisit
w hen patientrequest
information
w hen patient isdiagnosed w ith
foodborneillness
other specialcircumstances
Figure 2. When Is Listeriosis Information Provided? (n=33)
Providers’ Perceptions as Food-Safety Educators Figure 3 shows a key perception of providers’ role as food-safety educators. Eighty-five percent of providers who responded believed that educating patients about listeriosis should be part of their role.
Figure 3. Making Sure Patients Receive Information About Prevention of Listeriosis is Part of My Role (n=63)
Strongly disagree5%, 3
Strongly agree28%, 18
Agree57%, 36
Disagree10%, 6
Table 2 summarizes the responding providers’ perceptions regarding their role as food-safety educators. Most responding providers agreed that the provision of food-safety information is part of the physician’s role (85%). Additionally, most providers were willing to provide a brief talk to their patients about preventing listeriosis (93% of respondents) and believed that educating patients about food safety would result in a decrease in listeriosis (98%).

Listeria Survey Page 58
Acute Communicable Disease Control 2009 Special Studies Report
Table 2. Perceptions of Responding Providers Regarding Their Role as Food-Safety Educators No. (%) of respondents,
by answer (n = 72)
Neutral* or no Strongly Strongly Statement of perception answer agree Agree Disagree disagree
I am comfortable with my general knowledge of listeriosis 12 7 (12) 38 (63) 9 (15) 6 (10) I am comfortable in identifying risk factors in my patients who
are at risk for listeriosis 23 6 (12) 29 (59) 10 (21) 4 (8)
Many of my patients are “at-risk” for listeriosis 31 5 (12) 20 (49) 12 (29) 4 (10) Making sure that patients receive education about prevention of
listeriosis is part of my role 9 18 (28) 36 (57) 6 (10) 3 (5) My patients would be interested in learning how they can
prevent listeriosis 18 12 (22) 38 (70) 2 (4) 2 (4) I am willing to provide a brief (three minute) talk to my patients
on preventing listeriosis 11 20 (33) 37 (60) 1 (2) 3 (5) Educating patients about food safety will result in a decrease in
listeriosis 6 27 (41) 38 (57) 0 (0) 1 (2) My patients are likely to comply with recommendations I provide
on prevention of listeriosis 19 11 (21) 38 (71) 3 (6) 1 (2) Effectively educating patients on how to prevent listeriosis takes
too much time 24 4 (8) 6 (13) 34 (71) 4 (8) I am confident about diagnosing and treating listeriosis in my patients 29 4 (9) 24 (56) 6 (14) 9 (21) I am comfortable making recommendations on how to prevent
listeriosis 17 14 (25) 35 (64) 2 (4) 4 (7) My patients feel that I am a valuable resource for advice on
prevention of listeriosis 11 13 (21) 40 (66) 5 (8) 3 (5) Health education materials can help me with educating my
patients about prevention of listeriosis 5 38 (57) 26 (39) 1 (1) 2 (3)
* The total no. of responses for the above statements does not include neutral responses.
Food-Safety Education Barriers Table 3 is a summary of anecdotal comments and responses to an open-ended question on barriers to providing patient education.
Table 3. Barriers Providers Face in Providing Prevention Education to Patients (n=72) Education/Literacy Most pregnant women are low education Patients’ lack of education Low level of education in the population we serve Around 70% of patients didn’t finish elementary school Lack of Time
Providers Patients are scheduled every 10 minutes Too busy doing other tasks Pressure of seeing patients with limited time
Not enough time to educate patients on so many areas
Patients Most of the moms don’t have time or show no interest in health education Working mothers’ busy schedules Patients are in a hurry or do not have time for education Lack of Educational Materials/ Resources
Like to have education video and flip chart to better address listeriosis information
No reading material for patients on listeriosis Need more printed low literacy materials at 4th grade reading level Need educational material and literature in Spanish Need educational material in Armenian
Need appealing, up-to-date free health education materials in English and Spanish
Not enough funding for educational material, handouts and posters
Patient Non-Compliance Patients resistant to change behavior, especially the change may have financial impact (i.e., if it's more expensive to buy cheese in a supermarket rather than getting home-made cheese at low cost).
Patients do not follow instructions Patients do not show an interest in learning

Listeria Survey
Page 59
Acute Communicable Disease Control 2009 Special Studies Report
DISCUSSION In this survey, 33 (46%) of 72 responding providers worked in clinics that provided listeriosis information to their patients; 18 (55%) of these providers provided the information themselves. Of the 27 providers who worked in practices that did not provide food-safety information, 15 (94%) reported that they would like to provide such information to their patients. A total of 87 providers responded to this survey and 72 complete surveys were analyzed. Responses indicate that overall providers’ knowledge, attitudes and perception regarding listeriosis patient education are positive. They strongly believe in the value and need for patient education and that it should be their role. Most providers indicate they are willing to provide education. Almost all believe in the value of health education materials in assisting them with prevention education. In fact, they indicated the importance of having culturally and literacy appropriate educational materials. Despite their strong belief in patient education, they face challenges and barriers including time constraints due to pressure of seeing patients with limited time, lack of education materials and resources, and patients’ lack of education. Almost one half of providers are seeing more than 75 patients per week (see Table 1). Providers serving at-risk patients are in an important position to serve as food-safety educators. Given the positive providers’ attitudes and perceptions on listeriosis patient education found in this survey, a targeted food-safety education campaign for providers serving patients at risk for listeriosis could enhance provider-based education. Such a campaign can focus on increasing providers’ perceived roles as food-safety educators, increasing providers’ awareness of their value to patients as food-safety educators for their patients, and increasing their comfort in providing listeriosis information to their patients. Education campaign and efforts should also focus on the small group of providers who do not perceive listeriosis education to be part of their role (15%) and their patients are at risk for listeriosis (39%) (Table 2). A low response rate is a limitation of this study. Therefore, the results cannot be generalized to and may not accurately reflect all providers within the CPSP providers network. The tremendous workload of these providers may explain the low response rate. In a study by Kaner et al. [2], a general increase in physicians’ workloads is a primary factor for low response rates to surveys. This increase in workload could have biased the survey responses. For example, physicians who felt they did not have time to provide food-safety information to patients may not have had time to fill out the survey. Moreover, in depth statistical analyses could not be performed because sample size was too small.
REFERENCES 1. Mead PS, Slutsker L, Dietz V, et al. Food-related illness and death in the United States. Emerg
Infect Dis 1999; 5(5):607–25. 2. Kaner EF, Haighton CA, McAvoy BR. ‘So much post, so busy with practice—so, no time!’: a
telephone survey of general practitioners’ reasons for not participating in postal questionnaire surveys. Br J Gen Pract 1998; 48(428):1067–9.

Building Relationships with ECE Providers
Page 61
Acute Communicable Disease Control 2009 Special Studies Report
BUILDING RELATIONSHIPS WITH EARLY CHILDHOOD EDUCATION PROVIDERS TO PREVENT INFECTIOUS DISEASE
Elaine Waldman; Laurie Chow, MA, MPH
BACKGROUND The Acute Communicable Disease Control Program (ACDC) is committed to working in collaboration with diverse stakeholders to initiate and sustain meaningful interventions to prevent disease among vulnerable community members, such as the very young and the very old. This report summarizes an example of ACDC’s efforts to translate knowledge into action and build community capacity to address public health risks using a mix of quantitative and qualitative research methods. Over 1,200 Salmonella cases in Los Angeles County are reported to ACDC each year, and though largely considered to be a foodborne illness, an average of 10% of these cases is associated with reptile (mostly turtle) exposure. In contrast, rates of reptile-associated cases average 6% of overall cases on a national level. Salmonella, a bacterium that most reptiles naturally carry in their systems, can easily be shed, both directly and indirectly, and can infect humans. Salmonellosis is a preventable disease that can cause serious illness and harmful consequences, including invasive disease, hospitalization, and, on occasion, death for children under age five and for individuals who have chronic health conditions that weaken their immune system. According to ongoing ACDC surveillance reports and anecdotal evidence provided by Public Health Nurses investigating cases in the field, low-income Latino families with young children who live in apartments in Service Planning Areas 2 and 4, who have pet reptiles, have consistently accounted for the majority of reported reptile-associated salmonellosis (RAS) cases in Los Angeles County. Observations by ACDC staff indicate that small turtles are common classroom pets in child care and early childhood education programs throughout the County, despite the nationwide law since 1975 prohibiting the sale or distribution of small turtles (with shells less than four inches in length) as well as the recommendation endorsed by the Centers for Disease Control and Prevention (CDC) that children under age five should not have contact with reptiles or amphibians [1]. With this in mind, ACDC developed in 2008 a community-level intervention on reptile-associated salmonellosis prevention to raise community awareness and build the capacity of stakeholder organizations to take action. This intervention, which is ongoing, began with the establishment of a RAS Working Group. This advisory body is an interdisciplinary group of DPH staff including health educators, nurses, physicians, veterinarians, students, and research analysts, who, in partnership with representatives of community-based organizations, including groups involved in expanding access to quality child care and early childhood education, promoting environmental health, and organizing low-income tenants, representatives of public sector agencies, including City of Los Angeles Animal Control and County of Los Angeles Office of Child Care, and institutions of higher learning, such as faculty and graduate students of Public Health,. The RAS Working Group has been meeting bimonthly to develop and implement strategies to reduce the risk of RAS in vulnerable communities. Strategies include designing and disseminating updated, culturally competent health education materials with tailored RAS prevention messages, participating in relevant community education and outreach activities, and developing and proposing to community-based organizations and stakeholder agencies the integration of policy recommendations on animals, infectious disease, and children’s health. ACDC staff sought opportunities to meet stakeholders who serve vulnerable populations throughout LAC during monthly meetings of the Child Care Planning Committee, whose mission is “to engage parents, child care providers, allied organizations, community, and public agencies in collaborative planning efforts to improve the overall child care infrastructure of the County of Los Angeles, including the quality and continuity, affordability, and accessibility of child care and development services for all families”[2]. ACDC staff regularly provided information and updates during public comment portions of the agendas. Updates focused on RAS prevention, infectious diseases, health and safety, H1N1, emergency preparedness, and

Building Relationships with ECE Providers Page 62
Acute Communicable Disease Control 2009 Special Studies Report
food borne illness outbreaks affecting young children and their families. These updates have reached a wide range of family-based and center-based early childhood education (ECE) providers, State of California Community Care Licensing advocate, parents, and other stakeholders appointed to the Committee, and were summarized in the meeting minutes, which are sent out to hundreds of child care programs and ECE providers throughout the County. Attending these meetings helped ACDC understand the context within which ECE providers work to serve local children, families and communities. Building relationships with the Child Care Planning Committee members has led to opportunities and invitations for ACDC to present workshops at regional ECE professional development conferences and events. In addition, ACDC staff has worked with Child Care Planning Committee members to test and disseminate several new, targeted health education materials to raise RAS awareness among ECE providers. ACDC determined that conducting site visits with a sample of ECE providers, most of whom are members of the Child Care Planning Committee, would enable staff to see and experience daily life at diverse program sites, conduct informational interviews, and share DPH/ACDC and RAS prevention resources. The aims of these field visits were to: 1) better understand the environments where ECE programs take place; 2) explore ECE provider strengths and challenges in infectious disease prevention, health, and safety; 3) strengthen the relationship between ECE providers and DPH/ACDC; and 4) determine the feasibility of future partnerships for RAS and other infectious disease prevention. METHODS A plan was developed to conduct site visits and interviews during the months of June through September, 2009. The visits were designed to strengthen relationships with ECE providers in order to enhance and expand infectious disease prevention practices. In contrast to the formal visits and audits from government inspectors familiar to licensed center-based and family-based ECE providers, ACDC staff embraced a nonjudgmental, conversational approach and philosophy of harm reduction. Using a train-the-trainer concept, staff aimed to encourage ECE providers to integrate RAS prevention education into the training/education of their staff, parents, and children, through ongoing activities at their sites. As teachers and leaders, ECE providers are well-positioned to initiate program-specific changes, including staff training, organizational policy development and enhanced disease prevention practices. In determining which ECE sites to visit, ACDC staff reviewed findings from 109 surveys they conducted in 2008 with ECE providers during RAS prevention outreach and education sessions at professional development conferences in Central, South, and Southeast Los Angeles and in meetings of the Child Care Planning Committee. They then targeted the 18 ECE providers located throughout the eight Los Angeles County Service Planning Areas (16.5% of total respondents) who reported that they had seen reptiles in their ECE program sites. Before conducting site visits, staff determined logistics, made introductory telephone calls and emails, and scheduled the visits. Staff conducted an initial visit and then, weeks later, confirmed the schedule and conducted a follow-up visit to each site. Staff informed ECE providers that the visits were voluntary and confidential, and explained the purpose of the site visits. Staff developed and facilitated an interview guide and compiled a binder of bilingual health education materials on RAS prevention and a range of relevant public health topics. Staff assembled a tabbed folder for each site, complete with driving directions, an interview guide, materials order form, and field notes. For the follow-up visits, staff prepared a 12-item evaluation survey, and a resource box filled with color copies of the amount specified of each specific health education material requested, and a “Partners in Public Health” certificate of appreciation for each ECE provider, signed by the ACDC Chief, the DPH Director of Communicable Disease Control, and the ACDC health education unit supervisor. RESULTS Of the 18 ECE providers ACDC staff invited to participate, 7 (39%) agreed to the visits. Eleven providers were unreachable despite multiple efforts to engage them. Participating providers were located in SPAs 2, 3, 4, 5, and 8; a total of 1,604 children were enrolled in their programs (Table 1). All of the providers serve culturally and ethnically diverse children from low-income, under-served families, most of whom
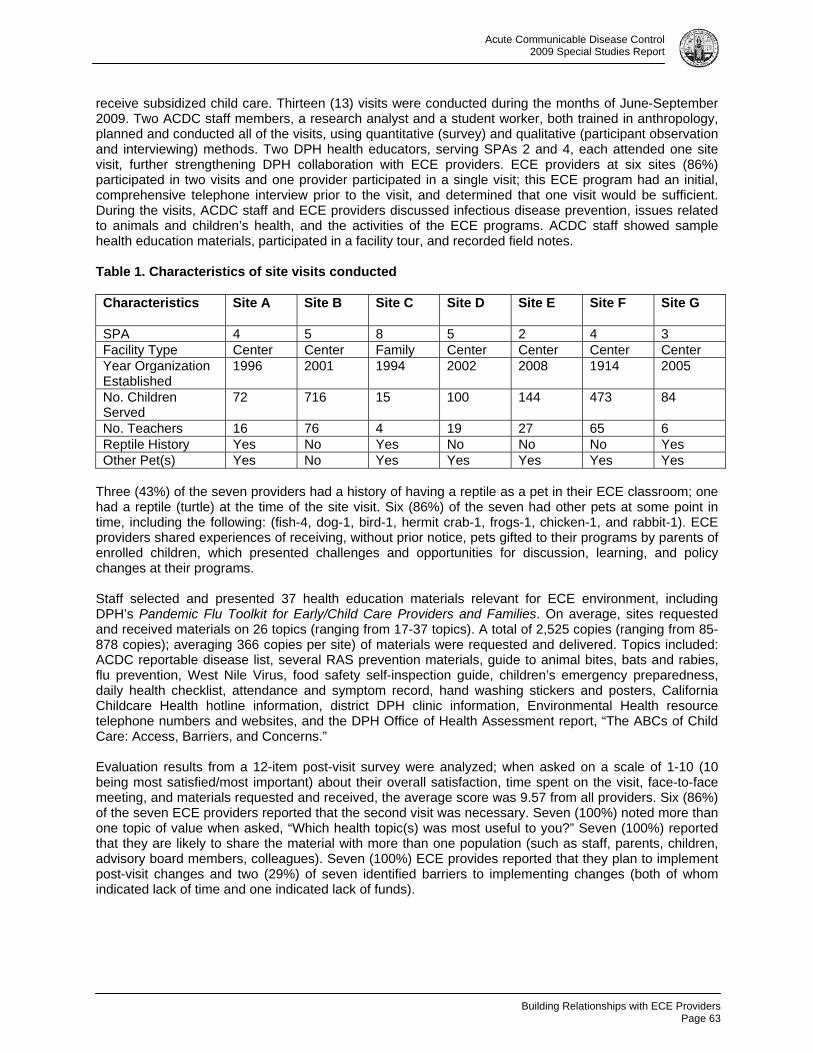
Building Relationships with ECE Providers
Page 63
Acute Communicable Disease Control 2009 Special Studies Report
receive subsidized child care. Thirteen (13) visits were conducted during the months of June-September 2009. Two ACDC staff members, a research analyst and a student worker, both trained in anthropology, planned and conducted all of the visits, using quantitative (survey) and qualitative (participant observation and interviewing) methods. Two DPH health educators, serving SPAs 2 and 4, each attended one site visit, further strengthening DPH collaboration with ECE providers. ECE providers at six sites (86%) participated in two visits and one provider participated in a single visit; this ECE program had an initial, comprehensive telephone interview prior to the visit, and determined that one visit would be sufficient. During the visits, ACDC staff and ECE providers discussed infectious disease prevention, issues related to animals and children’s health, and the activities of the ECE programs. ACDC staff showed sample health education materials, participated in a facility tour, and recorded field notes. Table 1. Characteristics of site visits conducted Characteristics Site A Site B
Site C Site D
Site E
Site F Site G
SPA 4 5 8 5 2 4 3 Facility Type Center Center Family Center Center Center Center Year Organization Established
1996 2001 1994 2002 2008 1914 2005
No. Children Served
72 716 15 100 144 473 84
No. Teachers 16 76 4 19 27 65 6 Reptile History Yes No Yes No No No Yes Other Pet(s) Yes No Yes Yes Yes Yes Yes
Three (43%) of the seven providers had a history of having a reptile as a pet in their ECE classroom; one had a reptile (turtle) at the time of the site visit. Six (86%) of the seven had other pets at some point in time, including the following: (fish-4, dog-1, bird-1, hermit crab-1, frogs-1, chicken-1, and rabbit-1). ECE providers shared experiences of receiving, without prior notice, pets gifted to their programs by parents of enrolled children, which presented challenges and opportunities for discussion, learning, and policy changes at their programs. Staff selected and presented 37 health education materials relevant for ECE environment, including DPH’s Pandemic Flu Toolkit for Early/Child Care Providers and Families. On average, sites requested and received materials on 26 topics (ranging from 17-37 topics). A total of 2,525 copies (ranging from 85-878 copies); averaging 366 copies per site) of materials were requested and delivered. Topics included: ACDC reportable disease list, several RAS prevention materials, guide to animal bites, bats and rabies, flu prevention, West Nile Virus, food safety self-inspection guide, children’s emergency preparedness, daily health checklist, attendance and symptom record, hand washing stickers and posters, California Childcare Health hotline information, district DPH clinic information, Environmental Health resource telephone numbers and websites, and the DPH Office of Health Assessment report, “The ABCs of Child Care: Access, Barriers, and Concerns.” Evaluation results from a 12-item post-visit survey were analyzed; when asked on a scale of 1-10 (10 being most satisfied/most important) about their overall satisfaction, time spent on the visit, face-to-face meeting, and materials requested and received, the average score was 9.57 from all providers. Six (86%) of the seven ECE providers reported that the second visit was necessary. Seven (100%) noted more than one topic of value when asked, “Which health topic(s) was most useful to you?” Seven (100%) reported that they are likely to share the material with more than one population (such as staff, parents, children, advisory board members, colleagues). Seven (100%) ECE provides reported that they plan to implement post-visit changes and two (29%) of seven identified barriers to implementing changes (both of whom indicated lack of time and one indicated lack of funds).

Building Relationships with ECE Providers Page 64
Acute Communicable Disease Control 2009 Special Studies Report
All participating ECE providers shared feedback: “The questions asked of our organization helped us to reflect on what existing practices are in
place and what additional measures can still be taken to improve upon our agency’s systems and infrastructure. The reflective time is a gift. We welcomed all the informative and guiding leaflets and documents.”
“We appreciated the attention to punctuality and brevity. I am grateful for the respectful manner in which our time was valued.”
“The meeting face-to-face was more appropriate due to the sensitivity of our site specific issues. I had some very strong compelling reasons why I thought animals should be a part of the young students’ school experience and (ACDC staff) (were) able to patiently and effectively show me the dangers and the importance of educating staff, families, and students (about) the serious health risks with turtles/reptiles.”
“I felt like a follow up doctor’s visit. Very important!” “Thanks to all the materials we got, our center is now more enriched and in many different
languages.” “I think it is important because we had the opportunity not only to get information but also share
ideas in a more friendly way (face to face).” “The visit was conducted professionally and I was satisfied with the help given.” “Having an outside eye look over the facility definitely helped in seeing areas that I can work
with.” “The face to face was important. It gave (them) a chance to see first hand how I am set up and I
feel gives them a better ability to customize the information to the needs of the facility.” “The amount of information exchanged and the handouts, pamphlets, posters could only have
been done in person to be effective.” “Very relevant information and materials shared. Visit tailored to the needs of our Center.” “Relationship based collaborations seem to be more successful. (ACDC staff) having a chance to
see the Center were able to suggest relevant resources.” Responses, when asked, “What changes, if any, will you make as a result of the visit?” were:
“Developing written policies regarding pets in the classroom. Information received is informing revision of emergency preparedness plan.”
“In the process of sharing it (information) already.” “Staff/parent training and integrating materials into curriculum.” “Train staff to be aware of what they have in the classroom and the importance of washing hands
constantly.” “An emergency preparedness supply (can) will be developed. Information on the Pandemic Flu
and Reptile-associated Salmonellosis will be presented to parents.” “As a result of the visit, we were able to make adjustments in our policies and reflected the
changes in our Parent Handbook. We also shared information with staff and plan to utilize the information as part of professional staff development.”
Responses, when asked, “What could we do to improve future visits?” were:
“Sending an email prior to the meeting reminding of visit, stating objectives for meeting so that we can better plan for other relevant staff to be present.”
“To improve future visits, it might be a good idea to do a parent workshop and share information with the parents directly…I think future visits could entail walking through classrooms to highlight or pinpoint ways to support the safety and health of children.” “Continue to support information with data/statistics and share stories from the field.”
“Continue providing information to the public about health issues to prevent spreading.” CONCLUSION AND RECOMMENDATIONS As this series of site visits demonstrates, ECE providers working at center-based and family-based programs play a vital role in linking vulnerable, under-served families to needed health resources. ECE providers care deeply about children’s health and disease prevention and are committed to taking action

Building Relationships with ECE Providers
Page 65
Acute Communicable Disease Control 2009 Special Studies Report
to improve community health. ECE providers merit recognition for their commitment to promoting infectious disease prevention, community health and safety. Building and sustaining relationships between DPH program staff and ECE providers is mutually beneficial: DPH is able to reach a large number of parents and caregivers throughout Los Angeles County whose children are served by ECE providers, ECE providers are able to access and disseminate health information and resources that the families they serve need. With a growing number of ECE providers participating in local, regional, and national initiatives seeking to improve the quality of services and working conditions for early childhood education, DPH/ACDC should continue to partner with ECE providers via their professional development networks to reach families with priority infectious disease prevention and public health messages and interventions. Furthermore, there is an ongoing and potentially unmet need to reach the many exempt and unlicensed child care providers in Los Angeles County with RAS, infectious disease prevention information, and health and safety updates, since these providers may be unaffiliated with ECE networks and may lack access to targeted public health messages. All of the ECE providers visited, and providers throughout Los Angeles County routinely use the Early Childhood Environment Rating Scale (ECERS), a nationally recognized and leading method of measuring quality indicators in early childhood education settings. This observational tool identifies nature/science as important elements, and the scoring form includes an “example of science/nature observed in daily events” [3]. As the ECE providers explained during the field visits, many providers have a live animal at their program site in order to fulfill this quality standard. Since education and regulation are important in combating the risk of RAS [4], and the ban on the sale of turtles is poorly enforced [5] perhaps the ECERS tool and scoring sheet should include a recommendation that reptiles and amphibians not be present in the ECE environment, in order to conform to CDC guidelines. These field visits proved important in building trust and engaging community stakeholders, and more such visits should be conducted where appropriate, to build bridges between DPH and ECE providers and thus advance collaborative infectious disease prevention efforts in Los Angeles County. ACKNOWLEDGMENTS The authors wish to acknowledge participating ECE providers for their time, insights, and hospitality. Special thanks to Laura Escobedo, convener, and members of the Los Angeles County Child Care Planning Committee. Thanks to the members of the RAS Working Group and to early childhood education providers everywhere for their ongoing contributions to community health. REFERENCES 1.National Association of State Public Health Veterinarians, Inc. (NASPHV). Compendium of Measures to Prevent Disease Associated with Animals in Public Settings. Centers for Disease Control and Prevention, Morbidity and Mortality Weekly Report. July 6, 2007, 56 (RR05); 18-19. 2.County of Los Angeles Office of Child Care. Website: http://ceo.lacounty.gov/ccp/ccpc.htm 3.Thelma Harms, Debby Cryer, and Richard M. Clifford. Environment Rating Scale Score Sheet, Expanded Version, Revised 2009. PFG Child Development Institute, University of North Carolina-Chapel Hill. 4. De Jong, B., Anderson, Y., and Ekdahl, K. Effect of Regulation and Education on Reptile-associated Salmonellosis. Emerging Infectious Diseases. Vol. 11, No. 3: 398-403, March 2005.Website: www.cdc.gov/ncidod/eid/ 5.RAS Working Group meeting minutes, February 5, 2010 discussion with City of Los Angeles Animal Control Officers.

Building Relationships with ECE Providers Page 66
Acute Communicable Disease Control 2009 Special Studies Report

Varicella after Two-Dose Varicella Vaccine
Page 67
Acute Communicable Disease Control 2009 Special Studies Report
VARICELLA DISEASE INCIDENCE AND CLINICAL PRESENTATION AFTER INTRODUCTION OF THE TWO-DOSE VARICELLA VACCINE SCHEDULE
Amanuel Hussien, MSc; Rachel Civen, MD, MPH
BACKGROUND Varicella (chickenpox) is a highly infectious disease caused by the varicella-zoster virus (VZV). In 1995, a vaccine to prevent varicella (VARIVAX®) was licensed in the United States for use among healthy children aged > 12 months, adolescents, and adults and was endorsed by the Advisory Committee on Immunization Practices (ACIP) [1]. Since September 1994, the Centers for Disease Control and Prevention (CDC) have sponsored two active surveillance projects for varicella with the Philadelphia Department of Public Health and the Los Angeles County (LAC) of Department of Public Health (DPH) situated in Antelope Valley, California. The objectives of these active surveillance projects have been to obtain population-based varicella incidence rates, to examine the clinical presentation of varicella, and to evaluate the transmission of varicella and varicella vaccine distribution practices. The Antelope Valley (AV) Varicella Active Surveillance Project (VASP) has conducted population-based active surveillance for varicella disease since January 1, 1995. Since that time, varicella vaccination coverage within LAC increased from 13.9% in 1996 to 92.3% in 2005 for children 19-35 months [2]. Correspondingly the varicella incidence rate (IR) declined by 90% from 1995 to 2005 within the AV VASP [3]; similar results have been reported from Philadelphia. Despite the overall decline in varicella incidence observed within both of the surveillance projects, there were increasing reports of varicella outbreaks nationally among highly vaccinated populations [4]. Investigators also more thoroughly understood the vaccine effectiveness of the one-dose regimen was approximately 85% in the prevention of varicella infection [5] and that improved immunologic response to varicella vaccination developed when one versus two vaccine doses was received [6, 7]. As a result, in 2006, the ACIP adopted new recommendations to support routine two-dose varicella vaccination program for children, with the first dose administered at age 12-15 months, and the second dose at age 4-6 years; a second dose catch-up varicella vaccination for children, adolescent, and adults who previously had received one dose; and routine vaccination with two doses for all healthy persons > 13 years without evidence of immunity [8]. This report presents comparison of the incidence of varicella infection and the clinical presentation of varicella disease at the end of one-dose vaccination era (2005-2006) and the initiation of two-dose varicella vaccine era (2007-2008). METHODS Varicella Active Surveillance Project (VASP) conducts active surveillance for varicella disease from more than 300 surveillance sites, which include daycare centers, schools, households, public health clinics, hospitals, skilled nursing facilities, private practice physicians, health maintenance organization offices and correctional facilities. All sites report varicella cases to the VASP every two weeks, even if no cases are identified. Vaccine providers reported varicella vaccine doses administered by age group on a monthly basis. Project staff completed a structured telephone interview with each case or parent/guardian to collect detailed demographic and clinical data. Case Definitions
o A varicella case is defined as illness with acute onset of a diffuse maculopapulovesicular rash without other known cause that is diagnosed and/or reported by a licensed healthcare provider, school attendance staff, or parents.
o A verified varicella case has a completed case report which validates the diagnosis of varicella and resides in the Antelope Valley (AV).
o A breakthrough (BT) varicella case has illness consistent with varicella infection >42 days after documented varicella vaccination.
o A probable varicella case is reported by a healthcare provider with a clinical history that could not be confirmed by medical chart review or case interview.

Varicella after Two-Dose Varicella Vaccine Page 68
Acute Communicable Disease Control 2009 Special Studies Report
Vaccination history is verified on each case using the vaccination record provided by the case, the school, or the medical provider. Susceptible household members are interviewed four to six weeks after the initial contact to identify additional household cases. If phone interview is not obtainable, medical records are reviewed to verify varicella cases. All data were entered into Microsoft Access and data analysis was performed with SAS® 9.2. Only verified cases were included in the analysis. Annual varicella incidence rates were calculated using AV 2005-2008 US census data as denominators. The relative risk of acquiring varicella in the one-dose era compared to the two-dose vaccine era was calculated comparing the incidence of varicella from 2005-2006 to the incidence of varicella during 2007-2008. The Chi-square test was used to assess statistical significance among variables. RESULTS From 2005-2008, 1617 varicella cases were reported; 1270 were verified cases, 56 cases were classified as probable, and 347 cases were excluded because residence was out of the surveillance area or the diagnosis was not consistent with the varicella case definition. Of 1270 verified varicella cases, 757 (60%) and 513 (40%), were reported in 2005-2006 and 2007-2008, respectively. Of the 757 cases, 36 (4.8%) cases were less than one year of age, 92 (12.1%) were 1-4 years, 286 (37.8%) were 5-9 years, 249 (32.9%) were 10-14 years, 38 (5%) were 15-19 years, and 56 (7.4%) were 20 years and older (Table 1). Of the 513 verified cases from 2007-2008, 24 (4.7%) cases were less than one year of age, 72 (14%) were between 1-4 years, 179 (34.9%) were 5-9 years, 168 (32.7%) were 10-14 years, 37 (7.2%) were 15-19 years, and 33 (6.4%) were 20 years and older (Table 1).
Table 1: Verified varicella cases and age- specific incidence rates (IR), Antelope Valley, California, 2005-2008 Age (years)
2005-2006 2007-2008
n (%) IR (#/1000 pop)
n (%) IR (#/1000 pop)
RR (95% CI)
< 1 36 (4.8) 3.3 24 (4.7) 2.0 1.7 (1.27-2.13) 1 – 4 92 (12.1) 2.2 72 (14.0) 1.5 1.5 (1.28-1.72) 5 – 9 286 (37.8) 5.4 179 (34.9) 3.5 1.5 (1.36-1.64) 10 – 14 249 (32.9) 3.8 168 (32.7) 2.7 1.4 (1.26-1.54) 15 – 19 38 (5.0) 0.6 37 (7.2) 0.5 1.2 (0.93-1.47) > 19 56 (7.4) 0.12 33 (6.4) 0.07 1.7 (1.45-1.95) Total 757 (100) 1.1 513 (100) 0.7 1.6 (1.52-1.68)
When the varicella overall incidence rate was compared among all age groups, the varicella incidence declined significantly from 2.6 (2005-2006) to 1.7 (2007-2008) cases per 1,000 population (p<0.05) in the two periods, respectively. All age groups <15 years and those >19 years of age show that the risk of varicella disease was greater in the one-dose era, 2005-6, versus the two dose era, 2007-8 (Table 1). Vaccine doses increased among all age groups <15 years in 2007-2008 compared to 2005-2006. The overall varicella vaccine doses also increased by 149% during this period from 14,858 in 2005-2006 to 37,107 doses in 2007-2008. The largest increase in vaccine doses was among the 5-9 year range increasing from 1666 to 11,504 doses during the respective time periods (Table 2).

Varicella after Two-Dose Varicella Vaccine
Page 69
Acute Communicable Disease Control 2009 Special Studies Report
Table 2: Varicella Vaccine Doses Administered by Age Group, Antelope Valley, California, 2005 – 2008
Age Group 2005-2006 2007-2008 # vaccine doses (%) # vaccine doses (%)
1-2 9943 (66.4) 12027 (32.4) 3-4 1104 (7.5) 4643 (12.5) 5-9 1666 (11.1) 11504 (31.0) 10-12 1202 (8.0) 5246 (14.1) 13-19 906 (6.0) 3567 (9.6) >19 162 (1.1) 120 (0.3) Total 14983 (100) 37107 (100)
Verified breakthrough (BT) cases also declined in 2007-2008 compared to the number reported in 2005-2006. Of the 1270 were verified cases documented from 2005-2008, 727 cases were BT. Of 727 BT varicella cases, 414 and 313 were reported in 2005-2006 and 2007-2008, respectively. The overall proportion of BT cases declined by 25% in the two respective study periods (p>0.05). Of the 414 cases from 2005-2006, 50 (12.0%) were 1-4 years, 242 (58.5) were 5-9 years, 113 (27.3%) were 10-14 years, 7 (1.7%) were 15-19 years, and 2 (0.5%) were 20 years and older. Of the 313 verified cases from 2007-2008, 43 (13.7%) were 1-4 years, 156 (49.8%) were 5-9 years, 111 (35.5%) were 10-14 years, and 3 (1.0%) were 15-19 years (data not shown). The largest proportion of BT cases in both time periods were among children 5-9 year olds. Cases in this age group declined by 35 % from 242 to 156, cases, within the respective time periods, (p=0.01). The median age of BT cases also increased from 8 years in 2005-2006 to 9 years in 2007-08. The proportion of cases exhibiting a mild clinical presentation increased in 2007-2008 compared to 2005-2006. Cases reporting <50 lesions increased from 55% (2005-2006) to 62% (2007-2008) (p=0.02). Fewer cases reported 50-250 lesions and >250 lesions from 2005-2006 to 2007-2008, but neither of these differences was statistically significant (Figure 1).
Figure 1: Clinical presentation of verified varicella cases, rash description and lesions at presentation, Antelope Valley, CA, 2005-2008.

Varicella after Two-Dose Varicella Vaccine Page 70
Acute Communicable Disease Control 2009 Special Studies Report
The proportion reporting mostly macular/papular rash increased from 62% in 2005-2006 to 70% in 2007-2008 (p=0.01) and those reporting vesicular rash decreased from 37% in 2005-2006 to 23% in 2007-2008 (p<0.01) (Figure 1). CONCLUSION Varicella incidence declined significantly among all age groups <15 years with the adoption of the recommended two-dose varicella regimen in 2007. There was a 47.6 % decline in overall incidence from 2005-2006 compared to 2007-2008. During both time periods, the 5-9 year old group had the highest age-specific incidence of any of the age groups. This group also had the most significant in age-specific incidence decline with incidence declining from 5.4 to 3.5 cases per 1,000 population (p<0.0001) in the two time periods. The 5-9 year old age group also had the greatest increase in varicella vaccine doses, with an increase of 590.5% in the two time periods (Table 2). The decline in varicella case reports and age specific incidence rates among almost age groups supports the assumption that community-wide varicella transmission was interrupted with the adoption of two-dose of varicella recommendation. There was also a significant decline in reported BT cases during the two time periods. The total 727 BT varicella cases made up 57% and 43% of total cases in 2005-2006 and 2007-2008, respectively. The decline in BT cases was most likely due to the increased number of children that were vaccinated in the 1-4 and 5-9 age groups. Vaccine distribution data from VASP also supported that vaccine providers supported the updated ACIP recommendation. The greatest increase in vaccine distribution in 2007-2008 was among the following age groups 1-4 years, 5-9 years and 10-14 years which also correspond to the greatest declines in varicella incidence (Table 2). VASP surveillance activities are scheduled to continue through September 30, 2011. The current surveillance project challenges include: increasing specimen collection of both BT and non-BT associated varicella cases, continue strong surveillance site project participation and to assess the vaccine coverage within the surveillance area. Concurrently, the project is participating in a combined VASP (Antelope Valley and Philadelphia) case-control study whose goal is to assess the vaccine efficacy of two-dose versus one-dose varicella vaccine regimen. It is hoped that this study will increase laboratory confirmation of varicella cases and to lead to a better understanding of the enhanced protection with the two-dose versus one-dose varicella vaccine schedule. REFERENCES 1. Centers for Disease Control and Prevention (CDC). Vaccine side effects, adverse reactions,
contraindications, and precautions recommendations: Recommendations of the Advisory Committee on Immunization Practices (ACIP) – United States, 1996. MMWR September 06, 1996, 45 (RR 12); 1-35.
2. Advisory Committee on Immunization Practices. http://www.cdc.gov/vaccines/stats-surv/imz-coverage. Accessed on March 9, 2010.
3. Guris D, Jumann AO, Mascola L, et al. Changing varicella epidemiology in active surveillances sites- United States, 1995-2005, J Infect Dis 2008; 197: S71-5.
4. Lopez As, Guris D, Zimmerman L, et al. One dose of varicella vaccine dose not prevent school outbreaks: is time for a second dose? Pediatrics 2006; 117:e1070-7.
5. Seward JF, Marin M, Vasquez M. Varicella vaccine effectiveness in the US vaccination program: a review. J Infect Dis 2008; 197: S82-89.
6. Kutter B, Matthews H, Shinefield H, et al. Ten year follow-up of healthy children who received one or two injections of varicella vaccine. Pediatr Infect Dis J 2004; 23:132-7.
7. Watson B, Rothstein E, Bernstein H, et al. Safety and cellular and humoral immune responses of a booster dose of varicella vaccine 6 years after primary immunization. J Infect Dis 1995; 172:217-9.
8. CDC. Prevention of Varicella Recommendations of the Advisory Committee on Immunization Practices (ACIP) – United States, 2007. MMWR June 22, 2007, Vol.56, N0. RR-4.