accuracy of grid pricing: an evaluation using wholesale
TRANSCRIPT

Accuracy of Grid Pricing: An Evaluation Using
Wholesale Values of Fed Cattleby
Joseph T. Kovanda, Ted C. Schroeder,
and Tommy L. Wheeler
Suggested citation format:Kovanda, J. T., T. C. Schroeder, and T. L. Wheeler. 2004. “Accuracy of Grid Pricing: An Evaluation Using Wholesale Values of Fed Cattle.” Proceedings of the NCR-134 Conference on Applied Commodity Price Analysis, Forecasting, and Market Risk Management. St. Louis, MO. [http://www.farmdoc.uiuc.edu/nccc134].

Accuracy of Grid Pricing: An Evaluation Using Wholesale Values of Fed Cattle
Joseph T. Kovanda,
Ted C. Schroeder,
and
Tommy L. Wheeler
Paper presented at the NCR-134 Conference on Applied Commodity Price Analysis, Forecasting, and Market Risk Management
St. Louis, Missouri, April 19-20, 2004
Copyright 2004 by Joseph T. Kovanda, Ted C. Schroeder, and Tommy L. Wheeler. All rights reserved. Readers may make verbatim copies of this document for non-commercial purposes by any means, provided that this copyright notice appears on all such copies.
Kovanda is a graduate research assistant ([email protected]) and Schroeder is a professor ([email protected]), Department of Agricultural Economics, Kansas State University. Wheeler is a Research Food Technologist, Roman L. Hruska U.S. Meat Animal Research Center, Clay Center, Nebraska.

2
Accuracy of Grid Pricing: An Evaluation Using Wholesale Values of Fed Cattle
Practitioner’s Abstract
Grid pricing is one of the beef industry’s answers to improving value coordination in fed cattle transactions. This paper constructs individual carcass-level grid and wholesale beef values. These values are used to evaluate the level of value communication that occurs between wholesale and grid values of beef. Furthermore, the values are used to estimate grid premiums/discounts that improve value communication. Results indicate that value coordination could be improved by modifying grid premiums/discounts. Keywords: Cattle, Price Signaling, Grid Pricing, Value-Based Marketing
Introduction
Marketing methods used to value fed cattle during the 1980s and 1990s were inefficient at communicating consumer preferences for beef to stakeholders along the beef value chain [Purcell; Fausti, Feuz, and Wagner; Schroeder et al. (1998)]. One of the industry’s major initiatives aimed at overcoming communication obstacles has been value-based marketing. A 1990 Cattlemen’s Beef Board (Cross and Savell) study recommended fed cattle valuation occur on an individual animal basis rather than an average live-weight basis. The beef industry has heeded this advice by improving fed cattle marketing methods predominately through the use of grid pricing methods. Grid pricing values animals on an individual basis and considers each animal’s carcass characteristics (quality, yield, weight, etc.) in assigning values. This marketing method is believed to be a more accurate method of assigning prices that reflect an individual animal’s economic value than average live- or dressed-weight pricing.
Ultimately beef cattle derive their value from the consumer’s retail valuation of beef products. Effective communication, therefore, conveys information about consumer acceptance and valuation of beef products. Consumer preferences are reflected in what they are willing to pay for beef at the retail and food service levels, which should also be reflected in wholesale beef and fed cattle prices. If grid pricing enhances communication of consumer preferences relative to traditional pricing methods, grid value will be more closely related to wholesale and retail beef values.
The first objective of this study was to assess how well grid prices predict or reflect downstream values of beef (wholesale values) to producers of fed cattle. The second objective was to determine if value communication can be enhanced by improvements in grid pricing. In other words, if grid pricing does not fully reflect wholesale beef values, then the variation in wholesale values left unexplained by grid valuation methods could potentially be explained by a superior method. Thus, this

3
objective aims to determine if this unexplained value can be better explained by altering current pricing structures.
The first section of this paper discusses the structure of grid pricing and recent
cattle valuation research. The next two sections outline the empirical models and procedures for the analysis. Next, the data used in this study is discussed. Finally, estimation results are discussed, interpreted, and applied to the data to examine the implications of altering grid pricing structure.
Valuing Fed Cattle
Grid pricing aims to overcome valuation obstacles that average-based pricing perpetuates. Average-based pricing (live- or dressed-weight) determines the transaction price for a pen of fed cattle based on an estimation of the pen’s average quality and yield. Two problems exist with this method: (1) carcass characteristics cannot be accurately estimated from live animals because large variation in meat quality and yield often exists among finished animals in the same pen and (2) the same price that is established on the average animal is applied to all animals in a pen. Average-based pricing confuses value because it is based on inaccurate estimates and assigns animal values based on the pen’s average animal. Therefore, to improve fed cattle value discovery, it is vital to decrease estimation error and value animals individually. Grid pricing aims to overcome these obstacles.
Grids are composed of a base price ($/dressed cwt.) and a matrix of
premiums/discounts that reward/penalize carcass attributes. Premiums/discounts are based on carcass weight and USDA quality and yield grades which are measured after slaughter. Quality grades measure palatability and are based on skeletal maturity and marbling score (measure of intra-muscular fat). Quality grades applied by USDA graders on most fed steers and heifers are Prime, Choice, Select, or Standard. Yield grades estimate carcass cutability (the percentage of boneless, closely trimmed retail cuts from the chuck, rib, loin, and round obtainable from a carcass). Yield grades applied by USDA graders are integer estimates of the actual yield grade (1-5) where 1 is the highest cutability. Certified Angus (CAB) is a hybrid premium applicable to carcasses that have marbling scores that qualify them for the upper 2/3 of the Choice grade, a yield grade less than 4, and Angus breed characteristics. Most grid base prices are based on Choice yield grade 3 carcasses weighing between 600 and 900 lbs. Various methods are used to establish the base price including cash market, plant-average, negotiated prices, or other methods. Furthermore, premium/discount structures differ across grids.
Predominantly three marketing methods (live-weight, dressed-weight, and grids)
are currently used for valuing fed cattle. Schroeder and Graff (2000) found that grid pricing is more selective in assigning prices to individual animals than either live- or dressed-weight pricing. Furthermore, variation in revenue is significantly higher for cattle priced on a grid than for the same cattle priced via live-weight methods (Feuz, Fausti, and Wagner). Variation in fed cattle prices is important because, “to achieve
4
pricing accuracy and send clearer signals to producers, better quality cattle should be rewarded and poorer quality cattle should be discounted. Combined, that means price variation” (Ward and Lee, p. 54).
Despite benefits that grids have in assigning discriminatory prices among
carcasses, questions have been raised about grid pricing accuracy. The stepwise discount/premium structure of grid marketing and the value that such a structure communicates has been questioned. Schroeder et al. (2002) suggested that grid pricing accuracy could be increased if continuous measures of quality and yield, like marbling and red meat yield, were implemented. Tronstad and Marchello evaluated the efficiency of live-weight and grid pricing methods in measuring an animal’s boxed beef cutout value. Live-weight, grid, and boxed beef cutout values were net of feeder animal’s purchase price and the feeding costs of fattening the animal. Additionally, the cost of transforming a live animal into wholesale components was deducted from the boxed beef cutout value. Boxed beef cutout values were the product of the weight of each wholesale component of the carcass and its corresponding price plus the by-product values minus costs. The study constructed live-weight, grid, and boxed beef cutout values at three separate years (1997-1999) based on carcass data from 315 steers. Using these values, they evaluated the efficiency of both live-weight and grid marketing methods. Results indicated that live-weight values were efficient price signaling methods over all time periods and grid values were efficient price signaling methods for only one of the three time periods.
Carcass-level wholesale values are difficult to construct because carcasses lose their identity after fabrication causing the carcass that wholesale products are derived from to be unknown. Meat science carcass dissection research, however, facilitates construction of carcass-level wholesale values (Gardner et al., Savell et al.). Wholesale product weights (sub-primals, lean trim, fat, and bone) in these studies were multiplied with matching sub-primal prices to produce values for each wholesale product from a carcass. Next, all the wholesale product values from a carcass were summed and slaughter/fabrication costs were subtracted to generate carcass-level wholesale values. These studies have recognized that, based upon differences in wholesale values among carcasses with different carcass characteristics, packers have an incentive to accurately encourage/discourage production of specific carcass characteristics.
Analyzing Grid Pricing Accuracy
Value signals are better communicated through assigning individual carcass values rather than assigning an average price to a group of fed cattle (Feuz, 1999a). Individual fed cattle grid prices for each carcass can be formulated as:
tntntntntntn owyqoutpremwtpremygpremqgpremdbasepricegridp ,..,,, ++++= (1)
where t refers to time and n to individual carcass, tngridp , is the dressed price ($/dressed cwt.) for carcass n at time period t, tdbaseprice is the price ($/dressed cwt.) for a carcass

5
with specified “base” carcass characteristics, tnqqgprem , is the quality grade
premium/discount ($/dressed cwt.), tnyygprem . is the yield grade premium/discount
($/dressed cwt.), and tnwwtprem . is the weight premium/discount ($/dressed cwt.) and
tnooutprem , is the out (e.g. stags, dairy-type, hard bones, and dark cutters) discount price. The dressed base price for carcass n at time period t is derived from the live-weight price ($/cwt.) and the individual animal’s dressing percentage. Total grid value ($/head) is the product of tngridp , and hot carcass weight, nhcw . Hot carcass weight (cwt.) is the weight taken after carcasses are eviscerated and all byproducts are removed. Therefore, carcass by-product value is not encompassed in the calculation of grid value. Rather, the grid value is a function only of a carcass’s grid price and its hot carcass weight. This fact is noteworthy in considering what wholesale value information is important in determining a carcass grid value. Beef processing can primarily be divided into two separate tasks: slaughter and fabrication. Slaughter processes include hide removal, evisceration, and carcass sanitation. Saleable products extracted from an animal during slaughter are often referred to as by-products or drop. Byproducts include hides, tongues, lungs, etc. and their saleable value primarily depends upon weight. After slaughter, carcasses are weighed and graded. At this point, a grid price for each carcass can be established because all the characteristics that determine the grid price are known. After grading, the fabrication process disassembles carcasses into primals, sub-primals, bone, fat, and lean trim products. At this point, carcasses lose the identity by which the grid price was assigned. However, if each of the carcass’s disassembled products (by-products, primals, sub-primals, bone, fat, and lean trim) is identifiable at the point of sale, each product’s sale price could be summed to construct the revenue received from an individual carcass’s disassembled beef products. Each carcass’s wholesale value is composed of values from both the slaughter and fabrication process:
∑∑==
+=K
kktn
J
jjtntn fabproductbyprodvwlsval
1,,
1,,, (2)
where tnwlsval , is the wholesale value ($/head), jtnbyprodv ,, is the sale price ($/product) for by-product j, and ktnfabproduct ,, is the sale price ($/product) for fabricated product k. J and K represent the number of by-products and fabricated products, respectively, which come from each carcass.
Fabricated product values are constructed based on product characteristics and corresponding exogenous market prices for cuts with similar specifications, such that:
knktktn productwtwlspricefabproduct ,,,, *= (3) where ktwlsprice , is the exogenous market price and knproductwt , is the weight of product. Market prices for fabricated products primarily differ based on four characteristics: the quality grade of the product, the weight of the product, the level of exterior fat that remains on the product, and the dimensions of the product. Therefore, each k product is distinguished by the combination of these four characteristics. For

6
example, a Choice and a Select ribeye roll, both weighing 10 pounds and containing no more that 0.25” of exterior fat are considered different products because they have different quality grades. Summing all k product values (3) disassembled from carcass n yields:
)*( ,,1
, knkt
K
ktn productwtwlspricefabwlsval ∑
=
= (4)
where tnfabwlsval , is the revenue received from all of the fabricated products.
Constructing grid and wholesale based carcass values facilitates an evaluation of value coordination between buyers (packers) and sellers (feeders) of fed cattle. The wholesale based carcass value reflects an individual carcass’s aggregate value of fabricated wholesale products. The grid carcass value reflects the packer’s willingness to pay for a live animal which contains raw by-products and raw fabrication products. As noted earlier, the carcass’s grid value is measured after by-products have been removed, so the byproduct value is not encompassed in the grid value directly. The weight of a whole carcass does not equal the sum of the weights of each product fabricated from the carcass. Due to dehydration, the weight of a carcass shrinks between slaughter and fabrication. The amount of shrink varies with each carcass and is the difference between hot carcass weight and the cumulative weight of fabricated products.
To ensure that grid carcass values communicate consumer value for beef to producers of fed cattle, grid values should be derived from values that accurately reflect consumer preferences. If consumer preferences for beef are accurately encompassed in retail values of beef, information flows from retailer to wholesaler (packer), to cattle producer (feeder). Assuming that wholesale beef procurement methods result in an accurate transfer of consumer preferences from the retailer to the wholesaler,
tnfabwlsval , provides an accurate value for comparison with grid carcass values. Grid carcass values, therefore, should be derived from wholesale values of beef in order to effectively communicate the information flows that wholesalers receive from retailers. Therefore, the relationship between tnfabwlsval , and tngridv , is important in evaluating the accurate communication of consumer preferences to cattle producers via grid valuation systems. Since hot carcass weight and the weight of fabricated products differ by the amount of carcass shrink, shrinkn encompasses the weight that is included in tngridv , , but is not included in tnfabwlsval , for carcass n. In order to produce grid and fabricated wholesale values based on the same weight, grid values are adjusted for the weight of shrink such that:
]100/)[(*,, nntntn shrinkhcwgridpgridv −= (5) As a result, any differences in grid and fabricated wholesale values due to differences in weight are eliminated. Therefore, a carcass’s grid value is a function of its value of fabricated products.
Modeling this functional relationship over a sample of carcasses having varied quality attributes, tests the strength of the relationship between grid and wholesale carcass values of fed cattle at one point in time. Therefore, Ordinary Least Squares

7
(OLS) regression was used to model the relationship between tngridv , and tnfabwlsval , . A linear specification of this functional relationship was used to estimate the OLS model:
ttt fabwlsvalgridv εαα ++= 10 (6) where t is the week analyzed and tε is the error term. 1α reflects how much a carcass’s gridv increases/decreases given a unit increase/decrease in a carcass’s .fabwlsval This estimated value is important in evaluating the accuracy of grid valuation methods because it explains how well changes in the wholesale value of fabricated products from a particular carcass are communicated in the carcass’s grid value. Equation 5 is estimated over three different market environments, to estimate the accuracy of grid pricing at different time periods. The hypothesis, 1α =1, is tested for each of three time periods to determine if grid valuation methods are accurate at communicating wholesale beef values.
Analyzing the Accuracy of Grid Premiums and Discounts
Grid carcass values depend on dressed-weight fed cattle prices and individual carcass characteristics. Premiums (discounts) are added to (subtracted from) the base price to calculate net price. In theory premiums/discounts should be derived from revenues and costs associated with fabricating live cattle into wholesale beef cuts. The premium/discount associated with a particular carcass characteristic is the difference between the revenue (value) and the fabrication cost associated with manufacturing wholesale beef cuts from the particular carcass characteristic. If costs exceed revenues for a particular characteristic, then carcasses exhibiting this characteristic would receive a discount compared to the base grid price. Conversely, if revenues exceed costs for a particular characteristic, then carcasses exhibiting this carcass characteristic would receive a premium compared to the base grid price. Absent data revealing the incremental revenue and cost for each carcass characteristic, the actual premium or discount associated with a given carcass characteristic cannot be calculated. The value of a particular carcass characteristic is important in evaluating the accuracy of grid values. To encourage production of carcasses with valuable carcass characteristics and to discourage production of less desirable characteristics, packers must provide incentives/disincentives. Packer incentives/disincentives should be based on the packer value of the carcass characteristic in order for accurate value communication to occur between packers and fed cattle producers. Assuming the incremental cost of fabricating a carcass with carcass characteristic m is the same for all levels of m, the packer premium/discount for carcass characteristic m only varies among levels of m when the revenue associated with carcass characteristic m varies. Comparing the premium/discount that the packer incurs to the actual premium/discount paid to the fed cattle producer, reveals how well the packer premium/discount is transferred between packer and fed cattle producer. This comparison facilitates evaluation of how accurately the beef value chain is sending signals via grid premiums/discounts.
8
The difference between premiums/discounts ($/cwt.) incurred by packers for carcass characteristic m at time period t, tmprem , , and the per cwt. values of the premium or discount actually used in grid valuation systems, tmgridprem , , measures the error in a particular grid premium or discount, tmerrprem , :
tmtmtm gridprempremerrprem ,,, −= (7) where tmerrprem , , tmprem , , and tmgridprem , are measured in $/cwt. Therefore, the total error in grid premiums/discounts ($/cwt.), tntoterrprem , , for carcass n at time period t is:
∑=
=M
mtnmtn errpremtoterrprem
1,,, (8)
where M is the number of carcass characteristics measured to determine carcass value.
The value of fabricated products from a carcass, tnfabwlsval , , in dollars per cwt. and carcass grid values in dollars per cwt. are useful for estimating packer incurred grid premiums/discounts. Per cwt. values of fabricated products, tnwtfabwlsvalc , , were derived by dividing tnfabwlsval , by nhcw . Per cwt. grid values, tngridvcwt , , were derived by dividing tngridv , from (5) by nhcw . Assuming that tnwtfabwlsvalc , is an accurate reflection of consumer preferences for beef, the total error in grid premiums/discounts is:
tntntn gridvcwtwtfabwlsvalctoterrprem ,,, −= (9) Rearranging equation 8 and combining it with equation 7, yields:
∑=
=M
mtnmtn errpremvalue
1,,, (10)
where tnvalue , is the difference between tnwtfabwlsvalc , and the tngridvcwt , in $/cwt. Therefore, tnvalue , is a function of the summed errors in grid premiums/discounts for carcass characteristic m from carcass n at time period t. This functional form is estimated for all carcasses using a linear specified OLS regression:
tn
tn
marbmarbmarbmarbygygygygyg
hcwhcwhcwhcwhcwhcwvalue
,15
1413121110987
6543210,
432154321
654321
εβββββββββ
βββββββ
+++++++++
+++++++=
(11)
where hcw1, hcw2, hcw3, hcw4, hcw5, and hcw6 are dummy variables for carcasses weighing between 450 and 499, 500 and 549, 550 and 599, 900 and 949, 950 and 999, and greater than 999 lbs., respectively. Dummy variables for carcasses having yield grades between 0 and 1.99, 2.00 and 2.49, 2.50 and 2.99, 4.00 and 4.99, and 5.00 and 7.00 are designated yg1, yg2, yg3, yg4,and yg5, respectively. Dummy variables for carcasses having marbling scores between 0 and 399, 400 and 499, and 800 and 1000 are designated marb1, marb2, and marb4, respectively. Dummy variables for CAB carcasses (i.e. marbling score between 600 and 799 and yield grade less than 4.00) are designated marb3. Carcasses weighing between 600 and 899 lbs, having a yield grade between 3.00 and 3.99, and having a marbling score between 500 and 599 are bases for hot carcass weight, yield grade, and marbling score, respectively. Therefore, dummy variables corresponding to these base values are excluded from the model.

9
The coefficients from (11) are estimates of tmerrprem , ($/cwt.) compared to the base carcass premium/discount ($/cwt.), 0β . Substituting the estimated errors in grid premiums or discounts, tmerrprem , , and the actual premiums or discounts ($/cwt.) for time period t, tmgridprem , , into (7) yields estimated values for tmprem , in $/cwt. Furthermore, 0β is an estimate of the difference between fabwlsvalcwt and gridvcwt for carcasses with “base” carcass characteristics.
Ninety-five percent confidence intervals (CI) were constructed for the parameter estimates and the intercept estimated from (11). These CI’s were then converted to CI’s estimated premiums and discounts using (7). If the actual premium or discount did not lie within the confidence interval of the estimated premium or discount, then the actual premium or discount was assumed to be inaccurate at communicating the value associated with that particular carcass characteristic. Furthermore, estimated grid prices for the sample of carcasses were calculated using the estimated grid premiums and discounts and (1). If a particular carcass exhibited “base” carcass characteristics, then the estimated grid price was the sum of the dressed base price and 0β from (11). For an individual carcass, the absolute valuation error due to pricing error was the difference between the actual and the estimated grid value.
Data
Carcass data (n=3,547 steers) for this study were collected by animal scientists at the Roman L. Hruska US Meat Animal Research Center (MARC) over three separate studies between 1978 and 1994 [Gregory et al., Wheeler et al. (1997), and Wheeler et al. (2001)]. Table 1 presents summary statistics for the relevant carcass characteristics used to calculate the grid value. The set contained no hard bone, dark cutting, stag, or dairy carcasses. Live steers were individually weighed before slaughter to obtain a live weight to use in calculating an individual animal dressing percentage. No-roll carcasses (those not receiving a USDA quality grade) were assumed to be Standard carcasses.

10
Table 1: Summary Statistics for Carcass Measurements from MARC Carcasses
Variable Mean Std. Dev. Minimum Maximum
Live Weight (lbs.) 1188.34 141.34 752.00 1770.00 Hot Carcass Weight (lbs.) 729.00 91.58 472.00 1079.00 Dressing Percentage (%) 61.33 2.16 50.25 72.38 Marbling Scorea 502.98 68.98 280.00 890.00 Quality Gradeb 1.54 0.68 0.00 4.00 Yield Grade 2.92 0.85 0.44 6.93 Number of Observations (carcasses) 3,547 a200=Practically devoid0, 300=Traces0, 400=Slight0, 500=Small0, 600=Modest0, 700=Moderate0, 800=Slightly Abundant0, 900=Moderately Abundant0 b0=No-Roll, 1=Select, 2=Low Choice, 3=Average/Top Choice, 4=Prime
This sample of carcasses was used to evaluate the accuracy of grid pricing across the industry. Thus, it was important that the MARC sample contained carcasses that reflected a wide variety of carcass characteristics to develop reliable results that applied to carcasses produced in the industry. Both the range and the frequency of the MARC carcass characteristics indicate that a wide variety of carcass characteristics (quality grade, yield grade, and weight) were presented in the MARC sample.
Simple average premiums/discounts from the USDA-AMS National Weekly Direct Slaughter Cattle-Premiums and Discounts report were used to represent an average of all the various grid pricing structures currently used. Each of the MARC carcasses was valued according to this grid structure. The Weekly Live Steer Average Price from the USDA-AMS Kansas Weekly Weighted Average Cattle Report was used to calculate the base price for each carcass. This price was divided by each carcass’s dressing percentage to produce the dressed base price for each carcass. The Weekly Live Steer Average Price is reported for the week that the cattle were traded. Therefore, it was assumed that cattle priced on the Weekly Live Steer Average Price were slaughtered during the week following the week that they were traded. As a result, the Weekly Live Steer Average Price used to calculate the grid base price was established the week prior to the National Weekly Direct Slaughter Cattle-Premiums and Discounts that was used to calculate grid premiums/discounts.
The Average/Top Choice premium from the USDA-AMS National Weekly Direct Slaughter Cattle-Premiums and Discounts report was assumed to represent premiums paid for cattle that qualified as Certified Angus Beef (CAB) premiums. According to the USDA Certified and Process Verified Programs requirements, carcasses that receive CAB premiums must meet four criteria relevant to this data set: (1) a marbling score between 600-799, (2) yield grade less than 3.9, (3) hide color that is at least 51% black, and (4) hump height less than 2 inches. Hide color and hump height were not distinguished by the MARC carcass data. Therefore, even though it could not be verified, it was assumed that carcasses that met the first two criteria for CAB eligibility

11
also met the third and forth criteria. This CAB criterion caused the CAB premium to be unique from other grid premiums/discounts.
Right sides of each of the carcasses were fabricated into sub-primal beef cuts
according to a standard cutting procedure. Following fabrication, each of the sub-primals was trimmed to 0.30 inches of external fat and resultant products were weighed. The carcass’s left sides were assumed to be identical to their right sides.
Wholesale product prices were obtained from Urner Barry Publications
Incorportated’s (UB) Comtell database and the USDA-AMS. Weekly average prices from these two sources were matched with the appropriate wholesale product (excluding fat and bone products) produced from the MARC carcasses to construct product values. CAB prices were only applied to sub-primal products that were derived from carcasses that qualified for CAB grid premiums. The NAMP identification number was used to match the fabricated product specifications with the UB prices. In some cases the wholesale products produced by the fabrication procedure were either not traded or were traded at such low volumes that prices were not reported for these products. Therefore, when prices for a particular product were unavailable, the price from the most closely related (according to NAMP specifications) product was used as a proxy1. In other cases not all quality grade levels of the product had price quotes. For these products, the price from the next lower quality grade of the same product was assigned as the price2.
Price quotes for Standard quality grade products were not available. In the beef
industry Select and Standard carcasses are often not quality graded and are referred to as “No-Roll.” In order to assign values to the sub-primal products from Standard carcasses, it was assumed that No-Roll prices were adequate for valuing Standard products. The accuracy of this assumption depends on the actual quality grade of the product for which these UB prices were established. If No-Roll prices were established on sub-primal products that predominately received a Standard quality grade, then this assumption was accurate.
Grid and wholesale carcass-level values were constructed at three separate market
environments to analyze accuracy of grid pricing under different market fundamentals. The weekly Choice/Select spread (calculated from USDA’s National Daily Boxed Beef Cutout and Boxed Beef Cuts) over the sample time period was used as a guide for choosing three distinctly different market environments. The Choice/Select spread reflects the estimated difference in carcass values between Choice and Select carcasses. The Choice/Select spread ranged from $4.11/cwt. to $34.04/cwt., averaged $10.85/cwt., and had a standard deviation of $6.94/cwt over the time period. Three weeks were selected for analysis: low (Choice/Select spread for the week beginning July 8, 2002 was $4.11/cwt.), average (Choice/Select spread for the week beginning August 18, 2003 was $10.91/cwt.), and high (Choice/Select spread for the week beginning November 17, 2003 was $17.63/cwt.).
1 Of the 17 wholesale products produced from each carcass, proxy prices for four products were used. 2 Prime and CAB prices were not available for 11 and 3 of the 17 wholesale products produced, respectively.

12
Table 2 compares the premium/discount structure used to construct grid values for
each of the three time periods. The three environments encompass a wide range of base prices from $63.82/dressed cwt. to $100.19/dressed cwt. for the low and high market environments, respectively. Furthermore, large ranges exist for Select and Standard discounts across the three time periods.
Table 2: Premium/Discounts Structure at Three Market Environments
Variable Averageb Highb Lowb Base Priceb ($/live cwt.) 78.13 100.19 63.82 Premiums/Discounts ($/dressed cwt.)
Prime 7.25 8.50 4.69 CAB 1.95 1.50 1.22 Choice 0.00 0.00 0.00 Select -9.54 -20.44 -7.23 Standard -18.33 -27.69 -13.35
Yield Grade <2.00 2.92 3.25 2.58 2.00-2.49 1.79 1.92 1.63 2.50-2.99 1.38 1.50 1.38 3.00-3.49 0.00 -0.08 -0.08 3.50-3.99 0.00 -0.08 -0.08 4.00-4.99 -13.18 -13.36 -11.42 >5.00 -18.31 -17.75 -18.08
Hot Carcass Weight (lbs.) 400-499 -24.50 -24.08 -21.25 500-549 -16.58 -16.58 -14.25 550-599 -4.08 -3.17 -5.00 600-899 0.00 0.00 0.00 900-949 -1.25 -1.25 -1.25 950-999 -7.75 -6.92 -5.33 >1000 -18.58 -20.00 -15.73
aSource: National Carcass Premiums and Discounts for Slaughter Steers and Heifers: USDA, AMS. b”Average” represents prices for the week beginning August 18, 2003, “High” represents prices for the week beginning November 17, 2003, and “Low” represents prices for the week beginning July 8, 2002. cWeekly Accumulated Live Steer Average Price from the Kansas Weekly Weighted Average Cattle Report-Negotiated Purchases: USDA, AMS.
Gridv, fabwlsval, and value were constructed for each carcass at each of the three
time periods. For simplicity, table 3 shows the summary statistics for each of these

13
variables at only the average time period. Gridv, fabwlsval, and value are measured in dollars per head. The high period resulted in the largest average values for gridv and fabwlsval, while the low period resulted in the smallest average values for those values. In each market environment, average fabwlsval was greater than average gridv. Variability of gridv and fabwlsval progressively increased from low to high among the three time periods. Table 3: Summary Statistics for gridv, fabwlsval, shrink, and value for the Average
Market Environment Average
(Week Beginning August 18, 2003) Mean Std. Dev. Minimum Maximum
gridva 844.68 113.38 412.56 1180.06 fabwlsvalb 905.10 119.99 575.80 1473.53 shrinkc 33.75 11.80 0.20 82.35 valued 60.42 55.50 -133.30 370.09 Observations (carcasses) 3,547 aGrid value of a carcass ($/head). bRevenue received from all fabricated products from a carcass ($/head). cWeight of carcass shrink between slaughter and fabrication (lbs.). dDifference between fabwlsval and gridv for a carcass ($/head).
Grid Pricing Accuracy Results In this section results from estimating (6) are presented. Recall, (6) used a linear OLS specification:
ttt fabwlsvalgridv εαα ++= 10 (6) and was estimated at three separate market environments: low, average, and high. Parameter estimates, t-statistics, and R2 values for each model were calculated separately over the three time periods. Table 4 presents these statistics for the three time periods. Additionally, F-values used to test the hypothesis, 1α =1, for each time period in each model are presented in table 4.
Regressions results for the average time period show that the independent variables explained 78.9% of the variation in the dependent variable, gridv. All estimated parameters were positive and statistically significant different from zero at the 0.01 level. The parameter estimate on fabwlsval was 0.840 indicating that a one dollar per head increase in fabwlsval resulted in a $0.840/head increase in the gridv. Parameter estimates for the average and high models were all positive and statistically significant at the 0.01 level.
Parameter estimates on fabwlsval for the low and high models were 0.851 and
0.899, respectively. This implies that the most value was communicated between the

14
carcass-level wholesale value and the grid carcass value at the high market environment. F-values for the low, average, and high time periods were 335, 485, and 217. Therefore, it was concluded that parameter estimates on fabwlsval were significantly different from 1 in all three time periods analyzed. This conclusion implies that carcass-level wholesale values are not completely communicated in grid carcass values for the same carcass.

15
Table 4: OLS Estimates for Equation 5 at Three Market Environments (Dependent Variable: gridv from 3,547 Carcasses)
Low Average High
Independent Variables
Parameter Estimates t-statistics
Independent Variables
Parameter Estimates t-statistics
Independent Variables
Parameter Estimates t-statistics
intercept 50.788* 8.32 intercept 84.940* 12.76 intercept* 58.380* 7.59 fabwlsval 0.851* 104.49 fabwlsval 0.840* 115.23 fabwlsval* 0.899* 131.45 R2 0.755 R2 0.789 R2 0.830 F-Valuea 335** F-Valuea 485** F-Valuea 217** Observations 3,547 Observations 3,547 Observations 3,547 *indicates the coefficient is statistically different from zero at the 0.01 level. aF-value for testing Ho: α1=1 in ttt fabwlsvalgridv εαα ++= 10 (6). **indicates that α1 is statistically different from one at the 0.01 level.

16
Grid Premiums/Discounts Accuracy Results
In this section results from estimating equation 10 are presented and discussed:
tn
tn
marbmarbmarbmarbygygygygyg
hcwhcwhcwhcwhcwhcwvalue
,15
1413121110987
6543210,
432154321
654321
εβββββββββ
βββββββ
+++++++++
+++++++=
(11)
This model was separately estimated at the same three market environments (low, average, and high) to examine how accuracy of premiums/discounts can change given different beef market fundamentals. Table 6 presents the regression results from estimating (11) over the three separate periods. The R2 value for the average model indicates that the independent variables explain 38.4% of the variation in value, which was the difference between fabwlsvalcwt and gridvcwt. Therefore, value measures value difference ($/cwt.) between a carcass valued at the wholesale level and the same carcass valued using current grid valuation component. If grid valuation components are accurately communicating wholesale value to fed cattle producers, then value is an accurate measure of the difference between the wholesale- and grid-level carcass values and all βi’s in (11) would equal zero. If grids are over-compensating cattle producers then βi’s will be negative for the carcass characteristics that are being over-compensated. Conversely, if grids are under-compensating cattle producers then βi’s will be positive for the carcass characteristics that are being under-compensated.
All parameter estimates for tmerrprem , were statistically significant at the 0.01 level for the average model. The intercept was the difference the between fabwlsvalcwt and gridvcwt for the default carcass. The estimated intercept was 3.854 in the average model which means that “base” carcasses valued using the average grid pricing structure was $3.8.54/cwt. smaller than fabwlsvalcwt, holding all else constant. The estimated parameter for hcw1 was 19.502 indicating that a carcass weighing between 450 and 499 pounds and valued using the average grid pricing structure was undervalued by $19.502/cwt. compared to the “base” carcass. All estimated parameters for the 15 dummy variables had positive signs. These positive signs indicate that using the average grid pricing structure resulted in premiums or discounts, for all carcass characteristics, that undervalued fed cattle.

17
Table 6: OLS Estimates for Equation 10 at Three Market Environments Low Average High
Independent Variables
Parameter Estimates t-statistics
Independent Variables
Parameter Estimates t-statistics
Independent Variables
Parameter Estimates t-statistics
intercept 2.990* 0.168 intercept 3.854* 0.207 intercept 1.086* 0.255 hcw1 17.444* 1.461 hcw1 19.502* 1.804 hcw1 18.162* 2.220 hcw2 10.764* 0.608 hcw2 12.175* 0.751 hcw2 11.655* 0.925 hcw3 2.948* 0.379 hcw3 1.325* 0.468 hcw3 0.335 0.576 hcw4 2.628* 0.582 hcw4 3.121* 0.719 hcw4 3.142* 0.885 hcw5 5.846* 1.081 hcw5 8.443* 1.335 hcw5 7.300* 1.643 hcw6 15.030* 2.060 hcw6 17.909* 2.545 hcw6 18.798* 3.132 yg1 4.934* 0.291 yg1 6.210* 0.359 yg1 7.290* 0.442 yg2 3.382* 0.267 yg2 4.481* 0.330 yg2 5.364* 0.406 yg3 1.052* 0.227 yg3 1.696* 0.281 yg3 2.069* 0.345 yg4 8.894* 0.326 yg4 10.090* 0.403 yg4 9.555* 0.496 yg5 11.973* 0.726 yg5 10.698* 0.897 yg5 8.478* 1.104 marb1 11.427* 0.484 marb1 10.255* 0.598 marb1 8.716* 0.736 marb2 4.906* 0.193 marb2 1.271* 0.239 marb2 4.257* 0.294 marb3 3.452* 0.435 marb3 2.384* 0.537 marb3 8.886* 0.661 marb4 6.479* 1.412 marb4 22.588* 1.743 marb4 26.915* 2.146 R2 0.480 R2 0.384 R2 0.326 Observations 3,547 Observations 3,547 Observations 3,547 *indicates the coefficient is statistically different from zero at the 0.01 level.
18
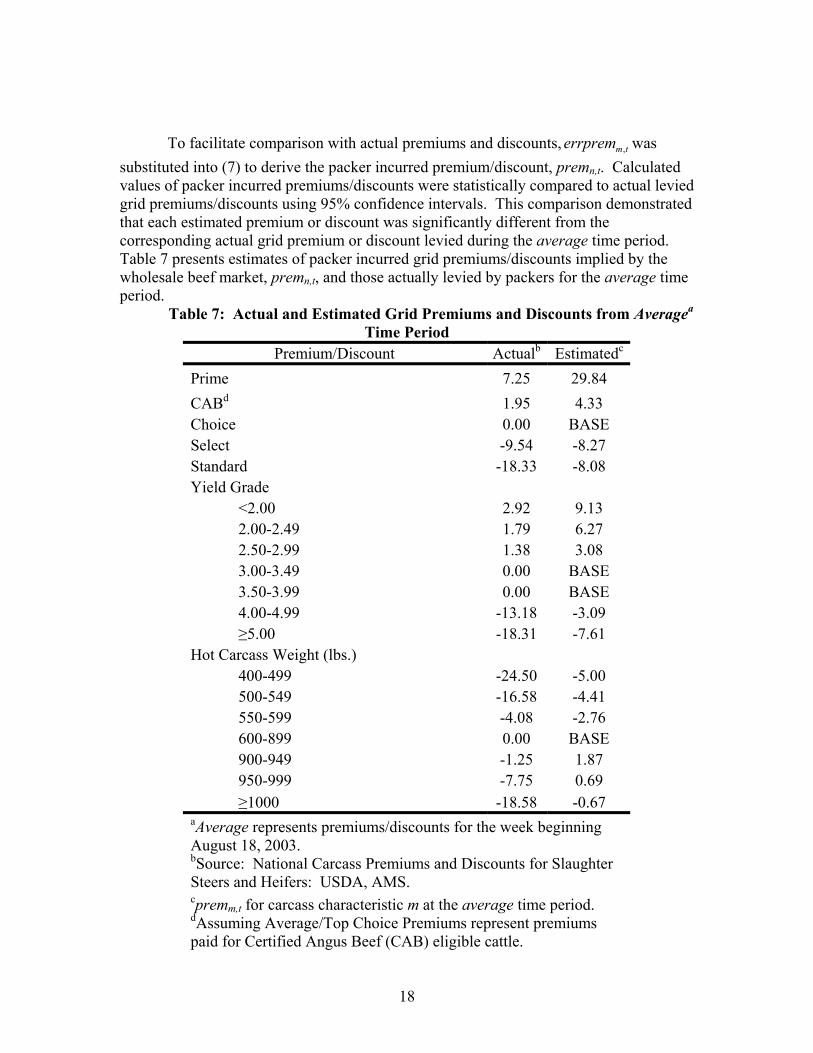
To facilitate comparison with actual premiums and discounts, tmerrprem , was
substituted into (7) to derive the packer incurred premium/discount, premn,t. Calculated values of packer incurred premiums/discounts were statistically compared to actual levied grid premiums/discounts using 95% confidence intervals. This comparison demonstrated that each estimated premium or discount was significantly different from the corresponding actual grid premium or discount levied during the average time period. Table 7 presents estimates of packer incurred grid premiums/discounts implied by the wholesale beef market, premn,t, and those actually levied by packers for the average time period.
Table 7: Actual and Estimated Grid Premiums and Discounts from Averagea
Time Period Premium/Discount Actualb Estimatedc
Prime 7.25 29.84 CABd 1.95 4.33 Choice 0.00 BASE Select -9.54 -8.27 Standard -18.33 -8.08 Yield Grade
<2.00 2.92 9.13 2.00-2.49 1.79 6.27 2.50-2.99 1.38 3.08 3.00-3.49 0.00 BASE 3.50-3.99 0.00 BASE 4.00-4.99 -13.18 -3.09 ≥5.00 -18.31 -7.61
Hot Carcass Weight (lbs.) 400-499 -24.50 -5.00 500-549 -16.58 -4.41 550-599 -4.08 -2.76 600-899 0.00 BASE 900-949 -1.25 1.87 950-999 -7.75 0.69 ≥1000 -18.58 -0.67
aAverage represents premiums/discounts for the week beginning August 18, 2003. bSource: National Carcass Premiums and Discounts for Slaughter Steers and Heifers: USDA, AMS. cpremm,t for carcass characteristic m at the average time period. dAssuming Average/Top Choice Premiums represent premiums paid for Certified Angus Beef (CAB) eligible cattle.

19
The estimated packer incurred premiums/discounts, tmprem , , in some cases, were not consistent with expectations. For example, in the average time period, estimates of hcw4 and hcw5 were $1.871/cwt. and $0.693/cwt., respectively. These estimates indicated that compared to the base carcass, some heavy-weight carcasses (hot carcass weight between 900 and 999 lbs.) should receive a premium. The sign of these estimates might be explained by the fact that packers endure higher processing/fabrication costs for heavy-weight carcasses and pass this increased cost along to producers of fed cattle in the form of grid discounts. This model, however, did not account for packer costs attributable to slaughtering/fabricating a heavy-weight carcass. Instead, the model only accounted for the increased/decreased revenue attributable to heavy-weight carcasses. Therefore, the model estimated the increased revenue from heavy-weight carcasses compared to the “base” carcass. Discounts for marb1 (Standard carcasses) were expected to be lower than premiums/discounts for marb2 (Select carcasses) because the Standard quality grade represents an inferior level of meat quality compared to the Select quality grade. However, in the low and average time periods the estimated discount for Standard carcasses was greater than the estimated discount for Select carcasses. These results may be explained by the assumption made earlier in constructing fabwlsval’s for Standard carcasses. Recall, that No-Roll UB prices were assumed to be accurate for valuing sub-primal products from Standard carcasses. The estimated grid discounts for the low and average time periods indicated that Standard carcasses should have received a smaller discount than Select carcasses. Based upon, these estimates two things can be concluded. First, UB No-Roll prices do not adequately represent the price of sub-primal products from Standard carcasses. Second, the estimated discounts for Standard carcasses are not reliable in these models.
Impacts of Grid Pricing Error on Fed Cattle Value
Estimated grid premiums/discounts were combined with the MARC carcasses to produce estimated grid prices ($/cwt.). Estimated grid prices were then subtracted from the actual grid price ($/cwt.) to estimate the absolute valuation error. On average absolute valuation error was greatest for carcasses valued in the low time period ($8.88/cwt.) and was smallest for carcasses valued in the high time period ($7.73/cwt.). This indicated that, during the three time periods analyzed, this sample of carcasses was, on average, overvalued/undervalued between $7.73/cwt. and $8.88/cwt. using the grid pricing structure reported by AMS. Variance of the estimated valuation error increases from the low to the average to the high time periods.
Summary and Conclusions
The beef industry largely depends on a price coordinated value chain to accurately communicate information among stages of beef production. Accuracy of fed cattle

20
values are largely dependent upon the marketing methods used to assign value to market-ready cattle. Accurate fed cattle values are important because they determine the quality of information (e.g. consumer approval or disapproval of a particular beef product) that is communicated from packers to fed cattle producers. Therefore, improving the accuracy of fed cattle values in turn improves the value chain’s ability to send accurate pricing signals.
The first objective of this research evaluated the ability of current grid marketing
methods to accurately communicate wholesale beef values. The second objective was to estimate a grid marketing structure that more accurately communicates wholesale beef values. Carcass and wholesale dissection data from a representative sample of fed steers were used to construct individual grid and carcass-level wholesale values. Premiums/discounts from an industry average grid pricing structures were used to construct grid values. In addition, individual wholesale values were constructed from the wholesale value of sub-primals derived from the carcass.
The accuracy of actual current grid marketing structures was modeled over three time periods representing distinctly different marketing environments. Results indicate that the marketing environment may affect the ability of actual grid values to reflect carcass-level wholesale values. On a larger scale, however, results indicate that carcass-level wholesale values are not completely communicated in actual grid carcass values for the same carcass. This conclusion suggests that actual grid pricing structures could be altered to improve the accuracy of both pricing signals and fed cattle values.
The same three market environments were used to estimate a grid marketing
structure that better explains carcass-level wholesale values for each environment. The value difference between actual grid values and wholesale values was used to estimate the error in current grid premiums/discounts and base prices. These error estimates were combined with the actual grid premiums/discounts and base prices to construct estimated grid premium/discount schedules for the three environments. These estimated schedules were then applied to the sample of carcasses to construct estimated grid values and to determine the degree of pricing error between the current and estimated grid valuation structures. Results indicate that actual grid premiums/discounts largely under-compensate carcasses for the actual wholesale value attributable to the carcass characteristics produced by the carcass. Therefore, using actual grid pricing structures under-compensates fed cattle producers for the actual value generated from carcasses. When estimated premiums/discounts were applied to the sample of carcasses, the average level of pricing error between actual and estimated grid values ranged from $7.73/cwt. to $8.88/cwt. over the three market environments.
The results from this research indicate that current fed cattle marketing methods
could be improved to enhance value communication between beef wholesalers and fed cattle producers. Additionally, the research concludes that altered pricing structures are a prerequisite to enhancing value communication and price signals along the beef value chain.

21
References
Cross, H.R. & J.W. Savell. “What do We Need for a Value-Based Beef Marketing System?” Meat Science. 36(1994):19-27. Feuz, D.M., S.W. Fausti, and J.J. Wagner. “Risk and Market Participant Behavior in the U.S. Slaughter-Cattle Market.” Journal of Agricultural and Resource Economics. 20(1995):22-31. Fausti, S.W., D.M. Feuz, and J.J. Wagner. “Value Based Marketing for Fed Cattle: A Discussion of the Issues.” International Food And Agribusiness Management Review. 1(1998):73-90. Gardner, T.L., H.G. Dolezal, and D.R. Gill. “Estimation of Beef Value Based on Boxed Beef Yields.” Oklahoma Agricultural Experiment Station. Animal Science Research Report P-951;31. 1996. Gregory, K.E, Cundiff, L.V., R.M. Koch, M.E. Dikeman, and M. Koohmaraie. “Breed Effects and Retained Heterosis for Growth, Carcass, and Meat Traits in Advanced Generations of Composite Populations of Beef Cattle. Journal of Animal Science. 72(1994):833-850. Purcell, W.D. “Demand for Meats: The Good, The Bad, The Ugly.” Paper presented at the International Meat Secretariat’s Marketing/Communications Workshop III, Houston TX. 19 February 2002. Savell, J.W., D.B. Griffen, H.R. Cross. “The Value of Cutability; Impact on Cattlemen.” Beef Cattle Science Handbook. 22(1998):465-478. Schroeder, T.C. and J.L. Graff. “Estimated Value of Increased Pricing Accuracy in Fed Cattle.” Review of Agricultural Economics. 22(2000):89-101. Schroeder, T.C., C.E. Ward, J.R. Mintert, and D.S. Peel. “Value-Based Pricing of Fed Cattle: Challenges and Research Agenda.” Review of Agricultural Economics. 20(1998):125-134. Schroeder, T.C., C.E. Ward, T.L. Wheeler, J.R. Mintert, and J.S. Drouillard. “Improving Fed Cattle and Carcass Value Determination.” Paper prepared for the Livestock and Meat Industry Council, Kansas State University. 18 December 2002. Tronstad, R. and J. Marchello. “Price Efficiency of Grid Versus Live Pricing.” Paper presented at the Western Agricultural Economics Annual Meeting. Denver, Colorado. July 2003.

22
United States Department of Agriculture, Agricultural Marketing Service. Kansas Weekly Weighted Average Cattle Report. LM_CT164, various issues, June 2002-December 2003. United States Department of Agriculture, Agricultural Marketing Service. National Weekly Boxed Beef Cuts for Prime Product-Negotiated Sales. LM_XB456), various issues, June 2002-December 2003. United States Department of Agriculture, Agricultural Marketing Service. National Weekly Direct Slaughter Cattle-Premiums and Discount. LM_CT155, various issues, June 2002-December 2003. Urner Barry Publications Incorporated. Weekly Average By-Products and Hide. Comtell Historical Database. June 2002-December 2003. Ward, C.E. and Lee, J. “Short-Term Variability in Grid Prices fro Fed Cattle in Formula Pricing and Grid Pricing Fed Cattle: Implications for Price Discovery and Variability.” Research Institute on Livestock Pricing. Research Bulletin 1-99. January 1999. Wheeler, T.L., L.V. Cundiff, and R.M. Koch. “Effect of Marbling Degree on Beef Palatability in Bos taurus and Bos indicus Cattle.” Journal of Animal Science. 72(1994):3145-3151. Wheeler, T.L., L.V. Cundiff, and S.D. Shackelford, and M. Koohmaraie. “Characterization of Biological Types of Cattle (Cycle V): Carcass traits and Longissimus Palatability.” Journal of Animal Science. 79(2001):1209-1222