accounting method choice and market valuation in the ... · accounting method choice and market...
TRANSCRIPT
Misund, Cogent Economics & Finance (2017), 5: 1408944https://doi.org/10.1080/23322039.2017.1408944
FINANCIAL ECONOMICS | RESEARCH ARTICLE
Accounting method choice and market valuation in the extractive industriesBård Misund1*
Abstract: For more than 40 years, oil and gas companies have been able to choose between two competing methods for accounting for exploration activities. The im-plication is that two otherwise identical companies can report substantially different earnings depending on chosen method. This situation, where oil and gas company managers have discretion to choose between different accounting methods, has transpired because of intense lobbyism towards accounting standard setters by oil and gas companies in favour of one of the methods. The existence of two account-ing methods is concerning since investors will struggle to uncover the true underlying performance of oil and gas companies. We conjecture that investors will resort to op-erating cash flows to evaluate oil company financial performance since cash flows are less affected by managers’ discretion than earnings are. In this study, we investigate the relevance to investors of earnings versus cash flow for oil and gas companies. Our results show that cash flow measures, but not earnings, are significantly associated with oil company returns. These findings suggest that the financial markets lack confi-dence in oil company earnings, irrespective of accounting method used, and investors therefore prefer cash flows as measures of underlying financial performance.
*Corresponding author: Bård Misund, Business School, University of Stavanger, N-4036 Stavanger, NorwayE-mail: [email protected]
Reviewing editor:David McMillan, University of Stirling, UK
Additional information is available at the end of the article
ABOUT THE AUTHORBård Misund is an associate professor of Accounting and Finance at UiS Business School at the University of Stavanger. He has more than 10 years of industry experience from commodities companies. Before joining academia, he worked as an economic analyst, and later as an advisor to the Norwegian oil and gas company Statoil ASA.His research covers several fields including accounting, finance and economics, mostly covering topics related to commodity markets. Misund’s research interests include commodity price behaviour, volatility transmission, the relationship between spot and futures prices, price formation in spot and futures markets, determinants of commodity firm stock returns, financial statement analysis and valuation of oil and gas firms. He has published more than 20 papers in international peer-reviewed journals in economics, finance and accounting.
PUBLIC INTEREST STATEMENTOil and gas companies’ financial report represent a very important source of information about the financial performance of these companies. However, evaluating the profitability of oil companies is quite challenging, especially so since two otherwise identical companies will report different profits depending on choice of accounting method. In particular, for more than 40 years oil companies have been allowed to choose between two competing methods for accounting for exploration activities. In this paper, we conjecture that this choice between competing accounting methods will confuse investors.
We test our hypothesis by examining the impact on market valuation of financial performance measures. We find that there is a closer association between market valuation and cash flows, than with accounting earnings. We find that cash flows outperform earnings independent of accounting method choice. Our research therefore suggest that when the quality of accounting information is adversely affected by accounting method heterogeneity, investors will turn to cash flow measures to evaluate financial performance in the oil and gas sector.
Received: 24 August 2017Accepted: 10 November 2017First Published: 24 November 2017
© 2017 The Author(s). This open access article is distributed under a Creative Commons Attribution (CC-BY) 4.0 license.
Page 1 of 14
Bård Misund
Page 2 of 14
Misund, Cogent Economics & Finance (2017), 5: 1408944https://doi.org/10.1080/23322039.2017.1408944
Subjects: Investment & Securities; Financial Accounting; Petroleum & Oil Industries
Keywords: full cost vs. successful efforts; oil company valuation; oil and gas exploration; cash flows; earnings; profitability; shareholder returns; oil price; gas prices
1. IntroductionThe topic of this study is the effect that accounting method choice can have on the valuation of companies, using the oil and gas firms as a case study. The term accounting method choice refers to the situation whereby the managers of a firm can choose between competing accounting methods for recording, for instance, revenues, costs and capitalized expenses in their financial statements. The choice between methods opens up for earnings management, which is a form of accounting manipulation. The latter described as the process of constructing financial statement numbers with the purpose of obtaining a private gain for the managers or owners of a company. Typically, this happens when managers take advantage of flexibility in financial reporting practices or by actively structuring transactions in such a way that the financial accounts misrepresent a firms’ actual eco-nomic performance. In this paper, we examine the choice between competing methods for account-ing for exploration activities in the oil and gas industry.
For over 40 years, accounting standard setters, regulators, oil and gas companies and academics have discussed intensively the topic of capitalization of exploration (pre-discovery1) expenses for oil and gas producers. Since the 1960s, oil and gas companies have been allowed to use one of two competing methods, the full cost (FC) and successful efforts (SE) methods (Zeff, 1978). For compa-nies using the SE method, only expenses from successful discoveries are allowed to become assets on their balance sheets. Costs incurred from unproductive drilling, so-called “dry wells”, are ex-pensed directly, meaning that these costs adversely affect the earnings immediately. Under the al-ternative FC method, oil and gas explorers are allowed to capitalize all expenses, both from successful exploration, and from “dry wells”. The incurred exploration costs are subsequently deducted from the revenues (depreciated) over several years, apportioning costs from unsuccessful drilling over time. The proponents of the FC method argue that this method leads to less volatile (“smooth”) earnings (Boone & Raman, 2007; Bryant, 2003). The users of the FC method are often the smaller exploration and production companies. These companies typically have fewer oil and gas assets in their portfolios, and a dry well will have a relatively large impact on their profits, as compared to a large multinational integrated oil and gas company with a large oil and gas asset portfolio (Misund, Osmundsen, & Sikveland, 2015). The latter companies typically use the SE method. The opponents of the FC method, including many academics, argue that the FC method leads to including assets on the balance sheet which will never generate any future cash flow, and therefore carry no economic value. The consequences of the FC method are that companies report earnings that do not fully in-corporate losses from dry wells, and asset values that have no true economic value.
The literature suggests that investors, faced with the difficulties of assessing the relevance of ac-counting numbers for predicting future cash flows, for instance, due to accounting method heteroge-neity, may instead turn to cash flows. In fact, a survey reports that earnings are considered unreliable by oil and gas analysts comparing firm performance (Oil and gas investor, 1993).2 Moreover, DeFond and Hung (2003) find that analysts tend to forecast cash flows for firms with more heterogenous ac-counting method choices. Moreover, as Dechow (1994) notes, “to the extent that management use their discretion to opportunistically manipulate accruals, earnings will become a less reliable measure of firm performance and cash flow could be preferable”. Hence, if the choice between full cost and suc-cessful efforts methods are governed by financial window dressing motives, rather than signalling private information, then the accruals of oil and gas companies will likely lose their ability to predict future cash flows. Consequently, investors are expected to turn to alternative measures in order to uncover the firms’ true financial performance. In our study, we investigate if this is the case in the oil and gas sector. We hypothesis that investors will turn to two relevant measures reported by oil and gas companies, namely cash flow from operations, which can convey information on current profitability, and oil and gas reserves net present values, which can provide information on future profitability.

Page 3 of 14
Misund, Cogent Economics & Finance (2017), 5: 1408944https://doi.org/10.1080/23322039.2017.1408944
The starting point of our empirical analysis is the Ohlson (1995) valuation model for relating ac-counting profits to market values. Using panel data econometric methods and data from oil and gas companies (more than 3,500 firm-year observations), we estimate models with accounting earnings and cash flow measures. If investors have a preference for cash flow performance measures, then there should be a stronger association between cash flow measures and market values, than would be the case for accounting earnings.
The results support the view that accounting method discretion reduces value-relevance of accru-als. We find evidence that cash flows from operations are more value-relevant than accounting earnings for both SE and FC firms. In fact, we fail to find evidence that neither earnings nor the change in earnings are significantly associated with oil company returns. A possible explanation is the adverse effect on investor confidence in earnings figures disclosed by oil and gas producers that multiple accounting methods have. Ironically, it seems that the fears of both the proponents and opponents of the successful efforts method have materialized. By contrast, it appears that more objective economic variables, such cash flows and net present value of reserves, are more important for market values than historical costs are. The results support earlier findings that accounting method heterogeneity has a detrimental effect on the accrual value relevance (e.g. Dechow, 1994). We conjecture that this result is mainly the effect of accounting method heterogeneity, a plurality that arose from disagreements among the stakeholders in the accounting standard setting process, a process that was heavily influenced by lobbyists. Despite the unfortunate situation of accounting method heterogeneity and its implication on reported earnings, investors seem to have adapted by turning to cash flow measures. This is indeed a triumph of economics over politics.
We contribute to the literature in several ways. First and foremost, our main contribution is to show that in the face of accounting method heterogeneity, investors tend to resort to cash flows as measures of both short- and long-term performance. This is in line with the accrual relevance de-struction view of DeFond and Hung (2003) and Dechow (1994). Second, using a substantially larger data-set than in similar studies, both in terms of number of firms and time, can lead to more robust inference. According to Fields, Lys, and Vincent (2001), small sample studies “exacerbate the prob-lem of determining whether the results are due to unusual or pathological cases rather than to the general use of accounting in ‘normal’ day-to-day circumstances”.
The remainder of the paper is organized as follows. The next section describes the background behind the current status quo situation of accounting method heterogeneity and reviews the litera-ture on the relative value relevance of accounting method choice in the oil and gas sector. Section 3 describes the methodology and develops the hypotheses. Section 4 describes the data, followed by a presentation and discussion of the results in Section 5. Finally, Section 6 concludes.
2. The role of economics, politics and lobbyismThe full cost versus successful efforts debate goes back more than five decades. The processes lead-ing up to, and including, the final decisions by the standard setters are considered to be very contro-versial, both the US process during the late 1970s and the international process more than 20 years later (Cortese, 2011; Cortese, Irvine, & Kaidonis, 2009; Sutton, 1984).
According to Van Riper (1994), the full cost method had been gaining popularity among small and medium-sized oil and gas producers since the 1960s due to the method’s favourable impact on earnings. As a consequence of the oil embargo of 1973, the US Securities and Exchange Commission (SEC) was tasked with standardizing accounting practices in the extractive industry, a responsibility the commission promptly delegated to the Financial Accounting Standards Board (FASB). In 1977, the FASB published an Exposure Draft called Financial Accounting and Reporting by Oil and Gas Producing Companies. Under the new rules it was proposed that only the successful efforts method should be allowed, effectively discontinuing the full cost approach. According to Cortese (2011), the release of the Exposure Draft prompted an intensive lobby activity by the oil and gas industry, and especially by small and independent oil and gas producers who are the primary users of the full cost
Page 4 of 14
Misund, Cogent Economics & Finance (2017), 5: 1408944https://doi.org/10.1080/23322039.2017.1408944
method. The subsequent debate involved many stakeholders including accounting standard setters, academics and regulators such as the US Securities and Exchange Commission, the US Department of Energy and the US Department of Justice, accounting firms, the oil and gas industry and lobby organizations sponsored by the oil and gas industry. Van Riper (1994, p. 56) refers to the full cost versus successful efforts controversy in the US of the late 1970s as “probably the most intensely politicised accounting argument ever”. An important argument used by the full cost proponents was that the full cost method allowed companies to engage in risky exploration activities without having to expense the cost of dry holes. Implementation of the SE method as the single accounting method for oil and gas exploration activities as proposed by the Exposure Draft would therefore be a limiting factor for the US oil and gas industry. It was further argued that this would have adverse effects on returns on full cost firms. Collins and Dent (1979) examining the negative difference in security re-turns between full cost and successful efforts firms surrounding the date of the announcement of the Exposure Draft attribute the “difference to the anticipated consequences which this mandated accounting change is likely to have on managerial behaviour and to increased costs that will have to be borne by the affected companies”. Although a switch in method from full cost to successful ef-forts would not affect the underlying fundamental situation for the companies, it was feared that the switch would likely have an adverse effect on capital market behaviour that “would significantly disadvantage the competitive viability of any segment of the oil and gas producing industry”.3
Consequently, the SEC opposed the proposed new accounting standard, the SFAS No. 19 Financial Accounting and Reporting by Oil and Gas Producing Companies, forcing the FASB to make an amend-ment to the standard, effectively suspending its implementation for an indefinite period. According to Cortese et al. (2009), three reasons explain the apparent unwillingness of legislators and account-ing standard setters to regulate oil and gas accounting disclosure rules. The first two refer to the economic importance and associated political influence that the industry exerts. The last explana-tion refers to the distinctive nature of oil and gas exploration activities. Wright and Gallun (2005) argue that certain distinguishing features of upstream oil and gas exploration and production activi-ties separates oil companies from other operations involving asset acquisition and use; (1) typically high risks and low probability of discovering commercial reserves, (2) a long time lag between ac-quiring permits and licences and the subsequent production of reserves, (3) potentially low correla-tion between expenditures and results, (4) challenges with reliably valuing the underlying value of the reserves so that they merit capitalization on the balance sheet, (5) the discovery of new reserves cannot be recorded as income immediately but represent a major future income-earning event and (6) high costs and risks often result in joint operations.
In the 2000s, International Accounting Standards Board (IASB) was working on an international standard for the extractive industries. Similar to the US process in the late 1970s, this process also ended up with a standard for the extractive industries that allowed for accounting method hetero-geneity, the IFRS 6. This process, like the US process, was also controversial, with substantial pres-sure from lobbyists representing the oil and gas sector (Cortese, 2011; Cortese & Irvine, 2010; Cortese, Irvine, & Kaidonis, 2010; Cortese et al., 2009).
Hence, the lack of confidence in historical costs and accrual accounting for the oil and gas sector could be a result of a “politicised” process resulting in accounting method heterogeneity, combined with the distinctive nature of business. As the FASB expressed it:
An important quality of information that is useful in making rational investment, credit, and similar decisions is its predictive value, specifically its usefulness in assessing the amounts, timing, and uncertainty of prospective net cash inflows to the enterprise. Historical cost based financial statements for oil and gas producing enterprises have limited predictive value. Their usefulness is further reduced because a uniform accounting method is not required to be used for costs incurred in oil and gas producing activities. FASB (1982)

Page 5 of 14
Misund, Cogent Economics & Finance (2017), 5: 1408944https://doi.org/10.1080/23322039.2017.1408944
3. Impact of accounting method heterogeneity on accounting information usefulness for investorsThe literature suggests that investors, faced with the difficulties of assessing the relevance of ac-counting numbers for predicting future cash flows due to accounting method heterogeneity may instead turn to cash flows. In fact, a survey reports that earnings are considered unreliable by oil and gas analysts comparing firm performance (Oil and gas investor, 1993, as quoted in DeFond & Hung, 2003). Moreover, DeFond and Hung (2003) find that analysts tend to forecast cash flows for firms with more heterogenous accounting method choices. There are two views on the impact of manage-ments’ accounting method discretion on the interpretability of earnings. According to the first view, accounting discretion allows managers to communicate their private information about firm perfor-mance (Healey & Palepu, 1993; Holthausen & Leftwich, 1983; Watts & Zimmerman, 1986). Managerial discretion over recognition of accruals can be used to signal private information which is expected to improve the ability to of earnings to measure firm performance and thereby also the firm’s cash flow generating ability. In turn this signal can reduce information asymmetry and increase contract-ing efficiency. On the other hand, DeFond and Hung (2003) argue that accounting heterogeneity can impair comparability of company probability. Moreover, as Dechow (1994) notes, “to the extent that management use their discretion to opportunistically manipulate accruals, earnings will become a less reliable measure of firm performance and cash flow could be preferable”. Hence, if the choice between full cost and successful efforts methods are governed by financial window dressing mo-tives, rather than signalling private information, then the accruals of oil and gas companies will likely lose their ability to predictive future cash flows. Consequently, investors are expected to turn to al-ternative measures.4
Very few studies compare the relative value relevance of accrual-based earnings measures and cash flow measure. Cormier and Magnan (2002), Misund, Asche, and Osmundsen (2008), and Misund and Osmundsen (2015) compare the relevance for investors of cash flows versus earnings, but do not examine the impact of accounting methods choice. Other studies such as Bryant (2003) examine the value relevance of earnings for SE versus FC firms, but do not compare the results with cash flow from operations. The aim of our paper is to provide insight into the market value–financial perfor-mance relation for earnings versus cash flow measures, across accounting methods.
4. MethodologyThe crux of the empirical analysis is the relationship between earnings and total shareholder re-turns.5 As our point of departure we apply the theoretical model of Ohlson (1995):
where rett is the total shareholder returns in excess of the risk free rate, Et is current earnings, ΔEt is the change in current earnings and v is “other information” that affect future, but not current cash flows. Following Misund (2015), we operationalize the Ohlson (1995) model using changes in the net present value of oil and gas reserves, ΔNPV, as a proxy for “other information”, and including a set of control variables including Fama–French–Carhart risk factors (Carhart, 1997; Fama & French, 1993), and changes in oil and gas prices. Several studies show that reserves are an important factor in the market capitalization of oil and gas companies (e.g. Ewing & Thompson, 2016; Kretzschmar, Misund, & Hatherly, 2007; Misund, 2015, 2016; Misund & Osmundsen, 2017; Misund et al., 2015).6
Moreover, we scale all accounting variables with the previous year’s market value of equity to make them on the same form as returns. The resulting empirical model (hereafter called “earnings model”) is
(1)rett= E
t+ ΔE
t+ v,
(2)Rit= �
0+ �
1
Eit
MVEit−1
+ �2
ΔEit
MVEit−1
+ �3
ΔNPVit
MVEit−1
+ �4MRP
t+ �
5SMB
t+ �
6HML
t+ �
7MOM
t
+ �8ΔOP
t+ �
9ΔGP
t+ �FE
i+ �FE
t+ �
3
it,

Page 6 of 14
Misund, Cogent Economics & Finance (2017), 5: 1408944https://doi.org/10.1080/23322039.2017.1408944
where i denotes company i and MVEit − 1 is the previous year’s market value of equity. The Fama–French–Carhart control variables include MRP (the market risk premium), SMB (the small-minus-big factor), HML (the high-minus-low factor) and MOM which is the momentum factor. We also include oil and gas prices changes where ΔOPt and ΔGPt denote the changes (returns) in oil and gas prices from time t − 1 to t, respectively. Fixed effects are denoted by the vectors FEi and FEt, for company and firm fixed effects, respectively.7
In addition to the earnings model in Equation (2), we estimate a cash flow version (Equation (3), hereafter called “cash flow model”), where the earnings variables
(
Eit
MVEit−1
andΔE
it
MVEit−1
)
are replaced with cash flow variables
where CFt and ΔCFt denoted and changes in cash flow from operations, respectively.
For ease of comparison, we estimate the relationship in Equations (2) and (3) for both FC and SE firms separately, resulting in four empirical models. We estimate all models using panel data econo-metric models, which have the benefit of capturing the impact of unobserved variables on the re-turns, mitigating the negative effects of unobserved variables—the omitted variables bias. We carry out a sequence of panel data tests to determine whether to choose a pooled OLS, fixed-firm effects model or a random effects model. Moreover, we test for the presence of heteroskedasticity and se-rial correlation in the error terms. While heteroskedasticity is usually corrected with White’s (1980) heteroskodasticity-consistent covariance matrix, this becomes a bit complicated in a fixed effects model. Using fixed effects with white correction can introduce serial correlation in the errors can give inconsistent estimators (Stock & Watson, 2010). It is therefore preferable to use the method pro-posed by Arellano for fixed effects models (Arellano, 1987). If we find evidence of heroskedasticity and or serial correlation in our models, we apply the Arellano method to produce both heteroskedas-ticity and serial correlation consistent standard errors (HACSE).
The analysis is carried out in two steps. First, we estimate the earnings model (Equation 2) and the cash flow model (Equation 3). Statistical significance of the coefficients on E and CF (likewise ΔE and ΔCF) variables will indicate their value relevance. A positive and significant loading on the parameter on E (CF) will provide evidence that earnings (cash flow from operations) are positively associated with total shareholder returns. We establish the following alternative hypotheses:
H11: Significant coefficients on E and/or ΔE combined with non-significant coefficients on CF
and ΔCF.
This is a test of the hypothesis that the accounting method choice, and therefore accruals (i.e. the difference between earnings and cash flows), signals information about future profitability.
H12: Significant coefficients on CF and/or ΔCF combined with non-significant coefficients on E
and ΔE.
This is a test of the hypothesis that the accounting method heterogeneity confuses investors about the usefulness of accruals and will instead turn to cash flow from operations as measures of future profitability.
To be able to compare models, i.e. to be able to say which model is “better” than the others, we carry out Vuong tests (Vuong, 1989). This will help us in the case that the hypotheses above (H1
1, H12)
do not provide conclusive evidence. The following null hypotheses are used:
(3)Rit= �
0+ �
1
CFit
MVEit−1
+ �2
CFit
MVEit−1
+ �3
NPVit
MVEit−1
+ �4MRP
t+ �
5SMB
t+ �
6HML
t+ �
7MOM
t
+ �8OP
t+ �
9GP
t+ �FE
i+ �FE
t+ �
4
it,

Page 7 of 14
Misund, Cogent Economics & Finance (2017), 5: 1408944https://doi.org/10.1080/23322039.2017.1408944
H03: An earnings model is better than a cash flow model for FC firms. A significant Vuong z-
statistic will reject the null hypothesis and we can accept the alternative hypothesis that a cash flow model is better than an earnings model for FC firms.
H04: An earnings model is better than a cash flow model for SE firms. A significant Vuong z-
statistic will reject the null hypothesis and we can accept the alternative hypothesis that a cash flow model is better than an earnings model for SE firms.
To make the set-up more clear for the reader we provide the following table describing the experi-mental design (Table 1).8
Four empirical relations are estimated using two data-sets (one for full cost and the other for suc-cessful efforts companies). Hypotheses H1
1 and H12 test whether earnings (H1
1) or cash flows (H12) are
preferred by investors when evaluating the financial performance of successful efforts or full cost companies, respectively. The second set of hypotheses (FC firms: H0
3, SE firms: H04) test whether
earnings are more value relevant than cash flow for investors (i.e. implicitly better for forecasting future cash flows).
5. DataThe data are collected from the John S. Herold database (www.ihs.com/herold). The Herold database contains a substantial amount of information drawn from oil and gas companies’ financial reports (e.g. 10-K SEC filings) including the supplementary information from oil and gas activities. Fama–French–Carhart risk factors are collected from Ken French’ website, and oil and gas prices are ob-tained from the US department of Energy website.
We use net income after tax as our earnings variable, operating cash flow as the cash flow meas-ure, and the standardized measure of oil and gas values as the net present value of oil and gas re-serves variable. Both variables are found in the annual reports of oil and gas companies.
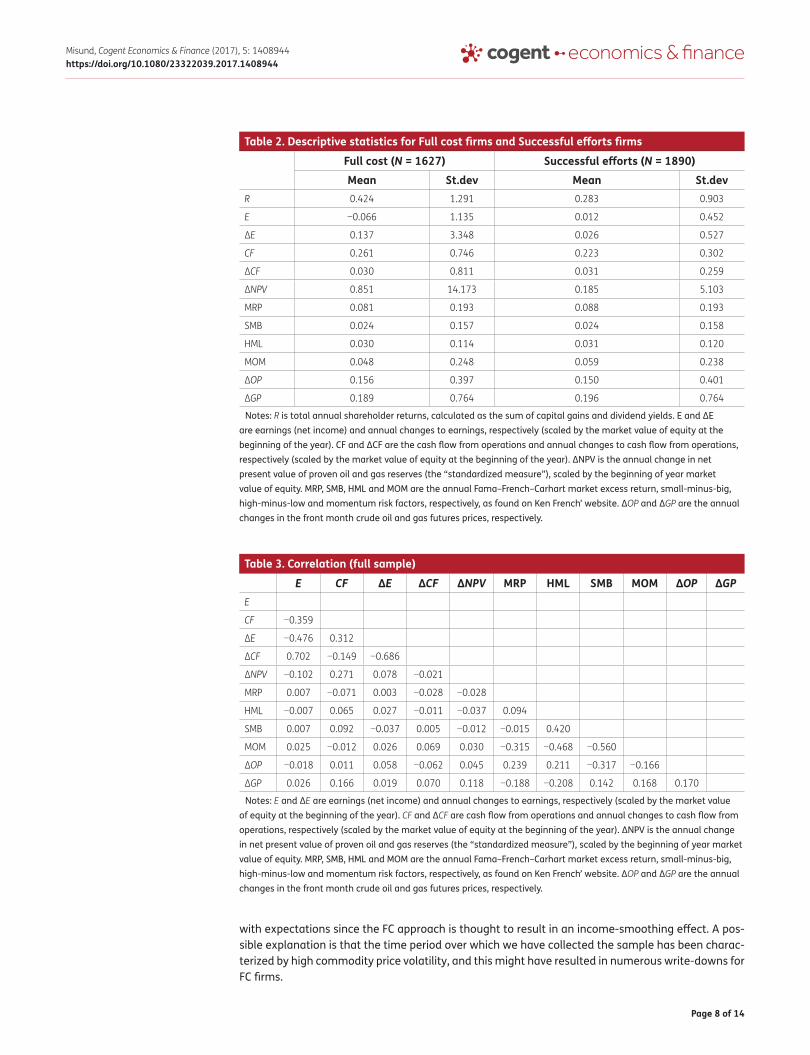
To improve the econometric modelling, we clean the data by removing observations with missing data as well as remove outliers. We exclude the outliers by removing the observations above the 99.9% and lower than the 0.1%. This process results in a total of 3,517 firm years, of which 1,627 are FC firm years and the remainder of 1890 are SE firm-years. The two samples are therefore quite bal-anced in terms of number of observations. Table 2 provides the descriptive statistics for the resulting sample for both FC and SE firms. Table 3 provides the correlations between the variables. As Table 2 shows the average excess return and standard deviation are higher for FC firms than SE firms. On average the FC firms in the sample have appreciated by 42.4% annually compared to 28.3% for SE firms. Interestingly, the average net income (scaled by beginning of year market value of equity) for FC firms has been negative over the period, while that of SE firms has been positive. This is not the case for cash flow from operations which has been much more similar, with an average of 0.261 for FC firms vs. 0.223 for SE firms. Similarly, the mean changes in cash flow for operations are also very close for both types of firms. Another interesting finding is that the standard deviations in all earn-ings variables are much higher for FC firms than for SE firms. Moreover, the standard deviations in all earnings variables are higher than that of the cash flow variables for FC firms. This is not consistent
Table 1. Research methodology setupAccounting method choice\performance measure
Accruals Cash flows
Full costs method Earnings model estimated using data from firms using the full cost method
Cash flow model estimated using data from firms using the full cost method
Successful efforts method Earnings model estimated using data from firms using the successful efforts method
Cash flow model estimated using data from firms using the successful efforts method
Page 8 of 14
Misund, Cogent Economics & Finance (2017), 5: 1408944https://doi.org/10.1080/23322039.2017.1408944
with expectations since the FC approach is thought to result in an income-smoothing effect. A pos-sible explanation is that the time period over which we have collected the sample has been charac-terized by high commodity price volatility, and this might have resulted in numerous write-downs for FC firms.
Table 2. Descriptive statistics for Full cost firms and Successful efforts firms
Notes: R is total annual shareholder returns, calculated as the sum of capital gains and dividend yields. E and ΔE are earnings (net income) and annual changes to earnings, respectively (scaled by the market value of equity at the beginning of the year). CF and ΔCF are the cash flow from operations and annual changes to cash flow from operations, respectively (scaled by the market value of equity at the beginning of the year). ΔNPV is the annual change in net present value of proven oil and gas reserves (the “standardized measure”), scaled by the beginning of year market value of equity. MRP, SMB, HML and MOM are the annual Fama–French–Carhart market excess return, small-minus-big, high-minus-low and momentum risk factors, respectively, as found on Ken French’ website. ΔOP and ΔGP are the annual changes in the front month crude oil and gas futures prices, respectively.
Full cost (N = 1627) Successful efforts (N = 1890)Mean St.dev Mean St.dev
R 0.424 1.291 0.283 0.903
E −0.066 1.135 0.012 0.452
ΔE 0.137 3.348 0.026 0.527
CF 0.261 0.746 0.223 0.302
ΔCF 0.030 0.811 0.031 0.259
ΔNPV 0.851 14.173 0.185 5.103
MRP 0.081 0.193 0.088 0.193
SMB 0.024 0.157 0.024 0.158
HML 0.030 0.114 0.031 0.120
MOM 0.048 0.248 0.059 0.238
ΔOP 0.156 0.397 0.150 0.401
ΔGP 0.189 0.764 0.196 0.764
Table 3. Correlation (full sample)
Notes: E and ΔE are earnings (net income) and annual changes to earnings, respectively (scaled by the market value of equity at the beginning of the year). CF and ΔCF are cash flow from operations and annual changes to cash flow from operations, respectively (scaled by the market value of equity at the beginning of the year). ΔNPV is the annual change in net present value of proven oil and gas reserves (the “standardized measure”), scaled by the beginning of year market value of equity. MRP, SMB, HML and MOM are the annual Fama–French–Carhart market excess return, small-minus-big, high-minus-low and momentum risk factors, respectively, as found on Ken French’ website. ΔOP and ΔGP are the annual changes in the front month crude oil and gas futures prices, respectively.
E CF ΔE ΔCF ΔNPV MRP HML SMB MOM ΔOP ΔGPE
CF −0.359
ΔE −0.476 0.312
ΔCF 0.702 −0.149 −0.686
ΔNPV −0.102 0.271 0.078 −0.021
MRP 0.007 −0.071 0.003 −0.028 −0.028
HML −0.007 0.065 0.027 −0.011 −0.037 0.094
SMB 0.007 0.092 −0.037 0.005 −0.012 −0.015 0.420
MOM 0.025 −0.012 0.026 0.069 0.030 −0.315 −0.468 −0.560
ΔOP −0.018 0.011 0.058 −0.062 0.045 0.239 0.211 −0.317 −0.166
ΔGP 0.026 0.166 0.019 0.070 0.118 −0.188 −0.208 0.142 0.168 0.170

Page 9 of 14
Misund, Cogent Economics & Finance (2017), 5: 1408944https://doi.org/10.1080/23322039.2017.1408944
The average change in the net present value of oil and gas reserves is much higher for FC firms than SE firms. This is probably due to SE firms being more diversified. With the result that the de-nominator is also affected by the market values of assets other than reserves. The low difference in the averages of the remaining variables (the common factors) in Table 2 indicates that the two samples are quite balanced in terms of the years in which they have been collected. If the two sam-ples were perfectly balanced then the means would be identical.
The correlations in Table 3 are low for most variables except the earnings and cash flow variables.9
Since our sample covers over 20 years, we also test if the variables in the time series dimension are stationary using the augmented Dickey–Fuller test (Said & Dickey, 1984). As Table 4 shows, all variables are stationary and first differencing is not necessary.
5. Results and discussionIn the following section, we present the results of the estimation of the four empirical models. Before estimating the models, we carry out the following diagnostics procedures. First, we check if a fixed effects model is better than either random effects or pooled OLS models. Then, after the final model is selected, the residuals are tested for presence of both heteroskedasticity and serial correlation in order to determine if the robust covariance matrix estimators are necessary.
We find that a fixed firm effects model is preferable to both pooled OLS (Table 5, column 4) and a random effects model (Table 5, Column 5), and will be the model of choice in the remainder of the study. We also find presence of both heteroskedasticity (Table 5, Column 2) and serial correlation
Table 4. Stationarity tests using the augmented Dickey–Fuller test (ADF)
Notes: The table shows the test statistics for the ADF test. The null hypothesis is that the time series has a unit root (i.e. non-stationary). Significant test statistics result in rejection of the null hypothesis meaning that the time series’ are stationary. R is total annual shareholder returns, calculated as the sum of capital gains and dividend yields. E and ΔE are the earnings (net income) and annual changes to earnings, respectively (scaled by the market value of equity at the beginning of the year). CF and ΔCF are the cash flow from operations and annual changes to cash flow from operations, respectively (scaled by the market value of equity at the beginning of the year). ΔNPV is the annual change in net present value of proven oil and gas reserves (the “standardized measure”), scaled by the beginning of year market value of equity. MRP, SMB, HML and MOM are the annual Fama–French–Carhart market excess return, small-minus-big, high-minus-low and momentum risk factors, respectively, as found on Ken French’ website. ΔOP and ΔGP are the annual changes in the front month crude oil and gas futures prices, respectively.
*p < 0.01.
ADFR −36.370 *
E −33.428 *
ΔE −41.036 *
CF −29.440 *
ΔCF −37.595 *
ΔNPV −43.938 *
MRP −36.712 *
SMB −37.768 *
HML −36.424 *
MOM −31.325 *
ΔOP −49.590 *
ΔGP −34.965 *
Page 10 of 14
Misund, Cogent Economics & Finance (2017), 5: 1408944https://doi.org/10.1080/23322039.2017.1408944
(Table 5, Column 3) in the error terms of the fixed effects model and consequently apply the Arellano method for HACSE correction for fixed effects models.
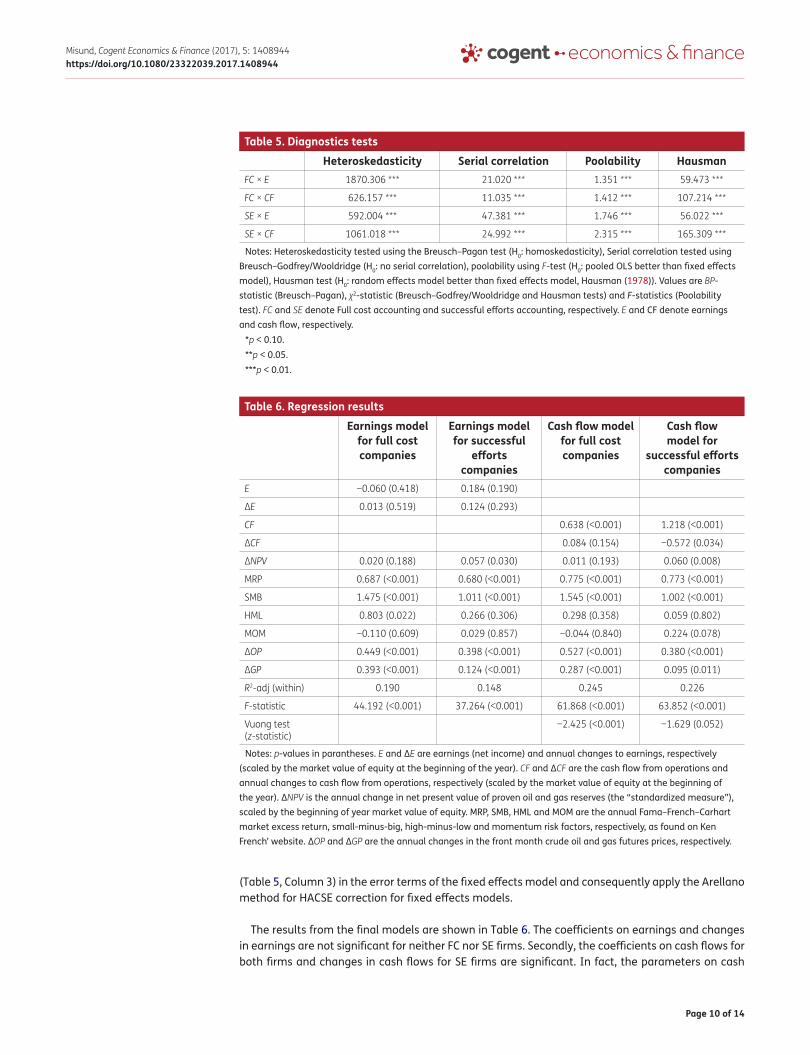
The results from the final models are shown in Table 6. The coefficients on earnings and changes in earnings are not significant for neither FC nor SE firms. Secondly, the coefficients on cash flows for both firms and changes in cash flows for SE firms are significant. In fact, the parameters on cash
Table 5. Diagnostics tests
Notes: Heteroskedasticity tested using the Breusch–Pagan test (H0: homoskedasticity), Serial correlation tested using Breusch–Godfrey/Wooldridge (H0: no serial correlation), poolability using F-test (H0: pooled OLS better than fixed effects model), Hausman test (H0: random effects model better than fixed effects model, Hausman (1978)). Values are BP-statistic (Breusch–Pagan), χ2-statistic (Breusch–Godfrey/Wooldridge and Hausman tests) and F-statistics (Poolability test). FC and SE denote Full cost accounting and successful efforts accounting, respectively. E and CF denote earnings and cash flow, respectively.
*p < 0.10.**p < 0.05.***p < 0.01.
Heteroskedasticity Serial correlation Poolability HausmanFC × E 1870.306 *** 21.020 *** 1.351 *** 59.473 ***
FC × CF 626.157 *** 11.035 *** 1.412 *** 107.214 ***
SE × E 592.004 *** 47.381 *** 1.746 *** 56.022 ***
SE × CF 1061.018 *** 24.992 *** 2.315 *** 165.309 ***
Table 6. Regression results
Notes: p-values in parantheses. E and ΔE are earnings (net income) and annual changes to earnings, respectively (scaled by the market value of equity at the beginning of the year). CF and ΔCF are the cash flow from operations and annual changes to cash flow from operations, respectively (scaled by the market value of equity at the beginning of the year). ΔNPV is the annual change in net present value of proven oil and gas reserves (the “standardized measure”), scaled by the beginning of year market value of equity. MRP, SMB, HML and MOM are the annual Fama–French–Carhart market excess return, small-minus-big, high-minus-low and momentum risk factors, respectively, as found on Ken French’ website. ΔOP and ΔGP are the annual changes in the front month crude oil and gas futures prices, respectively.
Earnings model for full cost companies
Earnings model for successful
efforts companies
Cash flow model for full cost companies
Cash flow model for
successful efforts companies
E −0.060 (0.418) 0.184 (0.190)
ΔE 0.013 (0.519) 0.124 (0.293)
CF 0.638 (<0.001) 1.218 (<0.001)
ΔCF 0.084 (0.154) −0.572 (0.034)
ΔNPV 0.020 (0.188) 0.057 (0.030) 0.011 (0.193) 0.060 (0.008)
MRP 0.687 (<0.001) 0.680 (<0.001) 0.775 (<0.001) 0.773 (<0.001)
SMB 1.475 (<0.001) 1.011 (<0.001) 1.545 (<0.001) 1.002 (<0.001)
HML 0.803 (0.022) 0.266 (0.306) 0.298 (0.358) 0.059 (0.802)
MOM −0.110 (0.609) 0.029 (0.857) −0.044 (0.840) 0.224 (0.078)
ΔOP 0.449 (<0.001) 0.398 (<0.001) 0.527 (<0.001) 0.380 (<0.001)
ΔGP 0.393 (<0.001) 0.124 (<0.001) 0.287 (<0.001) 0.095 (0.011)
R2-adj (within) 0.190 0.148 0.245 0.226
F-statistic 44.192 (<0.001) 37.264 (<0.001) 61.868 (<0.001) 63.852 (<0.001)
Vuong test (z-statistic)
−2.425 (<0.001) −1.629 (0.052)

Page 11 of 14
Misund, Cogent Economics & Finance (2017), 5: 1408944https://doi.org/10.1080/23322039.2017.1408944
flow from operations are significant at the 99% confidence level. Taken together these results allow us to reject hypothesis H1
1 and accept hypothesis H12, implying that accounting method heterogene-
ity and management discretion does not provide a valuable signal for investors. Investors instead prefer cash flows to earnings. The Vuong tests also confirm this finding.
The results are in line studies such as Cormier and Magnan (2002) and Misund et al. (2008) who find significant cash flow coefficients, but contradicts other studies such as Duchac and Douthett (1997) who find a significant earnings–returns relationship.
The results also show that changes in the net present value of reserves are value relevant for SE firms, but not for FC firms. This is surprising since this measure is independent of accounting method choice. Boone (2002) attributes this to a higher measurement error for FC firms.
Interestingly, we find that the FC models give a higher adjusted R2, but by careful inspection of the coefficients we see that this clearly not related to earnings and earnings changes, but rather the ef-fect of other variables. This illustrates comparisons based on adjusted R2 values must be interpreted with care. A higher R2 for the FC models does not imply a higher value relevance of earnings, but it could be the combinations of all the other variables.
The loadings on the risk factors provide insight into the impact of different types of systematic risk on the returns on oil companies. Prior studies vary substantially with respect to treatment of risk in returns. Some disregard risk (e.g. Bryant, 2003), while others only include the market risk premium explicitly (e.g. Boyer & Filion, 2007; Sadorsky, 2001) or indirectly through risk adjustment of the re-turns before regressing on the explanatory variables (e.g. Boone & Raman, 2007). We find that sev-eral of the risk factors are in fact important. While the loading on the market risk premium is quite similar for FC and SE firms, the loadings on the other risk factors are more different. For instance, the loading on the SMB risk factor (small-minus-big) is higher for FC firms than SE firms and is in line with the finding that FC firms tend to be smaller. Hence, the higher average return for FC firms can in part be attributed to the SMB risk factor. The significance of the loadings on the HML and MOM factors are less consistent and vary across the earnings and cash flow models making their interpretation challenging.
Also the loadings on changes in oil and gas prices provide insight into the differences between FC and SE firms. Few value relevance studies explicitly model the change in oil and especially the gas price. Some studies, however, include fixed year effects captures some of the same effects as using fixed oil price changes, as we have done in our study. The benefit of using changes in oil and gas process separately instead of year-dummies is that we are able to assess the differential impact of oil price and gas price changes on the returns. The results show that FC firms, compared to SE firms, are slightly more exposed to the oil price (i.e. coefficients of 0.45 (FC) and 0.40 (SE)) in the earnings model, but much more exposed to the gas price, i.e. coefficients of 0.39 (FC) and 0.12 (SE). This is consistent with the claims made that FC firms are more exposed to the commodity price since they are less diversified (Misund et al., 2015).
The results show that FC and SE firm characteristics are different, and that the investors place dif-ferent loadings on the variables and thus able to distinguish between the two types of firms. The overall impression from the results is that the returns on both FC and SE firms are determined by fundamental factors consistent with financial economic theory, rather than accounting-based prof-itability measures. This is consistent with the theory that when faced with accruals that do not provide valuable signals investors will turn to cash flows measures. In addition, some of the differing characteristics of FC versus SE firms are prices by the markets. For instance, the smaller size of FC firms results in a higher loading on the SMB factor. Given the controversy surrounding the accounting method heterogeneity for oil and gas exploration activities (including longstanding debate, lobbying activities, interference by regulators) combined with specific characteristics in the oil and gas indus-try, it should therefore not be surprising that the financial markets turn to fundamental information
Page 12 of 14
Misund, Cogent Economics & Finance (2017), 5: 1408944https://doi.org/10.1080/23322039.2017.1408944
contained in cash flows, financial asset pricing models and net present values of expected future cash flows.
6. Conclusions and policy implicationIn this paper, we have examined the relative importance for investors of cash flow versus earnings for oil and gas firms. Our hypothesis is that investors prefer cash flows in the oil and gas sector be-cause of accounting method confusion. We use an empirical model based on Ohlson (1995) that provides insight into the impact on oil and gas firm total shareholder returns of short-term profitabil-ity (earnings or cash flow from operations), long-term profitability (net present value of reserves). We find that accounting method heterogeneity combined with management discretion confuses investors, who will resort to fundamental economic information instead of reported earnings. The returns on both FC and SE firms are mainly determined by fundamental factors consistent with fi-nancial economic theory, rather than accounting-based profitability measures. Our finding is con-sistent with the theory suggesting that when an investor is faced with accounting earnings that do not provide valuable signals, it will turn to cash flows measures. In fact, we find a positive associa-tion of both short-term and long-term cash flow measures with returns for oil and gas firms that use the SE approach. The results also suggest that although FC and SE firm characteristics are different, this seems to be recognized and priced by investors.
Our research also highlights the adverse effects of politicized processes for determining accounting standards that companies have to adhere to. The FC/SE case illustrates that the results lead to a reduced significance of reported earnings for investors. The existence of two competing methods serves only to confuse investors trying to uncover oil and gas companies’ true financial performance.
Our research also has some policy implications when it comes to accounting standard setting and financial reporting regulation. Non-profit organization and foundations such as FASB and IFRS estab-lish financial accounting and reporting standards that oil and gas companies have to adhere to. Regulating bodies such as the SEC look to organizations such as FASB when setting accounting stand-ards, and also holds the power to enforce those standards. Our results suggest that these accounting standard setters and financial reporting regulators should revisit the decision to allow for accounting methods choice for accounting for exploration activities in oil and gas companies. We provide evi-dence that investors shy away from accrual measures, instead using cash flows as measures of finan-cial performance, which is the exact opposite of the intentions of the accounting standards.
Given the controversy surrounding the accounting method heterogeneity for oil and gas explora-tion activities (including long-standing debate, lobbying activities, interference by regulators), com-bined with specific characteristics in the oil and gas industry, it should therefore not be surprising that the financial markets turn to fundamental information contained in cash flows, financial asset pricing models and net present values of expected future cash flows. It is indeed a triumph of eco-nomics over politics.
FundingThis work was supported by the Norges Forskningsråd [grant number 237674].
AcknowledgementsThe author would like to thank the participants at the IAEE conference in Rome 2017, as well as an anonymous reviewer, for constructive suggestions which have improved the quality of the paper.
Author detailsBård Misund1
E-mail: [email protected] ID: http://orcid.org/0000-0001-7069-57071 Business School, University of Stavanger, N-4036 Stavanger,
Norway.
Citation informationCite this article as: Accounting method choice and market valuation in the extractive industries, Bård Misund, Cogent Economics & Finance (2017), 5: 1408944.
Notes1. Pre-discovery costs include property acquisition and car-
rying costs, geological and geophysical exploration costs and exploratory drilling costs.
2. As cited in DeFond and Hung (2003).3. Extracted from Department of Justice response to the
SEC dated 27 February 1978. Published in the Federal Register (43 F.R. 878), 4 January 1978 (as cited in Collins, Rozeff, & Dhaliwal, 1981).
4. Studies examining the impact of the association between financial ratios and valuation multiples did not find a significant relation (Osmundsen, Asche, Misund, &
Page 13 of 14
Misund, Cogent Economics & Finance (2017), 5: 1408944https://doi.org/10.1080/23322039.2017.1408944
Mohn, 2006; Osmundsen, Mohn, Misund, & Asche, 2007).5. Total shareholder returns include both capital gains and
dividend yields.6. The reserves class that is used in the calculation of
reserves NPV is proved reserves. The reader should be aware that this definition of oil and gas reserves excludes other classes such as probable and possible reserves (see e.g. Bentley & Bentley, 2015; Misund & Osmundsen, 2015; Speirs, McGlade, & Slade, 2015).
7. Asche and Misund (2016) suggest using fixed effects model for capturing the effects on valuation from variables not included in the models. Examples of such effects might be related to size (Osmundsen et al., 2006), geographical location of oil and gas reserves (Kretzschmar & Kirchner, 2009) and exploration activity (Misund, Mohn & Sikveland, 2017).
8. We thank an anonymous reviewer for this suggestion.9. We also test some alternative variables that Bryant
(2003) used in her study, e.g. the asymmetric net income variables. However, in our data-set we found very high correlations (>0.700) and chose not to include these variables in order to avoid multicollineratity issues.
ReferencesArellano, M. (1987). Computing robust standard errors for
within-groups estimators. Oxford Bulletin of Economics and Statistics, 49(4), 431–434.
Asche, F., & Misund, B. (2016). Who’s a major? A novel approach to peer group selection: Empirical evidence from oil and gas companies. Cogent Economics & Finance, 4, 1264538. doi:10.1080/23322039.2016.1264538
Bentley, R., & Bentley, Y. (2015). Explaining the price of oil 1971–2014: The need to use reliable data on oil discovery and to account for ‘mid-point’ peak. Energy Policy, 86, 880–890. https://doi.org/10.1016/j.enpol.2015.04.028
Boone, J. (2002). Revisiting the reportedly weak value relevance of oil and gas asset present values: The Roles of measurement error, model misspecification, and time‐period idiosyncrasy. The Accounting Review, 77(1), 73–106. https://doi.org/10.2308/accr.2002.77.1.73
Boone, J., & Raman, K. K. (2007). Does implementation guidance affect opportunistic reporting and value relevance of earnings? Journal of Accounting and Public Policy, 26, 160–192. https://doi.org/10.1016/j.jaccpubpol.2007.02.004
Boyer, M. M., & Filion, D. (2007). Common and fundamental factors in stock returns of Canadian oil and gas companies. Energy Economics, 29, 428–453. https://doi.org/10.1016/j.eneco.2005.12.003
Bryant, L. (2003). Relative value relevance of the successful efforts and full cost accounting methods in the oil and gas industry. Review of Accounting Studies, 8(1), 5–28. https://doi.org/10.1023/A:1022645521775
Carhart, M. M. (1997). On persistence in mutual fund performance. The Journal of Finance, 52(1), 57–82. https://doi.org/10.1111/j.1540-6261.1997.tb03808.x
Collins, D., & Dent, W. (1979). The proposed elimination of full cost accounting in the extractive petroleum industry: An empirical assessment of the market consequences. Journal of Accounting and Economics, 1, 3–44. https://doi.org/10.1016/0165-4101(79)90013-2
Collins, D. W., Rozeff, M. S., & Dhaliwal, D. S. (1981). The economic determinants of the market reaction to proposed mandatory accounting changes in the oil and gas industry: A cross-sectional analysis. Journal of Accounting and Economics, 3(1), 37–71. https://doi.org/10.1016/0165-4101(81)90034-3
Cormier, D., & Magnan, M. (2002). Performance reporting by oil and gas firms: Contractual and value implications. Journal of International Accounting, Auditing and Taxation, 11(2), 131–153. https://doi.org/10.1016/S1061-9518(02)00071-X
Cortese, C. L. (2011). Standardizing oil and gas accounting in the US in the 1970s: Insights from the perspective of regulatory capture. Accounting History, 16(4), 403–421. https://doi.org/10.1177/1032373211417990
Cortese, C. L., & Irvine, H. J. (2010). Investigating international accounting standard setting: The black box of IFRS 6. Research in Accounting Regulation, 22, 87–95. https://doi.org/10.1016/j.racreg.2010.07.003
Cortese, C. L., Irvine, H. J., & Kaidonis, M. A. (2009). Extractive industries accounting and economic consequences: Past, present and future. Accounting Forum, 33, 27–37. https://doi.org/10.1016/j.accfor.2008.07.005
Cortese, C. L., Irvine, H. J., & Kaidonis, M. A. (2010). Powerful players: How constituents captured the setting of IFRS 6, an accounting standard for the extractive industries. Accounting Forum, 34, 76–88. https://doi.org/10.1016/j.accfor.2008.11.003
Dechow, P. M. (1994). Accounting earnings and cash flows as measures of firm performance: The role of accounting accruals. Journal of Accounting and Economics, 18, 3–42. https://doi.org/10.1016/0165-4101(94)90016-7
DeFond, M. L., & Hung, M. (2003). An empirical analysis of analysts’ cash flow forecasts. Journal of Accounting and Economics, 35, 73–100. https://doi.org/10.1016/S0165-4101(02)00098-8
Duchac, J., & Douthett, E. (1997). The effect of accounting for oil and gas reserves on the relation between returns and earnings. Journal of Accounting and Finance Research, 4(2), 20–32.
Ewing, B. T., & Thompson, M. A. (2016). The role of reserves and production in the market capitalization of oil and gas companies. Energy Policy, 98, 576–581. https://doi.org/10.1016/j.enpol.2016.09.036
Fama, E. F., & French, K. R. (1993). Common risk factors in the returns on stocks and bonds. Journal of Financial Economics, 33(1), 3–56. https://doi.org/10.1016/0304-405X(93)90023-5
Fields, T. D., Lys, T. Z., & Vincent, L. (2001). Empirical research on accounting choice. Journal of Accounting and Economics, 31, 255–307. https://doi.org/10.1016/S0165-4101(01)00028-3
Financial Accounting Standards Board. (1982). Statement of financial accounting standards No. 69: Disclosures about oil and gas producing activities. Stamford, CT: FASB.
Hausman, J. A. (1978). Specification tests in econometrics. Econometrica, 46(6), 1251–1271. https://doi.org/10.2307/1913827
Healey, P., & Palepu, K. (1993). The effects of firms’ financial disclosure strategies on stock prices. Accounting Horizons, 7, 1–11.
Holthausen, R., & Leftwich, R. (1983). The economic consequences of accounting choice implications of costly contracting and monitoring. Journal of Accounting and Economics, 5, 77–117. https://doi.org/10.1016/0165-4101(83)90007-1
Kretzschmar, G. L., & Kirchner, A. (2009). Oil price and reserve location—Effects on oil and gas sector returns. Global Finance Journal, 20(3), 260–272. https://doi.org/10.1016/j.gfj.2009.08.001
Kretzschmar, G. L., Misund, B., & Hatherly, D. (2007). Market risks and oilfield ownership—Refining oil and gas disclosures. Energy Policy, 35(11), 5909–5917. https://doi.org/10.1016/j.enpol.2007.06.007
Misund, B. (2015). Reserves replacement and oil and gas company shareholder returns (Working Paper). University of Stavanger.
Misund, B. (2016). Vertical integration and value-relevance: Empirical evidence from oil and gas producers. Cogent Economics & Finance, 4, 1264107. doi:10.1080/23322039.2016.1264107

Page 14 of 14
Misund, Cogent Economics & Finance (2017), 5: 1408944https://doi.org/10.1080/23322039.2017.1408944
© 2017 The Author(s). This open access article is distributed under a Creative Commons Attribution (CC-BY) 4.0 license.You are free to: Share — copy and redistribute the material in any medium or format Adapt — remix, transform, and build upon the material for any purpose, even commercially.The licensor cannot revoke these freedoms as long as you follow the license terms.
Under the following terms:Attribution — You must give appropriate credit, provide a link to the license, and indicate if changes were made. You may do so in any reasonable manner, but not in any way that suggests the licensor endorses you or your use. No additional restrictions You may not apply legal terms or technological measures that legally restrict others from doing anything the license permits.
Cogent Economics & Finance (ISSN: 2332-2039) is published by Cogent OA, part of Taylor & Francis Group. Publishing with Cogent OA ensures:• Immediate, universal access to your article on publication• High visibility and discoverability via the Cogent OA website as well as Taylor & Francis Online• Download and citation statistics for your article• Rapid online publication• Input from, and dialog with, expert editors and editorial boards• Retention of full copyright of your article• Guaranteed legacy preservation of your article• Discounts and waivers for authors in developing regionsSubmit your manuscript to a Cogent OA journal at www.CogentOA.com
Misund, B., Asche, F., & Osmundsen, P. (2008). Industry upheaval and valuation: Empirical evidence from the international oil and gas industry. The International Journal of Accounting, 43(4), 398–424. https://doi.org/10.1016/j.intacc.2008.09.007
Misund, B., Mohn, K., & Sikveland, M. (2017). Exploration risk in oil and gas shareholder returns. Forthcoming in Journal of Energy Markets. doi:10.21314/JEM.2017.167
Misund, B., & Osmundsen, P. (2015). The value-relevance of accounting figures in the oil and gas industry: Cash flow or accruals? Petroleum Accounting and Financial Management Journal, 34(2), 90–110.
Misund, B., & Osmundsen, P. (2017). Valuation of proved vs. probable oil and gas reserves. Cogent Economics & Finance, 5, 1385443. doi:10.1080/23322039.2017.1385443
Misund, B., Osmundsen, P., & Sikveland, M. (2015). International oil company valuation: The effect of accounting method and vertical integration. Petroleum Accounting and Financial Management Journal, 34(1), 1–19.
Ohlson, J. A. (1995). Earnings, book values, and dividends in equity valuation. Contemporary Accounting Research, 11(2), 661–687. https://doi.org/10.1111/care.1995.11.issue-2
Osmundsen, P., Asche, F., Misund, B., & Mohn, K. (2006). Valuation of international oil companies. The Energy Journal, 27(3), 49–64.
Osmundsen, P., Mohn, K., Misund, B., & Asche, F. (2007). Is supply choked by financial market pressures? Energy Policy, 35(1), 467–474. https://doi.org/10.1016/j.enpol.2005.12.010
Sadorsky, P. (2001). Risk factors in stock returns of Canadian oil and gas companies. Energy Economics, 23, 17–28. https://doi.org/10.1016/S0140-9883(00)00072-4
Said, S. E., & Dickey, D. A. (1984). Testing for unit roots in autoregressive-moving average models of unknown order. Biometrika, 71(3), 599–607. https://doi.org/10.1093/biomet/71.3.599
Speirs, J., McGlade, C., & Slade, R. (2015). Uncertainty in the availability of natural resources: Fossil fuels, critical metals, and biomass. Energy Policy, 87, 654–664. https://doi.org/10.1016/j.enpol.2015.02.031
Stock, J. H., & Watson, M. W. (2010). Introduction to econometrics (3rd ed.). London: Pearson Eduction.
Sutton, T. G. (1984). Lobbying of accounting standard-setting bodies in the UK and the USA: A Downsian analysis. Accounting, Organizations and Society, 9(1), 81–95. https://doi.org/10.1016/0361-3682(84)90031-X
Van Riper, R. (1994). Setting standards for financial reporting: FASB and the struggle for control of a critical process. Westport, CT: Quorom Books.
Vuong, Q. H. (1989). Likelihood ratio test for model selection and non-nested hypotheses. Econometrica, 57, 307–333. https://doi.org/10.2307/1912557
Watts, R. L., & Zimmerman, J. L. (1986). Positive accounting theory. Englewood Cliffs, NJ: Prentice-Hall.
White, H. (1980). A heteroskedasticity-consistent covariance matrix estimator and a direct test from heteroskedastcity. Econometrica, 48(4), 817–838. https://doi.org/10.2307/1912934
Wright, C. J., & Gallun, R. A. (2005). International petroleum accounting. Tulsa, OK: PennWell.
Zeff, S. A. (1978). The risk of ‘economic’ consequences. Journal of Accountancy, 146(6), 56–63.