accounting for variations in the quality of primary school ... · multilevel model of pupil...
TRANSCRIPT
Working Paper
Botswana Ken
ya Lesotho M
alaw
i Mauritius Mozambique Nam
ibia Seychelles South Africa Sw
aziland Tanzania Uganda Zambia Zanzibar Zim
babwe
Accounting for Variations in the Quality of Primary School Education
Accounting for Variations in the Quality of Primary School Education
SACMEQ’s research and training activities have been generously supported for over a decade by the
Netherlands Government
77
Njora HungiNjora Hungi
September 2011


iii
ABSTRACT
This paper reports on the use of multivariate analyses procedures to examine pupil- and
school-level factors that contributed to variations in reading and mathematics achievement
among Grade 6 pupils in 15 African school systems (Botswana, Kenya, Lesotho, Malawi,
Mauritius, Mozambique, Namibia, the Seychelles, South Africa, Swaziland, Tanzania,
Uganda, Zambia, Zanzibar, and Zimbabwe). The data for this study were collected in 2007 as
part of the major SACMEQ III Project, which sought to examine the quality of education
offered in primary schools in these countries. (SACMEQ is an acronym for the Southern and
Eastern Africa Consortium for Monitoring Educational Quality.)
At the pupil level, grade repetition, socio-economic background, pupil age, and pupil
sex were found to be the most important factors affecting the variations in pupil achievement
in these school systems, while at the school level, school resources and school location were
identified as the important common factors. South Africa and Zimbabwe were among the
school systems with the largest between-school variation (especially in reading), while the
Seychelles and Mauritius had the largest within-school variation.
In addition, low social equity in pupil achievement was evident in South Africa,
Mauritius, and Zimbabwe, while large gender differences in pupil achievement were evident
in the Seychelles and to some extent in Tanzania and Kenya, especially in mathematics.
Implications of the findings for policy and practice are outlined.
KEYWORDS
Absenteeism; Grade repetition; Homework; Household tasks; Learning materials;
Mathematics achievement; Multilevel models; Preschool attendance; Pupil achievement;
Pupil age; Pupil sex; Pupil–teacher ratio; Quality of education; Reading achievement;
SACMEQ school systems; School location; School resources; Socioeconomic background;
Speaking the language of instruction; Textbooks.
ACKNOWLEDGMENT
SACMEQ wishes to acknowledge the generous financial assistance provided by the Ministry
of Foreign Affairs of the Government of the Netherlands in support of SACMEQ’s research
and training programmes.

iv
The Fifteen SACMEQ School Systems
Source: SACMEQ Data, 2007
400 450 500 550 600
Zimbabwe
Zanzibar
Zambia
Uganda
Tanzania
Swaziland
South Africa
Seychelles
Namibia
Mozambique
Mauritius
Malawi
Lesotho
Kenya
Botswana
Pupil reading scores
v
TABLE OF CONTENTS
ABSTRACT ............................................................................................................................. iii
KEYWORDS ........................................................................................................................... iii
ACKNOWLEDGMENT .......................................................................................................... iii
LIST OF TABLES....................................................................................................................... vi
LIST OF FIGURES..................................................................................................................... vii
Introduction ....................................................................................................................1
Sampling procedures.....................................................................................................2
Calculating pupil scores................................................................................................3
About SACMEQ questionnaires....................................................................................3
Construction of predictor variables..............................................................................4
Multilevel model of pupil achievement.........................................................................5
Analyses..........................................................................................................................6
Results ............................................................................................................................8
Discussions ....................................................................................................................8
Summary and conclusions..........................................................................................25
References ................................................................................................................29
APPENDICES ............................................................................................................31
Appendix 1: Variables tested in the two-level models for reading and mathematics ........ 32
Appendix 2: Final models for reading achievement .......................................................... 36
Appendix 3: Final models for mathematics achievement .................................................. 40

vi
LIST OF TABLES
Table 1: Numbers of Grade 6 pupil, teachers and schools
in the SACMEQ III Project .............................................................................2
Table 2: Standardized regression coefficients of the variables
in the reading models ...................................................................................9
Table 3: Standardized regression coefficients of the variables
in the mathematics models ..........................................................................11
Table 4: Summary of the effects of the common pupil-level variables.......................16
Table 5: Summary of the effects of the common school-level variables ....................21
Table A6: Pupil-level models for reading .....................................................................36
Table A7: School-level models for reading ..................................................................38
Table A8: Pupil-level models for mathematics .............................................................40
Table A9: School-level models for mathematics ..........................................................42

vii
LIST OF FIGURES
Figure 1: Hypothesized two-level model of pupil achievement for SACMEQ III
study..............................................................................................................7
Figure 2: Differences in achievement between pupils one standard deviation
above and below the national mean SES score without
controlling for any other factors ...................................................................13
Figure 3: Differences in achievement between girls and boys after
controlling for all other significant factors.....................................................15
Figure 4: Differences in achievement between pupils one standard deviation
above and below the national Grade 6 mean age after controlling
for all other factors.......................................................................................15
Figure 5: Effects of various uses of mathematics textbooks on pupil achievement
after controlling for pupil SES ......................................................................17
Figure 6: Effects of various durations of preschool attendance on pupil
achievement after controlling for pupil SES.................................................17
Figure 7: Variation in reading achievement ................................................................23
Figure 8: Variation in mathematics achievement ........................................................23
Figure 9: Changes in between-school variations in pupil reading scores
between 2000 and 2007 ..............................................................................25


Introduction In this paper, multilevel analyses of the SACMEQ III data are presented. These analyses were
carried out to identify the major pupil-level and school-level factors influencing scores for
reading and mathematics among Grade 6 pupils in 15 SACMEQ school systems.
The Dakar Education for All (EFA) Framework for Action recognized that education was
central to individual empowerment, the elimination of poverty at household and community
level, and broader social and economic development. It therefore resolved that governments
and all other EFA partners must work together to ensure a basic education of quality for all
children, regardless of their background. Thus, it is of interest to identify and understand the
key factors that influence pupil achievement so that governments can focus on policies that
could improve education quality for all children regardless of the children’s background
characteristics (such as socio-economic background and gender) and their schools’
characteristics (such as school location and school size).
The main research questions tackled in this paper are:
What were the key pupil- and school-level factors influencing pupil achievement in
SACMEQ school systems?
What were the within-school and between-school variations in pupil achievement in
SACMEQ school systems? What proportions of these variations could be explained in the
final model? Were there substantial changes in the between-school variances over time?
How do social and gender differences compare across SACMEQ school systems after
controlling for other factors influencing pupil achievement?
The multilevel analyses reported in this paper were carried out using HLM6. This software
allows the effects of variables at the different levels of hierarchy as well as their interaction
effects to be examined simultaneously.
The structure of this paper is as follows. Four short sections describe (a) the sampling
procedures employed in SACMEQ studies, (b) how pupil reading and mathematics scores
were calculated, (c) an overview of SACMEQ questionnaires, and (d) how the predictor
variables involved in this paper were constructed. These are followed by two sections in
which the hypothesized multilevel model for pupil achievement and the analyses are
described. Finally, sections are included in which the results of the analyses are presented and
discussed.
Accounting for Variations in the Quality of Primary School Education
2
Sampling procedures
The desired target population for the SACMEQ III study was defined as “All pupils at Grade
6 level in 2007 (at the first week of the eighth month of the school year) who were attending
registered mainstream primary schools”. This definition used a grade-based description (and
not an age-based description) of pupils because an age-based description would have required
the collection of data across many grade levels due to the high incidences of “late starters”
and grade repetition in SACMEQ school systems.
The SACMEQ III data were selected using a stratified two-stage cluster sample design based
on the technique of a lottery method of sampling proportional to size, with the assistance of
SAMDEM software (Sylla et al., 2003). At the first stage, schools were selected in each
region (province) in proportion to the number of pupils in that region in the defined target
population. At the second stage, a simple random sample of 25 pupils was taken within each
selected school (in the Seychelles, all Grade 6 pupils in all 25 schools in the island country
were tested).
In order to avoid selection bias, precautions were taken to ensure that school heads and
teachers did not have any influence over the sampling procedures within schools. This is
because school heads and teachers might have felt they had a vested interest in selecting
particular kinds of pupils, and this could have resulted in major distortions of sample
estimates (Brickell, 1974).
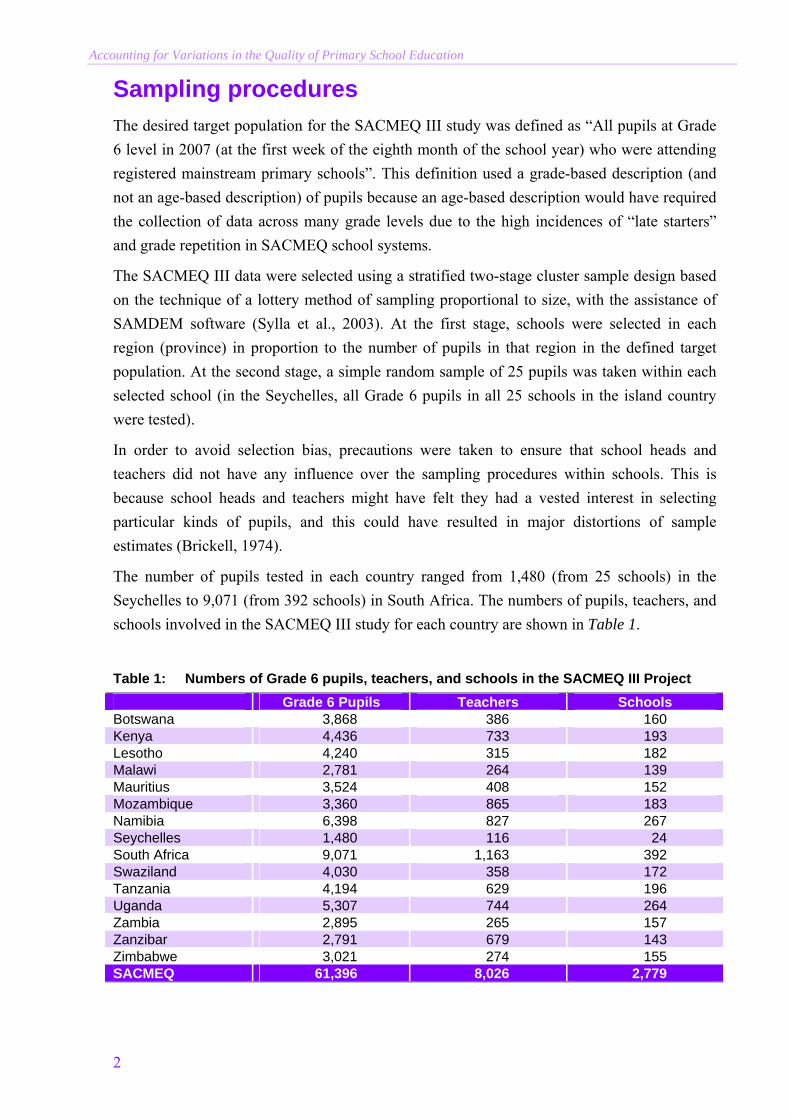
The number of pupils tested in each country ranged from 1,480 (from 25 schools) in the
Seychelles to 9,071 (from 392 schools) in South Africa. The numbers of pupils, teachers, and
schools involved in the SACMEQ III study for each country are shown in Table 1.
Table 1: Numbers of Grade 6 pupils, teachers, and schools in the SACMEQ III Project
Grade 6 Pupils Teachers Schools Botswana 3,868 386 160 Kenya 4,436 733 193 Lesotho 4,240 315 182 Malawi 2,781 264 139 Mauritius 3,524 408 152 Mozambique 3,360 865 183 Namibia 6,398 827 267 Seychelles 1,480 116 24 South Africa 9,071 1,163 392 Swaziland 4,030 358 172 Tanzania 4,194 629 196 Uganda 5,307 744 264 Zambia 2,895 265 157 Zanzibar 2,791 679 143 Zimbabwe 3,021 274 155 SACMEQ 61,396 8,026 2,779

Hungi, N.
3
Calculating pupil scores
The outcome variables of interest in the SACMEQ III study were pupil scores in reading,
mathematics, and health knowledge tests, but in this paper only the reading and mathematics
scores are considered. The SACMEQ tests were developed after careful curriculum mapping
by a panel of subject specialists drawn from all the 15 SACMEQ school systems to identify
those elements of curriculum outcomes that were considered important and which were to be
assessed in the tests. The subject specialists also reviewed the test items to ensure that they
conformed to the national syllabuses of SACMEQ countries. In addition, during the process
of test development and before the tests were administered they were field-tested in all
SACMEQ school systems, and their psychometric characteristics were examined using Rasch
scaling techniques. Items that did not meet Rasch scaling requirements were dropped from the
tests. The items were also examined for gender bias and country bias, and those found to
function differently among boys and girls or among countries were dropped from the test.
Most of the items survived these stringent examinations.
During the SACMEQ II study, the Rasch scores on the final pupil reading and mathematics
tests were transformed to have a mean of 500 and a standard deviation of 100 (for the pooled
data with equal weight given to each country). During the SACMEQ III study, Rasch
measurement procedures were employed to equate the SACMEQ II and SACMEQ III scores.
These are the scores that have been used as the criterion variables in this paper.
About SACMEQ questionnaires
Apart from pupil achievement scores, SACMEQ studies are renowned for collecting a wide
range of information about pupils, teachers, classrooms, school heads, schools, and school
communities. For the SACMEQ III study, four main questionnaires (pupil, teacher, school
head, and school information) were used.
It is important to note that SACMEQ questionnaires were subjected to careful thought,
thorough examination, and stringent refinement before they were administered. For example,
for the SACMEQ III study, the questionnaires were developed by a committee of experts
consisting of members drawn from all SACMEQ countries, SCC staff, IIEP staff, and private
consultants, following (a) field experiences gained from the SACMEQ II study, (b)
recommendations arising from analyses of SACMEQ II data, and (c) policy questions raised
by SACMEQ country ministries of education. These questionnaires were refined by the
SACMEQ scientific committee, then piloted in each SACMEQ country and refined further
before they were administered.
One important innovation in the development of questionnaires for the SACMEQ III study
was introduction of a “Homework form” for pupils to take home. This consisted of questions
to which the pupil might not know the answers (for example, parental education, estimates of
travel distance to school, home possessions, whether or not their biological parents were
Accounting for Variations in the Quality of Primary School Education
4
alive) that parents, family members, or guardians could help in filling in. This considerably
reduced the number of missing values in the SACMEQ III study compared with previous
SACMEQ studies.
The quality of the data provided by the school heads, teachers, and pupils was examined in
two ways. First, at the time of data collection, the data collectors who visited the schools
verified, for example, (a) the actual existence and conditions of the school resources such as
library, school head office, and staff room, and (b) the official school records about the
information provided by pupils such as their gender, age, days absent, and whether or not
their parents were alive. Second, similar questions were included in the school head, pupil,
and teacher questionnaires, and these helped to verify the responses given by the respondents
during data cleaning. For example, a question on the existence of a class library was included
in both the teacher and pupil questionnaires. Any inconsistencies between the responses of the
school heads, teachers, and pupils were followed up by the national research coordinators
(NRCs) and corrected during data cleaning.
Construction of predictor variables
The information collected using the questionnaires mentioned above was used in the
construction of the predictor variables involved in the analyses described in this paper.
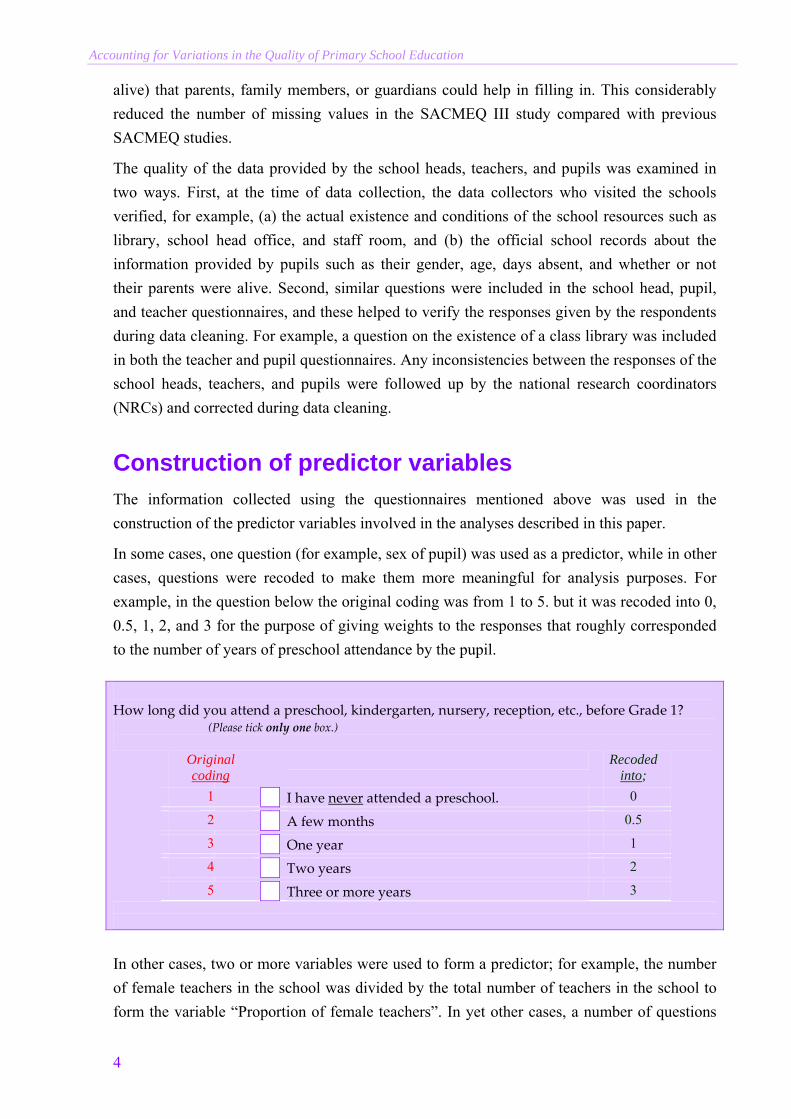
In some cases, one question (for example, sex of pupil) was used as a predictor, while in other
cases, questions were recoded to make them more meaningful for analysis purposes. For
example, in the question below the original coding was from 1 to 5. but it was recoded into 0,
0.5, 1, 2, and 3 for the purpose of giving weights to the responses that roughly corresponded
to the number of years of preschool attendance by the pupil.
How long did you attend a preschool, kindergarten, nursery, reception, etc., before Grade 1? (Please tick only one box.)
Original coding
Recoded into;
1 I have never attended a preschool. 0
2 A few months 0.5
3 One year 1
4 Two years 2
5 Three or more years 3
In other cases, two or more variables were used to form a predictor; for example, the number
of female teachers in the school was divided by the total number of teachers in the school to
form the variable “Proportion of female teachers”. In yet other cases, a number of questions

Hungi, N.
5
were combined to estimate, for instance, a pupil socio-economic status factor (also referred to
as “Pupil SES”), classroom resources factor, and school resources factors. Information about
the predictor variables involved in the analyses described in this paper is given in Appendix 1.
An interesting aspect of the SACMEQ III study is that Grade 6 teachers were also tested in
reading and mathematics (except in Mauritius where only pupils were tested). The teacher and
pupil tests used different sets of items, but the two tests had some common items for purposes
of comparison. The teacher tests were designed to be more difficult than the pupil tests. In
addition, like the pupil tests, the teacher tests were field-tested and their measurement
characteristics examined using Rasch analysis before they were administered. Teachers’
scores (also referred to as “Teacher subject matter knowledge”) in the tests are used as
predictors of pupil score in the models analysed in this study.
Multilevel model of pupil achievement
Figure 1 shows the general two-level model that was hypothesized for factors influencing
pupil achievement in reading and mathematics. This model was examined separately for each
of 15 school systems involved in the SACMEQ III study, and separately for reading and for
mathematics data. The general model is based on existing literature on pupil learning,
especially Carroll’s model of school learning (Carroll, 1963) and Creemers’ model of
effective classrooms (Creemers, 1994).
The hierarchical structure of the model, shown in Figure 1, has pupils at level 1 and schools at
level 2: that is, pupils nested within schools. At an early point of this study a three-level
model was considered (with pupils, schools, and provinces at levels 1, 2, and 3 respectively).
However, this three-level model was discarded because multilevel analyses of the model were
considered unstable for the Seychelles, which had too few level-2 units (25 schools nested
under six provinces) and Swaziland which had too few level-3 units (172 schools nested
under four provinces), as well as Uganda, which also had too few level-3 units (264 schools
nested under four provinces). An alternative three-level model was also considered (with
pupils, classes, and schools at levels 1, 2, and 3 respectively), but a decision was made to
settle for the two-level model for this paper because it was considered sufficient for achieving
the main aims – identification of the key factors, and estimation of within- and between-
school variance.
As can be seen from Figure 1, three categories of variables were hypothesized to directly
influence achievement at the pupil level: “Individual characteristics” (e.g. sex and age),
“Personalized learning support” (e.g. preschool attendance, extra tuition, and homework help
at home), and “Home environment” (e.g. pupil SES, number of siblings, and household tasks).
Four categories of variables were hypothesized to directly influence achievement at the school
level: “Teacher characteristics” (e.g. sex, education, and professional qualifications), and
“Classroom environment” (e.g. class size and classroom resources). Other variables were
Accounting for Variations in the Quality of Primary School Education
6
“School head characteristics” (e.g. sex, education level, and experience), and “School
environment” (e.g. school resources, type of school, pupils’ behaviour problems, and the
contextual climate such as average pupil SES and the proportion of girls in the school). A
comprehensive list of all the predictor variables (and their details) in each of these categories
is given in Appendix 1. Over 80 different variables were examined in this study, 21 at the
pupil level and over 60 at the school level.
Analyses
Before commencement of multilevel analyses the correlations between variables were
examined in order to get a general “feel” of the associations between variables, and also to
check potential problems because of any multicollinearity and suppressor variable
relationships in the model (Keeves, 1997). This task was carried out successfully.
The variables were then examined using simple multiple linear regression (MLR) models
using SPSS software to identify which of the variables (listed in Appendix 1) warranted further
scrutiny using multilevel procedures. In other words, the MLR analyses were employed to
select variables to be examined in the multilevel analyses. In this regard, a variable was
deemed worth of further scrutiny using the multilevel approach if it was significant in the
MLR models at the p0.05 level.
The multilevel analyses were carried out using HLM6 software (Raudenbush et al., 2005),
following the logic employed by Raudenbush and Bryk (2002) in their descriptions of these
types of model. For each school system, two multivariate data matrix (MDM) files were built,
one for reading and the other for mathematics. Weighting (with sampling weights calculated
to cater for the design of this study) was undertaken during the analyses.
The initial step in the HLM analyses was to run so-called “null models” in order to estimate
the within- and between-school variations for each subject and for each school system. This
was followed by building up the pupil-level models, which involved adding pupil-level
predictors to the models, but without entering predictors at the school level. At this stage, a
“step-up” approach (Bryk and Raudenbush, 1992) was followed to examine which of the
pupil-level variables had a significant (at p0.05) influence on the outcome variables. The
step-up approach involved progressive addition of significant predictors into the model, one at
time. Finally, school-level predictors were added into the models using the step-up strategy
mentioned above. The level-2 exploratory analysis subroutine available in HLM6 was
employed for examining the potentially significant school-level predictors (as shown in the
output) in successive HLM runs.

7
PupilAchievement
PupilAchievement
Pupil-level(Level-1)
School-level(Level-2)
Home Environment
Pupil Individual
Characteristics
Classroom Environment
Teacher Characteristics
School Head Characteristics
School Environment
Level-1 effect
Level-2 effect
Interaction effect
Level-1 variable
Level-2 variable
Pupil Achievement = Reading or
Mathematics
NOTES
Personalized Learning Support
Figure 1: Hypothesized two-level model of pupil achievement for the SACMEQ III study
Accounting for Variations in the Quality of Primary School Education
8
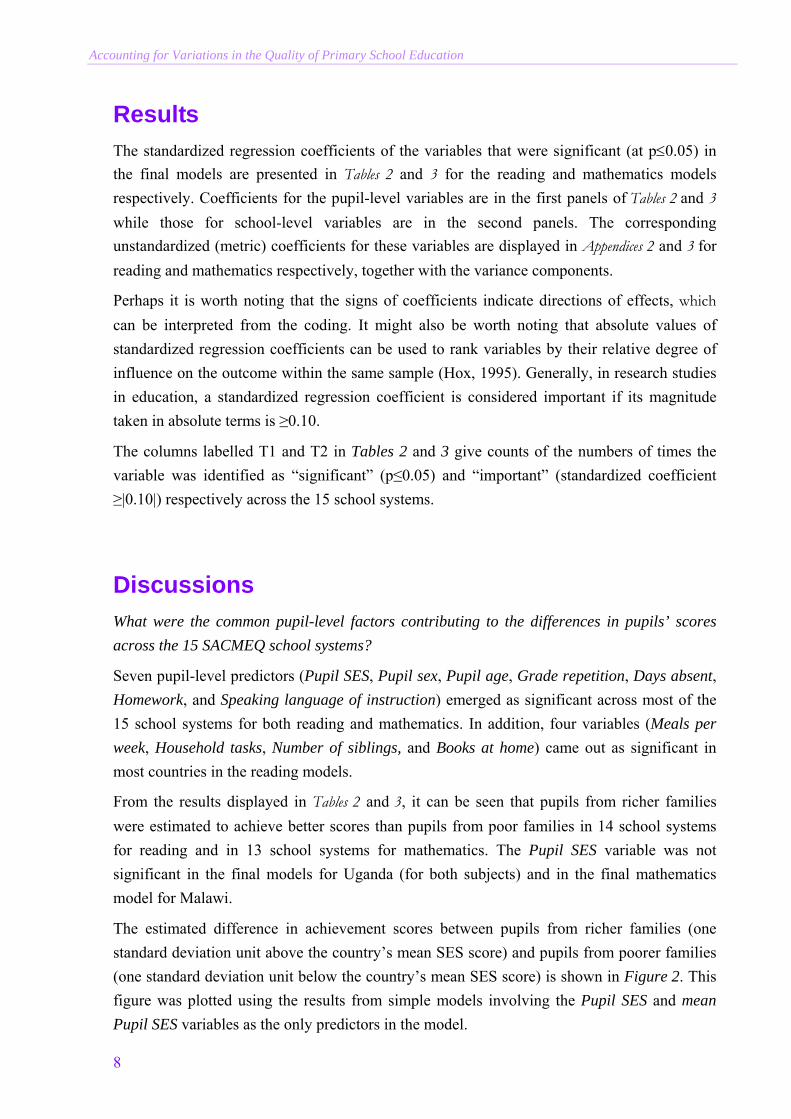
Results
The standardized regression coefficients of the variables that were significant (at p0.05) in
the final models are presented in Tables 2 and 3 for the reading and mathematics models
respectively. Coefficients for the pupil-level variables are in the first panels of Tables 2 and 3
while those for school-level variables are in the second panels. The corresponding
unstandardized (metric) coefficients for these variables are displayed in Appendices 2 and 3 for
reading and mathematics respectively, together with the variance components.
Perhaps it is worth noting that the signs of coefficients indicate directions of effects, which
can be interpreted from the coding. It might also be worth noting that absolute values of
standardized regression coefficients can be used to rank variables by their relative degree of
influence on the outcome within the same sample (Hox, 1995). Generally, in research studies
in education, a standardized regression coefficient is considered important if its magnitude
taken in absolute terms is ≥0.10.
The columns labelled T1 and T2 in Tables 2 and 3 give counts of the numbers of times the
variable was identified as “significant” (p≤0.05) and “important” (standardized coefficient
≥|0.10|) respectively across the 15 school systems.
Discussions
What were the common pupil-level factors contributing to the differences in pupils’ scores
across the 15 SACMEQ school systems?
Seven pupil-level predictors (Pupil SES, Pupil sex, Pupil age, Grade repetition, Days absent,
Homework, and Speaking language of instruction) emerged as significant across most of the
15 school systems for both reading and mathematics. In addition, four variables (Meals per
week, Household tasks, Number of siblings, and Books at home) came out as significant in
most countries in the reading models.
From the results displayed in Tables 2 and 3, it can be seen that pupils from richer families
were estimated to achieve better scores than pupils from poor families in 14 school systems
for reading and in 13 school systems for mathematics. The Pupil SES variable was not
significant in the final models for Uganda (for both subjects) and in the final mathematics
model for Malawi.
The estimated difference in achievement scores between pupils from richer families (one
standard deviation unit above the country’s mean SES score) and pupils from poorer families
(one standard deviation unit below the country’s mean SES score) is shown in Figure 2. This
figure was plotted using the results from simple models involving the Pupil SES and mean
Pupil SES variables as the only predictors in the model.

9
Table 2: Standardized regression coefficients of the variables in the reading models
BOT KEN LES MAL MAU MOZ NAM SEY SOU SWA TAN UGA ZAM ZAN ZIM
Pupil-level variables T1 T2
Pupil age -0.10 -0.17 -0.13 -0.07 -0.04 -0.11 0.05 -0.05 -0.12 -0.10 -0.03 -0.04 12 6 Pupil sex 0.08 -0.06 -0.12 0.03 -0.08 0.03 0.20 0.05 -0.10 -0.06 -0.06 11 3 Grade repetition -0.17 -0.10 -0.11 -0.07 -0.22 -0.07 -0.13 -0.06 -0.09 -0.13 -0.14 -0.05 -0.09 -0.14 -0.10 15 9 Days absent -0.03 -0.05 -0.05 -0.08 -0.13 -0.04 -0.02 -0.08 -0.12 -0.04 -0.06 -0.09 -0.05 13 2 Preschool attendance 0.07 0.04 0.05 0.08 0.03 0.04 0.05 7 0 Speaking language of instruction 0.09 0.17 0.05 0.05 0.23 0.09 0.03 0.09 0.06 9 2 Socio-economic status 0.23 0.05 0.12 0.06 0.19 0.12 0.09 0.11 0.16 0.10 0.13 0.13 0.17 0.13 14 11 Number of siblings -0.03 -0.04 -0.06 -0.05 -0.05 -0.11 -0.02 -0.06 8 1 Meals per week 0.03 0.05 0.04 0.04 0.03 0.02 0.04 0.03 0.06 9 0 Household tasks -0.04 -0.05 -0.07 -0.04 -0.04 -0.08 -0.03 -0.04 -0.05 9 0 Homework help at home 0.04 0.04 0.05 3 0 Parents alive 0.03 0.03 2 0 Living with parents/relatives 0.03 0.03 0.07 0.02 0.04 0.08 6 0 Learning culture (books at home) 0.03 0.07 0.03 0.03 0.06 0.16 0.05 0.07 8 1 Pupil learning materials 0.06 0.03 0.11 0.03 0.05 0.06 6 1 Reading textbook ownership 0.09 0.08 0.02 0.05 0.04 5 0 Homework (given, corrected and explained) 0.06 0.10 0.05 0.08 0.08 0.03 0.04 0.05 0.11 0.06 0.11 0.09 12 3 Extra tuition in reading 0.11 -0.03 0.06 -0.03 4 1 Travel distance to school -0.04 -0.05 -0.04 -0.03 4 0 Working place 0.03 0.06 0.09 3 0
School-level variables
Teacher age -0.08 -0.05 2 0 Permanent teacher 0.16 1 1 Teacher education level 0.10 1 1 Teacher years of professional training 0.12 1 1 Teacher teaching hours per week -0.08 1 0 Teacher in-service training 0.07 0.04 2 0 Teacher visits to education resources centre 0.07 1 0 Teacher subject matter knowledge 0.05 0.07 0.07 3 0 Teacher frequency of meeting parents 0.06 1 0 Teacher hours of preparation per week 0.08 1 0 Teacher housing condition 0.06 1 0 Frequency of reading tests -0.06 0.07 2 0 Teacher days absent -0.04 1 0 Teachers' behaviour problems -0.04 1 0 Proportion of female teachers 0.10 0.15 2 2 Class size -0.18 -0.07 2 1

10
Table 2: Standardized regression coefficients of the variables in the reading models (Continued)
BOT KEN LES MAL MAU MOZ NAM SEY SOU SWA TAN UGA ZAM ZAN ZIM
School-level variables (Continued) T1 T2
School head sex 0.07 1 0 School head age -0.13 1 1 School head professional training 0.05 1 0 School head education level 0.06 1 0 School head experience as a head 0.14 1 1 School head management course 0.06 1 0 School head teaching hours per week -0.05 1 0 Condition of school buildings 0.06 1 0 School resources 0.11 0.06 0.12 0.06 0.13 0.11 0.18 0.07 0.08 0.19 10 6 Pupils allowed to borrow books 0.11 1 1 School location 0.11 0.09 0.19 0.15 0.15 0.18 0.10 0.18 8 7 School inspections 0.06 1 0 School community contribution 0.08 1 0 School community problems -0.04 -0.11 -0.09 -0.09 -0.08 5 1 Pupil–teacher ratio -0.08 -0.10 -0.06 -0.12 -0.07 5 2 Private school 0.12 1 1 Free school meals -0.20 -0.06 -0.08 -0.13 -0.14 5 3 School size 0.09 -0.09 2 0 Pupil behaviour problems 0.10 1 1 Mean pupil age 0.18 1 1 Mean days absent -0.10 1 1 Mean preschool attendance 0.10 1 1 Mean speaking language of instruction 0.08 1 0 Mean socio-economic status 0.21 0.09 2 1 Mean meals per week 0.06 1 0 Mean household tasks -0.09 1 0 Mean learning materials 0.06 0.09 2 0 Mean reading textbook ownership 0.04 1 0 Mean homework 0.06 1 0 Mean extra tuition in reading 0.06 0.07 2 0 Mean working place 0.03 1 0
NOTE: BOT is Botswana, KEN is Kenya, LES is Lesotho, MAL is Malawi, MAU is Mauritius, MOZ is Mozambique, NAM is Namibia, SEY is the Seychelles, SOU is South Africa, SWA is Swaziland, TAN is Tanzania, UGA is Uganda, ZAM is Zambia, ZAN is Zanzibar, and ZIM is Zimbabwe Standardized regression coefficients in bold text are ≥|0.10|; T1 and T2 are numbers of times the variable was identified as significant (p≤0.05) and important (standardized regression coefficient ≥|0.10|) across the 15 school systems respectively; - Indicates that the variable was not available for testing in the model for the mentioned country.

11
Table 3: Standardized regression coefficients of the variables in the mathematics models
BOT KEN LES MAL MAU MOZ NAM SEY SOU SWA TAN UGA ZAM ZAN ZIM
Pupil-level variables T1 T2
Pupil age -0.08 -0.14 -0.13 -0.05 -0.10 -0.05 -0.11 -0.04 -0.05 9 4
Pupil sex -0.15 -0.05 -0.10 -0.03 -0.10 -0.05 0.10 -0.12 -0.18 -0.09 -0.09 -0.06 -0.04 13 7
Grade repetition -0.15 -0.05 -0.10 -0.18 -0.06 -0.11 -0.08 -0.07 -0.10 -0.04 -0.09 -0.07 -0.12 13 6
Days absent -0.03 -0.04 -0.06 -0.04 -0.11 -0.02 -0.06 -0.11 -0.03 -0.04 -0.05 11 2
Preschool attendance 0.06 0.06 0.03 0.06 0.03 0.05 6 0
Speaking language of instruction 0.07 0.06 0.11 0.04 0.04 0.21 0.05 0.06 0.06 9 2
Socioeconomic status 0.18 0.05 0.11 0.21 0.08 0.10 0.13 0.12 0.04 0.09 0.11 0.11 0.09 13 8
Number of siblings -0.05 -0.04 -0.05 -0.09 -0.01 -0.05 6 0
Meals per week 0.03 0.07 0.04 0.03 0.06 5 0
Household tasks -0.05 -0.04 -0.06 -0.03 4 0
Homework help at home 0.05 0.04 0.08 3 0
Parents alive 0.03 1 0
Living with parents/relatives 0.05 0.08 0.05 0.04 4 0
Learning culture (books at home) 0.02 0.04 0.04 0.17 0.07 0.07 6 1
Pupil learning materials 0.03 0.08 0.10 0.03 0.04 0.04 0.05 7 1
Mathematics textbook ownership 0.08 0.05 0.04 0.04 0.15 5 1
Homework (given, corrected and explained) 0.04 0.05 0.07 0.07 0.08 0.04 0.06 0.05 0.10 0.05 0.05 11 1
Extra tuition in mathematics 0.05 0.11 0.08 -0.03 0.06 0.12 6 2
Travel distance to school -0.05 -0.05 -0.05 -0.05 4 0
Working place 0.04 0.05 0.06 0.06 4 0
School-level variables
Teacher sex 0.08 1 0
Teacher age -0.09 1 0
Teacher education level 0.05 1 0
Teacher teaching hours per week -0.07 -0.06 2 0
Teacher subject matter knowledge 0.07 0.08 0.10 0.06 0.09 5 1
Teacher days absent -0.07 -0.07 -0.06 -0.07 4 0
Report on mathematics 0.11 1 1
SH advice teacher 0.08 1 0
12
Table 3: Standardized regression coefficients of the variables in the mathematics models (Continued)
BOT KEN LES MAL MAU MOZ NAM SEY SOU SWA TAN UGA ZAM ZAN ZIM
School-level variables (Continued) T1 T2
Teachers' behaviour problems -0.07 1 0
Proportion of female teachers -0.06 1 0
Class size -0.17 -0.10 -0.06 3 2
Classroom resources 0.10 1 1
SH professional training 0.06 1 0
SH experience as a head 0.08 1 0
SH experience as a teacher 0.04 0.13 0.08 0.08 4 1
SH teaching hours per week -0.10 1 1
School resources 0.08 0.08 0.12 0.12 0.09 0.11 0.15 7 4
Pupils allowed to borrow books 0.08 1 0
School days lost -0.05 1 0
School location 0.05 0.09 0.08 0.12 0.08 0.13 0.11 7 3
School inspections 0.07 0.06 0.09 3 0
School community contribution 0.07 0.06 2 0
School community problems -0.09 1 0
Pupil–teacher ratio -0.06 -0.09 -0.10 -0.07 -0.09 5 1
Private school 0.14 0.14 0.20 3 3
Free school meals -0.15 0.10 -0.15 -0.09 4 3
School size 0.15 -0.09 -0.06 3 1
Mean socioeconomic status 0.16 0.06 2 1
Mean meals per week 0.08 0.10 2 1
Mean household tasks -0.06 1 0
Mean learning materials 0.08 0.07 2 0
Mean extra tuition in mathematics 0.08 1 0
NOTE: BOT is Botswana, KEN is Kenya, LES is Lesotho, MAL is Malawi, MAU is Mauritius, MOZ is Mozambique, NAM is Namibia, SEY is the Seychelles, SOU is South Africa, SWA is Swaziland, TAN is Tanzania, UGA is Uganda, ZAM is Zambia, ZAN is Zanzibar, and ZIM is Zimbabwe Standardized regression coefficients in bold text are ≥|0.10|; T1 and T2 are numbers of times the variable was identified as significant (p≤0.05) and important (standardized regression coefficient ≥|0.10|) across the 15 school systems respectively; - Indicates that the variable was not available for testing in the model for the mentioned country.

Hungi, N.
13
400
420
440
460
480
500
520
540
560
580
600
620
640
660
680
700
Bot
swan
a
Ken
ya
Leso
tho
Mal
awi
Mau
ritiu
s
Moz
ambi
que
Nam
ibia
Sey
chel
les
Sou
th A
fric
a
Sw
azila
nd
Tan
zani
a
Uga
nda
Zam
bia
Zan
ziba
r
Zim
babw
e
Pu
pil
rea
din
g s
co
re
400
420
440
460
480
500
520
540
560
580
600
620
640
660
680
700
Bot
swan
a
Ken
ya
Leso
tho
Mal
awi
Mau
ritiu
s
Moz
ambi
que
Nam
ibia
Sey
chel
les
Sou
th A
fric
a
Sw
azila
nd
Tan
zani
a
Uga
nda
Zam
bia
Zan
ziba
r
Zim
babw
e
Pu
pil
ma
the
ma
tic
s s
co
re
Figure 2: Differences in achievement between pupils one standard deviation above and below the
national mean SES score without controlling for any other factors
Thus, a large difference in reading scores between the rich and poor pupils was evident in
South Africa (138 points), Mauritius (118 points), and Zimbabwe (114 points). These three
countries also recorded the largest differences in mathematics scores (South Africa 95 points,
Mauritius 138 points, and Zimbabwe 86 points), which indicates low social equity in pupil
achievement at Grade 6 level in these school systems. Other countries that recorded large
social differences for both subjects were Botswana, Namibia, and the Seychelles. For
Botswana, these findings were somewhat surprising because social inequities were not
particularly obvious in the SACMEQ II data (see Hungi and Thuku, 2010a).
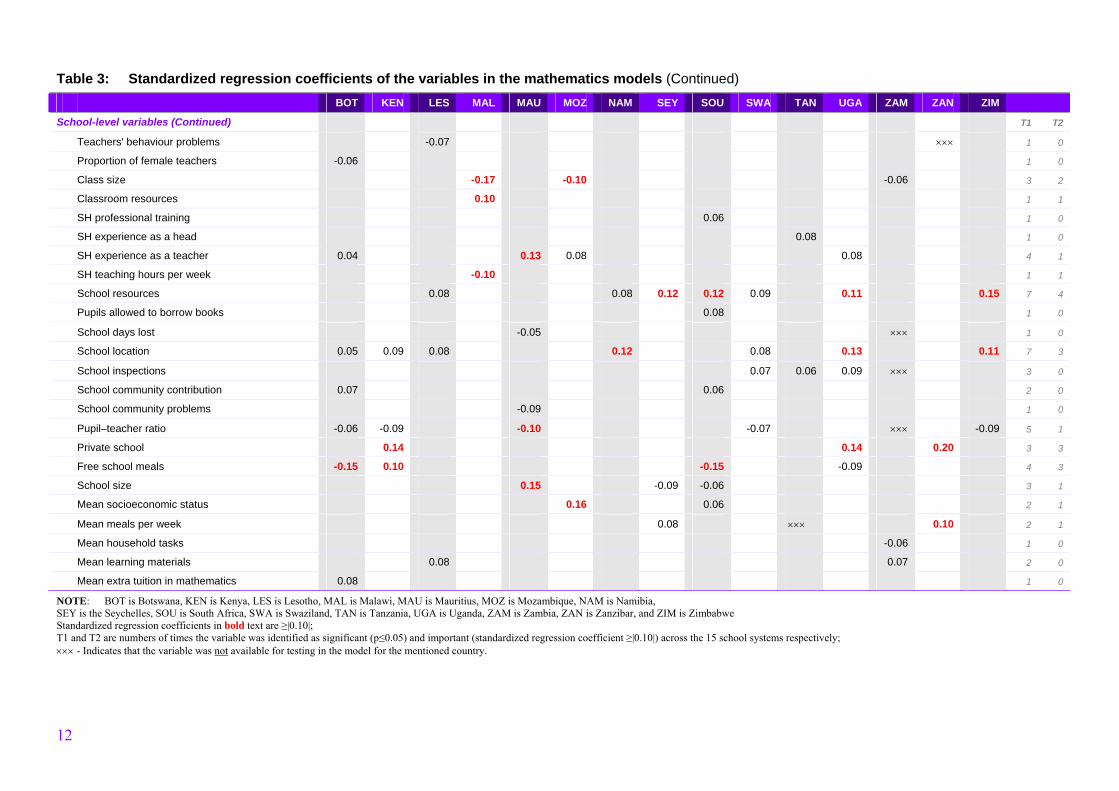
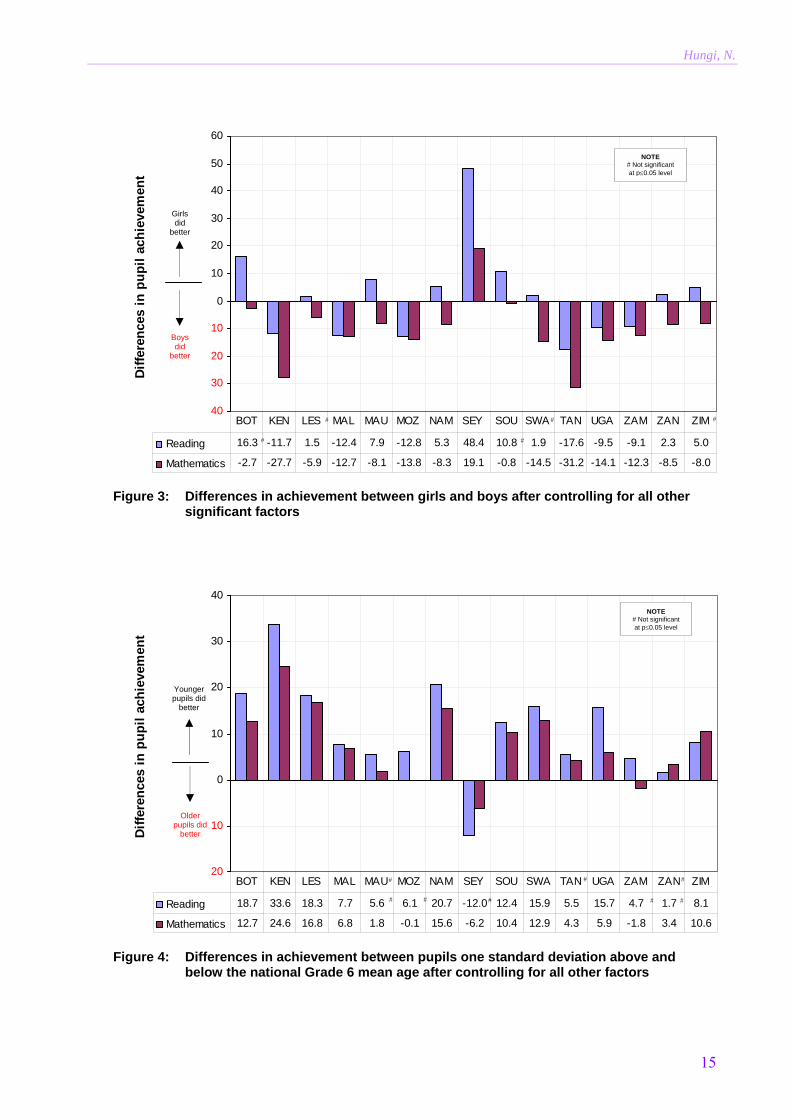
In the reading models, the variable Pupil sex was significant in 11 out of the 15 school
systems (the exceptions were Lesotho, Swaziland, Zanzibar, and Zimbabwe), and in the
mathematics models, this variable was significant in 13 school systems (the exceptions were
Botswana and South Africa). However, the direction of effect for Pupil sex varied across
these school systems and across subject, as shown in Figure 3. This figure was plotted using
the results from models in which all other significant factors were controlled.
For example, in six school systems (Kenya, Malawi, Mozambique, Tanzania, Uganda, and
Zambia) boys outperformed girls in both subjects, while in one school systems (the
Seychelles) girls outperformed boys in these two subjects. In Mauritius, Namibia, and
Zanzibar, girls did better than boys in reading while boys did better than girls in mathematics.
97
56
38
10
118
69
95
87
138 24
41
34
42
81
114 65
37
32
1#
138
43 69
66
95
16
27
19
33
45
86
NOTE # Not significant at p0.05 level

Accounting for Variations in the Quality of Primary School Education
14
The Seychelles recorded the largest gender difference in Figure 3 (i.e. a difference of 48 points
in reading, which is about half a standard deviation on the SACMEQ reading scale). This
indicates that pupil sex had the greatest impact on pupil reading score in this school system,
with girls greatly outperforming boys. Other countries that recorded relatively large gender
differences were Tanzania and Kenya, especially for mathematics achievement.
The large gender differences in pupil achievement in the Seychelles were also evident in the
SACMEQ II data. Leste et al. (2005) blamed within-school streaming (ability grouping) for
these large gaps between the academic performances of girls and boys in the Seychelles. They
reported that streaming in the Seychelles is based on teachers’ judgements, which are more
influenced by subjective and social criteria than by ability. They argued that in making these
judgements, teachers tend to place girls in the better-performing classes because they see girls
as more passive and less disruptive than boys.
In the vast majority of the 15 school systems, younger pupils were generally estimated to
achieve better than their older counterparts in both reading and mathematics (see Figure 4).
However, in the Seychelles older pupils were more advantaged than younger pupils,
especially in reading. It is perhaps worth noting that the Grade 6 pupils from the Seychelles
were on average much younger (around 11 years) than the pupils from most of the other
SACMEQ school systems (around 14 years), and this could explain why the variable Pupil
age had a different effect in the Seychelles.
Pupils who had never repeated grades were likely to achieve better than pupils who had
repeated grades in all the 15 schools system in reading, and in all but in two of the school
systems (Malawi and Swaziland) in mathematics. In addition, pupils who were rarely absent
from school were likely to perform better in both subjects than pupils who were frequently
absent from school, except in Swaziland (both subjects), South Africa (reading), and
Mozambique (mathematics), where this variable did not have significant effects. Pupils who
were given homework more frequently and had it corrected and explained most days were
estimated to achieve significantly better than pupils who were hardly given any homework, or
pupils who were given homework but rarely had it corrected or explained. Moreover, pupils
who spoke the language of instruction at home more often were estimated to achieve better
than pupils who rarely or never spoke the language of instruction at home in most of the 15
school systems. (English is the language of instruction in most SACMEQ school systems,
except for Tanzania and Zanzibar, where Kiswahili is used, and Mozambique, where
Portuguese is used. A few schools in South Africa use Afrikaans.)
Hungi, N.
15
40
30
20
10
0
10
20
30
40
50
60D
iffe
ren
ces
in p
up
il a
chie
vem
ent
Reading 16.3 -11.7 1.5 -12.4 7.9 -12.8 5.3 48.4 10.8 1.9 -17.6 -9.5 -9.1 2.3 5.0
Mathematics -2.7 -27.7 -5.9 -12.7 -8.1 -13.8 -8.3 19.1 -0.8 -14.5 -31.2 -14.1 -12.3 -8.5 -8.0
BOT KEN LES MAL MAU MOZ NAM SEY SOU SWA TAN UGA ZAM ZAN ZIM
Figure 3: Differences in achievement between girls and boys after controlling for all other significant factors
20
10
0
10
20
30
40
Dif
fere
nce
s in
pu
pil
ach
ieve
men
t
Reading 18.7 33.6 18.3 7.7 5.6 6.1 20.7 -12.0 12.4 15.9 5.5 15.7 4.7 1.7 8.1
Mathematics 12.7 24.6 16.8 6.8 1.8 -0.1 15.6 -6.2 10.4 12.9 4.3 5.9 -1.8 3.4 10.6
BOT KEN LES MAL MAU MOZ NAM SEY SOU SWA TAN UGA ZAM ZAN ZIM
Figure 4: Differences in achievement between pupils one standard deviation above and below the national Grade 6 mean age after controlling for all other factors
Boys did
better
Girls did
better
#
#
#
# #
NOTE # Not significant at p0.05 level
Younger pupils did
better
#
#
#
# #
NOTE # Not significant at p0.05 level
Older pupils did
better
# # #

Accounting for Variations in the Quality of Primary School Education
16
Some variables were only significant in a few school systems, but nonetheless their effects on
pupil achievement should interest authorities in most SACMEQ countries, especially the
malleable variables such as Household tasks, Preschool attendance, and Textbook ownership.
For Household tasks, pupils who undertook fewer household tasks were estimated to perform
better than pupils who undertook more such tasks at home in nine and four schools systems
for reading and mathematics, respectively. This could imply that parents need to be
encouraged to reduce the time spent on household tasks by pupils, because it is likely that it
interferes with the time pupils need for academic activities at home such as homework and
revision of school work.
For Preschool attendance, pupils who attended preschool for longer durations achieved better than
pupils who attended preschool for shorter durations or pupils who never attended preschool at
all, in seven and six school systems for reading and mathematics, respectively. This means
that education authorities plus other interested parties might need to invest more in early
childhood education programmes and encourage parents to take their children through these
programmes. For Textbook ownership, pupils who said they had sole use of textbooks during
classroom lessons achieved better than pupils who said they had to share textbooks (or had no
textbooks at all) in five school systems for reading and also in five school systems for
mathematics.
Further analyses were undertaken to investigate in detail the effects of (a) usage of textbooks
during classroom lessons, and (b) duration of preschool attendance, on pupil achievement.
Perhaps it is worth noting that there were four options for the variable Textbook ownership:
“No textbook”, “Share with two or more pupils” (this option was used as a dummy in these
analyses), “Share with one pupil”, and “Sole use”. For Preschool attendance, the options were
five: “Never attended”, “A few months”, “One year” (used as the dummy in these analyses),
“Two years”, and “Three years”.
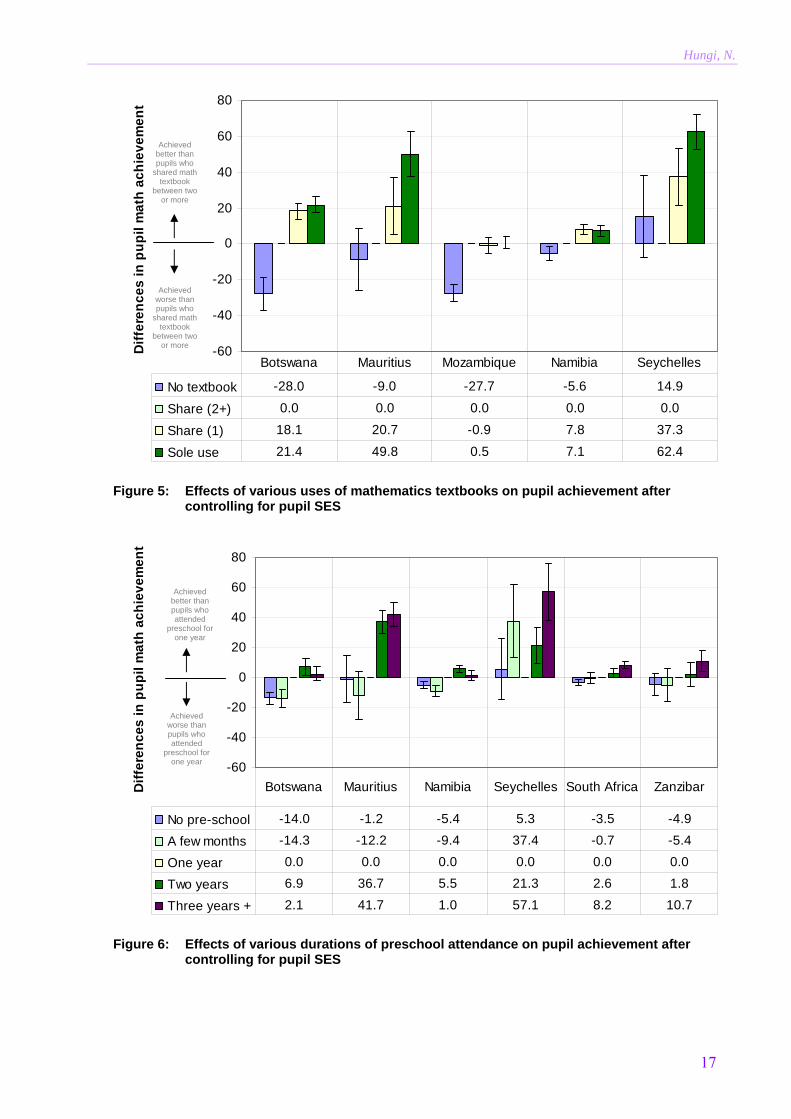
The effects of various usages of mathematics textbooks on pupil mathematics achievement
are depicted in Figure 5, while the effects of various durations of preschool attendance are
depicted in Figure 6 (the graphs for reading achievement followed similar patterns).
From Figure 5, it is clear that pupils generally achieved better if they had sole use of textbooks
during lessons (especially in Botswana, Mauritius, and the Seychelles). It is also clear that
sharing of textbooks between two pupils was better than situations where pupils had to share
books with many others, or had no textbook at all.
For Preschool attendance, it is clear from Figure 6 that pupils who had attended preschool for
two or three years generally achieved better than pupils who had attended preschool for
shorter durations of time, or who had never attended preschool before joining Grade 1.
A summary of the effects of the common pupil-level variables is given in Table 4.
Hungi, N.
17
-60
-40
-20
0
20
40
60
80
Dif
fere
nc
es
in
pu
pil
ma
th a
ch
iev
em
en
t
No textbook -28.0 -9.0 -27.7 -5.6 14.9
Share (2+) 0.0 0.0 0.0 0.0 0.0
Share (1) 18.1 20.7 -0.9 7.8 37.3
Sole use 21.4 49.8 0.5 7.1 62.4
Botswana Mauritius Mozambique Namibia Seychelles
Figure 5: Effects of various uses of mathematics textbooks on pupil achievement after controlling for pupil SES
-60
-40
-20
0
20
40
60
80
Dif
fere
nc
es
in
pu
pil
ma
th a
ch
iev
em
en
t
No pre-school -14.0 -1.2 -5.4 5.3 -3.5 -4.9
A few months -14.3 -12.2 -9.4 37.4 -0.7 -5.4
One year 0.0 0.0 0.0 0.0 0.0 0.0
Two years 6.9 36.7 5.5 21.3 2.6 1.8
Three years + 2.1 41.7 1.0 57.1 8.2 10.7
Botswana Mauritius Namibia Seychelles South Africa Zanzibar
Figure 6: Effects of various durations of preschool attendance on pupil achievement after controlling for pupil SES
Achieved worse than pupils who attended
preschool for one year
Achieved better than pupils who attended
preschool for one year
Achieved worse than pupils who
shared math textbook
between two or more
Achieved better than pupils who
shared math textbook
between two or more

Accounting for Variations in the Quality of Primary School Education
18
Table 4: Summary of the effects of the common pupil-level variables
Variable had significant effects in these models Variable
Reading Mathematics Grade repetition 15 school systems 13 school systems
(Effect: Pupils who had
repeated grades performed
poorly)
ALL ALL except two:
• Malawi
• Seychelles
Socioeconomic status 14 school systems 13 school systems
(Effect: Pupils from richer
homes achieved better)
ALL except one:
• Uganda
ALL except two:
• Malawi
• Uganda
Days absent 13 school systems 11 school systems ALL except two: ALL except four: (Effect: Pupils who were rarely
or never absent from school
did better)
• South Africa • Swaziland • Mozambique
• South Africa
• Swaziland
• Zanzibar
Homework 12 school systems 11 school systems ALL except three: ALL except four: (Effect: Pupils who were given
more homework and had it
homework corrected and
explained by the teachers did
better)
• Malawi
• Seychelles
• Swaziland • Malawi
• Namibia
• Seychelles
• Zambia
Pupil age 12 school systems 9 school systems ALL except three: ALL except six: (Effect: Younger pupils did
better except in the Seychelles
where older pupils did better
in reading)
• Mauritius
• Tanzania
• Zanzibar • Mauritius
• Mozambique
• Seychelles
• Tanzania
• Zambia
• Zanzibar
Pupil sex 11 school systems 13 school systems
(Effect: Varied across school
systems and across subject)
Interpretation:
(+) Girls did better
(‐) Boys did better
• Botswana (+)
• Kenya (-)
• Malawi (-)
• Mauritius (+)
• Mozambique (-)
• Namibia (+)
• Seychelles (+)
• South Africa (+)
• Tanzania (-)
• Uganda (-)
• Zambia (-)
• Kenya (-)
• Lesotho (-)
• Malawi (-)
• Mauritius (-)
• Mozambique (-)
• Namibia (-)
• Seychelles (+)
• Swaziland (-)
• Tanzania (-)
• Uganda (-)
• Zambia (-)
• Zanzibar (-)
• Zimbabwe (-)
Speaking the language of instruction
9 school systems 9 school systems
(Effect: Pupils who spoke the
language of instruction at
home performed better )
• Botswana
• Mauritius
• Mozambique
• Namibia
• Seychelles
• South Africa
• Swaziland
• Zambia
• Zimbabwe
• Botswana
• Malawi
• Mauritius
• Mozambique
• Namibia
• Seychelles
• South Africa
• Zambia
• Zimbabwe
Meals per week 9 school systems 5 school systems
(Effect: Pupils who ate more
meals per week did better)
• Botswana
• Lesotho
• Mauritius
• Mozambique
• Namibia
• South Africa
• Uganda
• Zambia
• Zimbabwe
• Botswana
• Malawi
• Mauritius
• Namibia
• Zimbabwe

Hungi, N.
19
Table 4: Summary of the effects of the common pupil-level variables (Continued)
Variable had significant effects in these models Variable
Reading Mathematics Household tasks 9 school systems 4 school systems
(Effect: Pupils who undertook
fewer household tasks did
better)
• Botswana
• Lesotho
• Mauritius
• Mozambique
• Namibia
• Seychelles
• South Africa
• Zambia
• Zanzibar
• Mauritius
• Namibia
• Seychelles
• Tanzania
Number of siblings 8 school systems 6 school systems
(Effect: Pupils who had fewer
brothers and sisters performed
better)
• Botswana
• Kenya
• Mauritius
• Mozambique
• Namibia
• Seychelles
• South Africa
• Swaziland
• Botswana
• Kenya
• Mauritius
• Seychelles
• South Africa
• Swaziland
Learning culture (Books at home)
8 school systems 6 school systems
(Effect: Pupils from homes
with many books did better)
• Botswana
• Kenya
• Lesotho
• Malawi
• Mauritius
• Seychelles
• South Africa
• Tanzania
• Malawi
• Mauritius
• Mozambique
• Seychelles
• South Africa
• Tanzania
Preschool attendance 7 school systems 6 school systems
(Effect: Pupil who attended
preschool did better)
• Botswana
• Lesotho
• Mauritius
• Seychelles
• South Africa
• Tanzania
• Zanzibar
• Botswana
• Mauritius
• Namibia
• Seychelles
• South Africa
• Zanzibar
Pupil learning materials 6 school systems 7 school systems
(Effect: Pupils with basic
learning items did better)
• Mauritius
• Namibia
• Seychelles
• South Africa
• Zambia
• Zanzibar
• Kenya
• Mauritius
• Seychelles
• South Africa
• Swaziland
• Uganda
• Zimbabwe
Living with parents or relatives
6 school systems 4 school systems
(Effect: Pupils who lived with
biological parents or relatives
performed better)
• Botswana
• Namibia
• Seychelles
• South Africa
• Zambia
• Zanzibar
• Malawi
• Seychelles
• Zanzibar
• Zimbabwe
Textbook ownership 5 school systems 5 school systems
(Effect: Pupils with sole use of
textbooks performed better)
• Botswana
• Mozambique
• South Africa
• Swaziland
• Uganda
• Botswana
• Mauritius
• Mozambique
• Namibia
• Seychelles
Extra tuition 4 school systems 6 school systems
(Effect: Varied across school
systems and across subject)
Interpretation:
(+) Extra tuition associated with
higher achievers
(‐) Extra tuition associated with
lower achievers
• Mauritius (+)
• Namibia (-)
• Seychelles (+)
• South Africa (-)
• Kenya (+)
• Mauritius (+)
• Seychelles (+)
• South Africa (-)
• Tanzania (+)
• Zanzibar (+)
Accounting for Variations in the Quality of Primary School Education
20
What were the common school-level factors contributing to the differences in pupils’ scores
across the 15 African school systems?
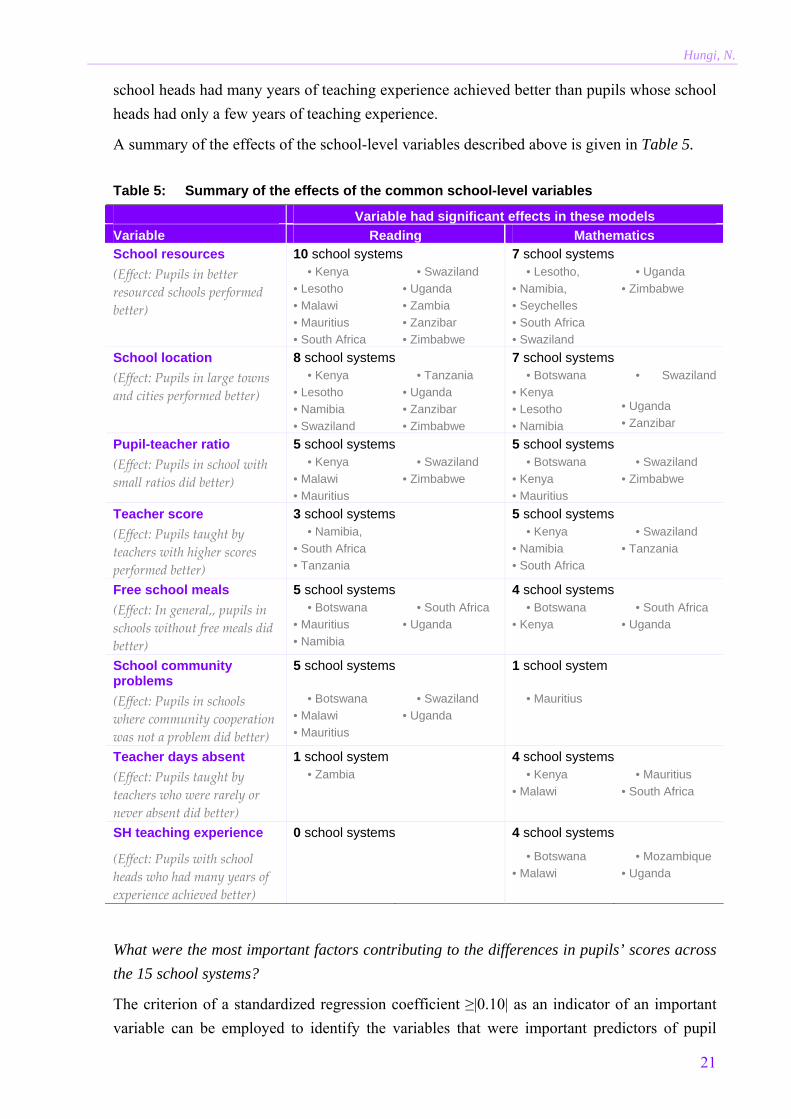
None of the school-level variables examined in this study had significant effects in all the 15
SACMEQ school systems. However, it can be seen from the results in Tables 2 and 3 that the
variable School resources had significant effects in ten and seven school systems for reading
and mathematics respectively, with pupils in schools that had many resources achieving better
than pupils in schools with only a few or no resources. The variable School location had
significant effects in eight school systems for reading and in seven school systems for
mathematics, with pupils in schools located in large towns or cities outperforming pupils in
schools located in rural and remote areas. In addition, the variable Pupil–teacher ratio had
significant effects in five school systems for both subjects, with pupils in schools with smaller
pupil–teacher ratios performing better than pupils in schools with larger pupil–teacher ratios.
The variable Teacher score had significant effects in five school systems for mathematics but
only in three school systems in reading. In the school systems where Teacher score was
significant, Grade 6 pupils taught by teachers who had higher subject-matter scores were
estimated to perform better than pupils taught by teachers with lower subject-matter scores. It
will be remembered that, in the SACMEQ III study, teachers were not tested in reading and
mathematics in Mauritius.
From the results in Tables 2 and 3, it can also be seen that the variable Free school
meals had significant effects in five school systems for reading and in four school systems for
mathematics. In most of these school systems, pupils in schools where one or more free meals
were provided per day were estimated to be of lower achievement levels than pupils in
schools where no free meals were provided. However, in Kenya free school meals were
associated with the better achievers in mathematics. Apart from the results for Kenya, the
results from the other school systems were not surprising, because in most SACMEQ
countries, free school meals are mostly provided in school serving communities that are
deemed to be disadvantaged economically. Such schools are normally located in remote areas
or in poor areas in towns and cities. It was not clear why this variable had a positive effect on
pupil achievement in Kenya.
Other school-level variables that had significant effects in several school systems were School
community problems (significant in five school systems for reading), and Teacher days absent
and School head experience as a teacher (both variables significant in the mathematics
models for four school systems). Pupils in schools in which lack of cooperation from the
community was perceived by the school head as a minor problem or no problem to the school
were estimated to perform better than pupils in schools where lack of community cooperation
was perceived as a major problem. Pupils who were taught by teachers who were never absent
(or were absent for only a few days) during the school year performed better than pupils
taught by teachers who were absent for many days. Furthermore, pupils in schools where the
Hungi, N.
21
school heads had many years of teaching experience achieved better than pupils whose school
heads had only a few years of teaching experience.
A summary of the effects of the school-level variables described above is given in Table 5.
Table 5: Summary of the effects of the common school-level variables
Variable had significant effects in these models
Variable Reading Mathematics School resources 10 school systems 7 school systems
(Effect: Pupils in better
resourced schools performed
better)
• Kenya
• Lesotho
• Malawi
• Mauritius
• South Africa
• Swaziland
• Uganda
• Zambia
• Zanzibar
• Zimbabwe
• Lesotho,
• Namibia,
• Seychelles
• South Africa
• Swaziland
• Uganda
• Zimbabwe
School location 8 school systems 7 school systems
(Effect: Pupils in large towns
and cities performed better)
• Kenya
• Lesotho
• Namibia
• Swaziland
• Tanzania
• Uganda
• Zanzibar
• Zimbabwe
• Botswana
• Kenya
• Lesotho
• Namibia
• Swaziland
• Uganda
• Zanzibar
Pupil-teacher ratio 5 school systems 5 school systems
(Effect: Pupils in school with
small ratios did better)
• Kenya
• Malawi
• Mauritius
• Swaziland
• Zimbabwe
• Botswana
• Kenya
• Mauritius
• Swaziland
• Zimbabwe
Teacher score 3 school systems 5 school systems
(Effect: Pupils taught by
teachers with higher scores
performed better)
• Namibia,
• South Africa
• Tanzania
• Kenya
• Namibia
• South Africa
• Swaziland
• Tanzania
Free school meals 5 school systems 4 school systems
(Effect: In general,, pupils in
schools without free meals did
better)
• Botswana
• Mauritius
• Namibia
• South Africa
• Uganda
• Botswana
• Kenya
• South Africa
• Uganda
School community problems
5 school systems 1 school system
(Effect: Pupils in schools
where community cooperation
was not a problem did better)
• Botswana
• Malawi
• Mauritius
• Swaziland
• Uganda
• Mauritius
Teacher days absent 1 school system 4 school systems
(Effect: Pupils taught by
teachers who were rarely or
never absent did better)
• Zambia • Kenya
• Malawi
• Mauritius
• South Africa
SH teaching experience 0 school systems 4 school systems
(Effect: Pupils with school
heads who had many years of
experience achieved better)
• Botswana
• Malawi
• Mozambique
• Uganda
What were the most important factors contributing to the differences in pupils’ scores across
the 15 school systems?
The criterion of a standardized regression coefficient ≥|0.10| as an indicator of an important
variable can be employed to identify the variables that were important predictors of pupil
Accounting for Variations in the Quality of Primary School Education
22
reading and mathematics scores in these school systems from the results given in Tables 2 and
3. For example, based on this criterion, the most important predictors of pupil reading score in
Botswana were Pupil SES (0.23), Free school meals (-0.20), Grade repetition (-0.17), and
Pupil age (-0.10), while the most important predictors of pupil mathematics score in this
country were again Pupil SES (0.18), Grade repetition (-0.15) and Free school meals (-0.15).
In Zimbabwe, the most important predictors of pupil reading scores were Grade repetition (-
0.10), Pupil SES (0.13), Teacher education level (0.10), School resources (0.19), and School
location (0.18), and the most important predictors of pupil mathematics score were Grade
repetition (-0.12), School resources (0.15), and School location (0.11).
From the results in Table 2 (in column T2), it can be seen that Pupil SES emerged as a vital
predictor of pupil reading achievement in 11 school systems, Grade repetition was an
important predictor in nine school systems, School location in seven school systems, and
Pupil age and School resources in six school systems each. Similarly, it can be seen from
Table 3 that Pupil SES emerged as an important predictor of pupil mathematics achievement
in eight school systems, Pupil sex and Grade repetition in six school systems each, and Pupil
age and School resources in four school systems each.
What were the variations in pupil scores across the 15 SACMEQ school systems?
Figures 7 and 8 were plotted using the results of variance available in the null models and
variance explained in the final models at the pupil level and school level given in Appendices 2
and 3.
From the width of the bars in Figures 7 and 8, it can be seen that the Seychelles, Mauritius,
and South Africa had the largest total (within-school + between-school) variances in pupil
reading scores, and also the largest variance in pupil mathematics scores. Malawi had the
smallest total variance in reading scores, while Swaziland (followed closely by Zanzibar and
Malawi) had the smallest total variance in mathematics scores. For both subjects the within-
school variance was largest in the Seychelles and Mauritius, while the between-school
variance was largest in South Africa.

Hungi, N.
23
140 120 100 80 60 40 20 0 20 40 60 80 100 120 140 160
Zimbabwe
Zambia
Uganda
Tanzania
Swaziland
South Africa
Seychelles
Namibia
Mozambique
Mauritius
Malawi
Lesotho
Kenya
Botswana
Between-School Variation Within-School Variation
(97; 47%)
(92; 33%)
(50; 26%)
(27; 18%)
(144; 48%)
(71; 47%)
(156; 37%)
(134; 57%)
(42; 21%)
(76; 20%)
(57; 33%)
(51; 34%)
(101; 48%)
NOTEThe numbers in parenthesis are the total variance available in the null model and the percentage of
this total variance that is explained in the final model,
respectively.
Zanzibar
(52; 33%)
(71; 29%)
Figure 7: Variation in reading achievement
140 120 100 80 60 40 20 0 20 40 60 80 100 120 140 160
Zimbabwe
Zambia
Uganda
Tanzania
Swaziland
South Africa
Seychelles
Namibia
Mozambique
Mauritius
Malawi
Lesotho
Kenya
Botswana
Between-School Variation Within-School Variation
(64; 37%)
(73; 25%)
(46; 14%)
(39; 23%)
(181; 42%)
(56; 30%)
(97; 37%)
(95; 43%)
(37; 9%)
(68; 17%)
(54; 18%)
(44; 13%)
(87; 41%)
NOTEThe numbers in parenthesis are the total variance available in the null model and the percentage of
this total variance that is explained in the final model,
respectively.
Zanzibar
(48; 25%)
(38; 21%)
Figure 8: Variation in mathematics achievement

Accounting for Variations in the Quality of Primary School Education
24
For the Seychelles, the large within-school variance is a consequence of streaming, which is
prevalent within primary schools in the Seychelles (Leste et al., 2005; Hungi and Thuku,
2010a). The same is probably the case for Mauritius, where streaming process starts after
Grade 4 in preparation for the highly competitive end of primary school examination
(Jahangeer and Jahangeer, 2004). On the other hand, the large between-school variances for
South Africa could be attributed to the apartheid history of South Africa, where some schools
were purposely well equipped and well staffed while the opposite was the case for other
schools (Hungi and Thuku, 2010a).
The amount of variance available between schools is an indicator of the degree of equity in a
school system, with large variance being associated with inequitable school systems (see
Ferrer et al., 2006: 549). Thus, South Africa had the most inequitable school system for both
subjects (most between-school variation in Figures 7 and 8), followed by Zimbabwe for
reading achievement, and by Mauritius for mathematics achievement. Nonetheless, it should
be noted that most of the between-school variance in South Africa was explained by pupil
background factors and school characteristics factors included in the final model for reading
(50 per cent) and mathematics (40 per cent). Swaziland, Malawi, and Lesotho were among the
countries that had school systems with high degrees of equity for both subjects.
For most school systems, it can be seen from Figures 7 and 8 that the models developed in
this study explained only small amounts of the within-school variance. This indicates that
there are other pupil-level factors that contributed to the variation in the achievement scores,
which were not included in these models. In this respect, there is a need for further
investigation to examine what other important factors were left out of this study for most of
the SACMEQ school systems (especially for the Seychelles and Mauritius, where large
amounts of within-school variance were left unexplained).
Were there substantial changes in the between-school variances over time?
The changes in between-school variations in pupil reading scores between 2000
(SACMEQ II) and 2007 (SACMEQ III) are depicted in Figure 9 (changes in between-school
variations in pupil mathematics scores followed a similar pattern). For Zimbabwe, the change
depicted in Figure 9 is between 1995 (SACMEQ I) and 2007 because Zimbabwe did not
participate in the SACMEQ II study.
South Africa and Uganda recorded the largest decrease in between-school variation in pupil
reading scores, while Zimbabwe and Botswana recorded the largest increase in this variation.
Namibia and Tanzania also recorded a considerable decline in between-school variation.
However, in most of the other school systems, this between-school variation remained
roughly the same.
These results should be pleasing to the education authorities in South Africa, Uganda,
Namibia, and Tanzania, because they imply that schools in these countries were becoming

Hungi, N.
25
more alike (equitable). On the other hand, the results should be troubling to the authorities in
Zimbabwe (and to some extent Botswana), because it means that schools in these countries
were becoming more dissimilar (inequitable).
It can be noted from Figure 9 that the change in between-school variation was strikingly
larger for Zimbabwe than the changes that were recorded for the other school systems. This
could be partly because the time period considered for Zimbabwe is 12 years (1995 to 2007)
while the time period considered for the other school systems is just seven years (2000 to
2010). It could also be partly because of the economic challenges undergone by Zimbabwe
during this time period.
-35 -30 -25 -20 -15 -10 -5 0 5 10 15 20 25 30 35
Zimbabwe
Zambia
Uganda
Tanzania
Swaziland
South Africa
Seychelles
Namibia
Mozambique
Mauritius
Malawi
Lesotho
Kenya
Botswana
Schools became more similar Schools became more different
Zanzibar
Figure 9: Changes in between-school variations in pupil reading scores between 2000 and 2007
Summary and conclusions
The major purpose of this study was to identify the key pupil- and school-related factors that
contribute to variation in reading and mathematics achievement among Grade 6 pupils in the
15 school systems that participated in the SACMEQ III study in 2007. In order to achieve this
purpose, a two-level model of pupil achievement was hypothesized and analysed using
multilevel procedures for each subject and for each of the 15 school systems.
At the pupil level, the results of the analyses showed that pupil socio-economic status
background, pupil sex, pupil age, grade repetition, absenteeism, homework, and speaking the
language of instruction at home were the common contributors to the variation in pupil
32.9
0.8
5.0
0.6
4.7
12.9
-1.6
-1.7
-3.3
-4.2
-7.8
-9.3
-9.5
-19.5
-20.9 NOTE
# Zimbabwe did not participate in the SACMEQ II study (2000) and
the change reported here is between the SACMEQ I study (1995) and SACMEQ III study
(2007).
Accounting for Variations in the Quality of Primary School Education
26
achievement in most of the 15 school systems for both subjects. These were the same
variables that were previously identified by Hungi and Thuku (2010a) in their analyses of
SACMEQ II data. Thus, in general, the individual-level factors influencing pupil achievement
in SACMEQ school systems have not changed much over the last seven years or so.
At the school level, the common contributors to the variation in pupil achievement were
identified as school resources, school location, pupil–teacher ratio, and teacher score (subject-
matter knowledge). School resources and teacher score were also identified as common
predictors of pupil achievement based on the SACMEQ II data (Hungi and Thuku, 2010a).
Importantly, based on the magnitudes of standardized regression coefficients of the variables
in the final models, results showed that the most important contributors to variation in pupil
reading and mathematics achievement across most of the 15 school systems were pupil socio-
economic background, grade repetition, pupil age, and school resources. In addition, it was
found that school location had a big impact on pupil reading scores in most of these school
systems, and that pupil sex was an important predictor of mathematics achievement among
Grade 6 pupils in these nations.
For both subjects, the results also showed that the school system with the largest between-
school variation was South Africa, while the school systems with the largest within-school
variation were the Seychelles and Mauritius. Large gender inequity in pupil achievement was
evident in the Seychelles. Moreover, low social equity in pupil achievement in reading and
mathematics was evident in South Africa, Mauritius, and Zimbabwe.
What were the policy implications of the key factors influencing pupil achievement?
The ministries of education in SACMEQ countries could consider taking actions for those
variables that have been identified in this paper as important predictors of school achievement
among pupils in their countries. In general, grade repetition, socio-economic status, pupil age,
pupil sex, school location, and school resources were found to be important predictors of
pupil achievement across most SACMEQ school systems.
For grade repetition, pupils who had never repeated grades achieved better scores than pupils
who had repeated grades. On average, almost two out of every five pupils (37 per cent) in the
SACMEQ III study reported that they had repeated a class at least once since starting
schooling. In some countries such as Malawi and Mozambique the percentages of grade
repeaters were much higher than this, and close to 60 per cent (see Hungi, 2010).
High levels of grade repetition have been blamed for increasing the overall cost of schooling
because if many pupils repeat each year, school systems need to employ more teachers and
build more classrooms. In most cases, pupils are made to repeat because it is believed that this
will improve their academic performance. However, educational research has shown that
grade repetition does not addresses the problems of low achievers satisfactorily, and that

Hungi, N.
27
potential solutions lie in early intervention, collaboration with parents, and supplementary
instruction (Brophy, 2006).
As expected, pupils from richer homes and with better-educated parents outperformed pupils
from poorer homes and with less-educated parents. Hungi and Thuku (2010a) proposed that,
in order to minimize the effects of socio-economic background on pupil achievement in the
long term, the education authorities in SACMEQ school systems may wish to consider
introducing special home intervention projects. These projects would involve training teachers
on how to change parental behaviour in the home so that the children receive more
encouragement and support for studying. Such home intervention projects have been
implemented successfully in Malaysia (see Norisah et al., 1982), and were credited with
raising the achievement levels of children from disadvantaged families. Such projects could
reduce the large social inequity in pupil achievement found in some SACMEQ school systems,
especially in Mauritius and the Seychelles, as well as reduce the problems of pupil
absenteeism and grade repetition in the long term.
For Pupil age, being older in Grade 6 was a clear disadvantage for both reading and
mathematics in most SACMEQ school systems, except in the Seychelles. As suggested by
Hungi and Thuku (2010b), it is likely that older pupils feel out of place and thus less
motivated to participate in school work than their younger counterparts. On average, Grade 6
pupils in most SACMEQ school systems were well above the expected age. For example, the
expected age for Grade 6 pupils in Kenya, Lesotho, Malawi, and Mozambique is around 12
years, but the observed average pupil age from the SACMEQ III data for Grade 6 pupils in
these countries was around 14 years. Furthermore, on average, about half (55 per cent) of the
pupils in the SACMEQ III data were estimated to be over-age (at least one year older than
expected), while about three-quarters of Grade 6 pupils in seven school systems (Kenya,
Malawi, Mozambique, Namibia, Tanzania, Uganda, and Zanzibar) were estimated to be over-
age. Incidences of over-age pupils could partly be blamed on the high levels of grade
repetition discussed above. These over-age incidences could also be partly blamed on starting
school late. This means that parents and education authorities in SACMEQ nations should
ensure that pupils start schooling at the official age of entry and also minimize grade
repetition.
For pupil sex, the direction of effect (especially for reading) varied from country to country.
However, for mathematics, boys outperformed girls in almost all countries, except in the
Seychelles where girls greatly outperformed boys. Ability grouping was blamed for the poor
performance of boys in the Seychelles (Leste et al., 2005). For the other SACMEQ school
systems, the authorities concerned should consider commissioning studies to examine the
reasons for the poor performance of girls (especially in mathematics) and to identify ways of
correcting this problem. Hungi and Thuku (2010b), analysing data from the SACMEQ II
study for Kenya, suggested that gender differences in mathematics achievement in Kenya
could be linked to how mathematics is taught in Kenyan primary schools, the teaching

Accounting for Variations in the Quality of Primary School Education
28
materials used in mathematics classes, or the Kenyan culture, which is mostly male dominated
and perceives girls as not being very able in mathematics and sciences (see also studies by
Lloyd et al., 1998 and 2000, which investigate effects of primary school quality on pupil
achievement and school internal efficiency among Kenyan pupils). Perhaps these perceptions
about girls’ abilities in mathematics, and teaching approaches (or teaching materials) that
disadvantage or discourage girls in mathematics, are common in most SACMEQ nations.
School location and School resources were the other factors that were found to be important
in a vast majority of the SACMEQ school systems. Pupils in schools located in urban areas
performed better than pupils in schools located in rural areas, while pupils in schools with
more resources did better than pupils in schools with fewer resources. Thus, the education
authorities in SACMEQ nations should endeavor to provide more resources to all schools,
especially those located in isolated areas and villages.
What are the policy implications of the within-school and between-school variations?
Large within-school variation in pupil achievement indicates huge inequity between pupils in
the same school. Hungi and Thuku (2010a), using the SACMEQ II data (collected in 2000),
found that the within-school variations in pupil achievement in the Seychelles and Mauritius
were much larger than these variations in other SACMEQ school systems. In the current study,
the within-school variations were also found to be largest in the Seychelles and Mauritius,
showing that this inequity still persists in these two countries. Hungi and his colleague
suggested that this inequity could be linked to the streaming practiced in these two school
systems. They argued that this kind of inequity should be discouraged by the governments by
introducing policies against streaming and for the promotion of mixed-ability teaching in
primary schools.
Between-school variations were found to be largest in South Africa and Zimbabwe (especially
in reading), and this indicates considerable inequity between the qualities of education offered
in primary schools in these two school systems. Thus, the ministries of education in South
Africa and Zimbabwe need to take actions to facilitate the improvement of low-performing
schools with an aim of minimizing the variance between primary schools in their countries.
Nevertheless, the authorities in South Africa should be pleased because their country recorded
the largest decrease in between-school variation between 2000 and 2007, which indicates that
schools in South Africa were becoming more alike. Uganda and Namibia were the other
countries that recorded impressive reductions in the between-school variations, meaning that
whatever actions the authorities in those countries were carrying out in their efforts to
minimize between-school variation were paying dividends. This is encouraging.
On the other hand, Zimbabwe recorded the largest increase in between-school variation, but
this could be partly because the change in between-school variation in Zimbabwe was over a
12-year period (1995 to 2007) while in other countries this change was over a seven-year

Hungi, N.
29
period (2000 to 2007). Nonetheless, this means that schools in Zimbabwe were becoming
more dissimilar (inequitable), and therefore the authorities in Zimbabwe may wish to consider
taking action to arrest this trend.
References
Brickell, J.L. 1974. “Nominated samples from public schools and statistical bias.” In:
American Educational Research Journal, 11(4), 333-341.
Brophy, J. 2006. “Grade repetition.” Education policy series 6. Paris: International Institute
for Educational Planning.
Bryk, A.S.; Raudenbush, S.W. 1992. Hierarchical linear models: Applications and data
analysis methods. Newbury Park, CA: Sage Publications.
Carroll, J.B. 1963. “A model of school learning.” In: Teachers College Record, 64, 723-733.
Creemers, B.P.M. 1994. The effective classroom. London: Redwood Books.
Dolata, S. 2005. Construction and validation of pupil socioeconomic status index for
SACMEQ Education System. A paper presented at the SACMEQ Conference (Paris,
September 2005).
Ferrer, F.; Ferrer, G.; Baldellou, J.L.C. 2006. “Equity and segregation in the Spanish
education system.” Prospects 36(4): 547–571.
Hox, J.J. 1995. Applied multilevel analysis. Amsterdam: TT-Publikaties.
Hungi, N. 2010. What are the levels and trends in grade repetition? SACMEQ Policy Issues
Series, Number 3. Retrieved on 14 March 2011 from:
www.sacmeq.org/downloads/policy/005-SACMEQPolicyIssuesSeries-
GradeRepetition.pdf
Hungi, N.; Thuku, F.W. 2010a. “Variation in reading achievement across 14 southern African
school systems: which factors matter?” International Review of Education, 56(1).
Hungi, N.; Thuku, F.W. 2010b. “Differences in pupil achievement in Kenya: implications for
policy and practice.” International Journal of Educational Development, 30: 33-44.
Retrieved 14 February 2011 from: http://dx.doi.org/10.1016/j.ijedudev.2009.05.001.
Jahangeer, S.A.; Jahangeer, A.C. 2004. “School culture in a private secondary institution in
Mauritius.” International Education Journal, 5(2): 247–254.
Keeves, J.P. (1997). “Suppressor variables.” In J.P. Keeves (Ed.), Educational research,
methodology, and measurement: an international handbook (pp. 695-696). Oxford:
Pergamon Press.
Leste, A.; Valentin, J.; Hoareau, F. 2005. The SACMEQ II Project in Seychelles: A study of
the conditions of schooling and the quality of education. Harare: SACMEQ.
Accounting for Variations in the Quality of Primary School Education
30
Lloyd, C.B.; Mensch, B.S.; Clark, W.H. 1998. “The effects of primary school quality on the
educational participation and attainment of Kenyan girls and boys.” Policy Research
Division Working Papers no. 116. New York: Population Council.
Lloyd, C.B.; Mensch, B.S.; Clark, W.H. 2000. “The effects of primary school quality on
school dropout among of Kenyan girls and boys.” Comparative Education Review, 44
(2), 113–147.
Raudenbush, S.W. ; Bryk, A.S ; Cheong, Y.F. ; Congdon, R.T. 2005. HLM 6. Lincolnwood,
IL: Scientific Software International.
Saito, M. 2005. “The construction of a ‘SACMEQ school resources index’ using Rasch
scaling.” Paper presented at the SACMEQ Conference, Paris, September 2005.
Sylla, K.; Saito, M.; Ross, K. 2003. SAMDEM: Sample Design Manager. Paris. International
Institute for Educational Planning.

APPENDICES

Accounting for Variations in the Quality of Primary School Education
32
Appendix 1: Variables tested in the two-level models for reading and mathematics
LEVEL 1 (PUPIL) VARIABLES
Pupil individual characteristics
Pupil age
Pupil sex
(0=boy; 1=girl)
Grade repetition
(0=never; 1=repeated once; 2=repeated twice; 3=repeated three times or more)
Days absent
Speaking language of instruction
(0=never, 1=sometimes; 2=most of the time; 3=all the time)
Personalized learning support
Preschool attendance
(0=never; 0.5=a few months; 1=one year; 2=two years; 3=three years or more)
Pupil learning materials Sum of possession of at least one of each of eight important learning materials: an exercise book, a notebook, a pencil, a sharpener, an eraser, a ruler, a pen, and a file.
(0= no learning materials; 1=at least one; . . . 8=at least one of each item)
Homework factor (0=no homework given; 1=homework given some days but never corrected nor explained; . . . 9=homework given most days, and always corrected and explained)
Homework help at home Two version of this variable were considered:
Version 1: (0=no homework/never; 1=sometimes; 2=most of the time). Version 2: (0=no homework/never; 1=sometimes/most of the time).
Extra tuition
(0=no extra tuition in this subject; 1=extra tuition in this subject)
Working place factor (0=has no sitting nor writing place; 1=has either sitting or writing place; 2=has both sitting and writing places)
Textbook ownership
(0=no textbook; 1=share with 2 or more pupils; 2=share with one pupil; 3=sole use)
Travel distance to school
Home environment
Socio-economic status factor Rasch score involving items on home possessions, parental education, home quality, source of lighting at home, etc. (see Dolata, 2005)
Number of siblings
Number of brothers and sisters (plus step- and half- brothers and sisters) living with pupil at home.
Meals per week
Total number of meals (breakfast, lunch, and supper) taken by pupil a week.
Household tasks factor Sum of the involvement of pupil in various household activities such as laundry, fetching water, collecting firewood, livestock duties.
Learning culture at home
Number of books at home
Parents alive
(0=no parent alive; 1=one parent alive; 2=both parents alive)
Living with parents/relatives
(0=living with non-relatives; 1=living with parents or relatives)
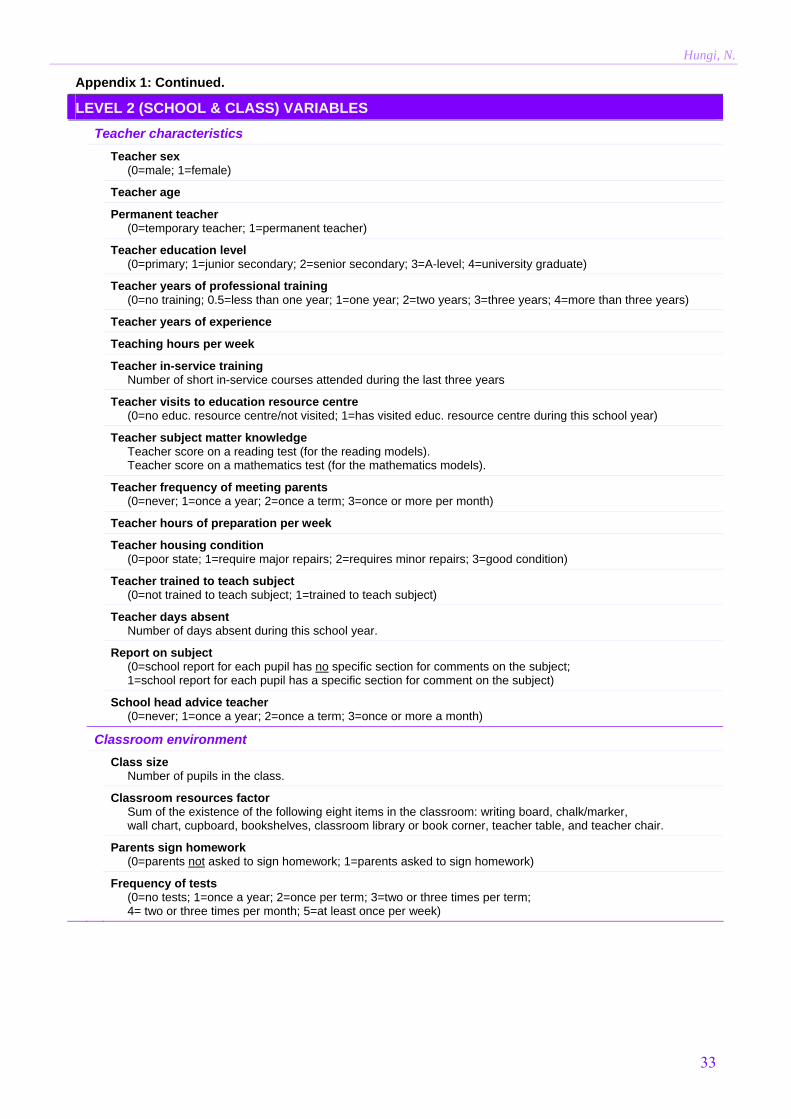
Hungi, N.
33
Appendix 1: Continued.
LEVEL 2 (SCHOOL & CLASS) VARIABLES
Teacher characteristics
Teacher sex
(0=male; 1=female)
Teacher age
Permanent teacher
(0=temporary teacher; 1=permanent teacher)
Teacher education level
(0=primary; 1=junior secondary; 2=senior secondary; 3=A-level; 4=university graduate)
Teacher years of professional training
(0=no training; 0.5=less than one year; 1=one year; 2=two years; 3=three years; 4=more than three years)
Teacher years of experience
Teaching hours per week
Teacher in-service training
Number of short in-service courses attended during the last three years
Teacher visits to education resource centre
(0=no educ. resource centre/not visited; 1=has visited educ. resource centre during this school year)
Teacher subject matter knowledge Teacher score on a reading test (for the reading models). Teacher score on a mathematics test (for the mathematics models).
Teacher frequency of meeting parents
(0=never; 1=once a year; 2=once a term; 3=once or more per month)
Teacher hours of preparation per week
Teacher housing condition
(0=poor state; 1=require major repairs; 2=requires minor repairs; 3=good condition)
Teacher trained to teach subject
(0=not trained to teach subject; 1=trained to teach subject)
Teacher days absent
Number of days absent during this school year.
Report on subject (0=school report for each pupil has no specific section for comments on the subject; 1=school report for each pupil has a specific section for comment on the subject)
School head advice teacher
(0=never; 1=once a year; 2=once a term; 3=once or more a month)
Classroom environment
Class size
Number of pupils in the class.
Classroom resources factor Sum of the existence of the following eight items in the classroom: writing board, chalk/marker, wall chart, cupboard, bookshelves, classroom library or book corner, teacher table, and teacher chair.
Parents sign homework
(0=parents not asked to sign homework; 1=parents asked to sign homework)
Frequency of tests (0=no tests; 1=once a year; 2=once per term; 3=two or three times per term; 4= two or three times per month; 5=at least once per week)

Accounting for Variations in the Quality of Primary School Education
34
Appendix 1: Continued
LEVEL 2 VARIABLES (Continued)
School head characteristics
School head sex
(0=male; 1=female)
School head age
School head years of professional training
(0=no training; 0.5=less than one year; 1=one year; 2=two years; 3=three years; 4=more than three years)
School head education level
(0=primary; 1=junior secondary; 2=senior secondary; 3=A-level; 4=university graduate)
School head years of experience as a head
School head years of teaching experience
School head management course
(0=no training on school management; 1=has received training on school management)
School head teaching hours per week
School environment
Condition of school buildings
(0=poor state; 1=require major repairs; 2=require minor repairs; 3=good condition)
School resources factor Two versions of this variable were considered:
Version 1: Sum of the existence of 22 school resource items in the school including a school library, school meeting hall, staff room, separate office for school head, sports area, water, electricity, telephone, fax machine, overhead projector, radio, TV set, photocopier, and computer.
Version 2: Rasch score involving school resources items (e.g. school library, staff room, water, electricity, and computer) as well as classroom resource items such as teacher table, teacher chair, sitting places, cupboard, and bookshelves (see Saito, 2005).
Borrowing books from school
(0=no library/not allowed to borrow books; 1=pupils allowed to borrow books)
Proportion of female teachers
School days lost Number of school days lost in the last school year because of factors beyond school head control such as natural calamities, strikes, and social unrest.
School location
(0=isolated; 1=rural; 2=small town; large town or city)
School inspections Two version of this variable were considered:
version 1: The number of times the school has been visited by a school inspector or quality assurance office during the last two school years.
version 2: The number of years since the school had a full inspection.
School community contribution factor Sum of the presence of community contributions towards nine school activities including construction and maintenance of school buildings, construction and repair of school furniture, provision of school meals, buying of textbooks, stationery and supplies, payment of teacher salaries, and extra-curriculum activities.
School community problems The extent to which lack of cooperation from community is a problem to the school.
(0=no problem; 1=minor problem; 2=major problem).

Hungi, N.
35
Appendix 1: Continued
LEVEL 2 VARIABLES (Continued)
Pupils’ behaviour problems factor Sum of existence of behavioural problems among pupils (e.g. lateness, skipping classes, classroom disturbance, cheating, use of abusive language, theft, fighting, and vandalism)
Teachers’ behaviour problems factor Sum of existence of behavioural problems among teachers (e.g. lateness, absenteeism, skipping classes, use of abusive language, drug abuse, and alcohol abuse)
Pupil–teacher ratio
Pupil–toilet ratio
Private school
(0=government school; 1=private school)
Free school meals
(0=no free school meals; 1=one free school meal a day; 2=two or more free school meals a day)
School size
Total number of pupils in the schools’ biggest shift.
School environment (aggregated variables)
Mean pupil age
Proportion of girls
Mean grade repetition
Mean days absent
Mean speaking language of instruction
Mean preschool attendance
Mean learning materials
Mean homework (given, corrected, and explained)
Mean homework help
Mean extra tuition
Mean working place
Mean textbook ownership
Mean travel distance to school
Mean socio-economic status
Mean number of siblings
Mean meals per week
Mean household tasks
Mean learning culture
Mean parents alive
Mean living with parents/relatives
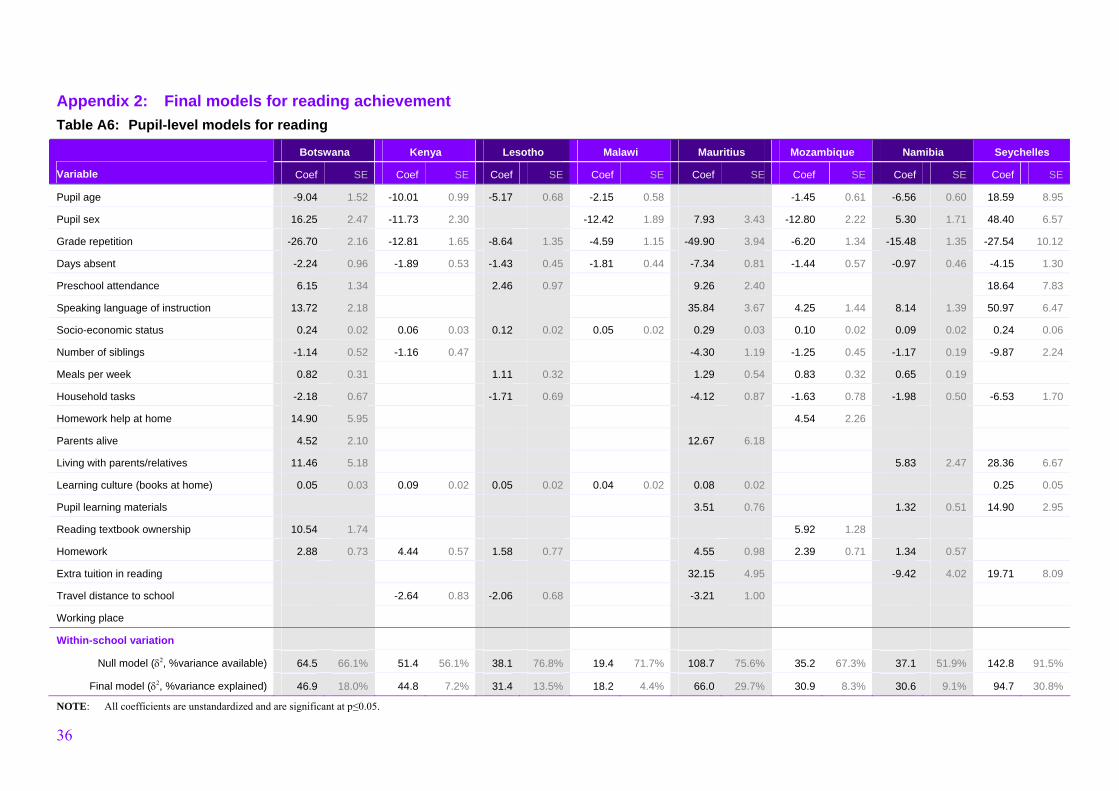
36
Appendix 2: Final models for reading achievement
Table A6: Pupil-level models for reading
Botswana Kenya Lesotho Malawi Mauritius Mozambique Namibia Seychelles
Variable Coef SE Coef SE Coef SE Coef SE Coef SE Coef SE Coef SE Coef SE
Pupil age -9.04 1.52 -10.01 0.99 -5.17 0.68 -2.15 0.58 -1.45 0.61 -6.56 0.60 18.59 8.95
Pupil sex 16.25 2.47 -11.73 2.30 -12.42 1.89 7.93 3.43 -12.80 2.22 5.30 1.71 48.40 6.57
Grade repetition -26.70 2.16 -12.81 1.65 -8.64 1.35 -4.59 1.15 -49.90 3.94 -6.20 1.34 -15.48 1.35 -27.54 10.12
Days absent -2.24 0.96 -1.89 0.53 -1.43 0.45 -1.81 0.44 -7.34 0.81 -1.44 0.57 -0.97 0.46 -4.15 1.30
Preschool attendance 6.15 1.34 2.46 0.97 9.26 2.40 18.64 7.83
Speaking language of instruction 13.72 2.18 35.84 3.67 4.25 1.44 8.14 1.39 50.97 6.47
Socio-economic status 0.24 0.02 0.06 0.03 0.12 0.02 0.05 0.02 0.29 0.03 0.10 0.02 0.09 0.02 0.24 0.06
Number of siblings -1.14 0.52 -1.16 0.47 -4.30 1.19 -1.25 0.45 -1.17 0.19 -9.87 2.24
Meals per week 0.82 0.31 1.11 0.32 1.29 0.54 0.83 0.32 0.65 0.19
Household tasks -2.18 0.67 -1.71 0.69 -4.12 0.87 -1.63 0.78 -1.98 0.50 -6.53 1.70
Homework help at home 14.90 5.95 4.54 2.26
Parents alive 4.52 2.10 12.67 6.18
Living with parents/relatives 11.46 5.18 5.83 2.47 28.36 6.67
Learning culture (books at home) 0.05 0.03 0.09 0.02 0.05 0.02 0.04 0.02 0.08 0.02 0.25 0.05
Pupil learning materials 3.51 0.76 1.32 0.51 14.90 2.95
Reading textbook ownership 10.54 1.74 5.92 1.28
Homework 2.88 0.73 4.44 0.57 1.58 0.77 4.55 0.98 2.39 0.71 1.34 0.57
Extra tuition in reading 32.15 4.95 -9.42 4.02 19.71 8.09
Travel distance to school -2.64 0.83 -2.06 0.68 -3.21 1.00
Working place
Within-school variation
Null model (2, %variance available) 64.5 66.1% 51.4 56.1% 38.1 76.8% 19.4 71.7% 108.7 75.6% 35.2 67.3% 37.1 51.9% 142.8 91.5%
Final model (2, %variance explained) 46.9 18.0% 44.8 7.2% 31.4 13.5% 18.2 4.4% 66.0 29.7% 30.9 8.3% 30.6 9.1% 94.7 30.8%
NOTE: All coefficients are unstandardized and are significant at p≤0.05.

37
Table A6: Pupil-level models for reading (Continued)
South Africa Swaziland Tanzania Uganda Zambia Zanzibar Zimbabwe
Variable Coef SE Coef SE Coef SE Coef SE Coef SE Coef SE Coef SE
Pupil age -5.12 0.76 -4.50 0.63 -4.91 0.71 -1.31 0.62 -4.18 1.97
Pupil sex 10.81 1.70 -17.64 3.05 -9.51 1.77 -9.07 3.01
Grade repetition -15.00 1.25 -9.53 1.28 -23.96 2.66 -4.74 1.13 -8.86 1.56 -26.14 4.43 -14.25 2.54
Days absent -3.29 0.42 -1.02 0.33 -1.34 0.43 -3.00 0.52 -1.69 0.57
Preschool attendance 2.84 0.83 5.13 2.18 3.99 1.77
Speaking language of instruction 14.69 1.66 3.86 1.61 10.75 2.31 8.49 2.33
Socio-economic status 0.20 0.02 0.08 0.01 0.18 0.03 0.12 0.03 0.19 0.04 0.16 0.04
Number of siblings -0.90 0.30 -1.15 0.28
Meals per week 0.63 0.20 0.56 0.21 0.55 0.27 1.26 0.33
Household tasks -1.54 0.46 -1.81 0.79 -2.72 1.07
Homework help at home 7.13 3.36
Parents alive
Living with parents/relatives 8.64 3.23 6.66 3.23 46.45 11.01
Learning culture (books at home) 0.08 0.01 0.80 0.25
Pupil learning materials 1.53 0.54 1.66 0.72 3.53 1.16
Reading textbook ownership 2.81 1.11 20.12 7.34 3.31 1.11
Homework (given, corrected, and explained) 2.02 0.48 1.74 0.62 3.22 0.51 1.82 0.80 4.47 0.88 3.87 0.92
Extra tuition in reading -12.98 5.10
Travel distance to school -2.18 1.03
Working place 18.17 7.66 26.45 8.99 16.97 3.87
Within-school variation
Null model (2, %variance available) 51.5 38.5% 29.0 69.9% 58.0 76.3% 29.3 51.0% 36.0 70.9% 58.1 81.3% 49.8 49.0%
Final model (2, %variance explained) 42.9 6.5% 26.1 7.1% 52.6 7.1% 25.9 6.0% 31.7 8.5% 48.3 13.8% 42.5 7.2%
NOTE: All coefficients are unstandardized and are significant at p≤0.05. - There were some technical issues with Meals per week for Tanzania

38
Table A7: School-level models for reading
Botswana Kenya Lesotho Malawi Mauritius Mozambique Namibia Seychelles
Variable Coef SE Coef SE Coef SE Coef SE Coef SE Coef SE Coef SE Coef SE
Grade mean 502.94 7.40 548.99 3.65 463.96 2.07 439.21 2.26 538.60 5.09 479.47 2.32 489.81 3.16 526.10 8.52
Teacher age -0.49 0.18 -0.55 0.23
Permanent teacher 32.26 6.71
Teacher yrs of prof. training 8.40 3.19
Teacher in-service training 3.12 1.42 0.66 0.25
Teacher subject matter knowledge 0.06 0.02
Teacher freq. of meeting parents 8.57 3.38
Frequency of reading tests -5.27 2.20
Proportion of female teachers 0.44 0.17 0.26 0.10
Class size -0.30 0.08
SH sex 18.92 8.56
SH age -2.10 0.63
SH experience as a head 1.34 0.44
SH management course 15.76 6.95
School resources 3.57 1.65 2.08 0.90 2.66 1.12 0.12 0.05
School location 13.99 5.55 8.23 3.08 21.41 3.18
School inspections 2.70 0.94
School community contribution 3.94 1.37
School community problems -6.53 3.25 -9.02 3.01 -14.35 3.84
Pupil–teacher ratio -0.54 0.27 -0.12 0.05 -1.38 0.65
Free school meals -64.38 7.33 -17.00 6.44 -14.08 4.34
School size 0.04 0.01 -0.05 0.01
Pupils’ behaviour problems 0.67 0.30
Mean days absent -23.94 6.81
Mean preschool attendance 58.17 18.58
Mean sp. language of instruction 51.45 19.46
Mean socioeconomic status 0.41 0.08
Mean meals per week 13.85 5.23
Mean reading textbook ownership 3.72 1.85
Mean homework 1.93 0.87
Mean extra tuition in reading 74.82 27.23
Mean working place 15.54 4.34
Between-school variation
Null model (, %var. available) 33.0 33.9% 40.2 43.9% 11.5 23.2% 7.7 28.3% 35.0 24.4% 17.1 32.7% 34.4 48.1% 13.2 8.5%
Final model (, %var. explained) 4.9 28.8% 16.3 26.1% 5.2 12.7% 4.0 13.7% 8.3 18.6% 4.4 24.3% 7.2 38.1% 3.4 6.3%
NOTE: All coefficients are unstandardized and are significant at p≤0.05. - Teachers were not tested in Mauritius
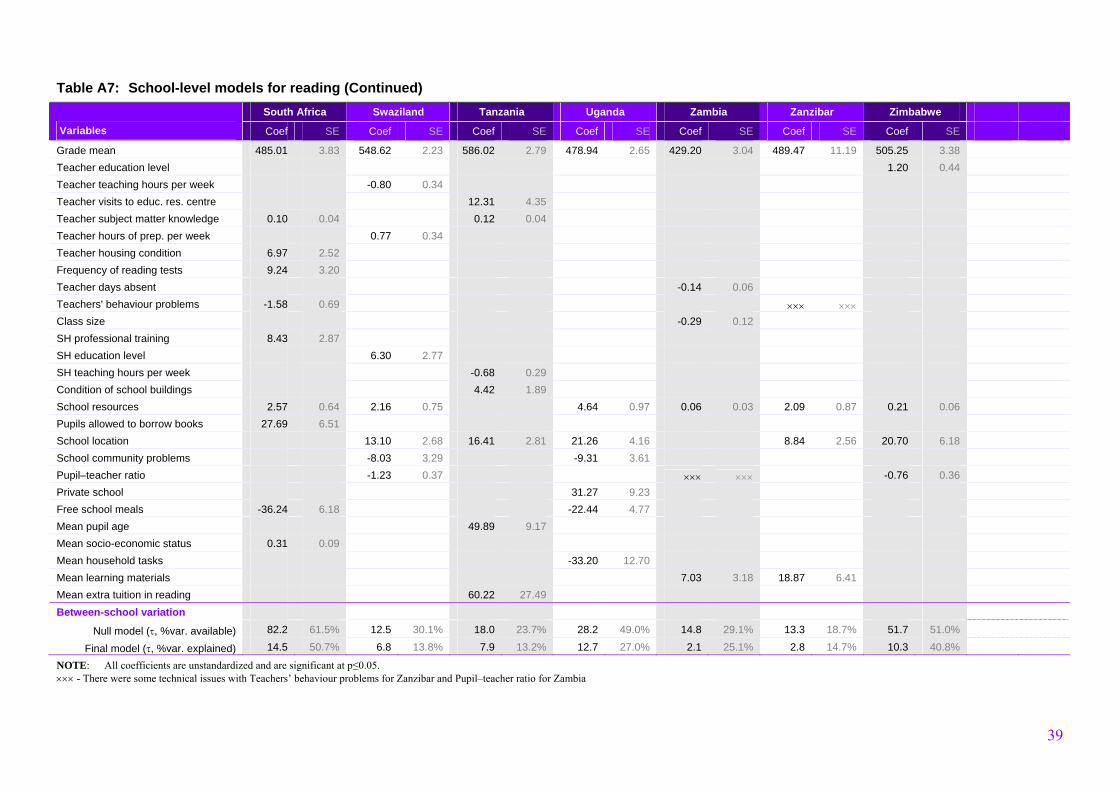
39
Table A7: School-level models for reading (Continued)
South Africa Swaziland Tanzania Uganda Zambia Zanzibar Zimbabwe
Variables Coef SE Coef SE Coef SE Coef SE Coef SE Coef SE Coef SE
Grade mean 485.01 3.83 548.62 2.23 586.02 2.79 478.94 2.65 429.20 3.04 489.47 11.19 505.25 3.38
Teacher education level 1.20 0.44
Teacher teaching hours per week -0.80 0.34
Teacher visits to educ. res. centre 12.31 4.35
Teacher subject matter knowledge 0.10 0.04 0.12 0.04
Teacher hours of prep. per week 0.77 0.34
Teacher housing condition 6.97 2.52
Frequency of reading tests 9.24 3.20
Teacher days absent -0.14 0.06
Teachers' behaviour problems -1.58 0.69
Class size -0.29 0.12
SH professional training 8.43 2.87
SH education level 6.30 2.77
SH teaching hours per week -0.68 0.29
Condition of school buildings 4.42 1.89
School resources 2.57 0.64 2.16 0.75 4.64 0.97 0.06 0.03 2.09 0.87 0.21 0.06
Pupils allowed to borrow books 27.69 6.51
School location 13.10 2.68 16.41 2.81 21.26 4.16 8.84 2.56 20.70 6.18
School community problems -8.03 3.29 -9.31 3.61
Pupil–teacher ratio -1.23 0.37 -0.76 0.36
Private school 31.27 9.23
Free school meals -36.24 6.18 -22.44 4.77
Mean pupil age 49.89 9.17
Mean socio-economic status 0.31 0.09
Mean household tasks -33.20 12.70
Mean learning materials 7.03 3.18 18.87 6.41
Mean extra tuition in reading 60.22 27.49
Between-school variation
Null model (, %var. available) 82.2 61.5% 12.5 30.1% 18.0 23.7% 28.2 49.0% 14.8 29.1% 13.3 18.7% 51.7 51.0%
Final model (, %var. explained) 14.5 50.7% 6.8 13.8% 7.9 13.2% 12.7 27.0% 2.1 25.1% 2.8 14.7% 10.3 40.8%
NOTE: All coefficients are unstandardized and are significant at p≤0.05. - There were some technical issues with Teachers’ behaviour problems for Zanzibar and Pupil–teacher ratio for Zambia
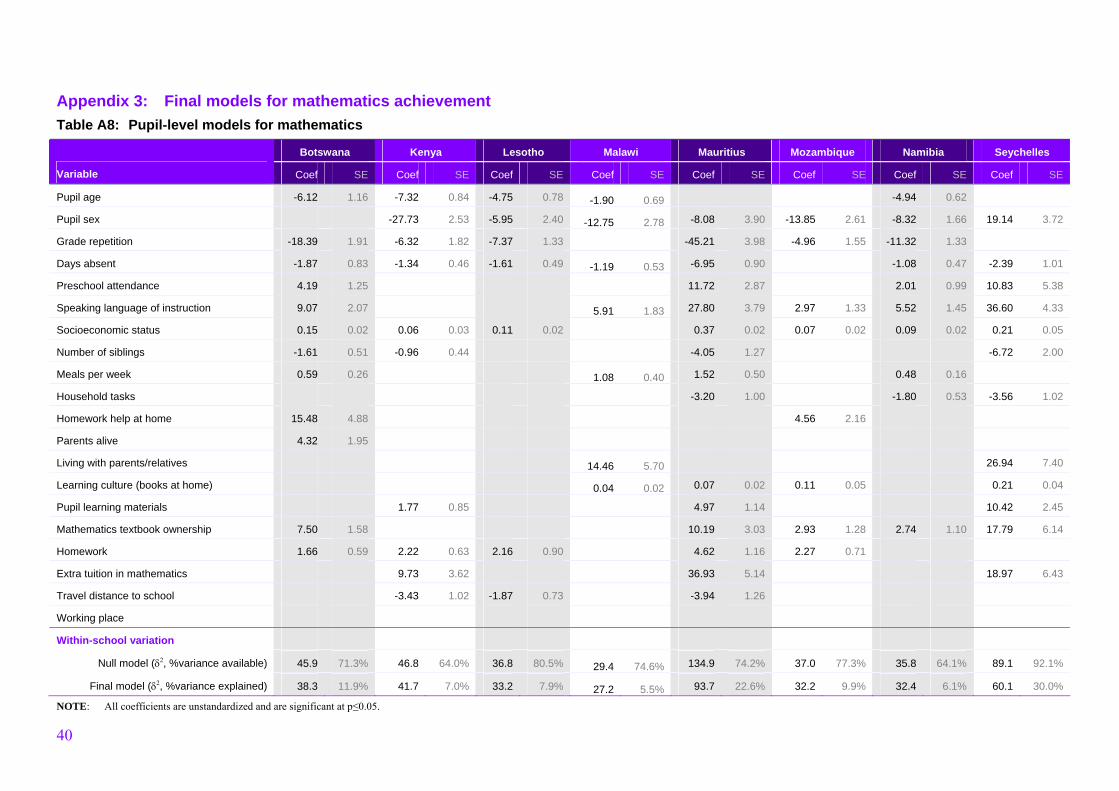
40
Appendix 3: Final models for mathematics achievement
Table A8: Pupil-level models for mathematics
Botswana Kenya Lesotho Malawi Mauritius Mozambique Namibia Seychelles
Variable Coef SE Coef SE Coef SE Coef SE Coef SE Coef SE Coef SE Coef SE
Pupil age -6.12 1.16 -7.32 0.84 -4.75 0.78 -1.90 0.69 -4.94 0.62
Pupil sex -27.73 2.53 -5.95 2.40 -12.75 2.78 -8.08 3.90 -13.85 2.61 -8.32 1.66 19.14 3.72
Grade repetition -18.39 1.91 -6.32 1.82 -7.37 1.33 -45.21 3.98 -4.96 1.55 -11.32 1.33
Days absent -1.87 0.83 -1.34 0.46 -1.61 0.49 -1.19 0.53 -6.95 0.90 -1.08 0.47 -2.39 1.01
Preschool attendance 4.19 1.25 11.72 2.87 2.01 0.99 10.83 5.38
Speaking language of instruction 9.07 2.07 5.91 1.83 27.80 3.79 2.97 1.33 5.52 1.45 36.60 4.33
Socioeconomic status 0.15 0.02 0.06 0.03 0.11 0.02 0.37 0.02 0.07 0.02 0.09 0.02 0.21 0.05
Number of siblings -1.61 0.51 -0.96 0.44 -4.05 1.27 -6.72 2.00
Meals per week 0.59 0.26 1.08 0.40 1.52 0.50 0.48 0.16
Household tasks -3.20 1.00 -1.80 0.53 -3.56 1.02
Homework help at home 15.48 4.88 4.56 2.16
Parents alive 4.32 1.95
Living with parents/relatives 14.46 5.70 26.94 7.40
Learning culture (books at home) 0.04 0.02 0.07 0.02 0.11 0.05 0.21 0.04
Pupil learning materials 1.77 0.85 4.97 1.14 10.42 2.45
Mathematics textbook ownership 7.50 1.58 10.19 3.03 2.93 1.28 2.74 1.10 17.79 6.14
Homework 1.66 0.59 2.22 0.63 2.16 0.90 4.62 1.16 2.27 0.71
Extra tuition in mathematics 9.73 3.62 36.93 5.14 18.97 6.43
Travel distance to school -3.43 1.02 -1.87 0.73 -3.94 1.26
Working place
Within-school variation
Null model (2, %variance available) 45.9 71.3% 46.8 64.0% 36.8 80.5% 29.4 74.6% 134.9 74.2% 37.0 77.3% 35.8 64.1% 89.1 92.1%
Final model (2, %variance explained) 38.3 11.9% 41.7 7.0% 33.2 7.9% 27.2 5.5% 93.7 22.6% 32.2 9.9% 32.4 6.1% 60.1 30.0%
NOTE: All coefficients are unstandardized and are significant at p≤0.05.

41
Table A8: Pupil-level models for mathematics (Continued)
South Africa Swaziland Tanzania Uganda Zambia Zanzibar Zimbabwe
Variables Coef SE Coef SE Coef SE Coef SE Coef SE Coef SE Coef SE
Pupil age -4.27 0.76 -3.66 0.69 -1.85 0.73 -5.46 2.40
Pupil sex -14.50 2.00 -31.16 3.49 -14.10 2.04 -12.30 2.73 -8.55 2.58 -8.00 3.47
Grade repetition -10.40 1.12 -4.72 1.25 -17.36 2.18 -3.32 1.22 -8.43 1.57 -9.06 3.42 -16.14 2.92
Days absent -2.75 0.35 -0.74 0.36 -0.95 0.42 -1.44 0.50
Preschool attendance 2.71 0.82 3.05 1.45
Speaking language of instruction 7.29 1.48 6.63 2.73 7.79 2.52
Socio-economic status 0.13 0.01 0.03 0.01 0.13 0.03 0.09 0.03 0.09 0.03 0.11 0.04
Number of siblings -0.56 0.26 -0.94 0.29
Meals per week 1.31 0.35
Household tasks -1.48 0.71
Homework help at home 20.25 4.09
Parents alive
Living with parents/relatives 20.17 8.93 7.84 3.45
Learning culture (books at home) 0.10 0.02 0.77 0.30
Pupil learning materials 1.24 0.55 2.61 1.15 1.37 0.50 1.88 0.78
Mathematics textbook ownership
Homework (given, corrected, and explained) 1.95 0.44 2.04 1.01 1.61 0.62 2.81 0.56 1.37 0.60 1.89 0.93
Extra tuition in mathematics -10.18 4.08 9.63 4.24 22.63 6.11
Travel distance to school -2.70 1.04
Working place 16.94 7.33 18.59 3.89 5.09 2.14 11.54 4.29
Within-school variation
Null model (2, %variance available) 42.6 44.8% 30.3 81.3% 50.0 73.3% 34.4 63.5% 36.8 84.3% 31.1 82.6% 53.0 60.8%
Final model (2, %variance explained) 39.1 3.7% 29.0 3.5% 41.4 12.7% 32.1 4.2% 35.4 3.2% 28.0 8.3% 42.3 12.3%
NOTE: All coefficients are unstandardized and are significant at p≤0.05. - There were some technical issues with Meals per week for Tanzania.

42
Table A9: School-level models for mathematics
Botswana Kenya Lesotho Malawi Mauritius Mozambique Namibia Seychelles
Variable Coef SE Coef SE Coef SE Coef SE Coef SE Coef SE Coef SE Coef SE
Grade mean 505.98 4.96 561.49 3.98 477.09 2.54 440.81 5.64 589.10 5.87 487.09 2.47 474.92 2.14 512.08 7.69
Teacher sex 11.52 4.64
Teacher teaching hours per week -1.47 0.61
Teacher subject matter knowledge 0.07 0.03 0.07 0.02
Teacher days absent -0.70 0.30 -0.42 0.19 -1.51 0.75
Report on mathematics 22.50 5.77
SH advice teacher 4.24 1.91
Teachers' behaviour problems -1.36 0.58
Proportion of female teachers -0.39 0.16
Class size -0.35 0.10 -0.47 0.16
Classroom resources 3.65 1.65
SH experience as a teacher 0.47 0.21 4.97 1.08 0.83 0.32
SH teaching hours per week -0.64 0.28
School resources 2.48 1.00 0.06 0.02 0.26 0.06
School days lost -4.34 1.71
School location 4.35 2.16 11.55 3.77 7.11 2.81 11.31 3.28
School community contribution 3.67 1.20
School community problems -16.31 4.77
Pupil–teacher ratio -0.86 0.43 -0.55 0.24 -2.54 0.78
Private school 43.18 15.70
Free school meals -41.23 9.03 20.15 6.28
School size 0.07 0.02 -0.04 0.01
Mean socio-economic status 0.28 0.05
Mean meals per week 45.98 18.78
Mean learning materials 27.04 11.06
Mean extra tuition in mathematics 66.80 17.26
Between-school variation
Null model (, %var. available) 18.5 28.7% 26.4 36.0% 8.9 19.5% 10.0 25.4% 46.9 25.8% 10.8 22.7% 20.0 35.9% 7.6 7.9%
Final model (, %var. explained) 2.5 24.8% 12.9 18.4% 5.9 6.5% 3.3 17.0% 12.7 18.8% 3.8 14.7% 6.5 24.2% 1.0 6.9%
NOTE: All coefficients are unstandardized and are significant at p≤0.05. - Teachers were not tested in Mauritius.

43
Table A9: School-level models for mathematics (Continued)
South Africa Swaziland Tanzania Uganda Zambia Zanzibar Zimbabwe
Variable Coef SE Coef SE Coef SE Coef SE Coef SE Coef SE Coef SE
Grade mean 495.68 2.25 548.00 2.32 563.26 3.78 487.22 2.81 438.94 2.61 472.82 9.10 498.01 5.77
Teacher age -0.80 0.30
Teacher education level 9.98 4.44
Teacher teaching hours per week -0.51 0.24
Teacher subject matter knowledge 0.09 0.02 0.04 0.02 0.10 0.04
Teacher days absent -0.43 0.15
Class size -0.24 0.11
SH professional training 8.24 2.83
SH experience as a head 0.84 0.40
SH experience as a teacher 0.95 0.39
School resources 2.11 0.62 0.09 0.03 2.73 1.08 0.16 0.04
Pupils allowed to borrow books 17.31 5.81
School location 6.28 2.34 15.83 3.46 12.62 4.63
School inspections 2.03 1.01 1.86 0.89 1.62 0.50
School community contribution 2.71 1.22
Pupil–teacher ratio -0.69 0.34 -0.92 0.29
Private school 33.40 7.97 48.19 8.37
Free school meals -35.82 6.25 -14.69 4.68
School size -0.02 0.01
Mean socio-economic status 0.19 0.09
Mean meals per week 8.92 2.66
Mean household tasks -9.07 3.66
Mean learning materials 7.47 2.45
Between-school variation
Null model (, %var. available) 52.4 55.2% 7.0 18.7% 18.2 26.7% 19.8 36.5% 6.8 15.7% 6.5 17.4% 34.1 39.2%
Final model (, %var. explained) 14.8 39.6% 4.9 5.6% 15.6 3.9% 12.3 13.9% 2.6 9.8% 1.9 12.3% 9.0 28.9%
NOTE: All coefficients are unstandardized and are significant at p≤0.05. - There were some technical issues with School inspections and Teacher–pupil ratio for Zambia, and Meals per week for Tanzania.

44
Author Contact
Njora Hungi
UNESCO International Institute for Educational Planning
7-9 rue Eugene-Delacroix, 75116 Paris, France
Email: [email protected]; [email protected]
For more information about SACMEQ, visit website: www.sacmeq.org
- END OF THE PAPER -