accounting for financial derivatives and its...
TRANSCRIPT
ACCOUNTING FOR FINANCIAL DERIVATIVES AND ITS EFFECTS ON EARNINGS VOLATILITY
Zhen Hua Hu B.B.A., University of Lethbridge, 2005
B.M., Zhongnan University of Laws and Economy, 2001
and
Ying Zhou B.Eco., Renmin University of China, 1998
PROJECT SUBMITTED IN PARTIAL FULFILLMENT OF THE REQUIREMENTS FOR THE DEGREE OF
MASTER OF ARTS
In the Faculty of Business Administration
Financial Risk Management Program
O Zhen Hua Hu and Ying Zhou 2006
SIMON FRASER UNIVERSITY
Summer 2006
All rights reserved. This work may not be reproduced in whole or in part, by photocopy or other means, without permission of the authors.

APPROVAL
Name:
Degree:
Title of Project:
Zhen Hua Hu and Ying Zhou
Master of Arts
Accounting for Financial Derivatives and its Effects on Earnings Volatility
Supervisory Committee:
Dr. Chris Veld Senior Supervisor Associate Professor of Finance
Date Approved:
Dr. George Blazenko Supervisor Associate Professor of Finance

SIMON FRASER UNIWR~IW~ i brary
DECLARATION OF PARTIAL COPYRIGHT LICENCE
The author, whose copyright is declared on the title page of this work, has granted to Simon Fraser University the right to lend this thesis, project or extended essay to users of the Simon Fraser University Library, and to make partial or single copies only for such users or in response to a request from the library of any other university, or other educational institution, on its own behalf or for one of its users.
The author has further granted permission to Simon Fraser University to keep or make a digital copy for use in its circulating collection, and, without changing the content, to translate the thesislproject or extended essays, if technically possible, to any medium or format for the purpose of preservation of the digital work.
The author has further agreed that permission for multiple copying of this work for scholarly purposes may be granted by either the author or the Dean of Graduate Studies.
It is understood that copying or publication of this work for financial gain shall not be allowed without the author's written permission.
Permission for public performance, or limited permission for private scholarly use, of any multimedia materials forming part of this work, may have been granted by the author. This information may be found on the separately catalogued multimedia material and in the signed Partial Copyright Licence.
The original Partial Copyright Licence attesting to these terms, and signed by this author, may be found in the original bound copy of this work, retained in the Simon Fraser University Archive.
Simon Fraser University Library Burnaby, BC, Canada

ABSTRACT
Upon the request of many constituents, the Financial Accounting Standards Board in the
US has been engaged to draft and enact some regulations for derivatives and hedging activities
since January 1992. FASB published an Exposure Draft in June 1996, after about two years of
discussions and analysis, FASB issued Accounting for Derivative Instruments and Hedging
Activities. The new regulation is effective for all fiscal quarters and years after June 15, 1999 and
it applies to all industries and enterprises.
The purpose of this paper is to discuss problems of previous accounting guidance for
derivatives and hedging activities, to illustrate the requirements of the new accounting regulations
in this respect, and to discuss some of the potential concerns of this new approach.
We also extend the empirical research in Jan (2001), which provides evidence showing
that the uses of derivative securities and discretional accounting accruals are negatively correlated.
Keywords: Accounting Standards; Financial Derivatives; Earning's Volatility

ACKNOWLEDGEMENTS
We would like to thank Chris Veld, George Blazenko for their immensely helpful
comments, criticisms and suggestions. We would also like to thank other people, who offered us
practical suggestions for finding data sources.

CONTRIBUTION
Zhen Hua Hu analyzed and summarized the SFAS No. 133 and prepared Section 1 to
Section 7; Ying Zhou made research and analysis on improvement and drawbacks of the SFAS
No.133 and provided some complements in the relevant sections.
Ying Zhou did research and generated the ideas on the empirical research, engaged in
data collection and analysis and prepared Section 8 to Section 10; Zhen Hua Hu designed and
implemented some necessary processes and programs to analyze these data.

TABLE OF CONTENTS
.. Approval .......................................................................................................................................... 11
... Abstract ......................................................................................................................................... m
Acknowledgements ........................................................................................................................ iv
Contribution ................................................................................................................................... v
Table of Contents .......................................................................................................................... vi ...
List of Tables .............................................................................................................................. VIII
Introduction .............................................................................................................................. 1
What is a Derivative Security? ............................................................................................... 3
Difficulties in Accounting for Derivatives before 1996 ......................................................... 5
Shortcomings of Accounting Standards for Derivatives before 1996 ................................. 7
4.1 Subjective Criteria of Hedge Accounting ....................................................................... 7 4.2 Internal Inconsistency ..................................................................................................... 8 4.3 Difficulties in Justifying Deferred Gains and Losses as Liabilities or Assets ................. 8 4.4 Other Limitations ............................................................................................................ 9
4.4.1 Lack of Visibility ....................................................................................................... 9 4.4.2 Incompleteness ........................................................................................................... 9
Changes in Accounting for Derivatives in the United States ........................................ 10 5.1 SFASNo.133 ................................................................................................................ 10 5.2 New Definition of Derivatives ...................................................................................... 11
..................................................................................... 5.3 Basic Accounting Requirement 11 5.3.1 Fair Value Hedge ..................................................................................................... 12 5.3.2 Cash Flow Hedge ..................................................................................................... 12 5.3.3 Foreign Currency Hedge .......................................................................................... 13
Improvements over the Previous Accounting for Derivatives ........................................ 14 6.1 Consistency ................................................................................................................... 14
................................... 6.2 Treatment on Deferred Gains or Losses as Liabilities or Assets 14 6.3 Easier to Determine a Hedge ......................................................................................... 15 6.4 Visibility ........................................................................................................................ 15
................................................................................................................. 6.5 Competences 15 6.6 Fewer Subjective Criteria of Hedge Accounting ........................................................... 15
New Problems Created by SFAS No.133 ............................................................................. 17 ................................................................................... 7.1 Volatility of Earning and Equity 17
7.2 Compliance Costs .......................................................................................................... 17 7.3 Reporting of Hedged Item between Historical Cost and Fair Value ............................. 18 7.4 Different Accounting for the same Financial Instrument or Transaction ...................... 18
The Empirical Research by Jan (2001) ................................................................................ 19 ........................................................................................... 8.1 Introduction to Jan's Study 19

8.2 Jan's Sample and Measurement of Derivative Use and Accrual Management ............. 19 8.2.1 The Sample .............................................................................................................. 19
............................................................................... 8.2.2 Measurement of Derivative Use 20 ................................................................... 8.2.3 Measurement of Accrual Management 2 0
.................................................................... 8.3 Jan's Hypothesis and Empirical Design 2 1 ........................................................................................................ 8.3.1 The Hypothesis 21
.............................................................................................. 8.3.2 The Empirical Design 21 .......................................................................................................... 8.4 Empirical Results 27
9 Testing the Hypothesis of Jan (2001) with Different Data ................................................. 30 ................................................................................................................... 9.1 Introduction 30 .................................................................................................................... 9.2 The Sample 30
9.3 Measurement of Derivative Use and Accrual Management and Relevant Data ........... 32 . . .............................................................................. 9.3.1 Measurement of Denvative Use 3 2 .................................................................... 9.3.2 Measurement of Accrual Management 33
9.4 Our Hypothesis and Empirical Design .......................................................................... 34 ........................................................................................................ 9.4.1 The Hypothesis 34
9.4.2 The Empirical Design .............................................................................................. 34 .......................................................................................................... 9.5 Empirical Results 39
10 Conclusion .............................................................................................................................. 42
References ..................................................................................................................................... 44
vii

LIST OF TABLES
............................................................... Table 8.1 Descriptive Statistics for Control Variables 25
.................................... Table 8.2 Regression Results for Self-section Simultaneous Equations 29
........................................................................................................ Table 9.1 Sample Selection 31
................................................... Table 9.2 Sample Descriptive Statistics (Million US Dollars) 32
............................................................... Table 9.3 Descriptive Statistics for Control Variables 37
.................................... Table 9.4 Regression Results for Self-section Simultaneous Equations 39

1 INTRODUCTION
The creation of financial derivatives during the past 20 years has inspired great interest in
all aspects of those intricate instruments. The innovations, diversity, and complexity of
derivatives have besieged traditional accounting implementation for financial instruments, which
had evolved in earlier years when non-derivative type instruments prevailed. Derivative securities,
from now on to be referred to as derivatives, have long been a concern in the accounting domain
because of their various types and complex nature. The development of the accounting standard
of derivatives has lagged and, as a result, the previous accounting practices for derivatives are
often contradictory and underdeveloped. In order to provide accurate, reliable, and comparable
financial information to financial statement users, accounting standard boards from all over the
world have been engaged to develop standards to account for derivatives.
In the United States, the authoritative accounting standard for derivatives is promulgated
by the Financial Accounting Standards Board (FASB). Since 1973, FASB has been the
designated organization in the private sector for establishing standards of financial accounting
and reporting. Those standards govern the preparation of financial reports. They are officially
recognized as authoritative by the Securities and Exchange Commission and the American
Institute of Certified Public Accountants. All the publicly traded companies in the US must
follow the standards issued by the FASB for preparing financial reports and disclosing financial
information. Such standards are essential to the efficient functioning of the economy because
investors, creditors, auditors and others rely on credible, transparent and comparable financial
information. Among the publications issued by the FASB, Statements of Financial Accounting
Standards, generally abbreviated and used as "SFAS", are the most authoritative publications for
setting the accounting rules on public companies.
However, the FASB has offered incomplete and inconsistent accounting standards prior
to 1996 as accounting guidance on derivatives (Raymond, 1997). Some major losses of several
public companies on derivatives activities in 1997 ' also added to the pressures for the FASB to
improve its existing accounting standard for derivatives. Finally, in June 1998 a breakthrough
accounting statement-- Statement of Financial Accounting Standards (SFAS) No. 133 was
published.
1 For example, Procter & Gamble Co., Gibson Greetings Inc., Orange County and Long-Tern Capital Management.

WHAT IS A DERIVATIVE SECURITY?
A derivative security or derivative is a contract that specifies the right or obligation
between two parties to receive or deliver future cash flows (or exchange of other securities or
assets) based on some future event. According the definition of FASB, a derivative security is
defined as a swap, future, forward, option or other financial instruments with similar
characteristics (Woodward et al. 1996). Due to the underdeveloped accounting standard system
and difficulties in recording non-cash transactions, FASB's definition of a derivative prior to 1996
excludes contracts that allow delivery of the actual item or commodity.
For financial derivatives, the dates or amounts or both are variables for calculation of the
cash payments or deliveries of other financial instrument, the values of which vary over time.
"Interest rate swaps, exchange traded futures contracts, and financial options are common
examples of financial derivatives" (Beier, 1995). Interest rate swaps are contracts where the
involved parties agree to exchange cash flows on settled future date. Party A is required to pay a
fixed amount of cash, and party B is obligated to pay a variable amount of cash determined by
some price index such as the London Inter-Bank offer Rate (LIBOR). Exchange traded futures
contracts are contracts where the involved parties agree to exchange a predetermined amount of
cash for a specified financial instrument on a specified date. The amount and the date of exchange
are fixed, but the value of the financial instrument is changeable; its value will be calculated
based on the prevailing market prices at the date of exchange. Financial optional contracts,
including put options and call options, are common derivatives. The writer of a put agrees to
obtain a defined financial instrument from the holder of the put for a fixed price on a future date.
The writer of a call agrees to sell a defined financial instrument to the holder of the call for a
fixed price on a future date. "The market price of the underlying financial instrument at the

exercise date determines whether the holder chooses to exercise the option and which party gains
or loss." (FASB, 1996)
However, the accounting standards for employee stock options, one of the most
commonly used employee compensation components, are not covered by SFAS 133. Due to the
significance and popularity of employee stock options, FASB issued separate statements
governing the recording and disclosure of employee stock options, namely APB No. 25 (which
has been superseded by SFAS123 (R) issued in December 2004), SFAS 123 and SFAS 123 (R).

3 DIFFICULTIES IN ACCOUNTING FOR DERIVATIVES BEFORE 1996
Financial instrument innovations have challenged the financial system's use of previous
authoritative guidance for new financial instruments. The creation of new financial products has
outpaced the establishment of relevant accounting standards, and accounting standard-setters
have not kept up with the innovations of the financial community. Reporting and disclosing
derivatives activity has bothered accountants, companies and accounting standard boards.
Difficulties associated with derivatives accounting exist in two areas: the gains and losses
recognition from these financial instruments and the disclosure of derivatives positions.
According to Carpenter (1996), difficulties in the reporting of derivatives in financial
statements seem to lie in the fact that some items on the balance sheet have been measured at cost
while others are marked to market. For example, free-standing derivatives are recorded at their
fair value, and gains and losses on the derivatives have been recognized until they occur.
However, the offsetting changes in the value of the hedged items, such as inventory, are not
recognized until disposition. This may cause the recognition of offsetting gains and losses in
hedging in different reporting periods. Therefore, a hedge that lowers economic risk may increase
the volatility of accounting earnings. In order to resolve this problem, firms are allowed to defer
derivatives gains and losses until offsetting gains and losses are realized. Nevertheless, the
problem with reporting derivatives still exists because the effectiveness of the approach relies on
the flexibility of the firm in deciding which gains and losses to defer. Such flexibility makes
financial statements hard to explain. One alternative solution is to recognize all gains and losses
when they occur. However, this solution is highly controversial since it violates the traditional
accounting convention.
Prior to 1996, the FASB issued five statements related to this area. Accordingly, it
adopted different approaches to account for derivatives. (FASB, 1998)
SFAS No.52 "Foreign Currency Translation" and SFAS No. 80 "Accounting for Futures
Contracts" allow hedge accounting which enables gains and losses in derivatives positions to be
deferred until the associated offsetting gains and losses are recognized. Recognizing gains and
losses on related items in the same period satisfies the "matching principle".
The Board adopted SFAS No.199 to hedge accounting in 1995. Although firms are
required by the new approach to classify derivatives as either for "trading" or "other" purposes,
the new approach additionally requires all derivatives to be marked to market and all realized
gains or losses to be reported under income. Unrealized gains and losses on "trading" derivatives
will be reported under income while those for "other" purpose will be reported in a separate
component of equity until realized. (Smith and Wilson, 1999)

4 SHORTCOMINGS OF ACCOUNTING STANDARDS FOR DERIVATIVES BEFORE 1996
The use and creation of various financial derivatives by companies has increased
significantly during the past twenty years. However, the relevant accounting standards and
guidelines offered by the FASB have lagged far behind such development. The existing rules and
regulations also have problems that hinder their implementations and forces. In particular, the
regulations issued by the FASB before 1996 had been criticized for some major shortcomings as
discussed below.
4.1 Subjective Criteria of Hedge Accounting
The criteria for hedge accounting treatment mentioned in SFAS No.52 and SFAS No. 80
are subjective for several reasons.
First, management relies on subjective judgement to determine risk exposure.
Management cannot consider risk exposure on just an individual item or transaction. Instead, it
must take into account all of the existing offsetting exposures. However, it is often difficult for
management to objectively measure an enterprise risk. Thus, this subject management judgement
can compare financial statements across different forms. More importantly, this may enable f m s
to manipulate their earnings.
Second, SFAS No. 80 requires that management must illustrate a high correlation
between gains and losses on the hedging instrument and changes within the market value of the
hedged item. However, the statement does not provide a definition of "high correlation" or
provide a definite guideline on how to measure and analyze such correlations. As such,
management's understanding and estimate on the correlations will be subjective. These various

understandings and estimates by the management of different companies will inevitably lead to
the inconsistency and lack of comparability of the financial statements of the companies.
4.2 Internal Inconsistency
Smith and Wilson (1999) mention that it is difficult to use an analogy to account for any
financial instrument not mentioned in these two statements because SFAS No.52 and SFAS No.
80 are inconsistent.
First, SFAS No.52, which addresses forwards, assesses risk on a transaction basis while
SFAS No.80, which addresses futures, assesses risk on an enterprise perspective.
Second, SFAS No.52 allows only firm commitments to be hedged while SFAS N0.80
pennits hedge accounting for both firm commitments and forecasted transactions.
Third, the correlation between the hedged position and the hedged item is a more
significant criterion to be reached in order to apply hedge accounting according to AFAS No.80
than SFAS No.52. The rationale is that SFAS No. 80 pennits cross-hedging. On the other hand,
SFAS No. 52 does not allow cross-hedging even though a high correlation condition is met, it
only permits cross-hedging if it is not practical or feasible to hedge in an identical currency.
Finally, SFAS N0.80 requires futures contracts to be reported at fair value while SFAS
No.52 requires foreign currency forwards to be reported at amounts based on changes in foreign
exchange rates only. As a result, derivatives are unrecognized or recorded at nominal amounts
that signify a small fraction of the value of their potential cash flows.
4.3 Difficulties in Justifying Deferred Gains and Losses as Liabilities or Assets
The problem mentioned by Wilson and Smith arises from recording a deferred loss as an
asset and a deferred gain as liability because they do not match the conventional accounting

definition of assets and liabilities. However, it is complicated to justify unrealized gains as future
sacrifices of economic benefits and unrealized losses as future economic benefits.
4.4 Other Limitations
4.4.1 Lack of Visibility
Many off-balance-sheet instruments are not reported in the financial statement since these
off-balance-sheet derivative instruments do not require an initial cash outlay. As a result,
unrealized gains or losses of these instruments are not recognized. The lack of visibility of
derivative instruments and the changes of their market values may hide potential risks to a
company.
4.4.2 Incompleteness
It is difficult for the accounting standard setting community to develop appropriate
guidelines. Due to the lack of complete guidance, accountants have to refer to numerous
Emerging Issues Task Force (EITF) consensus documents and non-authoritative literature to
decide how to account for specific derivatives instruments. Usually, they have to analogize an
accounting method since even EITF is unable to provide timely guidance on rapidly evolving
derivative instruments. As different combinations are possible, various methods can be applied.
This makes financial statements hard to compare across companies.
5 CHANGES IN ACCOUNTING FOR DERIVATIVES IN THE UNITED STATES
5.1 SFAS No.133
Due to the incompleteness and inconsistency of accounting standards in derivatives and
the large derivative losses of some companies in the 1990s, under the stress from Congress, the
Securities and Exchange Committee (SEC), bank regulators and other groups, EASB has to
improve its accounting standards for derivatives and hedging activities. After the analysis of
possible alternatives and the consideration of all comments at the public hearings, the EASB
published an Exposure Draft in June 1996. After two years of trial and adjustment, the final
Accounting Standard for Derivatives instruments and Hedging Activities was issued in the
summer of 1998 (Ashley and Bliss, 1999). SEAS No. 133 establishes accounting and reporting
standards for derivative instruments, including certain derivative instruments embedded in other
contracts, (collectively referred to as derivatives) and for hedging activities. It requires that an
entity recognizes all derivatives as either assets or liabilities in the statement of financial position
and measure those instruments at fair value. If certain conditions are met, a derivative may be
specifically designated as a hedge of the exposure to changes in the fair value of a recognized
asset or liability or an unrecognized firm commitment, (b) a hedge of the exposure to variable
cash flows of a forecasted transaction, or (c) a hedge of the foreign currency exposure of a net
investment in a foreign operation, an unrecognized firm commitment, an available-for-sale
security, or a foreign-currency-denominated forecasted transaction.
The purpose of SEAS 133 is to provide a comprehensive and consistent guide for all
derivatives and hedging activities, and to eliminate non-authoritative practices. SEAS No. 133 was
supposed to be effective for all fiscal quarters of all fiscal years after June 15, 1999. However,

there was some strong opposition from corporate end users, banks, exchanges and several
regulatory agencies. Consequently, the FASB has decided to defer the effective date for one more
year.
. 5.2 New Definition of Derivatives
To accommodate innovative new derivatives instruments' emerging in the market, SFAS
No. 133 defines a derivative as having three "distinguishing" characteristics. It should have: first,
one or more underlying assets such as index, price or rates, a specified interest rate and foreign
exchange rate, and one or more notional amounts or payment provisions; second, there is little or
no initial net investment required; third, its term requires or permits net settlement. The Board
believes that this new definition will accommodate most existing or emerging free-standing
derivatives.
5.3 Basic Accounting Requirement
As an absolute breakthrough in the accounting treatments for derivatives, SFAS No. 133
substantially changes the current hedge accounting and requires all derivatives to be recorded at
fair or current market value and recognized as assets or liabilities in the balance sheet. Derivatives
may be specifically designed as (i) hedging the exposure to changes in the fair value of an
existing asset or liability or a f m ' s fair value hedge, (ii) hedging the exposures to changes in
cash flows associated with an existing asset or liability or with a forecasted cash flow hedge, and
(iii) hedging the foreign currency exposure of a firm commitment, a net investment in foreign
operation, an available-for-sale security, or a forecasted transaction denominated in foreign
currency (foreign currency hedge). Changes in fair value of derivatives are not designated as any
one of the three hedges mentioned above will be included in earnings as they occur. (Demarzo
and Duffie, 1998)

5.3.1 Fair Value Hedge
The accounting for changes in the fair value of a derivative (that is, gains and losses)
depends on the intended use of the derivative and the resulting designation. For a derivative
designated as hedging the exposure to changes in the fair value of a recognized asset or liability
or a firm commitment (referred to as a fair value hedge), the gain or loss is recognized in earnings
in the period of change together with the offsetting loss or gain on the hedged item attributable to
the risk being hedged. The effect of that accounting is to reflect in earnings the extent to which
the hedge is not effective in achieving offsetting changes in fair value.
The gain or loss on a derivative will be recognized in earnings accounts or income
statements as it occurs, along with the offsetting gain or loss on the hedged item attributed to the
risk being hedged. The offsetting gain or loss on the hedged item and the entire gain or loss on the
derivative will be reported to the extent the hedge is effective. In general, fixed-rate financial
assets and liabilities are subject to fair value exposure due to changes in the market interest rate.
(Rasch and Wilson, 1998)
5.3.2 Cash Flow Hedge
For a derivative designated as hedging the exposure to variable cash flows of a forecasted
transaction (referred to as a cash flow hedge), the effective portion of the derivative's gain or loss
is initially reported as a component of other comprehensive income (outside earnings) and
subsequently reclassified into earnings when the forecasted transaction affects earnings. The
ineffective portion of the gain or loss is reported in earnings immediately.
A derivative's gain or loss will be reported in other comprehensive income or current
earning, as necessary, in order to adjust the balance in other comprehensive income with the
amount equalling the lesser of 1) the cumulative gain or loss on the derivative, 2) the cumulative
change in expected cash flows on the hedged transaction. The excess cumulative gain or loss on
the derivative will be referred to as ineffective and included in current earnings. The accumulated

gains and losses will be deferred and reported in equity when the forecasted transaction
influences earning. (Rasch and Wilson, 1998)
5.3.3 Foreign Currency Hedge
For a derivative designated as hedging the foreign currency exposure of a net investment
in a foreign operation, the gain or loss is reported in other comprehensive income (outside
earnings) as part of the cumulative translation adjustment. The accounting for a fair value hedge
described above applies to a derivative designated as a hedge of the foreign currency exposure of
an unrecognized firm commitment or an available-for-sale security. Similarly, the accounting for
a cash flow hedge described above applies to a derivative designated as a hedge of the foreign
currency exposure of a foreign-currency-denominated forecasted transaction.
To account for derivatives that hedge the foreign currency exposure of a future firm
commitment or available-for-sale security, the fair value hedge accounting is used to provide that
all fair value hedge criteria are met. For derivatives that hedge the foreign currency exposure of a
forecasted transaction, cash flow hedge accounting is used provided that all cash flow hedge
criteria are met. (FASB, 1998)

6 IMPROVEMENTS OVER THE PREVIOUS ACCOUNTING FOR DERIVATIVES
It is understandable that SFAS No. 133 cannot resolve all previous accounting problems
related to financial derivatives. Alex (2004) points out that SFAS No. 133 represents great
improvements. SFAS No. 133 resolves many of the major problems with previous accounting
standard of derivative; it also increases the visibility, completeness and internal consistency of the
accounting of derivatives (Alex, 2004). However, these studies do not seem to be comprehensive
enough. More improvements over the previous accounting for derivatives are discussed below.
6.1 Consistency
First, inconsistencies caused by entities holding different view of risk are eliminated by
requiring an entity to identify the risk being hedged by the exposure of changes in the cash flow,
fair value or exchange rate.
Second, inconsistencies are reduced because SFAS No. 133 permits hedge accounting for
most derivatives instruments. Inconsistencies that arose from derivatives being measured
differently under previous accounting standard are overcome by SFAS No. 133.
6.2 Treatment on Deferred Gains or Losses as Liabilities or Assets
Reporting deferred gains or losses as liabilities or assets need not be justified since SFAS
No.133 does not require the reporting of unrealized gains or losses as liabilities or assets. They
will be included in current earning if they are not deferred. Otherwise, they will be included in
comprehensive income and reported in stockholder' equity.

6.3 Easier to Determine a Hedge
Under SFAS No. 133, only three kinds of hedges, fair value hedge, cash flow hedge and
foreign currency hedge, are permitted. Therefore, it is easier to determine what designates as a
hedge. The derivatives can be qualified as one of these hedges only if the criteria for the
corresponding hedge are met.
6.4 Visibility
Lack of visibility is no longer a problem under SFAS No. 133 since all derivative
financial instruments are to be measured at fair value instead of historical cost and reported as
assets or liabilities on the balance sheet. Since fair value provides financial instruments users a
better reference to of whether the value of the hedged item is experiencing favourable or
unfavourable market changes, the FASB decided that fair value is more useful measure for
derivative financial instruments than historical cost. As a result of this new regulation, it can help
financial statement users make better assessment on the company's investment strategies.
6.5 Competences
There will be no need to analogize to current guidance and generate new accounting
standards since SFAS No. 133 offers a comprehensive approach in accounting for derivatives. It
will apply to all derivatives instruments. Comparability also improves since the purpose and the
way all companies use to account for derivatives are similar. SFAS No. 133 also promotes the
matching principle since gains and losses on a hedging instrument are the same time with the
gains and losses of the hedging item.
6.6 Fewer Subjective Criteria of Hedge Accounting
SFAS No. 133 overcomes the subjective judgment of net risk exposure. SFAS No.80
requires that to justify hedge accounting, an entity must show that there is risk reduction on an

enterprise basis. Since it is hard to assess an enterprise risk objectively, this requirement has led
to earning manipulation. However, such as requirement is eliminated in SFAS No. 133. Therefore,
the new accounting statement serves to reduce the subjective criteria of hedge accounting.

7 NEW PROBLEMS CREATED BY SFAS N0.133
7.1 Volatility of Earning and Equity
One of the major concerns on SFAS No.133 is that it will increase companies' earning
volatility. As previously mentioned, this regulation requires all the U.S. corporations and foreign
corporations with a stock listing in the US to include their derivatives on balance sheets and
adjust earnings to reflect changes in their market value. As a result, it will be a lot more difficult
for companies to smooth out their earnings. Risk managers, CFOs and CEOs are worried a lot on
how the market and investors will react to this increased volatility. As argued by Jonathan
Boyles, director of financial standards at Washington, D.C.-based Fannie Mae, which held $240
billion worth of interest-rate swaps at the end of 1999, "Derivative is still a four-letter word",
"People may see our use of derivatives and think we're taking on a lot of risk, when that's not the
case." (Andrew, 2000)
7.2 Compliance Costs
There are short term and long term compliance costs associated with the SFAS No. 133.
Over the short run, companies have to incur a considerable amount of implementation costs. For
example, there are costs of revising a company's accounting, tax, risk management and valuation
system, as well as the cost of required computer system changes. Over the long run, there are
ongoing costs associated with the extensive disclosure requirement of the new accounting
standard. Documentation of the hedge relationship, the risk-management objective and the risk-
management strategy is required.

7.3 Reporting of Hedged Item between Historical Cost and Fair Value
Under SFAS No. 133 the magnitude of overhedging will be reflected in current earnings,
but underhedging will not. Overhedging means that the change in fair value of the derivative is
greater than the change in fair value of the hedged item. Underhedging means that the change in
fair value of the derivative is less than the change in fair value of the hedged item. If there is
overhedging, both the derivative and the hedged item will be reported at fair value while the
changes in their fair value will be included in current earnings. The excess of the gain or loss on
the derivatives over the gain or loss on the hedged item will be included in earning. If there is
under-hedging, the full amount of gain or loss on the derivative will be reported in earning, but
the amount of gain or loss on the hedged item being reported will only be up to the amount that
provides asset. The hedged item, reported at an amount between historical cost and fair value,
may create inconsistency in reporting the value of a hedge item.
7.4 Different Accounting for the same Financial Instrument or Transaction
SFAS No. 133 creates inconsistency in new areas since the same financial instrument or
transaction will be accounted for differently. For instance, the accounting for hedges of firm
commitments versus forecasted transactions. There is belief that there is no substantive difference
in qualifying forecasted transactions and firm commitments and hence both of them should be
treated the same way. However, FASB believes that firm commitments are distinct from
forecasted transactions. Therefore, its new requirements account for hedging of forecasted
transactions as cash flow hedges and hedging of fm commitments as fair value hedges. For a
forecasted transaction that later becomes a qualified firm commitment, the hedge accounting for a
forecasted transaction must be discontinued. The firm commitment can then be hedged
prospectively. (Arlette and Rasch, 1998)

8 THE EMPIRICAL RESEARCH BY JAN (2001)
8.1 Introduction to Jan's Study
Contrary to the general argument that the implementation of SFAS No. 133 may increase
the earning's volatility, Jan (2001) presents evidence showing that managers actually can use
derivatives and accounting accruals as partial substitutes to smooth their earnings volatility. In his
study, Jan examines the relation between managers' use of derivative financial instruments and
their earnings management decisions. He points out that in addition to discretionary accounting
accruals which are used as the primary means by managers to smooth their f m s ' earnings,
"managers also can smooth earnings by using other tools, such as financial derivatives, that
smooth their firms' cash flows. That is, earning is the sum of cash flows and accruals; all else
equal, reducing cash flow volatility should reduce earnings volatility." Through his empirical
study on the 1994-1996 data on a sample of 304 non-financial, non-regulated Fortune 500
companies, he finds a significant negative association between derivatives' notional amounts and
proxies for the magnitude of discretionary accruals.
8.2 Jan's Sample and Measurement of Derivative Use and Accrual Management
8.2.1 The Sample
The sample used by Jan includes non-financial, non-regulated Fortune 500 firms for
1994-1996. From the 489 f m s that were consistently included in the Fortune 500 firms for 1994-
1996, Jan discards 82 firms that were privately owned or owned by foreign corporations or had
missing information. 103 firms in the financial industry and regulated industry were also
excluded from the sample. Accordingly, there were 304 firms remaining in the sample, among

which 218 were derivative users and 86 were non-users. Jan uses three annual observations for
these 304 firms in his study. The firms in the sample that use derivatives do so consistently
throughout the sample period.
8.2.2 Measurement of Derivative Use
In his study, Jan measures derivative use (DERIVATIVES) as the "disclosed notional
amount of interest rate and foreign currency derivatives, scaled by lagged total assets." The
derivative information can be found from the 1994-1996 Form 10-K filings retrieved from
EDGAR through SEC's website. The other financial data of the sample f m s are obtained from
the Standard and Poor's CompuStat Database.
8.2.3 Measurement of Accrual Management
For the measurement of accrual management of the sample firms, Jan uses the Jones
(1991) accruals expectation model as modified by Dechow et al. (1995) to develop a proxy:
TACit /TAit.l = vl(l/ TAit-1) + ~2 [(AREVit - ARECiJ TAit-l] + cp3(PPEit/ TAit.l) +&it (1)
where TAC is total accruals, which is measured by Jan as earnings before extraordinary items and
discontinued operations less operating cash flows; TA is total assets; AREV is change in revenue;
AREC is change in accounts receivable; and PPE is gross property, plant, and equipment. "The
(AREV - AREC) term controls for normal levels of working capital accruals related to sales, the
PPE term controls for normal levels of depreciation expense and related deferred tax accruals,
and the TA deflator controls for potential scale bias (Jones, 1991; Dechow et al. 1995)". "The
above model implicitly assumes that an changes in credit sales result from the earnings
management. This is based on the reasoning that it is easier to manage earnings by exercising
discretion over the recognition of revenue on credit sales than it is to manage earnings by
exercising discretion over the recognition of revenue on cash sales." (Dechow et al. 1995)
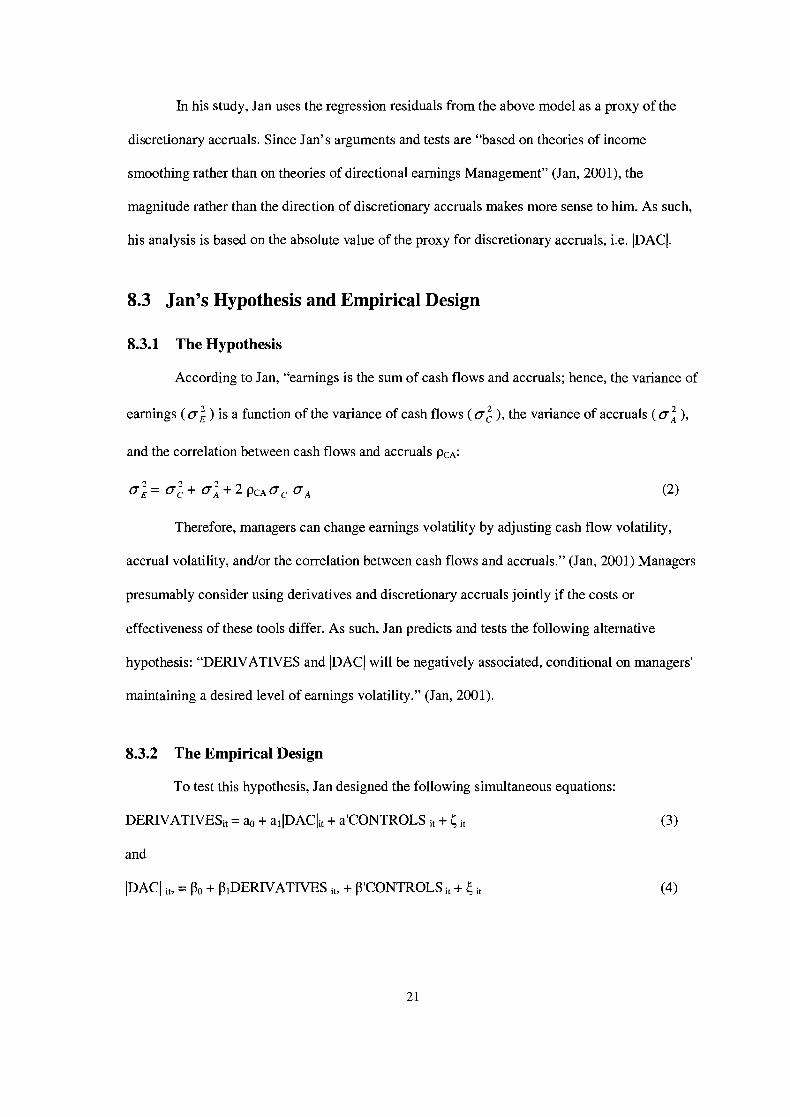
In his study, Jan uses the regression residuals from the above model as a proxy of the
discretionary accruals. Since Jan's arguments and tests are "based on theories of income
smoothing rather than on theories of directional earnings Management" (Jan, 2001), the
magnitude rather than the direction of discretionary accruals makes more sense to him. As such,
his analysis is based on the absolute value of the proxy for discretionary accruals, i.e. IDACI.
8.3 Jan's Hypothesis and Empirical Design
8.3.1 The Hypothesis
According to Jan, "earnings is the sum of cash flows and accruals; hence, the variance of
earnings ( a: ) is a function of the variance of cash flows ( a: ), the variance of accruals ( a: ),
and the correlation between cash flows and accruals pc,:
2 2 2 DA+2pCAac aA @I
Therefore, managers can change earnings volatility by adjusting cash flow volatility,
accrual volatility, and/or the correlation between cash flows and accruals." (Jan, 2001) Managers
presumably consider using derivatives and discretionary accruals jointly if the costs or
effectiveness of these tools differ. As such, Jan predicts and tests the following alternative
hypothesis: "DERIVATIVES and IDACJ will be negatively associated, conditional on managers'
maintaining a desired level of earnings volatility." (Jan, 2001).
8.3.2 The Empirical Design
To test this hypothesis, Jan designed the following simultaneous equations:
DERIVATIVESi, = ao + allDAClit + a'CONTROLS it + 6 it (3)
and
IDACl it, = Po + PIDERIVATIVES it, + P'CONTROLS it + 6 it (4)

CONTROLS is a vector of control variables. It accounts for managers' incentives to use
derivatives and manage accruals to maintain a desired level of earnings volatility. It includes two
sets of variables, one common to both equations and the other intended to identify the
simultaneous equations. The data used to construct these variables mostly come from CompuStat,
if not otherwise indicated.
Variables Common to All Equations
According to Jan, "managers use derivatives and discretionary accruals to increase
managerial compensation and wealth, to reduce income taxes and debt financing costs, to avoid
underinvestment and earnings surprises, and to mitigate any volatility caused by low
diversification." Equations (3)-(4) above include variables to control for these incentives.
The cash compensation and value of the shares and stock options held by managers create
the most important incentive on them to manage earnings volatility of their companies. According
to the literature review conducted by Jan, "because cash compensation and firm value tend to
increase with earnings persistence (Baber et al. 1998; Barth et al. 1999; Myers and Skinner,
1999), managers are likely to smooth earnings through derivatives and discretionary accruals to
increase their compensation and the value of their stock (e.g.. Smith and Stulz, 1985; Gaver et al.
1995; Balsam, 1998). The incentives to manage earnings volatility to increase the value of stock
options are less clear."
The variables used in the equations (3) and (4) for the manager's compensations are cash
compensation (CASH-COMP), stock holdings (STOCK) and option holdings (OPTIONS). These
variables are all scaled by the respective company's lagged total assets. The data is obtained from
the database ExecuComp. Jan uses the CEO's salary and bonus for CASH-COMP, fair value of
stock the manager owns for STOCK, and the number of outstanding options the manager has for
OPTIONS.

Income tax is also an incentive to managers to smooth earnings and cash flows in Jan's
equations. He uses the variable "CONVEXITY" for the "tax convexity" of the company and
expects that it is positively associated with derivative use and accrual management. This variable
is computed as the excess of the marginal tax rate according to Graham (1996) over the average
tax rate which is calculated as tax expense divided by pre-tax earnings.
Leverage and financial distress also create the necessity to smooth earnings and cash
flows so that the firm's credit risk can be under control or reduced. Therefore, Jan uses the debt-
to-asset ratio for proxy of leverage (LEVERAGE). For financial distress (DISTRESS), he uses
Ohlson's (1980) bankruptcy prediction model for the proxy.
Jan also takes into considerations firms with growth options such as research and
development, which "are more likely to smooth earnings and cash flows to avoid
underinvestment". He uses the variable RD in his equation which is the ratio of research and
development expense to total sales.
Since firms with heavy analyst following face pressure to smooth earnings so that they
can avoid reporting earnings surprises (Johnson, 1999), Jan uses the logarithm of the number of
analysts following the firm as a control variable in his equations. This variable is "ANALYSTS"
and the number of analysts following the firm is obtained from Bloomberg.
Finally, since firms with more diversified business are less stressed in using derivatives
and accruals to smooth earnings, Jan uses the entropy index of business segment sales in (Palepu,
1985) as a measure of business diversification (DIVERSIFICATION) in his equations. He also
uses the ratio of foreign sales to total sales (FRGN-SALES) to measure the company's exposure
to foreign exchange rate risk.
Variables to Identifv the Simultaneous Equations
In the equation for DERIVATIVES, i.e. equation (3), Jan includes variables to control for
firm size ( S m ) , dividend yield (DIV-YIELD), debt maturity (ST-DEBT), and cash cycle
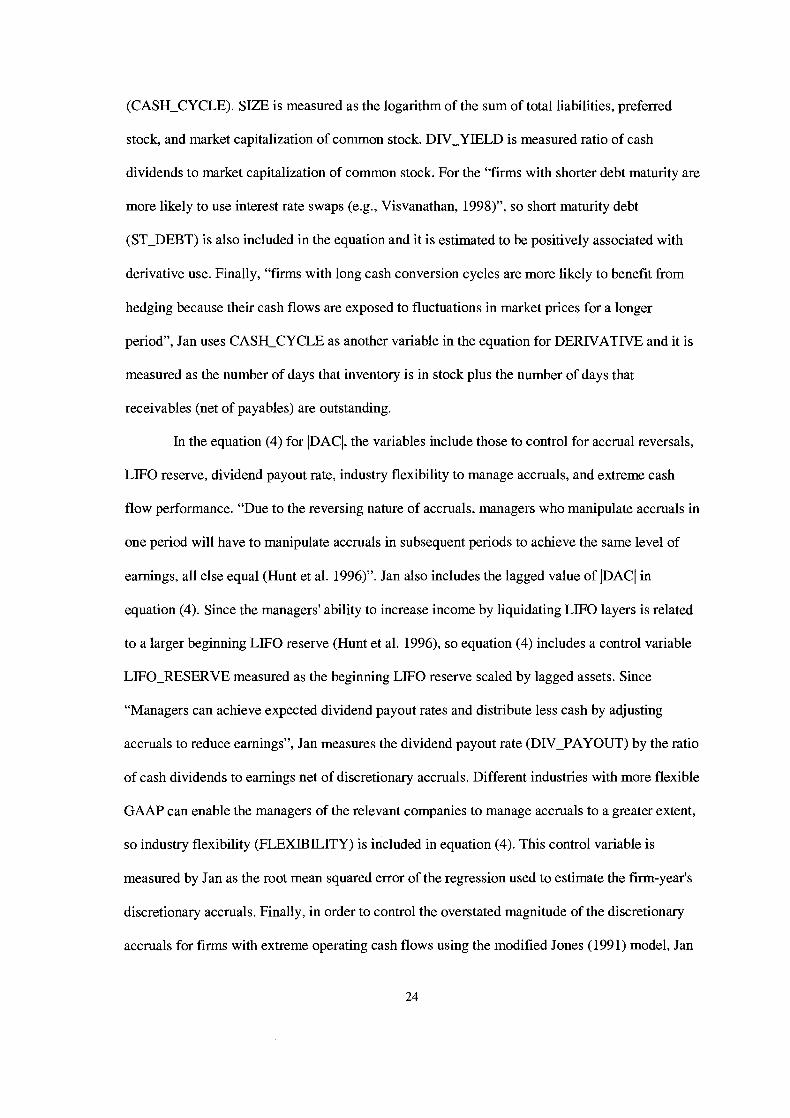
(CASH-CYCLE). SIZE is measured as the logarithm of the sum of total liabilities, preferred
stock, and market capitalization of common stock. DIVYIELD is measured ratio of cash
dividends to market capitalization of common stock. For the "firms with shorter debt maturity are
more likely to use interest rate swaps (e.g., Visvanathan, 1998)", so short maturity debt
(ST-DEBT) is also included in the equation and it is estimated to be positively associated with
derivative use. Finally, "firms with long cash conversion cycles are more likely to benefit from
hedging because their cash flows are exposed to fluctuations in market prices for a longer
period", Jan uses CASH-CYCLE as another variable in the equation for DERIVATIVE and it is
measured as the number of days that inventory is in stock plus the number of days that
receivables (net of payables) are outstanding.
In the equation (4) for IDACI, the variables include those to control for accrual reversals,
LIFO reserve, dividend payout rate, industry flexibility to manage accruals, and extreme cash
flow performance. "Due to the reversing nature of accruals, managers who manipulate accruals in
one period will have to manipulate accruals in subsequent periods to achieve the same level of
earnings, all else equal (Hunt et al. 1996)". Jan also includes the lagged value of IDACl in
equation (4). Since the managers' ability to increase income by liquidating LIFO layers is related
to a larger beginning LIFO reserve (Hunt et al. 1996), so equation (4) includes a control variable
LIFO-RESERVE measured as the beginning LIFO reserve scaled by lagged assets. Since
"Managers can achieve expected dividend payout rates and distribute less cash by adjusting
accruals to reduce earnings", Jan measures the dividend payout rate (DIV-PAYOUT) by the ratio
of cash dividends to earnings net of discretionary accruals. Different industries with more flexible
GAAP can enable the managers of the relevant companies to manage accruals to a greater extent,
so industry flexibility (FLEXIBILITY) is included in equation (4). This control variable is
measured by Jan as the root mean squared error of the regression used to estimate the firm-year's
discretionary accruals. Finally, in order to control the overstated magnitude of the discretionary
accruals for firms with extreme operating cash flows using the modified Jones (1991) model, Jan

also includes the absolute value of operating cash flows scaled by lagged assets (IOCFI) in the
equation of IDACI. Table 8.1 (Jan, 2001) reports descriptive statistics, including the mean,
standard deviation, first quartile, median and third quartile for the control variables. There are
three annual observations for the sample of 304 firms and hence n equals to 912.
Table 8.1 Descriptive Statistics for Control Variables
Control Variable
CASLCOMP
STOCK
OPTIONS
CONVEXITY
LEVERAGE
DISTRESS
RD
RD X LEVERAGE
ANALYSTS
DIVERSIFICATION
FRGN-SALES
SIZE
DIV-Y IELD
STDEBT
CASHCY CLE
IDACIt-,
LIFO-RESERVE
DIVJAYOUT
FLEXIBILITY
IOCFl
Where:
Mean
0.39 1
0.591
0.195
0.018
0.4 13
0.123
0.017
0.005
3.21 1
0.422
0.187
9.130
0.021
0.228
57.563
0.019
0.013
0.275
0.198
0.113
Standard Deviation
0.325
1.531
0.489
0.05 1
0.220
0.135
0.030
0.010
0.805
0.506
0.206
1.181
0.019
0.230
91.081
0.046
0.025
0.620
0.121
0.079
First Quartile
0.144
0.010
0.000
0.000
0.258
0.037
0.000
0.000
2.996
0.000
0.000
8.370
0.006
0.043
19.715
0.016
0.000
0.000
0.129
0.070
Median
0.303
0.039
0.000
0.000
0.404
0.08 1
0.000
0.000
3.401
0.100
0.134
8.993
0.021
0.149
48.748
0.034
0.000
0.219
0.145
0.1 10
Third Quartile
0.532
0.181
0.056
0.000
0.556
0.154
0.019
0.007
3.738
0.790
0.343
9.904
0.030
0.343
92.404
0.067
0.015
0.475
0.245
0.152
- DERIVATIVES = notional amount of interest rate and foreign currency derivatives, scaled by lagged total assets. Data is obtained from the 1994-1996 Form 10-K filings received from EDGAR;
- JDACI = absolute value of discretionary accruals, i.e. regression residuals from equation (1); - CASH-COMP = salary and bonus compensation of CEO, scaled by lagged total assets; - STOCK = fair value of shares owned by CEO, scaled by lagged total assets;
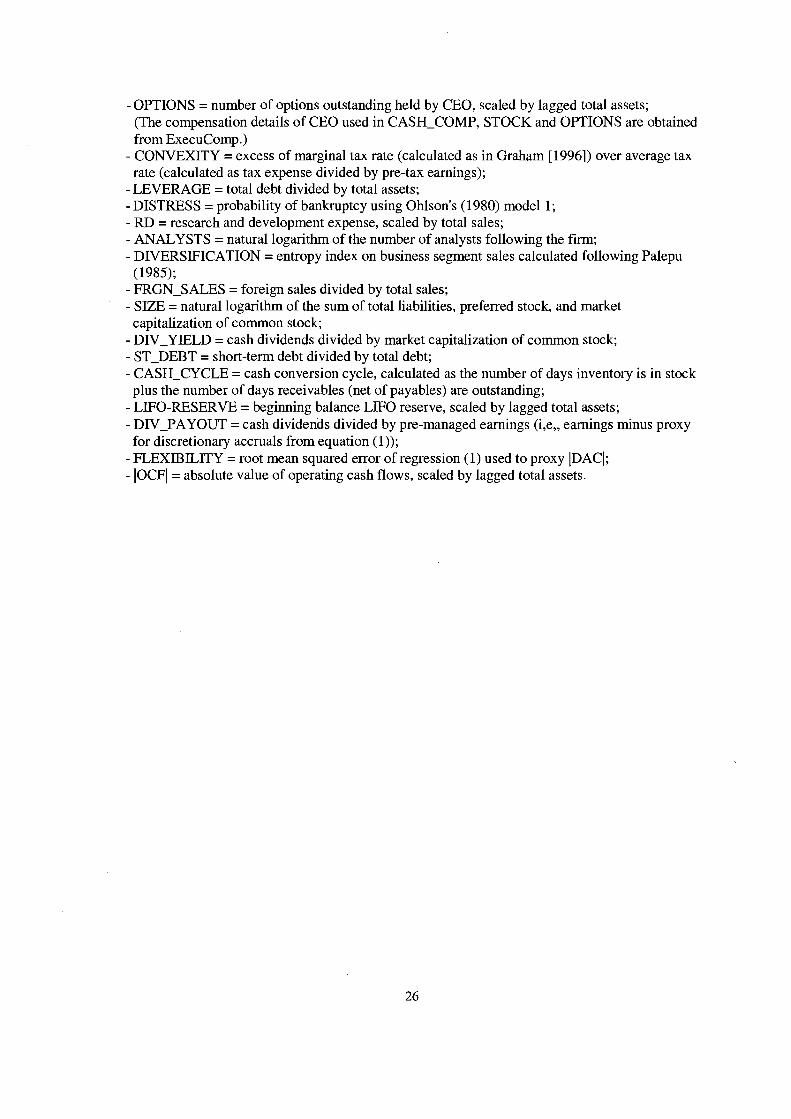
-OPTIONS = number of options outstanding held by CEO, scaled by lagged total assets; (The compensation details of CEO used in CASH-COMP, STOCK and OPTIONS are obtained from ExecuComp.)
- CONVEXITY = excess of marginal tax rate (calculated as in Graham [1996]) over average tax rate (calculated as tax expense divided by pre-tax earnings);
-LEVERAGE = total debt divided by total assets; -DISTRESS = probability of bankruptcy using Ohlson's (1980) model 1; - RD = research and development expense, scaled by total sales; - ANALYSTS = natural logarithm of the number of analysts following the fm; - DIVERSIFICATION = entropy index on business segment sales calculated following Palepu
(1985); - FRGN-SALES = foreign sales divided by total sales; - SIZE = natural logarithm of the sum of total liabilities, preferred stock, and market capitalization of common stock;
- DIV-YIELD = cash dividends divided by market capitalization of common stock; - ST-DEBT = short-term debt divided by total debt; - CASH-CYCLE = cash conversion cycle, calculated as the number of days inventory is in stock plus the number of days receivables (net of payables) are outstanding;
- LIFO-RESERVE = beginning balance LIFO reserve, scaled by lagged total assets; - DIV-PAYOUT = cash dividends divided by pre-managed earnings (i,e,, earnings minus proxy for discretionary accruals from equation (1));
- FLEXIBILITY = root mean squared error of regression (1) used to proxy IDACI; - lOCFl= absolute value of operating cash flows, scaled by lagged total assets.
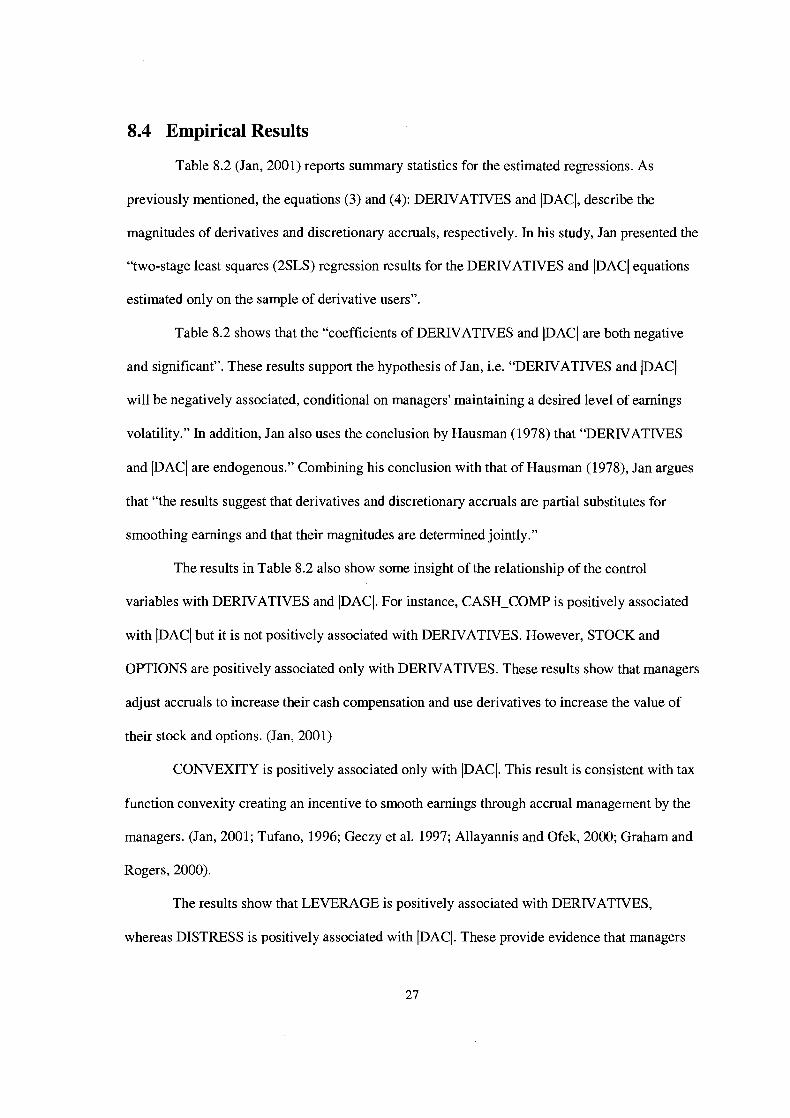
8.4 Empirical Results
Table 8.2 (Jan, 2001) reports summary statistics for the estimated regressions. As
previously mentioned, the equations (3) and (4): DERIVATIVES and IDACI, describe the
magnitudes of derivatives and discretionary accruals, respectively. In his study, Jan presented the
"two-stage least squares (2SLS) regression results for the DERIVATIVES and IDACl equations
estimated only on the sample of derivative users".
Table 8.2 shows that the "coefficients of DERIVATIVES and 1DACI are both negative
and significant". These results support the hypothesis of Jan, i.e. "DERIVATIVES and IDACJ
will be negatively associated, conditional on managers' maintaining a desired level of earnings
volatility." In addition, Jan also uses the conclusion by Hausman (1978) that "DERIVATIVES
and IDACl are endogenous." Combining his conclusion with that of Hausman (1978), Jan argues
that "the results suggest that derivatives and discretionary accruals are partial substitutes for
smoothing earnings and that their magnitudes are determined jointly."
The results in Table 8.2 also show some insight of the relationship of the control
variables with DERIVATIVES and IDACI. For instance, CASH-COMP is positively associated
with IDACl but it is not positively associated with DERIVATIVES. However, STOCK and
OPTIONS are positively associated only with DERIVATIVES. These results show that managers
adjust accruals to increase their cash compensation and use derivatives to increase the value of
their stock and options. (Jan, 2001)
CONVEXITY is positively associated only with IDACI. This result is consistent with tax
function convexity creating an incentive to smooth earnings through accrual management by the
managers. (Jan, 2001; Tufano, 1996; Geczy et al. 1997; Allayannis and Ofek, 2000; Graham and
Rogers, 2000).
The results show that LEVERAGE is positively associated with DERIVATIVES,
whereas DISTRESS is positively associated with IDACI. These provide evidence that managers

use derivatives and discretionary accruals to lower debt financing costs by reducing creditors'
perception of firm risk. (Jan, 2001)
The positive association between RD and (DACI suggests that R&D-intensive firms are
more likely to have large discretionary accruals. On the other hand, since RD* LEVERAGE is
positively associated with DERIVATIVES, it shows that firms with significant investment
opportunities, together with costly external financing, are more likely to benefit from hedging.
(Jan, 2001)
ANALYSTS is positively associated with DERIVATIVES. This suggests that for those
firms who have larger analyst following, it is more probable that the managers use derivatives.
(Jan, 2001)
Since DIVERSIFICATION is only negatively associated with IDACI, it suggests that
diversified f m s have relatively small discretionary accruals. Additionally, FRGN-SALES is
positively associated with DERIVATIVES. This result is consistent with the argument that
managers use derivatives to hedge foreign exchange rate risk generated from international
diversification. (Jan, 2001)

Table 8.2 Regression Results for Self-section Simultaneous Equations
Variables PAC1
DERIVATIVES CASH-COMP
STOCK OPTIONS
CONVEXITY LEVERAGE DISTRESS
RD RD*LEVERAGE
ANALYSTS DIVERSIFICATION
FRGN-SALE SIZE
DIV-YIELD ST-DEBT
CASH-CYCLE lDAClt-l
LIFO-RESERVE DIV-PAYOUT FLEXIBILITY
IOCFI MILLS
Expected Sign
DERIVATIVES Standardized
Coefficient -0.347
t-stat. -9.634
PAC1 Standardized
Coefficient t-stat.

9 TESTING THE HYPOTHESIS OF JAN (2001) WITH DIFFERENT DATA
9.1 Introduction
The goal of our following empirical research is primarily to test Jan's conclusion using
another set of data and sample companies. Since SFAS No. 133 was issued and required to be
adopted by public companies in the US, there has been much controversy regarding its impact on
companies' earnings volatility. One of the major concerns is that it will increase the earnings
volatility and hence will affect investors' perceptions on companies' risks. However, as Jan
shows in his study, since the use of derivatives and accrual management is negatively correlated,
managers can actually use derivatives as partial substitutes of accruals to smooth their firms'
earnings. Jan only provides evidence to his argument using the data of the sample companies for
the period 1994-1996, i.e. before SFAS No. 133 was issued. We intend to test whether his
argument is also supported by data of different companies after the above regulation was issued.
Further research with similar methods and purposes is also suggested by Jan at the end of his
study. Therefore, we conducted our empirical research using the simultaneous equations designed
by Jan and the 2000-2002 data of a sample of 120 S&P 500 companies to testify whether there is
also a negative correlation between the use of derivative and accrual.
9.2 The Sample
We selected our sample from S&P 500 firms. As shown in Table 9.1, we firstly exclude
134 firms in financial services or regulated industries. Among the remaining companies, the ones
that are owned by foreign corporations, had missing data or did not use financial derivatives
consistently during 2000-2002 are also excluded from our sample. As a result, the total number of
companies in our sample is 120.

Table 9.1 Sample Selection
Companies included in S&P 500 lists
Less: Firms in financial services or regulated industries (134)
Less: Firms that are foreign-owned, with missing information or not consistent use of derivatives during 2000-2002 (246)
Total firms in sample 120

Table 9.2 Sample Descriptive Statistics (Million US Dollars)
Variable Total asset EBIT Sale Net income Gross property, plant, equipment Account receivable Account payable Total current liability Total Liability Depreciation Earning per share Common equity Cash dividends Cash from operation Receivable turnover Inventory turnover Days to pay account payable Average collection period Cash turnover Derivative
Mean 14,787.73 1,325.66
11,513.98 527.81
5,667.30
1,720.74 1,187.34 4,665.25
10,276.40 589.04
1 .56 4,453.55
323.69 1,354.64
13.94 15.95 63.38 57.84 51.51
108.94
Standard Deviation 27,375.79 2,733.22
20,394.08 1,821.52
10,203.96
3,758.63 2,846.62
18,95 1.05 23,384.03
996.35 1.82
7,603.51 71 1.78
2,846.64 24.80 21.01
131.96 57.02 73.32
227.64
First Quartile 3,206.99
298.00 2,964.00
109.62 852.72
36 1.73 183.97 709.20
1,946.37 150.32
0.78 1,201.70
5 1.49 341.73
5.22 4.05
29.52 34.68 10.19 22.72
Median 7,138.00
692.00 6,272.00
324.64 2,075.00
745.99 456.00
1,514.70 4,552.00
301.30 1.45
2,4 10.00 127.55 728.39
6.95 6.96
41.62 51.78 29.60 54.00
Third Quartile 16,047.30 1,397.00
11,856.00 7 14.00
7,046.00
1,449.15 1,168.00 3,639.00
10,156.90 723.00
2.49 5,600.00
334.63 1,566.00
10.38 18.20 58.07 67.86 59.38
124.40
9.3 Measurement of Derivative Use and Accrual Management and Relevant Data
9.3.1 Measurement of Derivative Use
We use the same measures in Jan's study for the use of derivatives (DERIVATIVES).
We obtain the disclosed notional amount of interest rate and foreign currency derivatives from the
2000-2002 Form 10-K filings retrieved from EDGAR through SEC's website. Then the
derivatives are scaled by lagged total assets. The other financial data of the sample f m s are also
obtained from the Standard and Poor's CompuStat Database. The descriptive statistics of all the
financial information obtained from CompuStat are reported in Table 9.2. Similar to the method
of Jan, we also use three annual observations of the 120 sample companies, including the mean,
standard deviations, first quartile, median and the third quartile of the various financial
information of the sample firms. Except for "Earnings per share", the unit of which is US dollars,

and for "Receivable turnover", "Inventory turnover", "Days to pay account payable", "Average
collection period" and "Cash turnover", the unit of which is days, all the other financial data are
measured with the unit of million US dollars. Table 9.2 shows that most of the firms in our
sample have relatively large levels of assets, debt, cash flows and sales. Therefore, it is likely that
these firms tend to use derivatives as a feasible alternative to accruals to manage the firms'
earnings volatility.
9.3.2 Measurement of Accrual Management
Our measurement of accrual management of the sample firms is also the same as that
used by Jan using equation (1) to develop a proxy. The equation and its variables are explained in
detail in Section 8.2.3 above.

9.4 Our Hypothesis and Empirical Design
9.4.1 The Hypothesis
As we mentioned above, we intend to test whether Jan's hypothesis is also supported by
the data of our sample companies for the period 2000-2002, the period when SFAS was issued
and required to be implemented by public companies in the US. As such, our hypothesis is the
same as that of Jan, i.e. "DERIVATIVES and IDACl will be negatively associated, conditional on
managers' maintaining a desired level of earnings volatility."(Jan, 2001)
9.4.2 The Empirical Design
We also adopted the following basic simultaneous equations designed by Jan to further
test his hypothesis in our research.
DERIVATIVESil = yo +yllDACIit +y'CONTROLS it + E it ( 5 )
and
IDACl it, = &, ++3LlDERIVATIVES it, +XCONTROLS it + 6 it (6)
However, due to the lack of necessary information and data, the control variables in our
equations do not include all those used by Jan. Most of the financial data are from the CompuStat
Database and the information regarding the executive's compensation is obtained from the
ExecuComp Database.
The Simultaneous Equations and Common Control Variables
The simultaneous equation used in our research for DERIVATIVES and (DACI are:
DERIVATIVES it =yo +yllDACI it +y2CASH-COMP it +y3STOCK it +y40PTIONS it +y5LEVERAGE it +y6DISTRESS it +y7RD it +ys (RD*LEVERAGE) it +y9FRG-SALES it +yloSIZE it
+yllDIV-YIELD it +y12ST-DEBT it +y13CASH-CYCLE it + E i t (7)

IDAC(it =b +IIDERIVATIVES it +h2CASH-COMP it +?qSTOCK it +h40PTIONS it +&LEVERAGE it +&DISTRESS it +h7RD it +A8 (RD*LEVERAGE) it + bFRG-SALES it +hlolDACI it-1
+I1lDIV-PAYOUT it + i: it (8)
In the equations used in our research, the common variables include: CASH-COMP,
STOCK, OPTIONS, LEVERAGE, DISTRESS, RD, RD*LEVERAGE and FRG-SALES,
The variables CASH-COMP, STOCK and OPTIONS are exactly the same as those used by Jan
in the equations (3) and (4) and they are also scaled by the respective company's lagged total
assets in our study. We expected that CASH-COMP and STOCK are positively correlated with
derivative use and accrual management.
We also measured the variable LEVERAGE as the debt-to-asset ratio of the company.
Since highly levered firms need to smooth earnings to reduce creditors' perception of fm risk, it
is expected that this variable is positively associated with derivative use and accrual management.
Our measurement of DISTRESS, i.e. the financial distress of the company, is different
from that used by Jan. We used the "Z-Score" which is a measure of bankruptcy probability
obtained from CompuStat Database as the proxy of financial distress. We predicted that
DISTRESS is also positively associated with derivative use and accrual management.
The variable RD is also included in our equations measured as ratio of research and
development expense to total sales. We expected that RD is positively associated with derivative
use and accrual management. We also expected the interaction between RD and LEVERAGE is
positively associated with derivative use and accrual management (Geczy et al. 1997; Graham
and Rogers, 2000).
Finally, we included in both the equations the ratio of foreign sales to total sales
(FRGN-SALES) to measure the company's exposure to foreign exchange rate risk. We expected
that this variable is positively associated with derivative use and accrual management.

Variables to Identify the Simultaneous Equations
In the equation for DERIVATIVES, i.e. equation (3, we also included variables to
control for firm size (SIZE), dividend yield (DIV-YIELD), debt maturity (ST-DEBT), and cash
cycle (CASH-CYCLE). The measurements are also the same as those used by Jan in his study.
Since larger firms with scale economies are more likely to find derivatives to be cost effective
(e.g., Tufano, 1996; Geczy et al. 1997; Allayannis and Ofek, 2000), so we predicted that firm size
(SIZE) is positively correlated with derivative use. We also predicted that dividend yield
(DIV-YIELD) is positively associated with derivative, because large expected dividend yields
increase the firm's needs for cash and hence gives the managers incentives to hedge (Graham and
Rogers, 2000). According to some studies such as Visvanathan (1998), firms with shorter debt
maturity are more likely to use interest rate swaps. Therefore, we expected that short maturity
debt (ST-DEBT) is positively associated with derivative use.
In our equation for IDACI, the variables include those to control for accrual reversals
(lagged value of IDAC)) and dividend payout rate (DIV-PAYOUT). The measurement of these
variables is the same as that used by Jan. We estimated that the dividend payout rate is negatively
associated with accrual management. Table 9.3 reports the descriptive statistics for the control
variables, including the mean, standard deviation, first quartile, median and third quartile for the
control variables. As previously mentioned, we use three annual observations of the 120 sample
companies.

Table 9.3 Descriptive Statistics for Control Variables
Descriptive Statistics for Control Variables (n=360)
Control Variable
CASH-COMP
STOCK
OPTION
LEVERAGE
DISTRESS
RD
RD*LEVERAGE
FRGN-SALES
SIZE
DIV-YIELD
ST-DEBT
CASH-CYCLE
IDACIt.1
DIV-PAYOUT
Where:
Mean
0.366
0.887
0.256
0.620
4.750
0.094
0.507
0.585
8.938
0.051
0.416
51.519
0.052
0.289
Standard Deviation
0.368
1.787
0.552
0.192
8.242
0.250
1.555
1.199
1.084
0.524
0.216
73.422
0.108
0.952
First Quartile
0.112
0.1 19
0.036
0.5 11
1.698
0.012
0.044
0.116
8.073
0.023
0.245
10.193
0.016
0
Median
0.230
0.296
0.087
0.640
2.820
0.034
0.094
0.267
8.873
0.048
0.377
29.597
0.03 1
0.242
Third Quartile
0.464
0.841
0.249
0.738
4.480
0.065
0.287
0.485
9.683
0.079
0.511
59.396
0.057
0.466
- DERIVATIVES = notional amount of interest rate and foreign currency derivatives, scaled by lagged total assets. Data is obtained from the 2000-2002 Form 10-K filings received from EDGAR;
- IDACl = absolute value of discretionary accruals, i.e. regression residuals from equation (1); - CASH-COMP = salary and bonus compensation of CEO, scaled by lagged total assets; - STOCK = fair value of shares owned by CEO, scaled by lagged total assets; - OPTIONS = number of options outstanding held by CEO, scaled by lagged total assets; - The compensation details of CEO used in CASH-COMP, STOCK and OPTIONS are obtained
from ExecuComp. - LEVERAGE = total debt divided by total assets; - DISTRESS = measure of bankruptcy using Z-score as a proxy; - RD = research and development expense, scaled by total sales; - FRGN-SALES = foreign sales divided by total sales; - SIZE = natural logarithm of the sum of total liabilities, preferred stock, and market
capitalization of common stock; - DIV-YIELD = cash dividends divided by market capitalization of common stock;

- ST-DEBT = short-term debt divided by total debt; - CASH-CYCLE = cash turnover days; and - DIV-PAYOUT = cash dividends divided by pre-managed earnings (i.e. earnings minus proxy
for discretionary accruals from equation (I)).

9.5 Empirical Results
Table 9.4 reports the results of our estimated regressions using equations (5) and (6)
which describe the magnitudes of derivatives and discretionary accruals respectively. In our
research, we ran the least square regressions using the sample of derivative users.
Table 9.4 Regression Results for Self-section Simultaneous Equations
PAC1
DERIVATIVES
CASH-COMP
STOCK
OPTIONS
LEVERAGE
DISTRESS
RD
RD*LEVERAGE
FRGN-SALES
SIZE
DIV-YIELD
ST-DEBT
CASH-CYCLE
(DAClit-I
DIV-PAYOUT
DERIVATIVES
Standardized Coefficient
-0.447 t-stat
-6.54
-0.336
2.098
3.031
2.348
-0.343
- 1.676
1.650
4.872
-0.540
2.338
1.552
3.980
Standardized Coefficient t-stat
-7.658
2.543
0.068
0.898
1.785
0.921
1.634
0.597
0.344
Table 9.4 also shows that the "coefficients of DERIVATIVES and (DACJ are both
negative and significant", which is consistent with Jan's conclusion in his study. As such, using
the 2000-2002 data for the 120 S&P companies, our research also supports Jan's hypothesis that
39

the use of derivative and accrual management are negatively correlated. If also combined with the
conclusion in Hausman (1978) that "DERIVATIVES and IDACl are endogenous," our research
also suggests that "derivatives and discretionary accruals are partial substitutes for smoothing
earnings, and that their magnitudes are determined jointly."
Some of the other coefficients shown in Table 9.4 also reflect consistency of our
conclusion with Jan's. According to Jan, "the results provide further insight into how managers of
firms that use derivatives might combine risk and earnings management strategies to achieve their
goals". For instance, contrary to our expectations, the regression result presents a negative
correlation between CASH-COMP and DERIVATIVES. STOCK and OPTIONS are positively
associated only with DERIVATIVES. Accordingly, these findings also support Jan's argument
in his study that "these results are consistent with managers adjusting accruals to increase their
cash compensation and using derivatives to increase the value of their stock and options." (Jan,
2001)
There are positive correlations between LEVERAGE and DERIVATIVES but there is
not a significant correlation between DISTRESS and DERIVATIVES or IDACl in our results.
However, in Jan's regression results, he obtained a positive association between DISTRESS and
IDACJ. This is not surprising because we used different variable to measure the financial distress
of the companies.
We also obtain a positive association between RD and IDACI. Therefore, it also supports
Jan's argument that the firms with intensive research and development are more likely to have
large discretionary accruals. We can also concludes from the positive correlation between RD*
LEVERAGE and DERIVATIVES that firms with significant investment opportunities, together
with costly external financing, are more likely to benefit from hedging. (Jan, 2001)
Again, the result in Table 9.4 shows that FRGN-SALES is positively associated with
DERIVATIVES. Hence it is consistent with the argument that managers use derivatives to hedge
foreign exchange rate risk because of international diversification. (Jan, 2001)

For the variables to control DERIVATIVES, SIZE, which is measured as a proxy to the
company's scale, is not found to have a significant association with DERIVATIVES. Consistent
with our expectation and result obtained by Jan, DIV-YIELD is positively associated with
DERIVATIVES, suggesting that large expected dividend yields give the managers incentives to
hedge (Graham and Rogers, 2000). Similarly, ST-DEBT is also proved to be positively
associated with DERIVATIVES. Finally, CASH-CYCLE has a positive correlation with
DERIVATIVES, consistent with the argument that companies having a long cash turnover period
tend to use more derivatives.
For the control variables for IDACI, the variables to control for accrual reversals (lagged
value of JDACI) are positively associated with IDACl and DIV-PAYOUT has a negative
association with (DACI.

10 CONCLUSION
Derivative contracts basically depend on interest rates, currencies, indexes, and
commodities, and as such result in real cash obligations or rewards. A balance sheet that does not
include them is sorely incomplete. After more than five years of studying possible alternatives,
considering input from constituents, and compromising, FASB has published new accounting
standards for derivatives and hedging activities. The new requirements will increase visibility,
comparability, and understandability of the risks associated with derivatives since they all will be
reported at fair value as assets or liabilities. Inconsistency and incompleteness of previous
accounting guidance should be reduced since the new approach provides comprehensive guidance
for all derivatives and hedging activities.
Although the new accounting standard does not completely resolve the previous
problems, it presents great improvement over the previous accounting standards. SFAS No. 133
offers a more objective criterion of hedge accounting and more consistent, visible, as well as
complete accounting approach for derivative over previous accounting. There is no need to
recognize deferred or realized gains or losses as liabilities or assets. It becomes easier to
determine what qualifies as a hedge. The new accounting standard also promotes the matching
principle and reduces the potential of window-dressing. Lastly, it provides a more comprehensive
definition of and a unique measurement method for derivatives.
It is true that SFAS No. 133 creates new problem. However, the extent that these
problems would adversely affect the assessment of financial statement users should not be
exaggerated. Research suggests that the assessment of financial statement users would not easily
be misled by the earning volatility caused by such accounting changes. Even though earning

volatility may affect managers' hedging decisions, this problem may be resolved by revising the
managers' compensation package. Although the compliance cost is considerable, it is
compensated by the benefits of more credible and understandable information. Also, financial
statement users may not be easily misled by the reporting of a hedge item between historical cost
and fair value. In addition, that the new accounting standard cannot accommodate all hedging
strategies is apprehensible. Lastly, it is justifiable that the new accounting standard has different
treatment of the some financial instrument or transaction. As a result, though not perfect, SFAS
No. 133 does offer better accounting for free-standing derivatives.
Based on the empirical research conducted in Jan (2001), we test his hypothesis that the
use of derivatives, i.e. DERIVATIVES, and discretional accounting accruals, i.e. JDACI, are
negatively correlated using the data of 120 S&P 500 companies for the period from 2000 to 2002.
We used the equations designed by Jan and the result of our research also supports a negative
correlation between the above variables. As such, as concluded by Jan, derivatives and accruals
can be used as partial substitutes by managers to smooth the earnings volatility of their
companies.

REFERENCES
Alex, J. P. (2004). No Accounting for Hedge. Barron's Chicop. (November). V84: 39.
Allayannis, G., and E. Ofek. (2000). Exchange rate exposure, hedging, and the use of foreign currency derivatives. Working paper. New York University, New York, NY.
Andrew 0 . (2000). Good Morning, Volatility. CFO Magazine (September).
Arlette, C. W., and R. H., Rasch (1998). NEW ACCOUNTING FOR DERIVATIVES AND HEDGING ACTIVITIES. A new standard takes root. The CPA Journal (October).
Ashley, L., and R., Bliss. (1999). Financial Accounting Standard No. 133. The Reprieve Chicago Fed Letter. V143: 1-4.
Baber, W. R., P. M., Fairfield, and J.A. Haggard. (1991). The effect of concern about reported income on discretionary spending decisions. The case of research and development. The Accounting Review 66 (October): 818-829.
Balsam, S. (1998). Discretionary accounting choices and CEO compensation. Contemporary Accounting Research 15 (Fall): 229-252.
Barth, M. E., J. A. Elliott, and M. W. Finn. (1999). Market rewards associated with patterns of increasing earnings. Journal of Accounting Research 37 (Autumn): 387-413.
Beier, R. J. 1995. Accounting For Derivatives: 2.
Carpenter, J. E. (1996). Current Issues in Accounting for Derivative. The Journal of Derivatives (Spring): 65-7 1.
Dechow, P. M., R. G., Sloan, and A. P., Sweeney, (1995). Detecting earnings management. The Accounting Review 70 (April): 193-225.
Demarzo, P. M., and D. Duffie (1998). Corporate Incentives for Hedging and Hedge Accounting. Review of Financial Studies. V8n3: 734-77 1.
FASB. (1996). Current Issues in Accounting for Derivatives. The Journal of Derivatives (Spring): 65-7 1.
FASB. (1997). Accounting for Derivative Instruments and Hedging Activities, Statement No. 133.
Gaver, J. J., K. M. Gaver, and J. R. Austin. (1995). Additional evidence on bonus plans and income management. Journal of Accounting and Economics 19 (February): 3-28.

Geczy, C. B., A. Minton, and C. Schrand. (1997). Why firms use currency derivatives. The Journal of Finance 52 (September): 1323- 1354.
Graham, J. R. (1996). Proxies for the corporate marginal tax rate. Journal of Financial Economics 42 (October): 187-221.
Graham, J. R., and D. A. Rogers. (2000). Do firms hedge in response to tax incentives? Working paper. Duke University, Durham, NC
Hausman, J. A. (1978). Specification tests in econometrics. Econometrica 46 (November): 1251- 1271.
Hunt, A., S. E., Moyer, and T. Shevlin. (1996). Managing interacting accounting measures to meet multiple objectives: A study of LIFO firms. Journal of Accounting and Economics 21 (June):339-374.
Jan, B. (2001). Does the use of Financial Derivatives Affect Earnings Management Decisions? The Accounting Review (January): 1-26.
Johnson, N. S. (1999). Current SEC developments-"Managed earnings" and "The year of the accountant," Remarks delivered at the Utah State Bar Mid-Year Convention, St, George, UT. March 6. Securities and Exchange Commission. Available at http://www.sec.gov/news/speeches/spch264.txt.
Jones, J, J. (1991). Earnings management during import relief investigations. Journal of Accounting Research 29 (Autumn): 193-228.
Myers, L. A., and D. J., Skinner. (1999). Earnings momentum and earnings management. Working paper, University of Michigan, Ann Arbor, MI.
Ohlson, J. A. (1980). Financial ratios and the probabilistic prediction of bankruptcy. Journal of Accounting Research 18 (Spring): 109-13 1.
Palepu, K. (1985). Diversification strategy, profit performance and the entropy measure. Strategic Management Journal 6 (July-September): 239-255.
Rasch, R. H., and A.C. Wilson (1998). New accounting for derivatives illustrated. CPA Journal (November) V68: 56.
Raymond, E. P. (1997). Accounting for derivatives. Irwin Professional Publishing.
Smith, C. W., and R. M. Stulz. (1985). The determinants of firms' hedging policies. Journal of Financial and Quantitative Analysis 20 (December): 39 1 -405.
Smith, G. R., and A. C. Wilson (1999). New Accounting for derivatives and Hedging Activities. Does it Result in Improved Accounting? The Journal of Lending and Credit Risk Management: 45-5 1.
Tufano, P. (1996). Who manages risk? An empirical examination of risk management practices in the gold mining industry. The Journal of Finance 51 (September): 1097-1 137.

Visvanathan, G. (1998). Who uses interest rate swaps? A cross-sectional analysis. Journal of Accounting, Auditing, and Finance 1 3 (Summer): 173-200.
Woodward et al. (1996). FASB 119 Derivative Financial Instruments: Disclosure & Fair Value. Notional Public Accounting.