accidental releases analysis for toxic aqueous solutions
TRANSCRIPT

Environmental solutions delivered uncommonly well
Accidental Releases Analysis for Toxic Aqueous Solutions
Paper No. 98-TP50A.05
Prepared By:
Hung-Ming (Sue) Sung, PhD, PE ▪ Director - Quality & Technology
TRINITY CONSULTANTS 12700 Park Central Drive
Suite 2100 Dallas, TX 75251
+1 (972) 661-8881 trinityconsultants.com
June 1998

1
ABSTRACT As a result of the cluster rule for the control of the hazardous air pollutants, pulp and paper mills are in the process of further substituting chlorine with aqueous chlorine dioxide for their bleaching operations. In addition, ammonia aqueous solutions are applied by paper mills in various processes. An evaporation model including both heat and mass transfer for aqueous solutions has been developed to quantify chemical evaporation rates. Chemical and physical properties for chlorine dioxide and ammonia aqueous solutions have been analyzed to allow plants to perform a dynamic analysis for various accidental release scenarios. This paper provides a detailed discussion of the methodologies for quantifying source parameters and modeling downwind concentrations from liquid spills of chlorine dioxide and ammonia aqueous solutions.
INTRODUCTION Under 40 CFR Part 68, a process, which stores or handles an aqueous solution with a concentration greater than or equal to the de minimis concentration and a total quantity greater than or equal to the threshold quantity, is regulated by the Risk Management Program (RMP) Rule. Chlorine dioxide (ClO2) and ammonia (NH3) aqueous solutions are commonly applied in pulp and paper mills. The de minimis concentration for ClO2 and NH3 are 1% and 20% by weight, respectively; while the threshold quantity for ClO2 and NH3 are 1,000 lb and 20,000 lb, respectively.
The Off-Site Consequence Analysis Guidance1 (OCA Guidance) provides a simple mass transfer method for calculating evaporation rates from liquid spills. During a spill of a toxic aqueous solution, the evaporation rate of the toxic chemical is a function of many variables, such as liquid pool temperature, vapor pressure, solution concentration. Studies2,3 have shown that both mass and heat transfer mechanisms must be considered in the calculation method in order to accurately quantify evaporation rates. As the key input parameters to the subsequent dispersion modeling, accurate evaporation rates will lead to accurate downwind concentrations to determine a reasonable impact radius . Therefore, a heat and mass transfer model has been developed in this study to better quantify evaporation rates for spills of the ClO2 and NH3 aqueous solutions. This paper provides a complete overview of the modeling methodologies for the two aqueous solutions.
SOURCE PARAMETERS In the RMP rule, the basic definition of the worst case release scenario provides general guidance for the determination of source parameters. For a toxic liquid, the worst case scenario is defined as:
“…the quantity in the largest vessel or pipe is spilled instantaneously to form a liquid pool. The surface area of the pool shall be determined by assuming that the liquid spreads to 1 centimeter deep unless passive mitigation systems are in place that serve to contain the spill and limit the surface area……The volatilization rate shall account for the highest daily maximum temperature occurring in the past three years, the temperature of the substance in the vessel, and the concentration of the substance if the liquid spilled is a mixture or solution.”

2
To conduct an accidental release analysis at a pulp bleaching facility, the largest storage tank for a ClO2 aqueous solution (aq) is typically over 100,000 gallons. The ClO2(aq) is normally chilled under 10 °C with a concentration lower than 15 grams per liter (g/L) or 1.5% by weight. ClO2(aq) storage tanks are normally placed near the bleaching process, which is confined with other structures. Therefore, a ClO2(aq) release is normally contained in a dike (confined) area to reduce the evaporation surface. In a paper mill, NH3(aq) storage tanks are typically smaller than those for ClO2(aq) and are not chilled (i.e., ambient temperature). A typical concentration of NH3(aq) is 29% by weight.
Chemical/Physical Properties Evaporation rates for a chemical contained in an aqueous solution are calculated based on the chemical/physical properties of the chemical/water mixture. The first key parameter for evaporation rate calculations is the partial vapor pressure of a chemical over the aqueous solution at different concentrations and temperatures. An equation for calculating the partial vapor pressure of ClO2 above solutions at variable temperatures is shown as follows:4
( )TClOClO eCP
3102717.10
225.7 −××= (1)
where
PClO2 = partial vapor pressure of ClO2 (mm-Hg)
CClO2 = ClO2 concentration in water (g/L)
T = absolute temperature (K)
For NH3(aq), the partial vapor pressure data5 for mixtures with a NH3 concentration less than 30% and a temperature less than 25 °C are best fit by the following equation:
( ) ( )33
526.10263.5254.10072.0736.51 NHCNH eTP ×
×−××= (2)
where
PNH3 = partial vapor pressure of NH3 (mm-Hg)
CNH3 = NH3 molar fraction in water
In addition, liquid densities and heats of vaporization for NH3(aq) as functions of temperatures and concentrations are also derived or obtained based on data contained in Perry’s Chemical Engineers’ Handbook.5 Other applicable chemical/physical properties for NH3 and ClO2 aqueous solutions are available in References 5 and 6, respectively.
Evaporation Rates The Off-Site Consequence Analysis Guidance4 (OCA Guidance) uses a method modified from the approach developed by Mackay and Matsugu.7 The evaporation rate by this simple mass transfer method is shown as follows:
T 82.05P A M U 0.284
= E v0.78
××××× 3
2
(3)

3
where:
E = evaporation rate (lb/min)
U = wind speed (m/sec)
M = molecular weight (lb/lb-mol)
A = surface area of pool (ft2)
Pv = vapor pressure (mm-Hg)
The OCA Guidance methods can be applied as a screening approach for calculating evaporation rate from a liquid spill pool. For refined evaporation rate calculations, a heat and mass transfer model has been developed in this study that applied a modified version of the Surface Temperature (Ts) method developed by Kawamura & Mackay.2 The evaporation rate applied by this method is based on the original Mackay and Matsugu7 approach shown as follows:
TRPMk
E v×××
= (4)
where
k = mass transfer coefficient (m/h)
M = molecular weight (g/gmol)
Pv = vapor pressure (Pa)
R = gas constant (Pa m3/mol K)
To calculated evaporation from an aqueous solution spill, both liquid phase and gas phase mass transfer were evaluated. During the first hour after a spill, the mass transfer from the surface is much slower than the mass transfer through the bulk liquid since the chemical concentration in the solution is high enough to assume that mass evaporated from the surface is replaced instantaneously with mass from the bulk liquid. In addition, liquid spills are normally drained to a sewer system before a quiescent pool can be formed. Therefore, the bulk liquid mass transfer coefficient is not included in this model. The surface mass transfer coefficient can then be calculated as follows:7
67.011.078.0029.0 −−Χ= ScUk (5)
where
U = wind speed at 10 meter height (m/h)
X = effective pool diameter (m)
Sc = Schmidt Number by Equation (6)
ABDSc ν= (6)
where
ν = kinematic viscosity of air (cm2/s)
4
DAB = chemical diffusivity in air (cm2/s)
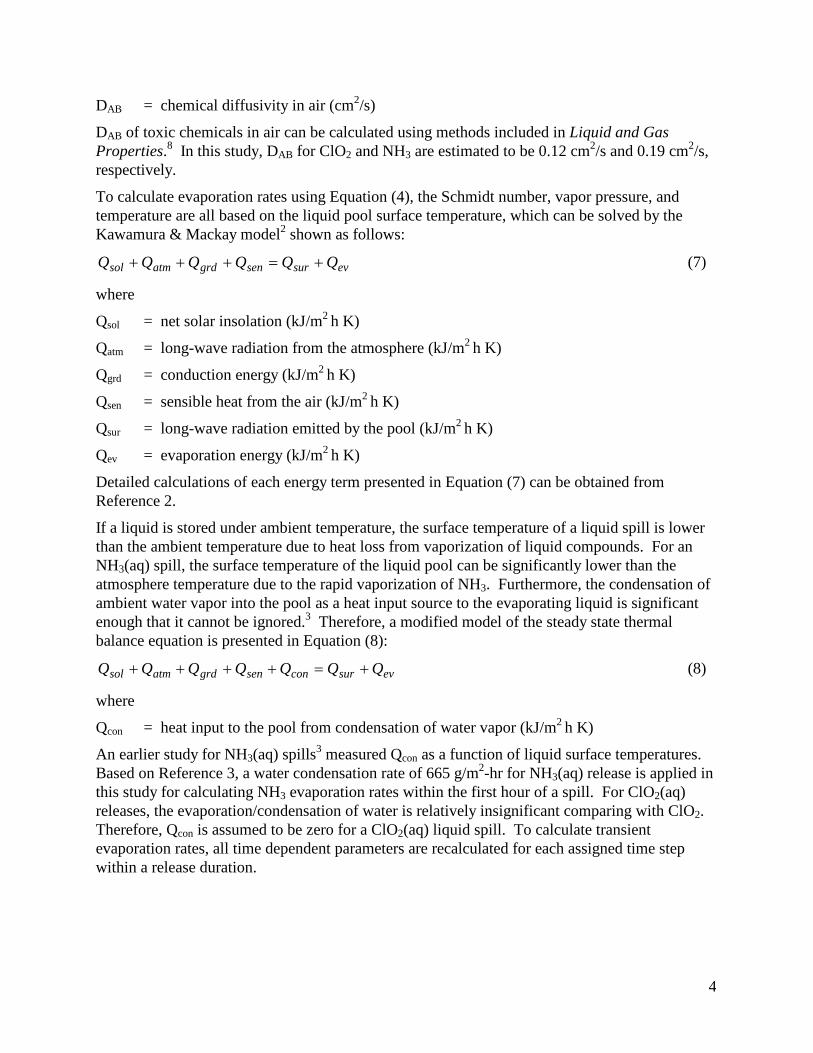
DAB of toxic chemicals in air can be calculated using methods included in Liquid and Gas Properties.8 In this study, DAB for ClO2 and NH3 are estimated to be 0.12 cm2/s and 0.19 cm2/s, respectively.
To calculate evaporation rates using Equation (4), the Schmidt number, vapor pressure, and temperature are all based on the liquid pool surface temperature, which can be solved by the Kawamura & Mackay model2 shown as follows:
evsursengrdatmsol QQQQQQ +=+++ (7)
where
Qsol = net solar insolation (kJ/m2 h K)
Qatm = long-wave radiation from the atmosphere (kJ/m2 h K)
Qgrd = conduction energy (kJ/m2 h K)
Qsen = sensible heat from the air (kJ/m2 h K)
Qsur = long-wave radiation emitted by the pool (kJ/m2 h K)
Qev = evaporation energy (kJ/m2 h K)
Detailed calculations of each energy term presented in Equation (7) can be obtained from Reference 2.
If a liquid is stored under ambient temperature, the surface temperature of a liquid spill is lower than the ambient temperature due to heat loss from vaporization of liquid compounds. For an NH3(aq) spill, the surface temperature of the liquid pool can be significantly lower than the atmosphere temperature due to the rapid vaporization of NH3. Furthermore, the condensation of ambient water vapor into the pool as a heat input source to the evaporating liquid is significant enough that it cannot be ignored.3 Therefore, a modified model of the steady state thermal balance equation is presented in Equation (8):
evsurconsengrdatmsol QQQQQQQ +=++++ (8)
where
Qcon = heat input to the pool from condensation of water vapor (kJ/m2 h K)
An earlier study for NH3(aq) spills3 measured Qcon as a function of liquid surface temperatures. Based on Reference 3, a water condensation rate of 665 g/m2-hr for NH3(aq) release is applied in this study for calculating NH3 evaporation rates within the first hour of a spill. For ClO2(aq) releases, the evaporation/condensation of water is relatively insignificant comparing with ClO2. Therefore, Qcon is assumed to be zero for a ClO2(aq) liquid spill. To calculate transient evaporation rates, all time dependent parameters are recalculated for each assigned time step within a release duration.

5
Example Calculations of Evaporation Rates Evaporation rates for example spills are calculated using both the OCA Guidance method and the modified Ts method. For the ClO2(aq) spill case, 100,000 gallons of ClO2 solution containing 10 g/L of ClO2, stored at less than 45 °F, was released into a 70 ft by 70 ft diked area. For the NH3(aq) spill case, 15,000 gallons of NH3 solution containing 29% (by weight) NH3 stored in an 8 feet diameter tank at ambient conditions is released to a 36 ft by 36 ft diked area.
The worst case meteorological parameters defined by the RMP rule (1.5 m/s wind, F stability class) and a typical ambient temperature of 25 °C (77 °F) are used in the calculations. Although F stability class conditions can only exist under a clear sky with very low solar insolation (i.e., night time period), a release time of 7:00 am (Eastern Standard Time 6:00 am) is selected for the demonstration of the Ts method. The time and location selected for calculations of the solar angle are the 180th Julian Day and Lansing, Michigan , respectively.
For each new time step, evaporation rates were recalculated based on heat and mass balances. Since the first hour evaporation is the worst hour for downwind exposure, all parameters were calculated for each 10-minute interval for the first hour of a spill. For each time step, the evaporation rate was recalculated using Equations (3) and (4) with new vapor pressures calculated using Equations (1) and (2). For NH3 aqueous spills, the OCA guidance provides an average first hour vapor pressure of 332 mm-Hg for a 30% NH3 aqueous solution. However, to demonstrate calculations for broader applications, time dependent evaporation rates are calculated using Equation (2). Using the Ts model, the liquid surface temperature is recalculated for each time step using the thermal balance method presented by Equation (8). In Equation (8), Qev, Qsen, Qsur, and Qgrd are functions of surface temperature, which was solved by an iterative approach using a spreadsheet. The spill temperature remains constant as the storage temperature when evaporation rates are calculated using the OCA guidance equation.
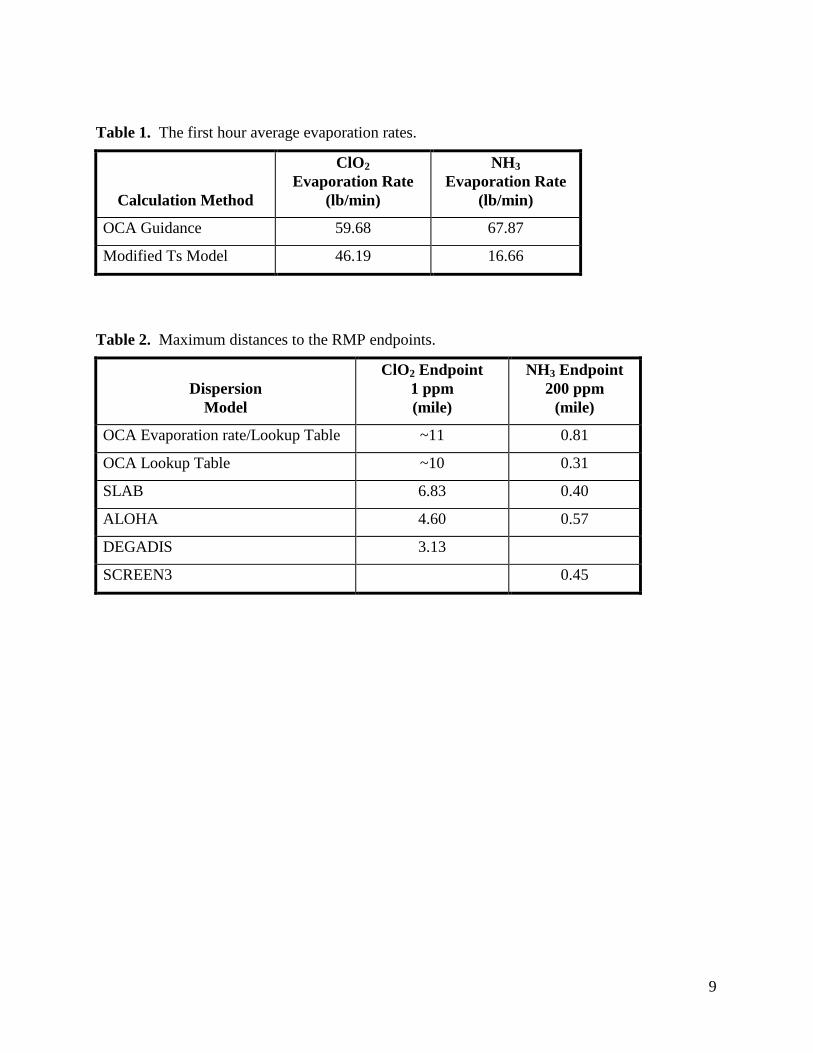
Table 1 summarizes the first hour average evaporation rates calculated by the two methods discussed above. Figures 1 and 2 illustrate the calculated time dependent evaporation rates for ClO2 and NH3, respectively.
For the ClO2 spill case, the OCA guidance allows evaporation rates be calculated based on the solution storage temperature (45 °F). However, the liquid pool surface temperatures increase with time since the ambient temperature is higher than the storage temperature. Based on the modified Ts model, the surface temperatures for the example spill initially dropped, then increased from 276 K to 289 K within the first hour of spill. As shown in Figure 1, the first hour average evaporation rate calculated by the modified Ts model is only slightly less than the rate calculated in accordance with the OCA guidance using the storage temperature.
For the NH3 spill case, the evaporation rates calculated using the OCA guidance are based on the ambient temperature (77 °F) since the aqueous solution is stored under ambient temperature. The modified Ts model calculated surface temperatures for the first hour to be approximately 272 K, which is consistent with temperatures observed by Reference 3. As a result of the low surface temperature, the evaporation rates calculated by the modified Ts model are significantly less than the rates calculated using the OCA guidance (see Figure 2).

6
DISPERSION MODELING ANALYSIS Based on the source parameters calculated above, various dispersion models may be applied to determine downwind concentrations caused by these spills. The vapor cloud behavior must be examined in order to select the most appropriate model. For the NH3 spill case, the evaporating NH3 vapor cloud is a neutrally buoyant release that can be modeled with models such as, SCREEN39, ALOHA10, and SLAB.11 For the ClO2 spill case, the evaporating ClO2 may be neutrally buoyant under turbulent atmospheric conditions; or may be heavier than the ambient air under a very stable condition. Therefore, the dense gas behavior of a ClO2 release must be evaluated for selecting an appropriate model to calculate downwind concentration. For a continuous vapor cloud from a ground level spill, the following Richardson Number (Ri) equation can be applied:12
5.0
2* 28.9
= −
uQ
uRi
i
i
a
aiρρ
ρρ (9)
where:
ρi = density of released material (kg/m3)
ρa = ambient air density (kg/m3)
Qi = mass emission rate (kg/s)
u = wind speed (m/s)
u* = friction velocity, usually 0.1×u (m/s)
The resulting Ri for the example evaluated above is 178, which indicates that the ClO2 release is slightly heavier than the ambient air under the slow wind condition and can be modeled as a dense gas release using DEGADIS13, ALOHA, and SLAB.
As a benchmark analysis, three dispersion models were applied to calculate downwind concentrations for each of the release cases. The NH3 release case was modeled by SCREEN3, ALOHA, and SLAB; while ClO2 release case is modeled by DEGADIS, ALOHA, and SLAB. The impact distances determined using the lookup table contained in the OCA Guidance are also included for comparison. For DEGADIS, ALOHA, and SLAB models, the example mill is modeled with a 0.2 meter surface roughness. The site was considered as a rural area for applying the SCREEN3 model and the OCA lookup tables. As defined in the RMP rule, the endpoints for ClO2 and NH3 are 1 ppm, and 200 ppm, respectively. The resulting maximum distances to the endpoints are summarized in Table 2.
For the ClO2 spill case, the distance of endpoint (DOE) determine by the OCA Guidance was greater than 10 miles. Using dense gas dispersion models with the evaporation rate calculated by the modified Ts model, the shortest DOE, 3.13 miles, was calculated by DEGADIS.
For the NH3 spill case, the DOE determine by applying the evaporation rate equation and lookup table contained in the OCA Guidance was approximately 0.8 miles. Using the evaporation rate calculated by the modified Ts model, the DOE determined by the OCA lookup table provided the shortest DOE, 0.31 mile. Using the three neutrally buoyant dispersion models with the

7
evaporation rate calculated by the modified Ts model, the shortest DOE, 0.40 mile, was calculated by SLAB.
SUMMARY The Risk Management Program rule requires modeling analysis for both worst case and more likely alternative release scenarios. The worst case scenarios are the major concern when the information is presented to the general public. Accurate source parameters will provide more reasonable impact distance. This paper presented various technical methods that can be applied to determine downwind concentrations from aqueous solution spills. A heat and mass transfer emission model has been developed to better quantify transient evaporation rates from aqueous solution spills. As a benchmark analysis, three dispersion models, all recognized by experts in the area, were applied to calculate the endpoint distances for each chemical spill case. All results are compared to the values obtained by applying the screening methods provided in the OCA Guidance. As shown, different methods and models can lead to significantly different results. Therefore, selecting the best approach that meets a mill’s specific needs is the key step to prepare a successful Risk Management Plan.
ACKNOWLEDGE The author would like to thank Mr. David Bryer of Mead Corporation for his suggestions and review of this paper.
REFERENCES 1. U.S. EPA, RMP Off-Site Consequence Analysis Guidance, U.S. Environmental Protection
Agency, Research Triangle Park, North Carolina, 1996.
2. Kawamura P., and Mackay, D., “The Evaporation of Volatile Liquids”, Journal of Hazardous Materials, pp. 343-364, Vol. 15, 1987.
3. Mikesell, J.L.; et al; “Evaporation of Contained Spills of Multicomponent Nonideal Solutions”, Proceedings of International Conference and Workshop on Modeling and Mitigating the Consequences of Accidental Releases of Hazardous Materials, CCPS of the AICHE, 1991.
4. Kirk-Othmer, Encyclopedia of Chemical Technology, 4th ed., Wiley, New York, 1991.
5. Perry, R.H.; Green, D.W.; Perry’s Chemical Engineers’ Handbook, 7th ed., McGraw Hill, New York, 1997.
6. Leach, J.; Chlorine Dioxide - Environmental and Technical Information, Beak Pacific Inc., prepared for Industrial Hazardous Chemical Handling Task Force and Council of Forest Industries, Canada, 1996
7. Mackay, D. and Matsugu, R., “Evaporation Rate of Hydrocarbon Spill on Water and Land”, Canadian Journal of Chemical Engineering, p. 434, Vol 5., 1973.
8. Reid, R. C., Prausnitz, J.M., and Poling, B.E., The Properties of Gases and Liquids, 4th ed., McGraw-Hill, New York, 1987.

8
9. U.S. EPA, SCREEN3 Model User’s Guide, EPA-454/B-95-004, U.S. Environmental Protection Agency, Research Triangle Park, North Carolina, 1995.
10. U.S. EPA, National Oceanic and Atmospheric Administration, Areal Locations of Hazardous Atmospheres, (ALOHA), Washington, D.C., National Safety Council, 1995.
11. Ermak, D.L, User’s Manual SLAB: An Atmospheric Dispersion Model for Denser-than-Air Release, Lawrence Livermore National Lab., Livermore, CA, 1990.
12. Havens, J. A., and Spicer, T. O. Development of an Atmospheric Dispersion Model for Heavier-than-Air Gas Mixtures. Report No. CG-D22-85 for the U.S. Coast Guard, Univ. of Arkansas, 1985.
13. Spicer, T. O., and Havens, J. A., User’s Guide for the DEGADIS 2.1 Dense Gas Dispersion Model, U.S. Environmental Protection Agency, Research Triangle Park, North Carolina, EPA-450/4-89-019, 1989.
9
Table 1. The first hour average evaporation rates.
Calculation Method
ClO2 Evaporation Rate
(lb/min)
NH3 Evaporation Rate
(lb/min)
OCA Guidance 59.68 67.87
Modified Ts Model 46.19 16.66
Table 2. Maximum distances to the RMP endpoints.
Dispersion
Model
ClO2 Endpoint 1 ppm (mile)
NH3 Endpoint 200 ppm
(mile)
OCA Evaporation rate/Lookup Table ~11 0.81
OCA Lookup Table ~10 0.31
SLAB 6.83 0.40
ALOHA 4.60 0.57
DEGADIS 3.13
SCREEN3 0.45

10
Figure 1. Time dependent ClO2 evaporation rates since initial spill.
0
10
20
30
40
50
60
70
80
0 10 20 30 40 50 60
Time Since Initial Spill (min)
Eva
pora
tion
Rat
e (lb
/min
)
Modified Ts Model OCA Guidance

11
Figure 2. Time dependent NH3 evaporation rates since initial spill.
0
10
20
30
40
50
60
70
80
90
0 10 20 30 40 50 60Time Since Initial Spill (min)
Eva
pora
tion
Rat
e (lb
/min
)
Modified Ts Model OCA Guidance