accessibility and impedance forms: empirical applications to the
TRANSCRIPT

Forthcoming in “International Regional Science Review” (2011)
1
ACCESSIBILITY AND IMPEDANCE FORMS: EMPIRICAL APPLICATIONS TO THE GERMAN COMMUTING
NETWORK
Aura Reggiani*, Pietro Bucci**, Giovanni Russo***
* University of Bologna, Department of Economics, Faculty of Statistics, Piazza Scaravilli, 2, 40126 Bologna, Italy; email: [email protected]
** Significance, Koninginnegracht 23, 2514 AB The Hague, The Netherlands; email: [email protected] *** Department of Spatial Economics, VU Amsterdam, De Booelelaan 1105, 1081 HV Amsterdam, The Netherlands; email: [email protected]
ABSTRACT
Accessibility plays a fundamental role in the transport network. First, it relates to all the nodes in the network. Second, it is a crucial instrument for exploring both slow network dynamics – characteristic of the network supply side (infrastructure development) – and fast network dynamics
– typical of the demand side (mobility/communication increase). In fact, accessibility may be used for investigating the (un)even distribution of economic activities, or the (dis)equilibrium in the development of different regional performances. In particular, the accessibility measure can be considered as a first exploratory step in the understanding of people’s needs and behaviour, especially in the framework of transport network structures.
From the methodological viewpoint, accessibility has a long tradition, starting in the 1950’s with the pioneering work by Hansen, who defined accessibility as the potential of opportunity for interaction. Such a definition can also be considered as an integrated framework of all subsequent definitions.
The aim of this paper is to explore accessibility in the German commuting network, by focusing attention on the relevance of the impedance form associated with it. The conventional (potential) accessibility function – in the light of the related economic activities – is used as a suitable instrument to identify the major German hub/attraction nodes. In this formulation, different types of decay functions are used as impedance forms.
In particular, in our applications we consider home-to-work commuters travelling between 439 German districts, for both 2003 and 2007. We then carry out a comparative analysis of the accessibility values in these years, by outlining the different emerging hierarchies, resulting from the use of different impedance forms.
The final aim is to identify – by means of different accessibility functions – homogeneous vs. heterogeneous characteristics of the German commuting network.
KEYWORDS: accessibility, commuting network, impedance functions, German districts

Forthcoming in “International Regional Science Review” (2011)
2
1 Introduction
The concept of accessibility and its measurement has received a great deal of attention in the regional science and transport literature (for a review, see among others, Baradaran and Ramjerdi 2001; Becker et al. 2008; Geurs and van Wee 2004; Reggiani 1988). Accessibility may be considered as a general concept which tries to encapsulate all the potential benefits that transport investments produce, based on the idea that changes in accessibility resulting from new transport infrastructure investments cause a redistribution of employment and activities between regions (Banister and Berechman 2001; Martin and Reggiani 2007).
The aim of this paper is to explore the dynamics of commuting accessibility in Germany through different behavioural patterns and preferences at an aggregate level. The different behavioural patterns are investigated by means of different impedance functions. These impedance functions play a crucial role in the spatial modelling (i.e. within the conventional Spatial Interaction models (SIMs)), as well as in the associated accessibility measures. In addition, accessibility is linked to the concept of network, since it relates to all the nodes in the spatial-economic system under analysis. In particular, accessibility refers to the ‘properties of the configuration of
opportunities for spatial interaction’ (Weibull 1980, p. 54; see also Section 3). Thus, different types of infrastructure and socio-economic networks might give rise to different accessibility patterns. The question is then whether the accessibility models conventionally used in spatial-economic science are able, first, to grasp the homogeneity/heterogeneity of the spatial system concerned, and, second, to investigate the associated connectivity infrastructure/economic network.
The present paper is organized as follows. Section 2 presents the adopted SIM, which is then used for constructing different types of accessibility functions in Section 3. These empirical experiments refer to the network of home-to-work commuters travelling between 439 German districts, for the years 2003 and 2007. In particular, since our SIM takes into account five different impedance functions (the exponential, exponential-normal, exponential-square-root, log-normal, and power form), five typologies of SIM have been calibrated, and, hence, five typologies of accessibility indicators have been constructed. The emerging values highlight different hierarchical patterns, essentially the accessibility embedding the power-decay form vs. the accessibility derived from the other types of decay functions (exponential, exponential-normal, exponential-square-root, and log-normal form). In particular, the power-accessibility form reveals the most accessible districts to be multiple nodes, dispersed over the country (i.e. Berlin, Hamburg, München, Frankfurt, Köln), while the other four types of accessibility function reveals the most accessible to be only those belonging to the Ruhr area.
The issue whether the most accessible districts are also the most connected is then explored in Section 4 by means of network analysis. This analysis shows that the infrastructure network is quite homogeneous, and that the connectivity pattern matches the power-accessibility hierarchy. This result confirms the good performance of the power-accessibility form for the analysis and forecasting of the German commuting network. Section 5 concludes with final remarks and suggestions for future research.

Forthcoming in “International Regional Science Review” (2011)
3
2 Spatial Interaction Modelling
2.1 Preface Section 2.2 below presents the Spatial Interaction Models (SIMs) adopted in the empirical experiments (described in Section 2.3) concerning the spatial modelling of commuting in Germany. In particular, five types of SIMs, embedding five different impedance functions (the exponential, exponential-normal, exponential-square-root, log-normal and power form), have been considered and calibrated – for both 2003 and 2007 – in order to extrapolate the coefficients (i.e. the time sensitivity parameters), which makes it possible to construct five different accessibility indicators for both 2003 and 2007. The comparative analysis of SIMs – and the related accessibility functions – for the years 2003 and 2007 has been chosen for exploring the impact over these years on the location of activities, and thus on the accessibility levels, of recent interventions in the German commuting network, such as the High Speed Train (HST) or new/improved transport connections.
2.2 The Adopted Spatial Interaction Models The first step of our analysis of commuting patterns in Germany is the modelling of spatial flows, in the light of proper forecasts and related policy analyses. In this framework, SIMs have been, in the last century, the central focus of several models and theories, with the aim of describing and predicting the processes or spatial flows emerging as a result of given spatial configurations. SIMs have a long history, starting from their first formulations that assumed analogies with Newton’s law of gravity. Later on, SIMs were shown to have a basis in entropy theory and in the utility maximization approach (for a review, see Reggiani 2004).
For transport planning purposes, SIMs are conventionally used in transport demand analysis, being the basic models for analysing trip generation/attraction, as well as trip distribution.
As a first step of our spatial modelling of commuting in Germany, we adopt an unconstrained SIM of the following type:
( )ij i j ijT KO D f t= . (1)
In Equation (1), the flows Tij represent the commuting flows (employees) from the origin (district) i to the destination (district) j. They are a function of the outflows Oi and of the inflows1
Dj, as well as of the deterrence function( )ijf t ; tij is the travel time between i and j; and the
parameter K is a scaling factor. Concerning the form of( )ijf t , here five different functional
specifications are here taken into account, on the basis of the contributions by Olsson (1980) and Taylor (1971). These five decay functions are written as follows:
(a) the exponential-decay function:
1( ) ijtijf t e β−= , (2)
(b) the exponential-normal decay function:
2
2( ) ijtijf t e β−= , (3)
1 In particular, here the outflows coincide with the number of persons living in place i and working in place j, while the inflows coincide with the workplaces in j.
Forthcoming in “International Regional Science Review” (2011)
4
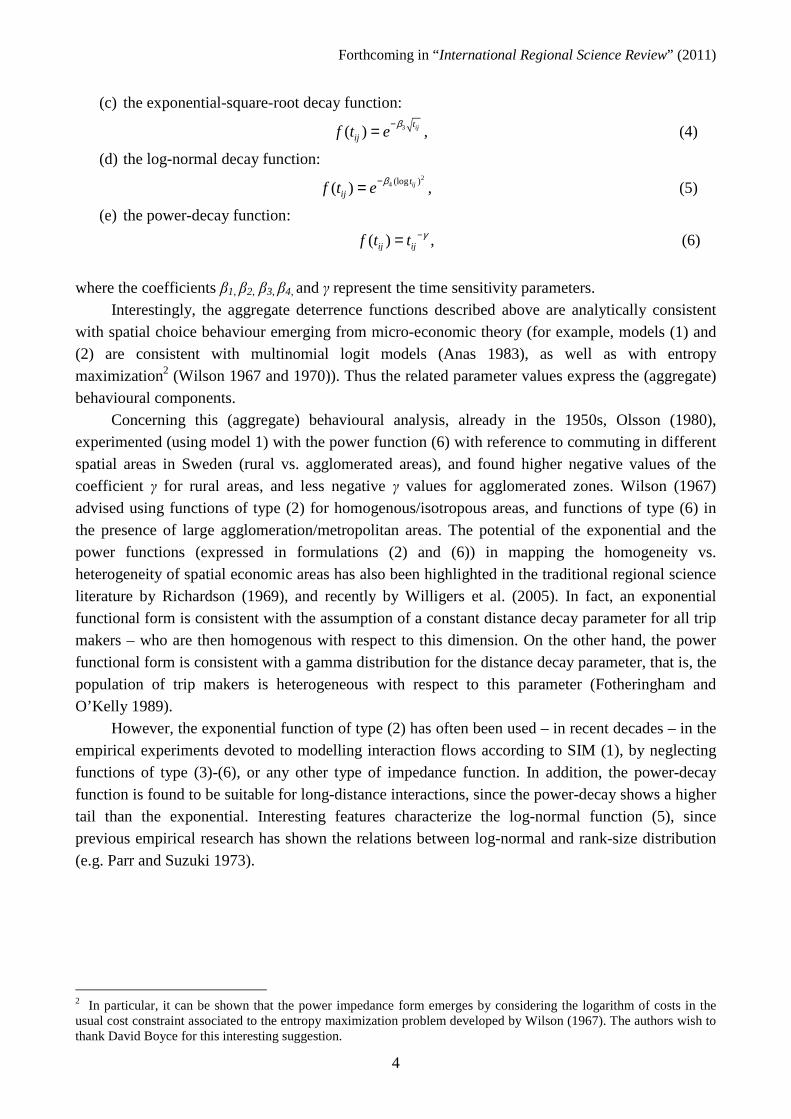
(c) the exponential-square-root decay function:
3( ) ijt
ijf t eβ−= , (4)
(d) the log-normal decay function: 2
4 (log )( ) ijtijf t e β−= , (5)
(e) the power-decay function:
( )ij ijf t t γ−= , (6)
where the coefficients β1, β2, β3, β4, and γ represent the time sensitivity parameters. Interestingly, the aggregate deterrence functions described above are analytically consistent
with spatial choice behaviour emerging from micro-economic theory (for example, models (1) and (2) are consistent with multinomial logit models (Anas 1983), as well as with entropy maximization2 (Wilson 1967 and 1970)). Thus the related parameter values express the (aggregate) behavioural components.
Concerning this (aggregate) behavioural analysis, already in the 1950s, Olsson (1980), experimented (using model 1) with the power function (6) with reference to commuting in different spatial areas in Sweden (rural vs. agglomerated areas), and found higher negative values of the coefficient γ for rural areas, and less negative γ values for agglomerated zones. Wilson (1967) advised using functions of type (2) for homogenous/isotropous areas, and functions of type (6) in the presence of large agglomeration/metropolitan areas. The potential of the exponential and the power functions (expressed in formulations (2) and (6)) in mapping the homogeneity vs. heterogeneity of spatial economic areas has also been highlighted in the traditional regional science literature by Richardson (1969), and recently by Willigers et al. (2005). In fact, an exponential functional form is consistent with the assumption of a constant distance decay parameter for all trip makers – who are then homogenous with respect to this dimension. On the other hand, the power functional form is consistent with a gamma distribution for the distance decay parameter, that is, the population of trip makers is heterogeneous with respect to this parameter (Fotheringham and O’Kelly 1989).
However, the exponential function of type (2) has often been used – in recent decades – in the empirical experiments devoted to modelling interaction flows according to SIM (1), by neglecting functions of type (3)-(6), or any other type of impedance function. In addition, the power-decay function is found to be suitable for long-distance interactions, since the power-decay shows a higher tail than the exponential. Interesting features characterize the log-normal function (5), since previous empirical research has shown the relations between log-normal and rank-size distribution (e.g. Parr and Suzuki 1973).
2 In particular, it can be shown that the power impedance form emerges by considering the logarithm of costs in the usual cost constraint associated to the entropy maximization problem developed by Wilson (1967). The authors wish to thank David Boyce for this interesting suggestion.

Forthcoming in “International Regional Science Review” (2011)
5
2.3 The Calibration of the Models
2.3.1 The Adopted Procedure The SIM described in Section 2.2 (see equation (1)) shows that the commuting flows from the origin (district) i to the destination (district) j are dependent on the relationship between the outflows, the inflows, and the deterrence function. In order to estimate the parameters β1, β2, β3, β4,
and γ included in the associated deterrence functions (2)-(6), five expressions of the (unconstrained) SIM (1) have been calibrated. For this purpose, SIM (1) has been transformed into a logarithmic form, as follows:
( ) ( ( ))ijij
i j
TlogY log logK log f t
O D= = + , (7)
where K represents the intercept parameter, and f (tij) is explained according to the five formulations (2)-(6).
Clearly, the linear form of (7) allows an easy fitting of the parameters β1, β2, β3, β4, and γ within the associated decay functions (2)-(6). The results of these calibrations are illustrated later in Section 2.3.3. Next, Section 2.3.2 shows the real data underlying this calibration procedure.
2.3.2 The Observed Data Figure 1 depicts the observed data distribution concerning the form of the impedance function. In particular, we consider as zone of origin i and destination j each of the 439 districts3 (Kreise) in Germany. Oi and Dj are the numbers of employees residing in district i and working in district j (that is, home-to-work trips). Tij are the commuting flows between district i and district j. We measure the travel time4 tij (by road and train) in minutes. The years considered are 2003 and 2007. From Figure 1 we can mostly conjecture a power-decay distribution, since high values for very short distances, as well as a tail not decaying down to zero, are observed.
Figure 1. Plots of the impedance functions for the observed data (2003 and 2007): y-axis = Y = Tij/OiDj ; x-
axis = tij = travel time in minutes
3 The data are aggregated at what is known as the NUTS III level (i.e. the German administrative districts, called Kreise) of the EU, and were collected by the Federal Employment Services (Bundesanstalt für Arbeit, B(A)) for social security purposes (IAB, Nuremberg, Germany). 4 We consider a weighted sum of road and train travel time.

Forthcoming in “International Regional Science Review” (2011)
6
Starting from the above considerations, our objective is to explore and test the feasibility of model (1), by considering the impedance functions (2)-(6) in a real setting, such as the commuting flows in Germany between the 439 districts. The results of the related calibration experiments are illustrated next in Section 2.3.3.
2.3.3 The Calibration results The procedure described in Section 2.3.1 – by means of equation (7) – is then applied to the observed data (i.e. the network of commuting flows in Germany), for both 2003 and 2007, in order to explore the variations of the time sensitivity parameters over these years. The related results are illustrated in Tables 1 and 2. Table 1. Estimation results concerning SIM (1) associated with the five impedance functions (2)-(6); year
2003
Deterrence Function R² Parameter Exponential 0.339 β1 = -0.009 Exponential-Normal 0.196 β2 = -1.36E-005 Exponential-Square-Root 0.449 β3 = -0.275 Log-Normal 0.520 β4 = -0.185 Power 0.574 γ = -1.882
Table 2. Estimation results concerning SIM (1) associated with the five impedance functions (2)-(6); year 2007
Deterrence Function R² Parameter Exponential 0.334 β1 = -0.008 Exponential-Normal 0.193 β2 = -1.2E-005 Exponential-Square-Root 0.441 β3 = -0.261 Log-Normal 0.513 β4 = -0.178 Power 0.566 γ = -1.835
The results displayed in Table 1 (year 2003) and in Table 2 (year 2007) highlight – over the
years – rather similar values of the time sensitivity parameters – and hence a rather stable behavioural pattern – for the parameters β1, β2 and β3. On the other hand, the parameters β4 and γ exhibit slight variations over the years, thus indicating some changes in the dynamics of the concentration of commuting patterns. Since the R2 values, for both 2003 and 2007, show that the log-normal and the power-decay functions fit better than the three types of exponential impedance functions, we can conjecture that changes in the (aggregate) commuting behaviour occurred over the years 2003-2007.
We have estimated the data for the two years separately because a Chow test rejects the null hypothesis of the stability of the coefficients in the two years for all impedance functions. This means that over the years the impact of travel time on commuting flows has changed. The change has been slow though, since the rate of change in the coefficients ranges from a decline of 2.5% for the power impedance function to a decline of 5.4% for the exponential sequential impedance

Forthcoming in “International Regional Science Review” (2011)
7
function, over the four year period. Given the small rate of change in the coefficients the impact on the accessibility measure should be limited. The exponential-normal impedance function appears to be an outlier in that the implied rate of change is fairly high: 12.3% over the 4 year-period (about 3% yearly).
The parameter values illustrated in Tables 1 and 2 will now be used for the calculation of the related accessibility functions (Section 3).
3 The Accessibility in German Commuting Districts
The accessibility concept came to the fore in the 1950s, thanks essentially to Hansen (1959) who defined accessibility as the potential of opportunities for interactions. The quantification, as well as the formulation of theoretical structures for this concept, has assumed various forms in the course of its history (for a review, see Reggiani 1998).
In this context, it is well-known that, despite the various theoretical formulations, accessibility emerges in its analytical form, as the potential of opportunities:
( )i j ijj
A D f t=∑ , (8)
where Ai defines the accessibility of zone i, Dj is a measure (or weight) of opportunities/activities in
j, and ( )ijf t is the impedance function from i to j. The impedance function( )ijf t can assume
different forms. In the present application, we have considered formulas (2)-(6). Amongst all these formulations, equation (8), embedding the exponential-decay function (2) is
the most popular one. Equation (8) embedding (2) has often dominated the scientific literature from both the theoretical and empirical viewpoint. For example, equation (8) embedding (2) emerges as the inverse of the calibration factor in an origin-constrained SIM (Reggiani 1998; Willigers et al. 2005). In addition, the accessibility indicator (8) – embedding (2) – is analytically connected to a logit model; therefore, this type of exponential accessibility can be interpreted – in a micro-economic perspective – as a utility function (see, also Geurs and van Wee 2004; Shi and Ying 2008). However, the accessibility indicator (8) embedding (6) is also often used (see, e.g. Rietveld and Bruinsma 1998; Hsu and Shi 2008).
In the accessibility formulation, particular attention should be paid to the time sensitivity parameters embedded in the decay functions (2)-(6), and hence in the accessibility index (8). The time sensitivity parameters might be useful for observing the (aggregate) behaviour of users, and hence utilized for forecast analyses. However, very often, in the empirical applications, the time sensitivity parameters are fixed a priori5 (usually according to a value between 1 and 2). In this work, we have decided to calibrate these parameters – by means of the calibration procedure previously illustrated (see Section 2) – in order to have an indication of the (aggregate) users’ preferences in 2003 compared with 2007.
The time sensitivity parameters resulting in Tables 1 and 2 have been then used for the construction of the accessibility indices Ai (i.e. for each district i), according to formulation (8) embedding the decay functions (2)-(6). 5 For example, Bruinsma and Rietveld (1993) assume, in equation (8) embedding (6), a value for γ equal to 1.
Forthcoming in “International Regional Science Review” (2011)
8
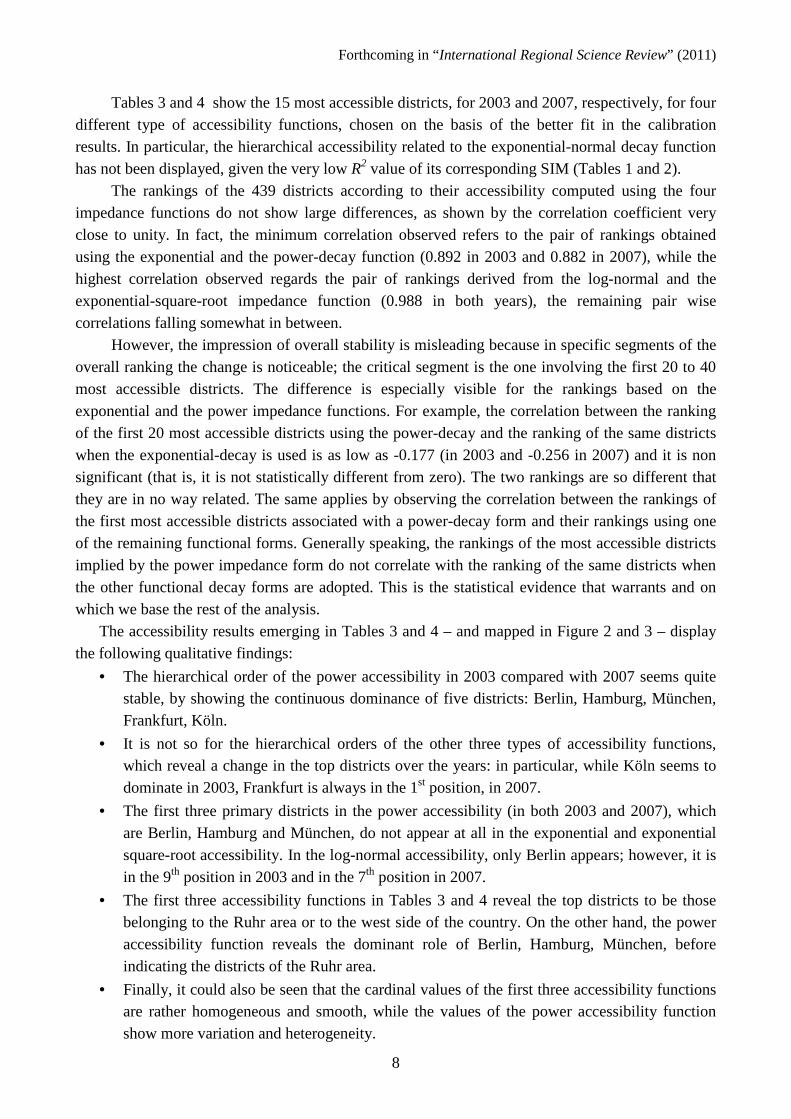
Tables 3 and 4 show the 15 most accessible districts, for 2003 and 2007, respectively, for four different type of accessibility functions, chosen on the basis of the better fit in the calibration results. In particular, the hierarchical accessibility related to the exponential-normal decay function has not been displayed, given the very low R2 value of its corresponding SIM (Tables 1 and 2).
The rankings of the 439 districts according to their accessibility computed using the four impedance functions do not show large differences, as shown by the correlation coefficient very close to unity. In fact, the minimum correlation observed refers to the pair of rankings obtained using the exponential and the power-decay function (0.892 in 2003 and 0.882 in 2007), while the highest correlation observed regards the pair of rankings derived from the log-normal and the exponential-square-root impedance function (0.988 in both years), the remaining pair wise correlations falling somewhat in between.
However, the impression of overall stability is misleading because in specific segments of the overall ranking the change is noticeable; the critical segment is the one involving the first 20 to 40 most accessible districts. The difference is especially visible for the rankings based on the exponential and the power impedance functions. For example, the correlation between the ranking of the first 20 most accessible districts using the power-decay and the ranking of the same districts when the exponential-decay is used is as low as -0.177 (in 2003 and -0.256 in 2007) and it is non significant (that is, it is not statistically different from zero). The two rankings are so different that they are in no way related. The same applies by observing the correlation between the rankings of the first most accessible districts associated with a power-decay form and their rankings using one of the remaining functional forms. Generally speaking, the rankings of the most accessible districts implied by the power impedance form do not correlate with the ranking of the same districts when the other functional decay forms are adopted. This is the statistical evidence that warrants and on which we base the rest of the analysis.
The accessibility results emerging in Tables 3 and 4 – and mapped in Figure 2 and 3 – display the following qualitative findings:
• The hierarchical order of the power accessibility in 2003 compared with 2007 seems quite stable, by showing the continuous dominance of five districts: Berlin, Hamburg, München, Frankfurt, Köln.
• It is not so for the hierarchical orders of the other three types of accessibility functions, which reveal a change in the top districts over the years: in particular, while Köln seems to dominate in 2003, Frankfurt is always in the 1st position, in 2007.
• The first three primary districts in the power accessibility (in both 2003 and 2007), which are Berlin, Hamburg and München, do not appear at all in the exponential and exponential square-root accessibility. In the log-normal accessibility, only Berlin appears; however, it is in the 9th position in 2003 and in the 7th position in 2007.
• The first three accessibility functions in Tables 3 and 4 reveal the top districts to be those belonging to the Ruhr area or to the west side of the country. On the other hand, the power accessibility function reveals the dominant role of Berlin, Hamburg, München, before indicating the districts of the Ruhr area.
• Finally, it could also be seen that the cardinal values of the first three accessibility functions are rather homogeneous and smooth, while the values of the power accessibility function show more variation and heterogeneity.

Forthcoming in “International Regional Science Review” (2011)
9
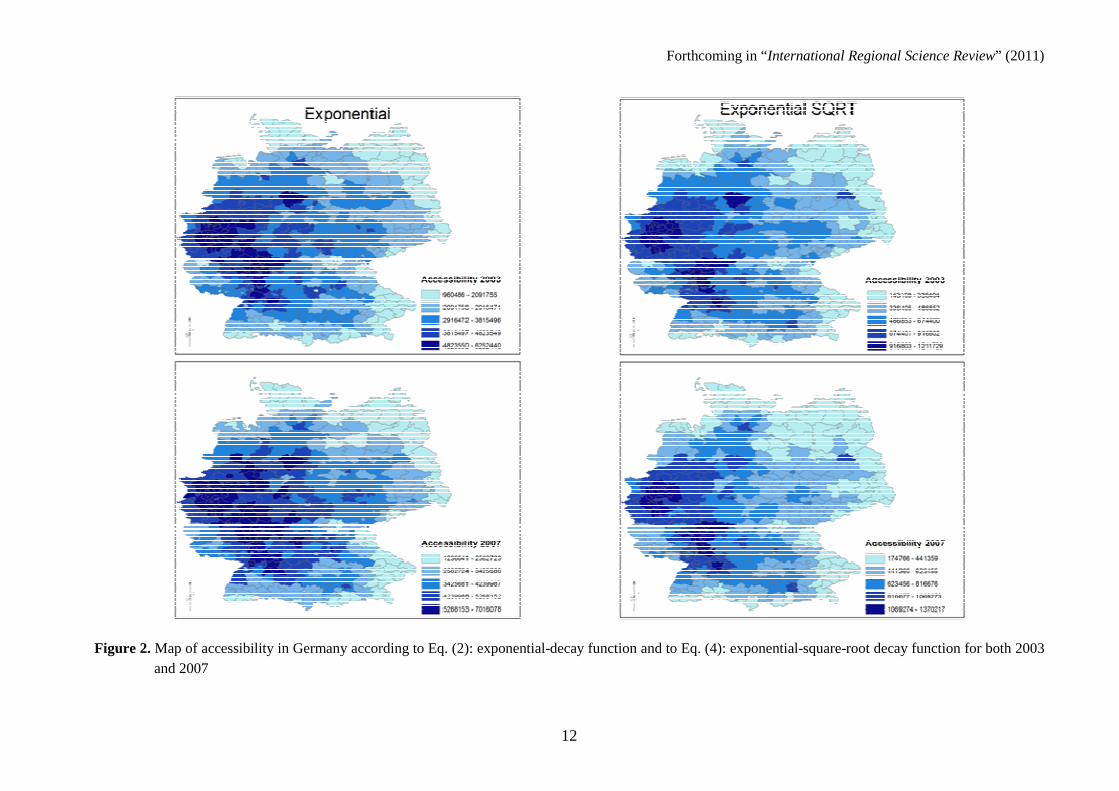
The maps6 displayed in Figure 2 and 3 enable the above results to be visualized. In particular,
the difference between the first six maps (accessibility with exponential, exponential-square-root, and log-normal decay functions for both 2003 and 2007) and the two final maps (accessibility embedding a power-decay function for both 2003 and 2007) is rather strong. All the six maps show the dominance of the Ruhr districts, apart from the log-normal map, which displays Berlin, but not Hamburg and Munich as in the power accessibility. It should be noted that these results also confirm previous findings concerning accessibility in the German commuting network for the year 2002 (Reggiani and Bucci 2008).
Having said this, the next point of concern is related to the topology issue. In other words, we want to explore which type of accessibility indicator – among our five indices – best matches the connectivity network. This further step of our investigation will be carried out by making use of network analysis. It will be dealt next in Section 4.
4 Network Analysis
Section 4 focuses on network analysis, and especially on how a district’s connectivity – and its centrality role – is related to its accessibility.
In recent years, an extensive literature has been devoted to the relationship between many social and economic phenomena and the related network interaction. In this context, although the application fields are substantially different, it has been shown that these networks display common topological patterns. These patterns can be roughly related to two main network models, viz. Random Networks (RN) and Scale-Free (SF) networks, on the basis of the fundamental contributions by Barabási and his collaborators (Albert and Barabási 2000 and 2002; Barabási 2002; Barabási and Albert 1999 and 2000). Researchers in many fields can find several applications of these models: for example in social science, biology, economics, technology and telecommunication (Buchanan 2002; Reggiani and Nijkamp 2006; Reggiani and Vinciguerra 2007; Yook et al. 2002).
In summary, RN models predict that the probability P(k) that a chosen node has exactly k links (in other words the degree distribution; Barabási and Oltvai, 2004) follows a Poisson distribution, while in an SF network this distribution/decay follows a power-law, i.e. P(k) ~ k- -δ,
where δ represents the degree exponent. These two contrasting, but also related, features were supported by numerous real-world examples (Joeng 2003). It is interesting to recall here that the power-law function has also been extensively studied in biology and economic science (Bak 1996; Krugman 1996).
6 The authors wish to thank John Öst (University of Uppsala, Sweden) and Roberto Patuelli (University of Lugano, Switzerland) for the elaboration of the above maps.
Forthcoming in “International Regional Science Review” (2011)
10
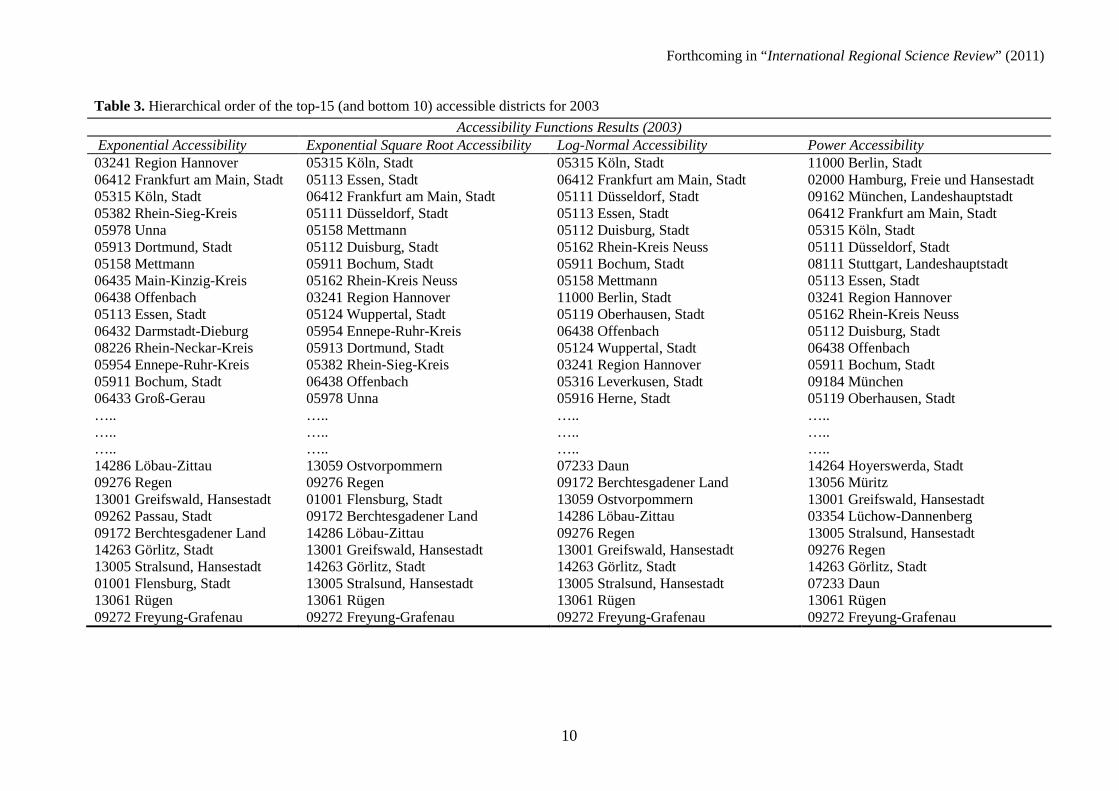
Table 3. Hierarchical order of the top-15 (and bottom 10) accessible districts for 2003
Accessibility Functions Results (2003) Exponential Accessibility Exponential Square Root Accessibility Log-Normal Accessibility Power Accessibility 03241 Region Hannover 05315 Köln, Stadt 05315 Köln, Stadt 11000 Berlin, Stadt 06412 Frankfurt am Main, Stadt 05113 Essen, Stadt 06412 Frankfurt am Main, Stadt 02000 Hamburg, Freie und Hansestadt 05315 Köln, Stadt 06412 Frankfurt am Main, Stadt 05111 Düsseldorf, Stadt 09162 München, Landeshauptstadt 05382 Rhein-Sieg-Kreis 05111 Düsseldorf, Stadt 05113 Essen, Stadt 06412 Frankfurt am Main, Stadt 05978 Unna 05158 Mettmann 05112 Duisburg, Stadt 05315 Köln, Stadt 05913 Dortmund, Stadt 05112 Duisburg, Stadt 05162 Rhein-Kreis Neuss 05111 Düsseldorf, Stadt 05158 Mettmann 05911 Bochum, Stadt 05911 Bochum, Stadt 08111 Stuttgart, Landeshauptstadt 06435 Main-Kinzig-Kreis 05162 Rhein-Kreis Neuss 05158 Mettmann 05113 Essen, Stadt 06438 Offenbach 03241 Region Hannover 11000 Berlin, Stadt 03241 Region Hannover 05113 Essen, Stadt 05124 Wuppertal, Stadt 05119 Oberhausen, Stadt 05162 Rhein-Kreis Neuss 06432 Darmstadt-Dieburg 05954 Ennepe-Ruhr-Kreis 06438 Offenbach 05112 Duisburg, Stadt 08226 Rhein-Neckar-Kreis 05913 Dortmund, Stadt 05124 Wuppertal, Stadt 06438 Offenbach 05954 Ennepe-Ruhr-Kreis 05382 Rhein-Sieg-Kreis 03241 Region Hannover 05911 Bochum, Stadt 05911 Bochum, Stadt 06438 Offenbach 05316 Leverkusen, Stadt 09184 München 06433 Groß-Gerau 05978 Unna 05916 Herne, Stadt 05119 Oberhausen, Stadt ….. ….. ….. ….. ….. ….. ….. ….. ….. ….. ….. ….. 14286 Löbau-Zittau 13059 Ostvorpommern 07233 Daun 14264 Hoyerswerda, Stadt 09276 Regen 09276 Regen 09172 Berchtesgadener Land 13056 Müritz 13001 Greifswald, Hansestadt 01001 Flensburg, Stadt 13059 Ostvorpommern 13001 Greifswald, Hansestadt 09262 Passau, Stadt 09172 Berchtesgadener Land 14286 Löbau-Zittau 03354 Lüchow-Dannenberg 09172 Berchtesgadener Land 14286 Löbau-Zittau 09276 Regen 13005 Stralsund, Hansestadt 14263 Görlitz, Stadt 13001 Greifswald, Hansestadt 13001 Greifswald, Hansestadt 09276 Regen 13005 Stralsund, Hansestadt 14263 Görlitz, Stadt 14263 Görlitz, Stadt 14263 Görlitz, Stadt 01001 Flensburg, Stadt 13005 Stralsund, Hansestadt 13005 Stralsund, Hansestadt 07233 Daun 13061 Rügen 13061 Rügen 13061 Rügen 13061 Rügen 09272 Freyung-Grafenau 09272 Freyung-Grafenau 09272 Freyung-Grafenau 09272 Freyung-Grafenau

Forthcoming in “International Regional Science Review” (2011)
11
Table 4. Hierarchical order of the top-15 (and bottom 10) accessible districts for 2007
Accessibility Functions Results (2007) Exponential Accessibility Exponential Square Root Accessibility Log-Normal Accessibility Power Accessibility 06412 Frankfurt am Main, Stadt 06412 Frankfurt am Main, Stadt 06412 Frankfurt am Main, Stadt 11000 Berlin, Stadt 05315 Köln, Stadt 05113 Essen, Stadt 05111 Düsseldorf, Stadt 02000 Hamburg, Freie und Hansestadt 05913 Dortmund, Stadt 05111 Düsseldorf, Stadt 05113 Essen, Stadt 09162 München, Landeshauptstadt 05978 Unna 05315 Köln, Stadt 05315 Köln, Stadt 06412 Frankfurt am Main, Stadt 05382 Rhein-Sieg-Kreis 05158 Mettmann 05162 Rhein-Kreis Neuss 05315 Köln, Stadt 06438 Offenbach 05911 Bochum, Stadt 05112 Duisburg, Stadt 05111 Düsseldorf, Stadt 06435 Main-Kinzig-Kreis 05913 Dortmund, Stadt 11000 Berlin, Stadt 08111 Stuttgart, Landeshauptstadt 05113 Essen, Stadt 05112 Duisburg, Stadt 05911 Bochum, Stadt 05113 Essen, Stadt 06432 Darmstadt-Dieburg 05162 Rhein-Kreis Neuss 05158 Mettmann 03241 Region Hannover 08226 Rhein-Neckar-Kreis 05124 Wuppertal, Stadt 05119 Oberhausen, Stadt 05162 Rhein-Kreis Neuss 05111 Düsseldorf, Stadt 05978 Unna 06438 Offenbach 05112 Duisburg, Stadt 06433 Groß-Gerau 05954 Ennepe-Ruhr-Kreis 05124 Wuppertal, Stadt 06438 Offenbach 05158 Mettmann 05382 Rhein-Sieg-Kreis 05316 Leverkusen, Stadt 09184 München 05911 Bochum, Stadt 06438 Offenbach 05913 Dortmund, Stadt 05911 Bochum, Stadt 06440 Wetteraukreis 06432 Darmstadt-Dieburg 08111 Stuttgart, Landeshauptstadt 05158 Mettmann ….. ….. ….. ….. ….. ….. ….. ….. ….. ….. ….. ….. 13059 Ostvorpommern 09262 Passau, Stadt 13056 Müritz 13055 Mecklenburg-Strelitz 14286 Löbau-Zittau 09172 Berchtesgadener Land 09276 Regen 13052 Demmin 09172 Berchtesgadener Land 13059 Ostvorpommern 13052 Demmin 13001 Greifswald, Hansestadt 13001 Greifswald, Hansestadt 14286 Löbau-Zittau 13059 Ostvorpommern 13056 Müritz 09262 Passau, Stadt 01001 Flensburg, Stadt 14286 Löbau-Zittau 14264 Hoyerswerda, Stadt 14263 Görlitz, Stadt 13001 Greifswald, Hansestadt 13001 Greifswald, Hansestadt 13005 Stralsund, Hansestadt 13005 Stralsund, Hansestadt 14263 Görlitz, Stadt 14263 Görlitz, Stadt 14263 Görlitz, Stadt 01001 Flensburg, Stadt 13005 Stralsund, Hansestadt 13005 Stralsund, Hansestadt 03354 Lüchow-Dannenberg 09272 Freyung-Grafenau 09272 Freyung-Grafenau 09272 Freyung-Grafenau 13061 Rügen 13061 Rügen 13061 Rügen 13061 Rügen 09272 Freyung-Grafenau
Forthcoming in “International Regional Science Review” (2011)
12
Figure 2. Map of accessibility in Germany according to Eq. (2): exponential-decay function and to Eq. (4): exponential-square-root decay function for both 2003
and 2007

Forthcoming in “International Regional Science Review” (2011)
13
Figure 3. Map of accessibility in Germany according to Eq. (5): log-normal decay function and to Eq. (6): power-decay function for both 2003 and 2007

Forthcoming in “International Regional Science Review” (2011)
14
In this context, it is important to identify an SF network, for its clustering character, as well as for its strong features in terms of robustness and vulnerability. Recent simulations of SF networks demonstrate that the damage of just a few of the major hubs (i.e. target attack) will provoke the crash of the whole system. In contrast, RNs are weak against a random attack which will cause the breakdown of the entire network. Good reviews on this topic can be found in, amongst others, Barabási and Oltvai (2004), Grubesic et al. (2008), and Jeong (2003). Recent applications in transport concern the identification of an RN vs. an SF network with reference to the evolution of commuting flows (De Montis et al. 2007; Patuelli et al. 2007 and 2010; Russo et al. 2007), and of air transport flows (Barrat et al. 2004; Reggiani et al. 2010).
Having said this, it is interesting to detect the most connected districts (according to the incoming links), in the light of the hierarchical accessibility orders previously examined. Table 5 displays the top 15 most connected districts in this respect. Here, we can observe that the first top-5 connected districts match well the top-5 districts emerging from the power accessibility ranking (Tables 3 and 4), while it is not so for the other types of accessibility rankings (the exponential, exponential-square-root, and log-normal accessibility).
Table 5. The top-15 most-connected districts for 2003 and 2007
Connectivity 2003 2007 02000 Hamburg, Freie und Hansestadt 02000 Hamburg, Freie und Hansestadt 05315 Köln, Stadt 06412 Frankfurt am Main, Stadt 06412 Frankfurt am Main, Stadt 09162 München, Landeshauptstadt 09162 München, Landeshauptstadt 11000 Berlin, Stadt 11000 Berlin, Stadt 05315 Köln, Stadt 08111 Stuttgart, Landeshauptstadt 08111 Stuttgart, Landeshauptstadt 05111 Düsseldorf, Stadt 05111 Düsseldorf, Stadt 09184 München 09184 München 03241 Region Hannover 09564 Nürnberg, Stadt 09564 Nürnberg, Stadt 03241 Region Hannover 06438 Offenbach 05158 Mettmann 08222 Mannheim, Universitätsstadt 06414 Wiesbaden, Landeshauptstadt 06436 Main-Taunus-Kreis 06438 Offenbach 08116 Esslingen 06436 Main-Taunus-Kreis 08118 Ludwigsburg 08212 Karlsruhe, Stadt
Next, we explore the topological7 features of our commuting network (i.e. the identification of
an RN vs. an SF network), by considering the statistical distribution of the incoming links (according to the conventional Barabási’s approach). We will then rank the German commuting districts by their incoming connections. Tables 6 and 7 display the related results.
The resulting R2 values (Tables 6 and 7) show that the exponential distribution of the incoming connections fits very well, highlighting a homogeneous (logical) topology network. However, also the power distribution fits rather well. The two (exponential and power) functions
7 It should be noted that we are looking at logical topology. Logical topology is the (virtual) network configuration emerging from the O-D matrix. When the (real) physical infrastructure network is considered, we talk about physical topology.
Forthcoming in “International Regional Science Review” (2011)
15
interpolating the distribution of the incoming connections concerning the 439 nodes (districts) in Germany, for 2003 and 2007, can be observed respectively in Figures A.1 and A.2, in Annex A.
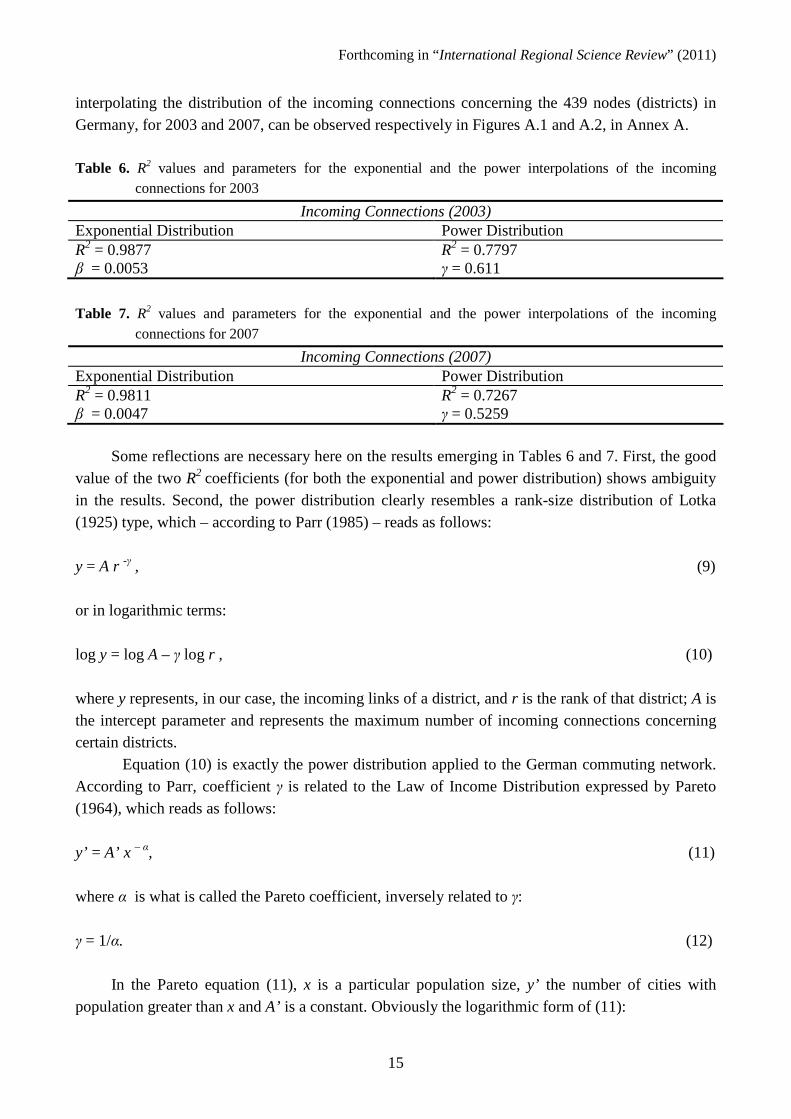
Table 6. R2 values and parameters for the exponential and the power interpolations of the incoming
connections for 2003
Incoming Connections (2003) Exponential Distribution Power Distribution R2 = 0.9877 R2 = 0.7797 β = 0.0053 γ = 0.611
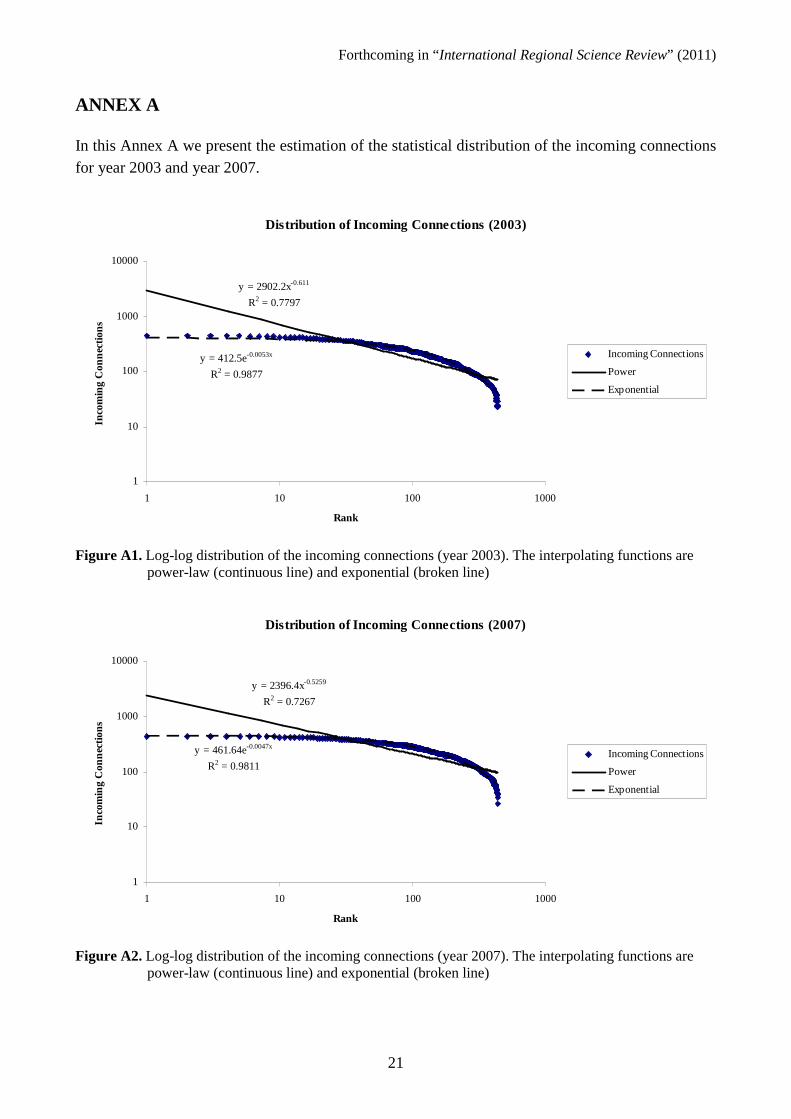
Table 7. R2 values and parameters for the exponential and the power interpolations of the incoming
connections for 2007
Incoming Connections (2007) Exponential Distribution Power Distribution R2 = 0.9811 R2 = 0.7267 β = 0.0047 γ = 0.5259
Some reflections are necessary here on the results emerging in Tables 6 and 7. First, the good value of the two R2 coefficients (for both the exponential and power distribution) shows ambiguity in the results. Second, the power distribution clearly resembles a rank-size distribution of Lotka (1925) type, which – according to Parr (1985) – reads as follows: y = A r -γ , (9)
or in logarithmic terms: log y = log A – γ log r , (10) where y represents, in our case, the incoming links of a district, and r is the rank of that district; A is the intercept parameter and represents the maximum number of incoming connections concerning certain districts.
Equation (10) is exactly the power distribution applied to the German commuting network. According to Parr, coefficient γ is related to the Law of Income Distribution expressed by Pareto (1964), which reads as follows: y’ = A’ x – α, (11) where α is what is called the Pareto coefficient, inversely related to γ: γ = 1/α. (12)
In the Pareto equation (11), x is a particular population size, y’ the number of cities with population greater than x and A’ is a constant. Obviously the logarithmic form of (11):

Forthcoming in “International Regional Science Review” (2011)
16
log y’ = log A’ – α log x, (13) shows that the axes in this case are transposed – with respect to (10). In equation (10) rank r is plotted on the x-axis, and population on the y-axis, while in Pareto formulation (13) population is plotted on the x-axis, and the cumulative frequency on the y-axis.
The Pareto-coefficient α in (13) has been interpreted as an index of concentration by Parr (1985, p. 200): “Consequently, the lower the value of α, the greater would be the proportion of
large cities and the higher the degree of metropolization or interurban concentration.” Therefore, since our values of α extrapolated from (12) seem to increase in 2007 compared with 2003, we can conjecture that the network of links is oriented towards a pattern of homogeneity (i.e. the infrastructural network is becoming spread out). In fact, it should be noted here that each link means the existence of an infrastructural arc underlying this link. However, an impedance function of the non-linear type (such as the exponential- or power-decay) concerning the costs associated with this link is not considered in the network analysis of the Barabási type. For example, in the presence of SF networks, it might be appropriate to take into account – in the preferential attachment – different types of decay cost functions8, as illustrated in the previous sections. This would certainly constitute an interesting topic for further research in network analysis, as well as a relevant methodological key-issue for interdisciplinary integration between spatial economic analysis and network analysis .
As previously outlined, the homogeneity of the network connections, means a ‘wide’ possibility for the user to reach all the destinations. This is not in contradiction with the pattern of economic variables associated with those links. In other words, the associated economic variables might in principle show agglomeration patterns. If we consider – for example – as population y in (10) the incoming flows, it can be easily seen that the coefficient α shows a slight decrease (from the value of 1.46 in 2003 to the value of 1.45 in 2007), and hence a tendency towards a concentration process (Reggiani and Bucci 2008). This tendency of the incoming flows towards agglomeration confirms the results, which emerged Section 3 above (accessibility results from SIMs), where the power accessibility indicator seems to show heterogeneous values.
A further reflection concerns the exploration of an additional network index, able to capture the major ‘central’ nodes and their interaction, by means of the edge-betweenness9 centrality index.
The edge-betweenness of an edge is defined as the number of shortest paths between pairs of nodes that run along it. If there is more than one shortest path between a pair of nodes, each path is assigned equal weight, such that the total weight of all of the paths is equal to unity. The outcome10 of the edge-betweenness index in the German commuting network shows the predominance11 of Berlin and Hamburg as destination nodes. Once again this result shows consistency with the power
8 See also Reggiani (2009), p. 282. 9It might also be useful to consider also the co-betweenness indicator. The co-betweenness is a centrality index that provides a measure of the number of shortest paths running through a pair of vertices (Kolaczyk et al. 2009). Thus both co-betweenness and edge-betweenness are suitable measures for the analysis of group vertex functioning. In particular cases co-betweennss and edge-betweenness coincide (see Csardi 2010). Co-betweenness analysis will be pursued in further research. The authors appreciated this suggestion from the referee. 10 For this analysis the authors used the software NetworkX (library Python). The authors would like to thank Simone Caschili (University of Cagliari, Italy) for his precious help in setting up this software. 11 The frequency analysis of the first 30 most central edges shows that Berlin and Hamburg (as destination nodes) occur 77 per cent of the time for 2003 and 53 per cent of the time for 2007.

Forthcoming in “International Regional Science Review” (2011)
17
accessibility results (see Tables 3 and 4), even though no impedance function is considered in this network analysis.
All in all, we can conjecture that the network of incoming connections in Germany is developing from a homogenous pattern towards a hierarchy of hubs (city network). The study of accessibility in Germany can take into account this hierarchical structure by considering the conventional accessibility specification, where a power impedance function is embedded. In addition, the power accessibility in Germany (Tables 3 and 4) shows a ranking compatible with the one that emerges from the network connectivity (Table 5). 5 Final Remarks and Further Research
In this paper the accessibility concept has been considered and applied from two complementary perspectives: (a) spatial-economics; (b) network analysis. In the spatial-economic context (a) five different decay functions where inserted the conventional accessibility function associated with a spatial interaction model (SIM). The first three decay functions are related to the exponential, the exponential normal, and the exponential square-root decay function; the fourth decay function is expressed by the log-normal, while the last one embodies the power form. The rationale behind these experiments is to explore the potential of these five accessibility functions in capturing the dynamics of commuting patterns in Germany. In addition, the associated connectivity network was investigated by means of network analysis (b), in order to identify which one of the five adopted accessibility functions is better able to grasp the homogeneity/heterogeneity of the dynamic commuting patterns in Germany.
These experiments – carried out for both the year 2003 and 2007 – showed the following findings:
• The two approaches (a) and (b) highlight – in principle – the same result, i.e. the potential of the power form in capturing the accessibility and concentration patterns in Germany.
• First, the power-decay form seems to better suit the dynamics of accessibility patterns in Germany as it better fits the associated SIM in both 2003 and 2007.
• Second, the connectivity results confirm that the most connected districts are those emerging from the power accessibility indicator, by revealing a hub-network of districts, and hence, the tendency, in Germany, towards a multiplicity of nodes.
• Consistent differences in the accessibility results between the power accessibility and the other four types of accessibility appear. In particular, the power accessibility indicator extrapolates three main nodes (Berlin, Hamburg, München) – for both 2003 and 2007 – in addition to the Ruhr districts (Frankfurt, Köln, Düsseldorf) that are also highlighted by the other three decay accessibility forms. Moreover, the related accessibility values of the power accessibility display discontinuous and heterogeneous values, while smooth and less discontinuous values characterize the other four types of accessibility.
All in all, the above experiments seems to indicate – by means of the power accessibility
indicator – a trend towards heterogeneity in the commuting network, where the ‘city-network’, composed of the main hubs/attractors, seems to play a significant socio-economic role.

Forthcoming in “International Regional Science Review” (2011)
18
Further research is then oriented to explore the commuting network of the top-15 districts – identified as the most accessible/attracting ones in the power accessibility results – in order to explore the accessibility patterns among these 15 districts, in the light of recent infrastructure interventions (e.g. high speed train). In this context, particular attention will be devoted, in the calibration of the parameters, to the analysis of a simply-constrained or doubly-constrained SIM.
Reflections on further theoretical links between spatial economic analysis and network analysis will also be pursued. For example, the relationship ‘rank-size rule power-law’, already explored in spatial economics (see, e.g., Batty 2007; Duranton 2002; Krugman 1995; Parr 1985), also needs to be revisited in the network analysis framework, to better investigate the related economic significance.
Acknowledgments The authors wish to thank Anette Haas and Uwe Blien (IAB, Nuremberg, Germany) for kindly providing the data set and interesting comments. Two anonymous referees are also acknowledged for a number of valuable constructive suggestions.
References Albert, R., and A. L. Barabási. 2000. Topology of Evolving Networks: Local Events and Universality.
Physical Review Letters 85 (24):5234-5237. Albert, R., and A. L. Barabási. 2002. Statistical Mechanics of Complex Networks. Reviews of Modern
Physics 74:47-97. Anas, A. 1983. Discrete Choice Theory, Information Theory and the Multinomial Logit and the Gravity
Models. Transportation Research B 17 (1):13-23. Banister, D., and Y. Berechman. 2001. Transport Investment and the Promotion of Economic Growth.
Journal of Transport Geography 9:209-218. Bak, P. 1996. How Nature Works Springer-Verlag. Berlin. Barabási, A. L. 2002. Linked: the New Science of Network Cambridge Massachusetts, Perseus
Publishing. Barabási, L.A. and R. Albert. 1999. Emerging of Scaling in Random Networks. Science 286:509-512. Barabási, L.A. and R. Albert. 2000. Topology of Evolving Networks: Local Events and Universality.
Physical Review Letters 74:47-97. Barabási, L.A., and Z. N. Oltvai. 2004. Network’s Biology: Understanding the Cell’s Functional
Organization. Nature Reviews-Genetics 5:101-113. Baradan, S., and F. Ramjerdi. 2001. Performance of Accessibility Measures in Europe. Journal of
Transportation and Statistics September-December 31-48. Barrat, A., M. Barthelemy, R. Pastor-Satorras, and A. Vespignani. 2004. The Architecture of Complex
Weighted Networks. Proceedings of the National Academy of Sciences of the United States of America, March 8. www.pnas.org/cgi/doi/10.1073/pnas.0400087101
Batty, M. 2005. Cities and Complexity: Understanding Cities with Cellular Automata, Agent-based Models, and Fractals. MIT Press, Cambridge.
Becker, U., J. Böhmer, and R. Gerike (eds). 2008. How to Define and Measure Access and Need Satisfaction in Transport. Dresden Institute for Transportation and Environment (DIVU), Issue 7, University of Dresden, Dresden.

Forthcoming in “International Regional Science Review” (2011)
19
Bruinsma, F., and P. Rietveld. Accessibility of Cities in European Infrastructure Networks: A Comparison of Approaches. Research-Memorandum 1993-18. Free University (VU), Amsterdam.
Buchanan, M. 2002. Nexus: Small Worlds and the New Science of Networks. W.W. Norton and Co., N.Y.
Csardi, G. 2010,. http://igraph.sourceforge.net/doc/R/betweenness.html. De Montis, A., M. Barthélémy, A. Chessa, and A. Vespignani. 2007. The Structure of Interurban
Traffic: A Weighted Network Approach. Environment and Planning B 304 (5): 905-924. Duranton, G. 2002. City Size Distribution as a Consequence of the Growth Process. London School of
Economics and Political Science, Centre of Economic Performance, London. Fotheringham A.S. and M.E. O’Kelly. 1989. Spatial Interaction Models: Formulations and
Applications. Kluwer Academic, Dordrecht. Geurs, K. T., and B. van Wee. 2004. Accessibility Evaluation of Land-Use and Transport Strategies
Review and Research Directions. Journal of Transport Geography 12:127-40. Grubesic, T. H., T. C. Matisziw, A. T. Murray and D. Snediker. 2008. Comparative Approaches for
Assessing Network Vulnerability. International Regional Science Review 31:88-112. Hansen, W. 1959. How Accessibility Shapes Land Use. Journal of the American Institute of Planners
25:73-76. Hsu, C.-I., and H.-H. Shi. 2008. Small-World Network Theory in the Study of Network Connectivity
and Efficiency of Complementary international Airline Alliances. Journal of Air Transport Management 14 (3):123-129.
Jeong, H. 2003. Complex Scale-Free Networks. Physics A 321:226-237. Kolaczyk, E. D., D. B. Chua, and M. Barthelemy. 2009. Group betweenness and co-betweenness: Inter-
related notions of coalition centrality. Social Networks 31:190-203. Krugman, P. 1996. Urban Concentration: The Role of Increasing Returns and Transport Costs.
International Science Review 19(1&2):5-30. Lotka, A. J. 1925. The Elements of Physical Biology Williams & Wilkins, Baltimore, Md. Martín, J.C., and A. Reggiani. 2007. Recent Methodological Developments to Measure Spatial
Interaction: Synthetic Accessibility Indices applied to High Speed Train Investments. Transport Reviews 27 (5):551-571.
Olsson, G. 1980, Birds in Egg/Eggs in Bird Pion Limited, London. Pareto, V., 1964, Cours d’Economie Politique, Libraire Droz, Geneva Parr, J. B. 1985. A note on the Size Distribution of Cities over Time. Journal of Urban Economics
18:199-212. Parr, J. B., and K. Susuki. 1973. Settlement Populations and the Lognormal Distribution. Urban Studies
10:335-352. Patuelli, R., A. Reggiani, S.P. Gorman, P. Nijkamp, and F.-J. Bade. 2007. Network Analysis of
Commuting Flows: A Comparative Static Approach to German Data. Networks and Spatial Economics 7 (4):315-331.
Patuelli, R., A. Reggiani, P. Nijkamp, and F.-J. Bade. 2010. The Dynamics of the Commuting Network in Germany: Spatial and Connectivity Patterns. Journal of Transport and Land Use 2 (3):5-37.
Reggiani, A. 2004. Evolutionary Approaches to Transport and Spatial Systems, in Hensher, D.A., K.J. Button, K.E. Haynes, P.R. Stopher (eds.). Handbook of Transport Geography and Spatial Systems, Elsevier, Amsterdam, 237-253.
Reggiani, A. 1998. Accessibility, Trade and Locational Behaviour Ashgate, Aldershot, UK. Reggiani, A. 2009. From Complexity to Simplicity: Interdisciplinary Synthesis and Future Perspectives,
in Reggiani, A., and P. Nijkamp (eds). Complexity and Spatial Networks Springer-Verlag, Berlin, 275-284.
Reggiani, A., and S. Vinciguerra. 2007. Network Connectivity Models: An Overview and Applications. in T. Friesz (ed.). Network Science, Nonlinear Science and Infrastructure System, Springer-Verlag, New York, 147-165.
Reggiani, A., and P. Bucci. 2008. Accessibility and Network Structures: The Case of Commuting in Germany. Paper presented at the NECTAR Cluster 6 Workshop, Las Palmas (Spain).

Forthcoming in “International Regional Science Review” (2011)
20
Reggiani, A., P. Nijkamp, and A. Cento. 2010. Connectivity and Concentration in Airline Networks: A Complexity Analysis of Lufthansa's Network. European Journal of Information Systems (forthcoming).
Rietveld, P., and F. R. Bruinsma. 1998. Is Transport Infrastructure Effective? Transport Infrastructure and Accessibility: Impacts on the Space-Economy. Springer-Berlin, Verlag.
Richardson H.W., 1969, Elements of Regional Economics, Penguin Books, Harmondsworth Russo, G., A. Reggiani, and P. Nijkamp. 2007. Spatial Activity and Labour Market Patterns: A
Connectivity Analysis of Commuting Flows in Germany. The Annals of Regional Science, 41:789-811.
Shi, J., and X. Ying. 2008. Accessibility of a Destination-Based Transportation System: A Large Airport Study. Tsinghua Science and Technology 13(2):211-219.
Taylor, P. J. 1971. Distance Transformation and Distance Decay Functions. Geographical Analysis III:221-238.
Weibull, J.W. 1980. On the Numerical Measurement of Accessibility. Environment Planning A 12:53-67.
Willigers, J., H. Floor, and B. Van Wee. 2007. Accessibility Indicators for Location Choices of Offices: an Application to the Intraregional Distributive Effects of High-Speed Rail in the Netherlands. Environment and Planning A 39:2086-2098.
Wilson, A. G. 1967. A Statistical Theory of Spatial Distribution Models. Transportation Research 1:253-269.
Wilson, A. G. 1970. Entropy in Urban and Regional Modelling Pion, London. Yook, S., H. Jeong, and A. Barabási. 2002. Modeling the Internet’s Large-Scale Topology. Proceedings
of the National Academy of Sciences 9913382-13386.
Forthcoming in “International Regional Science Review” (2011)
21
ANNEX A In this Annex A we present the estimation of the statistical distribution of the incoming connections for year 2003 and year 2007.
Distribution of Incoming Connections (2003)
y = 2902.2x-0.611
R2 = 0.7797
y = 412.5e-0.0053x
R2 = 0.9877
1
10
100
1000
10000
1 10 100 1000
Rank
Inco
min
g C
onn
ecti
ons
Incoming Connections
Power
Exponential
Figure A1. Log-log distribution of the incoming connections (year 2003). The interpolating functions are
power-law (continuous line) and exponential (broken line)
Distribution of Incoming Connections (2007)
y = 2396.4x-0.5259
R2 = 0.7267
y = 461.64e-0.0047x
R2 = 0.9811
1
10
100
1000
10000
1 10 100 1000
Rank
Inco
min
g C
onn
ecti
ons
Incoming Connections
Power
Exponential
Figure A2. Log-log distribution of the incoming connections (year 2007). The interpolating functions are
power-law (continuous line) and exponential (broken line)