access to healthcare, utilization and health outcomes in turkey
TRANSCRIPT

Introduction Theoretical Background Research Design Analysis Modelling Strategy Conclusion Future work
Access to Healthcare, Utilization and HealthOutcomes in Turkey
Can KarahasanPiri Reis University
Firat BilgelOkan University
ERF WorkshopThe Economics of Healthcare in the ERF Region
MENA Health Policy ForumCairo, Egypt
22 May 2016
1 / 30

Introduction Theoretical Background Research Design Analysis Modelling Strategy Conclusion Future work
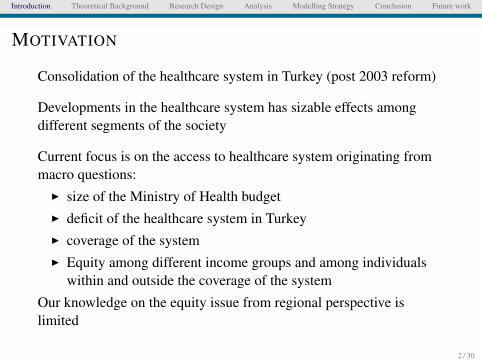
MOTIVATION
Consolidation of the healthcare system in Turkey (post 2003 reform)
Developments in the healthcare system has sizable effects amongdifferent segments of the society
Current focus is on the access to healthcare system originating frommacro questions:
I size of the Ministry of Health budgetI deficit of the healthcare system in TurkeyI coverage of the systemI Equity among different income groups and among individuals
within and outside the coverage of the system
Our knowledge on the equity issue from regional perspective islimited
2 / 30

Introduction Theoretical Background Research Design Analysis Modelling Strategy Conclusion Future work
MOTIVATION
Consolidation of the healthcare system in Turkey (post 2003 reform)
Developments in the healthcare system has sizable effects amongdifferent segments of the society
Current focus is on the access to healthcare system originating frommacro questions:
I size of the Ministry of Health budgetI deficit of the healthcare system in TurkeyI coverage of the systemI Equity among different income groups and among individuals
within and outside the coverage of the system
Our knowledge on the equity issue from regional perspective islimited
2 / 30

Introduction Theoretical Background Research Design Analysis Modelling Strategy Conclusion Future work
RESEARCH QUESTION(S)Given the extent of regional disparities in Turkey and given sizablemeasures to transform the healthcare system during the last decade:
I What is the extent of regional healthcare inequality in Turkey?Focus is on the accessibility and outcome
I How do we define access to healthcare system?Potential vs. revealed accessibility
I Is it possible to offer an alternative way to measures inequalities?Spatial Analysis of healthcare system
I What is the extent of spatial dependence, heterogeneity andpersistence of regional differences?Spatiotemporal patterns
I How do we incorporate geography to introduce a geographicalaccessibility measure?
I What is the relationship between access to healthcare system andhealth outcomes of Turkish regions?
3 / 30

Introduction Theoretical Background Research Design Analysis Modelling Strategy Conclusion Future work
HUMAN CAPITAL DEVELOPMENT:HEALTH AND EQUITY
I Gallup and Sachs (2001) and Barro (2013) indicate the impact ofhealth based human capital development in order to understandcross country income differences.
I Lopez-Casasnovas et al. (2005), Frohlich et al. (2006), Fang etal. (2010) put forward the regional dimension by examining intracountry variation of healthcare development
4 / 30

Introduction Theoretical Background Research Design Analysis Modelling Strategy Conclusion Future work
DATA AND SAMPLE
DescriptionData Source: TurkStat, Ministry of Health Care Statistical YearbooksLevel of disaggregation: NUTS 3 (81 Province)Time Dimension: 2009-2014
CategorizationPotential healthcare accessibilityHealthcare utilization (revealed accessibility)Healthcare outcome
5 / 30

Introduction Theoretical Background Research Design Analysis Modelling Strategy Conclusion Future work
HEALTHCARE VARIABLES
I Potential healthcare accessibilitypractitioners per 100K population (gptp)specialists per 100K population (specptp)
I Healthcare utilization (revealed accessibility)primary healthcare visits (phcvpc )secondary healthcare visits (sthcvpc)
I Healthcare outcomesinfant mortality (imr1)under five mortality rates (imr5)crude death rate in hospitals per 1K population (crudehosp)
6 / 30

Introduction Theoretical Background Research Design Analysis Modelling Strategy Conclusion Future work
HOW TO DEFINE INEQUALITY?
I Usual suspectsI Theil Decomposition
T =
n∑i=1
yilog(
yi
xi
)+
n∑g=1
YgTg (1)
I Spatial Concentration - AutocorrelationMoran’s I and Geary’s C
I =ns
∑i wij(xi − x̄)(xj − x̄)∑
z2i
(2)
C =(n − 1)(
∑i∑
j wij(xi − xj)
2(∑
i∑
j wij)(xi − xj)2 (3)
7 / 30

Introduction Theoretical Background Research Design Analysis Modelling Strategy Conclusion Future work
WEIGHT MATRIX CONSTRUCTION
I Contiguity Weight Matrix
wi,j =
w = 0 if i=jw = 0 if i,j non-neighborw = 1 if i,j neighbor
(4)
I Inverse Distance Weight Matrix
wi,j =1
dni,j
(5)
I k-th Nearest Weight Matrix
wi,j =
w = 0 if i = jw = 0 if di,j > Di(k)w = 1 if di,j ≤ Di(k)
(6)
8 / 30

Introduction Theoretical Background Research Design Analysis Modelling Strategy Conclusion Future work
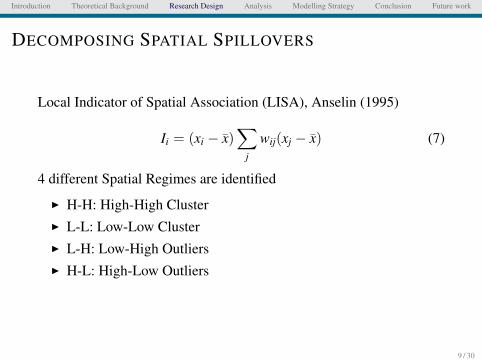
DECOMPOSING SPATIAL SPILLOVERS
Local Indicator of Spatial Association (LISA), Anselin (1995)
Ii = (xi − x̄)∑
j
wij(xj − x̄) (7)
4 different Spatial Regimes are identified
I H-H: High-High ClusterI L-L: Low-Low ClusterI L-H: Low-High OutliersI H-L: High-Low Outliers
9 / 30
Introduction Theoretical Background Research Design Analysis Modelling Strategy Conclusion Future work
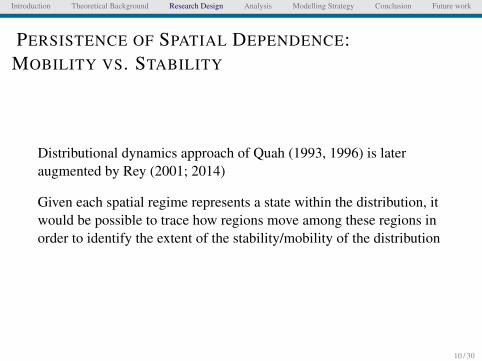
PERSISTENCE OF SPATIAL DEPENDENCE:MOBILITY VS. STABILITY
Distributional dynamics approach of Quah (1993, 1996) is lateraugmented by Rey (2001; 2014)
Given each spatial regime represents a state within the distribution, itwould be possible to trace how regions move among these regions inorder to identify the extent of the stability/mobility of the distribution
10 / 30

Introduction Theoretical Background Research Design Analysis Modelling Strategy Conclusion Future work
SPATIAL MARKOV CHAIN ANALYSIS
Low-Low Low-High High-Low High-High
Low-Low 0 II I IIIALow-High II 0 IIIB IHigh-Low I IIIB 0 IIHigh-High IIIA I II 0
Source: Rey (2001)
F0,t, FI,t, FII,t, FIIIA,t, FIIIB,t
n = F0,t + FI,t + FII,t + FIIIA,t + FIIIB,t
Cohesion index:
Ct =FIIIA,t
n(8)
Augmented cohesion index:
C∗t =
FIIIA,t + F0,t
n(9)
11 / 30

Introduction Theoretical Background Research Design Analysis Modelling Strategy Conclusion Future work
INCORPORATING THE IMPACT OF GEOGRAPHY:GEOGRAPHIC ACCESSIBILITY
I NEG framework to define market access / potential - Reddingand Schott (2003); Redding and Venables (2004)
I Harris (1954) market potential index is defined to control for thedemand and supply based potential of Turkish provinces
HAi =Hi
Dij(10)
I H measures the province based healthcare indicator(demand/supply in NEG framework, accessibility/utilization inthe current framework) of any region, D represents the physicaldistance between any pair of province.
12 / 30

Introduction Theoretical Background Research Design Analysis Modelling Strategy Conclusion Future work
DESCRIPTIVE FIGURES
Mean Std. Dev. CoV Min-Max
2009 2014 2009 2014 2009 2014 2009 2014
gpptp 52.10 55.48 7.58 7.78 0.15 0.14 0.48 0.41specptp 62.82 76.64 24.59 27.35 0.39 0.36 0.17 0.19phcvpc 2.94 2.79 0.92 0.78 0.31 0.28 0.09 0.15sthcvpc 4.23 5.38 0.70 0.81 0.16 0.15 0.46 0.44imr1 13.77 10.99 3.27 3.40 0.24 0.31 0.38 0.20imr5 17.49 13.18 4.83 4.09 0.28 0.31 0.30 0.25crudehosp 10.87 15.80 4.34 5.88 0.40 0.37 0.08 0.08
Notes: For the phcvpc variable we use the 2012 data for 2009
13 / 30

Introduction Theoretical Background Research Design Analysis Modelling Strategy Conclusion Future work
DECOMPOSITION OF INEQUALITIES
2009 2014
Theil Within Between Theil Within BetweenIndex (%) (%) Index (%) (%)
gpptp 0.011 30.26 69.83 0.010 57.51 42.49specptp 0.064 35.79 64.21 0.059 40.41 59.59phcvpc 0.053 20.33 79.65 0.043 21.39 78.61sthcvpc 0.013 48.46 51.54 0.011 55.83 44.17imr1 0.028 44.72 55.28 0.044 29.86 70.16imr5 0.036 30.95 69.05 0.045 25.18 74.84crudehosp 0.084 28.66 71.34 0.073 43.19 56.80
Notes: For the phcvpc variable we use the 2012 data for 2009
14 / 30

Introduction Theoretical Background Research Design Analysis Modelling Strategy Conclusion Future work
SPATIAL CONCENTRATION
15 / 30

Introduction Theoretical Background Research Design Analysis Modelling Strategy Conclusion Future work
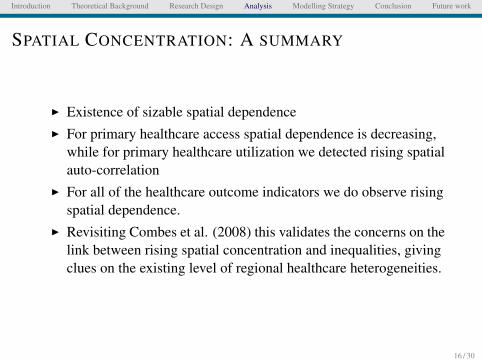
SPATIAL CONCENTRATION: A SUMMARY
I Existence of sizable spatial dependenceI For primary healthcare access spatial dependence is decreasing,
while for primary healthcare utilization we detected rising spatialauto-correlation
I For all of the healthcare outcome indicators we do observe risingspatial dependence.
I Revisiting Combes et al. (2008) this validates the concerns on thelink between rising spatial concentration and inequalities, givingclues on the existing level of regional healthcare heterogeneities.
16 / 30
Introduction Theoretical Background Research Design Analysis Modelling Strategy Conclusion Future work
SPATIAL CONCENTRATION: A SUMMARY
I Existence of sizable spatial dependenceI For primary healthcare access spatial dependence is decreasing,
while for primary healthcare utilization we detected rising spatialauto-correlation
I For all of the healthcare outcome indicators we do observe risingspatial dependence.
I Revisiting Combes et al. (2008) this validates the concerns on thelink between rising spatial concentration and inequalities, givingclues on the existing level of regional healthcare heterogeneities.
16 / 30

Introduction Theoretical Background Research Design Analysis Modelling Strategy Conclusion Future work
DECOMPOSITION OF SPATIAL CONCENTRATION
LISA Analysis of Infant Mortality Rates (2009)
Not Significant
Low−Low
High−Low
High−High
17 / 30

Introduction Theoretical Background Research Design Analysis Modelling Strategy Conclusion Future work
DECOMPOSITION OF SPATIAL CONCENTRATION
LISA Analysis of Infant Mortality Rates (2014)
Not Significant
Low−Low
Low−High
High−Low
High−High
18 / 30

Introduction Theoretical Background Research Design Analysis Modelling Strategy Conclusion Future work
DECOMPOSITION OF SPATIAL CONCENTRATION
LISA Analysis of Crude Death Rates at Hospital (2009)
Not Significant
Low−Low
Low−High
High−Low
High−High
19 / 30

Introduction Theoretical Background Research Design Analysis Modelling Strategy Conclusion Future work
DECOMPOSITION OF SPATIAL CONCENTRATION
LISA Analysis of Crude Death Rates at Hospital (2014)
Not Significant
Low−Low
Low−High
High−Low
High−High
20 / 30
Introduction Theoretical Background Research Design Analysis Modelling Strategy Conclusion Future work
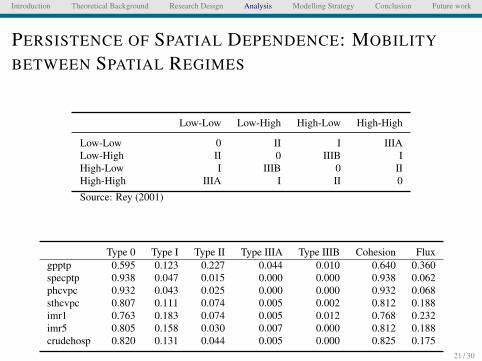
PERSISTENCE OF SPATIAL DEPENDENCE: MOBILITY
BETWEEN SPATIAL REGIMES
Low-Low Low-High High-Low High-High
Low-Low 0 II I IIIALow-High II 0 IIIB IHigh-Low I IIIB 0 IIHigh-High IIIA I II 0
Source: Rey (2001)
Type 0 Type I Type II Type IIIA Type IIIB Cohesion Fluxgpptp 0.595 0.123 0.227 0.044 0.010 0.640 0.360specptp 0.938 0.047 0.015 0.000 0.000 0.938 0.062phcvpc 0.932 0.043 0.025 0.000 0.000 0.932 0.068sthcvpc 0.807 0.111 0.074 0.005 0.002 0.812 0.188imr1 0.763 0.183 0.074 0.005 0.012 0.768 0.232imr5 0.805 0.158 0.030 0.007 0.000 0.812 0.188crudehosp 0.820 0.131 0.044 0.005 0.000 0.825 0.175
21 / 30

Introduction Theoretical Background Research Design Analysis Modelling Strategy Conclusion Future work
ECONOMETRIC SPECIFICATION
I Non-Spatial Models: Cross Section and Panel Fixed EffectsI Spatial Models: Panel Fixed Effects (Spatial Lag and Error
Models)
Spatial Lag Procedure: Spatal Auto Regressive Models (SAR)
HOi,t = a + bHi,t + ρWHOi,t + εi,t (11)
Spatial Error Models (SEM)
HOi,t = a + bHi,t + Wλεi,t (12)
22 / 30

Introduction Theoretical Background Research Design Analysis Modelling Strategy Conclusion Future work
RESULTS: CROSS SECTION MODELS
23 / 30

Introduction Theoretical Background Research Design Analysis Modelling Strategy Conclusion Future work
RESULTS: PANEL MODELS
24 / 30

Introduction Theoretical Background Research Design Analysis Modelling Strategy Conclusion Future work
RESULTS: SPATIAL PANEL MODELS: SAR
25 / 30

Introduction Theoretical Background Research Design Analysis Modelling Strategy Conclusion Future work
RESULTS: SPATIAL PANEL MODELS: SEM
26 / 30

Introduction Theoretical Background Research Design Analysis Modelling Strategy Conclusion Future work
SUMMARY OF ECONOMETRIC MODELS
I Cross section and panel models underline the significant impactof access and utilization on understanding regional healthoutcome differences
I Controlling for spatial networks via lag and error proceduresdepresses the impact of access and utilization
I Note that no regional controls are used so farI Geographical access is interestingly influencing our results:
impact of access and utilization is reloaded
27 / 30

Introduction Theoretical Background Research Design Analysis Modelling Strategy Conclusion Future work
TO CONCLUDE...
I Inequalities matter for healthcare developmentI Outcome of healthcare services is spatially more concentrated,
more heterogeneous and less mobile within the distributionI Modelling outcome shows that even access and utilization
matters, this impact is not robust as incorporating spatialnetworks weakens the impact of access and utilization.
I Using the geographical access as distance weighted access andutilization measures reloads the impact of the two.
28 / 30

Introduction Theoretical Background Research Design Analysis Modelling Strategy Conclusion Future work
TO DO LIST...
I Discussion on the literature for health and development.Similarly theoretical discussions are going to be reviewed inorder to formalize the background of the central researchquestion.
I Analysis of the spatial varying relationship by estimating theGWR models.
I Augment all set of models by using some other regional controlvariables.
I Discussing the policy issues on healthcare system in conjunctionwith the regional development paradigm.
I Central focus will be diverted to the one size fits approach ofboth healthcare and regional policies.
29 / 30

Introduction Theoretical Background Research Design Analysis Modelling Strategy Conclusion Future work
Thank you, Q/A
30 / 30