accepted manuscript identification of a munc13-sensitive
TRANSCRIPT

ACCEPTED MANUSCRIPT
Identification of a Munc13-sensitive step in chromaffin cell large dense-core vesicle exocytosis
Jens Rettig, Jakob B Sørensen, Benjamin H Cooper, Nils Brose, Sonja M WojcikKwun-nok Mimi Man, Cordelia Imig, Alexander Matthias Walter, Paulo S Pinheiro, David R Stevens,
http://dx.doi.org/10.7554/eLife.10635DOI:
Cite as: eLife 2015;10.7554/eLife.10635
Published: 17 November 2015Accepted: 16 November 2015Received: 5 August 2015
and proofing.formatted HTML, PDF, and XML versions will be made available after technical processing, editing, This PDF is the version of the article that was accepted for publication after peer review. Fully
elife.elifesciences.org at Sign up for alertsStay current on the latest in life science and biomedical research from eLife.

Identification of a Munc13-sensitive step in chromaffin cell large 1 dense-core vesicle exocytosis 2 Kwun-nok M. Man1, Cordelia Imig1, Alexander M. Walter2, Paulo S. 3 Pinheiro3, David R. Stevens4, Jens Rettig4, Jakob B. Sørensen3, Benjamin 4 H. Cooper1, Nils Brose1, and Sonja M. Wojcik1. 5 6 1Department of Molecular Neurobiology, Max Planck Institute of Experimental 7 Medicine, D-37075 Göttingen, Germany 8 2Leibniz Institute for Molecular Pharmacology, D-13125 Berlin, Germany 9 3Department of Neuroscience and Pharmacology, Faculty of Health and Medical 10 Sciences and Lundbeck Foundation Center for Biomembranes in Nanomedicine, 11 University of Copenhagen, 2200N Copenhagen, Denmark 12 4Department of Physiology, Saarland University, D-66421 Homburg, Saar, Germany 13 Contact: [email protected] 14
Tel: +49 551 3899 722 15 Fax: +49 551 3899 715 16 17
Short title: Munc13s in LDCV Priming and Docking 18 19

2
Abstract 20 It is currently unknown whether the molecular steps of large dense-core vesicle 21 (LDCV) docking and priming are identical to the corresponding reactions in synaptic 22 vesicle (SV) exocytosis. Munc13s are essential for SV docking and priming, and we 23 systematically analyzed their role in LDCV exocytosis using chromaffin cells lacking 24 individual isoforms. We show that particularly Munc13-2 plays a fundamental role in 25 LDCV exocytosis, but in contrast to synapses lacking Munc13s, the corresponding 26 chromaffin cells do not exhibit a vesicle docking defect. We further demonstrate that 27 ubMunc13-2 and Munc13-1 confer Ca2+-dependent LDCV priming with similar 28 affinities, but distinct kinetics. Using a mathematical model, we identify an early 29 LDCV priming step that is strongly dependent upon Munc13s. Our data demonstrate 30 that the molecular steps of SV and LDCV priming are very similar while SV and 31 LDCV docking mechanisms are distinct. 32 33

3
Introduction 34 The regulated, Ca2+-triggered secretion of catecholamines from chromaffin cell 35 LDCVs is an integral part of the physiological adaption to environmental stressors. 36 Like the exocytosis of neuronal SVs, LDCV exocytosis is mediated by SNARE 37 complex formation, in concert with Ca2+ sensors and essential regulatory proteins 38 (James and Martin, 2013; Neher, 2006; Ovsepian and Dolly, 2011; Pang and Sudhof, 39 2010). 40 Mammalian uncoordinated 13 (Munc13) proteins are essential SV priming factors in 41 neurons (Augustin et al., 1999; Richmond et al., 1999; Rosenmund et al., 2002), and 42 ultrastructural studies have shown that in synapses lacking Munc13s/Unc-13, SVs 43 also fail to physically dock to synaptic active zones (Imig et al., 2014; Siksou et al., 44 2009; Weimer et al., 2006). At the molecular level, this morphological phenotype 45 most likely corresponds to a role of Munc13s in mediating the formation of SNARE 46 complexes at vesicular release sites (Hammarlund et al., 2007; Hammarlund et al., 47 2008; Imig et al., 2014; Ma et al., 2011; Ma et al., 2013; Yang et al., 2015). 48 The Munc13 family consists of five members, Munc13-1 (Unc13a), Munc13-2 49 (Unc13b), Munc13-3 (Unc13c), the brain specific angiogenesis inhibitor I-associated 50 protein 3 (Baiap3), and the non-neuronal isoform Munc13-4 (Unc13d) (Koch et al., 51 2000). Genetic deletion of Unc13a and Unc13b completely eliminates SV exocytosis 52 in hippocampal neurons (Varoqueaux et al., 2002), and selectively reduces synaptic 53 vs. extrasynaptic exocytosis of neuronal LDCVs (van de Bospoort et al., 2012), which 54 indicates that SV and LDCV exocytosis at active zones is mediated by similar 55 molecular mechanisms. By contrast, studies in C. elegans and Drosophila have shown 56 that Unc-13/dUnc-13 selectively regulate SV release, whereas the Ca2+-dependent 57

4
activator proteins for secretion (CAPS/Unc-31) specifically regulate LDCV release 58 (Hammarlund et al., 2008; Renden et al., 2001; Speese et al., 2007; Zhou et al., 2007). 59 In mammals, Munc13s and CAPSs appear to perform non-redundant functions critical 60 for both SV and LDCV exocytosis in neurons (Jockusch et al., 2007; van de Bospoort 61 et al., 2012), as well as for LDCV exocytosis in neuroendocrine cells (Elhamdani et 62 al., 1999; Kabachinski et al., 2014; Kang et al., 2006; Kwan et al., 2006; Liu et al., 63 2010; Liu et al., 2008; Speidel et al., 2008). Yet, to date, while CAPS-1 and CAPS-2 64 have been shown to be required for LDCV exocytosis in mammalian chromaffin cells 65 (Liu et al., 2010; Liu et al., 2008), evidence that endogenous Munc13s are required 66 for LDCV exocytosis is lacking. In fact, the role of Munc13-1 and ubMunc13-2 has 67 only been examined in the context of overexpression studies, and other isoforms have 68 not been investigated (Ashery et al., 2000; Bauer et al., 2007; Liu et al., 2010; Stevens 69 et al., 2005; Zikich et al., 2008). 70 In the present study, we performed the first comprehensive analysis of all neuronal 71 and neuroendocrine members of the Munc13 protein family in chromaffin cells, 72 defining their respective roles in LDCV exocytosis. We identify the Ca2+-dependent 73 step in the priming process at which Munc13-1 and ubMunc13-2 operate, and 74 demonstrate that, although they are critical for LDCV priming and release, LDCV 75 docking can occur without them. 76
77

5
Results 78 Expression of Munc13 isoforms in the mouse adrenal gland 79 We first analyzed the expression of all Munc13 isoforms in the murine adrenal gland 80 by Western blotting (Figure 1). In perinatal adrenal glands, we detected Munc13-1 81 (Figure 1A and Figure 1–figure supplement 1B), the ubiquitous isoform ubMunc13-2 82 (Figure 1B and Figure 1–figure supplement 1B), and Baiap3 (Figure 1D). Not 83 detected were the brain-specific isoform of Munc13-2 (bMunc13-2), which is a splice 84 variant expressed from the same gene as ubMunc13-2 (Figure 1B), Munc13-3 (Figure 85 1C), and the non-neuronal isoform Munc13-4 (Figure 1E). To directly compare the 86 expression levels of Munc13-1, ubMunc13-2, bMunc13-2, and Munc13-3, we used 87 knockin mice that express these proteins fused to enhanced yellow or green 88 fluorescent protein (EYFP/EGFP) from the respective endogenous loci (Cooper et al., 89 2012; Kalla et al., 2006). We found that ubMunc13-2-EYFP is the only isoform 90 readily detectable in the adrenal gland using an antibody to the GFP-derived tags 91 (Figure 1–figure supplement 1A). 92 To assess whether the isoforms detected in whole gland homogenates are present in 93 the adrenal medulla, and/or the adrenal cortex, we dissected adult wild-type (WT) 94 adrenal glands, and used an antibody to the LDCV marker Chromogranin A (CgA) to 95 monitor effective separation of the medullary tissue, which consists mostly of 96 chromaffin cells, from cortical tissue (Figure 1F). The expression of Munc13-1 and 97 Baiap3 in the adrenal gland is largely restricted to the medulla. Expression of 98 ubMunc13-2 was detected in both adrenal medulla and cortex. Thus, a significant 99 fraction of the ubMunc13-2 signal detected in whole gland homogenates (Figure 1B) 100

6
appears to originate from the adrenal cortex, possibly due to innervation of the cortex 101 by ubMunc13-2 positive synapses. 102 103 Absence of Munc13-1, Munc13-3, or Baiap3 does not impair LDCV exocytosis in 104 chromaffin cells 105 Next, we analyzed cultured chromaffin cells from knockout (KO) mice deficient for 106 the individual Munc13 isoforms (Figure 2). LDCV exocytosis was triggered using 107 flash photolysis of caged Ca2+, which causes a sharp global increase in intracellular 108 [Ca2+] (Neher, 2006). Fusion of LDCVs with the plasma membrane was monitored by 109 measurement of the membrane capacitance change (ΔCm). Fitting a sum of three 110 exponentials to the exocytotic burst of each individual trace identifies the amplitudes 111 and time constants of release, which are generally interpreted as two kinetically 112 distinct vesicle pools, the fast burst as the Readily-Releasable Pool (RRP), and the 113 slow burst as the Slowly-Releasable Pool (SRP) (Sorensen et al., 2003a; Voets, 2000). 114 However, as will be discussed later, the slow burst component may in fact not be a 115 releasable pool, but instead represent the conversion from a Non-Releasable Pool 116 (NRP), to the RRP (Walter et al., 2013). The rate of sustained release was measured 117 as a linear component after the exocytotic burst, and reflects the ongoing recruitment 118 of LDCVs into the NRP/SRP and RRP. Deletion of Munc13-1 (Unc13a), the major 119 Munc13 isoform in SV exocytosis (Augustin et al., 1999; Varoqueaux et al., 2002), 120 did not markedly alter LDCV exocytosis compared to WT littermate controls (Figure 121 2A,D), nor did it affect the kinetics of the exocytotic burst (Figure 2D). 122 Although we did not detect Munc13-3 in the adrenal gland, we wanted to rule out 123 possible physiological effects of protein expression below the detection limit of 124

7
Western blot analysis (Figure 1C), and included Unc13cKO mice in our analysis. 125 However, as expected, LDCV exocytosis in Unc13cKO chromaffin cells was not 126 perturbed (Figure 2B,D). 127 We then investigated the possible role of Baiap3 in LDCV exocytosis, as this isoform 128 is prominently expressed in the adrenal medulla (Figure 1D,F). Surprisingly, LDCV 129 exocytosis in Baiap3KO cells was intact (Figure 2C,D). Furthermore, Baiap3KO cells 130 also did not show a release deficit when we stimulated the cells using a series of 131 depolarization steps (Figure 2–figure supplement, 1A-C), nor did overexpression of 132 Baiap3 in WT cells affect LDCV exocytosis (Figure 2–figure supplement 1D-F). 133 134 Absence of ubMunc13-2 dramatically reduces LDCV release 135 We then analyzed the role of ubMunc13-2 and Munc13-1 in chromaffin cell LDCV 136 exocytosis. For this purpose, we used an Unc13a/b (DKO) mouse line. Heterozygous 137 (Het) animals of this line express ~50 % of WT levels of Munc13-1 and Munc13-2, 138 which does not affect neurotransmission (Augustin et al., 1999; Varoqueaux et al., 139 2002). Data were collected from genotype groups available for a given litter and were 140 pooled for analysis. Because our breeding scheme did not produce littermate WT 141 animals in sufficient numbers, and because deletion of Unc13a alone was without 142 effect, data from Unc13aWTUnc13bHet and Unc13aHetUnc13bHet cells were pooled and 143 used as control (Figure 2E-J, Unc13aWT/HetUnc13bHet). 144 Deletion of both Unc13a alleles together with a single Unc13b allele 145 (Unc13aKOUnc13bHet) did not reduce LDCV release (Figure 2E,F). By contrast, 146 abrogation of ubMunc13-2 expression alone, irrespective of the Unc13a genotype, 147

8
drastically diminished release (Figure 2E,F). Furthermore, in the context of the 148 Unc13bKO background, cells with Unc13aWT, Unc13aHet, and Unc13aKO genotypes 149 showed a progressive reduction of LDCV release that depended on the number of 150 Unc13a alleles present (Figure 2F,G). The fast and slow burst components were 151 reduced to 39%, 32%, and 27%, and to 54%, 52%, and 42% of control levels, 152 respectively (Figure 2F). The rate of sustained release was reduced even more 153 dramatically, to 26%, 19%, and 12% of control levels (Figure 2F). When one uses the 154 Unc13aWTUnc13bKO genotype as a reference point (Figure 2G), the deletion of 155 Unc13a caused a reduction of the sustained release component to 48%. The rate of 156 sustained release of Unc13aKOUnc13bKO cells was also significantly reduced when 157 compared to Unc13aHetUnc13bKO cells. 158 The deletion of both Unc13a and Unc13b significantly delayed the onset of vesicular 159 exocytosis triggered by flash photolysis, compared to control and 160 Unc13aKOUnc13bHet cells (Figure 2H). Unc13aWTUnc13bKO cells also showed a mild 161 increase in delay. However, this difference was significant only when compared to 162 Unc13aKOUnc13bHet cells, but not compared to the other groups. 163 Thus, ubMunc13-2, the only isoform expressed from the Unc13b gene in mouse 164 chromaffin cells, is the most critical isoform for LDCV release in this cell type. 165 Moreover, in its absence it becomes apparent that endogenous Munc13-1 also 166 regulates LDCV release in this cell type. 167 168 169 170

9
Reduced IRP and RRP in the absence of ubMunc13-2 171 We next assessed whether ubMunc13-2 affects LDCV release in response to Ca2+ 172 entry through voltage-gated Ca2+ channels by stimulating the cells with a series of 173 depolarization steps (Figure 3). The first six short depolarizations of the train release 174 the Immediately-Releasable Pool (IRP), i.e. the subset of RRP vesicles located closest 175 to Ca2+-channels (Schonn et al., 2010; Voets et al., 1999). We found a significant 176 reduction in LDCV release; the size of the RRP in Unc13bKO cells was reduced to 177 53% of WT levels (Figure 3C). This deficit is somewhat less pronounced than the 178 reduction seen in the flash photolysis experiment (reduction to 39%, Figure 2F), most 179 likely because the depolarization protocol used to obtain the data shown in Figure 3 180 lasts several seconds and therefore causes some ongoing recovery of the RRP. By 181 contrast, in flash photolysis experiments, the RRP is probed within ∼60 ms (3 times 182 the time constant), which is much faster than the recovery of the RRP. Strikingly, in 183 the depolarization experiment, impaired release in Unc13bKO cells was already 184 evident in response to the first 10-ms depolarization (Figure 3B), which implies that 185 lack of ubMunc13-2 would even affect resting level catecholamine release driven by 186 low frequency stimulation (Zhou and Misler, 1995). 187 188 Reduced catecholamine release in the absence of ubMunc13-2 189 To understand how ubMunc13-2 affects the kinetics of single catecholamine release 190 events, we performed single spike amperometry while infusing the cells with a 191 solution with moderate (∼4.6 µM) [Ca2+] (Figure 4). Unc13bKO cells showed a 192 dramatic reduction in spike frequency (Figure 4B,C), whereas basic spike parameters 193 such as duration, half-width, maximum amplitude, charge, rise time, and decay time 194

10
were unchanged (Figure 4D-I). Amplitude, duration and charge of the spike foot 195 signal, which is thought to reflect release during the initial formation of the fusion 196 pore prior to full fusion, were also unchanged (Figure 4J-L). However, we found that 197 the number of spikes that did show these foot signals was slightly reduced in 198 Unc13bKO cells (Figure 4M), which may indicate that fusion pore dynamics are 199 altered for some release events. However, overall, the LDCVs undergoing fusion in 200 the absence of ubMunc13-2 do so without major alterations in fusion kinetics or 201 vesicle content. 202 203 Munc13 isoforms display different LDCV priming efficiencies 204 As our experiments so far showed that, with the exception of Baiap3, the contribution 205 of the Munc13 isoforms to the regulation of LDCV release correlates with their level 206 of expression in perinatal adrenal glands, we next wanted to compare the intrinsic 207 properties of the different isoforms. To this end, we overexpressed Munc13-1, 208 ubMunc13-2, Baiap3, and its closest relative Munc13-4 using Semliki Forest Virus 209 (SFV) in Unc13aKOUnc13bKO cells. Munc13-1 and ubMunc13-2 were expressed as 210 EGFP fusion constructs whose functions are identical to those of the respective WT 211 proteins (Rosenmund et al., 2002), whereas Baiap3 and Munc13-4 were expressed as 212 internal ribosome entry site (IRES)-EGFP constructs, to avoid possible confounding 213 effects of a fusion tag. Unc13aKOUnc13bKO cells expressing only EGFP were used as 214 control. For the purpose of comparison, the averaged traces obtained from the rescue 215 experiments with the four isoforms were plotted in the same graph (Figure 5A). The 216 exocytotic burst was measured as the ΔCm within the first 0.5 s after the flash 217 stimulus, and the rate of sustained release was measured as the ΔCm between 0.5 s 218

11
and 4 s after the flash (Figure 5B). Interestingly, Munc13-1 and ubMunc13-2 were 219 both able to rescue the LDCV release deficit of Unc13aKOUnc13bKO cells (Figure 220 5A,B). However, rescue with ubMunc13-2 resulted in an enormous enhancement of 221 LDCV exocytosis to levels that by far exceeded the amount of exocytosis typical of 222 WT cells, for both the exocytotic burst and the rate of sustained release (Figure 223 5A,B). The direct comparison of Munc13-1 and ubMunc13-2 expressing cells with 224 matching EGFP fluorescence intensity confirmed that the stronger enhancement of 225 burst size and rate of sustained release in ubMunc13-2 expressing cells was not due to 226 higher expression levels of ubMunc13-2 (Figure 5–figure supplement 1). 227 Overexpression of Baiap3 failed to rescue the LDCV release deficit of the 228 Unc13aKOUnc13bKO chromaffin cells (Figure 5A,B). Yet, its closest relative, 229 Munc13-4, which regulates SNARE-mediated vesicular exocytosis in the 230 hematopoietic system (Feldmann et al., 2003; Shirakawa et al., 2004), was able to 231 rescue LDCV exocytosis in Unc13aKOUnc13bKO cells, albeit less efficiently than 232 Munc13-1 or ubMunc13-2 (Figure 5A,B). To exclude the possibility that these 233 findings might be due to inefficient translation of Baiap3 and Munc13-4, protein 234 expression was confirmed with isoform-specific antibodies in SFV-infected neuronal 235 cultures, which provide enough material for Western blot analysis (Figure 5–figure 236 supplement 2). Thus, individual Munc13 isoforms appear to show inherent 237 differences in their ability to promote LDCV release in chromaffin cells. 238 239 LDCV docking in the absence of ubMunc13-2 and Munc13-1 240 We went on to investigate whether Unc13aKOUnc13bKO chromaffin cells show an 241 LDCV docking defect analogous to the SV docking defect seen in 242

12
Unc13aKOUnc13bKO synapses (Siksou et al., 2009). SV docking deficits of 243 Munc13/Unc-13 deficient synapses in mice and C. elegans were previously only 244 detected when rapid cryo-fixation methods were employed instead of classical 245 chemical fixation for ultrastructural analysis (Siksou et al., 2009; Weimer et al., 246 2006). Moreover, it has been shown that 3D electron tomography (ET) allows a more 247 accurate assessment of SV docking at the active zone (Imig et al., 2014; Siksou et al., 248 2009). To study LDCV recruitment and docking in chromaffin cells, we therefore 249 combined high-pressure freezing (HPF) and freeze-substitution of acute adrenal gland 250 slices with classical 2D-EM (Figure 6A-E) and high-resolution 3D-ET analyses 251 (Figure 6F-N). Quantitative analysis of 2D-EM images of Unc13aHetUnc13bHet 252 (Figure 6A) and Unc13aKOUnc13bKO chromaffin cells (Figure 6B) did not reveal any 253 differences in LDCV distribution within 2 μm of the plasma membrane (PM) (Figure 254 6C), in the number of membrane-proximal LDCVs within 40 nm of the PM (Figure 255 6D), or in the total number of LDCVs (Figure 6E). LDCV docking and recruitment 256 into the vicinity of the PM were assessed using 3D-ET (Figure 6F-N). From all 257 LDCVs analyzed within 100 nm of the PM, the percentage of membrane-proximal 258 LDCVs (0-40 nm) (Figure 6M) and their distribution (Figure 6L) was unaltered 259 between both groups, indicating that LDCV recruitment to the PM is intact in 260 Munc13-deficient chromaffin cells. The number of docked LDCVs, defined as 261 LDCVs in physical contact with the PM and assigned to the 0-4 nm bin in Figure 6L, 262 and the number of docked LDCVs normalized to the number of membrane-proximal 263 LDCVs (Figure 6N) were unchanged. Furthermore, the average LDCV diameter of 264 docked or non-docked LDCVs, measured by 3D-ET, did not differ significantly 265 between genotypes, although Unc13aKOUnc13bKO LDCVs tended to be smaller 266 (Figure 6–figure supplement 1). Thus, in spite of the dramatic release deficit seen in 267

13
Unc13aKOUnc13bKO chromaffin cells and the dramatic SV docking deficit seen in 268 neurons of this genotype (Siksou et al., 2009), we did not detect any changes in 269 LDCV docking, nor a loss or accumulation of LDCVs in the vicinity of the PM. Thus, 270 chromaffin cells can generate what appears to be a full-sized pool of morphologically 271 docked LDCVs in the absence of Munc13-1 and Munc13-2, which implies that the 272 molecular requirements of morphological LDCV and SV docking are distinct. 273 Additionally, this could either indicate that the mechanism of functional docking, i.e. 274 priming, differs between LDCV and SVs as well, or else, that the primed LDCVs (i.e. 275 those that belong to the RRP) are in the minority among the docked vesicles and 276 therefore cannot be detected. 277 To distinguish between these two possibilities, we estimated the total number of 278 docked LDCVs per cell. To this end, we re-calculated the percentage of docked 279 vesicles identified using 3D-ET, as the percentage of membrane proximal vesicles (0-280 40 nm) identified in the 2D-EM analysis and converted LDCVs/μm PM to 281 LDCVs/cell as described (Parsons et al., 1995). This conversion was necessary due to 282 the limited volume sizes analyzed by 3D-ET and the uneven distribution of LDCVs 283 within the cells. The estimated size of the morphologically docked pool was ∼662 284 LDCVs per chromaffin cell in control cells. For Unc13aKOUnc13bKO cells we 285 calculated ∼865 docked LDCVs per cell, which can be accounted for by two factors 286 used in the calculation: Unc13aKOUnc13bKO cells are slightly larger, and their LDCVs 287 are slightly smaller (Figure 6–figure supplement 1). Both values are lower than the 288 previously reported ∼1607 for embryonic day (E)18 murine chromaffin cells (de Wit, 289 2010), presumably reflecting improved discrimination between docked and undocked 290 vesicles by 3D-ET. With a diameter of a docked LDCV of ∼170 nm (Figure 6–figure 291 supplement 1E) and assuming a specific membrane capacitance of 1 μF/cm2, this 292

14
corresponds to a vesicular capacitance of 0.91 fF, in excellent agreement with recent 293 electrophysiological measurements of 0.94 fF (Pinheiro et al., 2014). Thereby, the 294 size of the RRP, which is <40 fF at resting [Ca2+] (Voets, 2000), corresponds to <44 295 vesicles from the total of ∼662 in control cells, indicating that even with 3D-ET, the 296 RRP will be very hard or even impossible to distinguish morphologically from other 297 docked vesicles in adrenal chromaffin cells. 298 299 Identification of a Munc13-sensitive step in LDCV priming 300 Thus far, our data indicate that although morphological docking of LDCVs does not 301 require Munc13s, the priming of a functional RRP does. We therefore wanted to 302 identify the Munc13-sensitive step in the LDCV priming process, and compare the 303 intrinsic properties of Munc13-1 and ubMunc13-2, the two most relevant isoforms in 304 the adrenal medulla. In a recently published mathematical model for LDCV fusion, 305 we showed that the fast and slow bursts of release originate from two serially 306 arranged pools of vesicles, the RRP and the non-releasable NRP, respectively (Walter 307 et al., 2013) (Figure 7). The NRP in turn is refilled from a larger depot pool. Thus, the 308 model features two separate priming steps (Liu et al., 2010), but only one fusion 309 pathway (Figure 7E). Since the deletion of Unc13a and Unc13b changed the fast and 310 slow burst to nearly the same degree (Figure 2F), within the framework of this model, 311 Munc13s must act upstream of the NRP. Furthermore, since the sustained release rate 312 is changed proportionally as well, Munc13s likely act to accelerate the forward 313 priming rate, k1 (Ashery et al., 2000). In most models, this rate constant k1 is Ca2+-314 dependent (Voets, 2000; Walter et al., 2013), and confers overall Ca2+-dependence to 315

15
the primed vesicle pool. We next investigated how the two relevant Munc13-isoforms 316 in chromaffin cells (ubMunc13-2, Munc13-1) affect this priming step. 317 The Ca2+-dependence of LDCV-priming (essentially k1 in Figure 7E) can be assessed 318 in an experiment by varying the pre-flash intracellular [Ca2+], before an uncaging 319 flash is used to probe the size of the primed vesicle pool (Voets, 2000). We expressed 320 either Munc13-1 or ubMunc13-2 in Unc13aKOUnc13bKO cells and extended the range 321 of pre-flash [Ca2+] values from the previously used 300-600 nM (Figure 2 and Figure 322 5) to 250-1200 nM (Figure 7A and Figure 7–figure supplement 1). In order to 323 compare the respective Ca2+-sensitivities rather than the absolute priming rates of 324 Munc13-1 and ubMunc13-2 – and to overcome cell-to-cell variability – we 325 normalized capacitance traces to their value after 3 s (Figure 7A, left and middle 326 panels). Using the fractional increase in capacitance after 30 ms as a read-out of the 327 primed vesicle pool, we identified the characteristic Ca2+-dependence of priming. 328 Strikingly, the Ca2+-dependence was almost identical for the two isoforms and could 329 be fitted with a single Hill equation (Figure 7A right-hand panel, Table 1). 330 Thus, Ca2+-dependent priming is supported with identical steady-state affinities in the 331 presence of Munc13-1 or ubMunc13-2. However, when applying Ca2+-uncaging 332 flashes from a relatively low pre-flash [Ca2+], the two isoforms induce quite different 333 secretion kinetics (Figure 7B,C). For ubMunc13-2, secretion shows a clear sigmoid 334 shape with acceleration after ∼0.5 s (Figure 7C), which is absent when the pre-flash 335 [Ca2+] is higher. This sigmoid shape of ubMunc13-2 driven secretion was noted 336 before and was attributed to a slow association of ubMunc13-2 with Calmodulin and 337 Ca2+, resulting in a slow “priming switch” (Zikich et al., 2008). In contrast, Munc13-1 338 does not show this secondary acceleration (Figure 7B), regardless of the pre-flash 339 [Ca2+]. To understand the origin of this behavior, we modeled the Ca2+ association 340

16
with the priming sensor (PS) explicitly - in our previous model (Walter et al., 2013), 341 this step had been assumed to be always in equilibrium. In accordance with the 342 observed identical steady state Ca2+ dependencies (Figure 7A), we used identical 343 dissociation constant (KD) values for both isoforms, and varied only the on-rate, kon, 344 (the off-rate was changed simultaneously, koff = KD*kon, with constant KD). This led 345 to a very satisfactory fit to both Munc13-1 and ubMunc13-2 data from both low and 346 high pre-flash [Ca2+] (Figure 7B,C). Also, this model made it possible to fit both the 347 control trace, and the Unc13bKO trace (Figure 7D). Importantly, the fit was performed 348 simultaneously to all traces, so that we could ensure consistency between fits, 349 simplify the interpretation of parameter changes, and ensure that all conditions could 350 be reproduced by one version of our model (for fitted parameters, refer to Table 1). 351 Our model (Figure 7E) assumes that the NRP vesicles can only fuse after maturing to 352 the RRP state (Walter et al., 2013). Earlier models assumed that the 'NRP pool' can 353 fuse directly via an alternative pathway; in those cases, the corresponding pool was 354 called ‘Slowly Releasable’ (SRP) (Voets, 2000). We note that our conclusion that 355 Munc13-1/ubMunc13-2 exert their main effects upstream of both pools (NRP/SRP 356 and RRP), i.e. on k1, is consistent with both ideas (see also Ashery et al., 2000). 357 Therefore our observations here do not necessarily distinguish between the parallel 358 pool model (SRP and RRP are both releasable) and the sequential pool model (only 359 the RRP is releasable); but see (Walter et al., 2013) for data supporting the sequential 360 pool model). 361 The modeling resulted in two main conclusions (Table 1): First, as expected, the 362 action of Munc13 (either isoform) is consistent with an increase in k1 – the forward 363 rate of priming within the first priming step (Figure 7E). This is seen both by the 364 increase in the fitted k1 upon overexpression of either isoform, and by the decrease of 365

17
k1 in the Unc13bKO cells. Second, ubMunc13-2 increases k1 4.5-fold more than 366 Munc13-1, but it does so after a longer delay. In the model, this delay is due to slower 367 kinetics of Ca2+ binding to the priming sensor (Zikich et al., 2008). Note that this step 368 might coincide with the translocation of Munc13-1 or ubMunc13-2 to the membrane 369 as a prerequisite for the priming action of the protein. Thus, the different delays might 370 reflect differences in the membrane translocation step. As a minor note, we also 371 noticed that k2, the forward rate of downstream priming (“priming 2”, Figure 7E) 372 always changed in the opposite direction of k1. The reason for this is unclear, but one 373 explanation could be that the protein(s) driving downstream priming compete with 374 Munc13 for association with the fusion machinery. 375 376 377
18
Discussion 378 Our study provides a comprehensive analysis of the Munc13 protein family in LDCV 379 docking and priming, and shows that genetic deletion of Munc13-1 (Unc13a) and 380 Munc13-2 (Unc13b) severely impairs LDCV release in chromaffin cells. Yet 381 surprisingly, LDCV docking, unlike SV docking, does not require Munc13s. We 382 furthermore identify the step most sensitive to Munc13s in the LDCV priming 383 process, and show that ubMunc13-2 and Munc13-1 accelerate this step with identical 384 Ca2+ affinities but distinct Ca2+ binding rates. 385 The essential role of Munc13s in vesicular release appears to lie in the opening of 386 Syntaxin (Stx-1)/Munc18-1 complexes, to permit the formation of Stx-1/SNAP-25 387 heterodimers that act as docking platforms for the vesicular SNARE protein 388 Synaptobrevin-2 (Syb-2) (Hammarlund et al., 2007; Ma et al., 2011; Ma et al., 2013; 389 Richmond et al., 1999; Sassa et al., 1999; Yang et al., 2015). SNARE complex 390 assembly is thought to proceed in an N- to C-terminal zipper-like fashion (Fasshauer 391 and Margittai, 2004; Pobbati et al., 2006; Sorensen et al., 2006; Walter et al., 2010), 392 and, at least for SVs, this assembly seems to be the molecular correlate of both the 393 physical docking process, and acquisition of fusion competence, which is referred to 394 as priming (Imig et al., 2014). However, as will be discussed below, morphological 395 docking of LDCVs does not require Munc13s (Figure 6), yet the priming of a full-396 sized RRP does (Figure 2), indicating that LDCV docking and functional priming do 397 not represent a one-step process in neuroendocrine cells. 398 399 400

19
LDCV and SV docking have distinct requirements 401 Our data demonstrate that although Munc13s are critical for functional priming of 402 LDCVs in chromaffin cells, morphological LDCV docking, even when assessed by 403 3D-ET at unprecedented resolution, is not impaired in the absence of Munc13s 404 (Figure 6). Thus, in contrast to synapses, where most, if not all docked SVs are part of 405 the RRP, the majority of docked LDCVs in chromaffin cells are not primed, and the 406 functional RRP therefore cannot be distinguished from other docked LDCVs by 407 current ultrastructural methods. Although we cannot completely exclude the 408 possibility that Munc13-3 and Munc13-4 may be present at very low levels, that we 409 were unable to detect (Figure 1), it seems unlikely that their presence could account 410 for the full-sized pool of docked LDCVs in Unc13aKOUnc13bKO cells. 411 This raises the question of how the non-primed LDCVs are docked. SV docking 412 requires the SNARE proteins Stx-1, SNAP-25, and Syb-2, as well as Munc13s and 413 CAPSs, but not necessarily the Ca2+ sensor of fusion, Synaptotagmin-1 (Syt-1) (Imig 414 et al., 2014). By contrast, current models imply that LDCV docking is mediated by 415 Syt-1, possibly via interaction with the Stx-1/SNAP-25 acceptor complex (de Wit et 416 al., 2006; de Wit et al., 2009; Parisotto et al., 2012). Additionally, Munc18-1 docks 417 LDCVs via its interaction with the closed form of Stx-1 (Gandasi and Barg, 2014; 418 Gerber et al., 2008; Gulyas-Kovacs et al., 2007; Han et al., 2011; Voets et al., 2001) 419 and is also involved in an additional tethering step (Toonen et al., 2006). The 420 vesicular SNAREs seem to be dispensable for docking in chromaffin cells 421 (Borisovska et al., 2005; Gerber et al., 2008), although they have been implicated in 422 PC12 cells (Wu et al., 2012). Some of these discrepancies are most likely due to 423 methodological and terminological differences as well as to limitations in assessing 424 true membrane attachment. However, since we used the same experimental approach 425

20
previously employed to detect SV docking deficits (Imig et al., 2014; Siksou et al., 426 2009), our data clearly show that the molecular requirements of SV and LDCV 427 docking are distinct. More specifically, while the formation of the docked/primed 428 RRP requires Munc13s in both cases, and thus appears to be mechanistically quite 429 similar for SVs and LDCVs, the non-primed LDCVs in chromaffin cells appear to 430 dock via a separate, Munc13-independent mechanism. 431 432 Our findings are therefore consistent with the following model of LDCV docking and 433 priming: (i) LDCV docking mediated by Munc18-1/Stx-1, this configuration would 434 be the starting point for Munc13-mediated SNARE complex assembly, i.e. priming 435 (Ma et al., 2011; Ma et al., 2013), and in parallel, (ii) LDCV docking mediated by a 436 second configuration, that would not be expected to progress to SNARE complex 437 assembly directly or as efficiently, and thus be consistent with the large unprimed, but 438 docked LDCV pool. What this second configuration would look like in terms of 439 molecular interactions is less clear. Docking via Syt-1/Stx-1/SNAP-25 complexes 440 would be consistent with un-primed docking (de Wit et al., 2009). This mode of 441 docking would require the assumption that in chromaffin cells, Stx-1/SNAP-25 442 complexes can escape NSF/SNAP mediated disassembly. An additional or alternative 443 mode of un-primed docking may involve the recruitment of vesicles based on the 444 interaction of Syt-1 with phosphatidylinositol 4,5-bisphosphate (PIP2)/Stx-1 clusters 445 (Honigmann et al., 2013; Park et al., 2015), although further interactions may be 446 required to achieve close membrane apposition. 447 In the model suggested above, we explicitly included only molecular components for 448 which docking deficits have been demonstrated in chromaffin cells. However, LDCV 449

21
docking most likely involves additional factors. For instance, the docking of LDCVs 450 to Munc18-1/Stx-1 complexes probably requires the interaction between Munc18 and 451 the vesicle-associated small GTPases Rab3 and Rab27 (Graham et al., 2008; Tsuboi 452 and Fukuda, 2006; van Weering et al., 2007), and additional docking/tethering factors 453 may be involved in docking both primed and un-primed LDCVs to the membrane. 454 455 Release kinetics of LDCV pools as correlates of SNARE complex assembly 456 Our analysis of how Munc13s prime LDCVs for fusion identifies the earliest phase of 457 the priming process as the step most sensitive to Munc13s. We interpret our data 458 according to a model that features Munc13 as a Ca2+-sensitive priming protein in a 459 single pathway to LDCV fusion with two serially arranged vesicle states or pools 460 (NRP and RRP) (Figure 7E). This essentially allows us to describe what was 461 previously interpreted as the release of two kinetically distinct LDCV pools (SRP and 462 RRP), as two sequential priming processes, priming 1 and priming 2, resulting in only 463 one releasable pool, the RRP (Walter et al., 2013). According to previous data, the 464 step most sensitive to Munc13s – priming 1 – is also the step affected by mutations 465 designed to interfere with the initiation of N-terminal SNARE complex assembly 466 (Walter et al., 2013; Walter et al., 2010). This is in line with a function of Munc13s in 467 initiating SNARE-complex assembly (Yang et al., 2015). The second priming step 468 may involve a downstream, presumably more C-terminal phase of SNARE-complex 469 assembly, although other options remain open. Thus, in the model (Figure 7E), the 470 formation of the NRP, i.e. the step most sensitive to Munc13s, most likely represents 471 the initiation of N-terminal SNARE complex assembly. 472 473

22
Catalysis of fast and slow LDCV priming by Munc13-1 and ubMunc13-2 474 As our study demonstrates, Munc13 isoforms differ in their ability to facilitate LDCV 475 priming (Figure 5). We detected three endogenously expressed isoforms in murine 476 chromaffin cells, Munc13-1, ubMunc13-2, and Baiap3 (Figure 1). Baiap3, somewhat 477 surprisingly given its prominent expression and ability to translocate to membranes in 478 a Ca2+-dependent manner (Lecat et al., 2015), does not appear to be involved in 479 LDCV priming in this cell type. However, Munc13-4, which regulates SNARE- 480 mediated vesicle exocytosis in the hematopoietic system (Boswell et al., 2012; 481 Feldmann et al., 2003; Shirakawa et al., 2004), and is the closest relative of Baiap3 482 (Koch et al., 2000), can promote LDCV priming, albeit less efficiently than Munc13-483 1 and ubMunc13-2. 484 The two most relevant isoforms, Munc13-1 and ubMunc13-2, promote LDCV 485 priming with very similar steady-state Ca2+-affinities, but nonetheless confer unique 486 release kinetics depending on the pre-stimulus [Ca2+]. Modeling of the secretion 487 kinetics produced by overexpression of Munc13-1 and ubMunc13-2 in 488 Unc13aKOUnc13bKO cells allowed us to isolate the intrinsic properties of each isoform 489 (Table 1). Secretion driven solely by the dominant isoform ubMunc13-2 shows a 490 characteristic sigmoid shape at low pre-stimulus [Ca2+] (Figure 7C) (Zikich et al., 491 2008). In our secretion model, the best-fit parameters indicate 2.5-fold slower sensing 492 of [Ca2+] for ubMunc13-2, which can however accelerate priming dramatically when 493 [Ca2+] increases. Thus, the fitted maximum priming rate (k1) for ubMunc13-2 is 4.5-494 fold higher than for Munc13-1. However, although Munc13-1 is unable to support the 495 same maximum priming rate as ubMunc13-2, it reacts faster to a change in the [Ca2+] 496 concentration (Figure 7B), which may reflect distinct conformational changes in 497 response to [Ca2+], and/or differences in a membrane translocation step. 498

23
499 Thus, neuroendocrine cells can fundamentally modify the kinetics of secretion by 500 expressing different Munc13 isoforms. Previous data from autaptic neurons showed 501 that Munc13-1 causes short term depression, whereas ubMunc13-2 causes short-term 502 facilitation (Rosenmund et al., 2002), which parallels our findings in chromaffin cells 503 from low basal [Ca2+], raising the possibility that the functions of different Munc13 504 isoforms in priming LDCVs and SVs are conserved, even though their role in docking 505 is not. Our model therefore provides a theoretical framework for how the molecular 506 properties of priming factors may be linked to the kinetics of exocytosis. 507 508 Sequential actions of upstream and downstream priming catalysts 509 Although Munc13s have the strongest effect on the priming step 1, i.e. the formation 510 of the NRP vesicle state, they also influence priming step 2, i.e. the formation of the 511 RRP. Remarkably, overexpression and deletion of Munc13s change the rate constants 512 k1 (priming 1) and k2 (priming 2) in opposite directions (Figure 7D). One possible 513 reason for this effect could be that the interaction of Munc13s with the SNARE fusion 514 machinery may compete with that of another priming protein, which mainly catalyzes 515 priming step 2. A likely candidate for this second catalyst appears to be CAPS, as 516 deletion of CAPS1 and CAPS2 leads to a significant reduction of the RRP, but has 517 little effect on the NRP/SRP, placing Munc13 upstream of CAPS (Liu et al., 2010; 518 Liu et al., 2008). 519 Furthermore, in PC12 cells, strong stimulation bypasses the need for CAPS-1 in 520 LDCV exocytosis, but not the need for ubMunc13-2 (Kabachinski et al., 2014), and 521

24
the ability of CAPS to promote membrane fusion is impaired by C-terminal mutations 522 in Stx-1 (Daily et al., 2010). We therefore propose an LDCV priming model, in which 523 the Munc13-driven priming step 1 corresponds to the initiation of N-terminal 524 SNARE-complex assembly, and the CAPS-driven priming step 2 represents a more 525 C-terminal, and presumably more easily completed phase of zippering (Gao et al., 526 2012). Assuming that priming step 2 is not catalyzed by CAPS alone but also 527 influenced by Munc13 and possibly Syt-1, such a model would also offer an 528 explanation as to why in both SV and LDCV exocytosis, lack of CAPS can be 529 compensated for by an increase in Ca2+, whereas lack of Munc13 cannot (Jockusch et 530 al., 2007; Kabachinski et al., 2014). 531 532 Conclusion 533 In summary, our data show that mammalian neurons and neuroendocrine cells both 534 require Munc13s to generate fusion-competent vesicles, although the molecular steps 535 leading to LDCV docking prior to SNARE complex assembly appear to be unique. In 536 LDCV priming, the step most sensitive to Munc13s is the initial phase (priming step 537 1), which most likely corresponds to the initiation of N-terminal SNARE-complex 538 assembly. Individual Munc13 isoforms accelerate this step at distinct rates, thereby 539 imparting distinct properties on the kinetics of LDCV release, which indicates that 540 they may have specialized functions in the fine-tuning of catecholamine release in 541 response to varying physiological stimuli. 542 543

25
Materials and methods 544 Animals 545 All experiments were performed in compliance with the regulations of the local 546 Animal Care and Use Committee of Lower Saxony, Oldenburg, Germany. The 547 generation and basic characterization of the KO lines of the Munc13 isoforms has 548 been described previously (Augustin et al., 2001; Augustin et al., 1999; Varoqueaux 549 et al., 2002; Wojcik et al., 2013). Unc13dKO (Unc13dJinx) mice (Crozat et al., 2007) 550 were obtained from Jackson Laboratories. Adult and perinatal mice were killed by 551 decapitation prior to the removal of adrenal glands and other tissues. 552 553 Western blotting and antibodies 554 Adrenal glands of perinatal animals were excised and stored at -80°C prior to use. 555 Adrenal glands from around 20 perinatal animals were pooled for the preparation of 556 homogenates. Homogenates of whole adrenal glands were prepared by 557 homogenization in an ice-cold buffer (320 mM D-glucose, 20 mM HEPES, 2 mM 558 EDTA, pH 7.4, with 0.5 μg/ml leupeptin, 1 μg/ml aprotinin and 0.1 mM PMSF added 559 freshly prior to homogenization), using a Potter S homogenizer. For the preparation of 560 adrenal cortical and medullary homogenates, adrenal glands from WT animals were 561 dissected in ice-cold buffer containing 19 mM NaH2PO4 and 81 mM Na2HPO4 and 562 material from 5-6 animals was pooled. Spleen homogenates were prepared similarly 563 and the DNA in the samples subsequently digested with 0.66 U/μl benzonase (E1014, 564 Sigma-Aldrich) in 3.86 mM MgCl2 for 10 min at 37°C prior to denaturation. Whole 565 brain homogenates were prepared using a Potter S homogenizer and centrifuged for 566

26
10 min at 1000 g at 4°C to remove the nuclear fraction. Homogenates were analyzed 567 by Western blotting with the following antibodies at the indicated dilutions: rabbit-568 anti-Munc13-1 (1:500) (126103, Synaptic Systems), rabbit-anti-ubMunc13-2 569 (1:2000), rabbit-anti-bMunc13-2 (1:1000), rabbit-anti-Munc13-3 (1:500) 570 (Varoqueaux et al., 2005), rabbit-anti-Baiap3 (1:1000) (Wojcik et al., 2013), goat-571 anti-Munc13-4 (1:250) (NB100-41385; Novus Biologicals), rabbit-anti-572 Chromogranin A (1:8000) (259002; Synaptic Systems), mouse-anti-GFP (1:500) 573 (11814460001; Roche), mouse-anti-valosin containing protein (VCP) (1:1000) 574 (612182; BD Transduction Laboratories), and mouse-anti-GAPDH (1:25000) 575 (ab8245; Abcam). Secondary antibodies (goat anti-rabbit IgG, 111035144; goat anti-576 mouse IgG, 115035146, donkey anti-goat, 705-035-147) were obtained from Jackson 577 ImmunoResearch. 578 579 Chromaffin cell culture 580 Chromaffin cell cultures were prepared as described in Sørensen et al. (Sorensen et 581 al., 2003b). Cultures from Unc13aKO and Unc13aKOUnc13bKO mice were prepared on 582 embryonic day (E)18, and from Unc13bKO, Unc13cKO, and Baiap3KO mice on 583 postnatal day (P)0, in each case using littermates of the appropriate genotypes as 584 controls. For overexpression of Baiap3 in WT cells, chromaffin cells from P0 WT 585 C57Bl/6N mice were used. Briefly, adrenal glands were excised and placed into ice-586 cold Locke’s solution (154 mM NaCl, 5.6 mM KCl, 0.84 mM NaH2PO4, 2.14 mM 587 Na2HPO4 and 10 mM D-glucose, pH 7.0). The glands were then transferred to 300 μl 588 of a papain solution [20 U/ml papain (Worthington Biochemical), 200 mg/L L-589 cysteine, 1 mM CaCl2, 0.5 mM EDTA, in DMEM (Gibco)], which had been 590

27
equilibrated for 15 min with 95 % O2 and 5 % CO2, and incubated with gentle shaking 591 for 45 min at 37°C. To terminate the papain digestion, 300 μl of inactivating solution 592 [10 % fetal bovine serum (Gibco), 2.5 g/L trypsin inhibitor (Gibco) and 2.5 g/L 593 albumin in DMEM (Gibco)] were then added, followed by an incubation period of 5 594 min at 37°C. The mixture of solutions was then replaced by 160 μl of DMEM 595 (Linaris) supplemented with 1 % insulin-transferrin-selenium X (Gibco) and 200 U/L 596 penicillin-streptomycin (Gibco). The glands were triturated with a 200-μl pipette tip 597 and the cell suspension was placed as 50 μl drops on coverslips in a 6-well plate. 598 Following an incubation period of 30 min at 37°C at 8 % CO2 to allow cells to settle, 599 2 ml of DMEM (Linaris) with the supplements described above were added per well 600 and the cells were kept at 37°C and 8 % CO2. The cells were used for 601 electrophysiological recordings on days in vitro 2-3. 602 603 Viral constructs 604 Expression constructs based on the SFV plasmid (pSFV1) for Munc13-1 and 605 ubMunc13-2, both subcloned in frame with a C-terminal EGFP, have been described 606 previously (Rosenmund et al., 2002). Munc13-4 and Baiap3 pSFV1 expression 607 constructs were generated as IRES-EGFP constructs using the full-length mouse 608 cDNAs. Production of SFV particles was done according to published protocols 609 (Ashery et al., 1999). Briefly, pSFV1 constructs and pSFV-helper2 DNA were 610 linearized with Spe I and transcribed into RNA using SP6 RNA polymerase. RNA 611 from the pSFV1 constructs and the pSFV-helper2 construct, 10 μg each, were 612 electroporated (500 V, 0.957 mF) into baby hamster kidney 21 cells. Supernatant of 613 cell cultures containing the virus was collected after 24 h. In cases where the virus 614
28
titer was low, the supernatant was concentrated approximately 25-fold using a filter 615 unit with a nominal molecular weight limit of 100 kDa (UFC910024, AMICON). 616 SFV particles encoding the respective Munc13 isoforms with EGFP or only EGFP as 617 a control were added to chromaffin cell cultures, infected cells identified based on the 618 EGFP fluorescence, and electrophysiological recordings performed 4-6 h after 619 addition of the virus. 620 621 Whole-cell capacitance measurements 622 Whole cell patch-clamping was performed with Sylgard-coated 4-6 MΩ pipettes 623 (Science Products) at a setup equipped with a Zeiss Axiovert 200 microscope (Zeiss) 624 and a HEKA EPC-10 amplifier controlled by Patchmaster (HEKA). Capacitance 625 measurements were performed according to the Lindau-Neher technique using the 626 „sine+dc“ mode in the Lockin Extension of Patchmaster. The frequency and peak-to-627 peak amplitude of the sine wave were 1042 Hz and 70 mV, respectively, and the 628 holding potential was -70 mV. Recordings were sampled at 12.5 kHz and filtered at 629 2.9 kHz. Flash photolysis experiments were performed according to established 630 protocols (Voets, 2000; Walter et al., 2010). The extracellular solution contained 147 631 mM NaCl, 10 mM HEPES, 11.1 mM D-glucose, 2.8 mM KCl, 2 mM CaCl2, 1 mM 632 MgCl2 and 3 μM tetrodotoxin (pH 7.2, 300-310 mOsM). For flash experiments, the 633 intracellular solution contained 109 mM L-glutamic acid, 35 mM HEPES, 5 mM 634 nitrophenyl-EGTA (Synaptic Systems), 5.65 mM CaCl2, 2 mM Mg-ATP, 0.3 mM 635 Na-GTP, 0.205 mM fura-4F (Invitrogen), 0.3 mM furaptura (Invitrogen) and 1 mM 636 ascorbic acid (titrated to pH 7.2 with CsOH, osmolarity 290-295 mOsM). The flash 637 stimulus was applied approximately 80 s after the whole-cell configuration was 638

29
established using a xenon lamp (Rapp OptoElectronics). Unless otherwise specified, 639 only cells with pre-flash [Ca2+] in the range of 300-600 nM were used for analysis. In 640 flash photolysis experiments requiring pre-flash [Ca2+] concentrations higher than 600 641 nM (Figure 7 and Figure 7–figure supplement 1), pulses of light at wavelengths of 642 340 and 380 nm were applied at varying frequencies to release Ca2+ from nitrophenyl-643 EGTA and the cell was kept at the target [Ca2+] for ∼20 s before the flash stimulus 644 was given. The pre-flash [Ca2+] was taken as the averaged measured [Ca2+] during the 645 20 s period. In depolarization experiments, the same extracellular solution was used 646 except that tetrodotoxin was omitted. The intracellular solution contained 111 mM L-647 glutamic acid, 35.5 mM HEPES, 17 mM NaCl, 1 mM MgCl2, 2 mM Mg-ATP, 0.3 648 mM Na-GTP (titrated to pH 7.2 with CsOH, osmolarity 290-295 mOsM), and fura-4F 649 and furaptra at the same concentration used in flash experiments. In flash photolysis 650 experiments, pool sizes (fast and slow bursts) and their time constants were obtained 651 by fitting a sum of exponential functions to the capacitance traces (Sorensen et al., 652 2003b), using a custom macro (Three-Exponential-Fit-Macro-Igor) with the software 653 IgorPro (WaveMetrics). The near-linear rate of release of the sustained component is 654 measured as a linear component with the unit capacitance increase per second. The 655 exocytotic delay was defined as the time point where the exponential fit meets the 656 pre-flash capacitance. 657 658 Ca2+ measurements 659 In flash experiments, exocytosis was stimulated by a sudden elevation of intracellular 660 [Ca2+] using UV flash stimuli given by a xenon flash lamp (Rapp OptoElectronics). 661 [Ca2+] measurements were performed according to established protocols (Voets, 662

30
2000; Walter et al., 2010). The ratiometric Ca2+ indicator dyes fura-4F and furaptra 663 were alternately excited at 340 and 380 nm using a Polychrome V monochromator 664 (TILL Photonics), and the emitted light was detected with a photomultiplier. The area 665 of fluorescence measurement was limited to the diameter of the cell. The 340/380 nm 666 fluorescence ratio was independently calibrated at the same dye concentrations with a 667 range of intracellular solutions with known [Ca2+], buffered with Ca2+ buffers 1,2-668 bis(o-aminophenoxy)ethane-N,N,N’,N’-tetraacetic acid (BAPTA, Invitrogen) and 669 diethylenetriaminepentaacetic acid (DPTA, Sigma-Aldrich). The [Ca2+] of the 670 calibration solutions was calculated using KD of BAPTA = 0.222 μM and KD of 671 DPTA = 80 μM. 672 673 Amperometry 674 Amperometric recordings were performed using carbon fibers of 5 µm diameter 675 (Thornel P-650/42; Cytec, NJ, USA), insulated using the polyethylene method 676 (Bruns, 2004). Vesicle fusion was triggered by infusing the cells through the patch 677 pipette with a solution containing 4.6 µM free Ca2+. The fibers were clamped at 700 678 mV and currents were hardware filtered at 3 kHz using an EPC-7 patch clamp 679 amplifier (HEKA). Currents were digitized at 25 kHz and filtered off-line using a 680 Gaussian filter with a cut-off set at 1 kHz. Filtering, spike detection, and analysis 681 were performed using a freely available, custom-written macro (Mosharov and 682 Sulzer, 2005) running under IgorPro (Wavemetrics, Lake Oswego, OR). A spike 683 detection threshold of 5 pA and a foot detection threshold of 2 pA were imposed. For 684 each analyzed cell, the median of each parameter (duration, halftime, amplitude, 685 charge, rise time, decay time, foot amplitude, foot duration, foot charge) was 686

31
calculated from all spikes, and this value was used for averaging between cells 687 (giving the mean of cell medians). 688 689 High-pressure freezing of adrenal gland slices for EM analysis 690 Adrenal glands from E18 animals were embedded in 3% low gelling agarose (Sigma-691 Aldrich) and adrenal gland slices were prepared according to published protocols 692 (Moser and Neher, 1997). Slices were allowed to recover in bicarbonate-buffered 693 saline (125 mM NaCl, 26 mM NaHCO3, 2.5 mM KCl, 1.25 mM NaH2PO4, 2 mM 694 CaCl2, 1 mM MgCl2, 10 mM D-glucose and 0.2 mM (+)-tubocurarine) at 37°C for 15 695 min and were subsequently kept in the same solution at RT before cryofixation. Slices 696 were rapidly frozen in external cryoprotectant (20% BSA in bicarbonate-buffered 697 saline) using a HPM100 HPF device (Leica). After freezing, samples were stored in 698 liquid nitrogen until further processing. Freeze substitution was performed as 699 previously published (Rostaing et al., 2006). Briefly, samples were substituted in 700 anhydrous acetone, fixed by 2% OsO4 in acetone for 7h at -90°C prior to a 701 temperature ramp (5°C/h) to -20°C, an incubation for 16 h at -20°C, and a final ramp 702 (10°C/h) to 4°C. Samples were washed in acetone and infiltrated with EPON resin at 703 room temperature (acetone/EPON 1:1 for 3 h, 90% EPON in acetone overnight, and 704 pure EPON for 36 h). Finally specimen carriers containing infiltrated samples were 705 incubated for 24 h at 60°C to polymerize. Aluminum sample carriers were trimmed 706 off the EPON block with a specimen trimming device (EM TRIM2, Leica) to expose 707 the surface of the embedded tissue for ultramicrotomy. 708 709

32
Sectioning, contrasting, and fiducial marker application for EM 710 An Ultracut UCT ultramicrotome (Leica) was used to cut 500 nm-thick sections until 711 the first tissue appeared. Ultrathin (50 nm) and semithin (400 nm) sections were then 712 collected onto Formvar-filmed, carbon-coated copper slot or mesh grids for 2D and 713 3D ultrastructural analysis, respectively. Vitrified samples were subjected to rigorous 714 quality control (Mobius et al., 2010) and samples exhibiting indications of ice-crystal 715 damage were excluded from the analysis. Ultrathin sections were post-stained with 716 1% uranyl acetate in ddH2O for 30 min, washed several times in ddH2O, stained with 717 0.3% lead citrate for 2 min, washed, and dried with filter paper. For 3D-tomographic 718 analysis, 400 nm-thick sections were briefly incubated in a solution of Protein A 719 conjugated to 10 nm gold particles (Cell Microscopy Center, Utrecht, The 720 Netherlands) to introduce fiducial markers. 721 722 2D-EM analysis of chromaffin cells 723 Electron micrographs (2048 x 2048 pixels) were acquired with a sharp:eye CCD 724 camera (Tröndle, TRS) at 5,000 fold magnification using the multiple image 725 acquisition and alignment feature of iTEM software (version 5.1, Olympus Soft 726 Imaging Solutions GmbH). Assembled montages had dimensions of approximately 21 727 x 21 µm and typically contained 1-3 randomly chosen chromaffin cells. Only 728 chromaffin cells with a clearly visible plasma membrane were included in the 729 analysis. iTEM software was used to measure chromaffin cell plasma membrane 730 circumference and the cytoplasmic area (calculated by subtraction of the nuclear area 731 from the total cell area). Additional parameters including the number of LDCVs and 732 the shortest distance of each LDCV to the plasma membrane were quantified using 733
33
ImageJ software. In regions where the plasma membrane did not appear as a clear cut, 734 the shortest distance from the vesicle membrane to the middle of the membrane 735 projection was measured. For this reason and due to the fact that LDCVs (mean 736 diameter of CTRL LDCVs ~ 160 nm; ~ 170 nm for docked CTRL LDCVs) might 737 have their centers outside of the imaged ultrathin (50 nm) section, we did not quantify 738 LDCV docking as defined by physical membrane-attachment in these 2D projection 739 images, but rather calculated the number of membrane-proximal LDCVs (within 0-40 740 nm of the plasma membrane). All vesicles with electron-dense cargo were included in 741 the analysis. Secretory vesicles of both genotypes exhibited heterogeneity in size (see 742 Figure 6–figure supplement 1) and appearance (e.g. compactness of the dense-core), 743 possibly reflecting distinct LDCV types (e.g. adrenaline vs. noradrenaline) or 744 different levels of maturity present in immature (E18) chromaffin cells. Data are 745 presented as LDCV density (number of LDCVs per µm² area cytoplasm), the number 746 of LDCVs within 40 nm of the plasma membrane normalized to the cell perimeter, 747 and the mean frequency distribution of LDCVs from the plasma membrane in 40 nm 748 bins. 749 750 3D-EM analysis of LDCV docking in chromaffin cells 751 For high-resolution electron tomographic analysis of LDCV docking in adrenal 752 chromaffin cells, we randomly selected regions between two neighboring cells that 753 exhibited a high density of LDCVs in proximity of the plasma membrane in thick 754 (400 nm) sections. Single-axis tilt series were acquired from -60° to +60° with 1° 755 increments and binned by the factor two at 10,000 fold magnification using an Orius 756 SC1000 camera (Gatan) and the SerialEM software for automated tilt series 757

34
acquisition (Mastronarde, 2005). Tomograms were reconstructed using the IMOD 758 package (Kremer et al., 1996), and exported as z-stacks for analysis with ImageJ 759 (National Institutes of Health). All analyses were performed blindly and manually. 760 The smallest distance between the plasma membrane and the outer leaflet of each 761 LDCV membrane was measured at its vesicular midline using the straight-line tool of 762 ImageJ on individual virtual z-slices. Only vesicles observed in physical contact with 763 the plasma membrane in tomographic volumes were considered ‘docked’. In 764 distribution analyses docked LDCVs were assigned to the 0-4 nm bin to account for 765 the voxel dimensions of reconstructed tomograms (isotropic voxel size = 2.86 nm). 766 The number of membrane-attached (0-4 nm, ‘docked’) LDCVs identified in a 767 tomographically reconstructed volume was normalized to the number of membrane-768 proximal (0-40 nm of plasma membrane) LDCVs. The number of membrane-769 proximal (0-40 nm) LDCVs was expressed as a percentage of all LDCVs within 100 770 nm of the plasma membrane and compared across genotypes to test for potential 771 differences in the ability of recruiting LDCVs close to the plasma membrane. The 772 frequency distribution displays the number of docked LDCVs (0-4 nm, first bin) and 773 subsequently the distances of LDCVs from the plasma membrane in 2 nm bins. 774 Statistical analyses were performed using Student’s t-test. The mean LDCV diameter 775 was calculated from the area of the LDCV measured at its midline including the 776 vesicular phospholipid bilayer in electron tomograms by using the elliptical selection 777 tool in ImageJ. All LDCVs in the randomly chosen field of view that contained their 778 midline within the tomographic volume were analyzed (Figure 6–figure supplement 779 1). 780 781

35
For illustrative purposes, figures depicting tomographic subvolumes represent an 782 overlay of 3 consecutive slices produced by the slicer tool of the 3dmod software of 783 the IMOD package to generate a ~ 8.6 nm thick subvolume. 784 785 Calculation of the number of docked LDCVs per chromaffin cell 786 The size of the pool of docked LDCVs per cell can be calculated from the number of 787 LDCVs per µm² PM area (na) (Parsons et al., 1995; Plattner et al., 1997). We 788 measured the number of membrane-proximal LDCVs (0-40 nm of PM) per µm PM 789 length (nl) in ultrathin sections of 0.05 µm thickness. Our 3D-ET approach permitted 790 us to accurately measure LDCV diameters (dv in µm) in chromaffin cells (Figure 6–791 figure supplement 1). The number of LDCVs per µm² PM area could then be 792 calculated as na = nl/(dv + 0.05) (Parsons et al., 1995; Plattner et al., 1997). The 793 average cell surface area (ac in µm2) per genotype was estimated based on the average 794 cell capacitance measured in cultured cells assuming 1 μF/cm2. We chose this 795 method, rather than using the cell circumference measured in ultrathin sections, 796 because the chromaffin cells in adrenal slices are not round, but have rather complex 797 shapes (Figure 6–figure supplement 1). Using either measurement, the 798 Unc13aKOUnc13bKO cells were slightly larger, by 5% based on capacitance, and by 799 15% based on cell circumference measurements. 800 Unc13aHetUnc13bHet control cells: 801 nl: 0.984 ± 0.075 vesicles per µm length 802 dv: 0.1627 ± 0.005 µm vesicle diameter 803 na: 4.627 vesicles per µm² PM area 804 ac: 421.23 µm² cell membrane area 805

36
The estimated number of LDCVs within 40 nm of the PM in Unc13aHetUnc13bHet 806 chromaffin cells is therefore ~ 1949. Our 3D analysis of LDCV docking revealed that 807 only 33.97% of LDCVs within 40 nm of the PM are physically attached to the PM, 808 therefore we estimated the pool of docked vesicles to contain ~ 662 LDCVs in our 809 acute adrenal slice preparation. 810 Unc13aKOUnc13bKO cells: 811 nl: 1.150 ± 0.083 vesicles per µm length 812 dv: 0.1525 ± 0.003 µm vesicle diameter 813 na: 5.679 vesicles per µm² PM area 814 ac: 442.26 µm² cell membrane area 815 The estimated number of LDCVs within 40 nm of the PM in Unc13aKOUnc13bKO 816 chromaffin cells is therefore ~ 2511. Our 3D analysis of LDCV docking revealed that 817 only 34.43% of LDCVs within 40 nm of the PM are physically attached to the PM, 818 therefore we estimated the pool of docked vesicles to contain ~ 865 LDCVs in our 819 acute adrenal slice preparation. 820 821 Modeling the Ca2+-dependence of vesicle priming 822 We simulated capacitance traces in Ca2+ uncaging experiments with an exocytosis 823 model that was adapted from a previous study of ours (Walter et al., 2013) to 824 explicitly describe the Ca2+ dependent vesicle priming reaction. Parameters (Table 1) 825 were either taken from the literature, directly from experiments (Figure 7A), or 826 determined by fitting the model to experimental capacitance traces. 827

37
We assume that Munc13 proteins act on the Ca2+-dependent priming reaction, which 828 ensures the refilling of vesicles from a large depot pool (Voets, 2000). We wanted to 829 explicitly describe this reaction in terms of its thermodynamic steady state binding 830 properties (i.e. its dissociation constant KD and cooperativity n), and in terms of its 831 Ca2+ binding kinetics. Let the chemical equation for Ca2+ binding to the priming 832 sensor (PS) be: 833
∗ + ( ) Then its overall dissociation constant KD is defined as: 834
= [ ][ ] 835 In order to obtain the values of the and n experimentally, we pre-equilibrated 836 chromaffin cells at different pre-flash [Ca2+] prior to uncaging. The secretion 837 responses were averaged in bins and normalized to their respective values 3 s after the 838 flash. Fitting the fraction of release 30 ms after the uncaging stimulus as a function of 839 pre flash [Ca2+] with the following Hill equation (non-linear curve fitting routine of 840 Origin Pro 8 G, OriginLab Corporation) allowed us to estimate and n: 841
([ ]) = [ ] 842 Where ([ ]) is the relative release at 30 ms, and [ ] is the pre-flash 843 Ca2+ concentration. , n and are free parameters. The best fit is shown as 844 solid line in Figure 7 and the values of n and can be found in Table 1. 845 We assume that priming is only increased when the proper number (n) of Ca2+ ions 846 are bound to the PS. Therefore, the rate of priming is proportional to the fraction ( ) 847

38
of PS that has bound the correct number of Ca2+ ions divided by the total amount of 848 PS: 849
( ) = [ ][PS ]
( ) = ( )
Where k is the asymptotic value of the priming rate for [ ] ≫ . Since the 850 total amount of PS is the sum of Ca2+-free and Ca2+-bound PS: 851
( ) = [ ][ ] + [PS] At steady state, the following relationships hold: 852
( ) = [ ]+ [ ]
( ) = [ ]+ [ ]
In order to describe temporal changes in this fraction at non-equilibrium conditions, 853 the Ca2+ concentrations ([ ]) were interpolated from the experimental values and 854 the concentration of [ ] was calculated at all time points by numerical 855 integration using the “ode15s” function in Matlab (version R2013a, Mathworks) of 856 the kinetic equation: 857
[ ] = [ ][ ] − [ ] We assume that the amount of PS is not limiting (i.e. that each vesicle contains a PS). 858 Then, by investing the relationships 859

39
[V ] = [ ] + [ ] and 860
= kk
we obtain 861 [ ] = ([V ] − [ ]) [ ] − [ ]
Such that the fraction of activated PS can be calculated at time t: 862 ( , ) = [ ]( )[V ]
863 This allows us to calculate at all times t. 864 865
( , ) = ( , )
866 Our model consists of a sequence of mandatory steps for vesicle maturation and 867 fusion (Walter et al., 2013). Vesicles from the depot enter a non-releasable state 868 (NRP, Figure 7E) from which they cannot fuse directly. Instead, these vesicles first 869 need to mature into the readily releasable pool (RRP), a transition that is governed by 870 a Ca2+-dependent rate constant (k2(Ca2+)). This Ca2+-dependence is modeled by a 871 Ca2+-dependent catalyst as described in Walter et al., 2013: 872 873

40
k2(Ca2+)=k20+g(Ca2+)k2cat 874 k-2(Ca2+)=k-20+g(Ca2+)k-2cat 875
=
876 As in our previous study, we assume that binding of one Ca2+ ion activates the 877 catalyst and that the catalyst is in equilibrium with Ca2+, which allows us to calculate 878 ( ): 879 880
( ) = [ ], + [ ] 881 Kinetic equations of the exocytosis model 882
[ ] = − ( )[ ] + [ ] [ ] = ( )[ ] − + ( ) [ ] + ( )[ ] [ ] = ( )[ ] − ( ( ) + 3 [ ])[ ] + [ ] [ ] = 3 [ ][ ] − ( + 2 [ ])[ ] + 2 [ ] [ ] = 2 [ ][ ] − (2 + [ ])[ ]
+ 3 [ ]
41
[ ] = [ ][ ] − (3 + )[ ] [ ] = [ ]
883 Modeling of exocytosis upon Ca2+ uncaging 884 To find the steady state occupation of the system ( ), ( ) and 885 ( ) were calculated for the experimental pre-flash Ca2+ values, the first five 886 kinetic equations were taken and set to zero, and mass conservation of vesicles was 887 obeyed: 888 0 = [ ] + [ ] + [ ] + [ ] + [ ] + [ ]− [V ] This system of 6 equations was solved using the function “fsolve” of Matlab (version 889 R2013a, Mathworks). The steady state values were used as starting values for the 890 numerical integration of the kinetic equations using the “ode15s” function of Matlab 891 (version R2013a, Mathworks). 892 For parameter optimization, model simulations were compared to experimental 893 capacitance data. The parameters of the model were varied and the goodness of fit 894 was determined in a cost function, which was the sum of squared deviations between 895 data and model prediction. In order to avoid bias towards data with larger secretion, 896 the cost function used relative deviations: deviations were normalized to the maximal 897 value of either the experimental capacitance trace or the simulated one, whichever 898 was smaller (led to a larger cost): 899

42
= ℎ ( )max ( )− ( ) max ( ) < max( )
= ℎ ( )max( ) ( )− ( ) max ( ) ≥ ( )
900 Three principal kinetic components have been described in capacitance traces: a fast 901 component with a time constant of tens of milliseconds, a slower component with a 902 time constant of hundreds of milliseconds and a sustained component with a time 903 constant of several seconds (Voets, 2000). To account for the fact that more data 904 points exist for slower components (due to the constant sampling rate) which would 905 dominate the fit, deviations at shorter times after the uncaging flash were given larger 906 weight: the weight was 100 for all datapoints upto 80 ms after the uncaging stimulus; 907 the weight was 10 for all datapoints occurring later than 80 ms, but earlier than 1.2 s 908 after the stimulus; the weight was 1 for all datapoints thereafter. To ensure 909 consistency, all conditions depicted in Figure 7 were fitted simultaneously and the 910 cost values from all data were summed. Only the parameters labeled with “best fit” in 911 Table 1 were allowed to vary. Because the lowest bin of the capacitance traces of the 912 DKO overexpressing Munc13-1 and ubMunc13-2 in Figure 7B and C contained 913 relatively few cells, the total number of vesicles was also a free parameter under these 914 conditions (best fit values Vtot(Munc13-1 low Ca2+)=2120 fF, Vtot(Munc13-1 low 915 Ca2+)=3340 fF). All parameters were optimized by minimizing the cost values using a 916

43
Nelder-Mead Simplex algorithm implemented in the Matlab function “fminsearch” 917 (version R2013a, Mathworks). 918 919 Statistics 920 Statistical analyses were performed using two-tailed Student’s t-test, ANOVA with 921 post-hoc Tukey’s test, or Mann-Whitney U test as specified in the figure legends. 922 923 Acknowledgements 924 This work was supported by the Max Planck Society. K-M.M. was supported by the 925 German Academic Exchange Service and the Göttingen Graduate School for 926 Neurosciences, Biophysics and Molecular Biosciences. A.W. was supported by the 927 Emmy Noether Program of the Deutsche Forschungsgemeinschaft. The work was 928 supported by The Danish Council for Independent Research in Medical Sciences 929 (J.B.S.). We thank J.-S. Rhee for advice, A. Zeuch, A. Günther, I. Beulshausen, S. 930 Bolte, F. Benseler, I. Thanhäuser, D. Schwerdtfeger, C. Harenberg, and M. Schlieper 931 for excellent technical support, and the MPIEM animal facility for mouse husbandry. 932 The authors declare no competing financial interests. 933 Author contributions: K-M.M., C.I., J.S., B.C., N.B. and S.W. designed research; K-934 M.M., C.I., A.W., P.P. and B.C. performed research; K-M.M., C.I., A.W., P.P., D.S., 935 J.R., J.S. and S.W. analyzed data; K-M.M., C.I., A.W., J.S., N.B. and S.W. wrote the 936 paper. 937 938 939

44
References 940 941
Ashery, U., A. Betz, T. Xu, N. Brose, and J. Rettig. 1999. An efficient method for 942 infection of adrenal chromaffin cells using the Semliki Forest virus gene 943 expression system. Eur. J. Cell Biol. 78:525-532. 944
Ashery, U., F. Varoqueaux, T. Voets, A. Betz, P. Thakur, H. Koch, E. Neher, N. 945 Brose, and J. Rettig. 2000. Munc13-1 acts as a priming factor for large dense-946 core vesicles in bovine chromaffin cells. EMBO J. 19:3586-3596. 947
Augustin, I., S. Korte, M. Rickmann, H.A. Kretzschmar, T.C. Sudhof, J.W. Herms, 948 and N. Brose. 2001. The cerebellum-specific Munc13 isoform Munc13-3 949 regulates cerebellar synaptic transmission and motor learning in mice. J. 950 Neurosci. 21:10-17. 951
Augustin, I., C. Rosenmund, T.C. Sudhof, and N. Brose. 1999. Munc13-1 is essential 952 for fusion competence of glutamatergic synaptic vesicles. Nature. 400:457-953 461. 954
Bauer, C.S., R.J. Woolley, A.G. Teschemacher, and E.P. Seward. 2007. Potentiation 955 of exocytosis by phospholipase C-coupled G-protein-coupled receptors 956 requires the priming protein Munc13-1. J. Neurosci. 27:212-219. 957
Borisovska, M., Y. Zhao, Y. Tsytsyura, N. Glyvuk, S. Takamori, U. Matti, J. Rettig, 958 T. Sudhof, and D. Bruns. 2005. v-SNAREs control exocytosis of vesicles from 959 priming to fusion. EMBO J. 24:2114-2126. 960
Boswell, K.L., D.J. James, J.M. Esquibel, S. Bruinsma, R. Shirakawa, H. Horiuchi, 961 and T.F. Martin. 2012. Munc13-4 reconstitutes calcium-dependent SNARE-962 mediated membrane fusion. J. Cell Biol. 197:301-312. 963
Bruns, D. 2004. Detection of transmitter release with carbon fiber electrodes. 964 Methods. 33:312-321. 965
Cooper, B., M. Hemmerlein, J. Ammermuller, C. Imig, K. Reim, N. Lipstein, S. 966 Kalla, H. Kawabe, N. Brose, J.H. Brandstatter, and F. Varoqueaux. 2012. 967 Munc13-independent vesicle priming at mouse photoreceptor ribbon synapses. 968 J. Neurosci. 32:8040-8052. 969
Crozat, K., K. Hoebe, S. Ugolini, N.A. Hong, E. Janssen, S. Rutschmann, S. Mudd, S. 970 Sovath, E. Vivier, and B. Beutler. 2007. Jinx, an MCMV susceptibility 971 phenotype caused by disruption of Unc13d: a mouse model of type 3 familial 972 hemophagocytic lymphohistiocytosis. J. Exp. Med. 204:853-863. 973
Daily, N.J., K.L. Boswell, D.J. James, and T.F. Martin. 2010. Novel interactions of 974 CAPS (Ca2+-dependent activator protein for secretion) with the three 975 neuronal SNARE proteins required for vesicle fusion. J. Biol. Chem. 976 285:35320-35329. 977
de Wit, H. 2010. Molecular mechanism of secretory vesicle docking. Biochem. Soc. 978 Trans. 38:192-198. 979

45
de Wit, H., L.N. Cornelisse, R.F. Toonen, and M. Verhage. 2006. Docking of 980 secretory vesicles is syntaxin dependent. PLoS One. 1:e126. 981
de Wit, H., A.M. Walter, I. Milosevic, A. Gulyas-Kovacs, D. Riedel, J.B. Sorensen, 982 and M. Verhage. 2009. Synaptotagmin-1 docks secretory vesicles to syntaxin-983 1/SNAP-25 acceptor complexes. Cell. 138:935-946. 984
Elhamdani, A., T.F. Martin, J.A. Kowalchyk, and C.R. Artalejo. 1999. Ca(2+)-985 dependent activator protein for secretion is critical for the fusion of dense-core 986 vesicles with the membrane in calf adrenal chromaffin cells. J. Neurosci. 987 19:7375-7383. 988
Fasshauer, D., and M. Margittai. 2004. A transient N-terminal interaction of SNAP-25 989 and syntaxin nucleates SNARE assembly. J. Biol. Chem. 279:7613-7621. 990
Feldmann, J., I. Callebaut, G. Raposo, S. Certain, D. Bacq, C. Dumont, N. Lambert, 991 M. Ouachee-Chardin, G. Chedeville, H. Tamary, V. Minard-Colin, E. Vilmer, 992 S. Blanche, F. Le Deist, A. Fischer, and G. de Saint Basile. 2003. Munc13-4 is 993 essential for cytolytic granules fusion and is mutated in a form of familial 994 hemophagocytic lymphohistiocytosis (FHL3). Cell. 115:461-473. 995
Gandasi, N.R., and S. Barg. 2014. Contact-induced clustering of syntaxin and munc18 996 docks secretory granules at the exocytosis site. Nat. Commun. 5:3914. 997
Gao, Y., S. Zorman, G. Gundersen, Z. Xi, L. Ma, G. Sirinakis, J.E. Rothman, and Y. 998 Zhang. 2012. Single reconstituted neuronal SNARE complexes zipper in three 999 distinct stages. Science. 337:1340-1343. 1000
Gerber, S.H., J.C. Rah, S.W. Min, X. Liu, H. de Wit, I. Dulubova, A.C. Meyer, J. 1001 Rizo, M. Arancillo, R.E. Hammer, M. Verhage, C. Rosenmund, and T.C. 1002 Sudhof. 2008. Conformational switch of syntaxin-1 controls synaptic vesicle 1003 fusion. Science. 321:1507-1510. 1004
Graham, M.E., M.T. Handley, J.W. Barclay, L.F. Ciufo, S.L. Barrow, A. Morgan, and 1005 R.D. Burgoyne. 2008. A gain-of-function mutant of Munc18-1 stimulates 1006 secretory granule recruitment and exocytosis and reveals a direct interaction of 1007 Munc18-1 with Rab3. Biochem. J. 409:407-416. 1008
Gulyas-Kovacs, A., H. de Wit, I. Milosevic, O. Kochubey, R. Toonen, J. Klingauf, M. 1009 Verhage, and J.B. Sorensen. 2007. Munc18-1: sequential interactions with the 1010 fusion machinery stimulate vesicle docking and priming. J. Neurosci. 1011 27:8676-8686. 1012
Hammarlund, M., M.T. Palfreyman, S. Watanabe, S. Olsen, and E.M. Jorgensen. 1013 2007. Open syntaxin docks synaptic vesicles. PLoS Biol. 5:e198. 1014
Hammarlund, M., S. Watanabe, K. Schuske, and E.M. Jorgensen. 2008. CAPS and 1015 syntaxin dock dense core vesicles to the plasma membrane in neurons. J. Cell 1016 Biol. 180:483-491. 1017
Han, G.A., N.T. Malintan, N.M. Saw, L. Li, L. Han, F.A. Meunier, B.M. Collins, and 1018 S. Sugita. 2011. Munc18-1 domain-1 controls vesicle docking and secretion 1019

46
by interacting with syntaxin-1 and chaperoning it to the plasma membrane. 1020 Mol. Biol. Cell. 22:4134-4149. 1021
Honigmann, A., G. van den Bogaart, E. Iraheta, H.J. Risselada, D. Milovanovic, V. 1022 Mueller, S. Mullar, U. Diederichsen, D. Fasshauer, H. Grubmuller, S.W. Hell, 1023 C. Eggeling, K. Kuhnel, and R. Jahn. 2013. Phosphatidylinositol 4,5-1024 bisphosphate clusters act as molecular beacons for vesicle recruitment. Nat. 1025 Struct. Mol. Biol. 20:679-686. 1026
Imig, C., S.W. Min, S. Krinner, M. Arancillo, C. Rosenmund, T.C. Südhof, J.S. Rhee, 1027 N. Brose, and B.H. Cooper. 2014. The morphological and molecular nature of 1028 synpatic vesicle priming at presynaptic active zones. Neuron. 82:416-431. 1029
James, D.J., and T.F. Martin. 2013. CAPS and Munc13: CATCHRs that SNARE 1030 Vesicles. Front. Endocrinol. (Lausanne). 4:187. 1031
Jockusch, W.J., D. Speidel, A. Sigler, J.B. Sorensen, F. Varoqueaux, J.S. Rhee, and 1032 N. Brose. 2007. CAPS-1 and CAPS-2 are essential synaptic vesicle priming 1033 proteins. Cell. 131:796-808. 1034
Kabachinski, G., M. Yamaga, D.M. Kielar-Grevstad, S. Bruinsma, and T.F. Martin. 1035 2014. CAPS and Munc13 utilize distinct PIP2-linked mechanisms to promote 1036 vesicle exocytosis. Mol. Biol. Cell. 25:508-521. 1037
Kalla, S., M. Stern, J. Basu, F. Varoqueaux, K. Reim, C. Rosenmund, N.E. Ziv, and 1038 N. Brose. 2006. Molecular dynamics of a presynaptic active zone protein 1039 studied in Munc13-1-enhanced yellow fluorescent protein knock-in mutant 1040 mice. J. Neurosci. 26:13054-13066. 1041
Kang, L., Z. He, P. Xu, J. Fan, A. Betz, N. Brose, and T. Xu. 2006. Munc13-1 is 1042 required for the sustained release of insulin from pancreatic beta cells. Cell. 1043 Metab. 3:463-468. 1044
Koch, H., K. Hofmann, and N. Brose. 2000. Definition of Munc13-homology-1045 domains and characterization of a novel ubiquitously expressed Munc13 1046 isoform. Biochem. J. 349:247-253. 1047
Kremer, J.R., D.N. Mastronarde, and J.R. McIntosh. 1996. Computer visualization of 1048 three-dimensional image data using IMOD. J. Struct. Biol. 116:71-76. 1049
Kwan, E.P., L. Xie, L. Sheu, C.J. Nolan, M. Prentki, A. Betz, N. Brose, and H.Y. 1050 Gaisano. 2006. Munc13-1 deficiency reduces insulin secretion and causes 1051 abnormal glucose tolerance. Diabetes. 55:1421-1429. 1052
Lecat, S., H.W. Matthes, R. Pepperkok, J.C. Simpson, and J.L. Galzi. 2015. A 1053 Fluorescent Live Imaging Screening Assay Based on Translocation Criteria 1054 Identifies Novel Cytoplasmic Proteins Implicated in G Protein-coupled 1055 Receptor Signaling Pathways. Mol. Cell. Proteomics. 14:1385-1399. 1056
Liu, Y., C. Schirra, L. Edelmann, U. Matti, J. Rhee, D. Hof, D. Bruns, N. Brose, H. 1057 Rieger, D.R. Stevens, and J. Rettig. 2010. Two distinct secretory vesicle-1058 priming steps in adrenal chromaffin cells. J. Cell Biol. 190:1067-1077. 1059
47
Liu, Y., C. Schirra, D.R. Stevens, U. Matti, D. Speidel, D. Hof, D. Bruns, N. Brose, 1060 and J. Rettig. 2008. CAPS facilitates filling of the rapidly releasable pool of 1061 large dense-core vesicles. J. Neurosci. 28:5594-5601. 1062
Ma, C., W. Li, Y. Xu, and J. Rizo. 2011. Munc13 mediates the transition from the 1063 closed syntaxin-Munc18 complex to the SNARE complex. Nat. Struct. Mol. 1064 Biol. 18:542-549. 1065
Ma, C., L. Su, A.B. Seven, Y. Xu, and J. Rizo. 2013. Reconstitution of the vital 1066 functions of Munc18 and Munc13 in neurotransmitter release. Science. 1067 339:421-425. 1068
Mastronarde, D.N. 2005. Automated electron microscope tomography using robust 1069 prediction of specimen movements. J. Struct. Biol. 152:36-51. 1070
Mobius, W., B. Cooper, W.A. Kaufmann, C. Imig, T. Ruhwedel, N. Snaidero, A.S. 1071 Saab, and F. Varoqueaux. 2010. Electron microscopy of the mouse central 1072 nervous system. Methods Cell Biol. 96:475-512. 1073
Moser, T., and E. Neher. 1997. Rapid exocytosis in single chromaffin cells recorded 1074 from mouse adrenal slices. J. Neurosci. 17:2314-2323. 1075
Mosharov, E.V., and D. Sulzer. 2005. Analysis of exocytotic events recorded by 1076 amperometry. Nat. Methods. 2:651-658. 1077
Neher, E. 2006. A comparison between exocytic control mechanisms in adrenal 1078 chromaffin cells and a glutamatergic synapse. Pflugers Arch. 453:261-268. 1079
Ovsepian, S.V., and J.O. Dolly. 2011. Dendritic SNAREs add a new twist to the old 1080 neuron theory. Proc. Natl. Acad. Sci. U. S. A. 108:19113-19120. 1081
Pang, Z.P., and T.C. Sudhof. 2010. Cell biology of Ca2+-triggered exocytosis. Curr. 1082 Opin. Cell Biol. 22:496-505. 1083
Parisotto, D., J. Malsam, A. Scheutzow, J.M. Krause, and T.H. Sollner. 2012. 1084 SNAREpin assembly by Munc18-1 requires previous vesicle docking by 1085 synaptotagmin 1. J. Biol. Chem. 287:31041-31049. 1086
Park, Y., J.B. Seo, A. Fraind, A. Perez-Lara, H. Yavuz, K. Han, S.R. Jung, I. Kattan, 1087 P.J. Walla, M. Choi, D.S. Cafiso, D.S. Koh, and R. Jahn. 2015. 1088 Synaptotagmin-1 binds to PIP2-containing membrane but not to SNAREs at 1089 physiological ionic strength. Nat. Struct. Mol. Biol. 22:815-823. 1090
Parsons, T.D., J.R. Coorssen, H. Horstmann, and W. Almers. 1995. Docked granules, 1091 the exocytic burst, and the need for ATP hydrolysis in endocrine cells. 1092 Neuron. 15:1085-1096. 1093
Pinheiro, P.S., A.M. Jansen, H. de Wit, B. Tawfik, K.L. Madsen, M. Verhage, U. 1094 Gether, and J.B. Sorensen. 2014. The BAR domain protein PICK1 controls 1095 vesicle number and size in adrenal chromaffin cells. J. Neurosci. 34:10688-1096 10700. 1097

48
Plattner, H., A.R. Artalejo, and E. Neher. 1997. Ultrastructural organization of bovine 1098 chromaffin cell cortex-analysis by cryofixation and morphometry of aspects 1099 pertinent to exocytosis. J. Cell Biol. 139:1709-1717. 1100
Pobbati, A.V., A. Stein, and D. Fasshauer. 2006. N- to C-terminal SNARE complex 1101 assembly promotes rapid membrane fusion. Science. 313:673-676. 1102
Renden, R., B. Berwin, W. Davis, K. Ann, C.T. Chin, R. Kreber, B. Ganetzky, T.F. 1103 Martin, and K. Broadie. 2001. Drosophila CAPS is an essential gene that 1104 regulates dense-core vesicle release and synaptic vesicle fusion. Neuron. 1105 31:421-437. 1106
Richmond, J.E., W.S. Davis, and E.M. Jorgensen. 1999. UNC-13 is required for 1107 synaptic vesicle fusion in C. elegans. Nat. Neurosci. 2:959-964. 1108
Rosenmund, C., A. Sigler, I. Augustin, K. Reim, N. Brose, and J.S. Rhee. 2002. 1109 Differential control of vesicle priming and short-term plasticity by Munc13 1110 isoforms. Neuron. 33:411-424. 1111
Rostaing, P., E. Real, L. Siksou, J.P. Lechaire, T. Boudier, T.M. Boeckers, F. Gertler, 1112 E.D. Gundelfinger, A. Triller, and S. Marty. 2006. Analysis of synaptic 1113 ultrastructure without fixative using high-pressure freezing and tomography. 1114 Eur. J. Neurosci. 24:3463-3474. 1115
Sassa, T., S. Harada, H. Ogawa, J.B. Rand, I.N. Maruyama, and R. Hosono. 1999. 1116 Regulation of the UNC-18-Caenorhabditis elegans syntaxin complex by UNC-1117 13. J. Neurosci. 19:4772-4777. 1118
Schonn, J.S., J.R. van Weering, R. Mohrmann, O.M. Schluter, T.C. Sudhof, H. de 1119 Wit, M. Verhage, and J.B. Sorensen. 2010. Rab3 proteins involved in vesicle 1120 biogenesis and priming in embryonic mouse chromaffin cells. Traffic. 1121 11:1415-1428. 1122
Shirakawa, R., T. Higashi, A. Tabuchi, A. Yoshioka, H. Nishioka, M. Fukuda, T. 1123 Kita, and H. Horiuchi. 2004. Munc13-4 is a GTP-Rab27-binding protein 1124 regulating dense core granule secretion in platelets. J. Biol. Chem. 279:10730-1125 10737. 1126
Siksou, L., F. Varoqueaux, O. Pascual, A. Triller, N. Brose, and S. Marty. 2009. A 1127 common molecular basis for membrane docking and functional priming of 1128 synaptic vesicles. Eur. J. Neurosci. 30:49-56. 1129
Sorensen, J.B., R. Fernandez-Chacon, T.C. Sudhof, and E. Neher. 2003a. Examining 1130 synaptotagmin 1 function in dense core vesicle exocytosis under direct control 1131 of Ca2+. J. Gen. Physiol. 122:265-276. 1132
Sorensen, J.B., G. Nagy, F. Varoqueaux, R.B. Nehring, N. Brose, M.C. Wilson, and 1133 E. Neher. 2003b. Differential control of the releasable vesicle pools by SNAP-1134 25 splice variants and SNAP-23. Cell. 114:75-86. 1135
Sorensen, J.B., K. Wiederhold, E.M. Muller, I. Milosevic, G. Nagy, B.L. de Groot, H. 1136 Grubmuller, and D. Fasshauer. 2006. Sequential N- to C-terminal SNARE 1137

49
complex assembly drives priming and fusion of secretory vesicles. EMBO J. 1138 25:955-966. 1139
Speese, S., M. Petrie, K. Schuske, M. Ailion, K. Ann, K. Iwasaki, E.M. Jorgensen, 1140 and T.F. Martin. 2007. UNC-31 (CAPS) is required for dense-core vesicle but 1141 not synaptic vesicle exocytosis in Caenorhabditis elegans. J. Neurosci. 1142 27:6150-6162. 1143
Speidel, D., A. Salehi, S. Obermueller, I. Lundquist, N. Brose, E. Renstrom, and P. 1144 Rorsman. 2008. CAPS1 and CAPS2 regulate stability and recruitment of 1145 insulin granules in mouse pancreatic beta cells. Cell. Metab. 7:57-67. 1146
Stevens, D.R., Z.X. Wu, U. Matti, H.J. Junge, C. Schirra, U. Becherer, S.M. Wojcik, 1147 N. Brose, and J. Rettig. 2005. Identification of the minimal protein domain 1148 required for priming activity of Munc13-1. Curr. Biol. 15:2243-2248. 1149
Toonen, R.F., O. Kochubey, H. de Wit, A. Gulyas-Kovacs, B. Konijnenburg, J.B. 1150 Sorensen, J. Klingauf, and M. Verhage. 2006. Dissecting docking and 1151 tethering of secretory vesicles at the target membrane. EMBO J. 25:3725-1152 3737. 1153
Tsuboi, T., and M. Fukuda. 2006. Rab3A and Rab27A cooperatively regulate the 1154 docking step of dense-core vesicle exocytosis in PC12 cells. J. Cell Sci. 1155 119:2196-2203. 1156
van de Bospoort, R., M. Farina, S.K. Schmitz, A. de Jong, H. de Wit, M. Verhage, 1157 and R.F. Toonen. 2012. Munc13 controls the location and efficiency of dense-1158 core vesicle release in neurons. J. Cell Biol. 199:883-891. 1159
van Weering, J.R., R.F. Toonen, and M. Verhage. 2007. The role of Rab3a in 1160 secretory vesicle docking requires association/dissociation of guanidine 1161 phosphates and Munc18-1. PLoS One. 2:e616. 1162
Varoqueaux, F., A. Sigler, J.S. Rhee, N. Brose, C. Enk, K. Reim, and C. Rosenmund. 1163 2002. Total arrest of spontaneous and evoked synaptic transmission but 1164 normal synaptogenesis in the absence of Munc13-mediated vesicle priming. 1165 Proc. Natl. Acad. Sci. U. S. A. 99:9037-9042. 1166
Varoqueaux, F., M.S. Sons, J.J. Plomp, and N. Brose. 2005. Aberrant morphology 1167 and residual transmitter release at the Munc13-deficient mouse neuromuscular 1168 synapse. Mol. Cell. Biol. 25:5973-5984. 1169
Voets, T. 2000. Dissection of three Ca2+-dependent steps leading to secretion in 1170 chromaffin cells from mouse adrenal slices. Neuron. 28:537-545. 1171
Voets, T., E. Neher, and T. Moser. 1999. Mechanisms underlying phasic and 1172 sustained secretion in chromaffin cells from mouse adrenal slices. Neuron. 1173 23:607-615. 1174
Voets, T., R.F. Toonen, E.C. Brian, H. de Wit, T. Moser, J. Rettig, T.C. Sudhof, E. 1175 Neher, and M. Verhage. 2001. Munc18-1 promotes large dense-core vesicle 1176 docking. Neuron. 31:581-591. 1177

50
Walter, A.M., P.S. Pinheiro, M. Verhage, and J.B. Sorensen. 2013. A sequential 1178 vesicle pool model with a single release sensor and a Ca(2+)-dependent 1179 priming catalyst effectively explains Ca(2+)-dependent properties of 1180 neurosecretion. PLoS Comput. Biol. 9:e1003362. 1181
Walter, A.M., K. Wiederhold, D. Bruns, D. Fasshauer, and J.B. Sorensen. 2010. 1182 Synaptobrevin N-terminally bound to syntaxin-SNAP-25 defines the primed 1183 vesicle state in regulated exocytosis. J. Cell Biol. 188:401-413. 1184
Weimer, R.M., E.O. Gracheva, O. Meyrignac, K.G. Miller, J.E. Richmond, and J.L. 1185 Bessereau. 2006. UNC-13 and UNC-10/rim localize synaptic vesicles to 1186 specific membrane domains. J. Neurosci. 26:8040-8047. 1187
Wojcik, S.M., M. Tantra, B. Stepniak, K.N. Man, K. Muller-Ribbe, M. Begemann, A. 1188 Ju, S. Papiol, A. Ronnenberg, A. Gurvich, Y. Shin, I. Augustin, N. Brose, and 1189 H. Ehrenreich. 2013. Genetic markers of a Munc13 protein family member, 1190 BAIAP3, are gender specifically associated with anxiety and benzodiazepine 1191 abuse in mice and humans. Mol. Med. 19:135-148. 1192
Wu, Y., Y. Gu, M.K. Morphew, J. Yao, F.L. Yeh, M. Dong, and E.R. Chapman. 1193 2012. All three components of the neuronal SNARE complex contribute to 1194 secretory vesicle docking. J. Cell Biol. 198:323-330. 1195
Yang, X., S. Wang, Y. Sheng, M. Zhang, W. Zou, L. Wu, L. Kang, J. Rizo, R. Zhang, 1196 T. Xu, and C. Ma. 2015. Syntaxin opening by the MUN domain underlies the 1197 function of Munc13 in synaptic-vesicle priming. Nat. Struct. Mol. Biol. 1198 22:547-554. 1199
Zhou, K.M., Y.M. Dong, Q. Ge, D. Zhu, W. Zhou, X.G. Lin, T. Liang, Z.X. Wu, and 1200 T. Xu. 2007. PKA activation bypasses the requirement for UNC-31 in the 1201 docking of dense core vesicles from C. elegans neurons. Neuron. 56:657-669. 1202
Zhou, Z., and S. Misler. 1995. Action potential-induced quantal secretion of 1203 catecholamines from rat adrenal chromaffin cells. J. Biol. Chem. 270:3498-1204 3505. 1205
Zikich, D., A. Mezer, F. Varoqueaux, A. Sheinin, H.J. Junge, E. Nachliel, R. 1206 Melamed, N. Brose, M. Gutman, and U. Ashery. 2008. Vesicle priming and 1207 recruitment by ubMunc13-2 are differentially regulated by calcium and 1208 calmodulin. J. Neurosci. 28:1949-1960. 1209
1210 1211 1212

51
Figure legends 1213 Figure 1. 1214 Expression of Munc13 isoforms in the mouse adrenal gland. KO mouse lines of 1215 the respective Munc13 isoform were used as control. The antibodies used to detect 1216 individual Munc13 isoforms and loading controls are indicated on the left. (A) 1217 Munc13-1 (*) is barely detectable in perinatal adrenal gland. (B) ubMunc13-2, but not 1218 bMunc13-2, is expressed. (C) Munc13-3 was not detected. (D) Baiap3 was detected, 1219 but not (E) Munc13-4. Jx refers to mice homozygous for the Unc13dJinx mutation 1220 (Crozat et al., 2007). (F) Munc13-1 and Baiap3 are mainly located in the medulla 1221 (Med), but ubMunc13-2 is present in cortex (Cort) as well. Please note that the 1222 difference in the position of ubMunc13-2 relative to the marker in panels (B) and (F) 1223 is due to how far the respective gels were run. Loading controls were valosin-1224 containing protein (VCP), glyceraldehyde-3-phosphate dehydrogenase (GAPDH) and 1225 CgA. Brain samples, and spleen tissue in the case of Munc13-4, were used for 1226 comparison. Please note that the Baiap3KO (Wojcik et al., 2013) and Unc13aKO 1227 animals express truncated protein products, whereas the truncated product present in 1228 the Unc13bKO (Cooper et al., 2012) is not shown here. Based on previous analyses of 1229 the Unc13aKO and Unc13bKO mice (Augustin et al., 1999; Cooper et al., 2012; 1230 Varoqueaux et al., 2002), the truncated Munc13-1 and Munc13-2 products are neither 1231 functional, nor do they have a dominant-negative effect. The truncated Baiap3 1232 product was not detected in adrenal gland, and its effect in the brain, where it can be 1233 detected in young animals up to P21, is currently unknown (Wojcik et al., 2013). See 1234 also Figure 1–figure supplement 1. 1235 1236

52
Figure 1–figure supplement 1. 1237 Comparison of Munc13-1, Munc13-2, and Munc13-3 expression. (A) Adrenal 1238 gland and brain homogenates from Unc13a-EYFP, Unc13b-EYFP, and Unc13c-1239 EGFP knockin (KI) mice were probed using an antibody that recognizes the GFP-1240 derived tags, which allowed us to compare expression levels of Munc13-1, 1241 ubMunc13-2, bMunc13-2 and Munc13-3 with the same antibody. The two bands 1242 detected in the Unc13b-EYFP KI brain sample represent ubMunc13-2 (lower band) 1243 and bMunc13-2 (upper band). While all isoforms were detected in brain, ubMunc13-1244 2-EYFP was the only isoform readily detectable in the adrenal gland. Valosin-1245 containing protein (VCP) was used as a loading control. (B) Adrenal gland and brain 1246 samples from Unc13aKOUnc13bKO (DKO) mice and WT controls, probed with 1247 antibodies to Munc13-1, ubMunc13-2 and VCP as a loading control. Expression of 1248 Munc13-1 (marked with *, to distinguish it from co-migrating bands of higher 1249 molecular weight) is low in E18 adrenal glands, while ubMunc13-2 can be readily 1250 detected. The expression of both isoforms was abrogated in DKO mice. Please note 1251 that, like the single KO lines, the DKO animals express truncated Munc13-1 protein 1252 products and a truncated Munc13-2 product (Cooper et al., 2012), the latter is not 1253 shown here. 1254 1255 Figure 2. 1256 Flash photolysis induced LDCV exocytosis in chromaffin cells. For each KO line, 1257 the average intracellular [Ca2+] ± SEM and the average ΔCm are shown in panels (A-1258 C, and E). Single gene deletions of (A) Unc13a, (B) Unc13c, or (C) Baiap3 did not 1259 impair LDCV exocytosis. (D) Summary of burst sizes, sustained release rates, and 1260

53
time constants. (E) LDCV exocytosis is dramatically reduced in Unc13aKOUnc13bKO 1261 cells, Unc13aWTUnc13bKO cells, and Unc13aHetUnc13bKO cells. This reduction is 1262 primarily due to the absence of ubMunc13-2. (F) Fast burst, slow burst and the rate of 1263 sustained release are reduced in the absence of Munc13-1 and ubMunc13-2, as well as 1264 in the absence of ubMunc13-2 alone (ANOVA with post-hoc Tukey’s test). (G) 1265 Compared to Unc13aWTUnc13bKO cells, the deletion of Munc13-1 causes significant 1266 reductions in the slow burst and the rate of sustained release (Student’s t-test, two-1267 tailed). (H) Delay of the onset of exocytosis after the flash stimulus (ANOVA with 1268 post-hoc Tukey’s test). (I) Normalized traces show identical release kinetics of the 1269 exocytotic burst. (J) Summary of the release components shown in panels (E, F, G). 1270 Time constants are not significantly different (ANOVA with post-hoc Tukey’s test). 1271 (p < 0.05: *, p < 0.01: **, p < 0.001: ***). See also Figure 2–figure supplement 1. 1272 1273 Figure 2–figure supplement 1. 1274 Single gene deletion or overexpression of Baiap3 does not affect LDCV 1275 exocytosis in chromaffin cells. (A) LDCV exocytosis was elicited by a series of 1276 depolarizing steps to analyze the Immediately-Releasable Pool (IRP) of vesicles 1277 localized in the vicinity of Ca2+ channels and the Readily-Releasable Pool (RRP). 1278 Shown are the averaged [Ca2+] ± SEM, ΔCm, and whole-cell current traces. The inset 1279 in the whole-cell current panel shows an enlargement of the first 100 ms 1280 depolarization. (B) The size of the IRP, estimated based on the release elicited by 6 1281 short (10 ms) depolarization pulses, was not altered. (C) The total ΔCm caused by the 1282 depolarization train was also not altered in Baiap3KO cells. Note that the data from 1283 Baiap3KO and Baiap3WT were matched for equal ionic influx according to the ionic 1284

54
charge of the first 100 ms depolarization to eliminate effects of differential ionic 1285 influx. (D) Overexpression (OE) of Baiap3 in WT chromaffin cells. EGFP expression 1286 in WT cells was used as control. Shown are the averaged [Ca2+] ± SEM and ΔCm 1287 traces. (E) Burst sizes, rate of sustained release and the kinetics of release were not 1288 altered by the overexpression of Baiap3 (Student’s t-test, two-tailed). (F) Normalized 1289 traces of Baiap3WT and Baiap3KO cells overlapped with each other, indicating no 1290 alterations in release kinetics in Baiap3KO cells. 1291 1292 Figure 3. 1293 Absence of Munc13-2 results in a significant release deficit in response to 1294 depolarization. (A) Shown are the averaged [Ca2+] ± SEM, ΔCm, and whole-cell 1295 current traces of Unc13bWT and Unc13bKO cells. The inset in the whole-cell current 1296 panel shows an enlargement of the first 100 ms depolarization. (B) ΔCm elicited by 1297 individual depolarizations was significantly different between the two groups. RRP, 1298 Readily-releasable Pool; IRP, Immediately-Releasable Pool. (C) The size of the RRP 1299 was measured as the ΔCm after the train of depolarization pulses and was 1300 significantly reduced in Unc13bKO cells. (p < 0.05: *, p < 0.01: **, p < 0.001: ***; 1301 Student’s t-test, two-tailed). 1302 1303 Figure 4. 1304 Reduced number of fusion events of catecholamine-containing LDCVs in the 1305 absence of Munc13-2. (A) Illustration of a single amperometric spike, corresponding 1306 to the release of catecholamines from a single LDCV, and the parameters analyzed. 1307

55
(B) Representative amperometric recordings of a Unc13bWT and a Unc13bKO cell. (C) 1308 Dramatic reduction in spike frequency in Unc13bKO chromaffin cells. (D) Spike 1309 duration, (E) width at half amplitude (t½), (F) maximum spike amplitude, (G) 1310 amperometric charge, (H) rise time, and (I) decay time were unchanged in the 1311 Unc13bKO. The stability of fusion pores was also not altered, as shown by the 1312 unchanged (J) foot amplitude, (K) duration and (L) charge. (M) The fraction of 1313 amperometric spikes with a detectable foot was reduced in Unc13bKO cells. (p < 1314 0.05:*, p < 0.001:***; Student’s t-test, two-tailed). 1315 1316 Figure 5. 1317 LDCV exocytosis in Unc13aKOUnc13bKO chromaffin cells is rescued by 1318 overexpression (OE) of Munc13-1, ubMunc13-2 and Munc13-4, but not Baiap3. 1319 Unc13aKOUnc13bKO cells were infected with SFV-Munc13-1-EGFP, SFV-1320 ubMunc13-2-EGFP, SFV-Munc13-4-IRES-EGFP or SFV-Baiap3-IRES-EGFP using 1321 SFV-EGFP as control. (A) Averaged [Ca2+] ± SEM and capacitance traces ΔCm are 1322 shown in the same graph to compare the efficiency of rescue: ubMunc13-2 > 1323 Munc13-1 > Munc13-4 > Baiap3. (B) Burst sizes and rates of sustained release after 1324 analysis of individual traces. (p < 0.05: *, p < 0.001: ***; Student’s t-test, two-tailed). 1325 See Figure 5–figure supplement 1 for a direct comparison of Munc13-1-EGFP and 1326 ubMunc13-2-EGFP expressing cell matched for fluorescence intensity and Figure 5–1327 figure supplement 2 for Western blotting to confirm the expression of Munc13-4 and 1328 Baiap3 from the IRES-constructs. 1329 1330

56
Figure 5–figure supplement 1. 1331 Direct comparison of Munc13-1 and ubMunc13-2 over-expressing cells with 1332 matching EGFP fluorescence. (A) Averaged [Ca2+] ± SEM and capacitance traces 1333 ΔCm are shown in the same graph to compare the efficiency of rescue. (B) 1334 Fluorescence intensity in arbitrary units (a.u.) of Unc13aKOUnc13bKO chromaffin 1335 cells over-expressing Munc13-1-EGFP and ubMunc13-2-EGFP. (C) Expression of 1336 ubMunc13-2 resulted in a significantly larger enhancement of burst size and rate of 1337 sustained release than expression of Munc13-1. (p < 0.01: **, p < 0.001: ***; 1338 Student’s t-test, two-tailed). 1339 1340 Figure 5–figure supplement 2. 1341 Western blot analysis confirming expression of Munc13-4 and Baiap3 SFV 1342 constructs. Neuronal cultures were infected with SFV-Baiap3-IRES-EGFP and SFV-1343 Munc13-4-IRES-EGFP, respectively. Tissue samples from Baiap3 and Unc13d (Jx) 1344 WT and KO mice were used as controls. Both Baiap3 and Munc13-4 were expressed. 1345 Please note, that we had to use infected neurons for this analysis, because our 1346 chromaffin cell cultures do not provide enough material for Western blotting. 1347 1348 Figure 6. 1349 Ultrastructural analysis of LDCV docking in adrenal chromaffin cells. 2D-EM of 1350 (A) Unc13aHetUnc13bHet (CTRL) and (B) Unc13aKOUnc13bKO (DKO) adrenal glands. 1351 (C) Frequency distribution of LDCVs within 0-2 µm of the plasma membrane (PM). 1352 (D) Membrane-proximal LDCVs (0-40 nm of PM) normalized to PM circumference. 1353

57
(E) Total number of LDCVs normalized to cytoplasmic area. (F-K) Tomographically 1354 reconstructed subvolumes from 400 nm-thick sections through (F-H) 1355 Unc13aHetUnc13bHet and (I-K) Unc13aKOUnc13bKO cells in which docked LDCVs 1356 (enlarged in panels G, J) and undocked LDCVs (enlarged in panels H and K, small 1357 gaps separating undocked LDCVs from the PM indicated with arrowheads) can be 1358 distinguished. (L) Frequency distribution of membrane-proximal LDCVs distributed 1359 within 0-40 nm of the PM. (M) Number of membrane-proximal LDCVs expressed as 1360 a percentage of all LDCVs within 0-100 nm of the plasma membrane. (N) Percentage 1361 of docked LDCVs with respect to all membrane-proximal LDCVs (within 0-40 nm of 1362 PM). Scale bars represent 1 µm in (A, B), 200 nm in (F, I), and 50 nm in (H, K). C: 1363 5779 LDCVs in CTRL and 4120 LDCVs in DKO profiles. D, E: CTRL: N=2, n=36; DKO: 1364 N=2; n=27. L: 473 LDCVs in CTRL and 386 LDCVs in DKO tomographic subvolumes. 1365 M, N: CTRL: N=2, n=24;DKO: N=2, n=26. Values indicate mean ± SEM. (Student’s t-1366 test, two-tailed). See also Figure 6–figure supplement 1. 1367 1368 Figure 6–figure supplement 1. 1369 Ultrastructural analysis of LDCV size in adrenal chromaffin cells. 2D-EM of (A) 1370 Unc13aHetUnc13bHet (CTRL) and (B) Unc13aKOUnc13bKO (DKO) adrenal glands. (C) 1371 Frequency distribution of LDCV diameters measured by 3D-ET. (D) Mean LDCV 1372 diameter in randomly imaged chromaffin cell areas. (E) LDCV diameter of docked 1373 (0-4 nm of PM) vesicles. Scale bar in B represents 5 µm. C: 846 LDCVs in CTRL and 1374 831 LDCVs in DKO tomographic subvolumes. D: CTRL: N=2, n=24; DKO: N=2, 1375 n=26. E: CTRL: N=2, n=98; DKO: N=2, n=140. Values indicate mean ± SEM. 1376
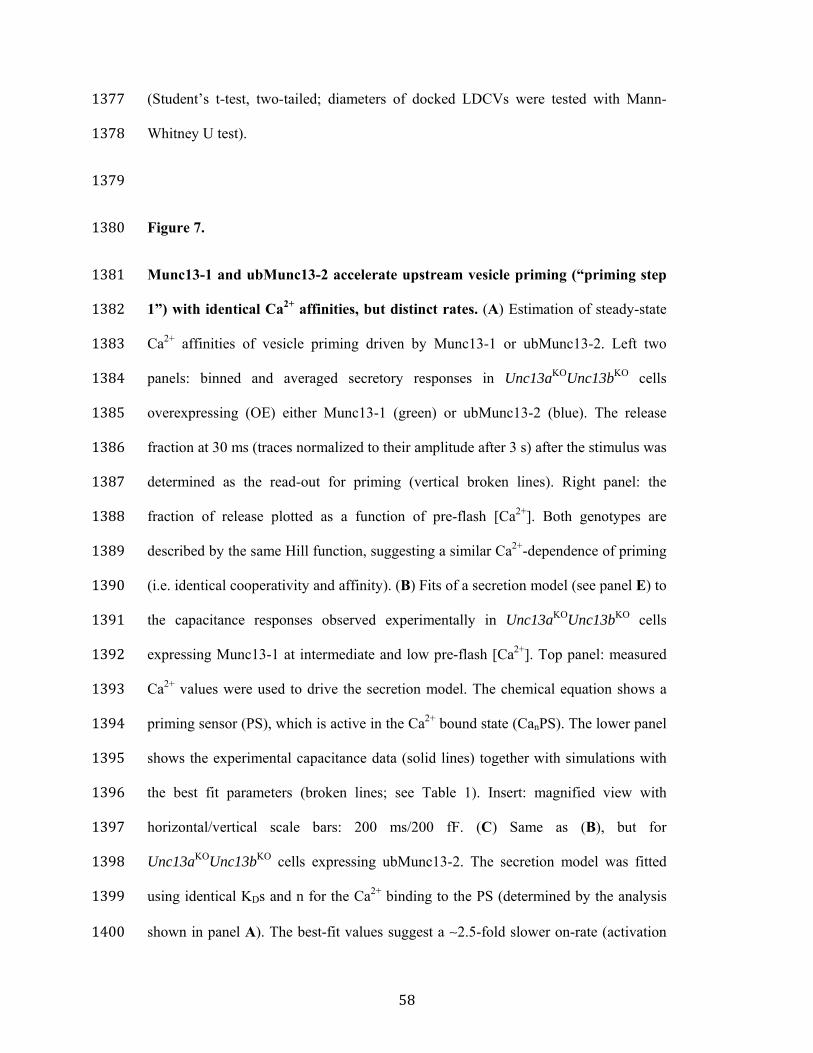
58
(Student’s t-test, two-tailed; diameters of docked LDCVs were tested with Mann-1377 Whitney U test). 1378 1379 Figure 7. 1380 Munc13-1 and ubMunc13-2 accelerate upstream vesicle priming (“priming step 1381 1”) with identical Ca2+ affinities, but distinct rates. (A) Estimation of steady-state 1382 Ca2+ affinities of vesicle priming driven by Munc13-1 or ubMunc13-2. Left two 1383 panels: binned and averaged secretory responses in Unc13aKOUnc13bKO cells 1384 overexpressing (OE) either Munc13-1 (green) or ubMunc13-2 (blue). The release 1385 fraction at 30 ms (traces normalized to their amplitude after 3 s) after the stimulus was 1386 determined as the read-out for priming (vertical broken lines). Right panel: the 1387 fraction of release plotted as a function of pre-flash [Ca2+]. Both genotypes are 1388 described by the same Hill function, suggesting a similar Ca2+-dependence of priming 1389 (i.e. identical cooperativity and affinity). (B) Fits of a secretion model (see panel E) to 1390 the capacitance responses observed experimentally in Unc13aKOUnc13bKO cells 1391 expressing Munc13-1 at intermediate and low pre-flash [Ca2+]. Top panel: measured 1392 Ca2+ values were used to drive the secretion model. The chemical equation shows a 1393 priming sensor (PS), which is active in the Ca2+ bound state (CanPS). The lower panel 1394 shows the experimental capacitance data (solid lines) together with simulations with 1395 the best fit parameters (broken lines; see Table 1). Insert: magnified view with 1396 horizontal/vertical scale bars: 200 ms/200 fF. (C) Same as (B), but for 1397 Unc13aKOUnc13bKO cells expressing ubMunc13-2. The secretion model was fitted 1398 using identical KDs and n for the Ca2+ binding to the PS (determined by the analysis 1399 shown in panel A). The best-fit values suggest a ∼2.5-fold slower on-rate (activation 1400

59
rate), but a 4.5-fold higher maximal priming rate for ubMunc13-2 (see Table 1), 1401 resulting in a sigmoidal secretion response from low pre-flash [Ca2+]. (D) Fitting our 1402 secretion model to the experimental data of several genotypes suggests that Munc13-1 1403 and ubMunc13-2 both primarily act by increasing the forward priming rate (k1, see 1404 also panel E), while loss of ubMunc13-2 – the dominant endogenous isoform – has 1405 the opposite effect. The downstream priming step (“priming 2”, k2) changes in the 1406 opposite direction. (E) Secretion model: Munc13-1 (green) and ubMunc13-2 (blue) 1407 regulate the Ca2+ binding rates (kon) to a PS, which controls the asymptotic forward 1408 priming rate k1 (see text for details, Table 1 for fitted parameters, and Walter et al., 1409 2013 for model development). NRP: Non-Releasable Pool; RRP: Readily-Releasable 1410 Pool; F: Fused pool. See also Figure 7–figure supplement 1. 1411 1412 Figure 7–figure supplement 1. 1413 Exocytotic burst size as a function of pre-flash [Ca2+]. Unc13aKOUnc13bKO cells 1414 were rescued by Munc13-1 or ubMunc13-2 overexpression (OE). For ubMunc13-1415 2, data from 23 cells already analyzed for Figure 5 were included here as well. The 1416 average size of the exocytotic burst is plotted as the ΔCm 0.5 s after the flash stimulus 1417 ± SEM against average pre-flash [Ca2+] ± SEM. Cells were binned according to pre-1418 flash [Ca2+]. For Munc13-1, bins are 250-350 nM (n = 17), 350-450 nM (n = 15), 1419 450-550 nM (n = 11), 550-800 nM (n = 11), 800-1200 nM (n = 13), 1200-1700 nM (n 1420 = 7). For ubMunc13-2, bins are 250-350 nM (n = 11), 350-450 nM (n = 20), 450-540 1421 nM (n = 10), 540-800 nM (n = 12), 800-1200 nM (n = 10) and 1200-1700 nM (n = 1422 4). 1423
1424

60
Table 1. Parameters of the exocytosis model. 1425 Parameter Control Unc13bKO Munc13-1
OE ubMunc13-2
OE Comment
Vtot 2350 Total number of vesicles,
best fit k1 ( ) ∙ ( )
( )( ) + , fraction of activated PS
kon 8.96*10-9 s-1 µM-n
2.25*10-8 s-1 µM-n
2.25*10-8 s-1 µM-n
8.96*10-9 s-1 µM-n
On-rate calcium
binding to PS
k1Max 1.99*10-2 s-1 6.89*10-3 s-1 7.44*10-2 s-1 3.42*10-1 s-1 Maximal
priming rate, best fit
0.407 µM Experiment,
Hill plot Figure 7
k-1 4.70*10-1 s-1 Best fit
n 7.38
Cooperativity PS,
experiment, Hill plot Figure 7
k2 (Walter et al., 2013)
k-2 (Walter et al., 2013)
g(Ca2+) + , (Walter et al.,
2013) k20 2.37*10-2 s-1 2.95*10-2 s-1 1.29*10-2 s-1 5.80*10-3 s-1 Best fit k2cat 3.95*101 s-1 4.91*101 s-1 2.14*101 s-1 9.65*100 s-1 Best fit k-20 2.10*10-2 s-1 Best fit
k-2cat (Walter et al., 2013)
KD, cat 138 µM Best fit k3 4.4 s-1μM-1 (Voets, 2000) k-3 56 s-1 (Voets, 2000) k4 1450 s-1 (Voets, 2000)
1426 1427
2+20 2(Ca ) catk g k= + ⋅
2+20 2(Ca ) catk g k− −= + ⋅
2 20 20/catk k k−= ⋅

200
150
120
VCP
Munc13-1
85
Unc13a
WT KOWT KO
E18 Brain
E18 Adrenal
*
VCP
VCP
bMunc13-2
ubMunc13-2200
85
200100
WT KO WT KO
P0 Brain
P0 Adrenal
Unc13bWT KO WT KO
P0 Brain
P0 Adrenal
Baiap3
VCP
Baiap3
85
120
WT Jx WT Jx
P0 Spleen
P0 Adrenal
130
35
Unc13d
Munc13-4
GAPDH
kDaWT KO WT KO
P0 Brain
P0 Adrenal
Unc13c
Munc13-3
VCP200
85
kDa
A
B
C
D
E
F
WT KO Cort Med
Unc13aP0 Brain
WT KO
Unc13bAdult Brain
WT KO
Baiap3Adult Brain
WTAdult Adrenal
Cort Med
WTAdult Adrenal
Cort Med
WTAdult Adrenal
200
85
200
85
120
85
Munc13-1
CgA
ubMunc13-2
CgA
Baiap3
CgA
kDa
Man et al. Figure 1

43210 T
40
20
0
2+μ
T
Fast burst Slow burst Rate of sustained release
Normalized at 1s
E F
Unc13aUnc13aUnc13aUnc13aUnc13a
WT/ Unc13bKOUnc13bWTUnc13bKO
Unc13bKO
KOUnc13bKO
0.8
0.4
00.80.40
Unc13aUnc13aUnc13aUnc13aUnc13a
WT/ Unc13bKOUnc13bWTUnc13b KO
Unc13b KO
KOUnc13b KO
Genotypes Fast burst Slow burst Rate of sustained release Fast time constant Slow time constant
I
G
H
0 1 2 3 4T
600
300
0
40
20
00 1 2 3 4
T
500400
200100
400
300
200
100
043210
T
40
20
0 0 1 2 3 4T
0 2 4T
1 3
0 2 4T
1 3
40
20
0
2+
600
300
0
500400
200100
Unc13aWT
Unc13aKOUnc13cWTUnc13cKO
Baiap3WT
Baiap3KOA B C
Genotypes
Unc13aWT
Unc13a KO
Unc13cWTUnc13cKO
Baiap3WT
Baiap3 KO
n
4145
5150
5659
Fast burst
137.1
1
Slow burst
112.78±1130.45±1
Rate of sustained release Fast time constant Slow time constantD
Man et al. Figure 2
020406080100
106
42 42 35 57 020406080100
051015202530
******
******
******
0
2
4
6
8
97 41 38 31 44
Delay
*****
*
0
2
4
6
106
42 42 35 57 106
42 4235 57
42 35 57Rate of sustained
release
J
****
400
300
200
100
043210

400
300
200
100
06543210
30
20
10
06543210
Time (s)
-1.2-1.0-0.8-0.6-0.4-0.20.0
6543210
***
*** *** ** **
*
*** *** ***
1 2 3 4 5 6 7 8 9
60
50
40
30
20
10
010
IRPRRP
RRP
A B
Time (s)
Time (s)
Unc13bUnc13b
***
2+
250
200
150
100
50
060
WT
KO

0
10
20
30
spik
e du
ratio
n (m
s)
0
1
2
3
4
spik
e t 1/
2 (m
s)
0
10
20
30I M
ax (p
A)
0.00
0.05
0.10
0.15
0.20
Q (
pC)
0.0
0.2
0.4
0.6
0.8
rise
time 5
0-90
(m
s)
0
1
2
3
4
deca
y tim
e 75-
25 (
ms)
0
1
2
3
4
Foot
am
plitu
de (
pA)
0
1
2
3
4
5
Foot
dur
atio
n (m
s)
0
5
10
15
20
Foot
cha
rge
(fC
)
0.0
0.2
0.4
0.6
0.8
***
spik
e fr
eqen
cy (
Hz)
0
20
40
60
*
spik
es w
/ foo
t (%
)
Unc13b (n = 21)Unc13b (n = 21)
charge
duration
foot
t1/2Imax
5 s
50 p
A
Unc13b WT
Unc13b KO
A
C F G H
B
ED
I J K L M
Man et al. Figure 4
WT
KO

43210
2.52.01.51.00.5
0
Time (s)
Amplitude at 0.5 s after flash
Rate of sustained release
0100200300400500
04080
120160
13 17
13 170
200400600800
0100200300400500
30 36
30 36
***
***
***
***
fF
fF/s fF/s
020406080
100fF/s
fF
04080
120*
20 33
***
20 33
01020304050
28 33
0
2
4
6
fF
fF/s
28 33
43210Time (s)
02040
2+] (μM
)fF
Munc13-1 OEubMunc13-2 OEMunc13-4 OE
EGFP
A B
Man et al. Figure 5
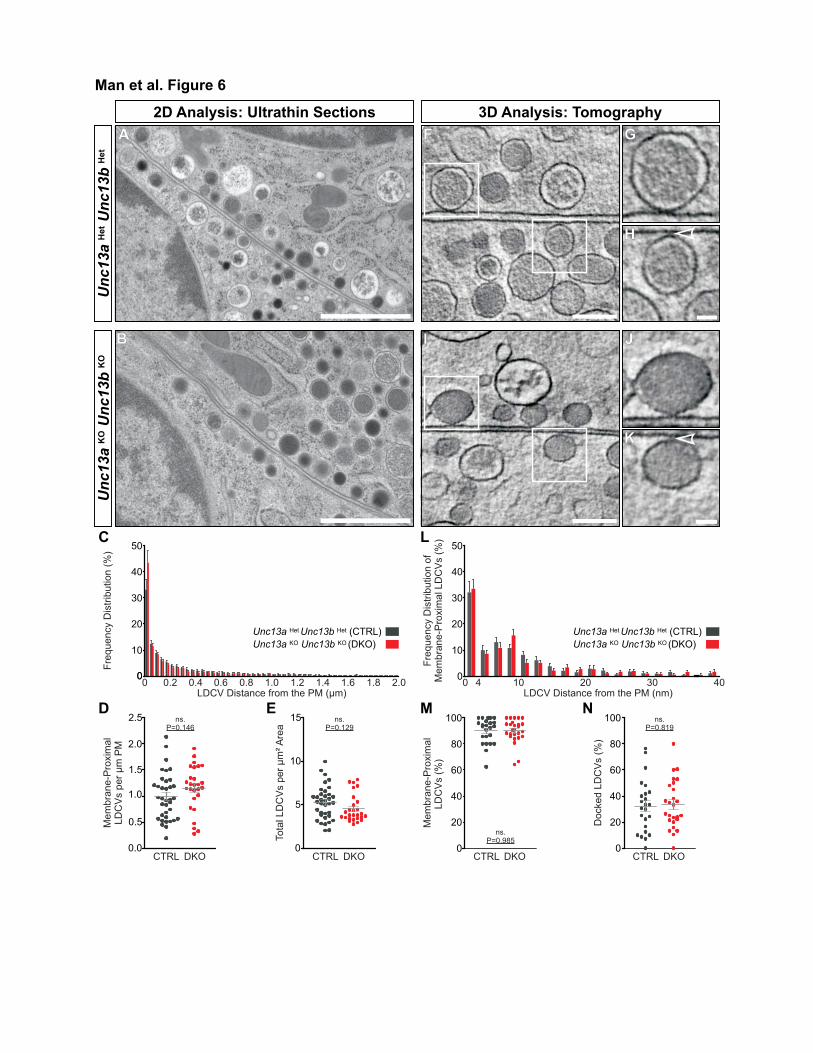
DKOCTRL0
20
40
60
80
100
Docked L
DC
Vs (
%)
ns.P=0.819
DKOCTRL0
20
40
60
80
100
ns.P=0.985
M
em
bra
ne
-Pro
xim
al
LD
CV
s (
%)
LDCV Distance from the PM (nm)
Fre
qu
en
cy D
istr
ibu
tio
n o
fM
em
bra
ne
-Pro
xim
al L
DC
Vs (
%)
0
10
20
30
40
50
0 4 10 20 30 40
To
tal L
DC
Vs p
er
μm
² A
rea
0
5
10
15
CTRL DKO
ns.P=0.129
0.0
0.5
1.0
1.5
2.0
2.5
Me
mb
ran
e-P
roxim
al
LD
CV
s p
er
μm
PM
CTRL DKO
ns.P=0.146
Fre
qu
en
cy D
istr
ibu
tio
n (
%)
00 2.00.2 0.4 0.6 0.8 1.0 1.2 1.4 1.6 1.8
LDCV Distance from the PM (μm)
0
10
20
30
40
50C
D E
L
M N
B I
G
H
J
K
A F
He
tH
et
Un
c1
3a
U
nc
13
b
KO
KO
Un
c13a
Un
c13b
2D Analysis: Ultrathin Sections
Man et al. Figure 6
3D Analysis: Tomography
KO KOUnc13a Unc13b (DKO)
Het HetUnc13a Unc13b (CTRL) KO KOUnc13a Unc13b (DKO)
Het HetUnc13a Unc13b (CTRL)

C
Pre-flash Ca2+ [nM]250-350350-450450-550550-800800-1200
250 500 750 1000pre-flash Ca2+ [nM]
0.1
0.2
frac
tion
prim
ed v
es.
0
0
2000
1000
1
10
0 1 2 3 4time [s]
ubM13-2 OE low Ca2+ubM13-2 OE
0 1 2 3 4time [s]
0
2000
1000
1
10
ΔC
M [f
F][C
a2+] [μM
]
M13-1 OE low Ca2+M13-1 OE
data
M13-1 OEubM13-2 OE
Hill fit
PS CanPSkon
KD*kon
n Ca2+ + PS CanPSkonn Ca2+ +
KD*kon
A
B
0
2000
1000
1
10
ΔC
M [f
F][C
a2+] [μM
]
0 1 2 3 4time [s]
E
RRP
k2 k-2
F
k3(Syt)
controlM13-1 OE
D
k1 k2
Unc13b KO k1 k2
Ca2+
Ca2+
ubM13-2 OE k1 k2
PS CanPSkon
KD*kon
n Ca2++
PS CanPSkonn Ca2+ +KD*kon
Munc13-1
ubMunc13-2
Depot
NRP
k1 k-1
model
priming 1
priming 2
fusion
50 ms
0.2
data model
data model
Pre-flash Ca2+ [nM]250-350350-450450-540540-800800-1200
Man et al. Figure 7
2.5*kon on
Normalized capacitance traces