accelerating itv’s digital transformation full year...
TRANSCRIPT

Accelerating ITV’s Digital TransformationFull Year Results for the year end 31 December 20195th March 2020

Introduction and Highlights Carolyn McCall
Financial and Operating Review Chris Kennedy
Strategic Update Carolyn McCall
Outlook Carolyn McCall
Q&A
Agenda
2

• Full year results are ahead of expectations
• Good progress in executing our strategy to build a digitally led media and entertainment company
- Grow ITV Studios• Total ITV Studios organic revenue up 9% • Solid pipeline of new and returning shows
- Transform Broadcast• Continued strong growth in online revenue, up 21%, offset by decline in spot advertising, with
total advertising down 1.5%• Good onscreen and online viewing performance: flat SOV and 13% growth in online viewing• Built and started rolling out Planet V, our addressable advertising platform• Investments delivering in data, tech, ITV Hub and advertising
- Expand Direct to Consumer • Successfully launched BritBox UK in November 2019• ITV Hub+ subscribers over 400,000• BritBox US subscribers over 1m and profitable
• Delivered £25m of cost savings, £5m ahead of our target
Highlights
3

2019 Group Financial Highlights
External revenue£3,308m
up 3% YOY(H2 up 13%)
Total advertising revenue
down 1.5%(H2 up 1.6%)
Adjusted EBITA£729m
(2018: £810m, down 10%)
Adjusted EPS13.9p
(2018: 15.4p, down 10%)
Online revenueup 21%
(H2 up 22%)
Statutory EPS11.8p
(2018: 11.7p, up 1%)
Total ITV Studios revenueup 9%
(H2 up 23%)
Dividend8.0p
(2018: 8.0p)
Total Non-TAR revenueup 7%
(H2 up 20%)
4
Profit to Cash87%
(2018: 88%)
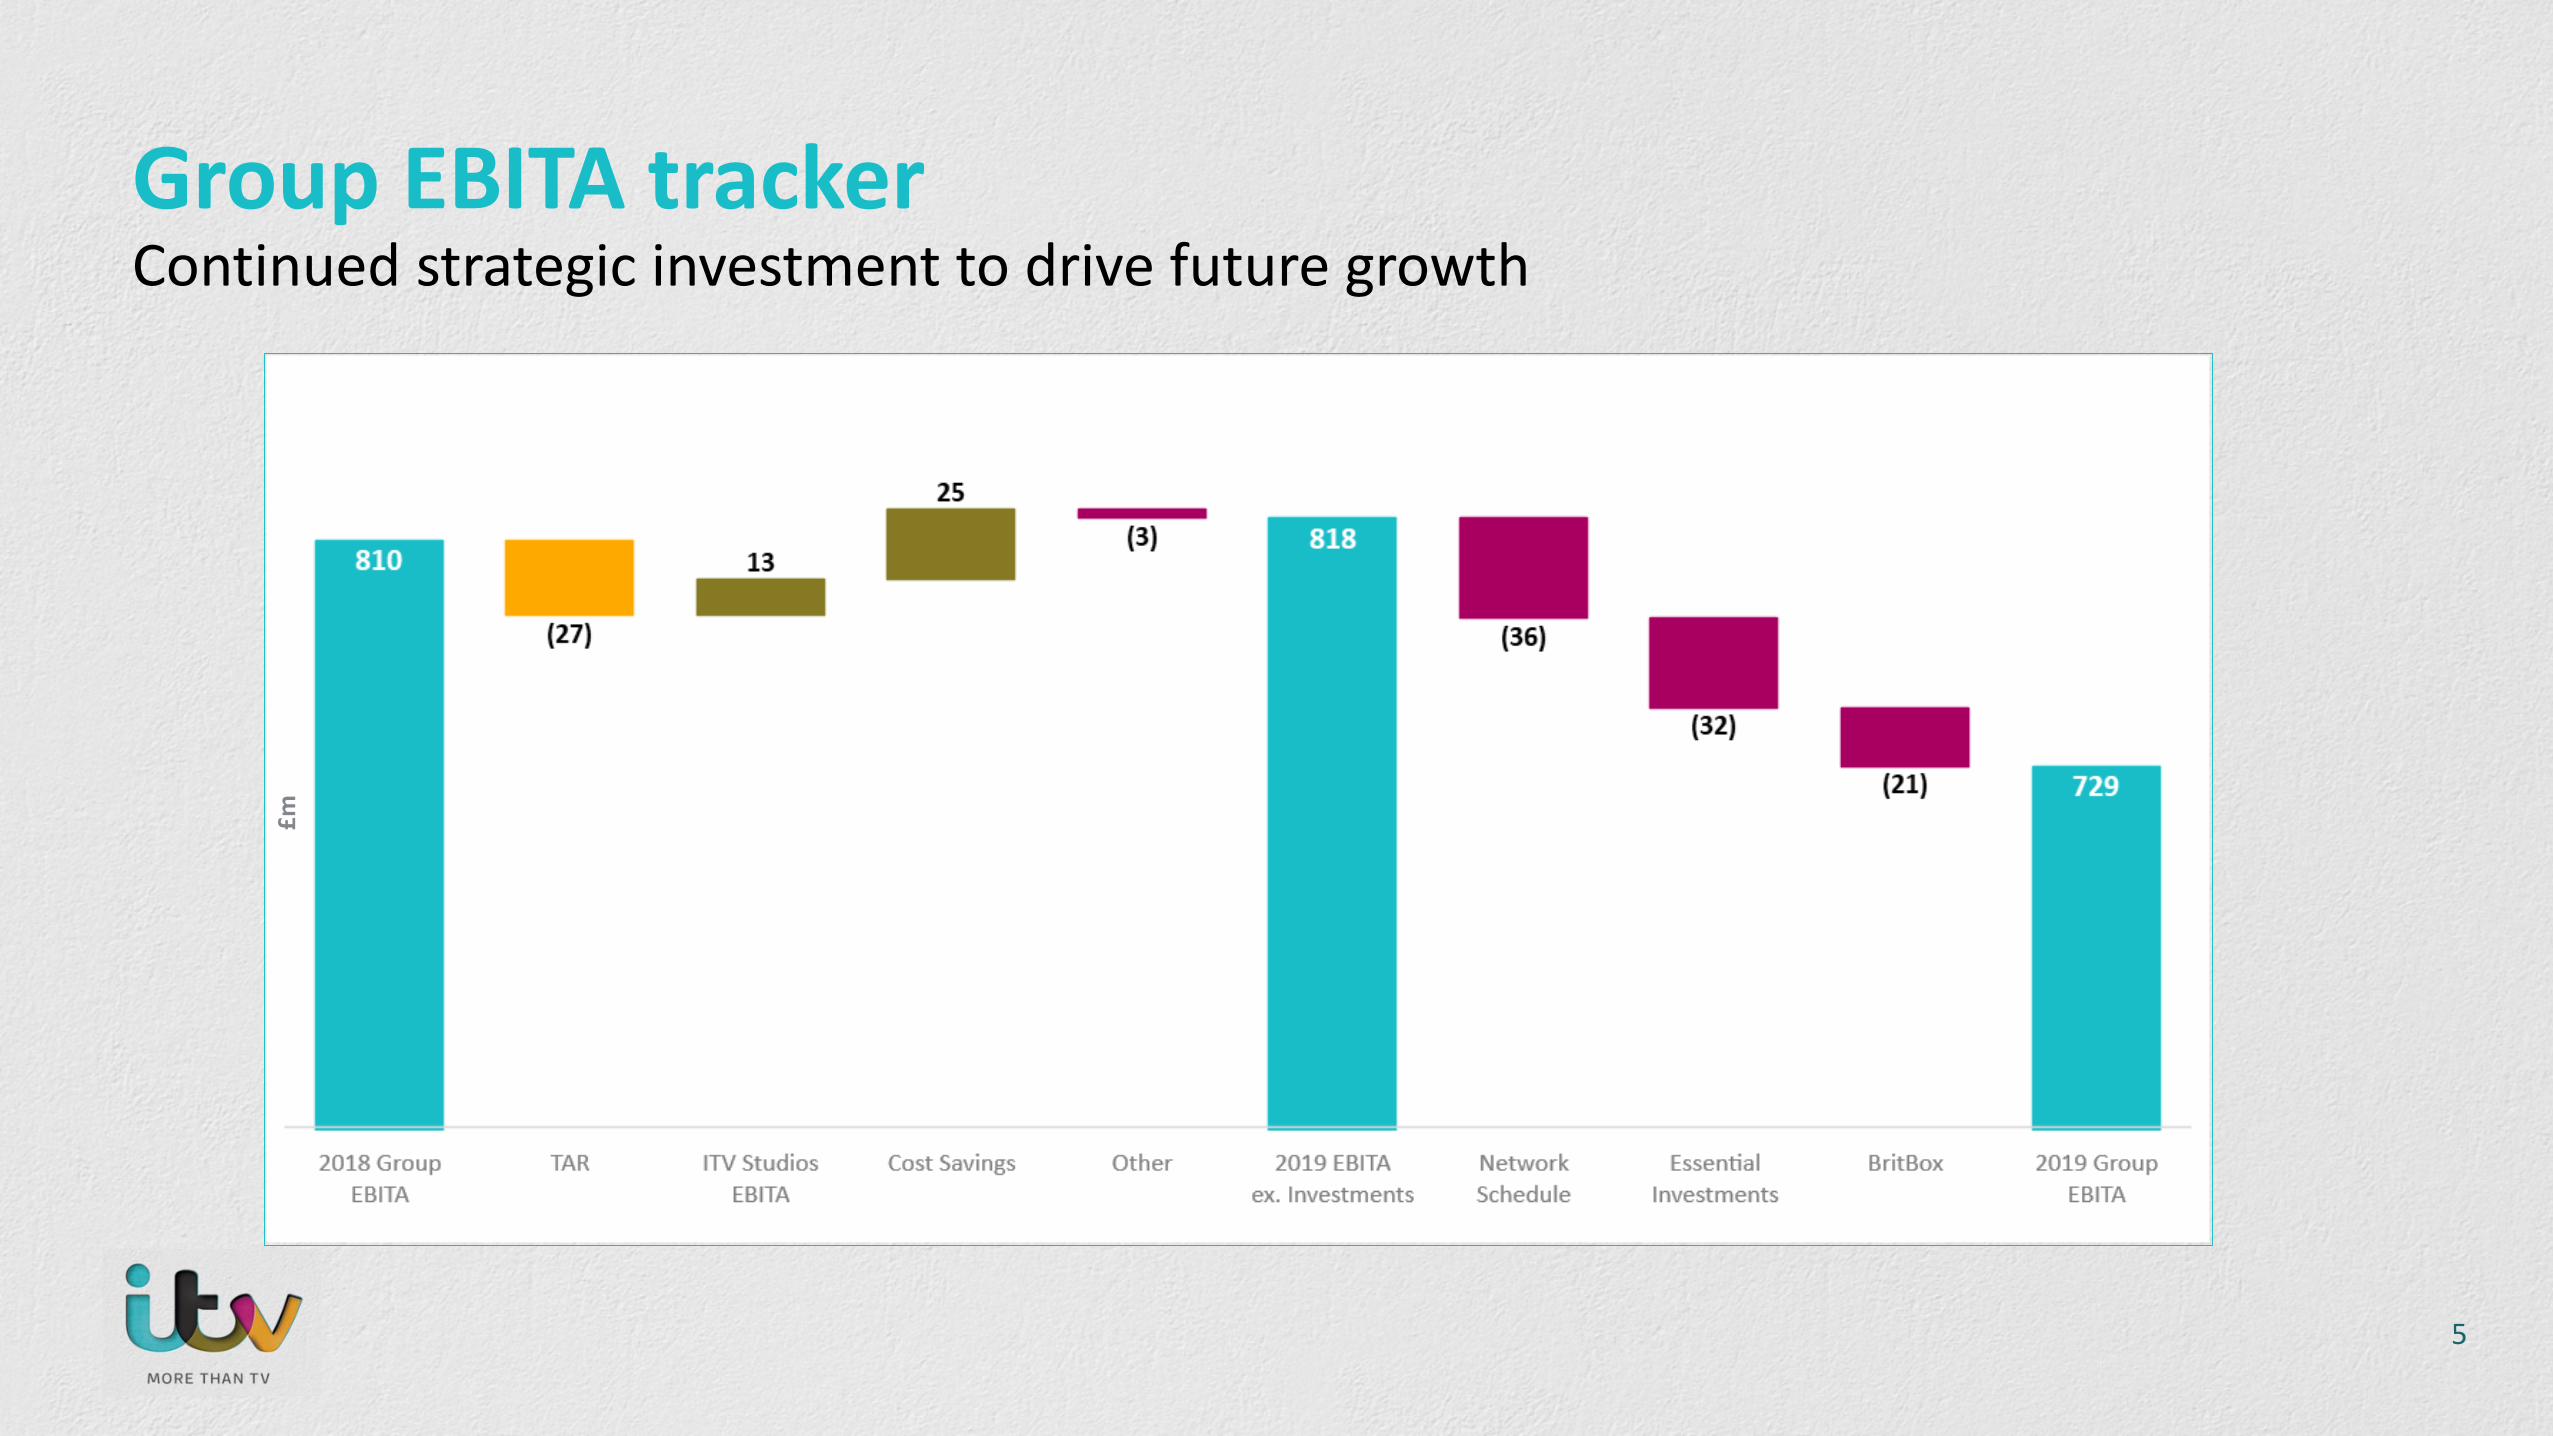
Group EBITA trackerContinued strategic investment to drive future growth
£m
5

Financial and Operating Review Chris Kennedy
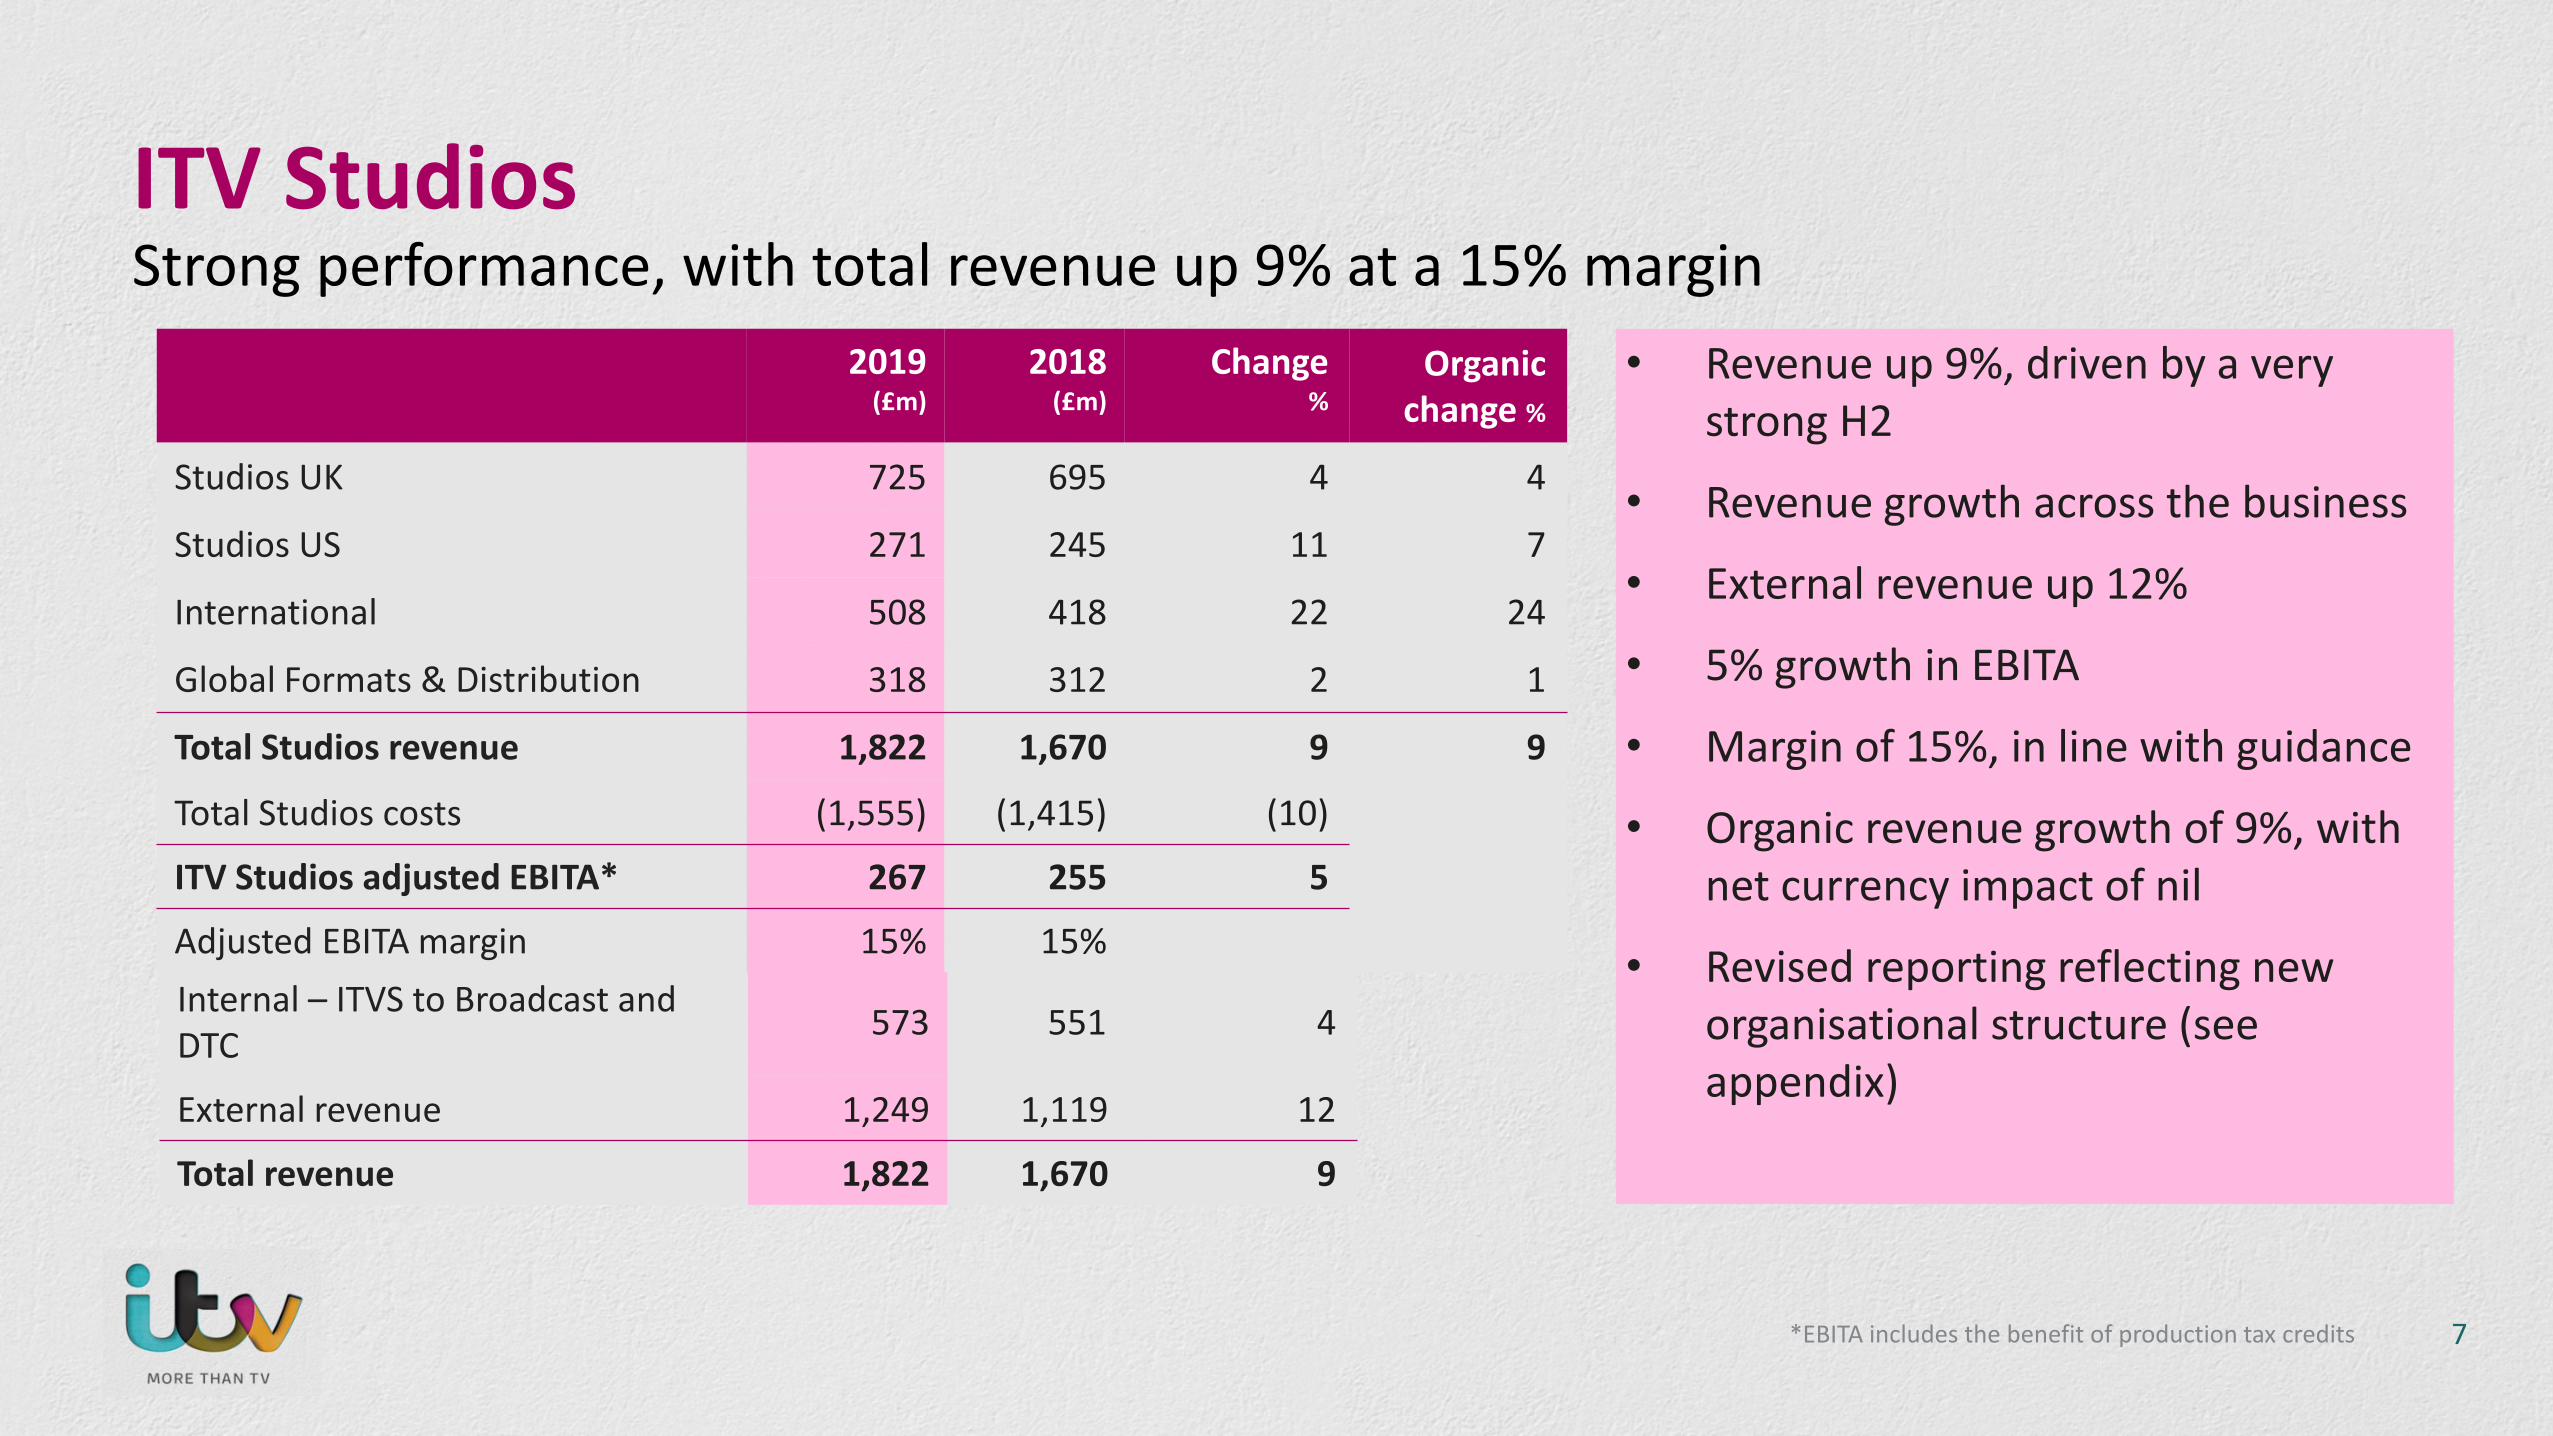
ITV Studios Strong performance, with total revenue up 9% at a 15% margin
Internal – ITVS to Broadcast and DTC 573 551 4
External revenue 1,249 1,119 12
Total revenue 1,822 1,670 9
2019 (£m)
2018 (£m)
Change%
Organic change %
Studios UK 725 695 4 4
Studios US 271 245 11 7
International 508 418 22 24
Global Formats & Distribution 318 312 2 1
Total Studios revenue 1,822 1,670 9 9
Total Studios costs (1,555) (1,415) (10)
ITV Studios adjusted EBITA* 267 255 5
Adjusted EBITA margin 15% 15%
• Revenue up 9%, driven by a very strong H2
• Revenue growth across the business
• External revenue up 12%
• 5% growth in EBITA
• Margin of 15%, in line with guidance
• Organic revenue growth of 9%, with net currency impact of nil
• Revised reporting reflecting new organisational structure (see appendix)
7*EBITA includes the benefit of production tax credits

ITV StudiosStrong growth in scripted revenues
2019 (£m)
2018 (£m)
Change(%)
Scripted 520 380 37Unscripted 1,018 997 2Core ITV and Other* 284 293 (3)Total Revenue 1,822 1,670 9
Core ITVUnscripted
Scripted
8*Core ITV includes the soaps and daytime shows produced by ITV for the ITV main channel

ITV Studios – Key performance indicators
Total Studios revenue
Total production hours
+9%
EBITA margin
KPI Performance in 2019 Target3 years to the end of 2021
On track?
15%
8,393, down 6%
Total Studios revenue to grow at least 5% average
CAGR
EBITA margin of 14% to 16%
Grow production hours to 10,000
9
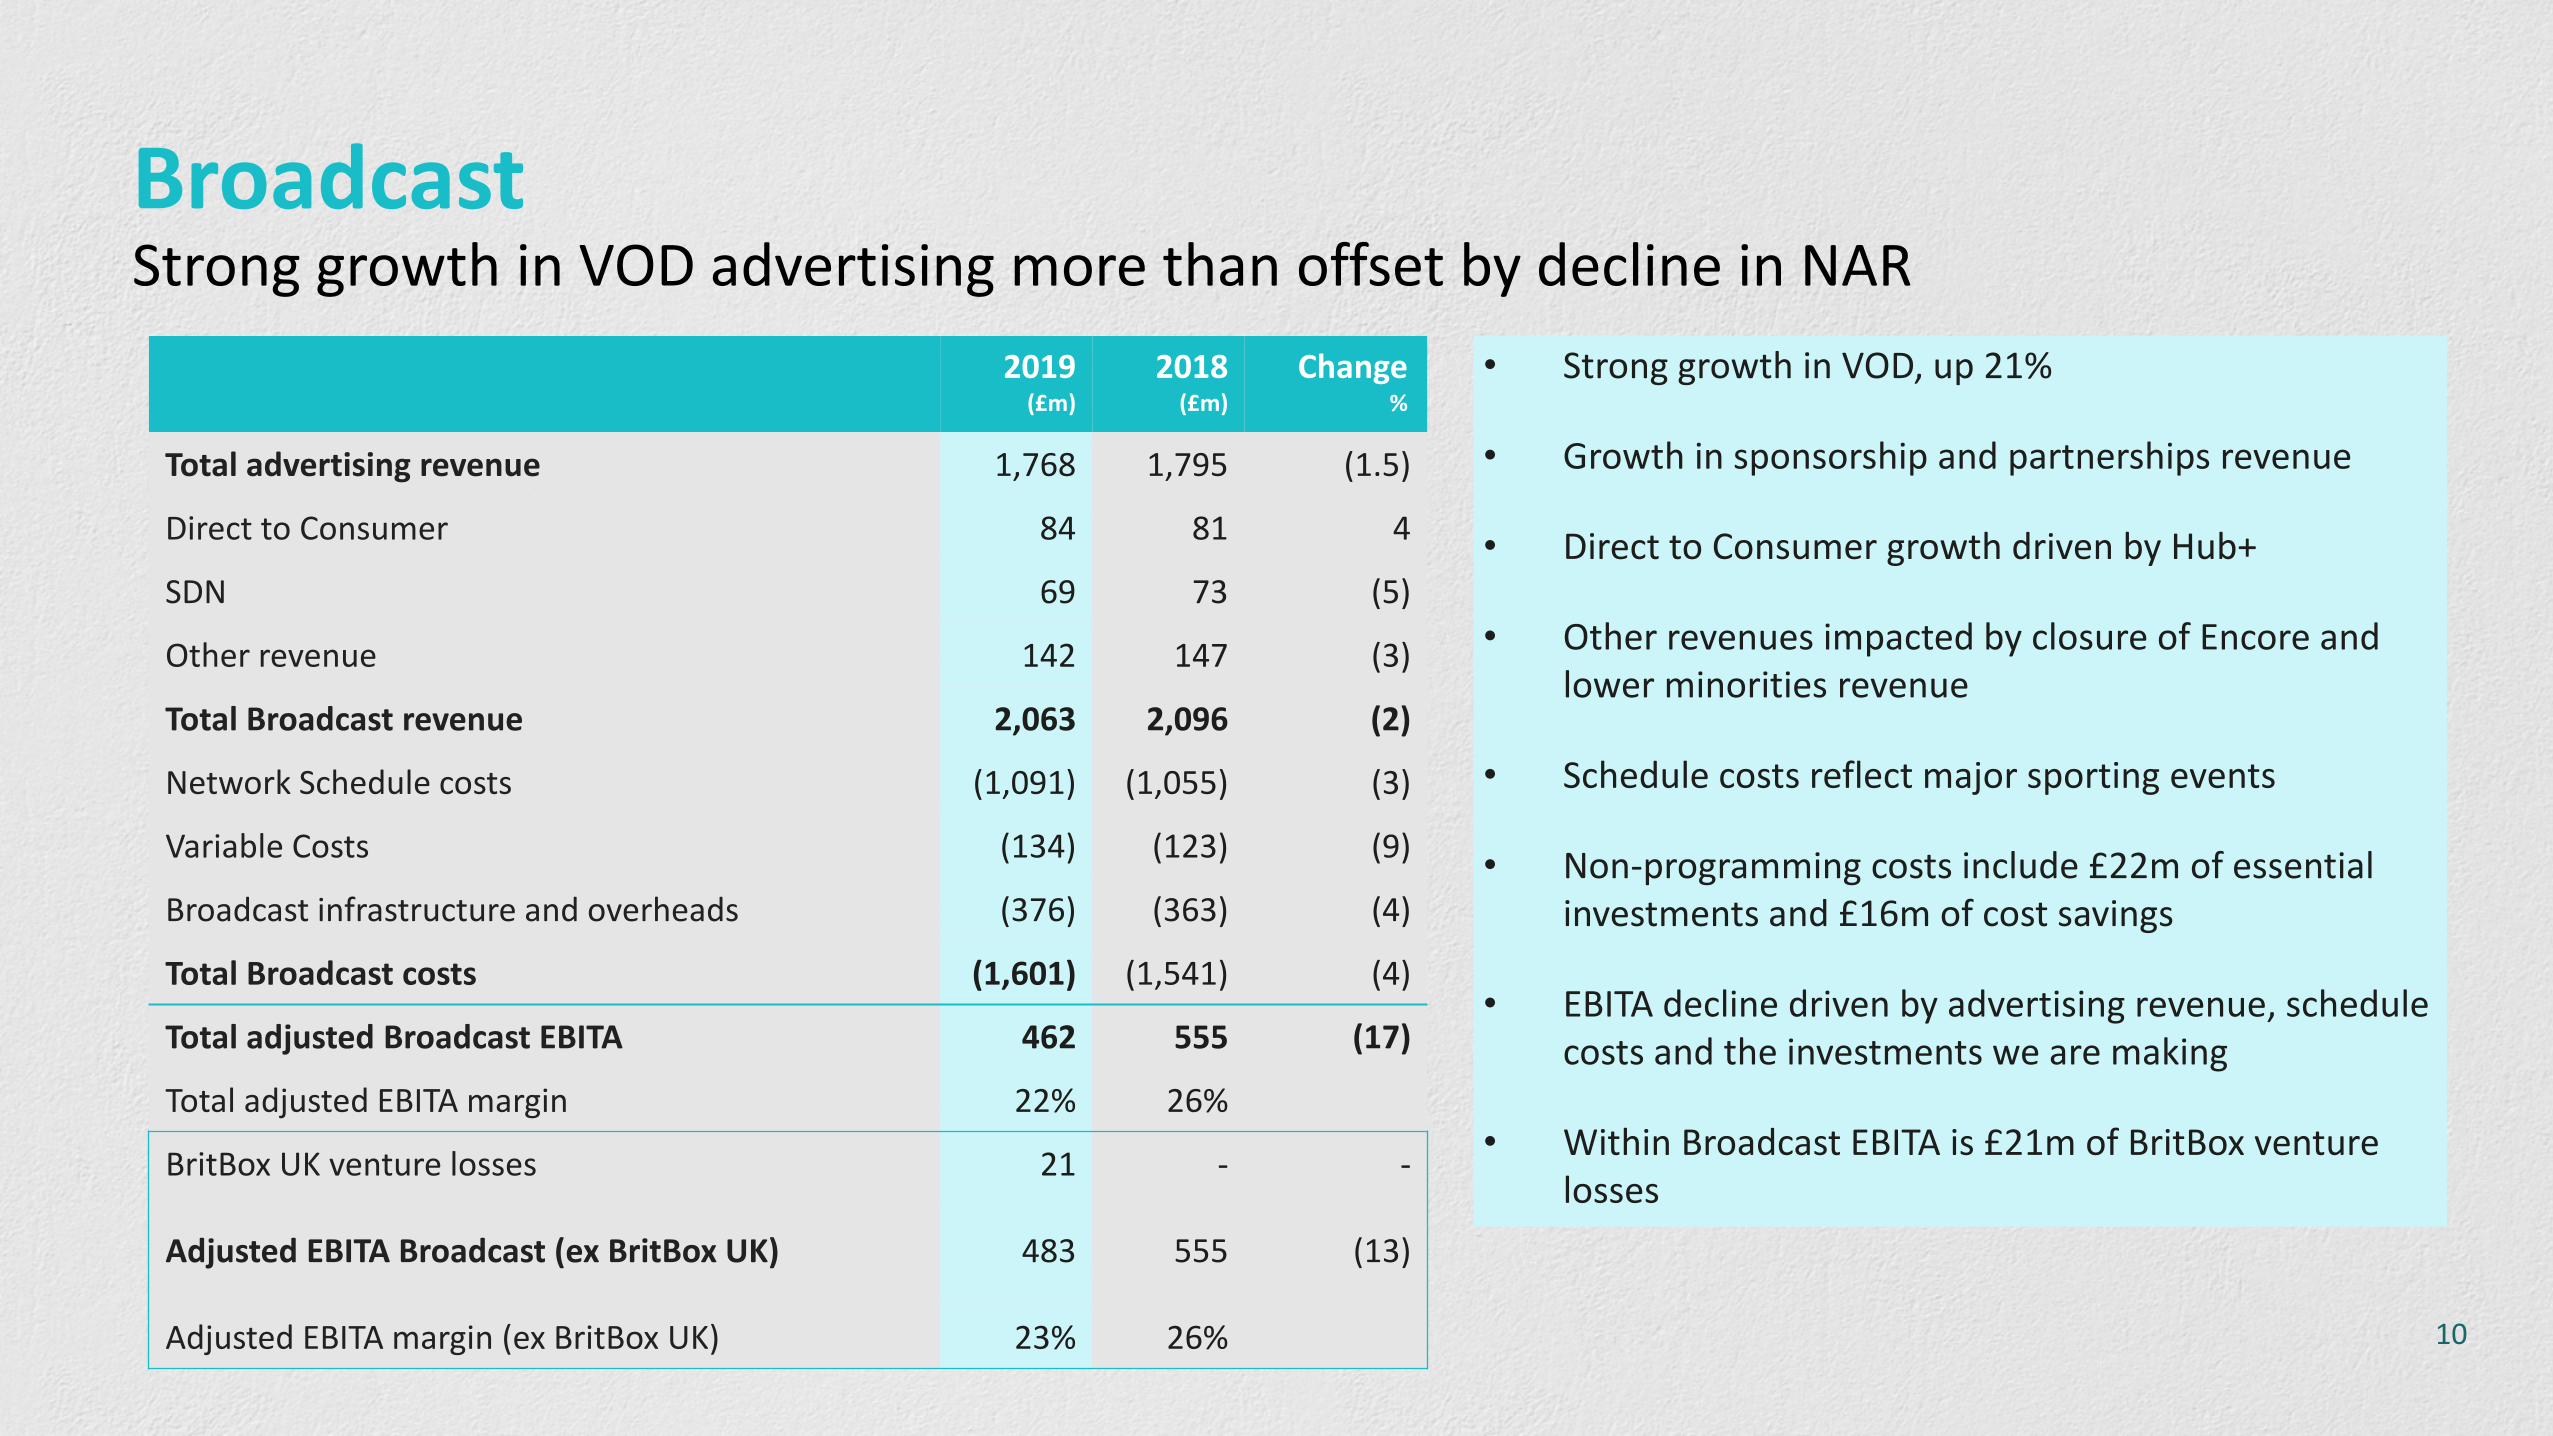
BroadcastStrong growth in VOD advertising more than offset by decline in NAR
2019 (£m)
2018 (£m)
Change%
Total advertising revenue 1,768 1,795 (1.5)
Direct to Consumer 84 81 4
SDN 69 73 (5)
Other revenue 142 147 (3)
Total Broadcast revenue 2,063 2,096 (2)
Network Schedule costs (1,091) (1,055) (3)
Variable Costs (134) (123) (9)
Broadcast infrastructure and overheads (376) (363) (4)
Total Broadcast costs (1,601) (1,541) (4)
Total adjusted Broadcast EBITA 462 555 (17)
Total adjusted EBITA margin 22% 26%
BritBox UK venture losses 21 - -
Adjusted EBITA Broadcast (ex BritBox UK) 483 555 (13)
Adjusted EBITA margin (ex BritBox UK) 23% 26%
• Strong growth in VOD, up 21%
• Growth in sponsorship and partnerships revenue
• Direct to Consumer growth driven by Hub+
• Other revenues impacted by closure of Encore and lower minorities revenue
• Schedule costs reflect major sporting events
• Non-programming costs include £22m of essential investments and £16m of cost savings
• EBITA decline driven by advertising revenue, schedule costs and the investments we are making
• Within Broadcast EBITA is £21m of BritBox venture losses
10

ITV ViewingGood onscreen and online viewing performance against tough comparatives
ITV Family SOV23.2%flat YOY
Online Viewingup 13%
16-34s SOV on ITV2
6.4% up 6%
>80% of 16-34sregistered on the
ITV Hub
ITV Total Viewingdown 4%
98% of all commercial
audiences >5m
ITV Hub MAU’sup 28%
ITV Hub dwell time
up 6%
11

Total Advertising Non-gambling online advertisers across categories continue to grow strongly, up 11%
Top 10 largest categories(Spot and VOD combined) 2019 (£m) YOY % change
Retail 269 (2)%
Entertainment and Leisure 160 (12)%
Finance 157 (5)%
Cars and Car Dealers 108 2%
Cosmetics & Toiletries 103 (11)%
Telecommunications 100 (5)%
Food 99 (5)%
Publishing and Broadcasting 94 21%
Airlines, Travel & Holidays 91 8%
Interior Furnishings 90 (9)%
12
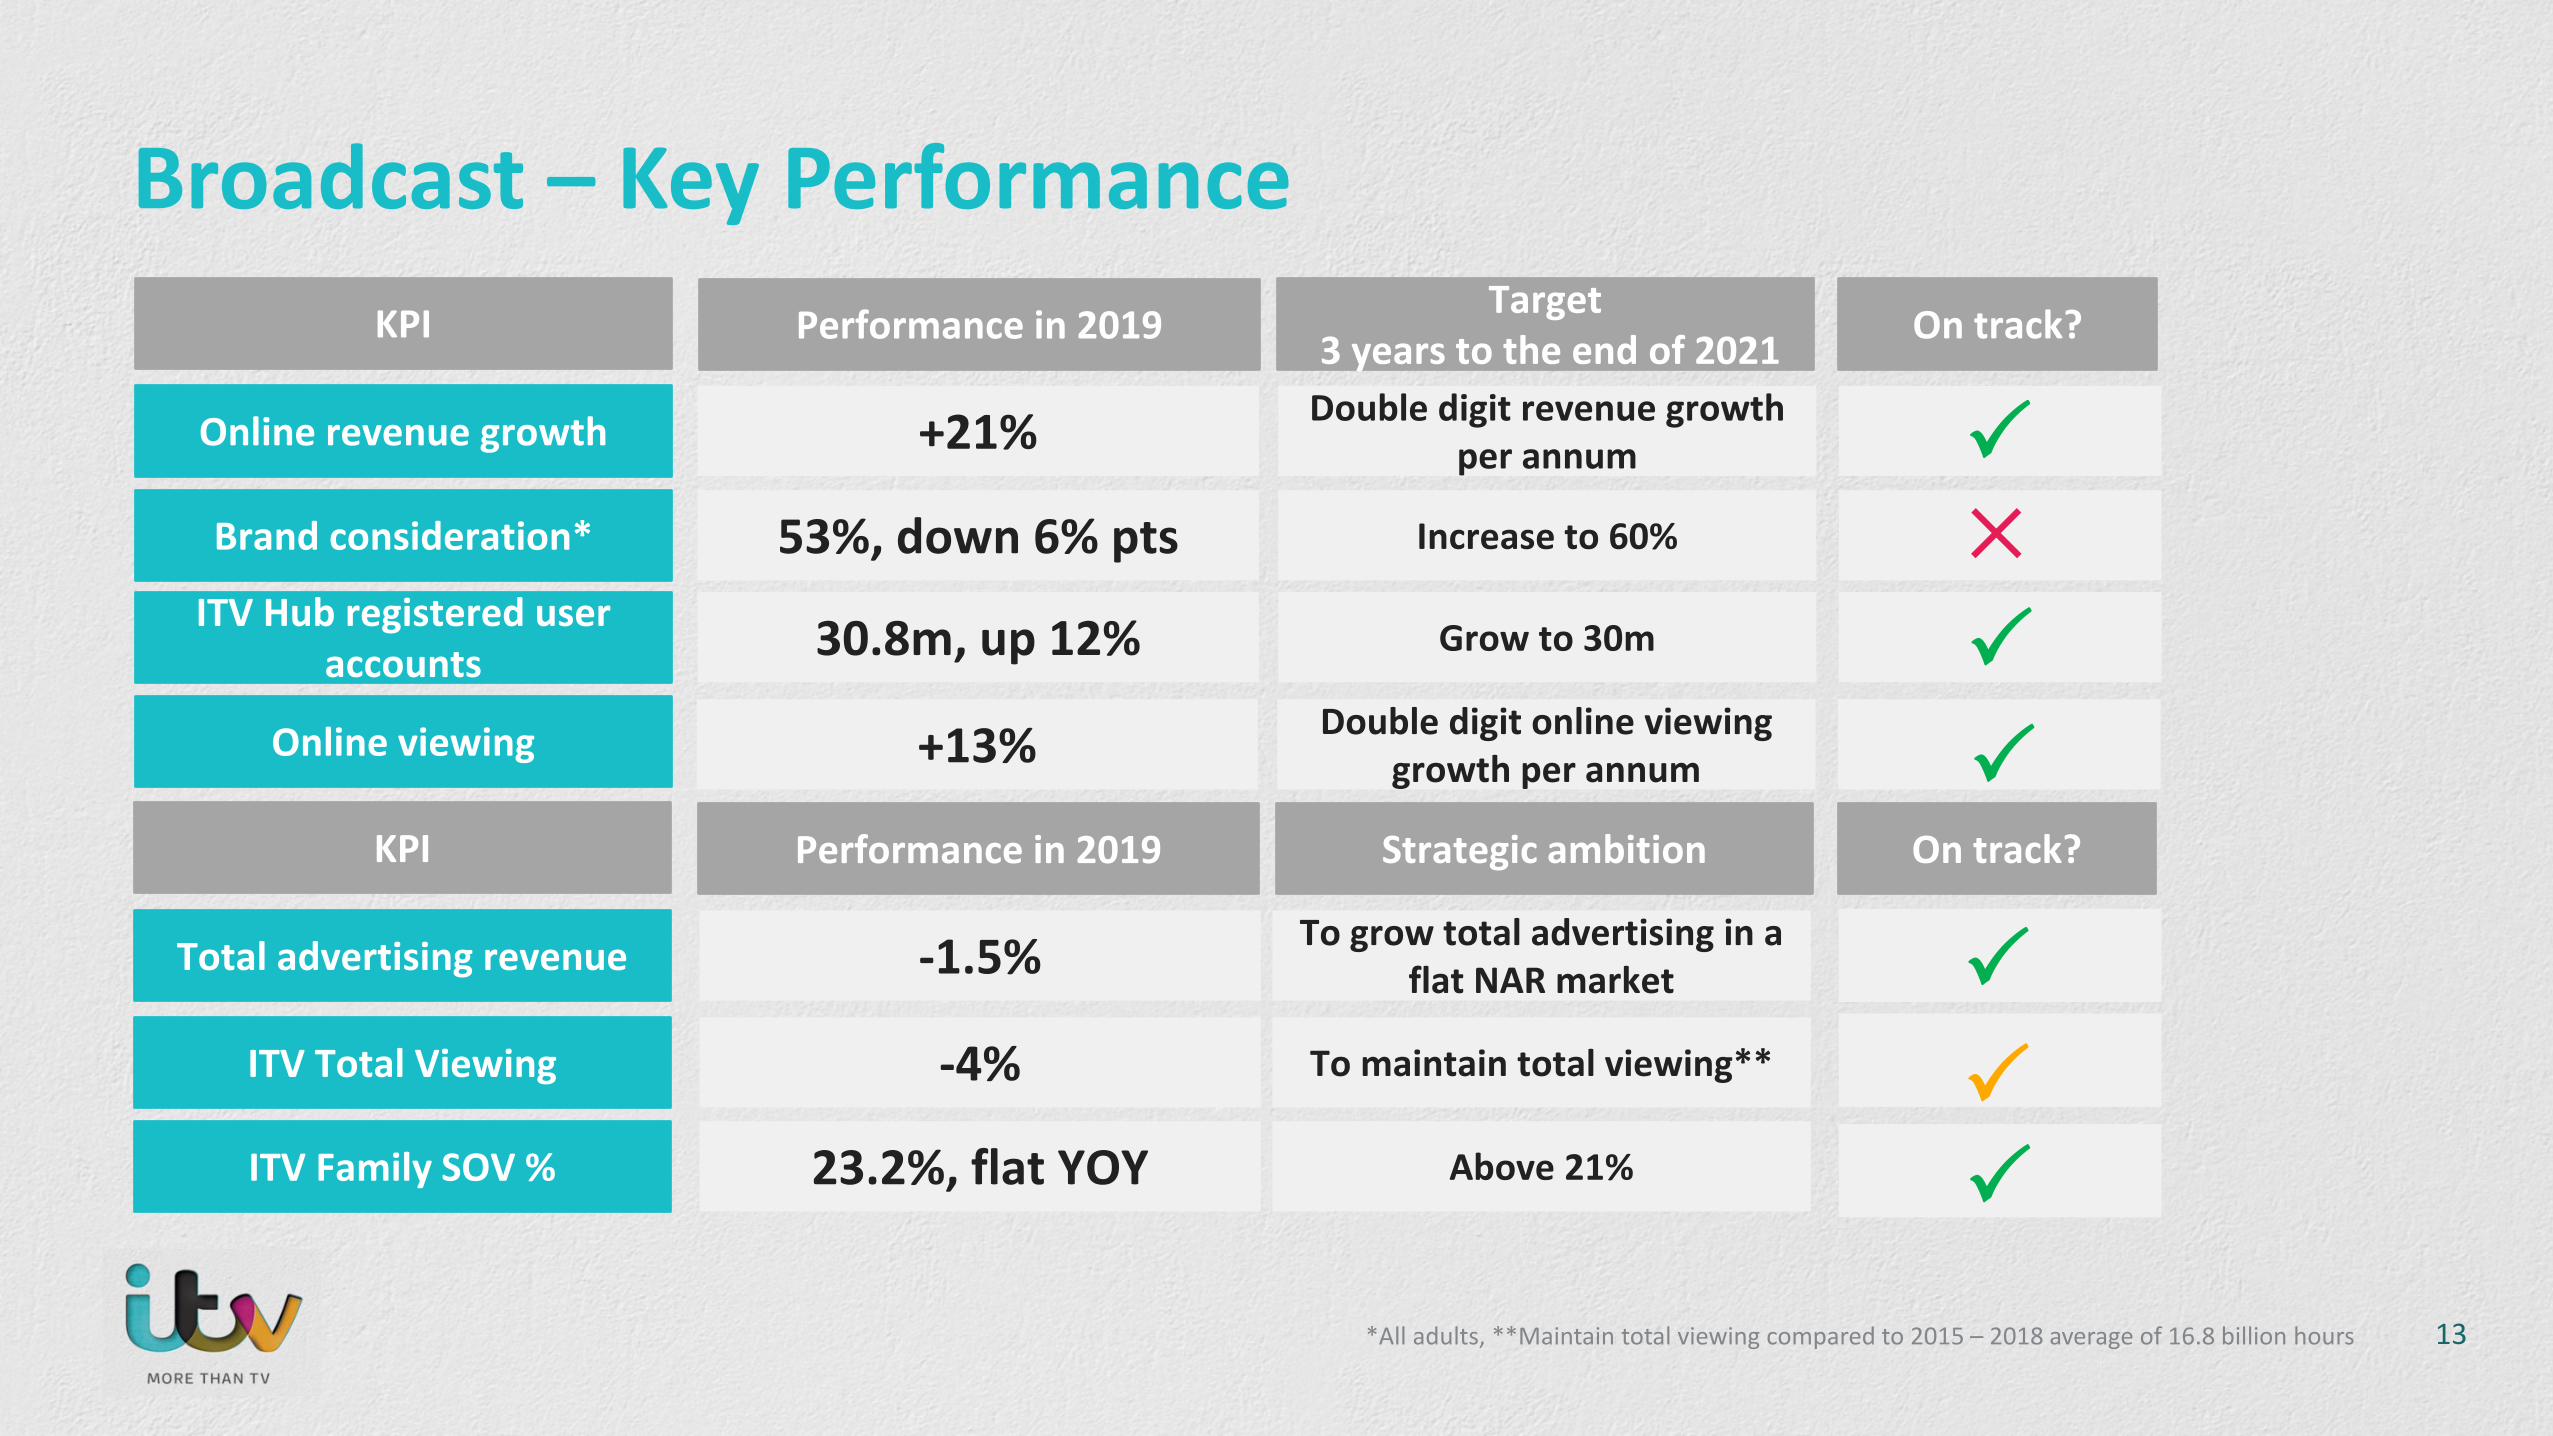
Online revenue growth
ITV Hub registered useraccounts
Brand consideration*
Online viewing
KPI Performance in 2019 Target3 years to the end of 2021 On track?
+21%
53%, down 6% pts
30.8m, up 12%
+13%
Double digit revenue growth per annum
Increase to 60%
Grow to 30m
Double digit online viewing growth per annum
Total advertising revenue
ITV Total Viewing
-1.5%
ITV Family SOV %
-4%
23.2%, flat YOY
To grow total advertising in a flat NAR market
To maintain total viewing**
Above 21%
KPI Performance in 2019 Strategic ambition On track?
Broadcast – Key Performance
✕
13*All adults, **Maintain total viewing compared to 2015 – 2018 average of 16.8 billion hours

Direct to Consumer – Key performance indicators
Total revenue* £84m, up 4%
Paying relationships*
KPI Performance in 2019Target
3 years to the end of 2021
On track?
8.4m, down 2%**
Grow revenue to at least £100 million
10 million paying relationships
* Excluding BritBox** Up year on year excluding Boxing pay per view
14
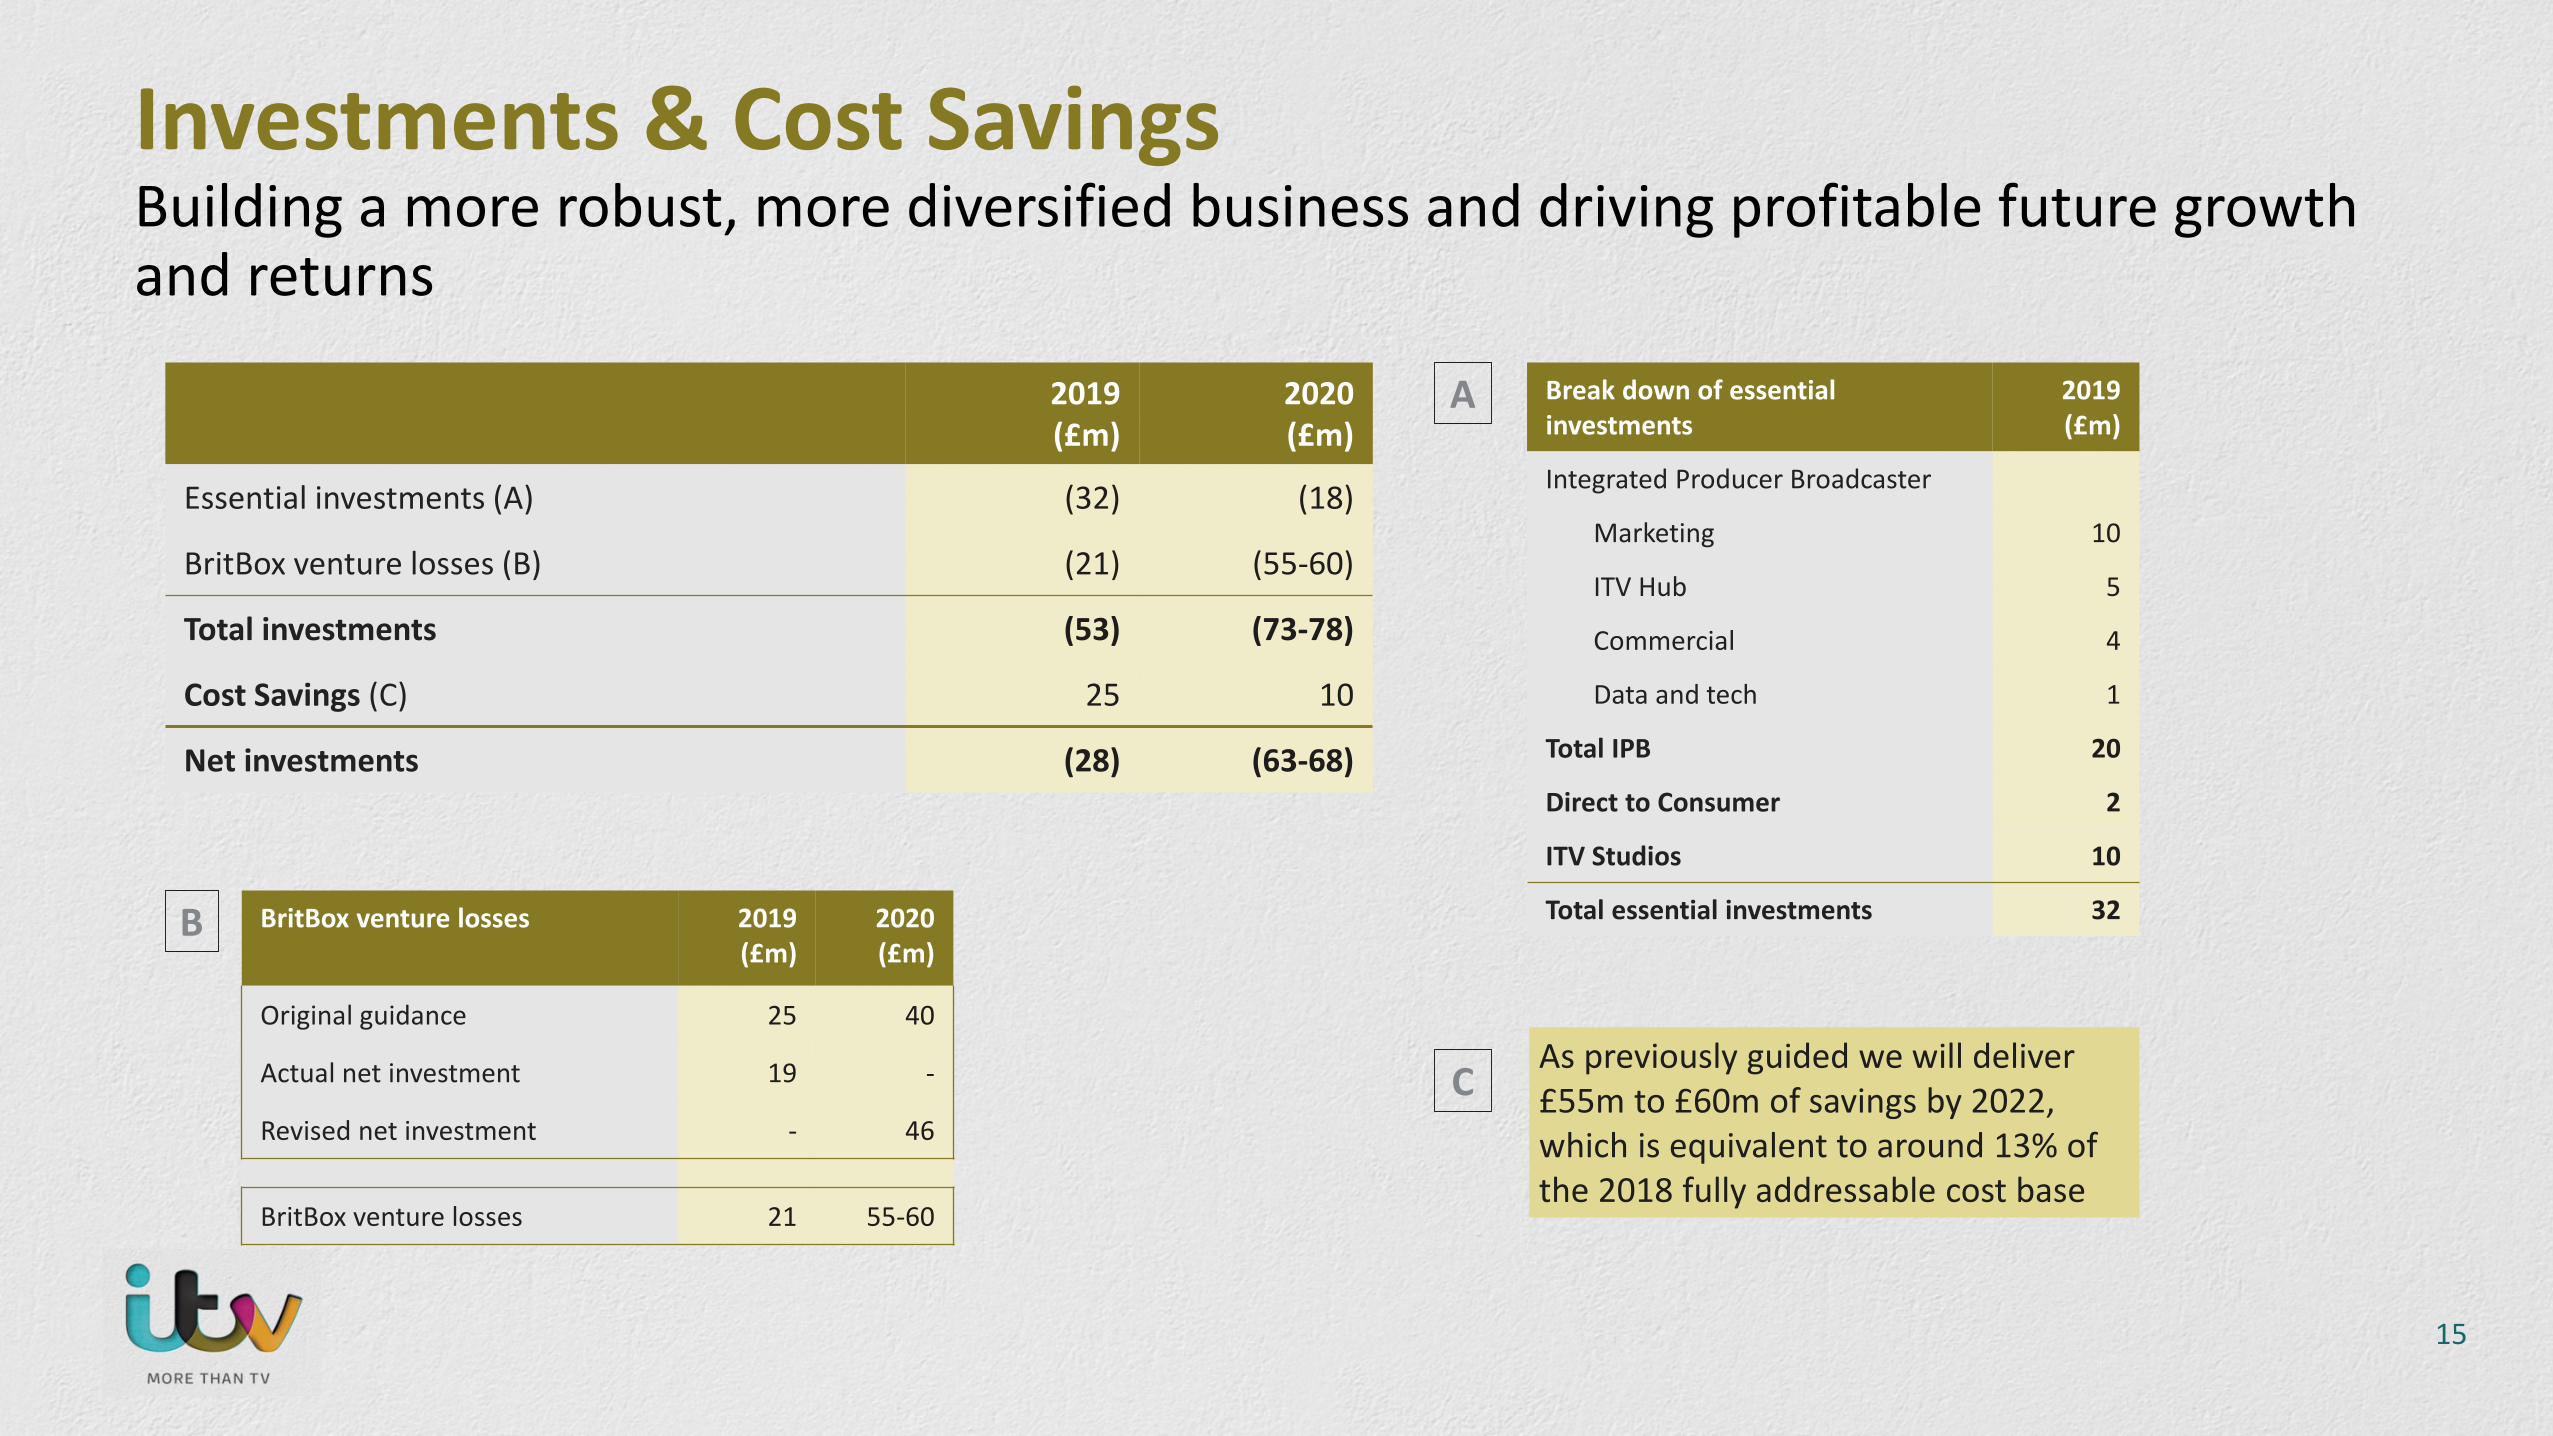
Investments & Cost SavingsBuilding a more robust, more diversified business and driving profitable future growth and returns
Break down of essential investments
2019 (£m)
Integrated Producer Broadcaster
Marketing 10
ITV Hub 5
Commercial 4
Data and tech 1
Total IPB 20
Direct to Consumer 2
ITV Studios 10
Total essential investments 32
2019 (£m)
2020 (£m)
Essential investments (A) (32) (18)
BritBox venture losses (B) (21) (55-60)
Total investments (53) (73-78)
Cost Savings (C) 25 10
Net investments (28) (63-68)
B BritBox venture losses 2019 (£m)
2020 (£m)
Original guidance 25 40
Actual net investment 19 -
Revised net investment - 46
BritBox venture losses 21 55-60
A
CAs previously guided we will deliver £55m to £60m of savings by 2022, which is equivalent to around 13% of the 2018 fully addressable cost base
15

Adjusted and Statutory results
Adjusted Earnings£555m
(2018: £621m, down 11%)
Adjusted EPS13.9p
(2018: 15.4p, down 10%)
Net Exceptional Items£22m
(2018: £83m)
Statutory EPS11.8p
(2018: 11.7p, up 1%)
16

Balance sheet and liquidity
Profit to Cash87%
(2018: 88%)
Net Debt£804m
(2018: £927m)
Leverage1.0x
(2018: 1.1x)
Undrawn Facilities£930m
(2018: £880m undrawn)
Net Pension Deficit£87m
(2018: £38m)
17
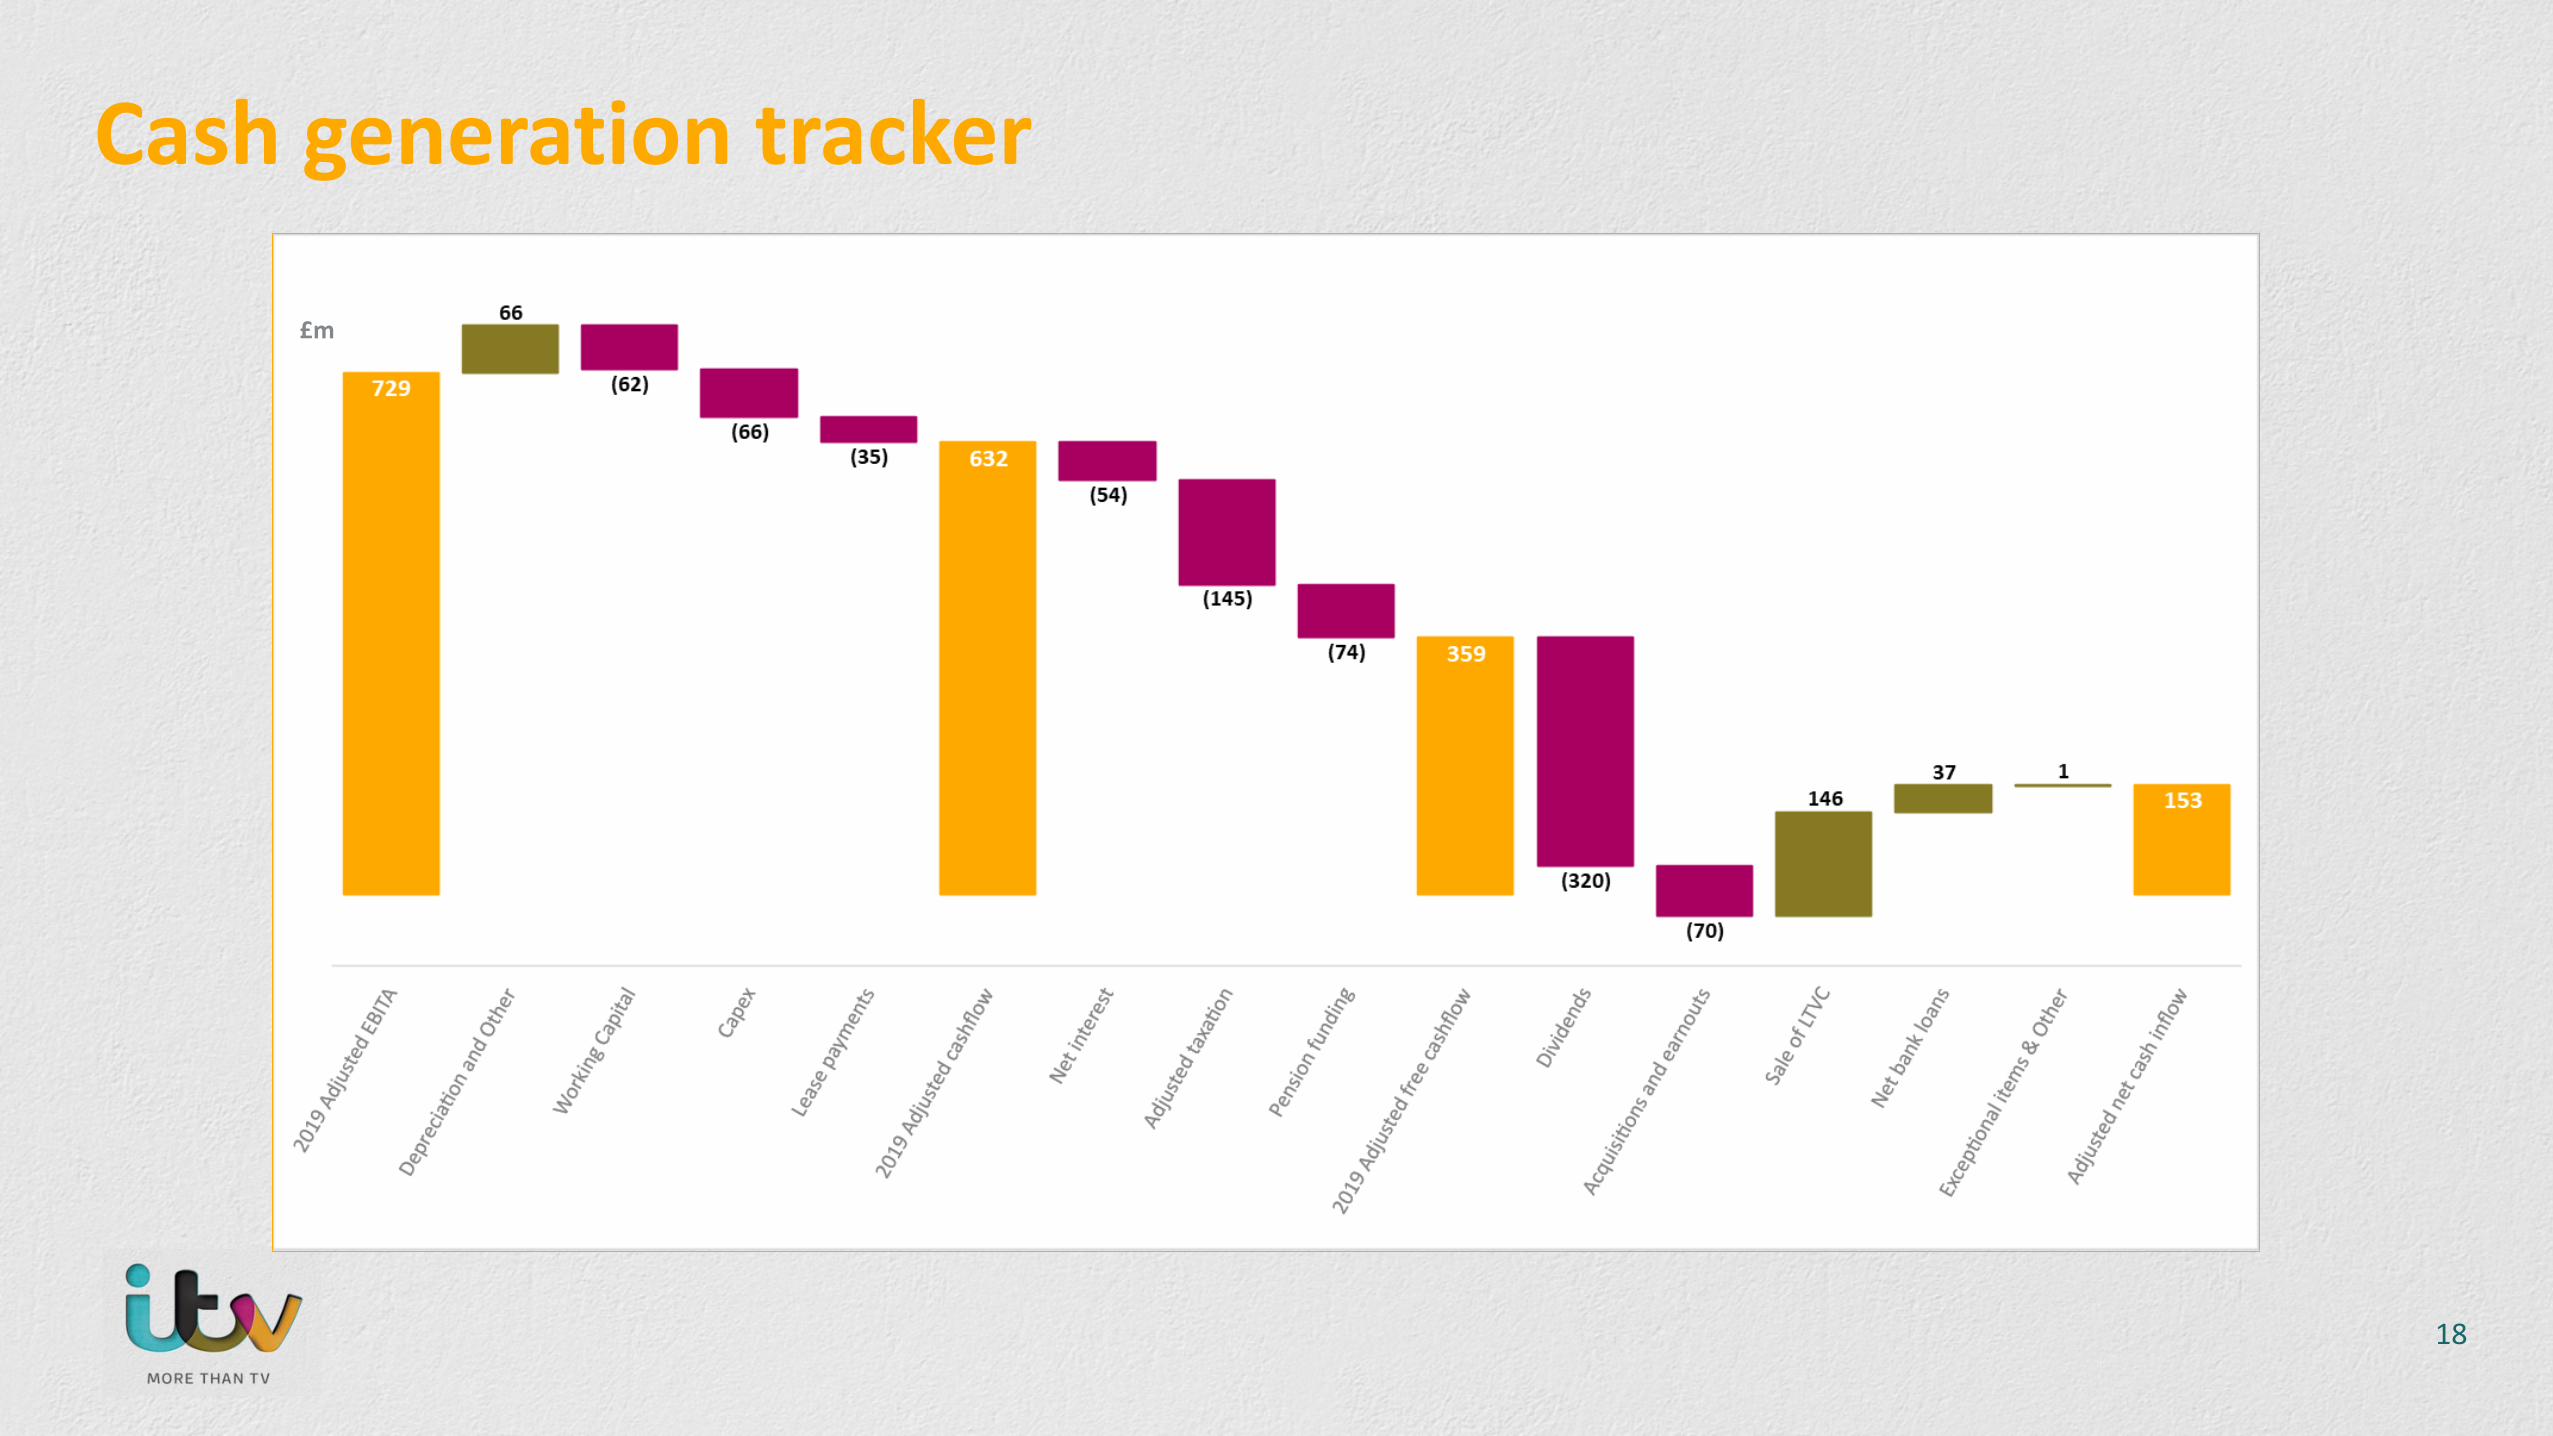
Cash generation tracker
18
£m

2020 Planning Assumptions
Estimated to be around £1.11bn
Total essential investments of around £18m, which includes £10m originally guided for 2020 and £8m phasing from 2019
Around £40m, in line with previous year
Adjusted effective tax rate of 18%-19%, and expected to remain at that level over the medium term
Translation impact of FX, assuming rates remain at current levels, is expected to have an adverse impact of around £50m
on revenue and £7m on profit
Schedule Costs
Investments
Adjusted Interest
Tax
Foreign Exchange
£10m cost savings in 2020 to fund strategic prioritiesCost Savings
Around £25m, mainly due to acquisition related expenses.Exceptional Items
Cash cost of exceptionals are expected to be around £210m largely accrued earnouts which includes the final earnout
payment for TalpaExceptional
items
Around 75-80% - reflecting our continued strong cash generation, investment in ITV Studios scripted working
capital, our addressable advertising platform and BritBoxProfit to cash
Around £95m of Capex, which includes investment in our addressable advertising platform and our US property movesCapex
P&L Cash
BritBox venture losses expected to be £55-60m, £6m higher than previously anticipated due to phasing from 2019BritBox
Pension Deficit funding contribution for 2020 is expected to be around £75m
Dividend The Board intends to pay a full year dividend of 8p
Will reflect a one-off of six quarterly payments, rather than four in previous yearsTax
19

Strategic Update Carolyn McCall
Our VisionWe will be a digitally led media and entertainment company that creates and brings our brilliant content to audiences wherever, whenever and however they choose.

We have evolved our strategy to deliver our vision….
22

Monetising quality content across multiple touch-points
Content
Linear TV ITV Hub
BritBox
InteractiveGL&M
Third party distribution
Global programme and format
sales
UK programmeand format
sales
ITV Studios
Hub+
Strategic and creative
partnerships
23

Social Purpose – shaping culture for good
24
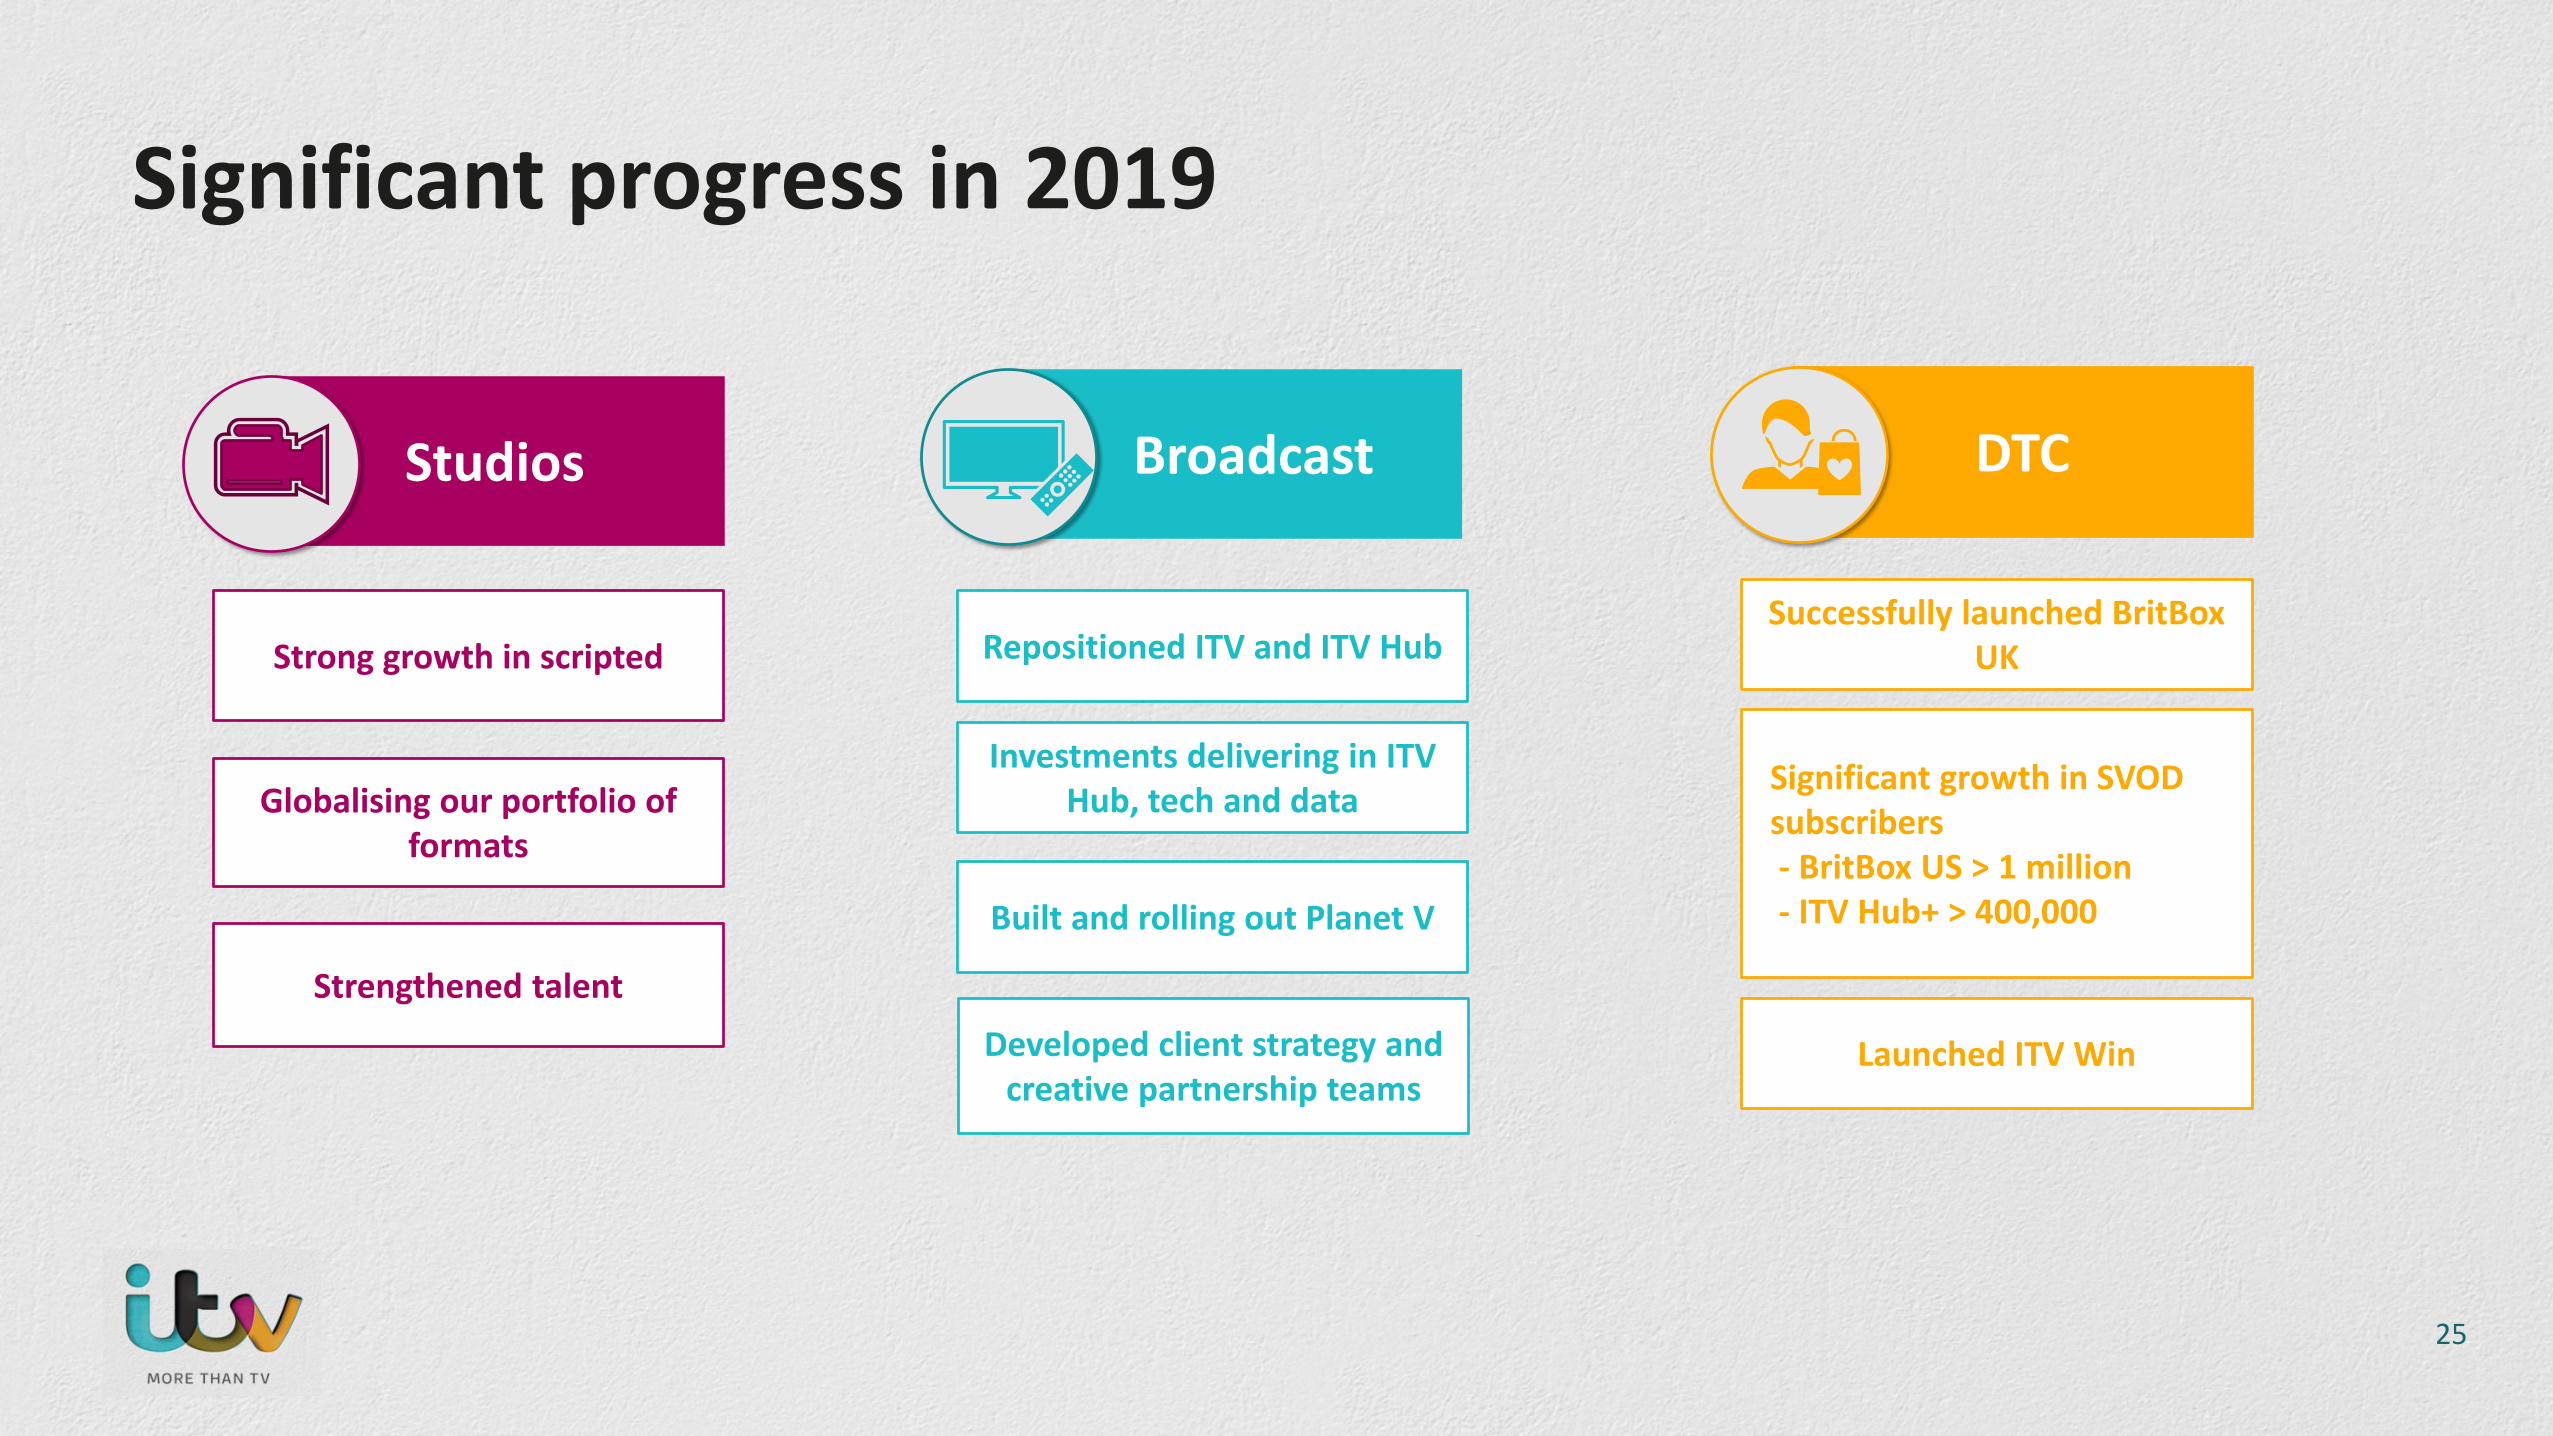
Significant progress in 2019
Broadcast DTC
Investments delivering in ITV Hub, tech and data
Built and rolling out Planet V
Repositioned ITV and ITV Hub
Significant growth in SVOD subscribers - BritBox US > 1 million- ITV Hub+ > 400,000
Launched ITV Win
Studios
Globalising our portfolio of formats
Strengthened talent
Strong growth in scripted
Developed client strategy and creative partnership teams
Successfully launched BritBoxUK
25
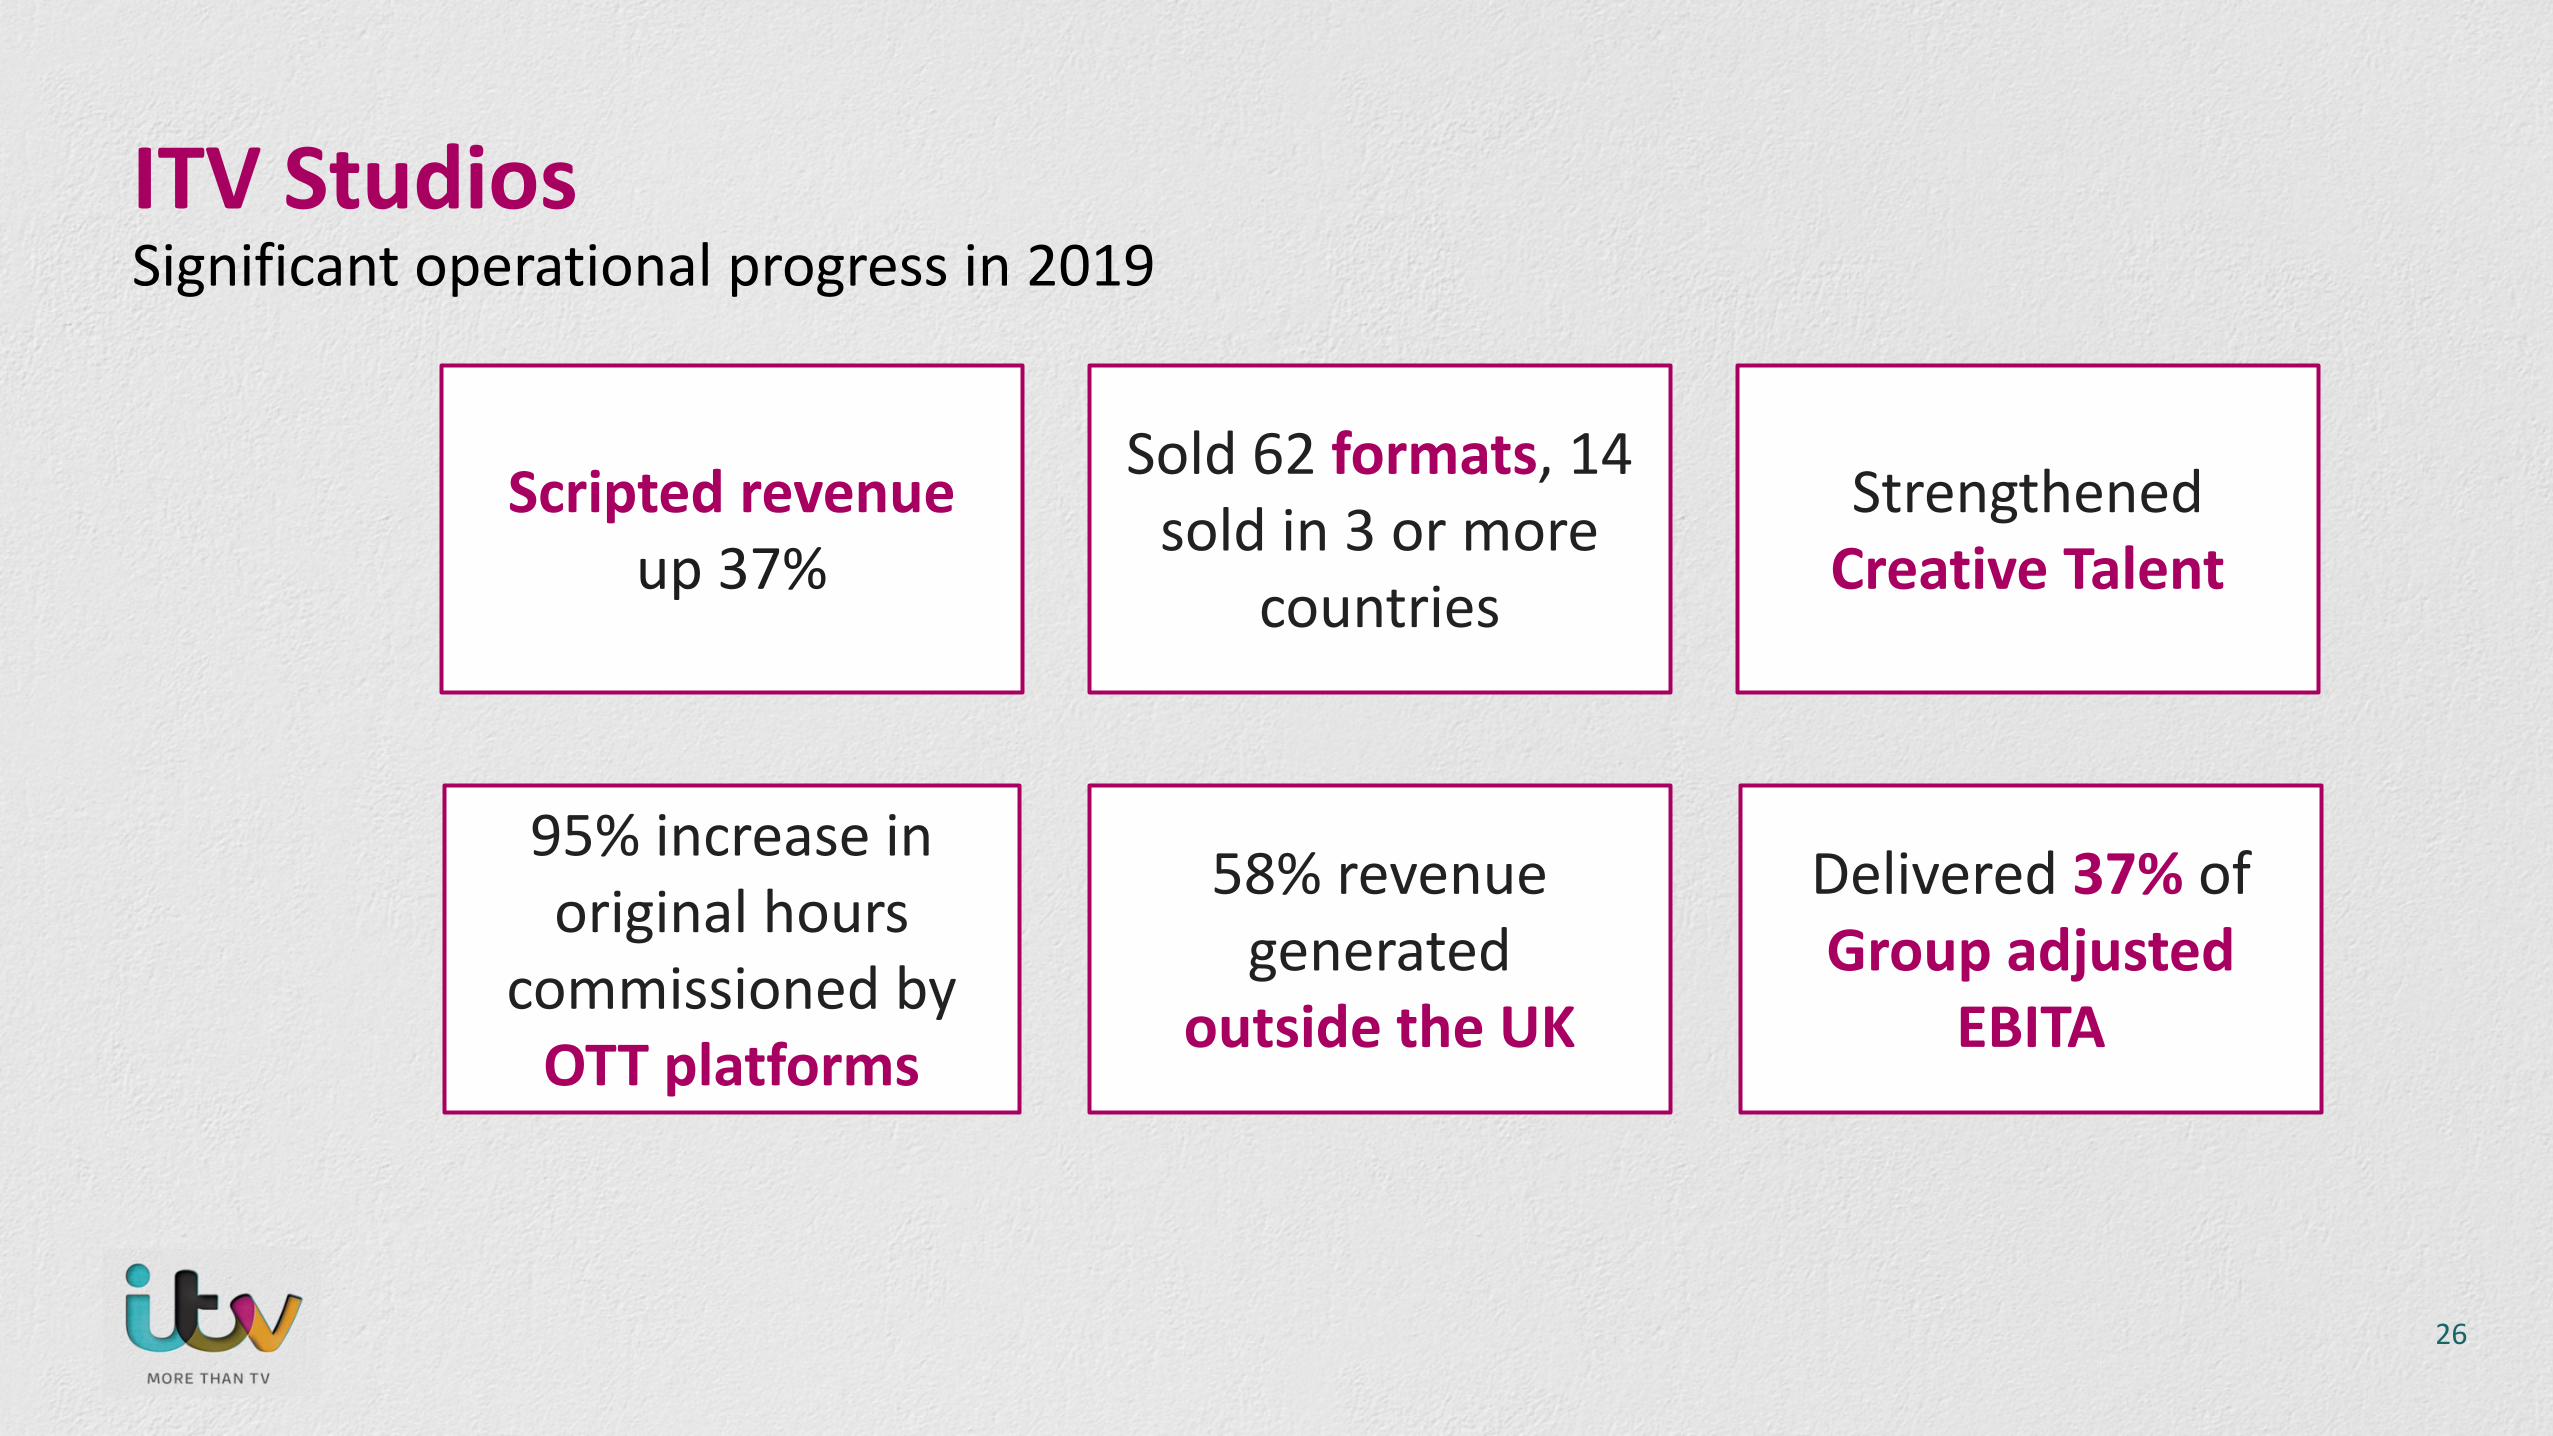
ITV StudiosSignificant operational progress in 2019
Scripted revenueup 37%
Sold 62 formats, 14 sold in 3 or more
countries
58% revenue generated
outside the UK
Strengthened Creative Talent
95% increase in original hours
commissioned by OTT platforms
Delivered 37% of Group adjusted
EBITA
26

Marketing
Broadcast essential investments delivering
27
Enhanced user experience – recommendations, cross platform resume, content trials Strengthened user interface – homepage redesign, consistent layout across platforms Brand and marketing – data driven performance marketing, upselling
ITV Hub
Evolution of digital video platform supporting Hub, Hub+ and BritBox Designed and built programmatic addressable advertising platform Launched airtime sales platform and evolving the audience data platform
Tech
Driving viewing: scaling recommendation model, econometrics model to optimise marketing investment, data driven CRM
Grow consumer revenue: SVOD subscriber acquisition and churn model Advertising: ad effectiveness POC, use and test data driven ad products
Data
Built client strategy team Strengthened creative partnerships Rolling out programmatic addressable advertising platform – Planet V
Advertising
Relaunched ITV and ITV Hub brand Increased SOV for light viewers

Direct to ConsumerProgress in 2019
BritBox USsubscribers >1m
Hub+ subscribers >400k
Successful launch of BritBox UK
Investing in ITV Win platform to drive
revenue
Customer relationships and
engagement around key brands
Developing gamingwith 10m downloads of Love Island game
28

Content
Marketing
Distribution
Q4 2019 Q1 2020 Q2 2020 Q3 2020 Q4 2020
First original launches
Number of screens BritBox is
available on
5 million
10 million
15 million
20 million
29
Brand building and performance marketingLaunch campaign

Broadcast DTC Enablers
Grow addressable on VOD, rolling out Planet V
Focus on mass quality audiences
Accelerate ITV Hub growthGrow SVOD subscribers and optimise retention BritBox UK BritBox US, and roll out
internationally ITV Hub+
Drive DTC revenues through ITV Win and focused DTC products
Strengthening capabilities in all areas
Ensure we own and manage our rights effectively
Create strong partnerships in the UK and internationally
Embedding data, analytics and tech
Build more strategic and creative partnerships with
advertisers
Studios
Globalise and maximise value of key formats and brands
Continued growth viaM&A and / or organically
Grow scripted business
How we are delivering the strategy
30

ITV Studios – Priorities for 2020 Integration of Talpa and reorganisation of the distribution and commercial
division with three Centres of Excellence The Creative Network Global Entertainment Global Distribution
Further strengthen creative talent
Continue to build and monetise a strong pipeline of programmes Growing scripted Globalising our formats, and Diversifying our customer base and increasingly serving OTTs
31

Broadcast - Priorities for 2020 Digital transformation using tech, data and analytics
Accelerate the growth of ITV Hub Strengthen content User experience – content, personalisation, prominence Invest in data and tech to enhance and support the ITV Hub Increase monetisable MAU’s
Focus marketing on driving light viewers and ITV Hub viewers Greater use of first party data
Further roll out and embed Planet V
Continue to build more strategic and creative partnerships with advertisers
Programme budget will focus on mass audiences, light viewers, live audiences, digital viewers and 16-34’s viewers
32

Direct to Consumer - Priorities for 2020
Interactive: Further develop and grow the ITV Win competition portal Drive value from integrating customer data across ITV
Subscription Grow BritBox UK subscribers and optimise retention Continued growth of the Hub+ and BritBox US Launch BritBox Australia and identify other possible international
markets
Direct to Consumer products around our key successful brands I’m a Celebrity live attraction Launch new Love Island game Scale the new Hells Kitchen game Continue to grow our merchandising globally
33

Accelerating ITV’s digital transformation
Scheduling
Rights Management System
Consumer facing products Core central functions
Ensuring people have the right tools and driving the best ways of working
2020 Projects:
Freecon
Workplace Tech
Show apps
CompetitionsPortal
Gaming Show shops
34
Content supply chain
Making our key processes more agile and efficient
2020 Projects:

Outlook• Good start to 2020
• Continued strong growth in online viewing• ITV Family SOV flat with strong schedule coming up• TAR is expected to be up 2% in Q1• Early indications suggest TAR is down 10% in April
• In March and April we have seen an impact from travel advertising deferments relating to the Coronavirus. All deferments to date have been included in the guidance.
• Despite the ongoing economic uncertainty around the outlook for the UK following its departure from the EU, over the full year we arecurrently confident that
• We will continue to execute well on the strategy with good momentum across ITV• ITV Studios will deliver revenue growth in 2020, as previously guided• We will deliver double digit growth in online revenues• Direct to Consumer will grow revenue over the full year• BritBox venture losses are expected to be around £55m to £60m• It’s the Board’s intention to pay 8p dividend for the full year
• At this stage it is too difficult to assess the further implications of the Coronavirus, but we continue to monitor the situation closely
• Strategic vision and priorities are clear
35

Q&A

Appendix
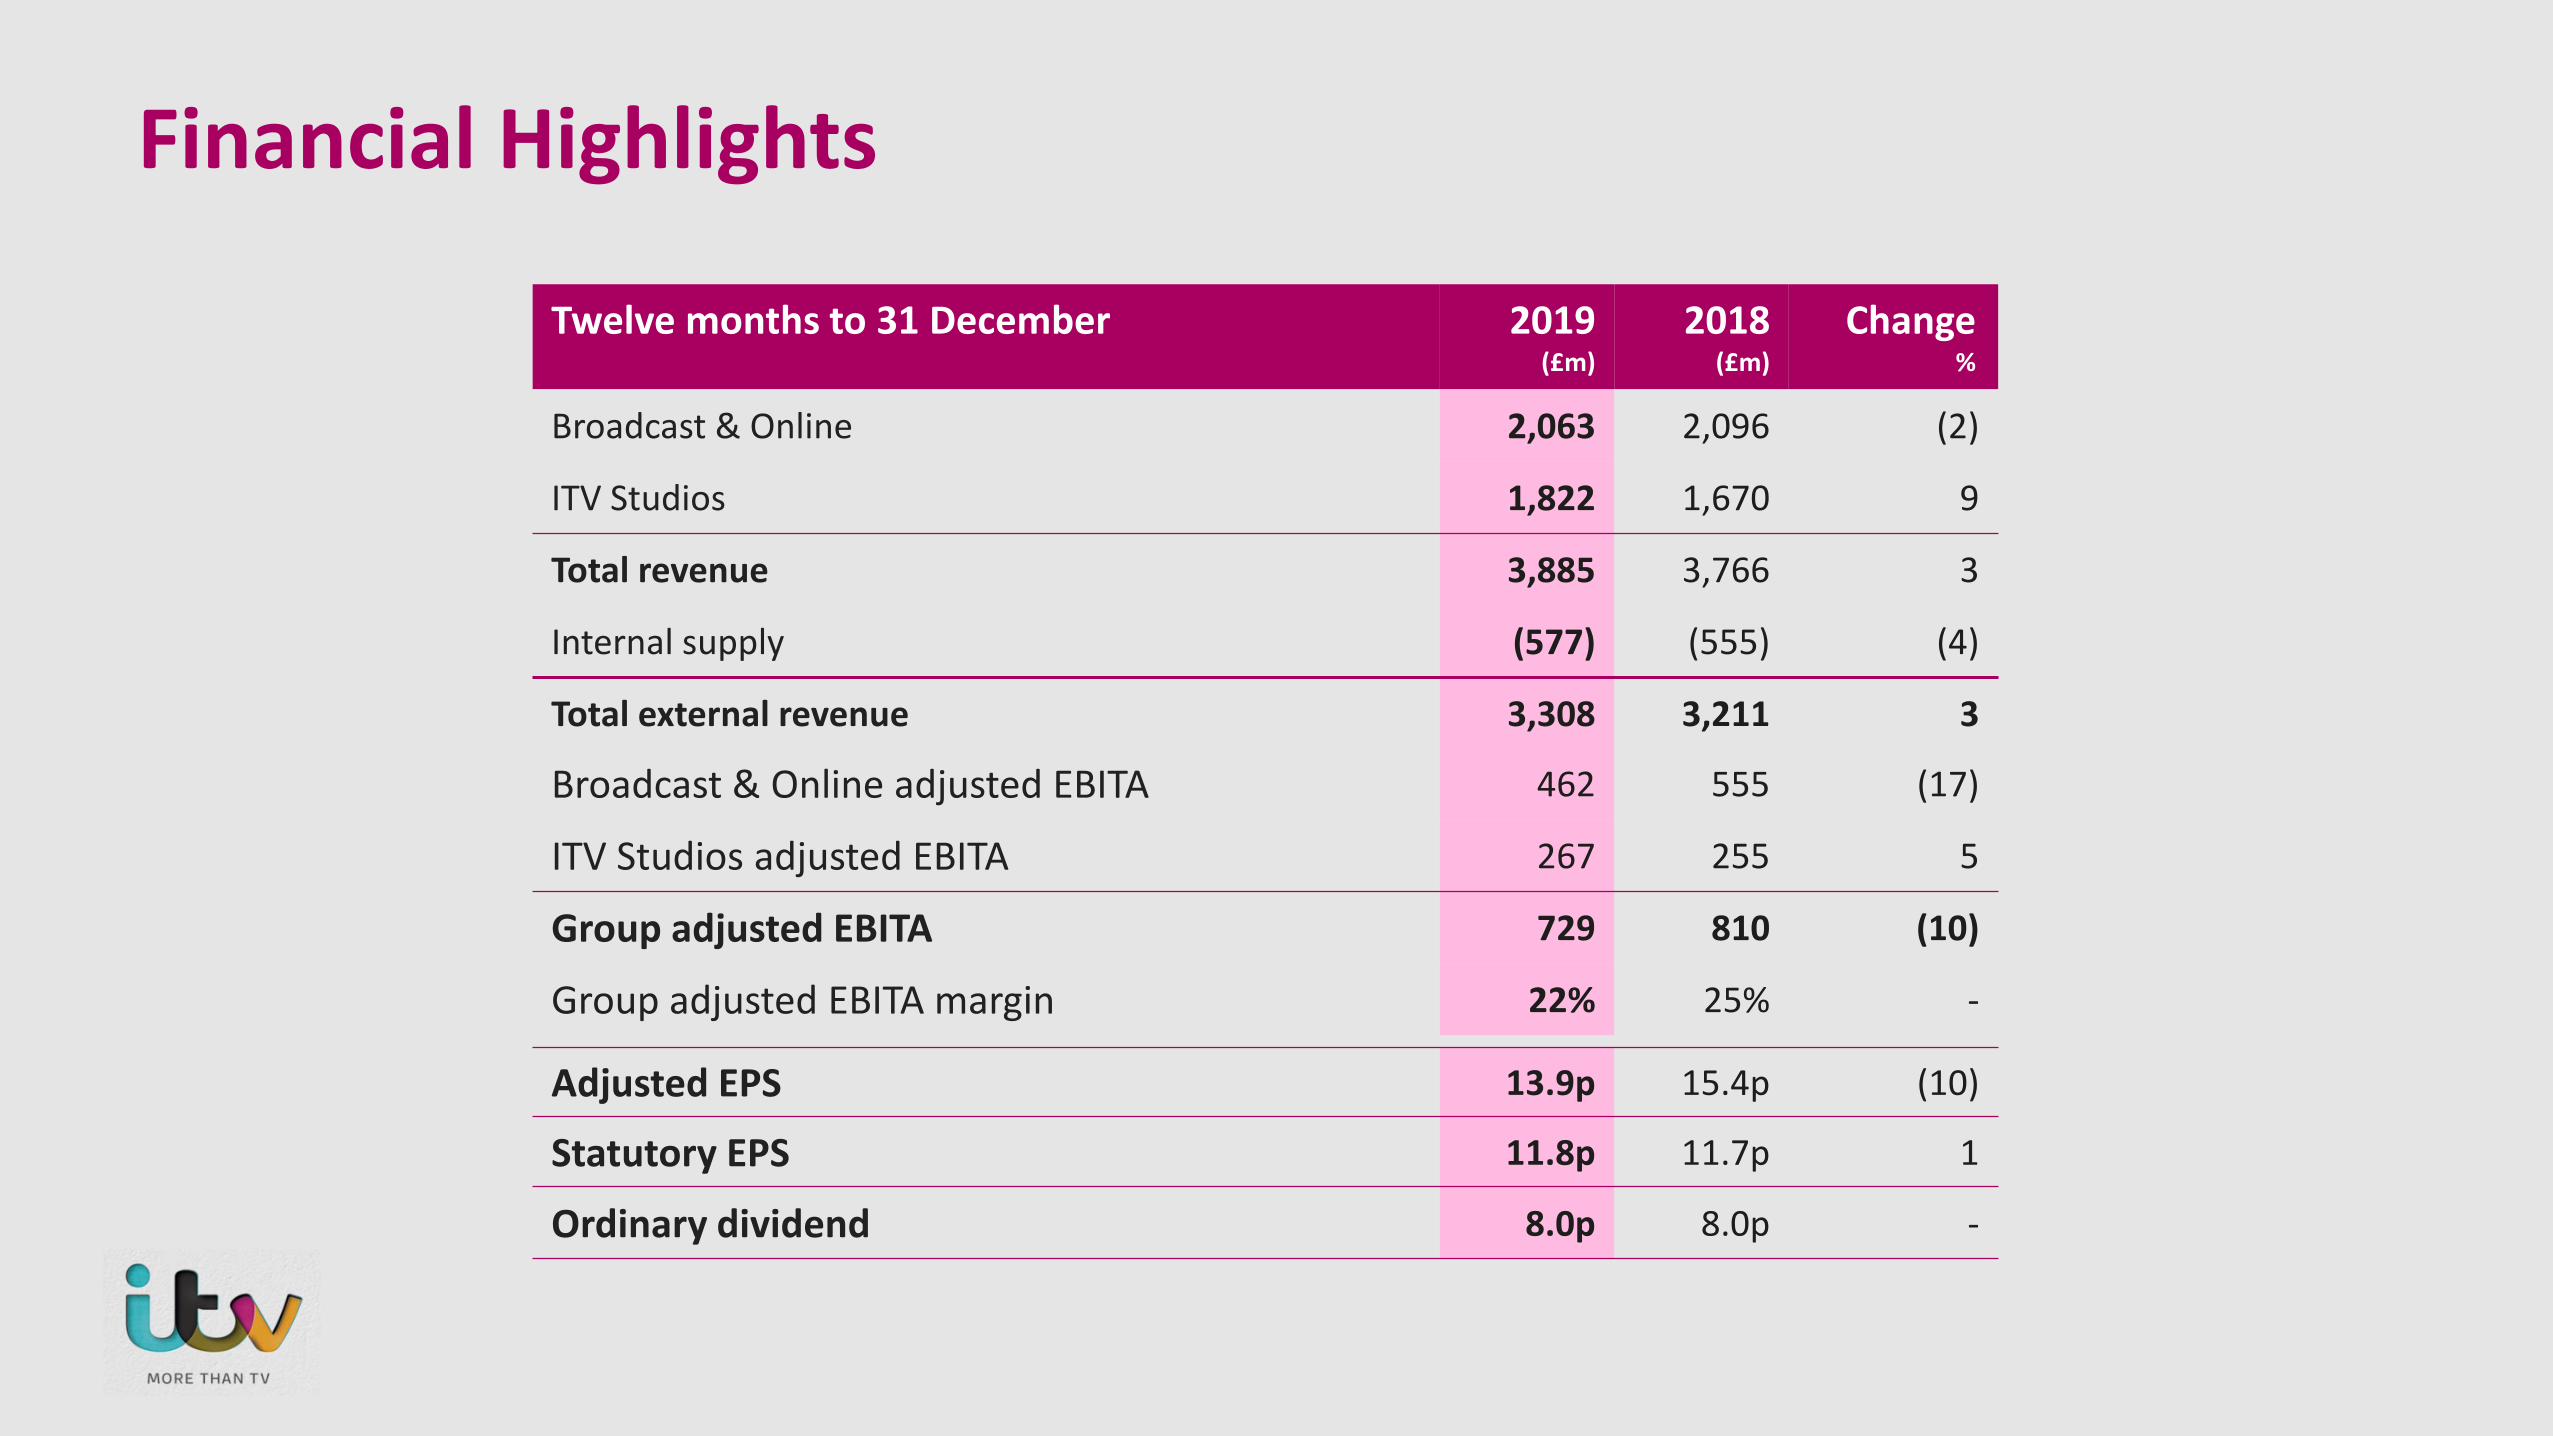
Twelve months to 31 December 2019 (£m)
2018 (£m)
Change%
Broadcast & Online 2,063 2,096 (2)
ITV Studios 1,822 1,670 9
Total revenue 3,885 3,766 3
Internal supply (577) (555) (4)
Total external revenue 3,308 3,211 3
Financial Highlights
Broadcast & Online adjusted EBITA 462 555 (17)
ITV Studios adjusted EBITA 267 255 5
Group adjusted EBITA 729 810 (10)
Group adjusted EBITA margin 22% 25% -
Adjusted EPS 13.9p 15.4p (10)
Statutory EPS 11.8p 11.7p 1
Ordinary dividend 8.0p 8.0p -
39
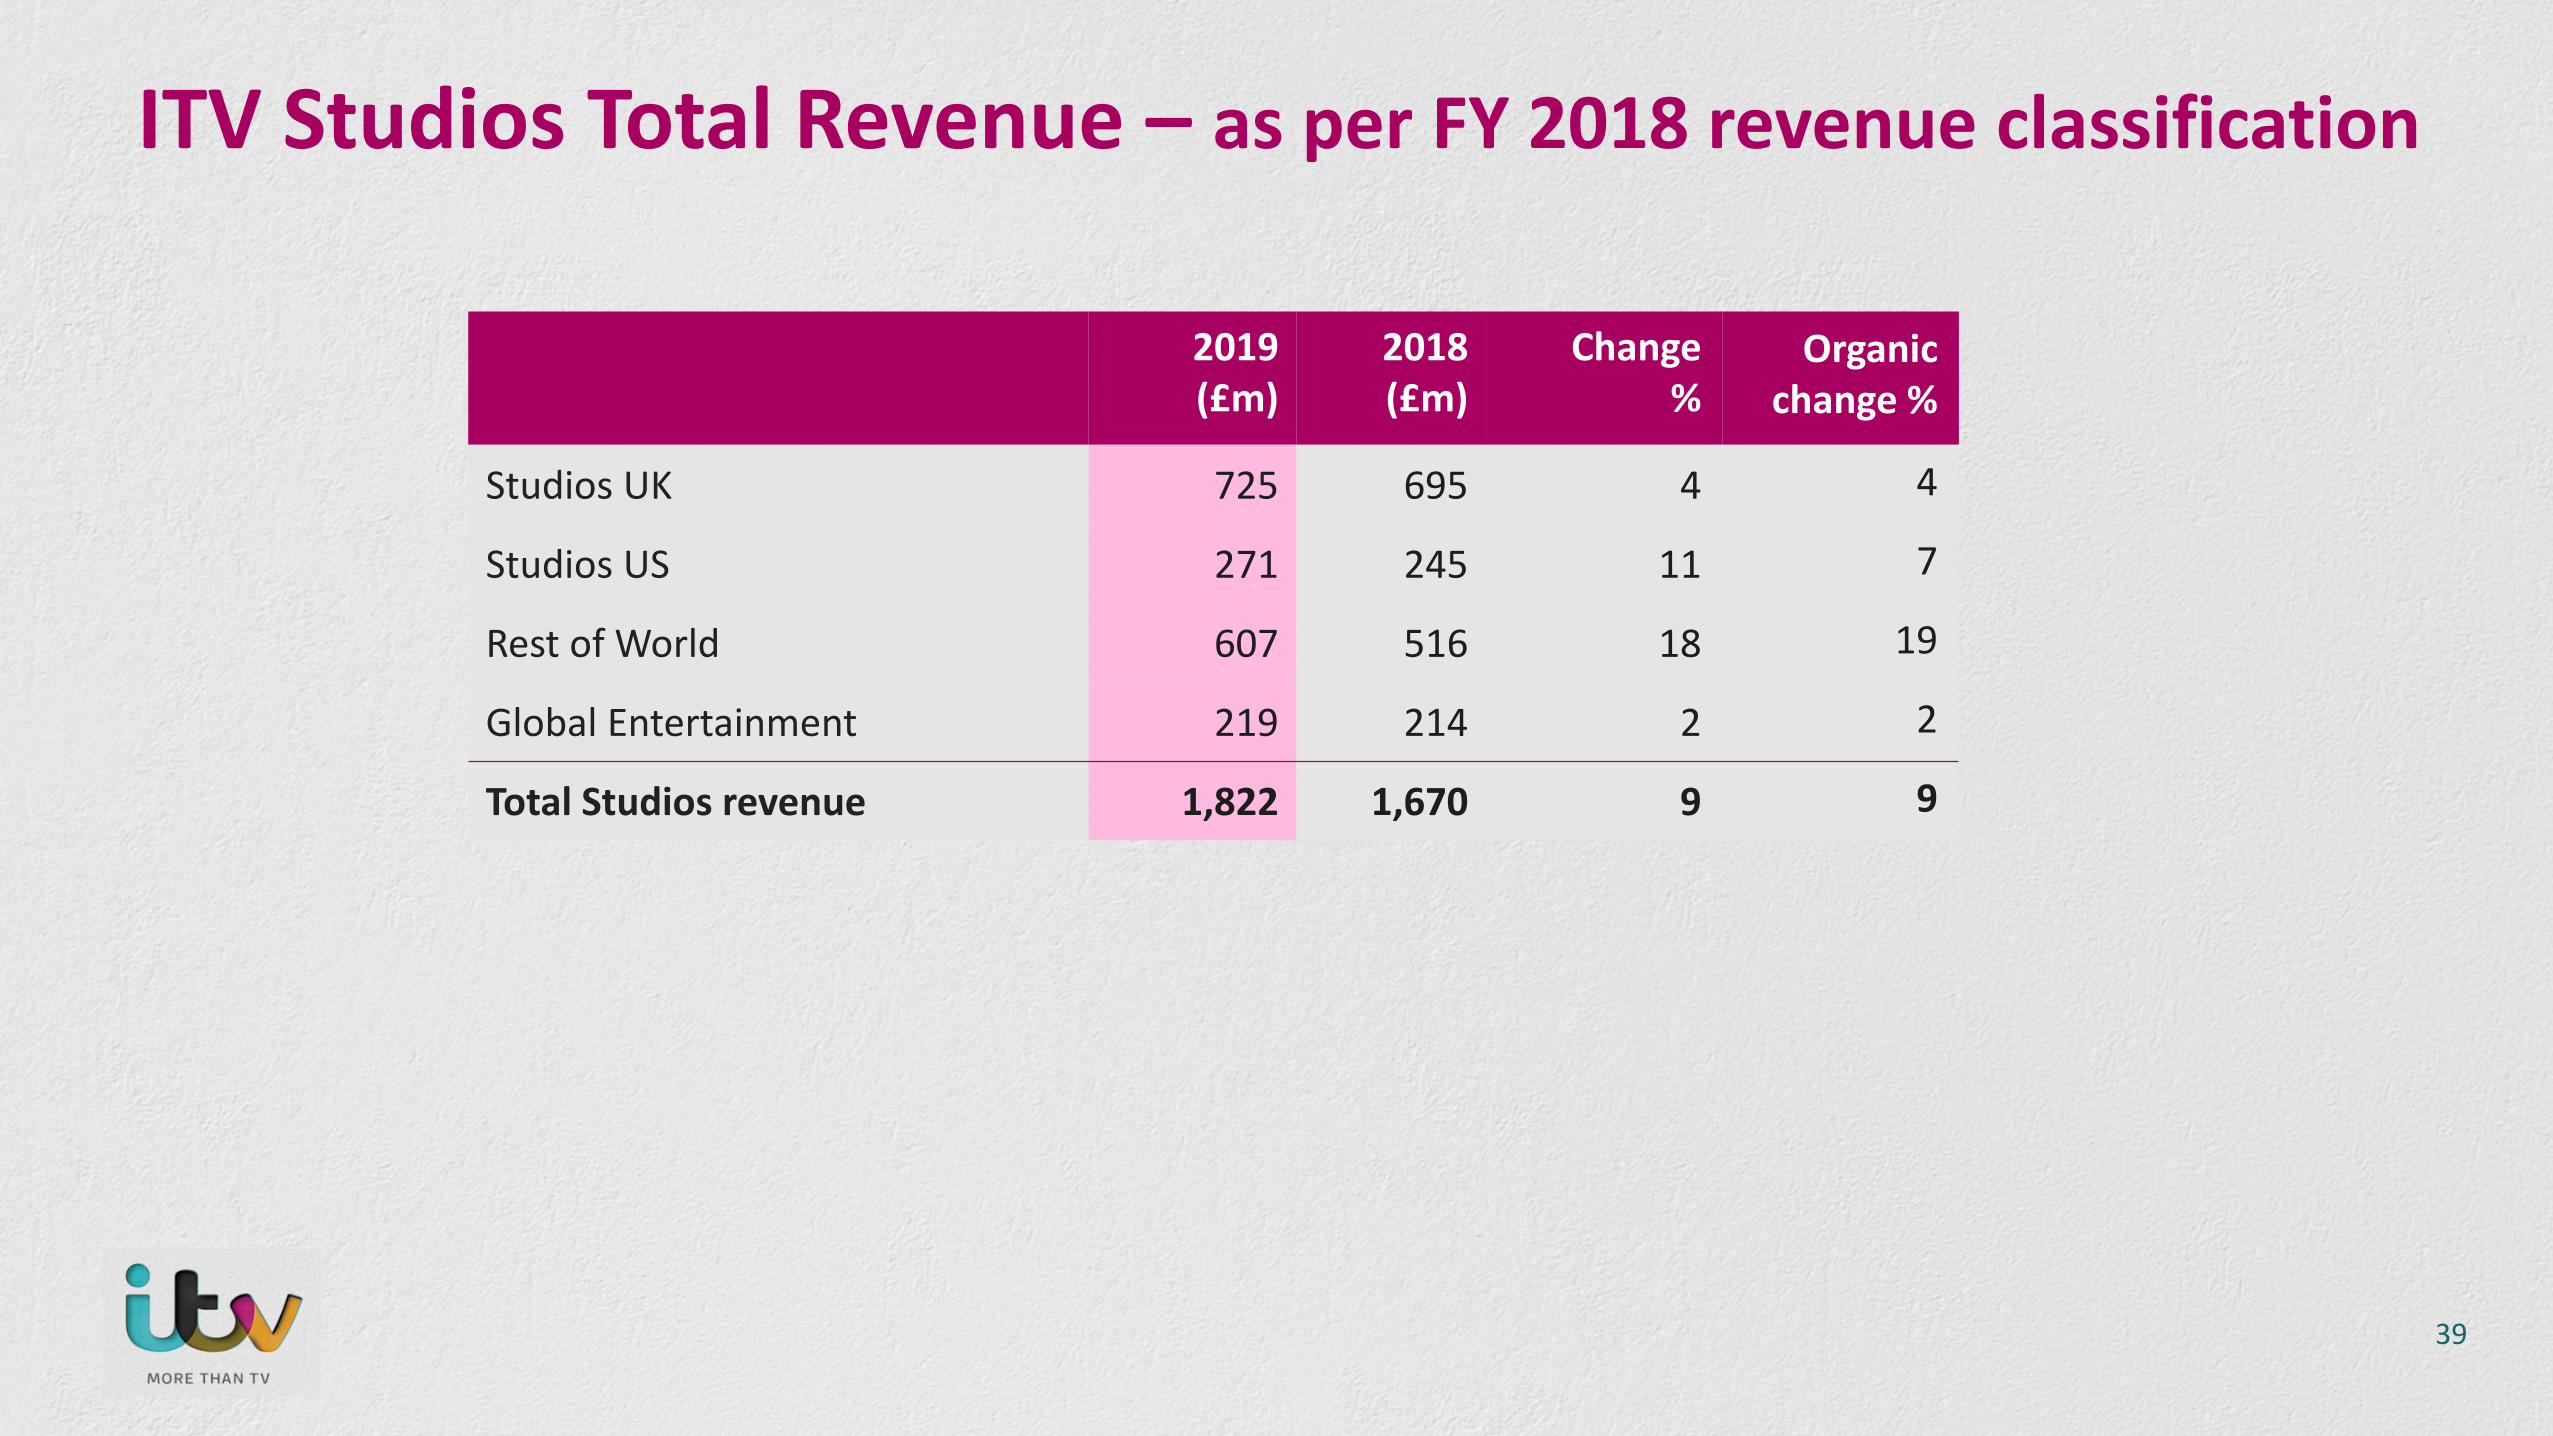
ITV Studios Total Revenue – as per FY 2018 revenue classification
2019 (£m)
2018 (£m)
Change%
Organic change %
Studios UK 725 695 4 4
Studios US 271 245 11 7
Rest of World 607 516 18 19
Global Entertainment 219 214 2 2
Total Studios revenue 1,822 1,670 9 9

Broadcast Schedule Costs
Twelve months to 31 December 2019(£m)
2018(£m)
Change%
Commissions 576 556 4
Sport 135 118 14
Acquired 37 43 (14)
ITN News and Weather 49 48 2
Total ITV main channel 797 765 4
Regional news and non-news 72 72 -
ITV Breakfast 45 46 (2)
Total ITV inc regional & Breakfast 914 883 4
ITV2, ITV3, ITV4, ITV Encore, ITVBe, CITV 177 172 3
Total schedule costs 1,091 1,055 3
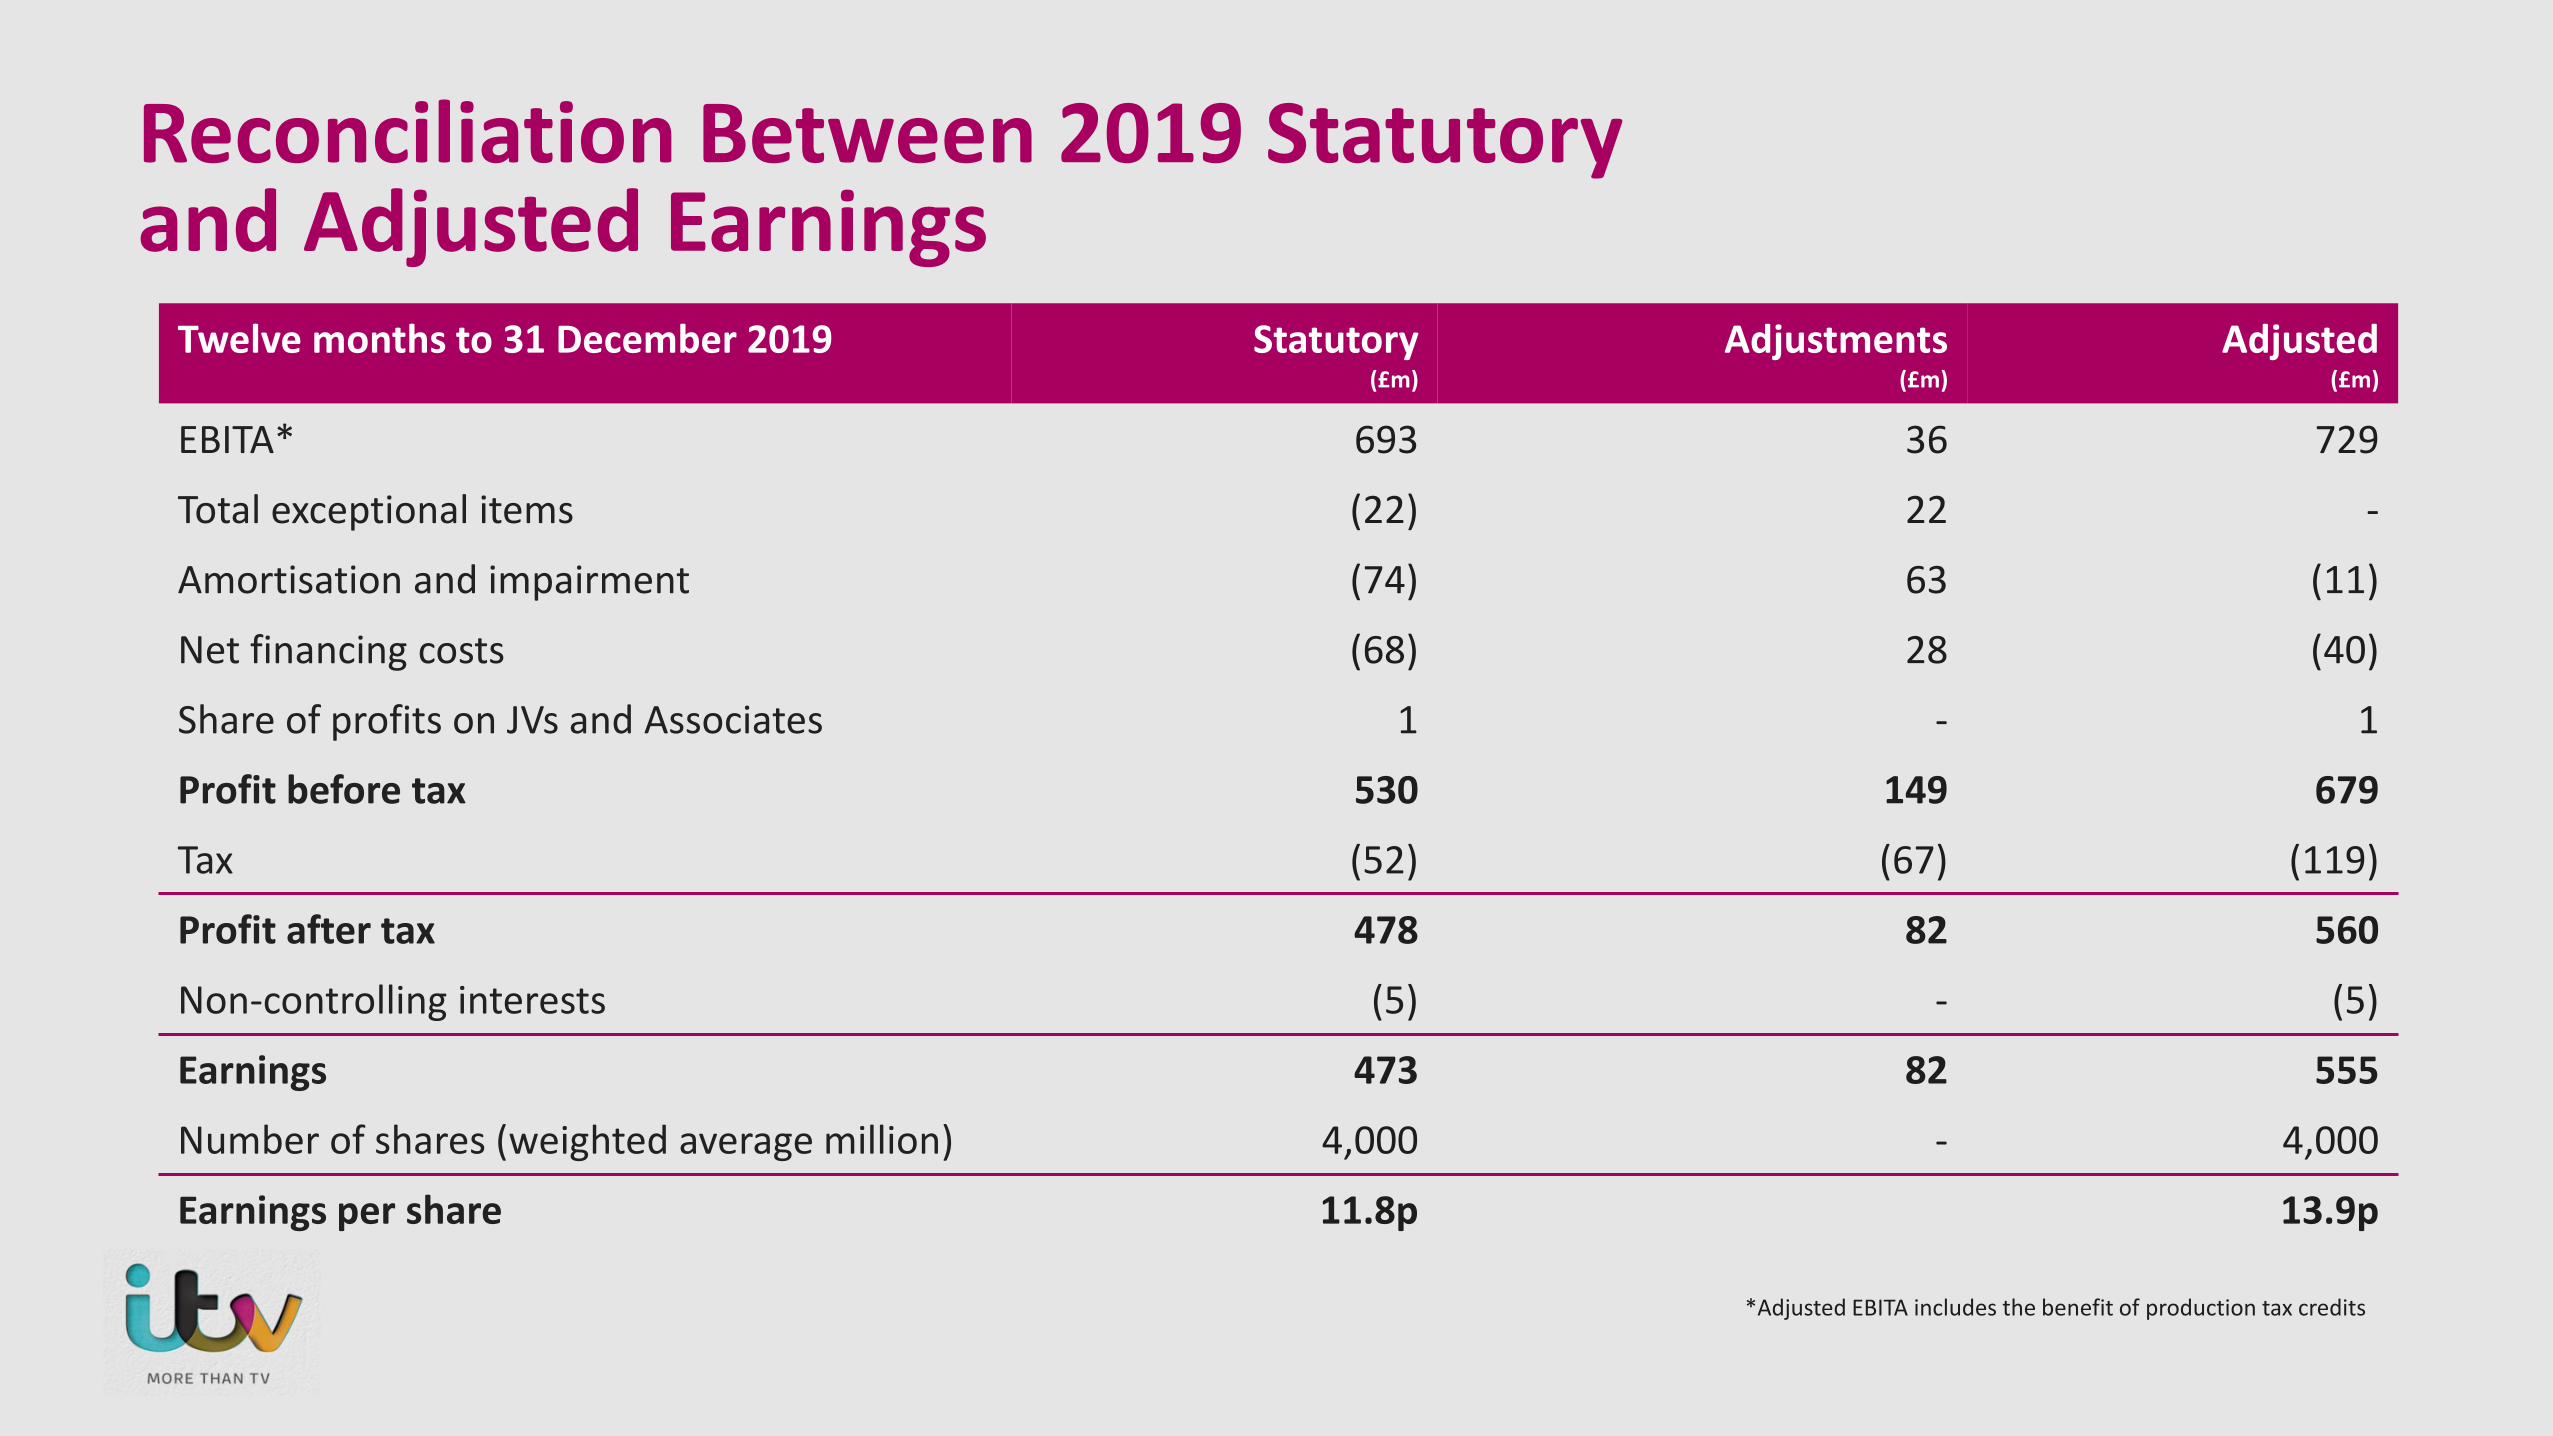
Reconciliation Between 2019 Statutory and Adjusted Earnings
*Adjusted EBITA includes the benefit of production tax credits
Twelve months to 31 December 2019 Statutory(£m)
Adjustments(£m)
Adjusted(£m)
EBITA* 693 36 729
Total exceptional items (22) 22 -
Amortisation and impairment (74) 63 (11)
Net financing costs (68) 28 (40)
Share of profits on JVs and Associates 1 - 1
Profit before tax 530 149 679
Tax (52) (67) (119)
Profit after tax 478 82 560
Non-controlling interests (5) - (5)
Earnings 473 82 555
Number of shares (weighted average million) 4,000 - 4,000
Earnings per share 11.8p 13.9p

Acquisitions – between 2012 and 2019
Company Initial consideration
(£m)
Additional consideration
paid (£m)
Expected future
payments*(£m)
Total expected consideration**
(£m)
Expected payment dates
Total for acquisitions between 2012-2019
972 191 230 1,393 2020-2025
* Undiscounted and adjusted for foreign exchange. All future payments are performance related.** Undiscounted and adjusted for foreign exchange, including the initial cash consideration and excluding working capital
adjustments. Total maximum consideration which was potentially payable at the time of acquisition was £2.4 billion.

Financing CostsTwelve months to 31 December 2019
(£m)2018
(£m)
€335m Eurobond at 2.125% coupon Sept 22 (10) (11)
€259m Eurobond at 2% coupon Dec 23 (13) (15)
€600m Eurobond at 1.375% coupon Sept 26* (4) -
£630m Revolving Credit Facility (4) (4)
Financing costs directly attributable to bonds and loans (31) (30)
Cash-related net financing costs (8) (5)
Amortisation of bonds (1) (1)
Adjusted financing costs (40) (36)
Imputed pension interest (1) (2)
Other net financial losses and unrealised foreign exchange (27) (5)
Net financing costs (68) (43)
* effective coupon of c2.9%
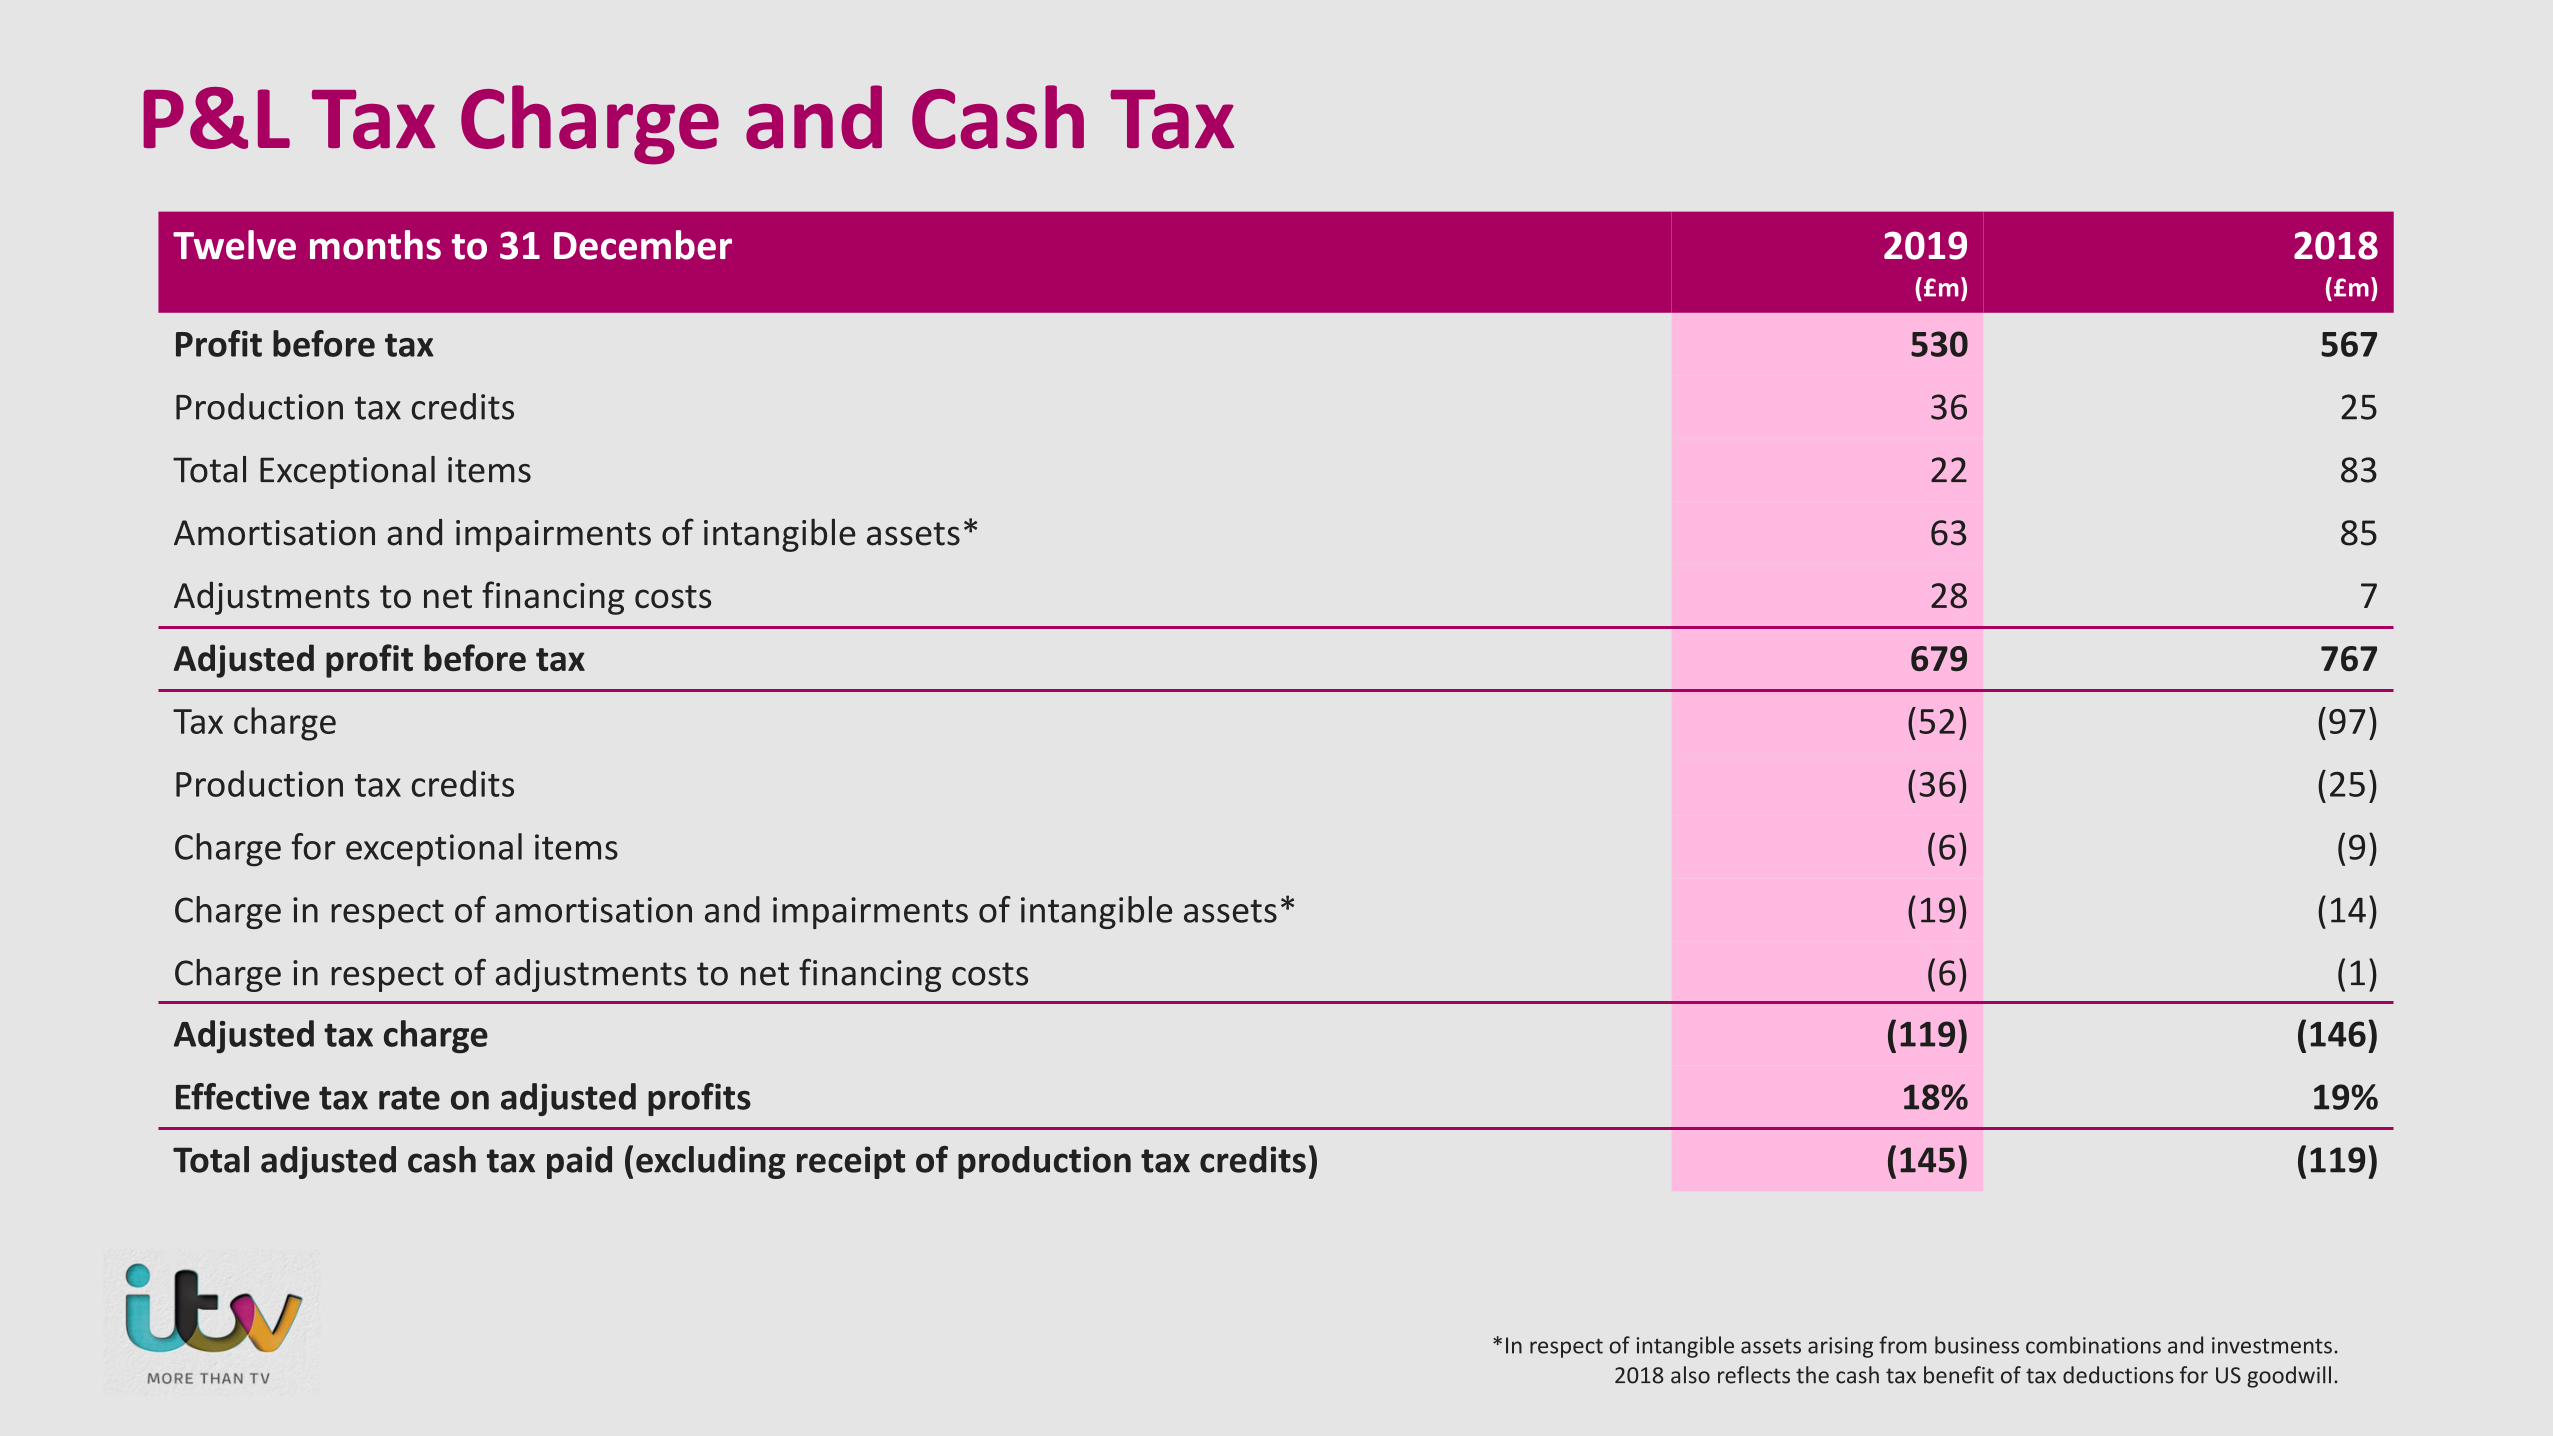
P&L Tax Charge and Cash TaxTwelve months to 31 December 2019
(£m)2018
(£m)
Profit before tax 530 567
Production tax credits 36 25
Total Exceptional items 22 83
Amortisation and impairments of intangible assets* 63 85
Adjustments to net financing costs 28 7
Adjusted profit before tax 679 767
Tax charge (52) (97)
Production tax credits (36) (25)
Charge for exceptional items (6) (9)
Charge in respect of amortisation and impairments of intangible assets* (19) (14)
Charge in respect of adjustments to net financing costs (6) (1)
Adjusted tax charge (119) (146)
Effective tax rate on adjusted profits 18% 19%
Total adjusted cash tax paid (excluding receipt of production tax credits) (145) (119)
*In respect of intangible assets arising from business combinations and investments. 2018 also reflects the cash tax benefit of tax deductions for US goodwill.

Analysis of Net Debt
31 December 2019(£m)
2018(£m)
£630m Revolving Credit Facility - (50)
€335m (previously €600m) Eurobond (283) (536)
€259m (previously €500m) Eurobond (219) (424)
€600m Eurobond** (532) -
Other debt (16) (12)
Cash and cash equivalents 246 95
Net debt (804) (927)
30 June 2019(£m)
2018(£m)
Cash and cash equivalents* 246 95
Debt** (1,050) (1,022)
Net debt (804) (927)
* Gross cash includes £50 million of restricted cash in relation to the LTVC Pension Funding Partnership and £25 million of restricted money market funds.** Net of £24m cross currency swap.

Profit to Cash Conversion and Free Cash Flow2019 Full Year 2019
(£m)2018(£m)
Adjusted EBITA 729 810Working capital movement (63) (93)High end production tax credits 1 2Share-based compensation and pension service cost 10 10Acquisition of property, plant and equipment, and intangible assets (68) (82)Capex relating to redevelopment of new London HQ 2 37Depreciation 56 28Lease liability payments (35) -Adjusted cash flow 632 712Profit to cash ratio 87% 88%
2019 Full Year 2019(£m)
2018(£m)
Adjusted cash flow 632 712
Net cash interest paid (54) (42)
Adjusted cash tax paid (145) (119)
Pension funding (74) (82)
Free cash flow 359 469

Borrowing Facilities
Type of Facility Facility Amount£m
Amount drawn at 31/12/2019
£m
Maturity
Revolving Credit Facility (RCF) 630 - Various
Bilateral financing facility 300 - June 2021
Total 930 -

Adjusted Results
Twelve months to 31 December 2019(£m)
2018(£m)
Change(%)
Adjusted EBITA* 729 810 (10)
Internally generated amortisation (11) (7) (57)Financing costs (40) (36) (11)Share of profits on JVs and associates 1 - -Profit before tax 679 767 (11)Tax (119) (146) 18Profit after tax 560 621 (10)Non-controlling interests (5) (4) (25)Earnings 555 617 (10)
EPS (p) 13.9p 15.4p (10)
Diluted EPS (p) 13.8p 15.4p (10)
*Adjusted EBITA includes the benefit of production tax credits
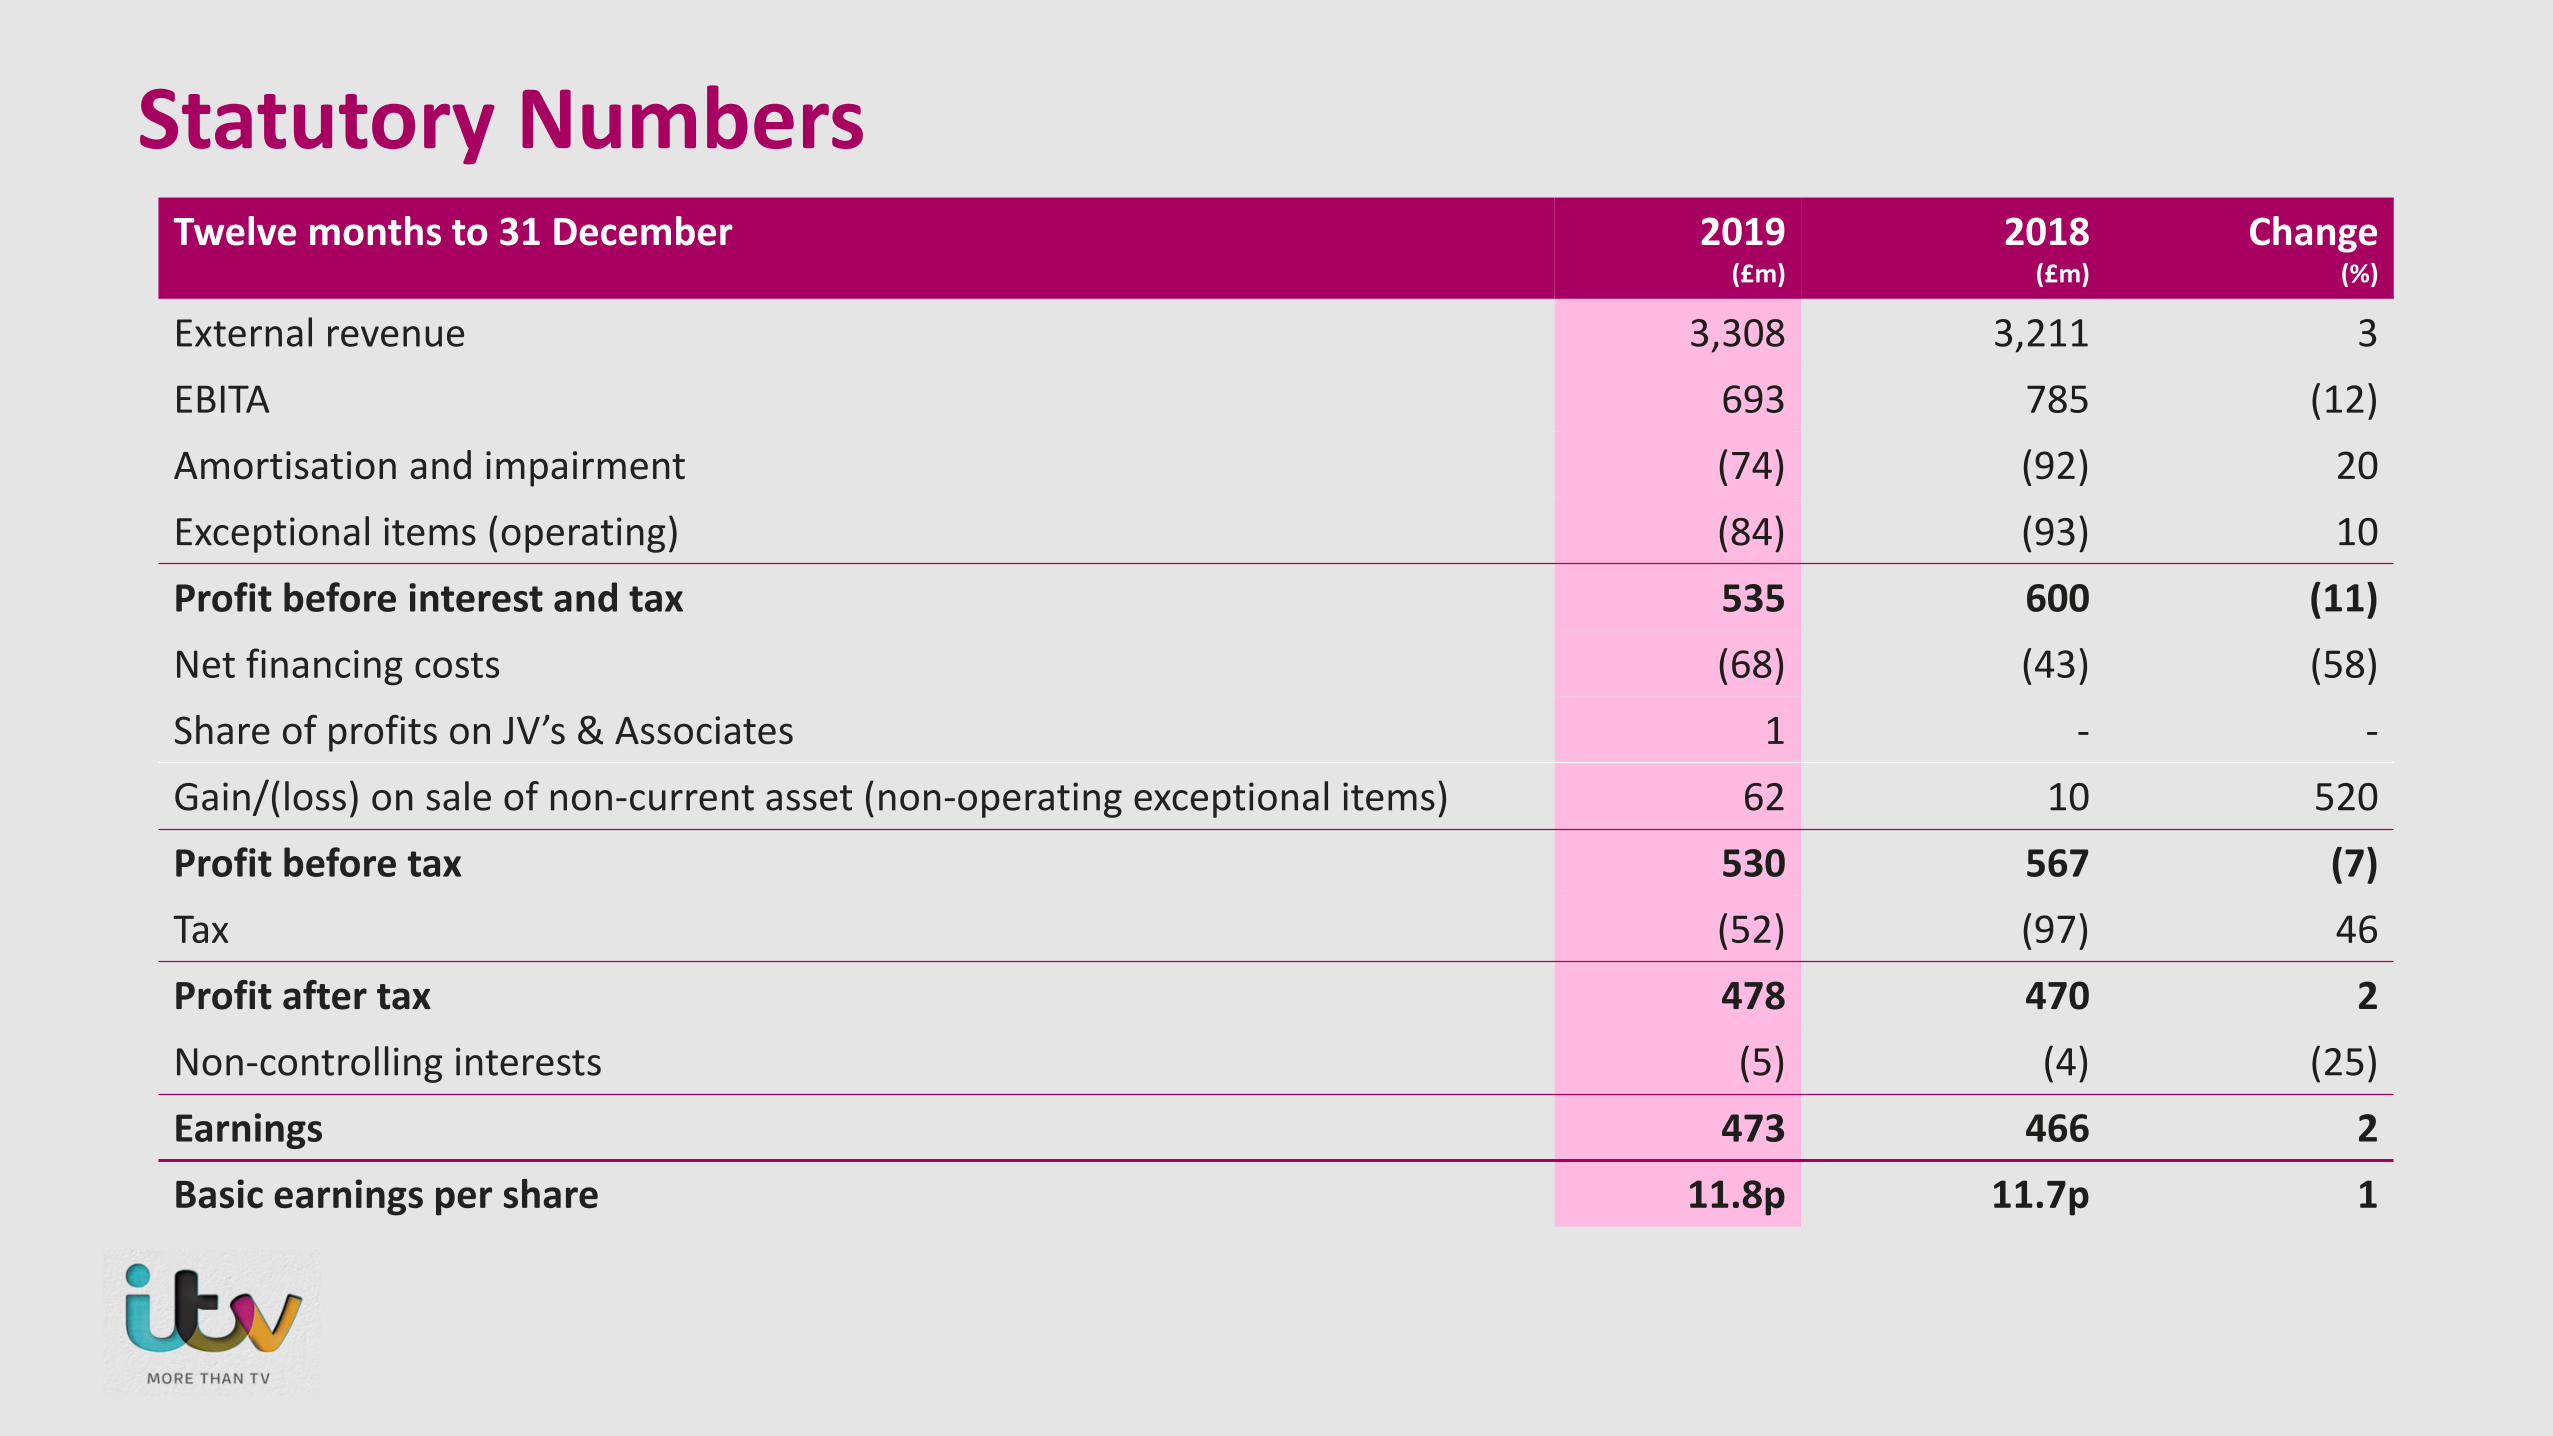
Statutory NumbersTwelve months to 31 December 2019
(£m)2018
(£m)Change
(%)
External revenue 3,308 3,211 3EBITA 693 785 (12)Amortisation and impairment (74) (92) 20Exceptional items (operating) (84) (93) 10Profit before interest and tax 535 600 (11)Net financing costs (68) (43) (58)Share of profits on JV’s & Associates 1 - -Gain/(loss) on sale of non-current asset (non-operating exceptional items) 62 10 520Profit before tax 530 567 (7)Tax (52) (97) 46Profit after tax 478 470 2Non-controlling interests (5) (4) (25)Earnings 473 466 2Basic earnings per share 11.8p 11.7p 1