accelerating india's clean energy transition · pdf fileindia is accelerating development...
TRANSCRIPT
Accelerating India's Clean Energy Transition The future of rooftop PV and other distributed
energy markets in India
November 28, 2017
1 November 28, 2017
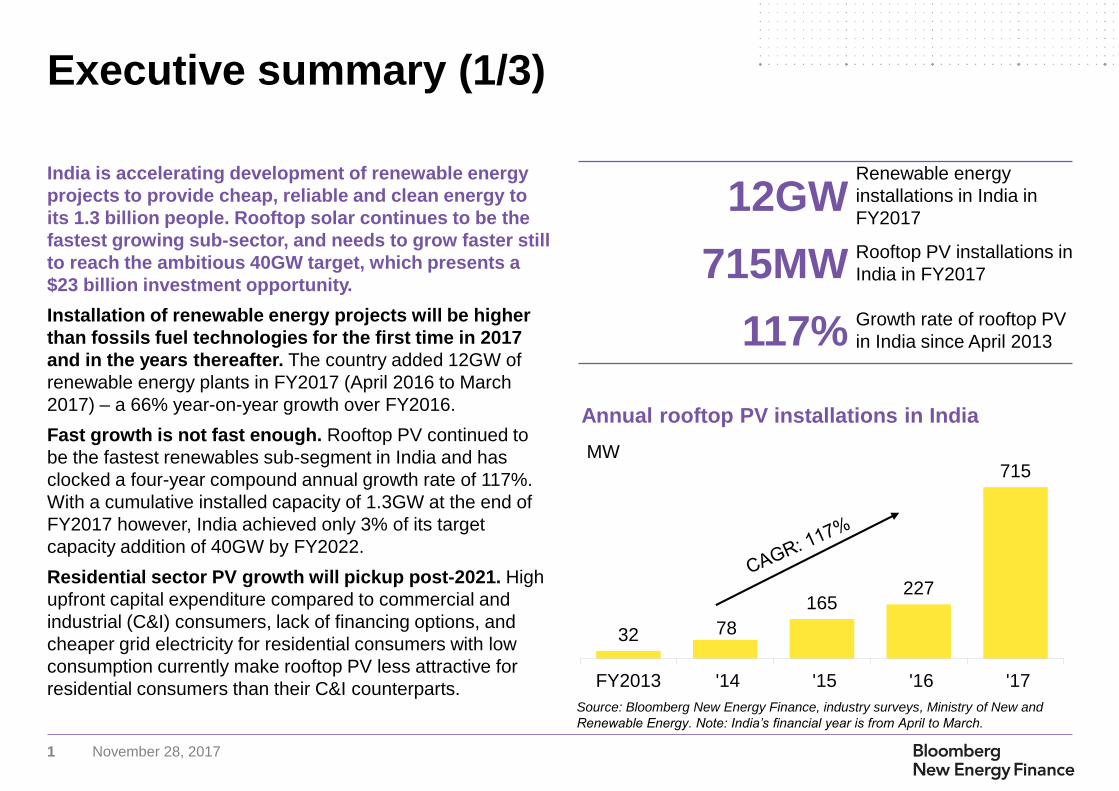
India is accelerating development of renewable energy
projects to provide cheap, reliable and clean energy to
its 1.3 billion people. Rooftop solar continues to be the
fastest growing sub-sector, and needs to grow faster still
to reach the ambitious 40GW target, which presents a
$23 billion investment opportunity.
Installation of renewable energy projects will be higher
than fossils fuel technologies for the first time in 2017
and in the years thereafter. The country added 12GW of
renewable energy plants in FY2017 (April 2016 to March
2017) – a 66% year-on-year growth over FY2016.
Fast growth is not fast enough. Rooftop PV continued to
be the fastest renewables sub-segment in India and has
clocked a four-year compound annual growth rate of 117%.
With a cumulative installed capacity of 1.3GW at the end of
FY2017 however, India achieved only 3% of its target
capacity addition of 40GW by FY2022.
Residential sector PV growth will pickup post-2021. High
upfront capital expenditure compared to commercial and
industrial (C&I) consumers, lack of financing options, and
cheaper grid electricity for residential consumers with low
consumption currently make rooftop PV less attractive for
residential consumers than their C&I counterparts.
Source: Bloomberg New Energy Finance, industry surveys, Ministry of New and
Renewable Energy. Note: India’s financial year is from April to March.
Executive summary (1/3)
Annual rooftop PV installations in India
12GW Renewable energy
installations in India in
FY2017
715MW Rooftop PV installations in
India in FY2017
117% Growth rate of rooftop PV
in India since April 2013
32 78
165227
715
FY2013 '14 '15 '16 '17
MW
2 November 28, 2017
Executive summary (2/3)
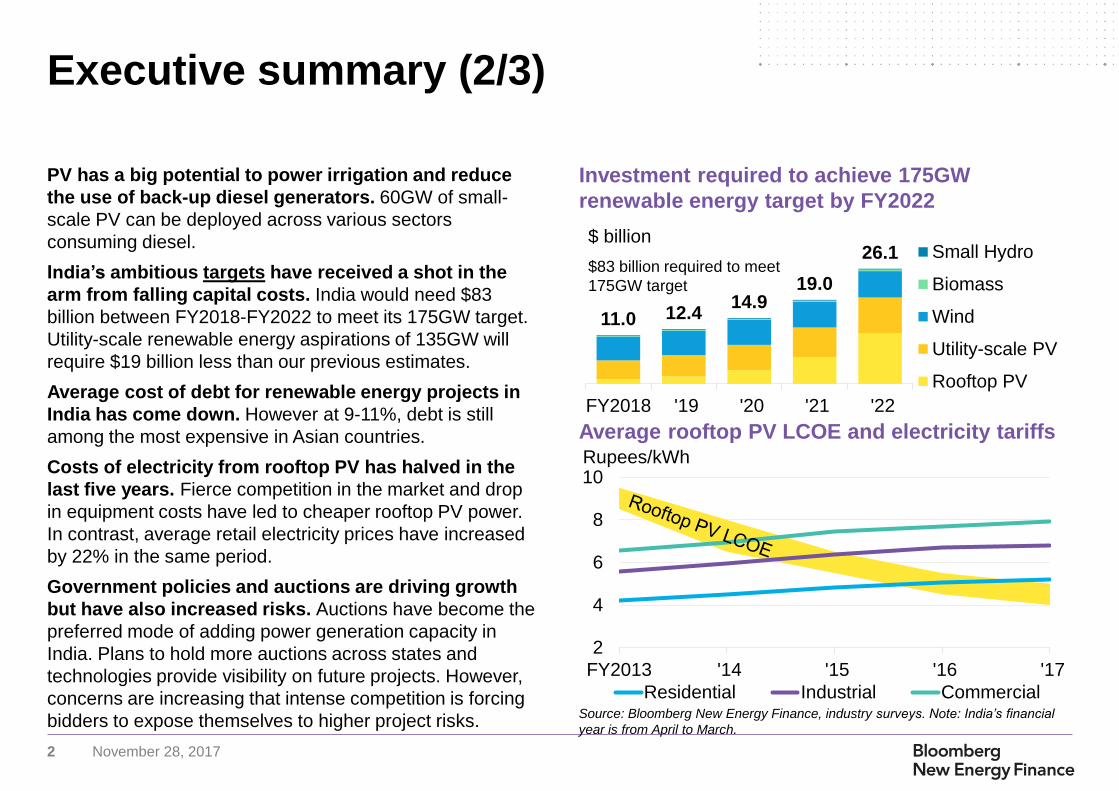
Average rooftop PV LCOE and electricity tariffs
Source: Bloomberg New Energy Finance, industry surveys. Note: India’s financial
year is from April to March.
Investment required to achieve 175GW
renewable energy target by FY2022
2
4
6
8
10
FY2013 '14 '15 '16 '17
Rupees/kWh
Residential Industrial Commercial
PV has a big potential to power irrigation and reduce
the use of back-up diesel generators. 60GW of small-
scale PV can be deployed across various sectors
consuming diesel.
India’s ambitious targets have received a shot in the
arm from falling capital costs. India would need $83
billion between FY2018-FY2022 to meet its 175GW target.
Utility-scale renewable energy aspirations of 135GW will
require $19 billion less than our previous estimates.
Average cost of debt for renewable energy projects in
India has come down. However at 9-11%, debt is still
among the most expensive in Asian countries.
Costs of electricity from rooftop PV has halved in the
last five years. Fierce competition in the market and drop
in equipment costs have led to cheaper rooftop PV power.
In contrast, average retail electricity prices have increased
by 22% in the same period.
Government policies and auctions are driving growth
but have also increased risks. Auctions have become the
preferred mode of adding power generation capacity in
India. Plans to hold more auctions across states and
technologies provide visibility on future projects. However,
concerns are increasing that intense competition is forcing
bidders to expose themselves to higher project risks.
11.0 12.414.9
19.0
26.1
FY2018 '19 '20 '21 '22
Small Hydro
Biomass
Wind
Utility-scale PV
Rooftop PV
$83 billion required to meet
175GW target
$ billion
3 November 28, 2017
Executive summary (3/3)
Rooftop PV is showing signs of a maturing market in
the corporate segment. C&I customers now set-up larger
capacity rooftop PV assets and are also open to signing
long-term power purchase agreements indicating growing
confidence in this technology. The economics of PV work
for C&I customers even without net metering. Net metering
is a far more important enabler for residential consumers as
they usually draw less power during the day when their PV
panels are producing electricity.
Three out of four rooftop PV projects are built under the
capex model where customers pay for the system
upfront. Renewable energy service company (RESCO)
projects, which require the consumer to pay a monthly fee,
could not increase their market share due to financing
challenges. Some corporates and government institutions
that are trying to avoid performance risk and high upfront
cost are driving the RESCO market.
Off-grid companies have not been able to match the
rapid growth of utility-scale renewables and rooftop
solar systems. These companies are innovating on
business and financial product offerings to increase sales
and enhance consumer engagement. Micro grid operators
are connecting more productive loads to their grids while
solar home system (SHS) companies are offering financing
solutions to their customers, that has increased the
appetite for SHS over solar lanterns.
While the quality and reliability of electric supply by
power distribution companies (discoms) in rural areas
continues to remain poor, even a partial achievement of
the government’s promise to provide 100% electrification
and 24x7 power will curb investor appetite for off-grid
solutions due to the risk of becoming stranded.
Growth of rooftop solar in India looks inevitable with or
without the support of distribution utilities. This
presents an opportunity for the discoms to diversify and
start their own rooftop solar business rather than lose
customers to other competitors.
Discoms can also partner with rooftop PV companies to
provide operations and maintenance (O&M) services,
billing, lead generation, branding and sales support. Utilities
can provide critical insights about customer load patterns
and payment history that can help RESCO developers in
system sizing and off-taker credibility assessment.
This report is a follow-up to Financing India’s Renewable
Energy Transition published in November 2016. Bloomberg
New Energy Finance was supported by The David and
Lucile Packard Foundation. The content and conclusions
are those of Bloomberg New Energy Finance alone, based
on our own independent analysis.
4 November 28, 2017
Contents
Rooftop PV gathers pace while utility-scale renewables maintain growth
Auctions, economics and competition are driving the renewables market 13
Corporates, households and solar-diesel hybrids are still untapped markets 18
India’s clean energy boom is slow to reach rural areas 24
Sustaining the small solar boom 29
Appendices 35
5
5 November 28, 2017
Rooftop PV gathers pace
while utility-scale
renewables maintain
growth
The market today
6 November 28, 2017
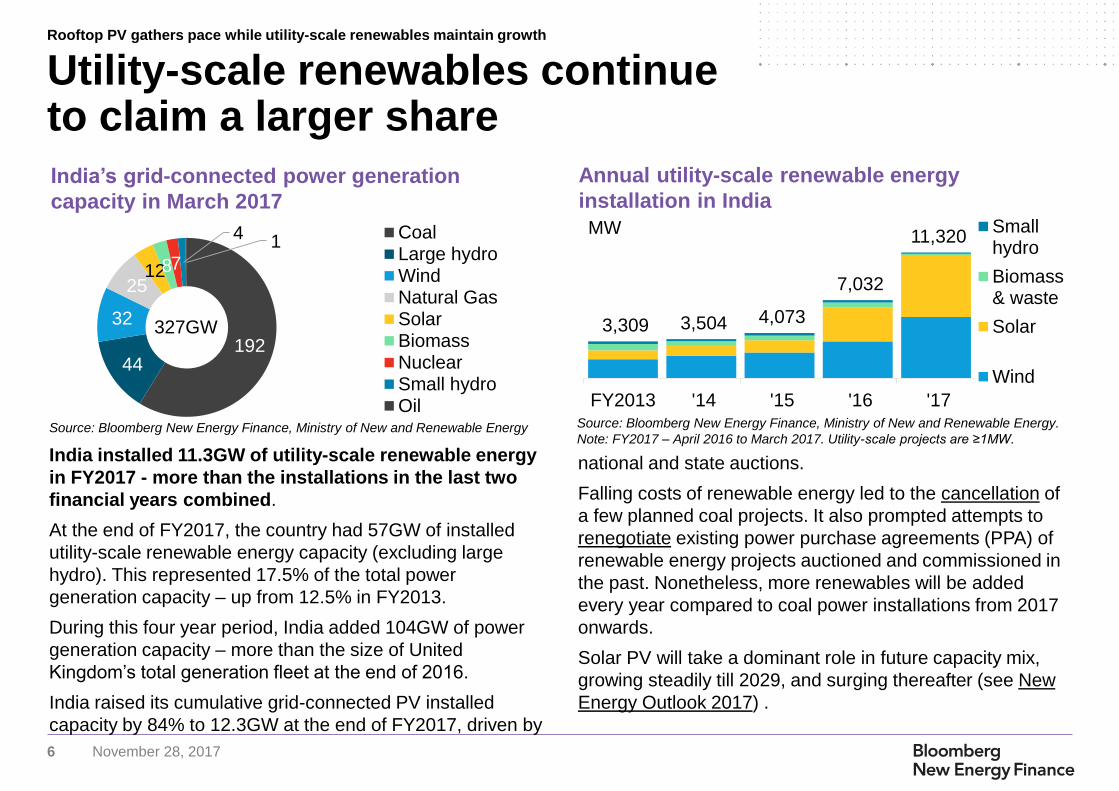
India installed 11.3GW of utility-scale renewable energy
in FY2017 - more than the installations in the last two
financial years combined.
At the end of FY2017, the country had 57GW of installed
utility-scale renewable energy capacity (excluding large
hydro). This represented 17.5% of the total power
generation capacity – up from 12.5% in FY2013.
During this four year period, India added 104GW of power
generation capacity – more than the size of United
Kingdom’s total generation fleet at the end of 2016.
India raised its cumulative grid-connected PV installed
capacity by 84% to 12.3GW at the end of FY2017, driven by
Utility-scale renewables continue to claim a larger share
Source: Bloomberg New Energy Finance, Ministry of New and Renewable Energy
India’s grid-connected power generation
capacity in March 2017
Annual utility-scale renewable energy
installation in India
Source: Bloomberg New Energy Finance, Ministry of New and Renewable Energy.
Note: FY2017 – April 2016 to March 2017. Utility-scale projects are ≥1MW.
national and state auctions.
Falling costs of renewable energy led to the cancellation of
a few planned coal projects. It also prompted attempts to
renegotiate existing power purchase agreements (PPA) of
renewable energy projects auctioned and commissioned in
the past. Nonetheless, more renewables will be added
every year compared to coal power installations from 2017
onwards.
Solar PV will take a dominant role in future capacity mix,
growing steadily till 2029, and surging thereafter (see New
Energy Outlook 2017) .
19244
32
251287
4 1CoalLarge hydroWindNatural GasSolarBiomassNuclearSmall hydroOil
327GW
Rooftop PV gathers pace while utility-scale renewables maintain growth
3,309 3,504 4,073
7,032
11,320
FY2013 '14 '15 '16 '17
Smallhydro
Biomass& waste
Solar
Wind
MW
7 November 28, 2017
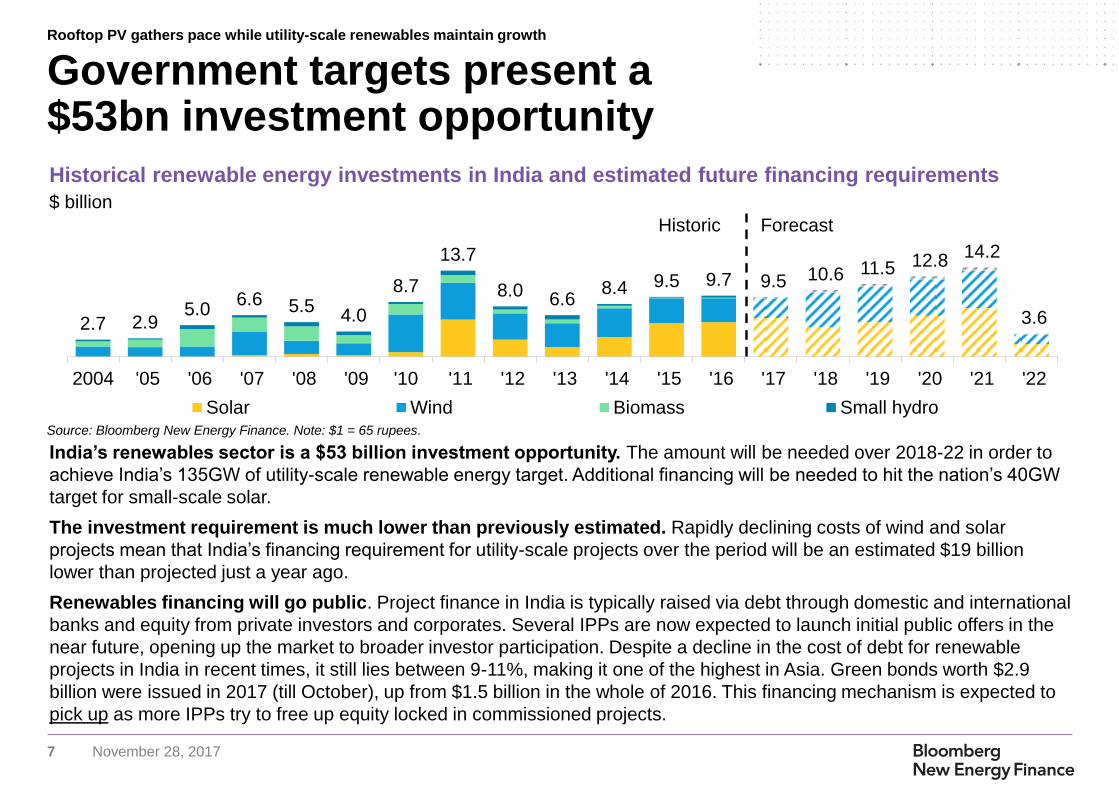
Government targets present a $53bn investment opportunity
Historical renewable energy investments in India and estimated future financing requirements
Source: Bloomberg New Energy Finance. Note: $1 = 65 rupees.
India’s renewables sector is a $53 billion investment opportunity. The amount will be needed over 2018-22 in order to
achieve India’s 135GW of utility-scale renewable energy target. Additional financing will be needed to hit the nation’s 40GW
target for small-scale solar.
The investment requirement is much lower than previously estimated. Rapidly declining costs of wind and solar
projects mean that India’s financing requirement for utility-scale projects over the period will be an estimated $19 billion
lower than projected just a year ago.
Renewables financing will go public. Project finance in India is typically raised via debt through domestic and international
banks and equity from private investors and corporates. Several IPPs are now expected to launch initial public offers in the
near future, opening up the market to broader investor participation. Despite a decline in the cost of debt for renewable
projects in India in recent times, it still lies between 9-11%, making it one of the highest in Asia. Green bonds worth $2.9
billion were issued in 2017 (till October), up from $1.5 billion in the whole of 2016. This financing mechanism is expected to
pick up as more IPPs try to free up equity locked in commissioned projects.
Rooftop PV gathers pace while utility-scale renewables maintain growth
2.7 2.95.0
6.6 5.54.0
8.7
13.7
8.06.6
8.4 9.5 9.7 9.5 10.6 11.5 12.8 14.2
3.6
2004 '05 '06 '07 '08 '09 '10 '11 '12 '13 '14 '15 '16 '17 '18 '19 '20 '21 '22
Solar Wind Biomass Small hydro
$ billion
Historic Forecast
8 November 28, 2017
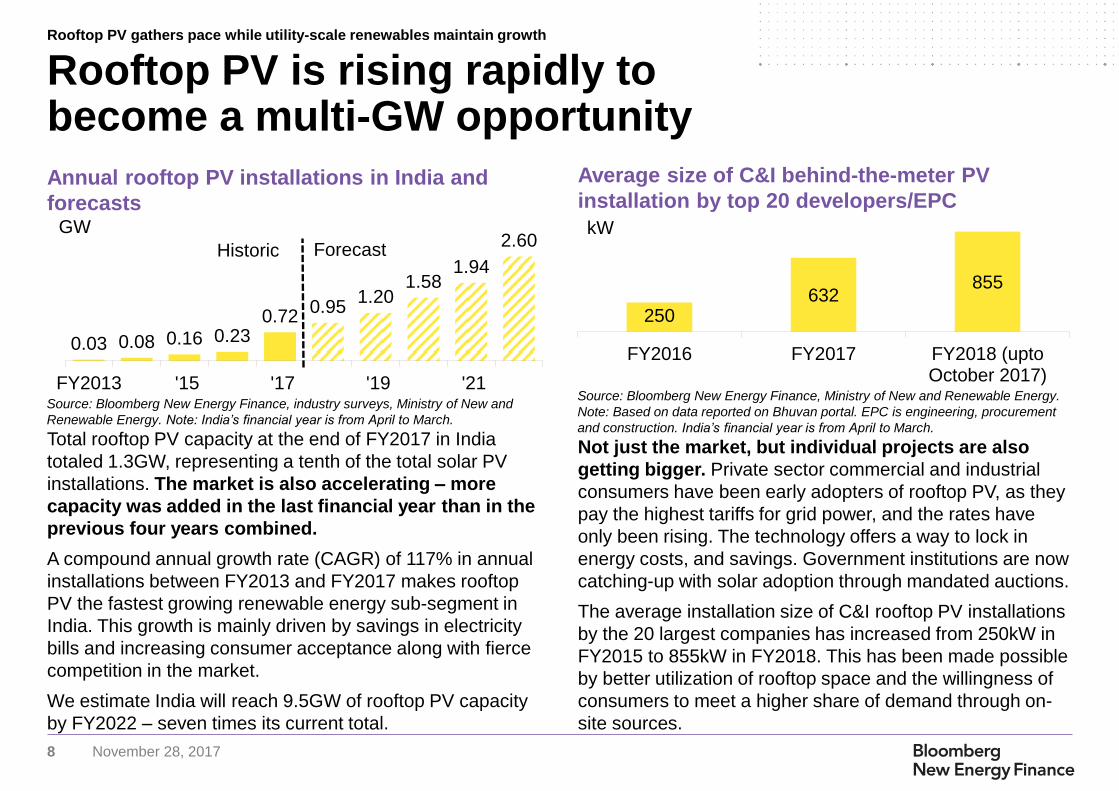
Not just the market, but individual projects are also
getting bigger. Private sector commercial and industrial
consumers have been early adopters of rooftop PV, as they
pay the highest tariffs for grid power, and the rates have
only been rising. The technology offers a way to lock in
energy costs, and savings. Government institutions are now
catching-up with solar adoption through mandated auctions.
The average installation size of C&I rooftop PV installations
by the 20 largest companies has increased from 250kW in
FY2015 to 855kW in FY2018. This has been made possible
by better utilization of rooftop space and the willingness of
consumers to meet a higher share of demand through on-
site sources.
Total rooftop PV capacity at the end of FY2017 in India
totaled 1.3GW, representing a tenth of the total solar PV
installations. The market is also accelerating – more
capacity was added in the last financial year than in the
previous four years combined.
A compound annual growth rate (CAGR) of 117% in annual
installations between FY2013 and FY2017 makes rooftop
PV the fastest growing renewable energy sub-segment in
India. This growth is mainly driven by savings in electricity
bills and increasing consumer acceptance along with fierce
competition in the market.
We estimate India will reach 9.5GW of rooftop PV capacity
by FY2022 – seven times its current total.
Annual rooftop PV installations in India and
forecasts
Average size of C&I behind-the-meter PV
installation by top 20 developers/EPC
Rooftop PV is rising rapidly to become a multi-GW opportunity
Source: Bloomberg New Energy Finance, industry surveys, Ministry of New and
Renewable Energy. Note: India’s financial year is from April to March.
Source: Bloomberg New Energy Finance, Ministry of New and Renewable Energy.
Note: Based on data reported on Bhuvan portal. EPC is engineering, procurement
and construction. India’s financial year is from April to March.
Rooftop PV gathers pace while utility-scale renewables maintain growth
0.03 0.08 0.16 0.230.72
0.951.20
1.581.94
2.60
FY2013 '15 '17 '19 '21
Historic Forecast
GW
250632
855
FY2016 FY2017 FY2018 (uptoOctober 2017)
kW
9 November 28, 2017
Source: Bloomberg New Energy Finance, Ministry of New and Renewable Energy
Despite record growth, the rooftop PV targets are unachievable
Legend
< 100MW 100 - 500MW 501 - 1,000MW 1,001 - 2,500MW > 2,500MW
Maharashtra
4,700
Gujarat
3,200
Uttar
Pradesh
4,300
Tamil Nadu
3,500
Karnataka
2,300
Kerala
800
Andhra Pradesh
2,000
Lakshadweep
Islands
10 Andaman &
Nicobar Islands
20
Telangana
2,000 Goa
150
Madhya Pradesh
2,200
Rajasthan
2,300
Punjab
2,000
Haryana
1,600
Jammu &
Kashmir
450
Delhi
1,100
Himachal Pradesh
320
Uttarakhand
350
Odisha
1,000
Jharkhand
800
Chhattisgarh
700
Bihar
1,000
West Bengal
2,100
Sikkim
50
Arunachal
Pradesh
50
Nagaland
50
Assam
250
Manipur
50
Mizoram
50 Tripura
50
Meghalaya
50
Chandigarh
100
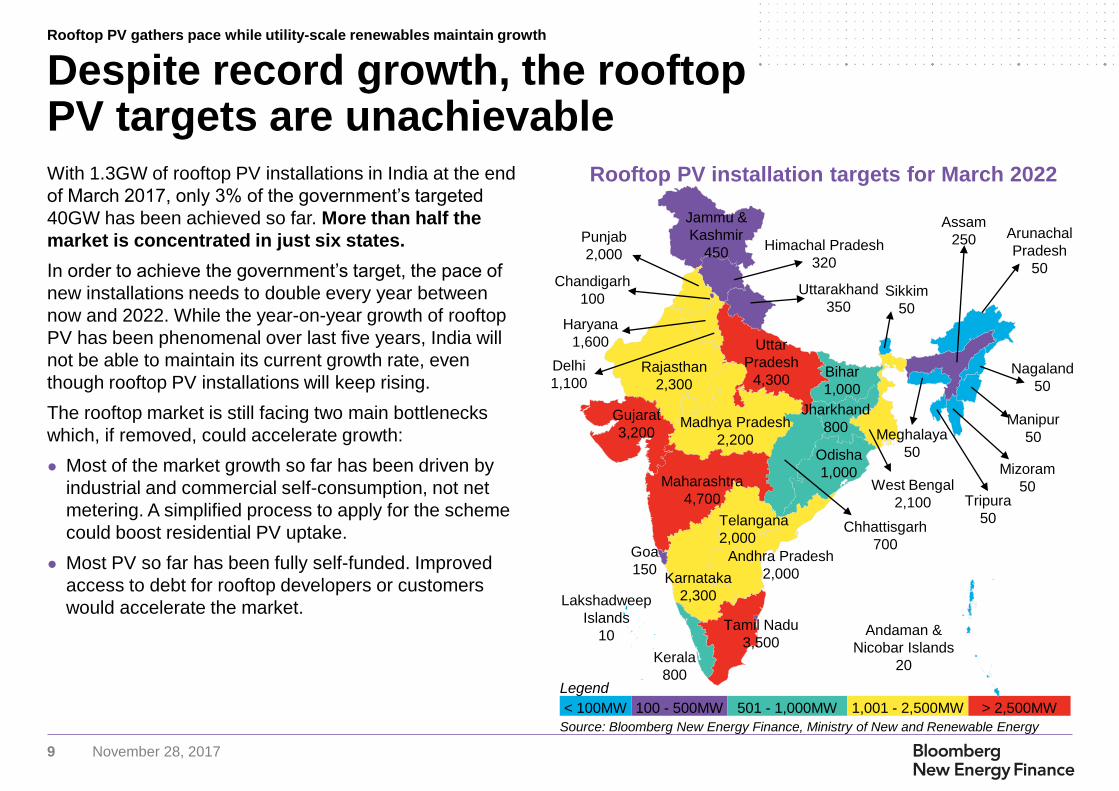
With 1.3GW of rooftop PV installations in India at the end
of March 2017, only 3% of the government’s targeted
40GW has been achieved so far. More than half the
market is concentrated in just six states.
In order to achieve the government’s target, the pace of
new installations needs to double every year between
now and 2022. While the year-on-year growth of rooftop
PV has been phenomenal over last five years, India will
not be able to maintain its current growth rate, even
though rooftop PV installations will keep rising.
The rooftop market is still facing two main bottlenecks
which, if removed, could accelerate growth:
● Most of the market growth so far has been driven by
industrial and commercial self-consumption, not net
metering. A simplified process to apply for the scheme
could boost residential PV uptake.
● Most PV so far has been fully self-funded. Improved
access to debt for rooftop developers or customers
would accelerate the market.
Rooftop PV installation targets for March 2022
Rooftop PV gathers pace while utility-scale renewables maintain growth
10 November 28, 2017
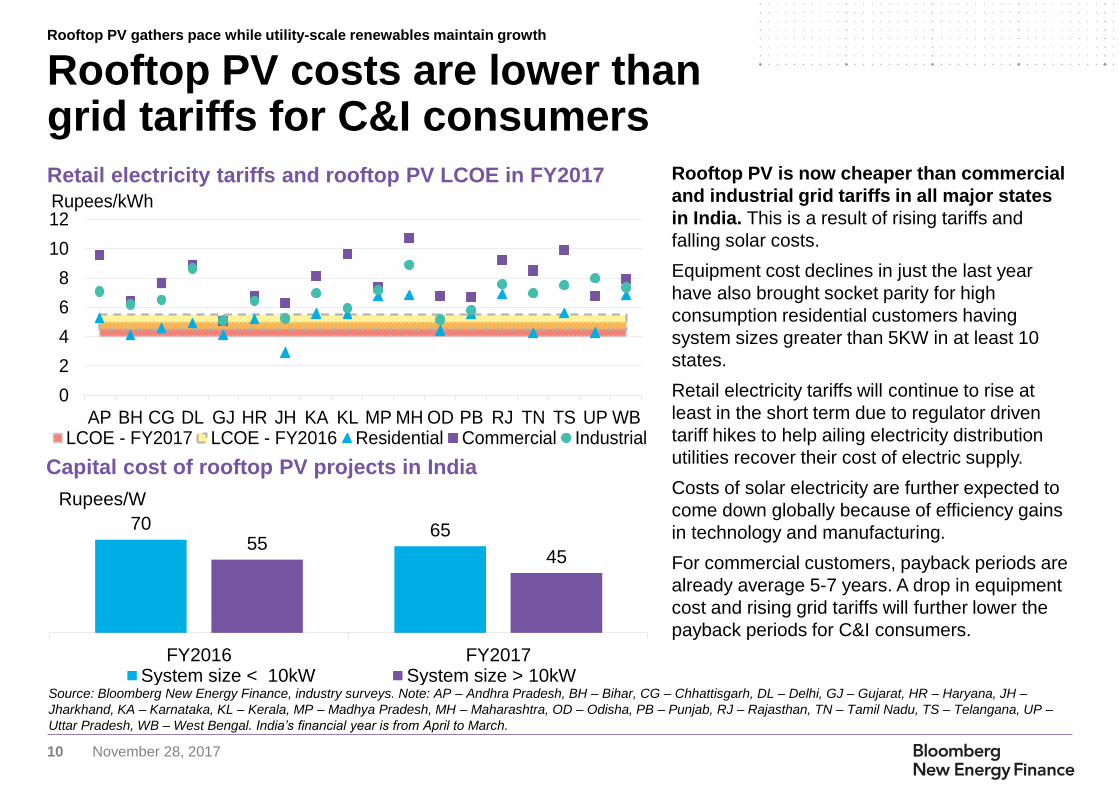
Retail electricity tariffs and rooftop PV LCOE in FY2017
Rooftop PV costs are lower than grid tariffs for C&I consumers
Rooftop PV is now cheaper than commercial
and industrial grid tariffs in all major states
in India. This is a result of rising tariffs and
falling solar costs.
Equipment cost declines in just the last year
have also brought socket parity for high
consumption residential customers having
system sizes greater than 5KW in at least 10
states.
Retail electricity tariffs will continue to rise at
least in the short term due to regulator driven
tariff hikes to help ailing electricity distribution
utilities recover their cost of electric supply.
Costs of solar electricity are further expected to
come down globally because of efficiency gains
in technology and manufacturing.
For commercial customers, payback periods are
already average 5-7 years. A drop in equipment
cost and rising grid tariffs will further lower the
payback periods for C&I consumers.
Capital cost of rooftop PV projects in India
Source: Bloomberg New Energy Finance, industry surveys. Note: AP – Andhra Pradesh, BH – Bihar, CG – Chhattisgarh, DL – Delhi, GJ – Gujarat, HR – Haryana, JH –
Jharkhand, KA – Karnataka, KL – Kerala, MP – Madhya Pradesh, MH – Maharashtra, OD – Odisha, PB – Punjab, RJ – Rajasthan, TN – Tamil Nadu, TS – Telangana, UP –
Uttar Pradesh, WB – West Bengal. India’s financial year is from April to March.
0
2
4
6
8
10
12
AP BH CG DL GJ HR JH KA KL MP MH OD PB RJ TN TS UP WB
Rupees/kWh
LCOE - FY2017 LCOE - FY2016 Residential Commercial Industrial
Rooftop PV gathers pace while utility-scale renewables maintain growth
70 6555
45
FY2016 FY2017System size < 10kW System size > 10kW
Rupees/W
11 November 28, 2017
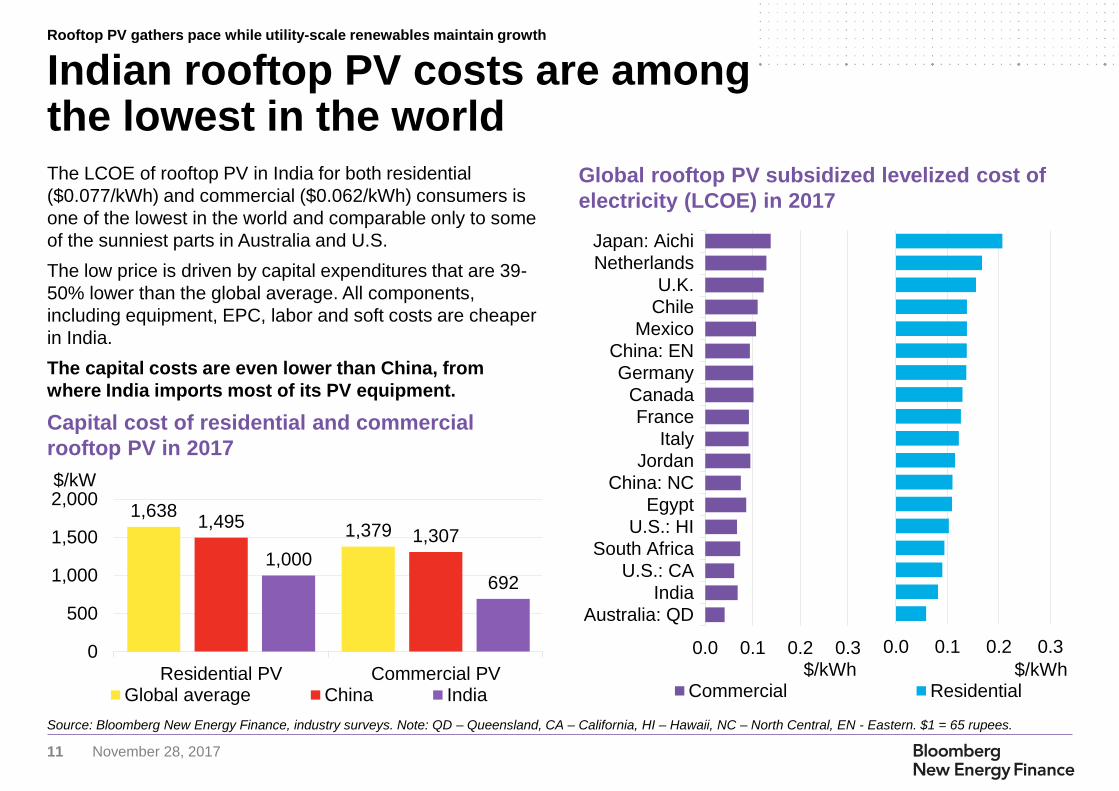
The LCOE of rooftop PV in India for both residential
($0.077/kWh) and commercial ($0.062/kWh) consumers is
one of the lowest in the world and comparable only to some
of the sunniest parts in Australia and U.S.
The low price is driven by capital expenditures that are 39-
50% lower than the global average. All components,
including equipment, EPC, labor and soft costs are cheaper
in India.
The capital costs are even lower than China, from
where India imports most of its PV equipment.
Capital cost of residential and commercial
rooftop PV in 2017
Indian rooftop PV costs are among the lowest in the world
Source: Bloomberg New Energy Finance, industry surveys. Note: QD – Queensland, CA – California, HI – Hawaii, NC – North Central, EN - Eastern. $1 = 65 rupees.
Global rooftop PV subsidized levelized cost of
electricity (LCOE) in 2017
0.0 0.1 0.2 0.3
Australia: QD
India
U.S.: CA
South Africa
U.S.: HI
Egypt
China: NC
Jordan
Italy
France
Canada
Germany
China: EN
Mexico
Chile
U.K.
Netherlands
Japan: Aichi
$/kWhCommercial
0.0 0.1 0.2 0.3
$/kWhResidential
1,6381,379
1,4951,307
1,000
692
0
500
1,000
1,500
2,000
Residential PV Commercial PV
$/kW
Global average China India
Rooftop PV gathers pace while utility-scale renewables maintain growth
12 November 28, 2017
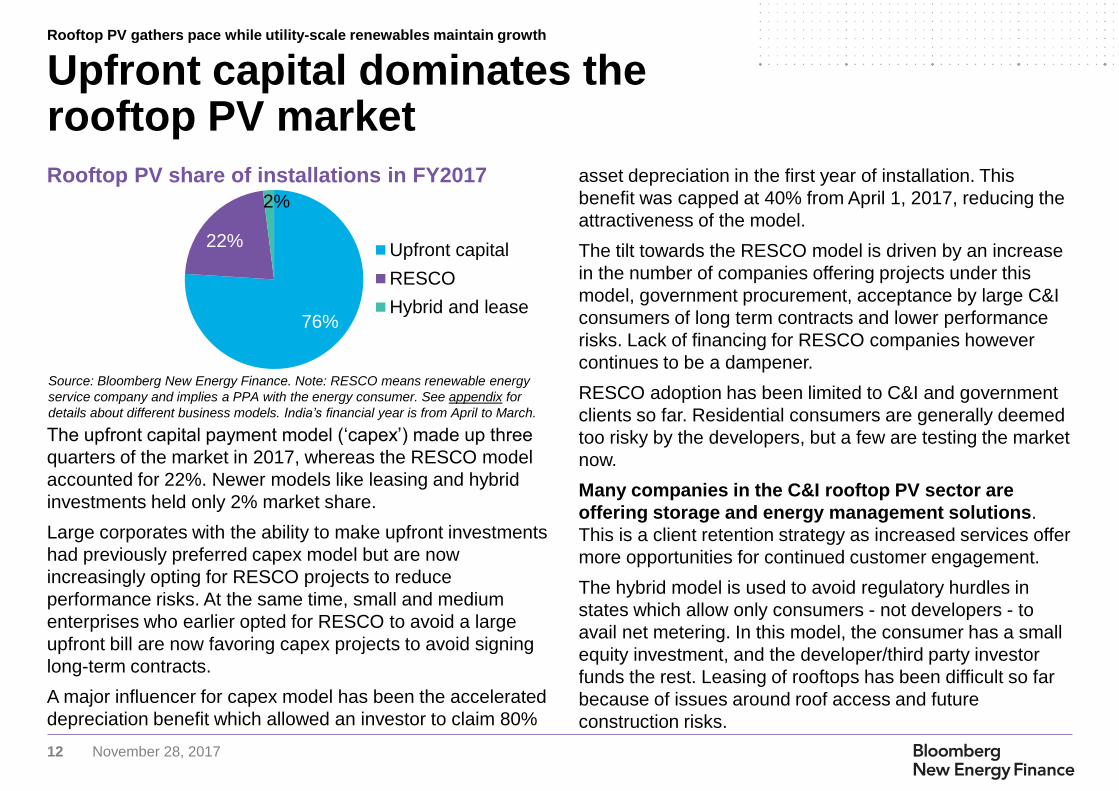
The upfront capital payment model (‘capex’) made up three
quarters of the market in 2017, whereas the RESCO model
accounted for 22%. Newer models like leasing and hybrid
investments held only 2% market share.
Large corporates with the ability to make upfront investments
had previously preferred capex model but are now
increasingly opting for RESCO projects to reduce
performance risks. At the same time, small and medium
enterprises who earlier opted for RESCO to avoid a large
upfront bill are now favoring capex projects to avoid signing
long-term contracts.
A major influencer for capex model has been the accelerated
depreciation benefit which allowed an investor to claim 80%
Rooftop PV share of installations in FY2017
Upfront capital dominates the rooftop PV market
Source: Bloomberg New Energy Finance. Note: RESCO means renewable energy
service company and implies a PPA with the energy consumer. See appendix for
details about different business models. India’s financial year is from April to March.
asset depreciation in the first year of installation. This
benefit was capped at 40% from April 1, 2017, reducing the
attractiveness of the model.
The tilt towards the RESCO model is driven by an increase
in the number of companies offering projects under this
model, government procurement, acceptance by large C&I
consumers of long term contracts and lower performance
risks. Lack of financing for RESCO companies however
continues to be a dampener.
RESCO adoption has been limited to C&I and government
clients so far. Residential consumers are generally deemed
too risky by the developers, but a few are testing the market
now.
Many companies in the C&I rooftop PV sector are
offering storage and energy management solutions.
This is a client retention strategy as increased services offer
more opportunities for continued customer engagement.
The hybrid model is used to avoid regulatory hurdles in
states which allow only consumers - not developers - to
avail net metering. In this model, the consumer has a small
equity investment, and the developer/third party investor
funds the rest. Leasing of rooftops has been difficult so far
because of issues around roof access and future
construction risks.
76%
22%
2%
Upfront capital
RESCO
Hybrid and lease
Rooftop PV gathers pace while utility-scale renewables maintain growth

13 November 28, 2017
Auctions, economics and
competition are driving
the renewables market
Drivers of growth in the market
14 November 28, 2017
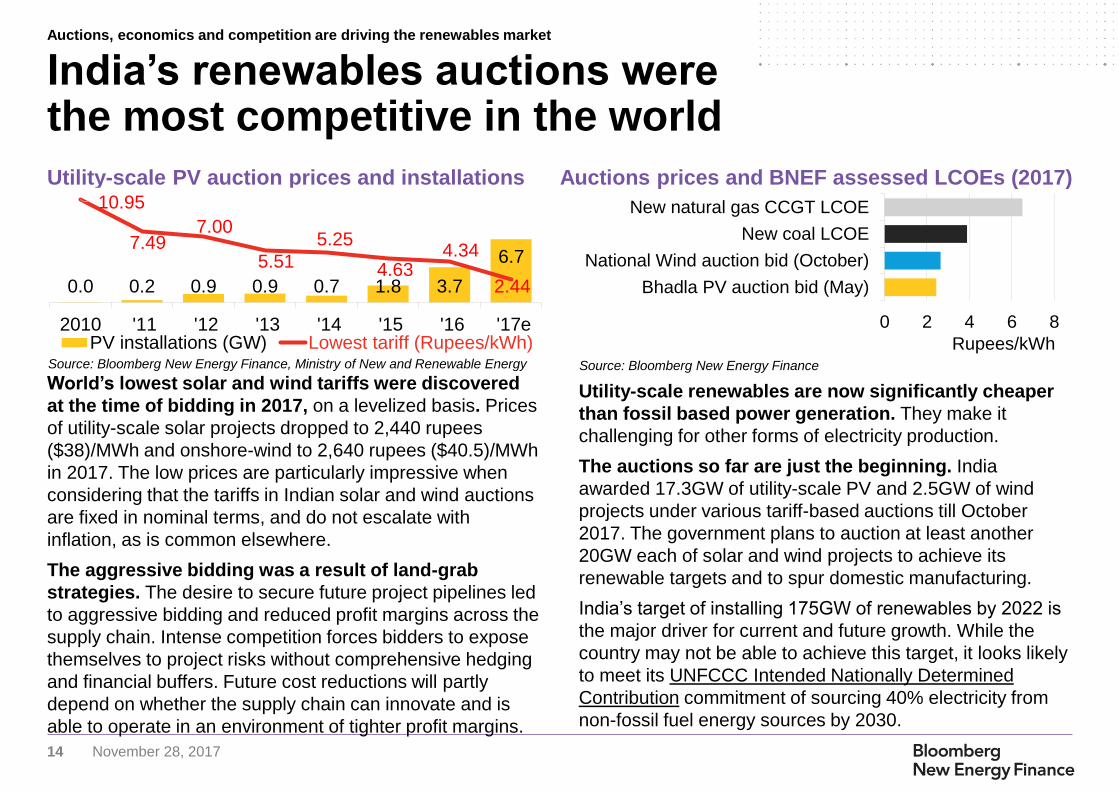
World’s lowest solar and wind tariffs were discovered
at the time of bidding in 2017, on a levelized basis. Prices
of utility-scale solar projects dropped to 2,440 rupees
($38)/MWh and onshore-wind to 2,640 rupees ($40.5)/MWh
in 2017. The low prices are particularly impressive when
considering that the tariffs in Indian solar and wind auctions
are fixed in nominal terms, and do not escalate with
inflation, as is common elsewhere.
The aggressive bidding was a result of land-grab
strategies. The desire to secure future project pipelines led
to aggressive bidding and reduced profit margins across the
supply chain. Intense competition forces bidders to expose
themselves to project risks without comprehensive hedging
and financial buffers. Future cost reductions will partly
depend on whether the supply chain can innovate and is
able to operate in an environment of tighter profit margins.
Utility-scale renewables are now significantly cheaper
than fossil based power generation. They make it
challenging for other forms of electricity production.
The auctions so far are just the beginning. India
awarded 17.3GW of utility-scale PV and 2.5GW of wind
projects under various tariff-based auctions till October
2017. The government plans to auction at least another
20GW each of solar and wind projects to achieve its
renewable targets and to spur domestic manufacturing.
India’s target of installing 175GW of renewables by 2022 is
the major driver for current and future growth. While the
country may not be able to achieve this target, it looks likely
to meet its UNFCCC Intended Nationally Determined
Contribution commitment of sourcing 40% electricity from
non-fossil fuel energy sources by 2030.
India’s renewables auctions were the most competitive in the world
Utility-scale PV auction prices and installations
Source: Bloomberg New Energy Finance, Ministry of New and Renewable Energy
Auctions prices and BNEF assessed LCOEs (2017)
Source: Bloomberg New Energy Finance
0 2 4 6 8
Bhadla PV auction bid (May)
National Wind auction bid (October)
New coal LCOE
New natural gas CCGT LCOE
Rupees/kWh
Auctions, economics and competition are driving the renewables market
0.0 0.2 0.9 0.9 0.7 1.8 3.7
6.7
10.95
7.49 7.00
5.51
5.25
4.63 4.34
2.44
2010 '11 '12 '13 '14 '15 '16 '17ePV installations (GW) Lowest tariff (Rupees/kWh)
15 November 28, 2017
LCOE range of rooftop PV in India
The small-scale PV market is highly competitive
Source: Bloomberg New Energy Finance, industry surveys. Note: India’s financial
year is from April to March.
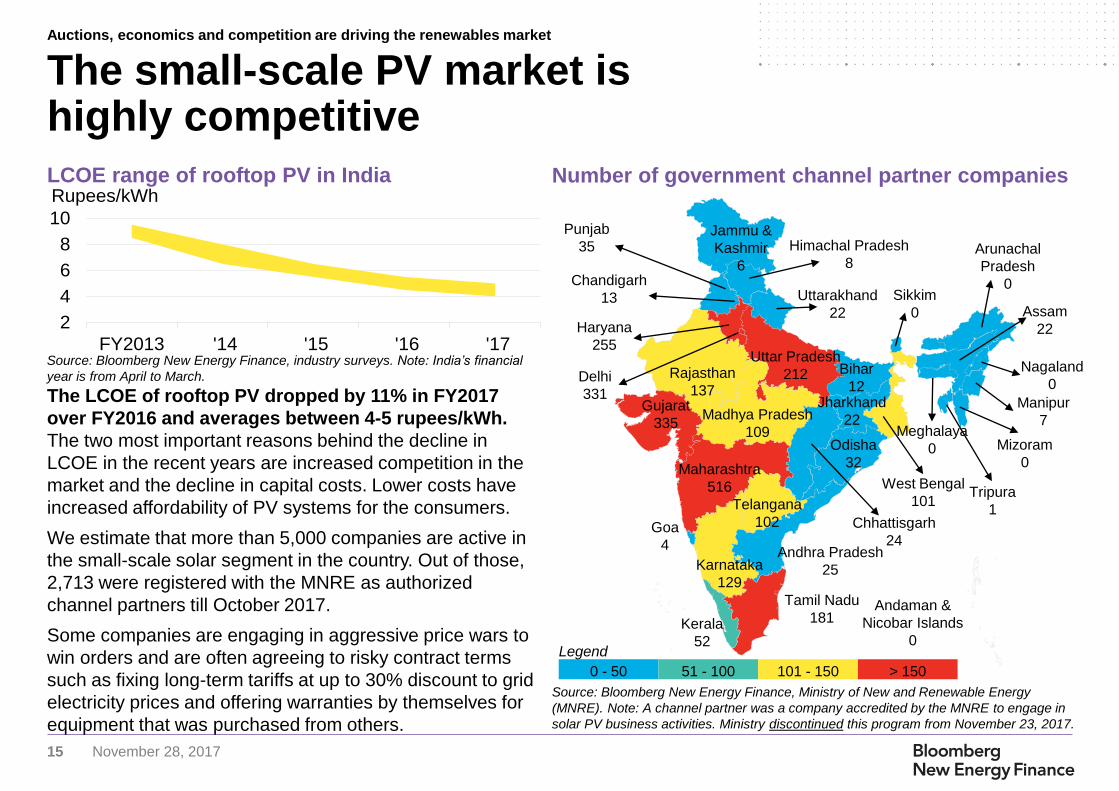
The LCOE of rooftop PV dropped by 11% in FY2017
over FY2016 and averages between 4-5 rupees/kWh.
The two most important reasons behind the decline in
LCOE in the recent years are increased competition in the
market and the decline in capital costs. Lower costs have
increased affordability of PV systems for the consumers.
We estimate that more than 5,000 companies are active in
the small-scale solar segment in the country. Out of those,
2,713 were registered with the MNRE as authorized
channel partners till October 2017.
Some companies are engaging in aggressive price wars to
win orders and are often agreeing to risky contract terms
such as fixing long-term tariffs at up to 30% discount to grid
electricity prices and offering warranties by themselves for
equipment that was purchased from others.
Maharashtra
516
Gujarat
335
Uttar Pradesh
212
Tamil Nadu
181
Karnataka
129
Kerala
52
Andhra Pradesh
25
Andaman &
Nicobar Islands
0
Telangana
102 Goa
4
Madhya Pradesh
109
Rajasthan
137
Punjab
35
Haryana
255
Jammu &
Kashmir
6
Delhi
331
Himachal Pradesh
8
Uttarakhand
22
Odisha
32
Jharkhand
22
Chhattisgarh
24
Bihar
12
West Bengal
101
Sikkim
0
Arunachal
Pradesh
0
Nagaland
0
Assam
22
Manipur
7
Mizoram
0
Tripura
1
Meghalaya
0
Chandigarh
13
Legend
0 - 50 51 - 100 101 - 150 > 150
Number of government channel partner companies
Source: Bloomberg New Energy Finance, Ministry of New and Renewable Energy
(MNRE). Note: A channel partner was a company accredited by the MNRE to engage in
solar PV business activities. Ministry discontinued this program from November 23, 2017.
Auctions, economics and competition are driving the renewables market
2
4
6
8
10
FY2013 '14 '15 '16 '17
Rupees/kWh
16 November 28, 2017
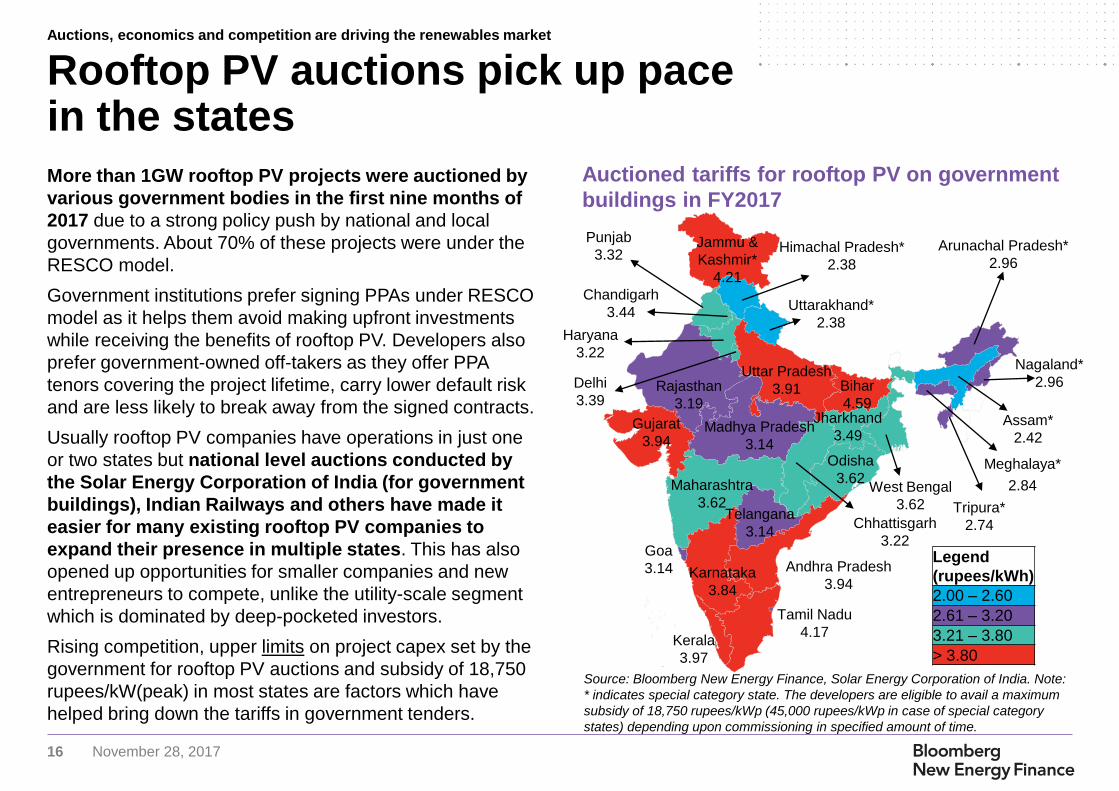
Source: Bloomberg New Energy Finance, Solar Energy Corporation of India. Note:
* indicates special category state. The developers are eligible to avail a maximum
subsidy of 18,750 rupees/kWp (45,000 rupees/kWp in case of special category
states) depending upon commissioning in specified amount of time.
Rooftop PV auctions pick up pace in the states
Maharashtra
3.62
Gujarat
3.94
Uttar Pradesh
3.91
Tamil Nadu
4.17
Karnataka
3.84
Kerala
3.97
Andhra Pradesh
3.94
Telangana
3.14
Goa
3.14
Madhya Pradesh
3.14
Rajasthan
3.19
Punjab
3.32
Haryana
3.22
Jammu &
Kashmir*
4.21
Delhi
3.39
Himachal Pradesh*
2.38
Uttarakhand*
2.38
Odisha
3.62
Jharkhand
3.49
Chhattisgarh
3.22
Bihar
4.59
West Bengal
3.62
Arunachal Pradesh*
2.96
Nagaland*
2.96
Assam*
2.42
Tripura*
2.74
Meghalaya*
2.84
Chandigarh
3.44
More than 1GW rooftop PV projects were auctioned by
various government bodies in the first nine months of
2017 due to a strong policy push by national and local
governments. About 70% of these projects were under the
RESCO model.
Government institutions prefer signing PPAs under RESCO
model as it helps them avoid making upfront investments
while receiving the benefits of rooftop PV. Developers also
prefer government-owned off-takers as they offer PPA
tenors covering the project lifetime, carry lower default risk
and are less likely to break away from the signed contracts.
Usually rooftop PV companies have operations in just one
or two states but national level auctions conducted by
the Solar Energy Corporation of India (for government
buildings), Indian Railways and others have made it
easier for many existing rooftop PV companies to
expand their presence in multiple states. This has also
opened up opportunities for smaller companies and new
entrepreneurs to compete, unlike the utility-scale segment
which is dominated by deep-pocketed investors.
Rising competition, upper limits on project capex set by the
government for rooftop PV auctions and subsidy of 18,750
rupees/kW(peak) in most states are factors which have
helped bring down the tariffs in government tenders.
Auctioned tariffs for rooftop PV on government
buildings in FY2017
Auctions, economics and competition are driving the renewables market
Legend
(rupees/kWh)
2.00 – 2.60
2.61 – 3.20
3.21 – 3.80
> 3.80
17 November 28, 2017
Net metering helps full utilization of rooftop PV: It lets
consumers maximize their rooftop installations – even if
they cannot use all the power they generate – by allowing
any surplus electricity to be offset against metered supply.
Some of this generated rooftop solar power would be lost in
the absence of such a mechanism.
Regulations lack clarity: Most states have notified net
metering regulations which are mandatory. However, a few
states like Andhra Pradesh, Odisha, Tamil Nadu and West
Bengal do not have regulations but instead have guidelines
which are legally non-binding. Lack of clarity about grid
connectivity in these states hinders installation of net-
metered rooftop PV systems. On the other hand, some
states like Madhya Pradesh have been active in addressing
these issues, setting a precedent for others.
Limits on PV system sizes and transformer loading
curtails installation: Barring a few exceptions, most states
permit rooftop solar installations between 1kW and 1MW as
eligible for net metering. Most states put maximum limits on
power fed back to the grid. This is generally around 30% of
the rated transformer capacity. However, Uttar Pradesh has
allowed higher capacity projects (5MW) to be connected on
a case-to-case basis. Similarly, states like Karnataka allow
transformer injection limits up to 80% of the rated capacity
thus providing flexibility on project sizes.
Limits based on annual consumption and PV output
curtails generation: Some states have put a limit on
injection of PV electricity to 90% of power imported by the
consumer from the grid.
Rollover of energy credits makes grid connectivity
more attractive: Across most states, an energy bill (for
import and export) is generated on a monthly basis and
financial settlement (if any) is done at the end of financial
year. Generally, states allow surplus electricity generated in
a month to be carried over to the next month as energy
credits. This lets consumers bank higher generation in a
month for use in lean periods and lower their power bills.
Other incentives: Most states have exempted banking
charges (facility to inject excess energy in the grid which
can be claimed later for a fee), wheeling charges (using the
discom assets to transfer power from point of generation to
point of use), cross-subsidy charges, electricity duty and
other surcharges, thereby incentivizing rooftop projects.
Our view: Effective implementation of net metering can
further propel growth of rooftop PV. Standardization of
regulations, timely & automated application approvals and
better co-ordination among discoms and consumers are
critical for a seamless net metering roll-out.
Net metering has teething problems, but issues are clearing up
Auctions, economics and competition are driving the renewables market
18 November 28, 2017
Corporates, households
and solar-diesel hybrids
are still untapped markets
Future potential for growth
19 November 28, 2017
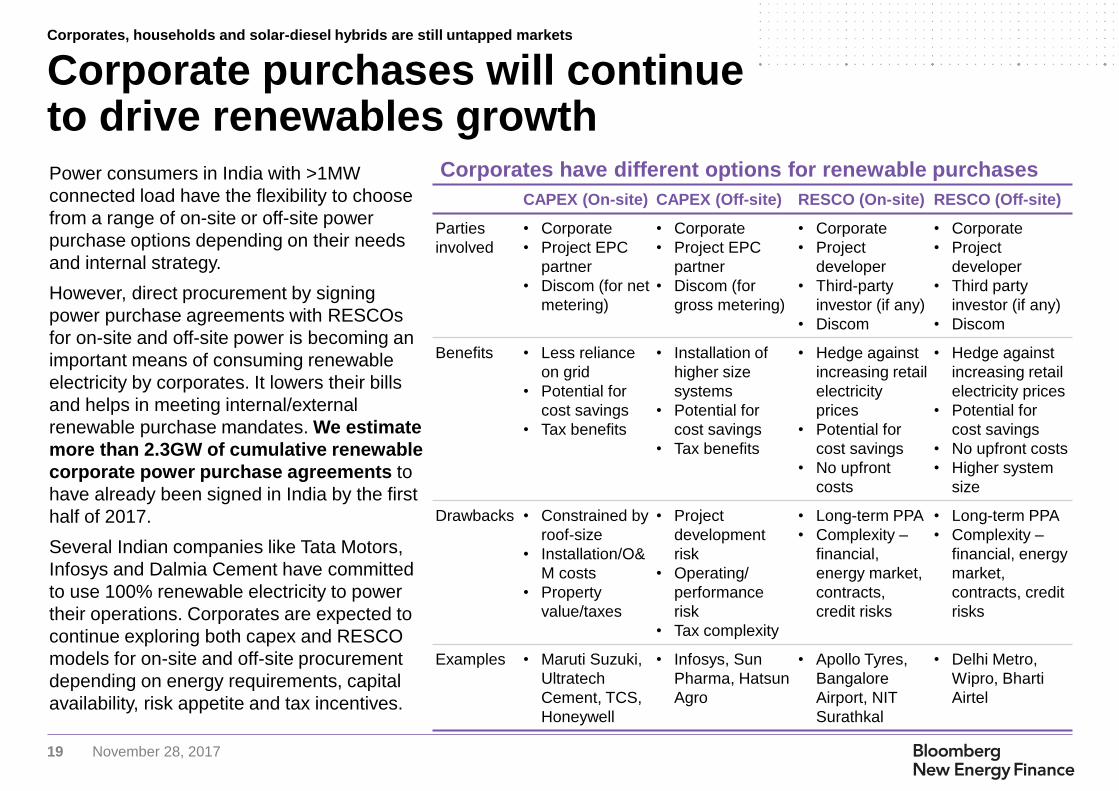
Power consumers in India with >1MW
connected load have the flexibility to choose
from a range of on-site or off-site power
purchase options depending on their needs
and internal strategy.
However, direct procurement by signing
power purchase agreements with RESCOs
for on-site and off-site power is becoming an
important means of consuming renewable
electricity by corporates. It lowers their bills
and helps in meeting internal/external
renewable purchase mandates. We estimate
more than 2.3GW of cumulative renewable
corporate power purchase agreements to
have already been signed in India by the first
half of 2017.
Several Indian companies like Tata Motors,
Infosys and Dalmia Cement have committed
to use 100% renewable electricity to power
their operations. Corporates are expected to
continue exploring both capex and RESCO
models for on-site and off-site procurement
depending on energy requirements, capital
availability, risk appetite and tax incentives.
Corporate purchases will continue to drive renewables growth
CAPEX (On-site) CAPEX (Off-site) RESCO (On-site) RESCO (Off-site)
Parties
involved
• Corporate
• Project EPC
partner
• Discom (for net
metering)
• Corporate
• Project EPC
partner
• Discom (for
gross metering)
• Corporate
• Project
developer
• Third-party
investor (if any)
• Discom
• Corporate
• Project
developer
• Third party
investor (if any)
• Discom
Benefits • Less reliance
on grid
• Potential for
cost savings
• Tax benefits
• Installation of
higher size
systems
• Potential for
cost savings
• Tax benefits
• Hedge against
increasing retail
electricity
prices
• Potential for
cost savings
• No upfront
costs
• Hedge against
increasing retail
electricity prices
• Potential for
cost savings
• No upfront costs
• Higher system
size
Drawbacks • Constrained by
roof-size
• Installation/O&
M costs
• Property
value/taxes
• Project
development
risk
• Operating/
performance
risk
• Tax complexity
• Long-term PPA
• Complexity –
financial,
energy market,
contracts,
credit risks
• Long-term PPA
• Complexity –
financial, energy
market,
contracts, credit
risks
Examples • Maruti Suzuki,
Ultratech
Cement, TCS,
Honeywell
• Infosys, Sun
Pharma, Hatsun
Agro
• Apollo Tyres,
Bangalore
Airport, NIT
Surathkal
• Delhi Metro,
Wipro, Bharti
Airtel
Corporates have different options for renewable purchases
Corporates, households and solar-diesel hybrids are still untapped markets
20 November 28, 2017
India’s residential solar market has remained largely
untapped, for several reasons:
● Low electricity tariff: The electricity prices for residential
consumers are cross-subsidized by industrial and
commercial users and are therefore low. Small-scale PV
is far less competitive in private homes.
● Higher system cost: The average capital cost of
residential PV systems in FY2017 were 44% higher than
commercial and industrial PV, mainly due to higher soft
costs and absence of economies of scale.
● Lack of awareness: Residential consumers still lack
awareness about rooftop policies and incentives, cost
savings, equipment quality, O&M care and other industry
innovation and best practices.
● Challenges in net metering: Consumers often require
multiple approvals to avail net metering leading to delays
in implementation of grid-connectivity.
● High customer acquisition cost: The costs associated
with acquisition of residential customers leave very little
margins for rooftop PV companies due to smaller ticket
sizes. Therefore, many major companies have completely
avoided catering to residential PV market segment so far.
● Lack of access to finance: Lack of dedicated financial
Next wave of growth will come from the residential sector
products from banks and inhibition of consumers to put
their residences as bank collateral limits the financing
options for consumers to avail rooftop PV.
● Government policies can drive growth: Central
government updated the ‘Model Building Bye Laws’
which mandate the installation of rooftop PV on both
old and new buildings exceeding a size and power
consumption threshold. Effective implementation of the
bye laws and ‘Energy Efficiency Building Code’ that
suggest rooftop PV installation, can lead to a sustained
growth of the residential PV market.
● Our long term view: Residential installations will
increase their share in rooftop PV markets, driven by
socket parity and a quest for more reliable power
supply. Rural areas, which face higher grid supply
disruptions, are better suited for reliable self generation
with small-scale PV rather than their urban-
counterparts.
● Net metering is a far more important enabler for
residential small-scale solar than for business: The
latter consume power throughout the day, when the
sun shines. Homeowners are usually drawing less
power when their PV panels produce, making self-
consumption much harder.
Corporates, households and solar-diesel hybrids are still untapped markets
21 November 28, 2017
Source: Bloomberg New Energy Finance, GARV portal
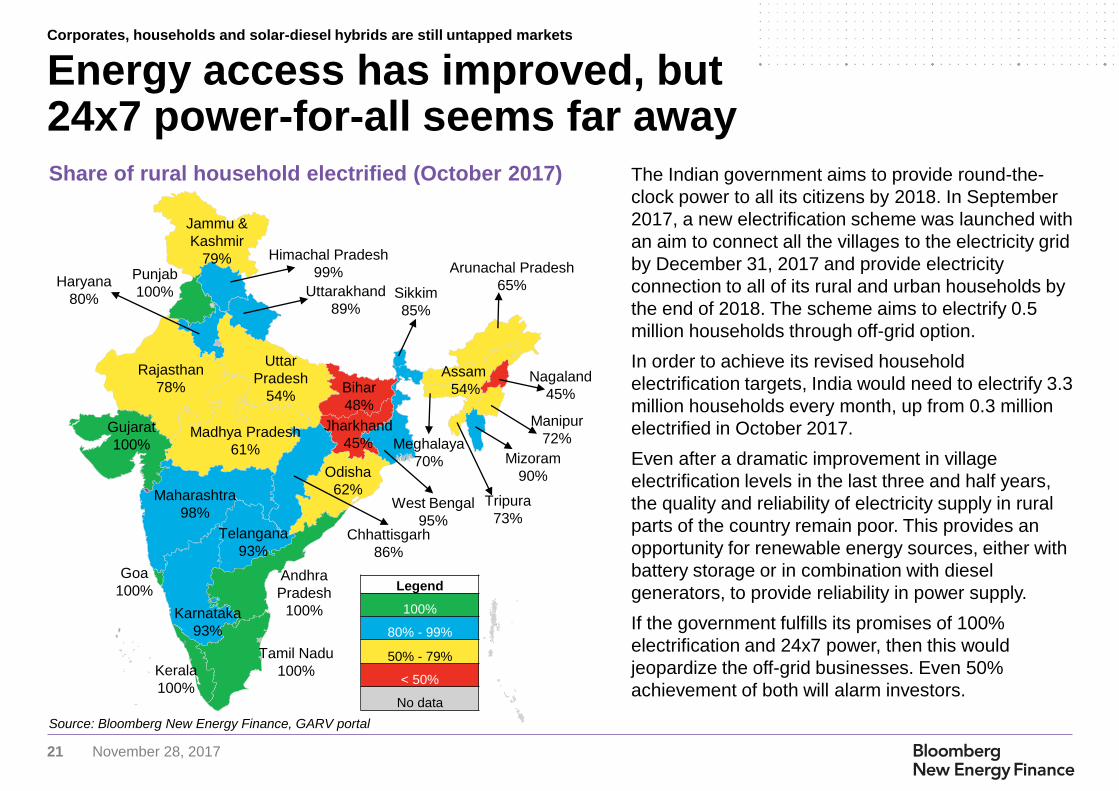
Energy access has improved, but 24x7 power-for-all seems far away
Jammu &
Kashmir
79% Himachal Pradesh
99%
Uttarakhand
89%
Punjab
100%
Rajasthan
78%
Uttar
Pradesh
54%
Madhya Pradesh
61%
Gujarat
100%
Maharashtra
98%
Karnataka
93%
Goa
100%
Kerala
100%
Tamil Nadu
100%
Andhra
Pradesh
100%
Odisha
62%
Chhattisgarh
86%
Bihar
48%
Jharkhand
45%
West Bengal
95%
Assam
54%
Meghalaya
70% Mizoram
90%
Manipur
72%
Nagaland
45%
Arunachal Pradesh
65% Sikkim
85%
Tripura
73%
Haryana
80%
Telangana
93%
Legend
100%
80% - 99%
50% - 79%
< 50%
No data
Share of rural household electrified (October 2017) The Indian government aims to provide round-the-
clock power to all its citizens by 2018. In September
2017, a new electrification scheme was launched with
an aim to connect all the villages to the electricity grid
by December 31, 2017 and provide electricity
connection to all of its rural and urban households by
the end of 2018. The scheme aims to electrify 0.5
million households through off-grid option.
In order to achieve its revised household
electrification targets, India would need to electrify 3.3
million households every month, up from 0.3 million
electrified in October 2017.
Even after a dramatic improvement in village
electrification levels in the last three and half years,
the quality and reliability of electricity supply in rural
parts of the country remain poor. This provides an
opportunity for renewable energy sources, either with
battery storage or in combination with diesel
generators, to provide reliability in power supply.
If the government fulfills its promises of 100%
electrification and 24x7 power, then this would
jeopardize the off-grid businesses. Even 50%
achievement of both will alarm investors.
Corporates, households and solar-diesel hybrids are still untapped markets
22 November 28, 2017
Source: Bloomberg New Energy Finance, Central Electricity
Authority, Ministry of New and Renewable Energy. India’s financial
year is from April to March.
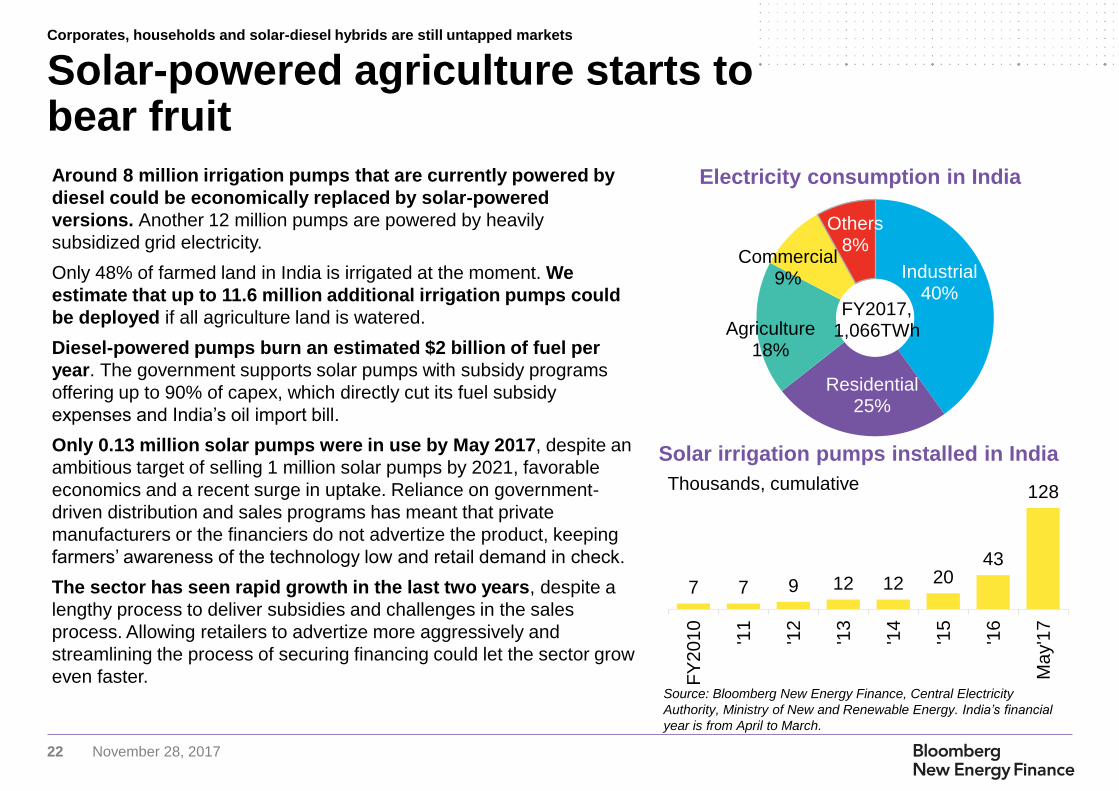
Solar-powered agriculture starts to bear fruit
Around 8 million irrigation pumps that are currently powered by
diesel could be economically replaced by solar-powered
versions. Another 12 million pumps are powered by heavily
subsidized grid electricity.
Only 48% of farmed land in India is irrigated at the moment. We
estimate that up to 11.6 million additional irrigation pumps could
be deployed if all agriculture land is watered.
Diesel-powered pumps burn an estimated $2 billion of fuel per
year. The government supports solar pumps with subsidy programs
offering up to 90% of capex, which directly cut its fuel subsidy
expenses and India’s oil import bill.
Only 0.13 million solar pumps were in use by May 2017, despite an
ambitious target of selling 1 million solar pumps by 2021, favorable
economics and a recent surge in uptake. Reliance on government-
driven distribution and sales programs has meant that private
manufacturers or the financiers do not advertize the product, keeping
farmers’ awareness of the technology low and retail demand in check.
The sector has seen rapid growth in the last two years, despite a
lengthy process to deliver subsidies and challenges in the sales
process. Allowing retailers to advertize more aggressively and
streamlining the process of securing financing could let the sector grow
even faster.
Electricity consumption in India
Solar irrigation pumps installed in India
7 7 9 12 12 2043
128
FY
2010
'11
'12
'13
'14
'15
'16
May'1
7
Thousands, cumulative
Industrial40%
Residential25%
Agriculture18%
Commercial9%
Others8%
FY2017, 1,066TWh
Corporates, households and solar-diesel hybrids are still untapped markets
23 November 28, 2017
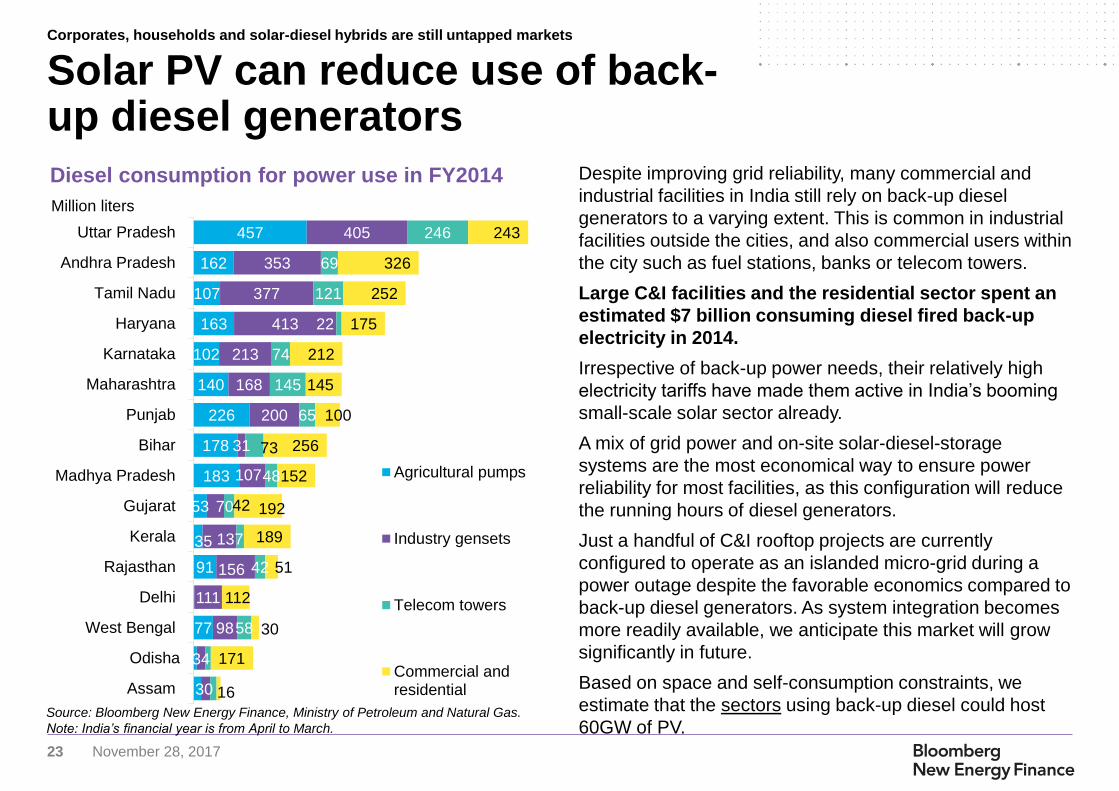
Solar PV can reduce use of back-up diesel generators
Diesel consumption for power use in FY2014 Despite improving grid reliability, many commercial and
industrial facilities in India still rely on back-up diesel
generators to a varying extent. This is common in industrial
facilities outside the cities, and also commercial users within
the city such as fuel stations, banks or telecom towers.
Large C&I facilities and the residential sector spent an
estimated $7 billion consuming diesel fired back-up
electricity in 2014.
Irrespective of back-up power needs, their relatively high
electricity tariffs have made them active in India’s booming
small-scale solar sector already.
A mix of grid power and on-site solar-diesel-storage
systems are the most economical way to ensure power
reliability for most facilities, as this configuration will reduce
the running hours of diesel generators.
Just a handful of C&I rooftop projects are currently
configured to operate as an islanded micro-grid during a
power outage despite the favorable economics compared to
back-up diesel generators. As system integration becomes
more readily available, we anticipate this market will grow
significantly in future.
Based on space and self-consumption constraints, we
estimate that the sectors using back-up diesel could host
60GW of PV. Source: Bloomberg New Energy Finance, Ministry of Petroleum and Natural Gas.
Note: India’s financial year is from April to March.
Corporates, households and solar-diesel hybrids are still untapped markets
30
77
91
35
53
183
178
226
140
102
163
107
162
457
34
98
111
156
137
70
107
31
200
168
213
413
377
353
405
58
42
42
48
73
65
145
74
22
121
69
246
16
171
30
112
51
189
192
152
256
100
145
212
175
252
326
243
Assam
Odisha
West Bengal
Delhi
Rajasthan
Kerala
Gujarat
Madhya Pradesh
Bihar
Punjab
Maharashtra
Karnataka
Haryana
Tamil Nadu
Andhra Pradesh
Uttar Pradesh
Million liters
Agricultural pumps
Industry gensets
Telecom towers
Commercial andresidential
24 November 28, 2017
India’s clean energy boom
is slow to reach rural
areas
Market trends for micro-grids and portable
solar kits

25 November 28, 2017
Annual rural micro-grid installations in India
Innovation in grid utilization is essential for growth of micro-grids
Source: Bloomberg New Energy Finance. Note: Based on data from 17 companies.
India has reached only 1% of its micro-grid target.
Unlike the utility-scale and rooftop targets, micro-grid
growth is relatively stagnant.
The rising micro-grid tide is not lifting all boats. Our
survey of 17 micro-grid companies found that 1.9MW micro-
grid projects were installed in FY2017, up from 1.6MW built
a year ago. Nine companies reported an uptick in
installations in FY2017, whereas four reported a decline in
installations and the other four reported no installations in
the year compared to FY2016.
The growth in the sector has been driven by philanthropic
and corporate social responsibility initiatives. Regulatory
uncertainty is still a major bottleneck in scaling-up the
business. Stranded asset risk because of grid extension,
revenue collection challenges and uncertain project returns
are the main concerns for investors.
Micro-grids deployed for rural electrification are often
oversized to meet anticipated demand increases.
However, this means that many micro-grids are not running
at full capacity.
In the absence of an anchor load such as a telecom
tower, ramping up the utilization and revenues from
micro-grids can be a slow process and takes a few
years. Companies are responding to under-utilization of
systems by connecting more productive loads to grids like
rice hullers, cold storage and water purification units. Micro-
grid operators have also started to build modular and
containerized grids that offer ease of expansion.
Taking advantage of growing digital payments penetration in
rural India, many micro-grid operators now offer smart
metering and online payment options, allowing them to
streamline operations and revenue collection.
Micro-grid operators are also providing their customers
with financing options to buy electrical appliances and
other commercial equipment. This serves three objectives -
increasing micro-grid utilization, higher customer
engagement and boosting economic activity in the rural
areas.
India’s clean energy boom is slow to reach rural areas
533 556 375
1,634 1,919
FY2013 '14 '15 '16 '17
kW
26 November 28, 2017
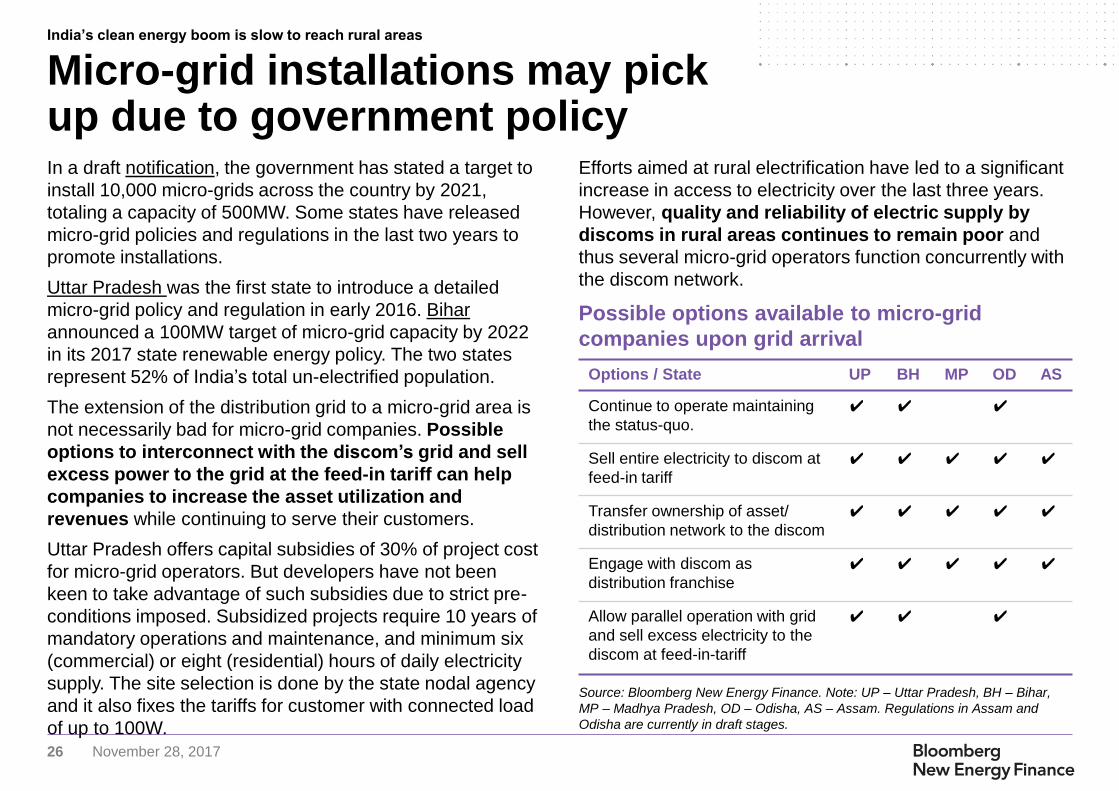
In a draft notification, the government has stated a target to
install 10,000 micro-grids across the country by 2021,
totaling a capacity of 500MW. Some states have released
micro-grid policies and regulations in the last two years to
promote installations.
Uttar Pradesh was the first state to introduce a detailed
micro-grid policy and regulation in early 2016. Bihar
announced a 100MW target of micro-grid capacity by 2022
in its 2017 state renewable energy policy. The two states
represent 52% of India’s total un-electrified population.
The extension of the distribution grid to a micro-grid area is
not necessarily bad for micro-grid companies. Possible
options to interconnect with the discom’s grid and sell
excess power to the grid at the feed-in tariff can help
companies to increase the asset utilization and
revenues while continuing to serve their customers.
Uttar Pradesh offers capital subsidies of 30% of project cost
for micro-grid operators. But developers have not been
keen to take advantage of such subsidies due to strict pre-
conditions imposed. Subsidized projects require 10 years of
mandatory operations and maintenance, and minimum six
(commercial) or eight (residential) hours of daily electricity
supply. The site selection is done by the state nodal agency
and it also fixes the tariffs for customer with connected load
of up to 100W.
Options / State UP BH MP OD AS
Continue to operate maintaining
the status-quo.
✔ ✔ ✔
Sell entire electricity to discom at
feed-in tariff
✔ ✔ ✔ ✔ ✔
Transfer ownership of asset/
distribution network to the discom
✔ ✔ ✔ ✔ ✔
Engage with discom as
distribution franchise
✔ ✔ ✔ ✔ ✔
Allow parallel operation with grid
and sell excess electricity to the
discom at feed-in-tariff
✔ ✔ ✔
Micro-grid installations may pick up due to government policy
Possible options available to micro-grid
companies upon grid arrival
Source: Bloomberg New Energy Finance. Note: UP – Uttar Pradesh, BH – Bihar,
MP – Madhya Pradesh, OD – Odisha, AS – Assam. Regulations in Assam and
Odisha are currently in draft stages.
Efforts aimed at rural electrification have led to a significant
increase in access to electricity over the last three years.
However, quality and reliability of electric supply by
discoms in rural areas continues to remain poor and
thus several micro-grid operators function concurrently with
the discom network.
India’s clean energy boom is slow to reach rural areas
27 November 28, 2017
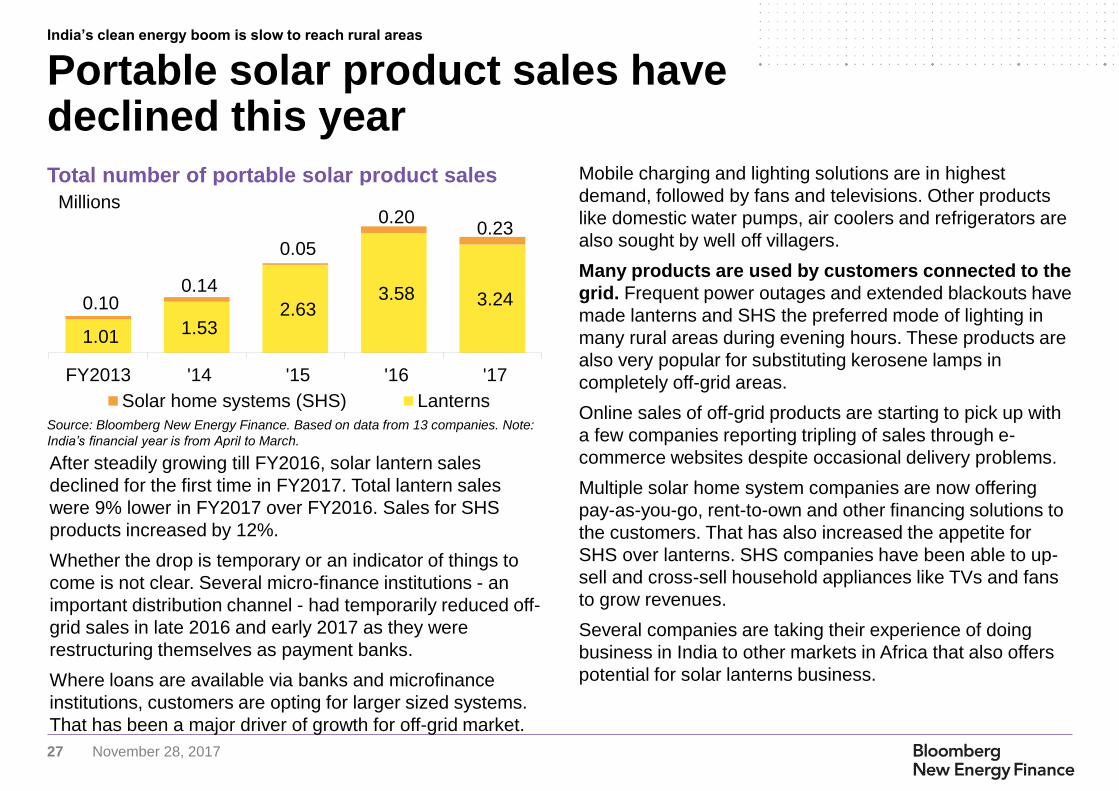
Total number of portable solar product sales
Portable solar product sales have declined this year
Source: Bloomberg New Energy Finance. Based on data from 13 companies. Note:
India’s financial year is from April to March.
After steadily growing till FY2016, solar lantern sales
declined for the first time in FY2017. Total lantern sales
were 9% lower in FY2017 over FY2016. Sales for SHS
products increased by 12%.
Whether the drop is temporary or an indicator of things to
come is not clear. Several micro-finance institutions - an
important distribution channel - had temporarily reduced off-
grid sales in late 2016 and early 2017 as they were
restructuring themselves as payment banks.
Where loans are available via banks and microfinance
institutions, customers are opting for larger sized systems.
That has been a major driver of growth for off-grid market.
Mobile charging and lighting solutions are in highest
demand, followed by fans and televisions. Other products
like domestic water pumps, air coolers and refrigerators are
also sought by well off villagers.
Many products are used by customers connected to the
grid. Frequent power outages and extended blackouts have
made lanterns and SHS the preferred mode of lighting in
many rural areas during evening hours. These products are
also very popular for substituting kerosene lamps in
completely off-grid areas.
Online sales of off-grid products are starting to pick up with
a few companies reporting tripling of sales through e-
commerce websites despite occasional delivery problems.
Multiple solar home system companies are now offering
pay-as-you-go, rent-to-own and other financing solutions to
the customers. That has also increased the appetite for
SHS over lanterns. SHS companies have been able to up-
sell and cross-sell household appliances like TVs and fans
to grow revenues.
Several companies are taking their experience of doing
business in India to other markets in Africa that also offers
potential for solar lanterns business.
India’s clean energy boom is slow to reach rural areas
1.01 1.53
2.63 3.58 3.24 0.10
0.14
0.05
0.20 0.23
FY2013 '14 '15 '16 '17
Solar home systems (SHS) Lanterns
Millions

28 November 28, 2017
India’s per-capita on-grid electricity consumption increased
by 22% from 914 kWh/person-year in FY2013 to an
estimated 1,112 kWh/person-year in FY2017. This
consumption has risen due to increased activity in the
industrial sector, higher adoption of electrical appliances by
the residential electricity users and addition of more
consumers to the grid.
Similar trends are observed in off-grid markets where
electricity demand is increasing as the economy grows and
people demand higher quality of goods and services.
Off-grid power consumers who earlier used lanterns
with mobile chargers are now moving to solar home
systems (SHS) which can support fans and TV sets.
India’s per capita electricity consumption
Rural electricity use is increasing with rising economic activity
Source: Bloomberg New Energy Finance, Central Electricity Authority. Note: India’s
financial year is from April to March
Similar upward transition is observed for existing SHS users
who are now demanding larger capacity systems which can
power more or larger appliances.
Clear trends of up-sell and cross-sell of domestic
appliances like TV sets and fans by SHS companies
and productive load-use equipment like rice hullers, air
coolers and refrigerators by micro-grid companies have
been observed. Off-grid companies are diversifying their
business activities to increase revenue and maintain higher
customer engagement to be able to retain them upon grid
arrival.
Micro-grids and other small-scale PV systems deployed by
for-profit companies, corporate social responsibility
mandates, government initiatives and other philanthropic
activities have helped in powering schools, primary health
centers and community centers.
India’s clean energy boom is slow to reach rural areas
914957
1,0101,075
1,112
FY2013 '14 '15 '16 '17e
kWh/person-year
29 November 28, 2017
Sustaining the small solar
boom
Industry best practices, strategies for
power distribution companies
30 November 28, 2017
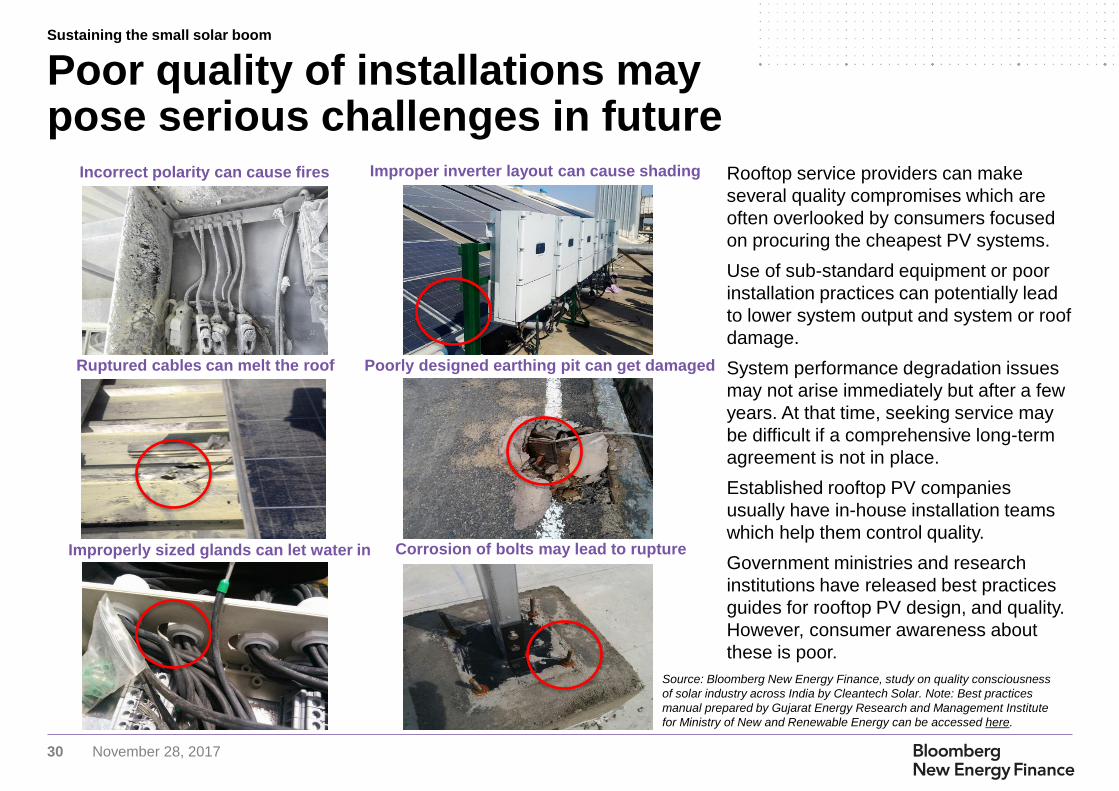
Poor quality of installations may pose serious challenges in future
Incorrect polarity can cause fires
Ruptured cables can melt the roof
Improperly sized glands can let water in
Improper inverter layout can cause shading
Poorly designed earthing pit can get damaged
Corrosion of bolts may lead to rupture
Rooftop service providers can make
several quality compromises which are
often overlooked by consumers focused
on procuring the cheapest PV systems.
Use of sub-standard equipment or poor
installation practices can potentially lead
to lower system output and system or roof
damage.
System performance degradation issues
may not arise immediately but after a few
years. At that time, seeking service may
be difficult if a comprehensive long-term
agreement is not in place.
Established rooftop PV companies
usually have in-house installation teams
which help them control quality.
Government ministries and research
institutions have released best practices
guides for rooftop PV design, and quality.
However, consumer awareness about
these is poor.
Sustaining the small solar boom
Source: Bloomberg New Energy Finance, study on quality consciousness
of solar industry across India by Cleantech Solar. Note: Best practices
manual prepared by Gujarat Energy Research and Management Institute
for Ministry of New and Renewable Energy can be accessed here.
31 November 28, 2017
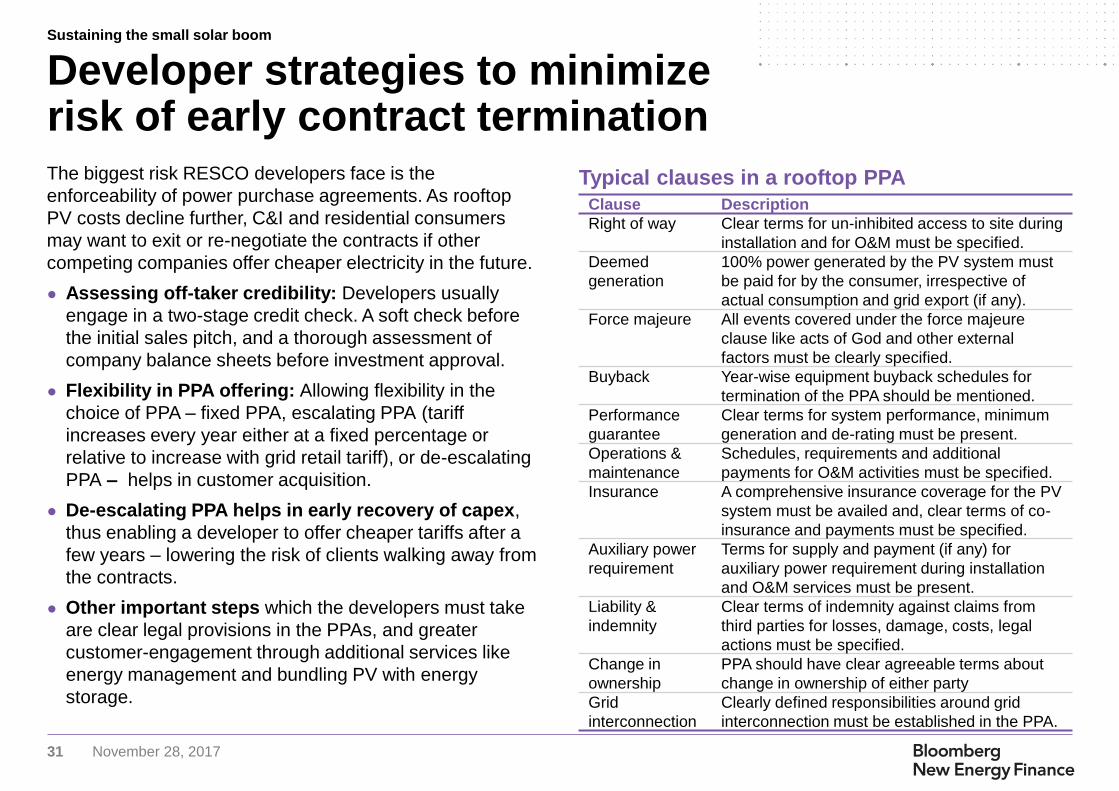
The biggest risk RESCO developers face is the
enforceability of power purchase agreements. As rooftop
PV costs decline further, C&I and residential consumers
may want to exit or re-negotiate the contracts if other
competing companies offer cheaper electricity in the future.
● Assessing off-taker credibility: Developers usually
engage in a two-stage credit check. A soft check before
the initial sales pitch, and a thorough assessment of
company balance sheets before investment approval.
● Flexibility in PPA offering: Allowing flexibility in the
choice of PPA – fixed PPA, escalating PPA (tariff
increases every year either at a fixed percentage or
relative to increase with grid retail tariff), or de-escalating
PPA – helps in customer acquisition.
● De-escalating PPA helps in early recovery of capex,
thus enabling a developer to offer cheaper tariffs after a
few years – lowering the risk of clients walking away from
the contracts.
● Other important steps which the developers must take
are clear legal provisions in the PPAs, and greater
customer-engagement through additional services like
energy management and bundling PV with energy
storage.
Clause Description
Right of way Clear terms for un-inhibited access to site during
installation and for O&M must be specified.
Deemed
generation
100% power generated by the PV system must
be paid for by the consumer, irrespective of
actual consumption and grid export (if any).
Force majeure All events covered under the force majeure
clause like acts of God and other external
factors must be clearly specified.
Buyback Year-wise equipment buyback schedules for
termination of the PPA should be mentioned.
Performance
guarantee
Clear terms for system performance, minimum
generation and de-rating must be present.
Operations &
maintenance
Schedules, requirements and additional
payments for O&M activities must be specified.
Insurance A comprehensive insurance coverage for the PV
system must be availed and, clear terms of co-
insurance and payments must be specified.
Auxiliary power
requirement
Terms for supply and payment (if any) for
auxiliary power requirement during installation
and O&M services must be present.
Liability &
indemnity
Clear terms of indemnity against claims from
third parties for losses, damage, costs, legal
actions must be specified.
Change in
ownership
PPA should have clear agreeable terms about
change in ownership of either party
Grid
interconnection
Clearly defined responsibilities around grid
interconnection must be established in the PPA.
Typical clauses in a rooftop PPA
Developer strategies to minimize risk of early contract termination
Sustaining the small solar boom
32 November 28, 2017
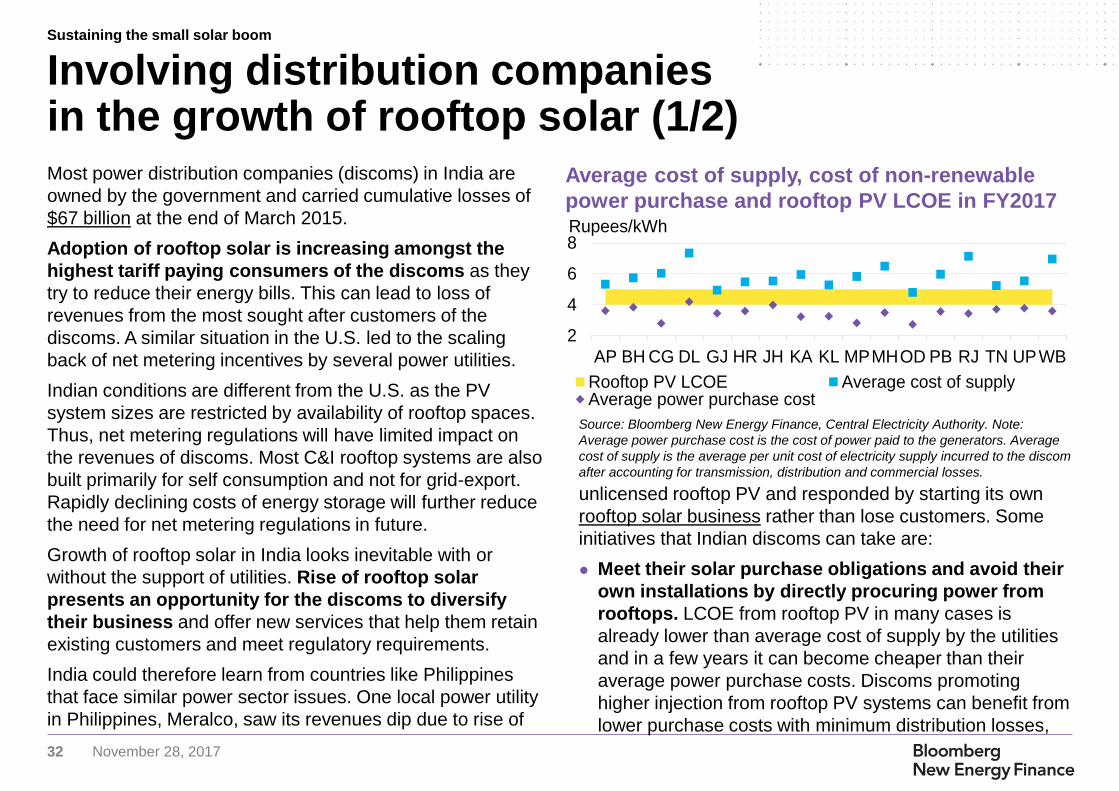
Most power distribution companies (discoms) in India are
owned by the government and carried cumulative losses of
$67 billion at the end of March 2015.
Adoption of rooftop solar is increasing amongst the
highest tariff paying consumers of the discoms as they
try to reduce their energy bills. This can lead to loss of
revenues from the most sought after customers of the
discoms. A similar situation in the U.S. led to the scaling
back of net metering incentives by several power utilities.
Indian conditions are different from the U.S. as the PV
system sizes are restricted by availability of rooftop spaces.
Thus, net metering regulations will have limited impact on
the revenues of discoms. Most C&I rooftop systems are also
built primarily for self consumption and not for grid-export.
Rapidly declining costs of energy storage will further reduce
the need for net metering regulations in future.
Growth of rooftop solar in India looks inevitable with or
without the support of utilities. Rise of rooftop solar
presents an opportunity for the discoms to diversify
their business and offer new services that help them retain
existing customers and meet regulatory requirements.
India could therefore learn from countries like Philippines
that face similar power sector issues. One local power utility
in Philippines, Meralco, saw its revenues dip due to rise of
unlicensed rooftop PV and responded by starting its own
rooftop solar business rather than lose customers. Some
initiatives that Indian discoms can take are:
● Meet their solar purchase obligations and avoid their
own installations by directly procuring power from
rooftops. LCOE from rooftop PV in many cases is
already lower than average cost of supply by the utilities
and in a few years it can become cheaper than their
average power purchase costs. Discoms promoting
higher injection from rooftop PV systems can benefit from
lower purchase costs with minimum distribution losses,
Involving distribution companies in the growth of rooftop solar (1/2)
Average cost of supply, cost of non-renewable
power purchase and rooftop PV LCOE in FY2017
Source: Bloomberg New Energy Finance, Central Electricity Authority. Note:
Average power purchase cost is the cost of power paid to the generators. Average
cost of supply is the average per unit cost of electricity supply incurred to the discom
after accounting for transmission, distribution and commercial losses.
Sustaining the small solar boom
2
4
6
8
AP BH CG DL GJ HR JH KA KL MPMHOD PB RJ TN UPWB
Rupees/kWh
Rooftop PV LCOE Average cost of supplyAverage power purchase cost
33 November 28, 2017
which will in turn also reduce their financial losses.
● Utilities can start their own EPC offerings to avoid
losing customers to third party installers. The utilities
would be in a position of strength compared to other
market players due to availability of better customer data
to target potential consumers and leverage long-standing
existing relationship with consumers. Discoms can either
start operations in their own region of operation (which
would require regulatory approvals) or outside their
regions through subsidiaries.
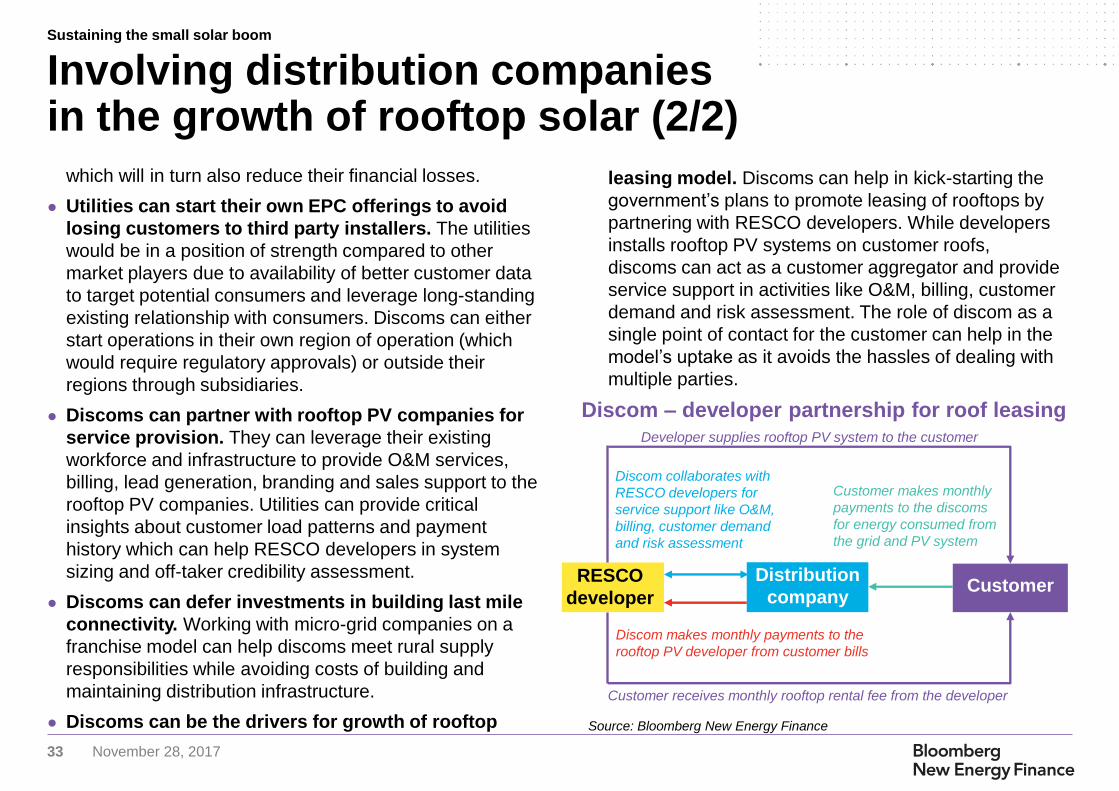
● Discoms can partner with rooftop PV companies for
service provision. They can leverage their existing
workforce and infrastructure to provide O&M services,
billing, lead generation, branding and sales support to the
rooftop PV companies. Utilities can provide critical
insights about customer load patterns and payment
history which can help RESCO developers in system
sizing and off-taker credibility assessment.
● Discoms can defer investments in building last mile
connectivity. Working with micro-grid companies on a
franchise model can help discoms meet rural supply
responsibilities while avoiding costs of building and
maintaining distribution infrastructure.
● Discoms can be the drivers for growth of rooftop
Involving distribution companies in the growth of rooftop solar (2/2)
RESCO
developer
Customer makes monthly
payments to the discoms
for energy consumed from
the grid and PV system
Customer receives monthly rooftop rental fee from the developer
Distribution
company Customer
Developer supplies rooftop PV system to the customer
Discom makes monthly payments to the
rooftop PV developer from customer bills
Discom collaborates with
RESCO developers for
service support like O&M,
billing, customer demand
and risk assessment
Discom – developer partnership for roof leasing
Source: Bloomberg New Energy Finance
leasing model. Discoms can help in kick-starting the
government’s plans to promote leasing of rooftops by
partnering with RESCO developers. While developers
installs rooftop PV systems on customer roofs,
discoms can act as a customer aggregator and provide
service support in activities like O&M, billing, customer
demand and risk assessment. The role of discom as a
single point of contact for the customer can help in the
model’s uptake as it avoids the hassles of dealing with
multiple parties.
Sustaining the small solar boom
34 November 28, 2017
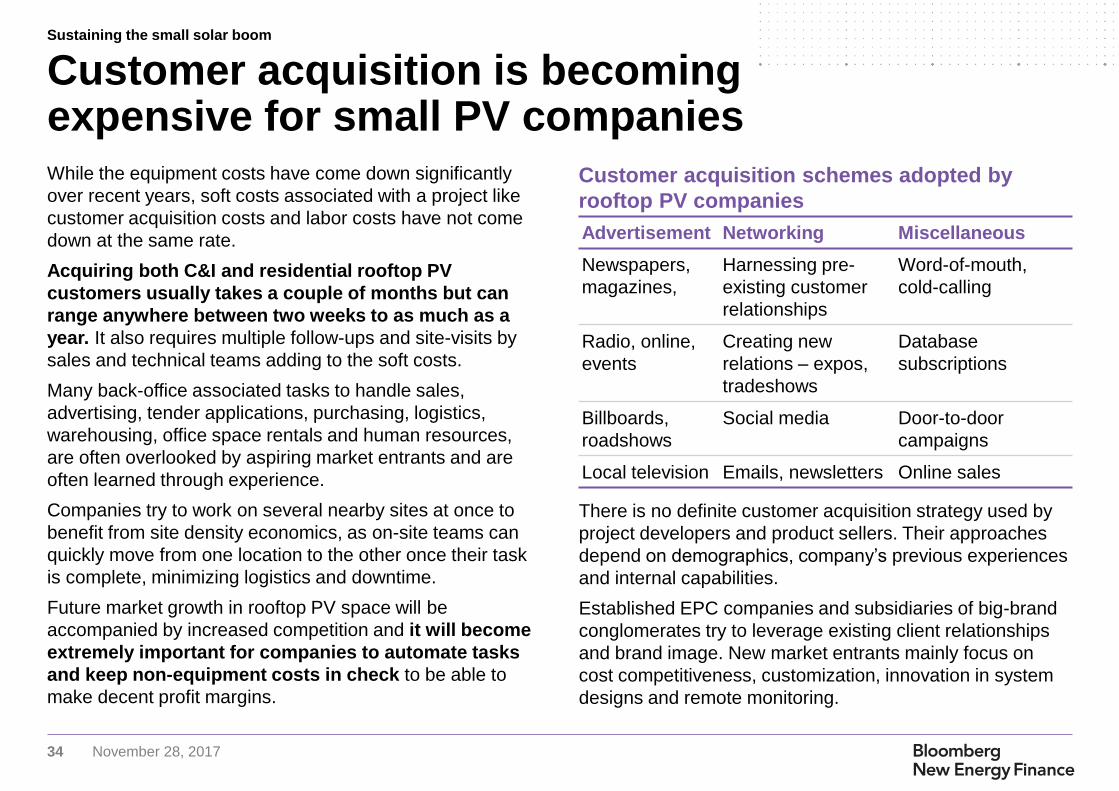
While the equipment costs have come down significantly
over recent years, soft costs associated with a project like
customer acquisition costs and labor costs have not come
down at the same rate.
Acquiring both C&I and residential rooftop PV
customers usually takes a couple of months but can
range anywhere between two weeks to as much as a
year. It also requires multiple follow-ups and site-visits by
sales and technical teams adding to the soft costs.
Many back-office associated tasks to handle sales,
advertising, tender applications, purchasing, logistics,
warehousing, office space rentals and human resources,
are often overlooked by aspiring market entrants and are
often learned through experience.
Companies try to work on several nearby sites at once to
benefit from site density economics, as on-site teams can
quickly move from one location to the other once their task
is complete, minimizing logistics and downtime.
Future market growth in rooftop PV space will be
accompanied by increased competition and it will become
extremely important for companies to automate tasks
and keep non-equipment costs in check to be able to
make decent profit margins.
Advertisement Networking Miscellaneous
Newspapers,
magazines,
Harnessing pre-
existing customer
relationships
Word-of-mouth,
cold-calling
Radio, online,
events
Creating new
relations – expos,
tradeshows
Database
subscriptions
Billboards,
roadshows
Social media Door-to-door
campaigns
Local television Emails, newsletters Online sales
There is no definite customer acquisition strategy used by
project developers and product sellers. Their approaches
depend on demographics, company’s previous experiences
and internal capabilities.
Established EPC companies and subsidiaries of big-brand
conglomerates try to leverage existing client relationships
and brand image. New market entrants mainly focus on
cost competitiveness, customization, innovation in system
designs and remote monitoring.
Customer acquisition schemes adopted by
rooftop PV companies
Customer acquisition is becoming expensive for small PV companies
Sustaining the small solar boom
35 November 28, 2017
Appendices
36 November 28, 2017
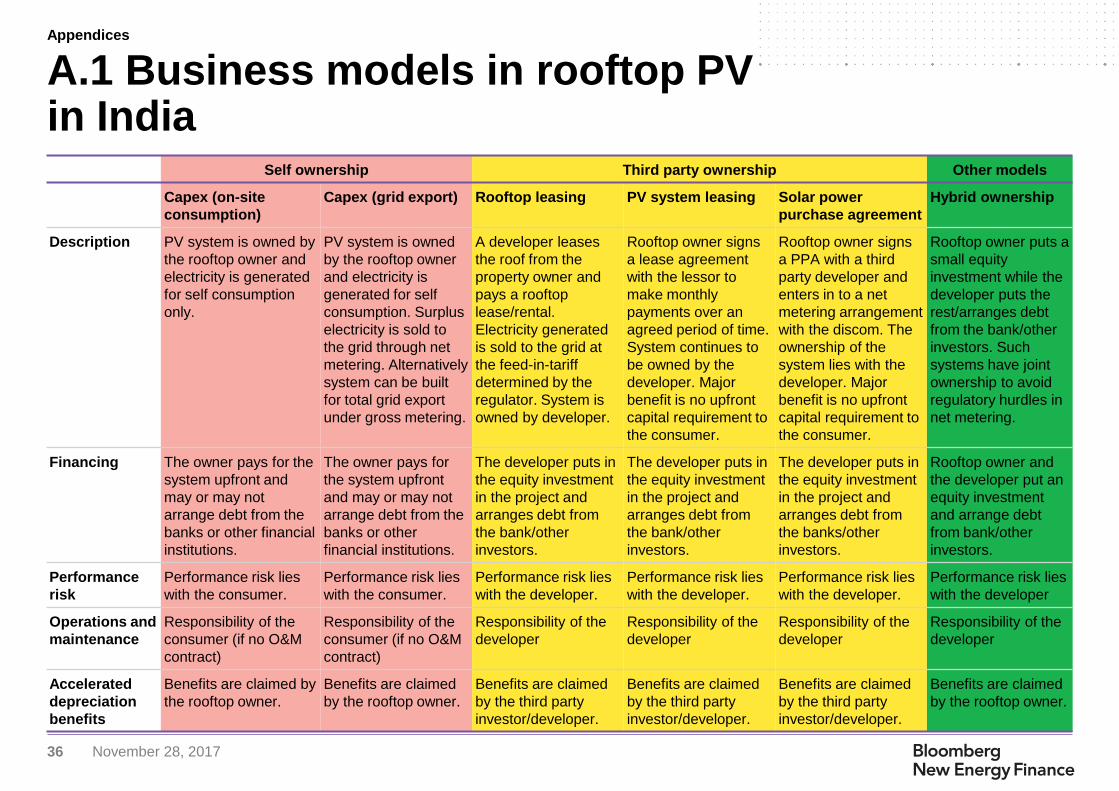
A.1 Business models in rooftop PV in India
Self ownership Third party ownership Other models
Capex (on-site
consumption)
Capex (grid export) Rooftop leasing PV system leasing Solar power
purchase agreement
Hybrid ownership
Description PV system is owned by
the rooftop owner and
electricity is generated
for self consumption
only.
PV system is owned
by the rooftop owner
and electricity is
generated for self
consumption. Surplus
electricity is sold to
the grid through net
metering. Alternatively
system can be built
for total grid export
under gross metering.
A developer leases
the roof from the
property owner and
pays a rooftop
lease/rental.
Electricity generated
is sold to the grid at
the feed-in-tariff
determined by the
regulator. System is
owned by developer.
Rooftop owner signs
a lease agreement
with the lessor to
make monthly
payments over an
agreed period of time.
System continues to
be owned by the
developer. Major
benefit is no upfront
capital requirement to
the consumer.
Rooftop owner signs
a PPA with a third
party developer and
enters in to a net
metering arrangement
with the discom. The
ownership of the
system lies with the
developer. Major
benefit is no upfront
capital requirement to
the consumer.
Rooftop owner puts a
small equity
investment while the
developer puts the
rest/arranges debt
from the bank/other
investors. Such
systems have joint
ownership to avoid
regulatory hurdles in
net metering.
Financing The owner pays for the
system upfront and
may or may not
arrange debt from the
banks or other financial
institutions.
The owner pays for
the system upfront
and may or may not
arrange debt from the
banks or other
financial institutions.
The developer puts in
the equity investment
in the project and
arranges debt from
the bank/other
investors.
The developer puts in
the equity investment
in the project and
arranges debt from
the bank/other
investors.
The developer puts in
the equity investment
in the project and
arranges debt from
the banks/other
investors.
Rooftop owner and
the developer put an
equity investment
and arrange debt
from bank/other
investors.
Performance
risk
Performance risk lies
with the consumer.
Performance risk lies
with the consumer.
Performance risk lies
with the developer.
Performance risk lies
with the developer.
Performance risk lies
with the developer.
Performance risk lies
with the developer
Operations and
maintenance
Responsibility of the
consumer (if no O&M
contract)
Responsibility of the
consumer (if no O&M
contract)
Responsibility of the
developer
Responsibility of the
developer
Responsibility of the
developer
Responsibility of the
developer
Accelerated
depreciation
benefits
Benefits are claimed by
the rooftop owner.
Benefits are claimed
by the rooftop owner.
Benefits are claimed
by the third party
investor/developer.
Benefits are claimed
by the third party
investor/developer.
Benefits are claimed
by the third party
investor/developer.
Benefits are claimed
by the rooftop owner.
Appendices
37 November 28, 2017
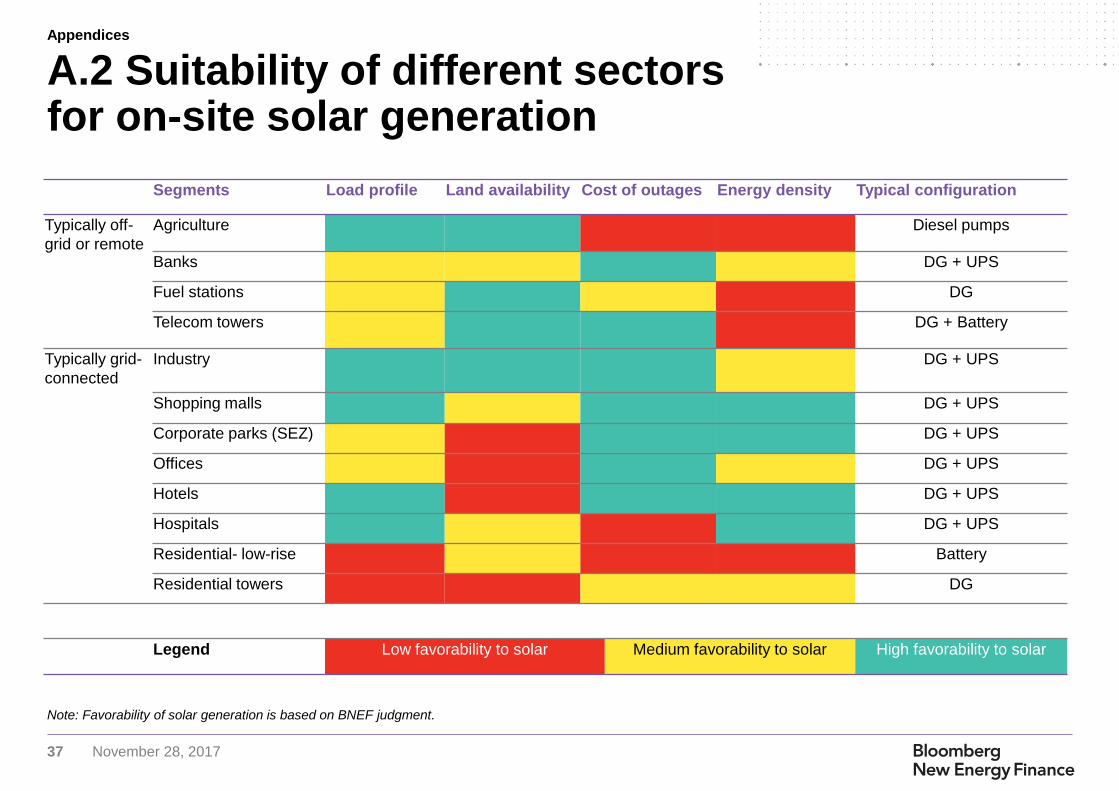
Segments Load profile Land availability Cost of outages Energy density Typical configuration
Typically off-
grid or remote
Agriculture Diesel pumps
Banks DG + UPS
Fuel stations DG
Telecom towers DG + Battery
Typically grid-
connected
Industry DG + UPS
Shopping malls DG + UPS
Corporate parks (SEZ) DG + UPS
Offices DG + UPS
Hotels DG + UPS
Hospitals DG + UPS
Residential- low-rise Battery
Residential towers DG
Legend Low favorability to solar Medium favorability to solar High favorability to solar
A.2 Suitability of different sectors for on-site solar generation
Note: Favorability of solar generation is based on BNEF judgment.
Appendices

38 November 28, 2017
We would like to thank the following companies (1/2)
Appendices
39 November 28, 2017
Appendices
We would like to thank the following companies (2/2)
… and Sterling & Wilson, Tata Power Solar and Tara Urja.

40 November 28, 2017
This publication is the copyright of Bloomberg New Energy Finance. No portion of this document may be photocopied,
reproduced, scanned into an electronic system or transmitted, forwarded or distributed in any way without prior consent of
Bloomberg New Energy Finance.
The information contained in this publication is derived from carefully selected sources we believe are reasonable. We do not
guarantee its accuracy or completeness and nothing in this document shall be construed to be a representation of such a
guarantee. Any opinions expressed reflect the current judgment of the author of the relevant article or features, and does not
necessarily reflect the opinion of Bloomberg New Energy Finance, Bloomberg Finance L.P., Bloomberg L.P. or any of their
affiliates ("Bloomberg"). The opinions presented are subject to change without notice. Bloomberg accepts no responsibility
for any liability arising from use of this document or its contents. Nothing herein shall constitute or be construed as an
offering of financial instruments, or as investment advice or recommendations by Bloomberg of an investment strategy or
whether or not to "buy," "sell" or "hold" an investment.
Copyright and disclaimer

Coverage.
Renewable Energy
Power & Utilities
Gas
Carbon Markets & Climate Negotiations
Energy Smart Technologies
Storage
Electric Vehicles
Mobility and Autonomous Driving
Frontier Power
Emerging Technologies
Bloomberg New Energy Finance is a
research firm that helps energy
professionals generate opportunities. With a
team of experts spread across six
continents, BNEF provides independent
analysis and insight, enabling decision-
makers to navigate change in an evolving
energy economy.
BNEF research and analysis is accessible
via web and mobile platforms, as well as on
the Bloomberg Terminal.
about.bnef.com
@BloombergNEF [email protected]
Shantanu Jaiswal, Head of India Research Atin Jain, Analyst India Itamar Orlandi, Head of Frontier Power Ashish Sethia, Head of APAC Research