accelerated laboratory testing for alkali-silica · pdf fileaccelerated laboratory testing for...
TRANSCRIPT

Accelerated Laboratory Testing for Alkali-Silica Reaction Using
ASTM 1293 and Comparison with ASTM 1260
Draft report prepared for the
CALIFORNIA DEPARTMENT OF TRANSPORTATION
By:
Cruz Carlos, Jr., Mauricio Mancio, Kome Shomglin, John Harvey, Paulo Monteiro, and Abdikarim Ali
November 2004
Pavement Research Center Institute of Transportation Studies University of California, Berkeley
University of California, Davis

TABLE OF CONTENTS
Table of Contents........................................................................................................................... iii
List of Figures ............................................................................................................................... vii
List of Tables ................................................................................................................................. xi
Executive Summary ...................................................................................................................... 13
Objectives ................................................................................................................................. 14
Aggregates Included in the Study............................................................................................. 15
Results....................................................................................................................................... 17
Conclusions............................................................................................................................... 18
Recommendations..................................................................................................................... 19
1.0 Introduction....................................................................................................................... 21
1.1 Alkali-Silica Reaction................................................................................................... 21
1.2 ASTM 1260 and 1293 Accelerated Laboratory Tests for ASR.................................... 22
1.3 Objective and Scope ..................................................................................................... 24
2.0 Materials and Experimental Methods ............................................................................... 27
2.1 Description of Aggregates Used for Testing ................................................................ 27
2.1.1 Aggregate A.............................................................................................................. 27
2.1.2 Aggregate B .............................................................................................................. 27
2.1.3 Aggregate C .............................................................................................................. 30
2.1.4 Aggregate D.............................................................................................................. 30
2.2 Historical Performance ................................................................................................. 32
2.2.1 Aggregate A.............................................................................................................. 32
2.2.2 Aggregate B .............................................................................................................. 32
2.2.3 Aggregate C .............................................................................................................. 32
iii
2.2.4 Aggregate D.............................................................................................................. 33
2.3 Description of Test Methods......................................................................................... 33
2.3.1 ASTM C 1260........................................................................................................... 33
2.3.2 ASTM C 1293........................................................................................................... 34
2.3.3 Modified Version of ASTM C 1293......................................................................... 35
2.3.4 Types of Cement ....................................................................................................... 36
2.3.5 Microscopy ............................................................................................................... 36
3.0 Results and Discussion ..................................................................................................... 39
3.1 Comparison of ASTM C 1260 and ASTM C 1293 ...................................................... 39
3.2 Comparison of ASTM C 1293 and Modified ASTM C 1293 ...................................... 43
3.3 Characterization of ASR products using Scanning Electron Microscopy .................... 46
3.3.1 ASTM C 1260 Microscopy Results Across Time .................................................... 46
3.3.2 ASTM C 1293 Microscopy Results.......................................................................... 49
3.3.3 Comparison of Microscopy Results for ASTM C 1260 and
C 1293 at Common Times ....................................................................................... 52
4.0 Conclusion and Recommendations................................................................................... 57
4.1 Conclusions................................................................................................................... 57
4.2 Recommendations......................................................................................................... 58
5.0 References......................................................................................................................... 59
Appendix A................................................................................................................................... 61
Source D: ASTM C 1293.......................................................................................................... 61
Source D: ASTM C 1260.......................................................................................................... 64
Source C: ASTM C 1293.......................................................................................................... 67
iv

Source C: ASTM C 1260.......................................................................................................... 70
v

vi
LIST OF FIGURES
Figure 1. X-ray diffraction plots for Aggregate A........................................................................ 28
Figure 2. X-ray diffraction plots for Aggregate B. ....................................................................... 29
Figure 3. X-ray diffraction plots for Aggregate D........................................................................ 31
Figure 4. Aggregate Reactivity results from ASTM C 1260. ....................................................... 40
Figure 5. Fine aggregate results from ASTM C 1293. ................................................................. 40
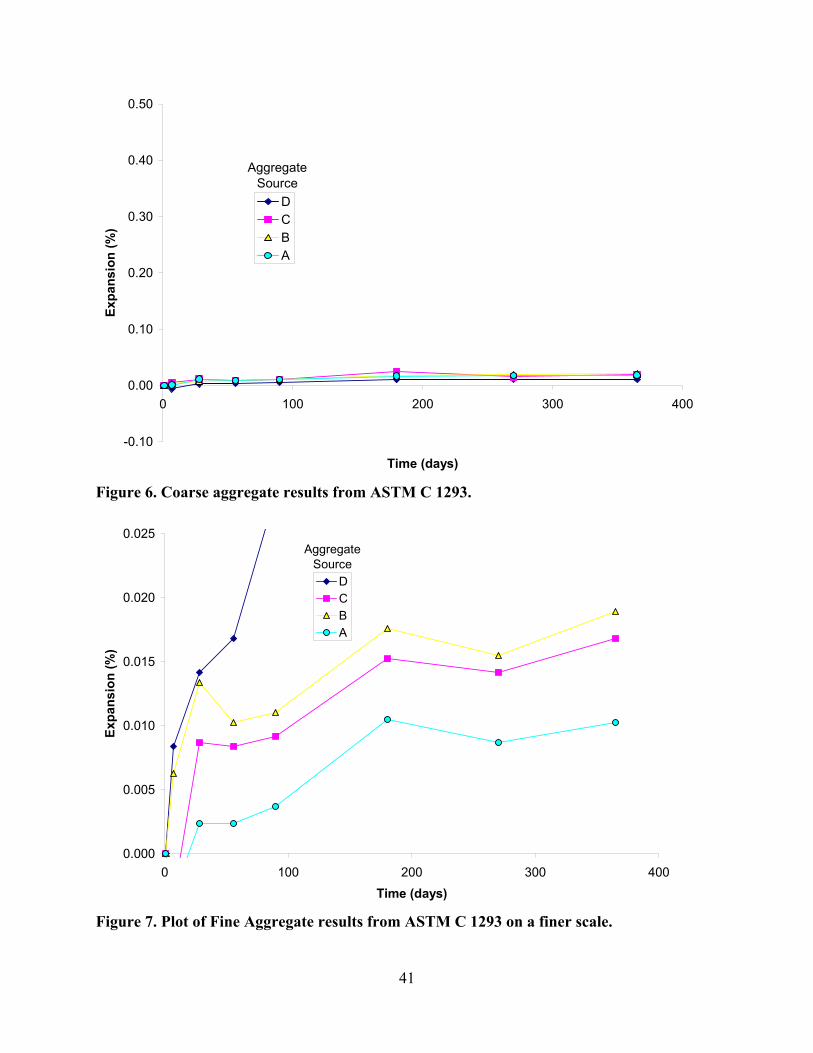
Figure 6. Coarse aggregate results from ASTM C 1293. ............................................................. 41
Figure 7. Plot of Fine Aggregate results from ASTM C 1293 on a finer scale. ........................... 41
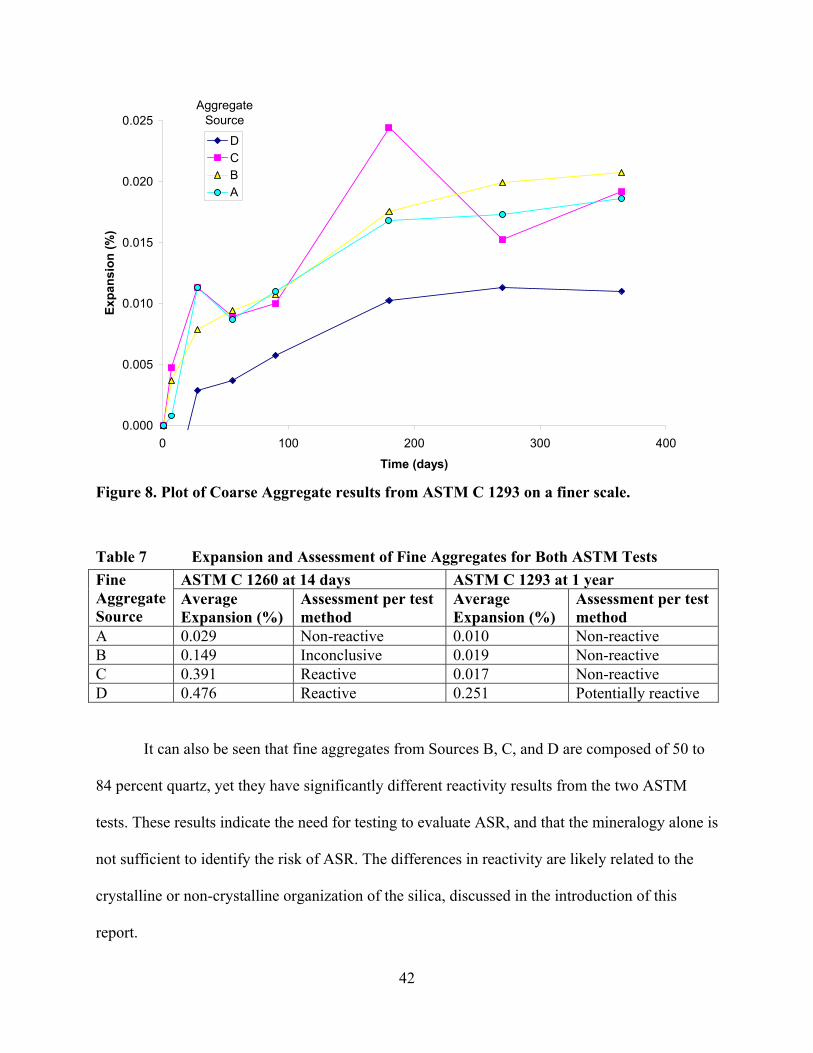
Figure 8. Plot of Coarse Aggregate results from ASTM C 1293 on a finer scale. ....................... 42
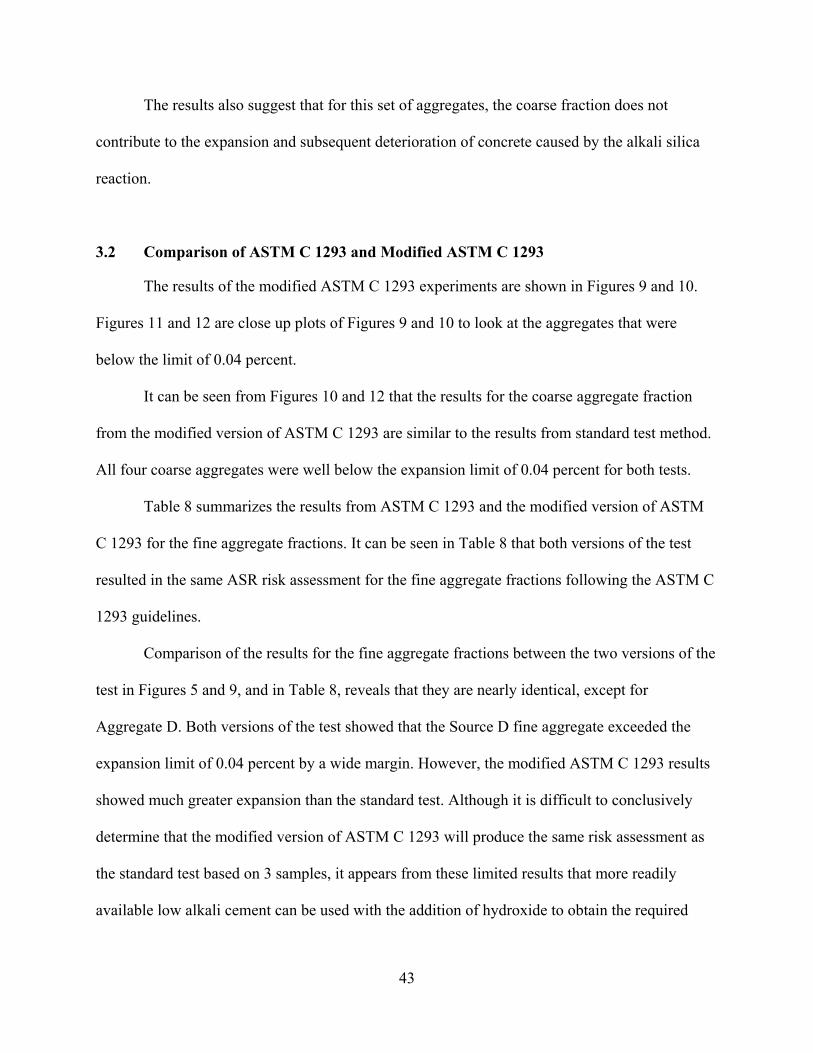
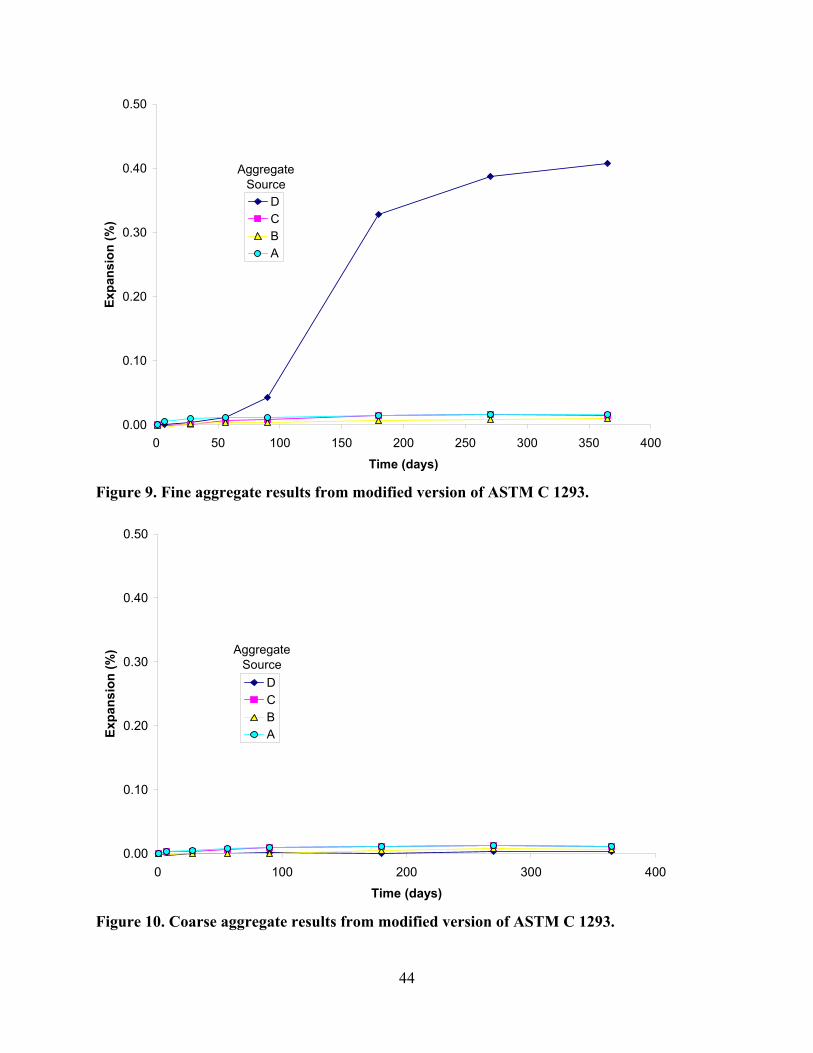
Figure 9. Fine aggregate results from modified version of ASTM C 1293.................................. 44
Figure 10. Coarse aggregate results from modified version of ASTM C 1293............................ 44
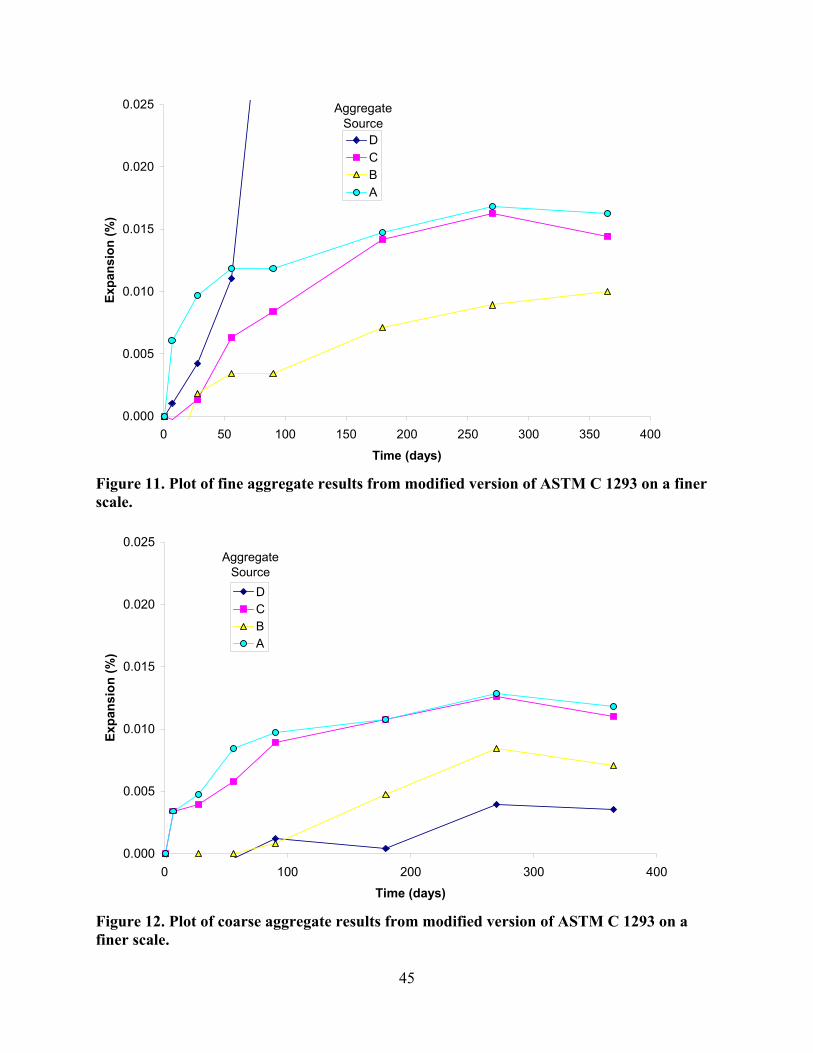
Figure 11. Plot of fine aggregate results from modified version of
ASTM C 1293 on a finer scale. .................................................................................. 45
Figure 12. Plot of coarse aggregate results from modified version of
ASTM C 1293 on a finer scale. .................................................................................. 45
Figure 13. Source C aggregate from ASTM C 1260 at 1 day....................................................... 47
Figure 14. Source C aggregate from ASTM C 1260 at 7 days. .................................................... 47
Figure 15. Source C aggregate from ASTM C 1260 at 21 days. .................................................. 47
Figure 16. Source D aggregate using ASTM C 1260 at 1 day. .................................................... 48
Figure 17. Source D aggregate using ASTM C 1260 at 7 days.................................................... 48
Figure 18. Source D aggregate using ASTM C 1260 at 21 days. ................................................. 48
Figure 19. Source C aggregate using ASTM C 1293 at 1 day...................................................... 50
Figure 20. Source C aggregate using ASTM C 1293 at 3 months................................................ 50
Figure 21. Source C aggregate using ASTM C 1293 at 1 year..................................................... 50
vii

Figure 22. Source D aggregate using ASTM C 1293 at 1 day. .................................................... 51
Figure 23. Source D aggregate using ASTM C 1293 at 3 months. .............................................. 51
Figure 24. Source D Aggregate using ASTM C 1293 at 1 year. .................................................. 51
Figure 25. Source D aggregate using ASTM C 1260 at 1 day. .................................................... 53
Figure 26. Source D aggregate using ASTM C 1260 at 7 days.................................................... 53
Figure 27. Source D aggregate using ASTM C 1260 at 21 days. ................................................. 53
Figure 28. Source D aggregate using ASTM C 1293 at 1 day. .................................................... 54
Figure 29. Source D aggregate using ASTM C 1293 at 7 days.................................................... 54
Figure 30. Source D aggregate using ASTM C 1293 at 1 month. ................................................ 54
Figure A1. Ludlow aggregate using ASTM C 1293 at 1 day. ...................................................... 62
Figure A2. Ludlow aggregate using ASTM C 1293 at day 7. ...................................................... 62
Figure A3. Ludlow aggregate using ASTM C 1293 at 1 month................................................... 62
Figure A4. Ludlow aggregate using ASTM C 1293 at 3 months. ................................................ 63
Figure A5. Ludlow aggregate using ASTM C 1293 at 6 months ................................................. 63
Figure A6. Ludlow aggregate using ASTM C 1293 at 1 year. ..................................................... 63
Figure A7. Ludlow aggregate using ASTM C 1260 at 1 day. ...................................................... 65
Figure A8. Ludlow aggregate using ASTM C 1260 at 3 days...................................................... 65
Figure A9. Ludlow aggregate using ASTM C 1260 at 7 days...................................................... 65
Figure A10. Ludlow aggregate using ASTM C 1260 at 10 days.................................................. 66
Figure A11. Ludlow aggregate using ASTM C 1260 at 14 days.................................................. 66
Figure A12. Ludlow aggregate using ASTM C 1260 at 21 days.................................................. 66
Figure A13. Pleasanton aggregate using ASTM C 1293 at 1 day. ............................................... 68
Figure A14. Pleasanton aggregate using ASTM C 1293 at 7 days............................................... 68
viii

Figure A15. Pleasanton aggregate using ASTM C 1293 at 1 month............................................ 68
Figure A16. Pleasanton aggregate using ASTM C 1293 at 3 months. ......................................... 69
Figure A17. Pleasanton aggregate using ASTM C 1293 at 6 months. ......................................... 69
Figure A18. Pleasanton aggregate using ASTM C 1293 at 1 year. .............................................. 69
Figure A19. Pleasanton aggregate using ASTM C 1260 at 1 day. ............................................... 71
Figure A20. Pleasanton aggregate using ASTM C 1260 at 3 days............................................... 71
Figure A21. Pleasanton aggregate using ASTM C 1260 at 7 days............................................... 71
Figure A22. Pleasanton aggregate using ASTM C 1260 at 10 days............................................ 72
Figure A23. Pleasanton aggregate using ASTM C 1260 at 14 days............................................. 72
Figure A24. Pleasanton aggregate using ASTM C 1260 at 21 days............................................. 72
ix

x
LIST OF TABLES
Table 1 Summary of Data from ASTM C 1260 and ASTM C 1293
for All Three Aggregates........................................................................................... 17
Table 2 Summary of Data from ASTM C1293 and Modified ASTM C1293 Using Locally
Available Low-Alkali Cement and Sodium Hydroxide ............................................ 18
Table 3 Comparison of ASTM C 1260, ASTM C 1293, and Field Conditions ..................... 24
Table 4 Assessment of Reactivity of Aggregate per ASTM C 1260 (3)................................ 34
Table 5 Assessment of Reactivity of Aggregate per ASTM C 1293 (4)................................ 35
Table 6 Ages of Specimens from both ASTM Tests at Time of Microscopy Analysis ......... 36
Table 7 Expansion and Assessment of Fine Aggregates for Both ASTM Tests.................... 42
Table 8 Expansion and Assessment for ASTM C 1293 and Modified Version of ASTM C
1293 for Fine Aggregate Fractions............................................................................ 46
xi

xii
EXECUTIVE SUMMARY
A great deal of work on alkali-silica reactivity (ASR) has been reported since1940. ASR
is a reaction in which certain aggregates react with the highly alkaline pore solution of concrete.
As the name of the reaction implies, the reactive aggregate contains silica. However, not all
siliceous aggregates are reactive.
In general, the aggregates that cause harmful reactions in concrete are those containing
amorphous silica (glasses and opal), unstable crystalline polymorphs of silica (cristobalite and
tridymite), poorly crystalline forms of silica (andesite and rhyolite), and microcrystalline quartz-
bearing rocks (quartzite and greywacke). The highly alkaline pore fluids of concrete are able to
depolymerize the reactive silica present in the aggregates, forming products of different
compositions in the concrete pores. In the presence of moisture, the reaction products (gel
products) change in volume and may expand to such a degree that the concrete tensile strength is
reached and the material cracks. The cracks allow water to enter the material, thus affecting its
integrity, and several processes of deterioration may take place.
Alkali-silica reactivity of aggregates in California may create problems if no preventative
measures are used. Some tests used to screen aggregates for potential alkali-silica reactivity are
ASTM C 1260 and ASTM C 1293. Both tests are accelerated test methods, meaning that the tests
put the materials in conditions that increase the rate of reaction compared to the rate at which it
would occur in the field. In some cases, accelerated tests may cause reactions that would not
occur in the field.
ASTM C 1260 is aggressive because of the high temperature and the high concentration
of hydroxide used in the test. A criticism of ASTM C 1260 is that it may classify good
aggregates as reactive. Results are obtained from ASTM C 1260 in 14 days.
13
A more realistic, yet still accelerated test is ASTM C 1293. The lower concentration of
hydroxide and the lower temperature at which the test is run are not as aggressive as the ASTM
C 1260 conditions. ASTM C 1293 is also considered to be more representative of actual field
conditions since the test is performed on concrete specimens, unlike ASTM C 1260, which is
performed on mortar specimens. However, the major drawback of this test is that it requires a
year to complete.
ASTM C 1293 requires high-alkali content cement. This cement was difficult to find in
the Western region of the United States, and had to be shipped from Pennsylvania. In addition to
problems caused by the lack of a readily available local source for this cement, the cost of
shipping such a material from the east coast imposes a substantial cost burden. Because of these
two factors, a replicate set of the experiment was preformed following ASTM C 1293, but with
the substitution of low-alkali cement for high-alkali cement. Sodium hydroxide was added to
increase the cement alkali content to 1.25 percent, which is exactly the same amount that is
required for the unmodified version of ASTM C 1293. The mixing procedures were performed
according to ASTM C 192.
The Partnered Pavement Research Center has previously reported results for several
California cements and aggregates using ASTM C 1260.
Objectives
The objectives of the study described in this report are:
1. Perform ASTM C 1293 laboratory tests on the same aggregates subjected to ASTM C
1260 testing. Compare the results of ASTM C 1260 and ASTM C 1293 and identify
similarities and differences between the two tests for the same set of materials.
14
2. Perform a microstructural study for the reactivity of quartz grains on samples
subjected to the two tests to identify any similarities and differences in the effects of
the different test conditions. Use these results to help to determine whether the
reactions are similar but just occur at different rates, or whether the reactions are
different for the two tests. Two aggregates, one reactive and the other non-reactive,
were used to perform this part of the study.
3. Investigate whether common California cement can be used with the addition of
sodium hydroxide to perform ASTM C 1293 as an alternative to importing the
expensive high-alkali content cement from Pennsylvania.
To achieve these objectives, specimens were prepared using aggregates from four
different sources, and tested using ASTM C 1260, ASTM C 1293, and a modified version of
ASTM C 1293 in which a low-alkali cement was used with added sodium hydroxide. The results
were compared. Microscopy was used to provide greater understanding of the test results.
Aggregates Included in the Study
Aggregates from four different quarries in California were used for this study. These
aggregates are referred to in this report as Aggregates A through D. Aggregates A and C are
from the Bay Area, and Aggregates B and D are from southern California.
For Aggregate A, X-ray diffraction indicated that quartz made up approximately 16
percent of the aggregate, Magnesiohomblende was at 26 percent, and Anorthite was at 58
percent. The following information was obtained from the supplier of Aggregate A regarding its
historical ASR performance:
15
Tests were “performed [using] ASTM C 1260 on aggregates (sand, ½” × No. 4, and 1” × No. 4) from Source A a year ago in order to partially fulfill Caltrans requirements for using < 25 percent fly ash with non-reactive aggregates… [ASTM] C 1260 tests indicated < 0.10 percent expansion.” “There are no documented cases of ASR in concrete containing [Source A] aggregate.”
For Aggregate B, X-ray diffraction indicated that quartz made up approximately 84
percent of the aggregate and Albite was 16 percent. No historical performance history was
obtained from the supplier of Aggregate B.
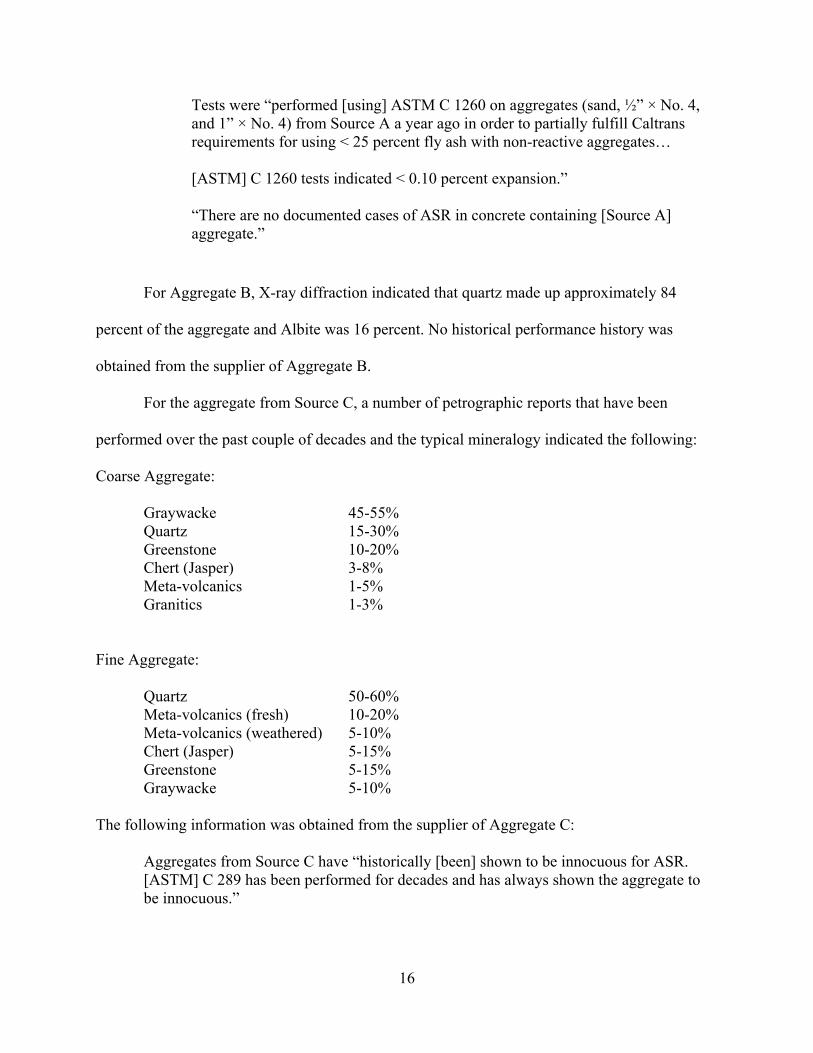
For the aggregate from Source C, a number of petrographic reports that have been
performed over the past couple of decades and the typical mineralogy indicated the following:
Coarse Aggregate:
Graywacke 45-55% Quartz 15-30% Greenstone 10-20% Chert (Jasper) 3-8% Meta-volcanics 1-5% Granitics 1-3%
Fine Aggregate:
Quartz 50-60% Meta-volcanics (fresh) 10-20% Meta-volcanics (weathered) 5-10% Chert (Jasper) 5-15% Greenstone 5-15% Graywacke 5-10%
The following information was obtained from the supplier of Aggregate C:
Aggregates from Source C have “historically [been] shown to be innocuous for ASR. [ASTM] C 289 has been performed for decades and has always shown the aggregate to be innocuous.”
16
ASTM C 1260 had also been preformed for Source C aggregates having results “typically around 0.25 – 0.30 percent expansion at 16 days age.” “In 80 years of operation, [Source C] supplied nearly 250,000,000 tons of aggregate to the Bay Area and there have been no reports of deleterious ASR.”
For Aggregate D, X-Ray diffraction indicated that quartz made up approximately 57
percent of the aggregate and Andesind was 43 percent. Aggregate D was obtained from a new
quarry opened specifically for the concrete pavement project from which the aggregate was
obtained. The aggregate therefore has no previous historical performance record for ASR. The
quarry is expected to be closed at the completion of the project in 2004.
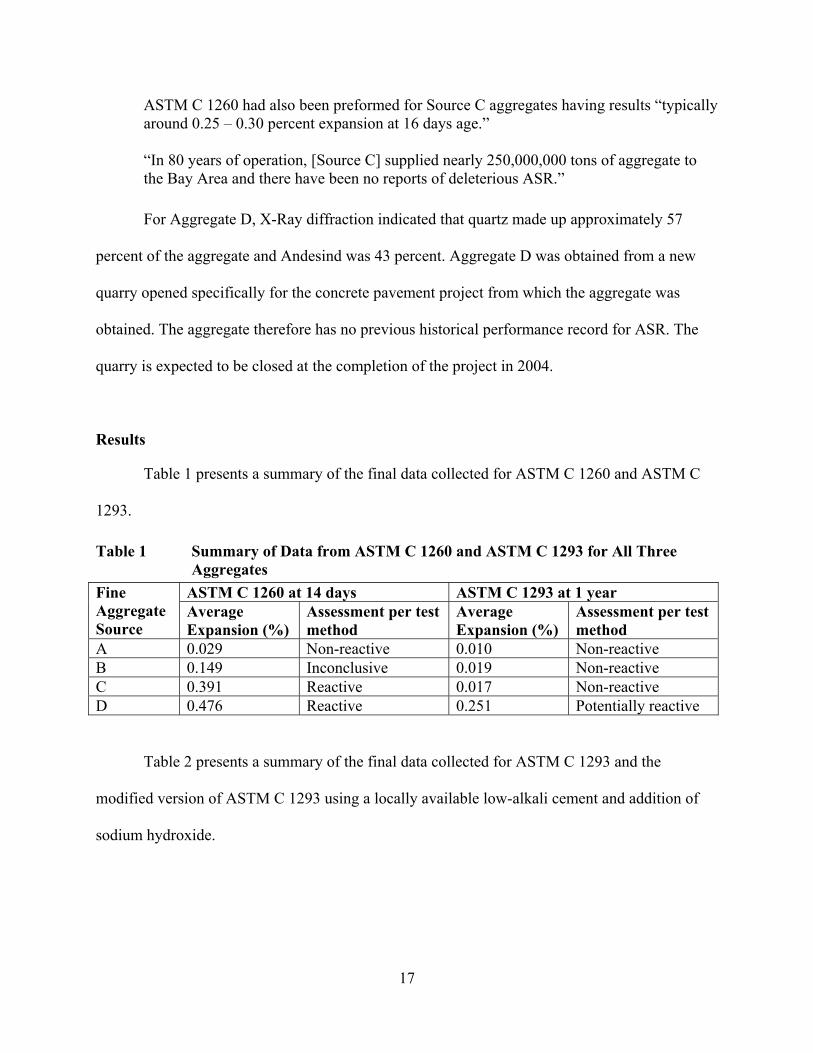
Results
Table 1 presents a summary of the final data collected for ASTM C 1260 and ASTM C
1293.
Table 1 Summary of Data from ASTM C 1260 and ASTM C 1293 for All Three Aggregates
ASTM C 1260 at 14 days ASTM C 1293 at 1 year Fine Aggregate Source
Average Expansion (%)
Assessment per test method
Average Expansion (%)
Assessment per test method
A 0.029 Non-reactive 0.010 Non-reactive B 0.149 Inconclusive 0.019 Non-reactive C 0.391 Reactive 0.017 Non-reactive D 0.476 Reactive 0.251 Potentially reactive
Table 2 presents a summary of the final data collected for ASTM C 1293 and the
modified version of ASTM C 1293 using a locally available low-alkali cement and addition of
sodium hydroxide.
17
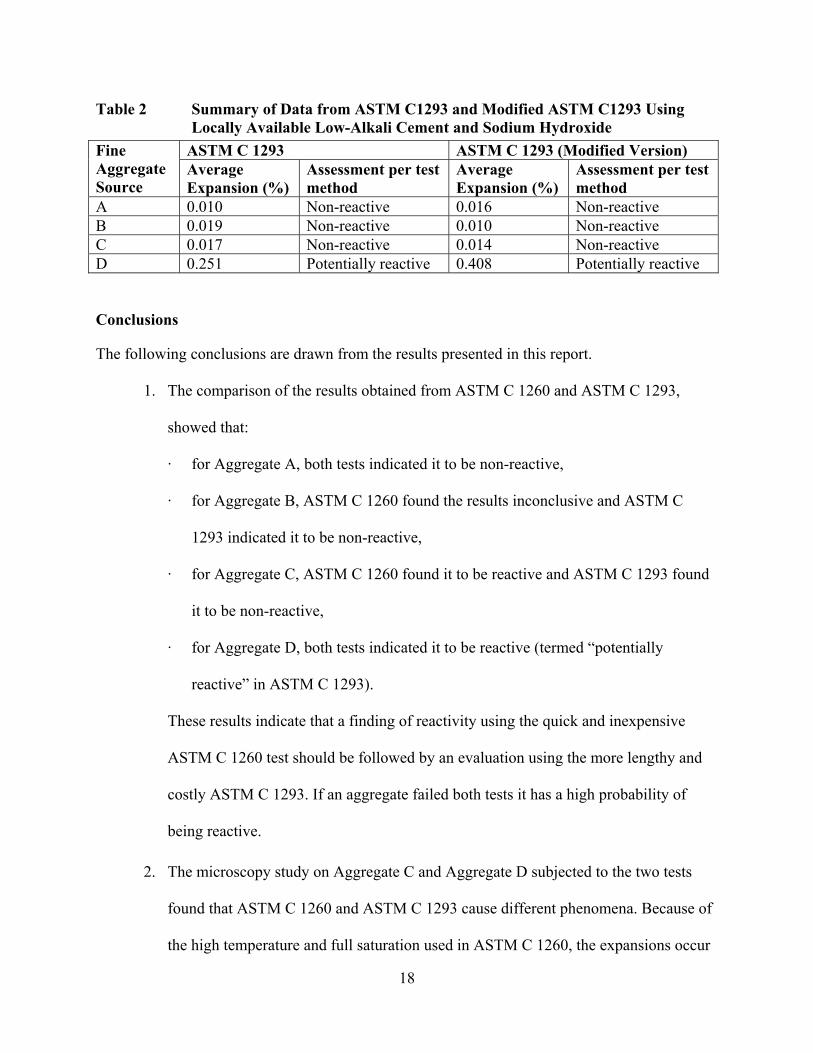
Table 2 Summary of Data from ASTM C1293 and Modified ASTM C1293 Using Locally Available Low-Alkali Cement and Sodium Hydroxide
ASTM C 1293 ASTM C 1293 (Modified Version) Fine Aggregate Source
Average Expansion (%)
Assessment per test method
Average Expansion (%)
Assessment per test method
A 0.010 Non-reactive 0.016 Non-reactive B 0.019 Non-reactive 0.010 Non-reactive C 0.017 Non-reactive 0.014 Non-reactive D 0.251 Potentially reactive 0.408 Potentially reactive
Conclusions
The following conclusions are drawn from the results presented in this report.
1. The comparison of the results obtained from ASTM C 1260 and ASTM C 1293,
showed that:
· for Aggregate A, both tests indicated it to be non-reactive,
· for Aggregate B, ASTM C 1260 found the results inconclusive and ASTM C
1293 indicated it to be non-reactive,
· for Aggregate C, ASTM C 1260 found it to be reactive and ASTM C 1293 found
it to be non-reactive,
· for Aggregate D, both tests indicated it to be reactive (termed “potentially
reactive” in ASTM C 1293).
These results indicate that a finding of reactivity using the quick and inexpensive
ASTM C 1260 test should be followed by an evaluation using the more lengthy and
costly ASTM C 1293. If an aggregate failed both tests it has a high probability of
being reactive.
2. The microscopy study on Aggregate C and Aggregate D subjected to the two tests
found that ASTM C 1260 and ASTM C 1293 cause different phenomena. Because of
the high temperature and full saturation used in ASTM C 1260, the expansions occur
18
in the aggregate, while the low temperatures and lower hydroxyl content of ASTM C
1293 cause cracks to form along the boundary between the aggregate and hardened
cement paste and then propagate through the paste. ASTM C 1260 is a very
aggressive test that may identify an aggregate as reactive even though it may never
react under conditions more typical of those occurring in the field, which is why it is
recommended that a finding of reactivity with this test should be followed by testing
with ASTM C 1293.
3. The investigation regarding the use of the modified version of ASTM C 1293, using a
low-alkali cement with added hydroxide ions, showed that the same conclusion could
be drawn as when the standard test is used. The low-alkali cement also seemed to
intensify the expansion value for the reactive aggregate only.
Recommendations
The following recommendation is based on the conclusions presented
1. It is recommended that the current use of ASTM C 1260 by Caltrans as a tool for
evaluating the reactivity of aggregates, followed by testing with ASTM C 1293 when
an aggregate is found to be reactive by ASTM C 1260, be continued.
2. It is recommended that the investigation regarding the use of low alkalinity cement be
extended to a wider number of aggregates, and if the results show that this
modification of the test works well, that it be adopted by Caltrans in place of the
current standard ASTM test. It is also recommended that this variation of the test be
submitted to ASTM for approval.
19

20
1.0 INTRODUCTION
1.1 Alkali-Silica Reaction
Thomas Stanton, a materials and research engineer for the California State Division of
Highways, today known as the California Department of Transportation (Caltrans), is credited
with the discovery of the alkali-silica reaction (ASR) in 1940.(1) In 1938, he noticed that
concrete pavements and bridges in the Salinas Valley were failing due to cracking caused by
excessive expansion, and set out to perform field and laboratory investigations to find the cause
of the expansion and to prevent its occurrence. An examination of the paving materials showed
that sections of pavement that had failed used aggregate quarried from the bed of the Salinas
River. Other structures in the area that were failing, such as bridges and trestles, also used
aggregate from the Salinas River. Aggregates used in pavements from other areas of California
that showed signs of excessive expansion were also gathered.
Petrographic examination showed that these aggregates were of the same general type,
containing a sizable fraction of shale and chert. Stanton’s laboratory experiments showed the
aggregates to be increasingly reactive when cements with higher alkali (sodium and potassium)
content were used. Stanton concluded from the evidence that a reaction had to be occurring
between the alkali and aggregate. To prove his point, Stanton placed samples of chert into heated
solutions of sodium hydroxide to show the deterioration and dissolution of the rock. Today, this
reaction that occurs between siliceous aggregates used in concrete and concrete pore solution is
known as the alkali-silica reaction (ASR).
A great deal of work on ASR has been reported in the literature since1940. As the
reaction name implies, the reactive aggregate contains silica. However, not all siliceous
21

aggregates are reactive. In general, the aggregates that cause harmful reactions in concrete are
those containing amorphous silica (glasses and opal), unstable crystalline polymorphs of silica
(cristobalite and tridymite), poorly crystalline forms of silica (andesite and rhyolite), and
microcrystalline quartz-bearing rocks (quartzite and greywacke).
Silica exists in a crystalline or in a non-crystalline state. The non-crystalline forms of
silica are often called amorphous silica. The expansion behavior of a concrete element depends
on the type, size, and amount of aggregates containing reactive silica present in the concrete
mixture. As with non-reactive siliceous materials, amorphous silica is composed of silicon
tetrahedra, but it is arranged in such a way as to produce a random three-dimensional network
without regular lattice structures. As a consequence of the absence of an ordered crystalline
arrangement, the structure of amorphous silica is open, with “holes” in the network where
electrical neutrality is not satisfied and the specific surface is large. In contrast, the electrical
neutrality of crystalline silica is satisfied on the surfaces, making it much less reactive. The
reactivity of amorphous silica with aqueous solutions increases as a consequence of the large
area available for reactions to take place.
The highly alkaline pore fluids of concrete are able to depolymerize the reactive silica
present in the aggregates, forming products of different compositions in the concrete pores. In
the presence of moisture, the reaction products (gel products) change in volume and may expand
to such a degree that the concrete tensile strength is reached and the material cracks. Water
entering through the cracks can cause additional processes of deterioration to take place.(2)
1.2 ASTM 1260 and 1293 Accelerated Laboratory Tests for ASR
The alkali-silica reactivity of aggregates in California may create problems if no
preventative measures are used. Some tests used to screen aggregates for potential alkali-silica
22

reactivity are ASTM C 1260 (3) and ASTM C 1293 (4). Both tests are accelerated test methods,
meaning that the tests put the materials in conditions that increase the rate of reaction compared
to the rate at which it would occur in the field. In some cases, accelerated tests may cause
reactions that would not occur in the field.
ASTM C 1260 is aggressive because of the high temperature and the high concentration
of hydroxide used in the test, and a criticism of ASTM C 1260 is that it may classify good
aggregates as reactive. Results are obtained from ASTM C 1260 in 14 days.
A more realistic, yet still accelerated test is ASTM C 1293. One difficulty of performing
ASTM C 1293 in California is that it requires high-alkali cement, which is difficult to obtain in
the state. Cement must therefore be imported from Pennsylvania to perform the test, which is
costly and can cause delays in obtaining test results. A possible alternative investigated in this
study is the addition of sodium hydroxide (NaOH) to the mixing water to obtain the alkali
content required by the test.
Table 3 shows the similarities and differences of ASTM C 1260, ASTM C 1293
(standard and modified), and field conditions. It can be seen in the table that ASTM C 1293 has
less aggressive conditions than ASTM C 1260—a lower concentration of hydroxide is used, and
ASTM C 1293 is run at a lower temperature than ASTM C 1260. ASTM C 1293 is also
performed on concrete specimens, which are more representative of field conditions than the
mortar specimens used with ASTM C 1293. However, the major drawback of ASTM C 1293 is
that it requires a year to complete.
23
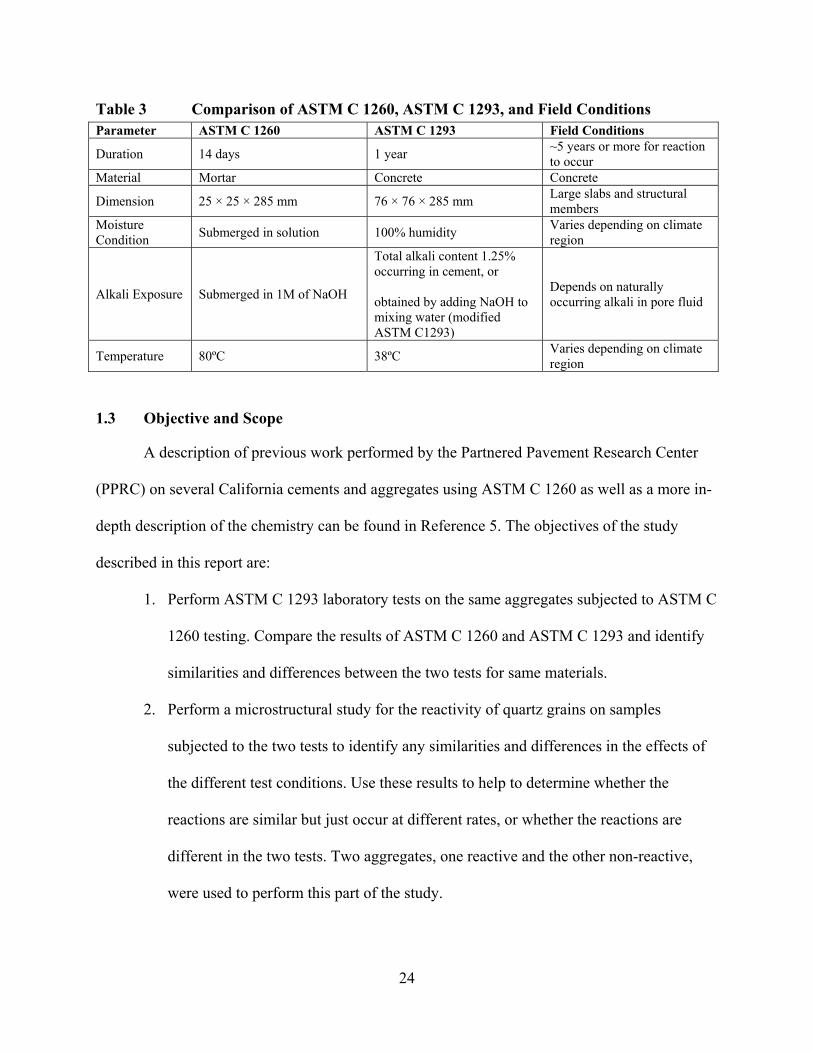
Table 3 Comparison of ASTM C 1260, ASTM C 1293, and Field Conditions Parameter ASTM C 1260 ASTM C 1293 Field Conditions
Duration 14 days 1 year ~5 years or more for reaction to occur
Material Mortar Concrete Concrete
Dimension 25 × 25 × 285 mm 76 × 76 × 285 mm Large slabs and structural members
Moisture Condition Submerged in solution 100% humidity Varies depending on climate
region
Alkali Exposure Submerged in 1M of NaOH
Total alkali content 1.25% occurring in cement, or obtained by adding NaOH to mixing water (modified ASTM C1293)
Depends on naturally occurring alkali in pore fluid
Temperature 80ºC 38ºC Varies depending on climate region
1.3 Objective and Scope
A description of previous work performed by the Partnered Pavement Research Center
(PPRC) on several California cements and aggregates using ASTM C 1260 as well as a more in-
depth description of the chemistry can be found in Reference 5. The objectives of the study
described in this report are:
1. Perform ASTM C 1293 laboratory tests on the same aggregates subjected to ASTM C
1260 testing. Compare the results of ASTM C 1260 and ASTM C 1293 and identify
similarities and differences between the two tests for same materials.
2. Perform a microstructural study for the reactivity of quartz grains on samples
subjected to the two tests to identify any similarities and differences in the effects of
the different test conditions. Use these results to help to determine whether the
reactions are similar but just occur at different rates, or whether the reactions are
different in the two tests. Two aggregates, one reactive and the other non-reactive,
were used to perform this part of the study.
24
3. Investigate whether common California cement can be used with the addition of
sodium hydroxide to perform ASTM C 1293, as an alternative to importing the
expensive high-alkali content cement from Pennsylvania.
To achieve these objectives, specimens were prepared using aggregates from four
different sources, and tested using ASTM C 1260, ASTM C 1293, and a modified version of
ASTM C 1293 in which a low-alkali cement was used with added sodium hydroxide. The results
were compared. Microscopy was used to provide greater understanding of the test results.
25

26

2.0 MATERIALS AND EXPERIMENTAL METHODS
2.1 Description of Aggregates Used for Testing
Aggregates from four different quarries in California were used for this study. These
aggregates are referred to in this report as Aggregates A, B, C, and D. Aggregates A and C are
from the Bay Area, and Aggregates B and D are from Southern California.
Aggregates A, B, and D were characterized using X-ray diffraction to identify their
constitutive minerals. Samples for X-ray diffraction at the end of this study could not be obtained
for Aggregate C because the quarry has been closed since the original aggregate sample was
collected.
2.1.1 Aggregate A
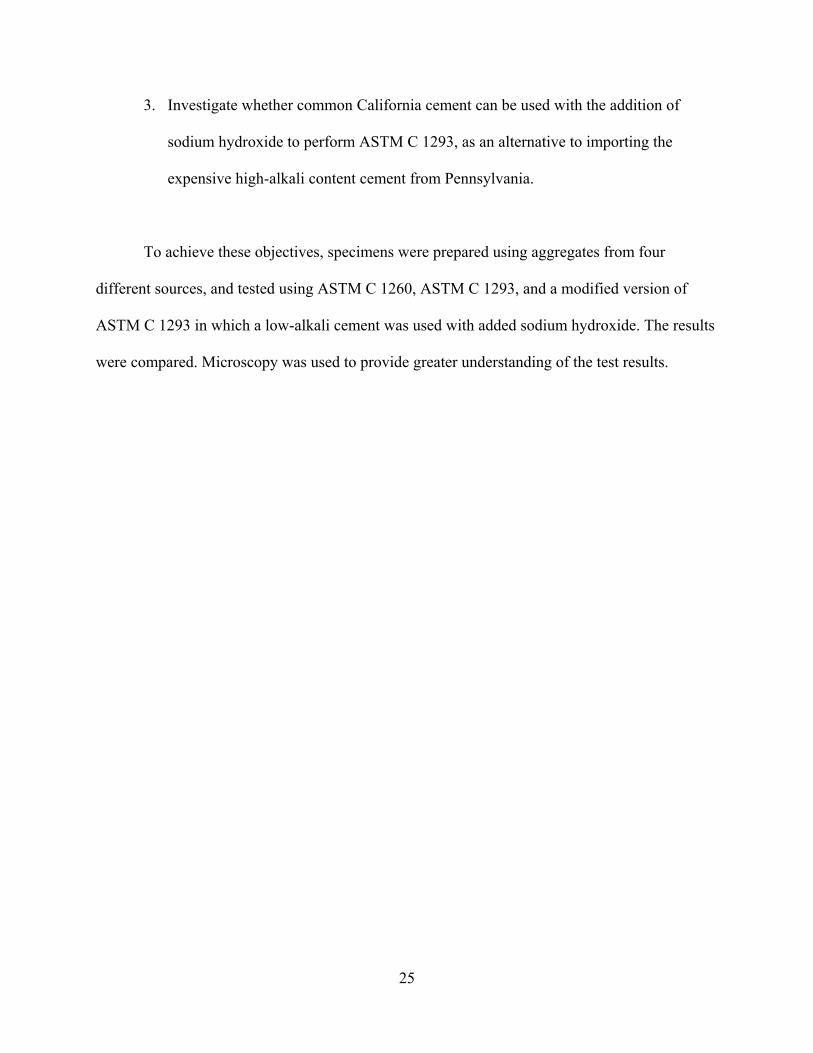
Figure 1 is the plot obtained from X-ray diffraction for Aggregate A. The plot indicates
the primary mineral to be Anorthite followed by Magnesiohomblende and Quartz. Quartz made
up approximately 16 percent of the aggregate, Magnesiohomblende was 26 percent, and
Anorthite was 58 percent.
2.1.2 Aggregate B
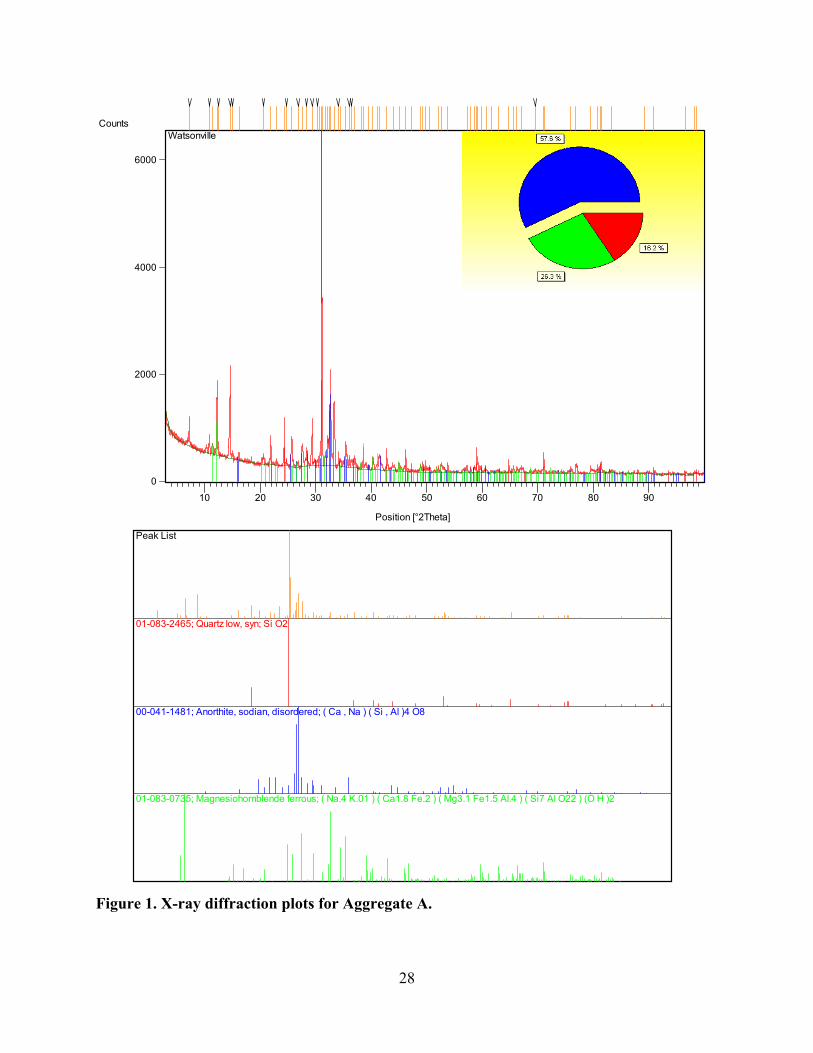
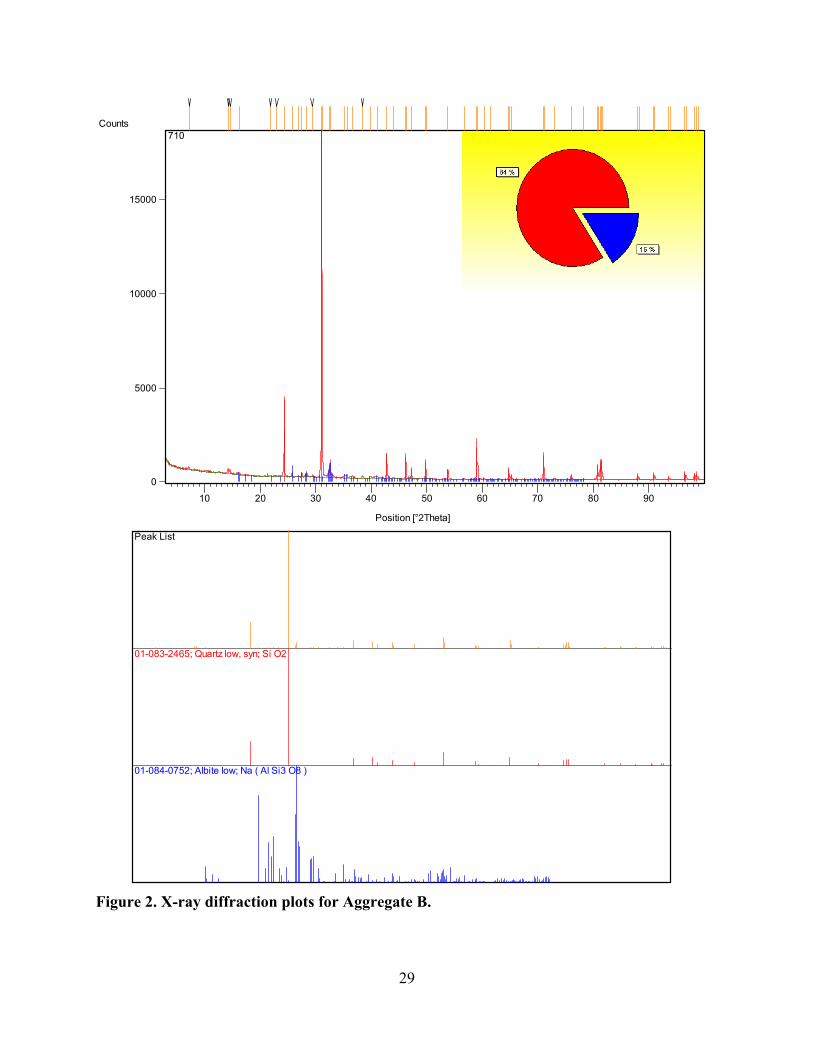
Figure 2 is the plot obtained from X-ray diffraction for Aggregate B. The plot indicates
the primary mineral to be Quartz followed by Albite. Quartz made up approximately 84 percent
of the aggregate and Albite was 16 percent.
27
Position [°2Theta]
10 20 30 40 50 60 70 80 90
Counts
0
2000
4000
6000
Watsonville
Peak List
00-041-1481; Anorthite, sodian, disordered; ( Ca , Na ) ( Si , Al )4 O8
01-083-0735; Magnesiohornblende ferrous; ( Na.4 K.01 ) ( Ca1.8 Fe.2 ) ( Mg3.1 Fe1.5 Al.4 ) ( Si7 Al O22 ) (O H )2
01-083-2465; Quartz low, syn; Si O2
Figure 1. X-ray diffraction plots for Aggregate A.
28
Position [°2Theta]
10 20 30 40 50 60 70 80 90
Counts
0
5000
10000
15000
710
Peak List
01-084-0752; Albite low; Na ( Al Si3 O8 )
01-083-2465; Quartz low, syn; Si O2
Figure 2. X-ray diffraction plots for Aggregate B.
29
2.1.3 Aggregate C
The following information was obtained from the supplier of Aggregate C.
“Aggregate extracted from the Livermore Valley alluvial deposit varies greatly in mineralogy, both with location and depth…a number of petrographic reports have been performed over the past couple of decades and the typical mineralogy is summarized below:
Coarse Aggregate:
Graywacke 45-55% Quartz 15-30% Greenstone 10-20% Chert (Jasper) 3-8% Meta-volcanics 1-5% Granitics 1-3%
Fine Aggregate:
Quartz 50-60% Meta-volcanics (fresh) 10-20% Meta-volcanics (weathered) 5-10% Chert (Jasper) 5-15% Greenstone 5-15% Graywacke 5-10%
2.1.4 Aggregate D
Figure 3 is the plot obtained from X-ray diffraction for Aggregate D. The plot indicates
the primary mineral to be Quartz followed by Andesind. Quartz made up approximately 57
percent of the aggregate and Andesind was 43 percent.
30

Position [°2Theta]
10 20 30 40 50 60 70 80 90
Counts
0
2000
4000
6000
8000 ludlow
Peak List
01-079-1148; Andesine; Na.499 Ca.491 ( Al1.488 Si2.506 O8 )
01-087-2096; Quartz low; Si O2
Figure 3. X-ray diffraction plots for Aggregate D.
31

2.2 Historical Performance
Information on the historical ASR performance of the four different sources was gathered
from the suppliers.
2.2.1 Aggregate A
The following information was obtained from the supplier of Aggregate A:
Tests were “performed [using] ASTM C 1260 on aggregates (sand, ½” × No. 4, and 1” × No. 4) from Source A a year ago in order to partially fulfill Caltrans requirements for using < 25 percent fly ash with non-reactive aggregates… [ASTM] C 1260 tests indicated < 0.10 percent expansion.” “There are no documented cases of ASR in concrete containing [Source A] aggregate.”
2.2.2 Aggregate B
No historical performance could be obtained from the supplier.
2.2.3 Aggregate C
The following information was obtained from the supplier of Aggregate C:
Aggregates from Source C have “historically [been] shown to be innocuous for ASR. [ASTM] C 289 has been performed for decades and has always shown the aggregate to be innocuous.” ASTM C 1260 had also been preformed for Source C aggregates having results “typically around 0.25 – 0.30 percent expansion at 16 days age.” “In 80 years of operation, [Source C] supplied nearly 250,000,000 tons of aggregate to the Bay Area and there have been no reports of deleterious ASR.”
32
2.2.4 Aggregate D
Aggregate D was obtained from a new quarry opened specifically for the concrete
pavement project from which the aggregate was obtained. The aggregate therefore has no
previous historical performance record for ASR. The quarry is expected to be closed at the
completion of the project in 2004.
2.3 Description of Test Methods
2.3.1 ASTM C 1260
ASTM C 1260 is a standardized test used by cement chemists, concrete technologists,
and industry to determine the susceptibility of an aggregate to the alkali-silica reaction (3). The
aggregates that are used in this test are crushed down to sand-size, and graded to the
specification listed in the test. An aggregate/cement ratio of 2.25 is used with a water/cement
ratio of between 0.45 and 0.47 (Ratios are by mass.). Enough mortar is mixed to make three
mortar bars with the dimensions of 25 × 25 × 285 mm. The mortar bars are then cured for 24
hours in a fog room at 23 ± 1.7ºC, demolded, and immersed in water within a closed container.
The container is placed in a water bath maintained at 80ºC. After 24 hours, the length of
the specimens are measured, and then placed back into the container with 1M of sodium
hydroxide solution maintained at 80ºC. The volume of the hydroxide solution is between 3.5 to
4.5 times the volumes of the mortar bars. The specimens are removed briefly from the containers
periodically and measured before significant cooling occurs. The average expansion of the three
mortar bars, after 14 days of immersion in the hydroxide solution, is used to estimate the
reactivity of the aggregate. As illustrated in Table 4, 0.0 to 0.1 percent expansion means that the
33
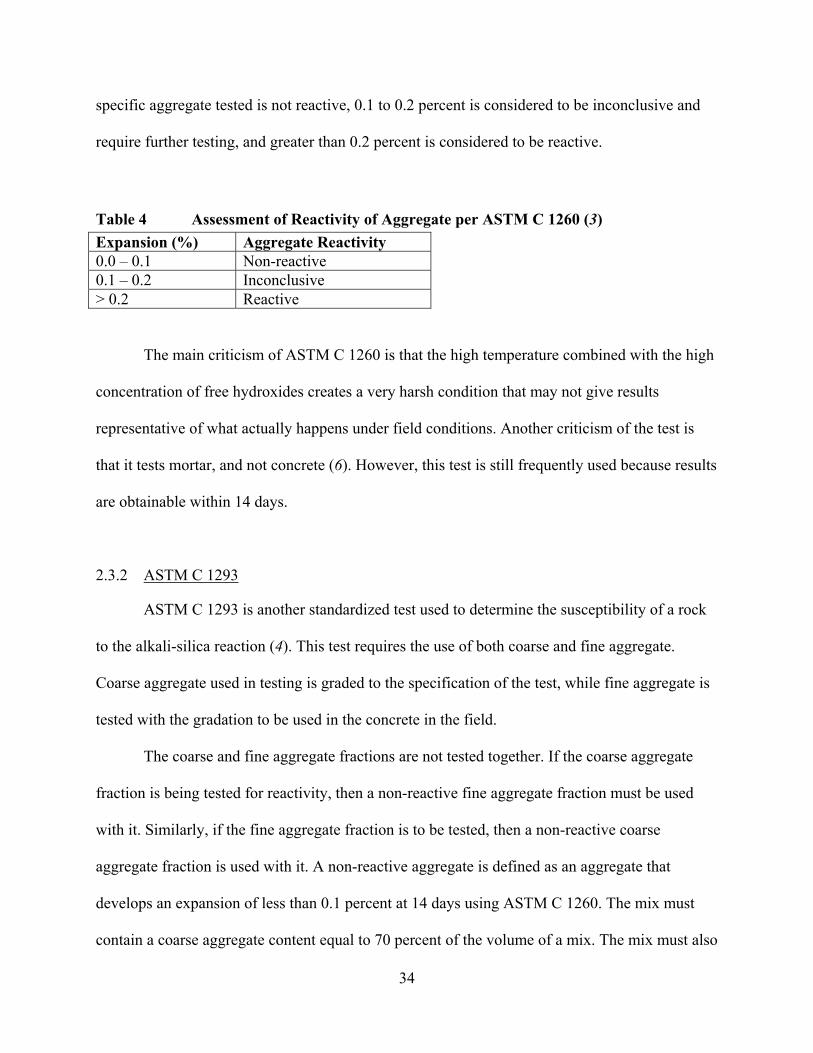
specific aggregate tested is not reactive, 0.1 to 0.2 percent is considered to be inconclusive and
require further testing, and greater than 0.2 percent is considered to be reactive.
Table 4 Assessment of Reactivity of Aggregate per ASTM C 1260 (3) Expansion (%) Aggregate Reactivity 0.0 – 0.1 Non-reactive 0.1 – 0.2 Inconclusive > 0.2 Reactive
The main criticism of ASTM C 1260 is that the high temperature combined with the high
concentration of free hydroxides creates a very harsh condition that may not give results
representative of what actually happens under field conditions. Another criticism of the test is
that it tests mortar, and not concrete (6). However, this test is still frequently used because results
are obtainable within 14 days.
2.3.2 ASTM C 1293
ASTM C 1293 is another standardized test used to determine the susceptibility of a rock
to the alkali-silica reaction (4). This test requires the use of both coarse and fine aggregate.
Coarse aggregate used in testing is graded to the specification of the test, while fine aggregate is
tested with the gradation to be used in the concrete in the field.
The coarse and fine aggregate fractions are not tested together. If the coarse aggregate
fraction is being tested for reactivity, then a non-reactive fine aggregate fraction must be used
with it. Similarly, if the fine aggregate fraction is to be tested, then a non-reactive coarse
aggregate fraction is used with it. A non-reactive aggregate is defined as an aggregate that
develops an expansion of less than 0.1 percent at 14 days using ASTM C 1260. The mix must
contain a coarse aggregate content equal to 70 percent of the volume of a mix. The mix must also
34
contain 420 kg/m3 of cement with an alkali content of 0.9 ± 0.1 percent, using a water/cement
ratio in the range of 0.42 to 0.45 by mass. The remainder of the volume of the mix is composed
of fine aggregate.
A sufficient amount of sodium hydroxide is added to the water used for the concrete mix
to increase the cement alkali content to 1.25 percent. A sufficient amount of mix is needed to
make three 76 × 76 × 285 mm bars. The mixing procedure used for this study followed ASTM C
192 (7). These bars are stored at 23 ± 1.7ºC and at greater than 95 percent relative humidity for
the first 24 hours. The first length reading is taken when the bars are at 24 hours of age.
Afterwards, the bars are stored standing up in airtight containers with 20 ± 5 mm of water in the
bottom of the container. The water cannot touch the bars. The containers are stored at 38 ± 2ºC.
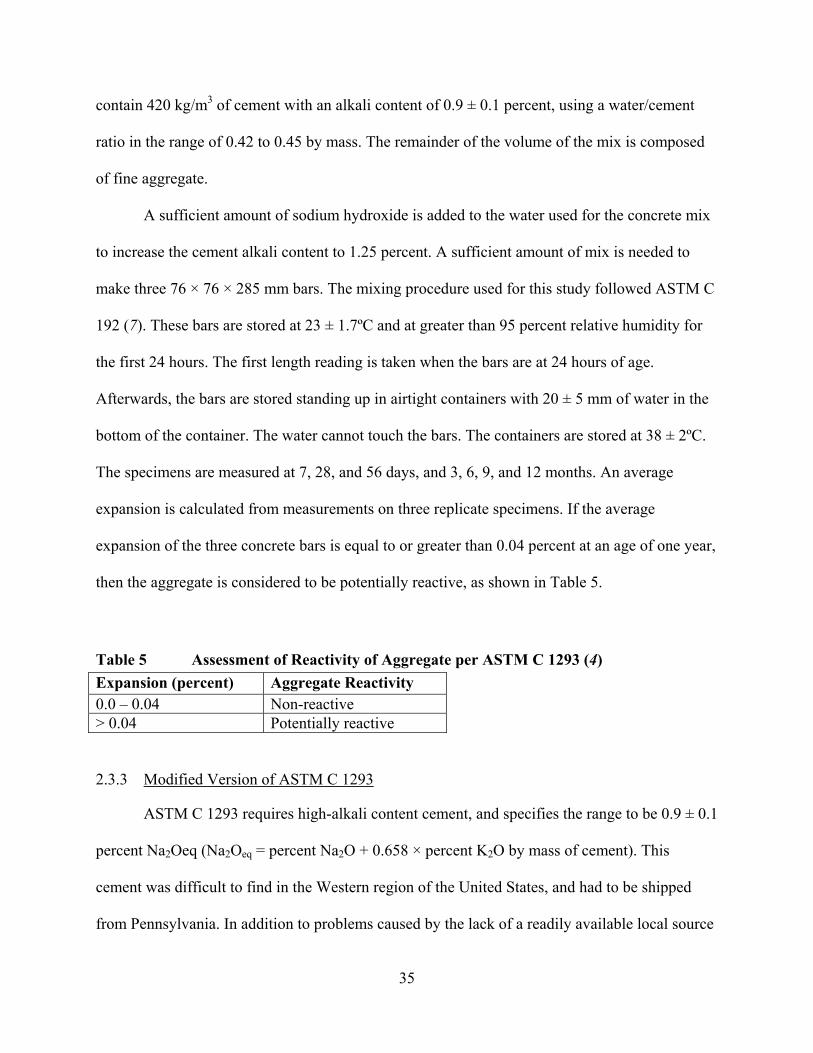
The specimens are measured at 7, 28, and 56 days, and 3, 6, 9, and 12 months. An average
expansion is calculated from measurements on three replicate specimens. If the average
expansion of the three concrete bars is equal to or greater than 0.04 percent at an age of one year,
then the aggregate is considered to be potentially reactive, as shown in Table 5.
Table 5 Assessment of Reactivity of Aggregate per ASTM C 1293 (4) Expansion (percent) Aggregate Reactivity 0.0 – 0.04 Non-reactive > 0.04 Potentially reactive
2.3.3 Modified Version of ASTM C 1293
ASTM C 1293 requires high-alkali content cement, and specifies the range to be 0.9 ± 0.1
percent Na2Oeq (Na2Oeq = percent Na2O + 0.658 × percent K2O by mass of cement). This
cement was difficult to find in the Western region of the United States, and had to be shipped
from Pennsylvania. In addition to problems caused by the lack of a readily available local source
35
for this cement, the cost of shipping the cement from the east coast imposes a substantial cost
burden.
To investigate the potential for using lower alkali cement available locally, a replicate set
of specimens was prepared and tested following ASTM C 1293, but with the substitution of low-
alkali cement for high-alkali cement. Sodium hydroxide was added to increase the cement alkali
content to 1.25 percent, the alkali content required for the unmodified version of ASTM C 1293.
Mixing procedures again followed ASTM C 192.
2.3.4 Types of Cement
Type I/II portland cement was used for both ASTM C 1260 and ASTM C 1293. Low-
alkali Type I/II portland cement containing 0.51 percent Na2Oeq was used for ASTM C 1260.
For ASTM C 1293, high-alkali Type I/II portland cement containing 0.99 percent Na2Oeq was
used. The modified version of ASTM C 1293 used the low-alkali Type I/II portland cement. The
alkali contents for the two cements were supplied by the manufacturers: Hanson Cement
Company for the low-alkali cement and LeHigh Cement Company for the high-alkali cement.
2.3.5 Microscopy
Specimens made using Aggregates C and D and tested following ASTM C 1260 and
ASTM C 1293 were evaluated using microscopy. Microscopy was performed at different stages
of each test, as shown in Table 6.
Table 6 Ages of Specimens from both ASTM Tests at Time of Microscopy Analysis Test Method Specimen Age for Testing ASTM C 1260 1, 3, 7, 10, 14, 21 Days ASTM C 1293 1 and 7 Days, 1, 3, 6, and 12 Months
36
Each specimen was removed at the age given in Table 6, and a cross section with a
thickness of approximately 12.7mm was cut using a rock saw. Samples were then polished using
a round flat spinning table that had alumina and silica particles on the surface. A Scanning
Electron Microscope (SEM) with a backscattered electron probe (Cameca SX-51 microprobe
instrument) was used to prepare backscattered electron images. The accelerating voltage used
was between 10 and 20 KeV with a specimen current of approximately 0.7 × 10⁻⁹E on brass.
The collection time was 150 or 200 seconds with a dead time of approximately 25 percent.
37

38
3.0 RESULTS AND DISCUSSION
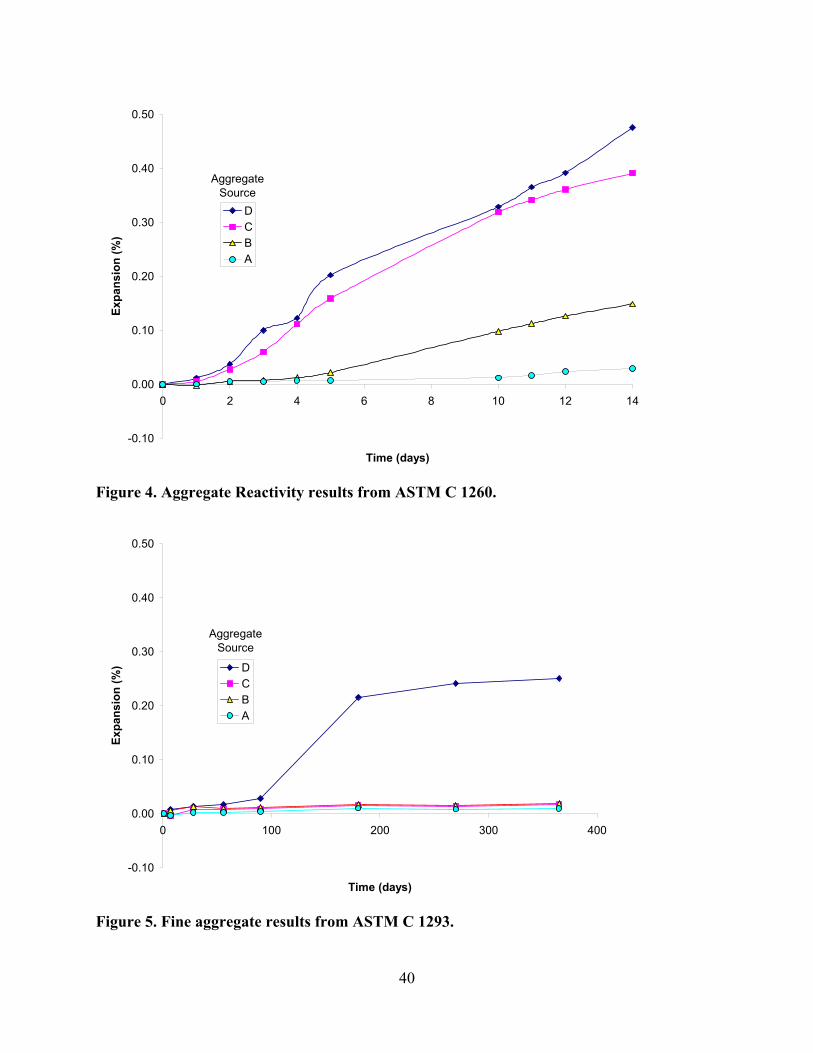
3.1 Comparison of ASTM C 1260 and ASTM C 1293
Figure 4 shows the results from ASTM C 1260 using aggregates from Sources A, B, C,
and D. These results indicate that Aggregates C and D have exceeded the 0.2 percent expansion
criteria set in ASTM C 1260, and therefore these aggregates are considered to be reactive
according to the assessment criteria included in the ASTM test method. Aggregate from Source
B falls in the range of 0.1 and 0.2 percent expansion, and the test would be considered
inconclusive, requiring further testing to determine whether or not the aggregate is reactive. Only
Aggregate A showed an expansion below 0.1 percent, and would be considered non-reactive.
Both coarse and fine aggregates taken from Sources A, B, C, and D were tested following
ASTM C 1293, and the results are shown in Figures 5 and 6. Figures 7 and 8 show data included
in Figures 5 and 6 on a finer scale to look at the aggregates that were below the limit of 0.04
percent expansion. The results indicate that only the fine aggregate from Source D exceeded the
0.04 percent expansion criteria set by ASTM C 1293, and would therefore be considered reactive
by the standards of the ASTM test method.
Table 7 shows a summary of the data collected for both tests. Table 7 does not include
data on the coarse aggregates tested by ASTM C 1293 because they had such small expansions.
For the fine aggregates, ASTM C 1293 showed that only fine aggregates from Source D
is reactive, whereas ASTM C 1260 showed that fine aggregates from Sources C and D were
reactive and results for fine aggregate from Source B are inconclusive. These results illustrate
that the more aggressive test, ASTM C 1293, will potentially identify aggregates as reactive that
are passed by the less aggressive test. The tradeoff is in the time spent testing.
39
-0.10
0.00
0.10
0.20
0.30
0.40
0.50
0 2 4 6 8 10 12
Time (days)
Expa
nsio
n (%
)
14
DCBA
AggregateSource
Figure 4. Aggregate Reactivity results from ASTM C 1260.
-0.10
0.00
0.10
0.20
0.30
0.40
0.50
0 100 200 300 400
Time (days)
Expa
nsio
n (%
) DCBA
AggregateSource
Figure 5. Fine aggregate results from ASTM C 1293.
40
-0.10
0.00
0.10
0.20
0.30
0.40
0.50
0 100 200 300 400
Time (days)
Expa
nsio
n (%
)
DCBA
AggregateSource
Figure 6. Coarse aggregate results from ASTM C 1293.
0.000
0.005
0.010
0.015
0.020
0.025
0 100 200 300 400Time (days)
Expa
nsio
n (%
)
DCBA
AggregateSource
Figure 7. Plot of Fine Aggregate results from ASTM C 1293 on a finer scale.
41
0.000
0.005
0.010
0.015
0.020
0.025
0 100 200 300 400
Time (days)
Expa
nsio
n (%
)
DCBA
AggregateSource
Figure 8. Plot of Coarse Aggregate results from ASTM C 1293 on a finer scale.
Table 7 Expansion and Assessment of Fine Aggregates for Both ASTM Tests
ASTM C 1260 at 14 days ASTM C 1293 at 1 year Fine Aggregate Source
Average Expansion (%)
Assessment per test method
Average Expansion (%)
Assessment per test method
A 0.029 Non-reactive 0.010 Non-reactive B 0.149 Inconclusive 0.019 Non-reactive C 0.391 Reactive 0.017 Non-reactive D 0.476 Reactive 0.251 Potentially reactive
It can also be seen that fine aggregates from Sources B, C, and D are composed of 50 to
84 percent quartz, yet they have significantly different reactivity results from the two ASTM
tests. These results indicate the need for testing to evaluate ASR, and that the mineralogy alone is
not sufficient to identify the risk of ASR. The differences in reactivity are likely related to the
crystalline or non-crystalline organization of the silica, discussed in the introduction of this
report.
42
The results also suggest that for this set of aggregates, the coarse fraction does not
contribute to the expansion and subsequent deterioration of concrete caused by the alkali silica
reaction.
3.2 Comparison of ASTM C 1293 and Modified ASTM C 1293
The results of the modified ASTM C 1293 experiments are shown in Figures 9 and 10.
Figures 11 and 12 are close up plots of Figures 9 and 10 to look at the aggregates that were
below the limit of 0.04 percent.
It can be seen from Figures 10 and 12 that the results for the coarse aggregate fraction
from the modified version of ASTM C 1293 are similar to the results from standard test method.
All four coarse aggregates were well below the expansion limit of 0.04 percent for both tests.
Table 8 summarizes the results from ASTM C 1293 and the modified version of ASTM
C 1293 for the fine aggregate fractions. It can be seen in Table 8 that both versions of the test
resulted in the same ASR risk assessment for the fine aggregate fractions following the ASTM C
1293 guidelines.
Comparison of the results for the fine aggregate fractions between the two versions of the
test in Figures 5 and 9, and in Table 8, reveals that they are nearly identical, except for
Aggregate D. Both versions of the test showed that the Source D fine aggregate exceeded the
expansion limit of 0.04 percent by a wide margin. However, the modified ASTM C 1293 results
showed much greater expansion than the standard test. Although it is difficult to conclusively
determine that the modified version of ASTM C 1293 will produce the same risk assessment as
the standard test based on 3 samples, it appears from these limited results that more readily
available low alkali cement can be used with the addition of hydroxide to obtain the required
43
0.00
0.10
0.20
0.30
0.40
0.50
0 50 100 150 200 250 300 350 400
Time (days)
Expa
nsio
n (%
)
DCBA
AggregateSource
Figure 9. Fine aggregate results from modified version of ASTM C 1293.
0.00
0.10
0.20
0.30
0.40
0.50
0 100 200 300 400Time (days)
Expa
nsio
n (%
)
DCBA
AggregateSource
Figure 10. Coarse aggregate results from modified version of ASTM C 1293.
44
0.000
0.005
0.010
0.015
0.020
0.025
0 50 100 150 200 250 300 350 400
Time (days)
Expa
nsio
n (%
)
DCBA
AggregateSource
Figure 11. Plot of fine aggregate results from modified version of ASTM C 1293 on a finer scale.
0.000
0.005
0.010
0.015
0.020
0.025
0 100 200 300 400Time (days)
Expa
nsio
n (%
)
DCBA
AggregateSource
Figure 12. Plot of coarse aggregate results from modified version of ASTM C 1293 on a finer scale.
45
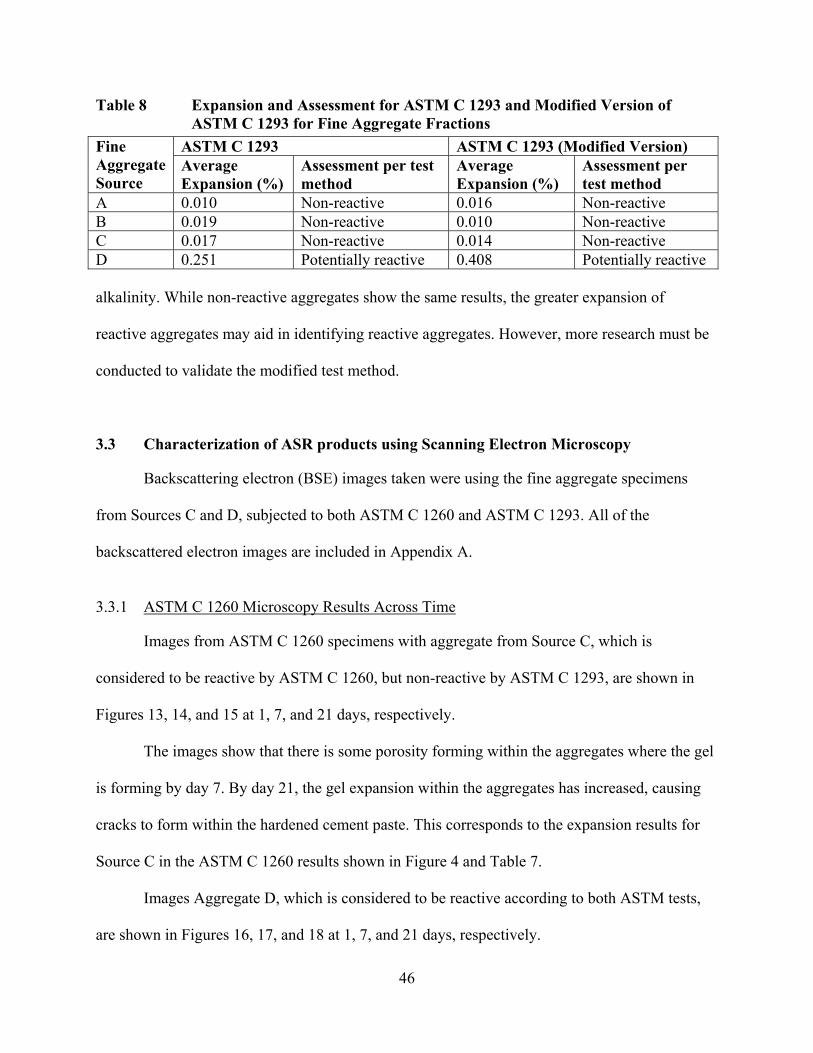
Table 8 Expansion and Assessment for ASTM C 1293 and Modified Version of ASTM C 1293 for Fine Aggregate Fractions
ASTM C 1293 ASTM C 1293 (Modified Version) Fine Aggregate Source
Average Expansion (%)
Assessment per test method
Average Expansion (%)
Assessment per test method
A 0.010 Non-reactive 0.016 Non-reactive B 0.019 Non-reactive 0.010 Non-reactive C 0.017 Non-reactive 0.014 Non-reactive D 0.251 Potentially reactive 0.408 Potentially reactive alkalinity. While non-reactive aggregates show the same results, the greater expansion of
reactive aggregates may aid in identifying reactive aggregates. However, more research must be
conducted to validate the modified test method.
3.3 Characterization of ASR products using Scanning Electron Microscopy
Backscattering electron (BSE) images taken were using the fine aggregate specimens
from Sources C and D, subjected to both ASTM C 1260 and ASTM C 1293. All of the
backscattered electron images are included in Appendix A.
3.3.1 ASTM C 1260 Microscopy Results Across Time
Images from ASTM C 1260 specimens with aggregate from Source C, which is
considered to be reactive by ASTM C 1260, but non-reactive by ASTM C 1293, are shown in
Figures 13, 14, and 15 at 1, 7, and 21 days, respectively.
The images show that there is some porosity forming within the aggregates where the gel
is forming by day 7. By day 21, the gel expansion within the aggregates has increased, causing
cracks to form within the hardened cement paste. This corresponds to the expansion results for
Source C in the ASTM C 1260 results shown in Figure 4 and Table 7.
Images Aggregate D, which is considered to be reactive according to both ASTM tests,
are shown in Figures 16, 17, and 18 at 1, 7, and 21 days, respectively.
46
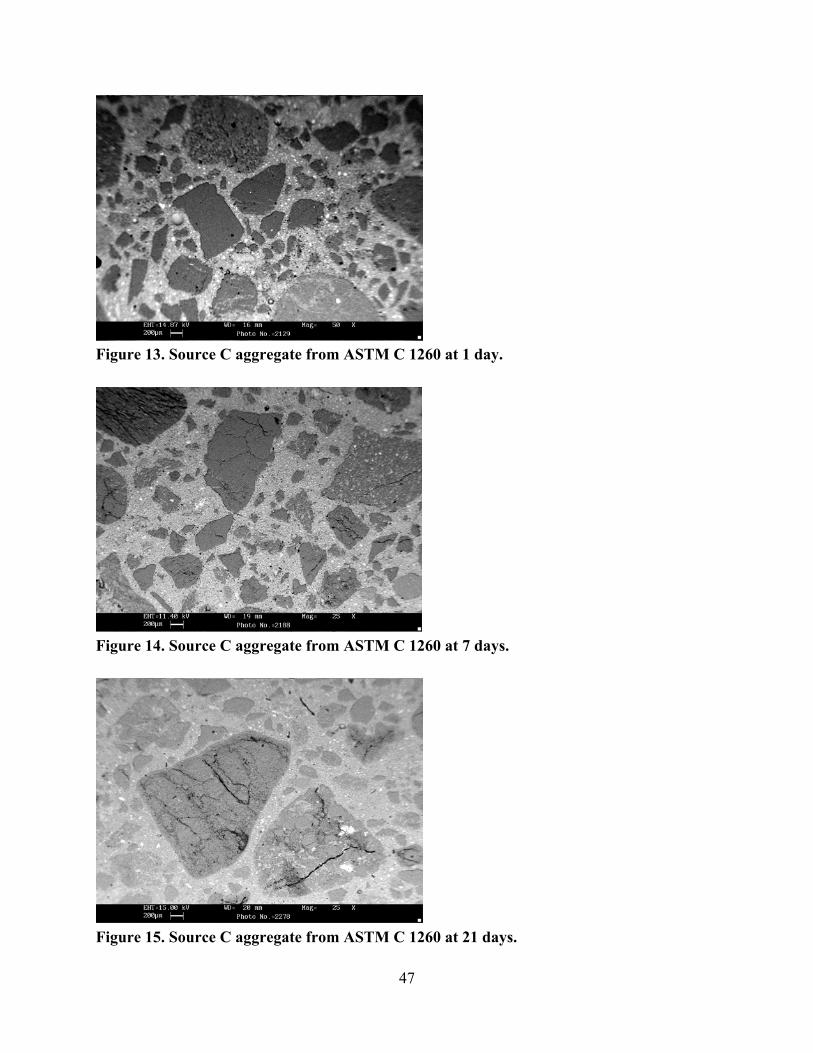
Figure 13. Source C aggregate from ASTM C 1260 at 1 day.
Figure 14. Source C aggregate from ASTM C 1260 at 7 days.
Figure 15. Source C aggregate from ASTM C 1260 at 21 days.
47

Figure 16. Source D aggregate using ASTM C 1260 at 1 day.
Figure 17. Source D aggregate using ASTM C 1260 at 7 days.
Figure 18. Source D aggregate using ASTM C 1260 at 21 days.
48

The Source D images show some porosity and a few cracks in the aggregate by day 7. By
day 21, large cracks can be seen within the aggregate and the cracks have propagated into the
hardened cement paste. The large cracks in the aggregate are probably causing the high
expansion that is seen in the ASTM C 1260 plot (Figure 4). These cracks in the aggregate are
mostly likely due to the high temperature and the fact that the mortar bars are fully saturated with
sodium hydroxide solution in this test.
In ASTM C 1260, the saturation of the specimens in the hydroxyl solutions results in
hydroxyls penetrating the aggregate, reacting with the silica, and reducing the stiffness of the
aggregate allowing the large expansions to occur.
3.3.2 ASTM C 1293 Microscopy Results
Images of Aggregate C are shown in Figures 19, 20, and 21 at 1 day, 90 days, and 12
months, respectively.
Although Source C aggregate is considered non-reactive by ASTM C 1293, the images
reveal many small cracks forming in the aggregate at the end of one year of the test. Cracks also
began propagating into the hardened cement paste in a radial pattern from the edges of the
aggregates. However, the cracks are not sufficient to cause significant expansion, as shown in
Figures 5 and 7, and Table 7.
Images of Source D aggregate are shown in Figures 22, 23, and 24 at 1 day, 90 days, and
12 months, respectively.
49
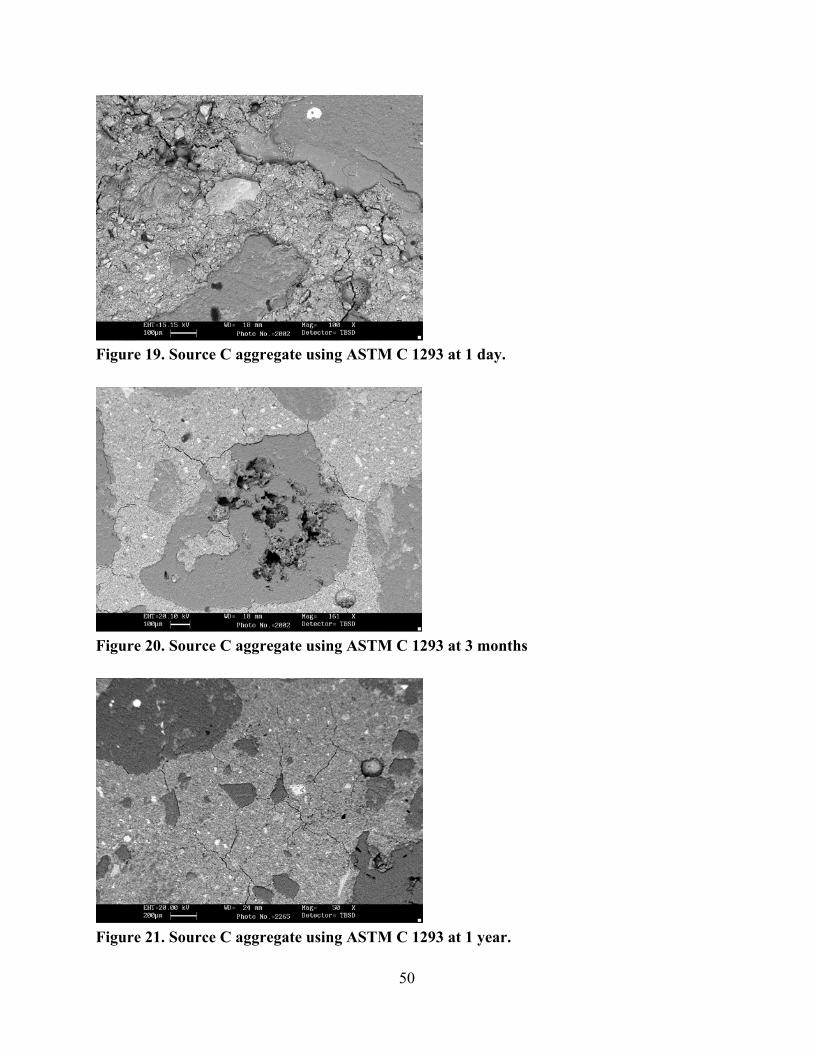
Figure 19. Source C aggregate using ASTM C 1293 at 1 day.
Figure 20. Source C aggregate using ASTM C 1293 at 3 months
Figure 21. Source C aggregate using ASTM C 1293 at 1 year.
50

Figure 22. Source D aggregate using ASTM C 1293 at 1 day.
Figure 23. Source D aggregate using ASTM C 1293 at 3 months.
Figure 24. Source D Aggregate using ASTM C 1293 at 1 year.
51

The same radial cracking pattern seen for Aggregate C could also be seen in Aggregate D
images at three months, but the cracks were much larger and penetrated farther into the hardened
cement paste than for Aggregate C. By 12 months, the cracks were very large and explain the
large expansion seen in Figure 5 and Table 7.
In ASTM C 1293, the hydroxyls are present in the pore solutions of the cement paste, and
are in contact with the aggregates at the interfaces between the aggregates and the paste. The
expansions therefore occurred in the hardened cement paste and not within the aggregate, and
hydroxyls were not easily transported to the surface of the aggregate to continue the reaction
unless large cracks formed. The reactions began on the surface of the aggregate and the gel
formation expanded into the hardened cement paste. In addition, reactions occurred at a slower
rate in ASTM C 1293 compared to ASTM C 1260 because of the lower temperature.
3.3.3 Comparison of Microscopy Results for ASTM C 1260 and C 1293 at Common Times
Source D aggregate, the more potentially reactive aggregate according to both tests, was
looked at for a comparison of ASTM C 1260 and 1293. Figures 25 through 30 show images at 1,
7, and 21 days for ASTM C 1260 and 1, 7, and 28 days for ASTM 1293.
The day 1 image from ASTM C 1260 shows no cracks formed, but ASTM C 1293 shows
cracks along the boundary of the aggregates. At 7 days, images from ASTM C 1260 show many
cracks forming within the aggregate, while images from ASTM C 1293 show cracks formed
along the boundary of the aggregates. At 21 days, images from ASTM C 1260 show expansion
occurring mostly from within the aggregate. At 28 days, images from ASTM C 1293 show radial
cracking occurring from the interface between the aggregate and paste and extending into the
hardened cement paste.
52

Figure 25. Source D aggregate using ASTM C 1260 at 1 day.
Figure 26. Source D aggregate using ASTM C 1260 at 7 days.
Figure 27. Source D aggregate using ASTM C 1260 at 21 days.
53

Figure 28. Source D aggregate using ASTM C 1293 at 1 day.
Figure 29. Source D aggregate using ASTM C 1293 at 7 days.
Figure 30. Source D aggregate using ASTM C 1293 at 1 month.
54
These images indicate that the two ASTM tests cause different phenomena. In ASTM C
1260, saturation with hydroxyl solution permits hydroxyl to penetrate the aggregates and cause
reactions, cracking, and expansion within the aggregates which propagates into the paste. A
constant supply of hydroxyl is available to continue the reaction. In ASTM C 1293, hydroxyl is
only present in the pore solutions and at the edges of the aggregate. Cracking and expansion only
occur from the edges of the aggregate propagating into the paste.
55

56
4.0 CONCLUSION AND RECOMMENDATIONS
4.1 Conclusions
The following conclusions are drawn from the results presented in this report.
1. The comparison of the results obtained from ASTM C 1260 and ASTM C 1293,
showed that:
· for Aggregate A, both tests indicated it to be non-reactive,
· for Aggregate B, ASTM C 1260 found the results inconclusive and ASTM C
1293 indicated it to be non-reactive,
· for Aggregate C, ASTM C 1260 found it to be reactive and ASTM C 1293 found
it to be non-reactive,
· for Aggregate D, both tests indicated it to be reactive (termed “potentially
reactive” in ASTM C 1293).
The results indicate that a finding of reactivity using the quick and inexpensive
ASTM C 1260 test should be followed by an evaluation using the more lengthy and
costly ASTM C 1293. If an aggregate fails both tests, it has a high probability of
being reactive.
2. The microscopy study on samples from Sources C and D subjected to the two tests
found that ASTM C 1260 and ASTM C 1293 cause different phenomena. Because of
the high temperature and full saturation used in ASTM C 1260, the expansions occur
in the aggregate, while the low temperatures and lower hydroxyl content of ASTM C
1293 cause cracks to form along the boundary between the aggregate and hardened
cement paste and then propagate through the paste. ASTM C 1260 is a very
aggressive test that may identify an aggregate as reactive even though it may never
57
react under conditions more typical of those occurring in the field, which is why it is
recommended that a finding of reactivity with this test should be followed by testing
with ASTM C 1293.
3. The investigation regarding the use of the modified version of ASTM C 1293 (using a
low-alkali cement with added hydroxide ions), showed that the same conclusion
could be drawn as when the standard test is used. The low alkali cement also seemed
to intensify the expansion value for the reactive aggregate only.
4.2 Recommendations
The following recommendation is based on the conclusions presented
1. Caltrans currently uses ASTM C 1260 as a tool for evaluating the reactivity of
aggregates, followed by testing with ASTM C 1293 when an aggregate is found to be
reactive by ASTM C 1260. It is recommended that this practice be continued.
2. It is recommended that the investigation regarding the use of low alkalinity cement in
combination with added hydroxide ions be extended to a wider number of aggregates,
and that if the results show that this modification of the test works well, that it be
adopted by Caltrans in place of the current standard ASTM test. It is also
recommended that this variation of the test be submitted to ASTM for approval.
58
5.0 REFERENCES
1. Stanton, T. E. “Expansion of Concrete Through Reaction Between Cement and Aggregate.” Proceedings of the ASCE, 66, 1781-1812, 1940.
2. Mehta, P. Kumar and Monteiro, Paulo J. M. Concrete: Microstructure, Properties, and Materials. Second Edition. McGraw-Hill Companies, Inc. San Francisco, California. 1993.
3. American Society for Testing and Materials. “Standard Test Method for Potential Alkali Reactivity of Aggregates (Mortar-Bar Method), ASTM C 1260-01.” Annual Book of ASTM Standards, Vol. 04.02, Philadelphia, 2002.
4. American Society for Testing and Materials. “Standard Test Method for Determination of Length Change of Concrete Due to Alkali-Silica Reaction, ASTM C 1293-01.” Annual Book of ASTM Standards, Vol. 04.02, Philadelphia, 2002.
5. Shomglin, K., Monteiro, P., and Harvey, J. “Accelerated Laboratory Testing for High Early Strength Concrete for Alkali Aggregate Reaction.” Draft report prepared for the California Department of Transportation. Pavement Research Center, Institute of Transportation Studies, University of California, Berkeley. 2001.
6. Hobbs, D. W. Alkali-Silica Reaction in Concrete. Thomas Telford Ltd., London, 1988.
7. American Society for Testing and Materials. “Standard Practice for Making and Curing Concrete Test Specimens in the Laboratory, ASTM C 192/C 192M-00.” Annual Book of ASTM Standards, Vol. 04.02, Philadelphia, 2002.
59

60

APPENDIX A
Source D: ASTM C 1293
61
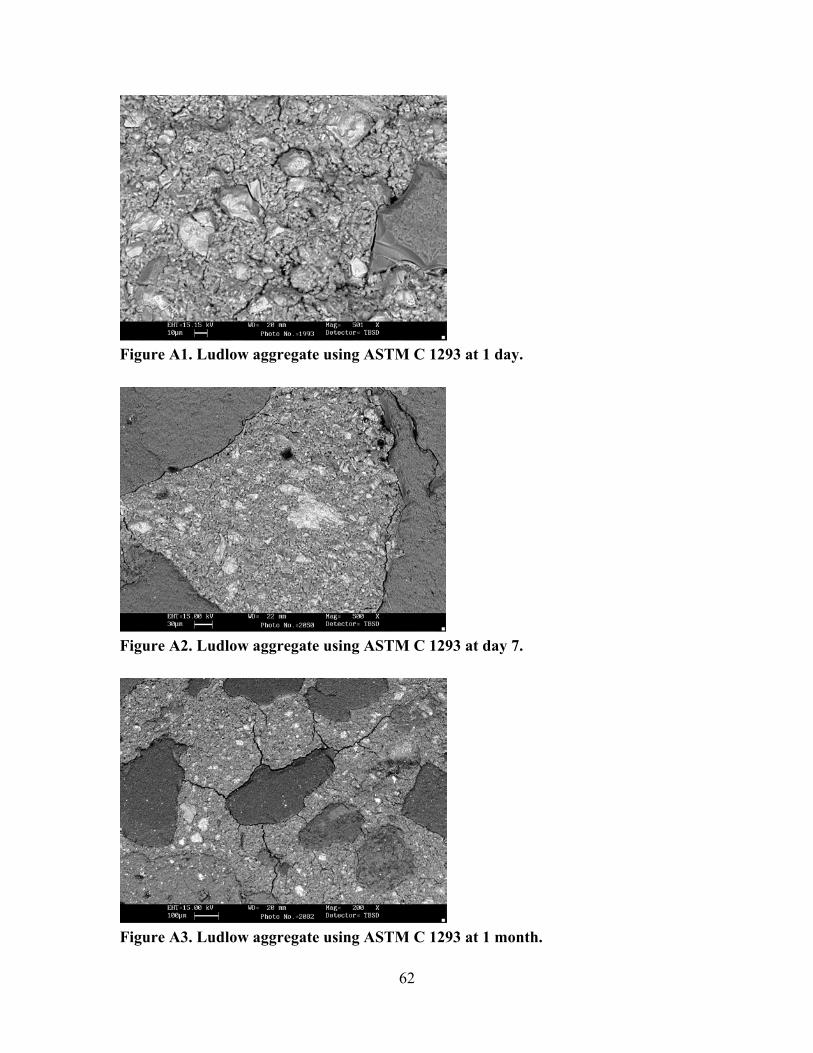
Figure A1. Ludlow aggregate using ASTM C 1293 at 1 day.
Figure A2. Ludlow aggregate using ASTM C 1293 at day 7.
Figure A3. Ludlow aggregate using ASTM C 1293 at 1 month.
62
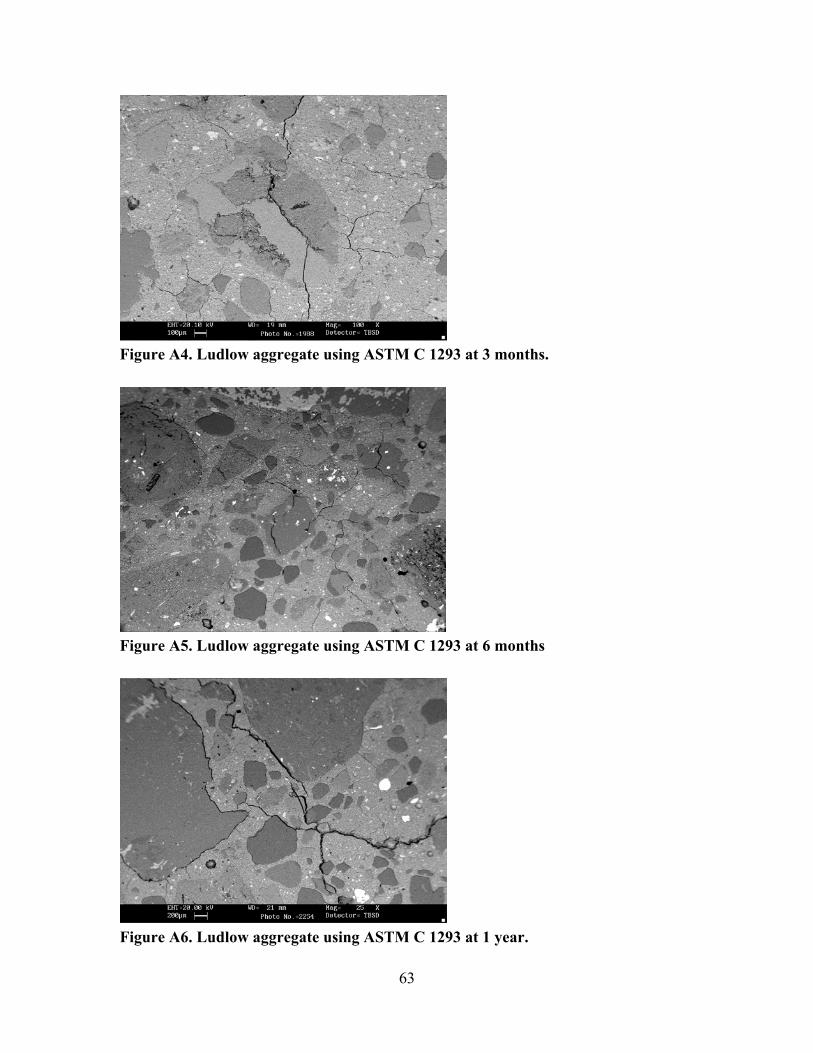
Figure A4. Ludlow aggregate using ASTM C 1293 at 3 months.
Figure A5. Ludlow aggregate using ASTM C 1293 at 6 months
Figure A6. Ludlow aggregate using ASTM C 1293 at 1 year.
63

Source D: ASTM C 1260
64

Figure A7. Ludlow aggregate using ASTM C 1260 at 1 day.
Figure A8. Ludlow aggregate using ASTM C 1260 at 3 days.
Figure A9. Ludlow aggregate using ASTM C 1260 at 7 days.
65

Figure A10. Ludlow aggregate using ASTM C 1260 at 10 days.
Figure A11. Ludlow aggregate using ASTM C 1260 at 14 days.
Figure A12. Ludlow aggregate using ASTM C 1260 at 21 days.
66

Source C: ASTM C 1293
67

Figure A13. Pleasanton aggregate using ASTM C 1293 at 1 day.
Figure A14. Pleasanton aggregate using ASTM C 1293 at 7 days.
Figure A15. Pleasanton aggregate using ASTM C 1293 at 1 month.
68
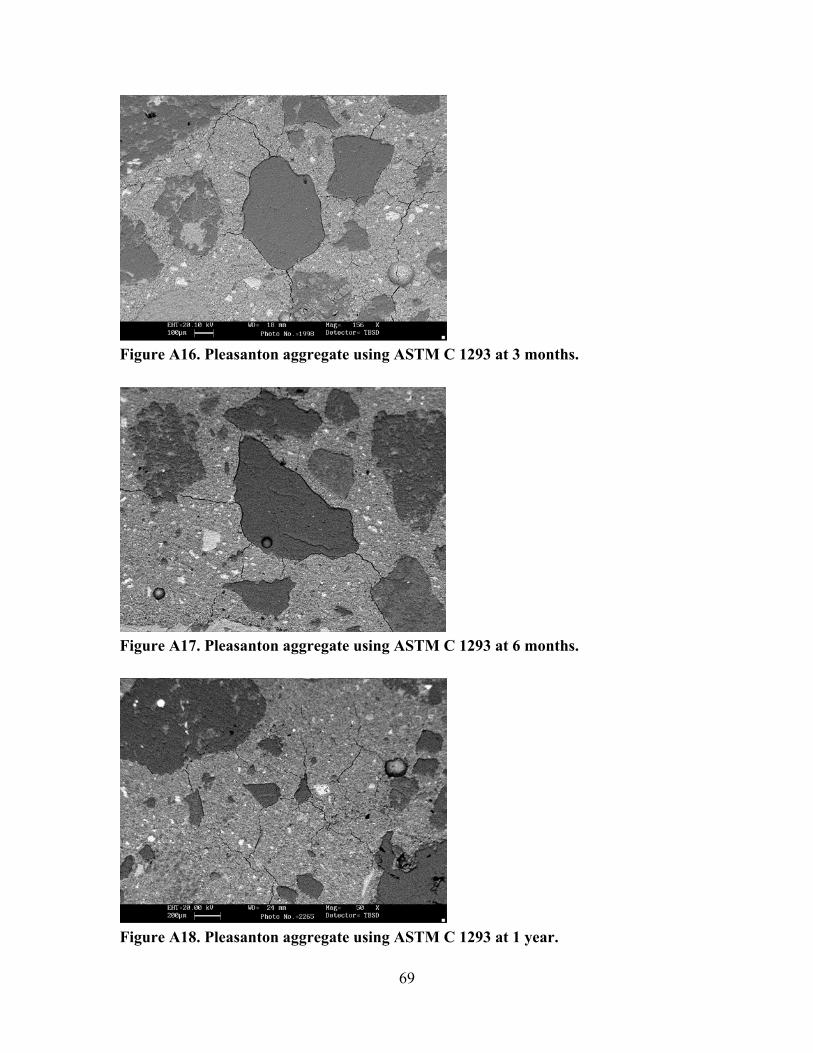
Figure A16. Pleasanton aggregate using ASTM C 1293 at 3 months.
Figure A17. Pleasanton aggregate using ASTM C 1293 at 6 months.
Figure A18. Pleasanton aggregate using ASTM C 1293 at 1 year.
69

Source C: ASTM C 1260
70

Figure A19. Pleasanton aggregate using ASTM C 1260 at 1 day.
Figure A20. Pleasanton aggregate using ASTM C 1260 at 3 days.
Figure A21. Pleasanton aggregate using ASTM C 1260 at 7 days.
71
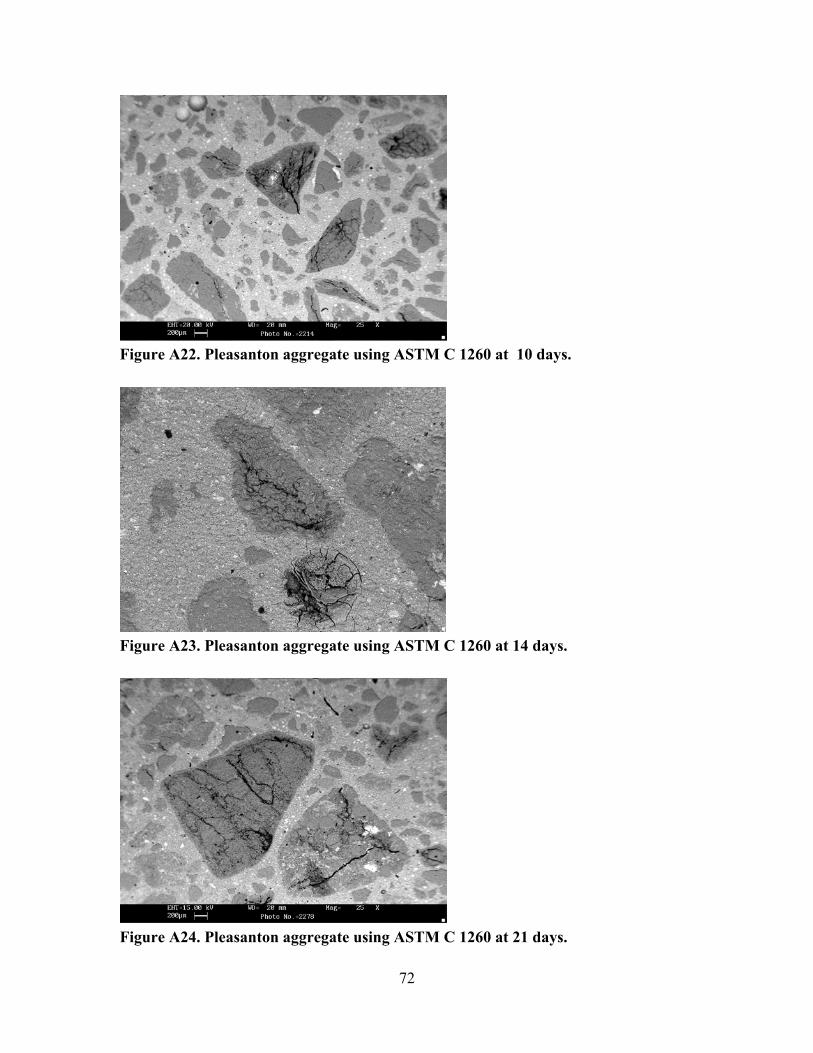
Figure A22. Pleasanton aggregate using ASTM C 1260 at 10 days.
Figure A23. Pleasanton aggregate using ASTM C 1260 at 14 days.
Figure A24. Pleasanton aggregate using ASTM C 1260 at 21 days.
72