accelerated growth in revenues and adjusted ... - orange.com · success of orange money, with its...
TRANSCRIPT
Press releaseParis, 21 February 2018
2017 earnings
Accelerated growth in revenues and adjusted EBITDA and return to growth in Operating Cash Flow*
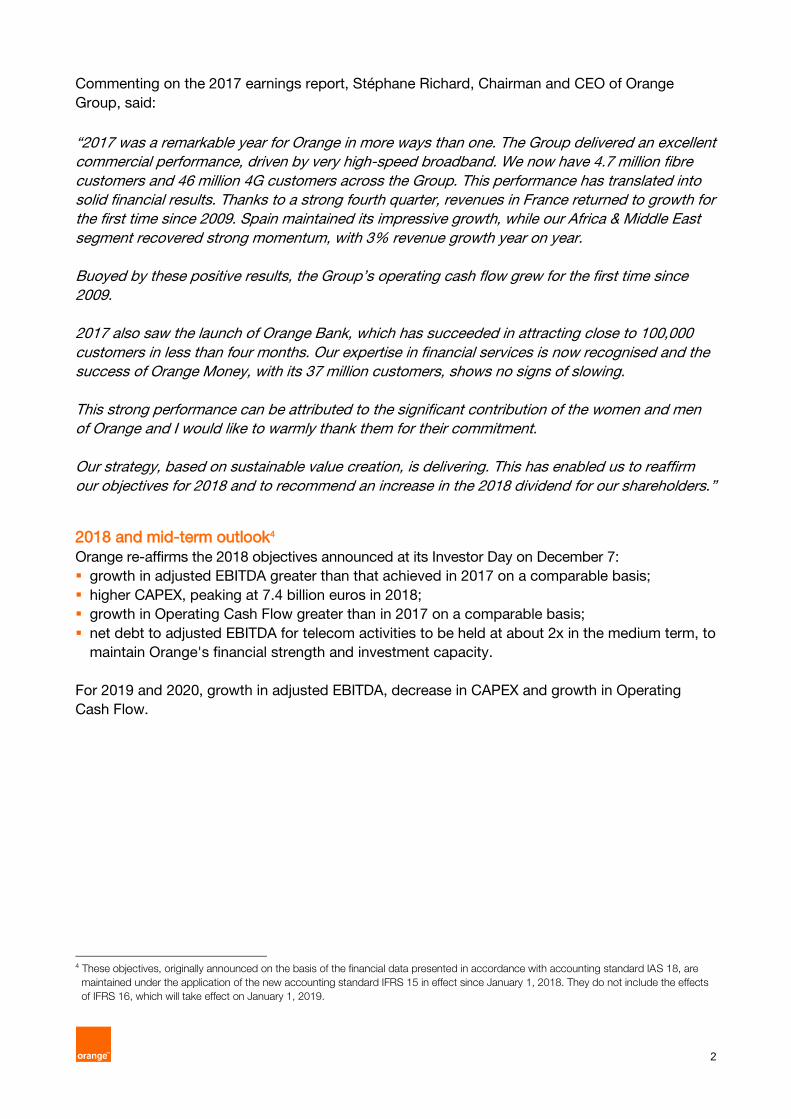
2017 2016 2016 change change
In millions of euros comparable
basis
historical
basis
comparable
basis
historical
basis
Revenues 41,096 40,593 40,918 1.2 % 0.4 %
Adjusted EBITDA 12,819 12,538 12,682 2.2 % 1.1 %
Operating Income 4,917 4,077 20.6 %
Consolidated net income of continuing operations 2,114 1,010
CAPEX (excluding licences) 7,209 6,974 6,971 3.4 % 3.4 %
Operating Cash Flow 5,610 5,564 5,711 0.8 % (1.8)%
Orange’s revenues and adjusted EBITDA grew for the second consecutive year in 2017, while
Operating Cash Flow grew for the first time since 2009*.
In France, revenue grew for the first time since 2009, up 0.6%;
In Spain, record growth rates achieved, with revenues up 7.1% and adjusted EBITDA up
17.0%*;
In Africa & the Middle East, revenue growth accelerated to 3.0%*.
This momentum was underpinned by an excellent operational performance in the fourth quarter.
A record quarter in fibre with 164,000 net sales in France and 175,000 in Spain;
Orange France recorded 212,000 net sales of mobile contracts1 in the fourth quarter;
approximately double the fourth quarter of 2016, continuing the excellent sales trend of the
third quarter;
Steady growth of retail convergence offers in France and the Europe segment with 10.3 million
customers at the end of 2017, up 11.1% on the year;
Successful launch of Orange Bank with 55,000 accounts opened by 2017 year-end.
2017 CAPEX of 7.2 billion euros supported our strategy of differentiation through investment in
our network quality and customer experience. At December 31, 2017, 26.6 million homes were
potentially connectable to high-speed broadband2, and 4G was rolled out in three new countries,
bringing the total to 21 countries.
With confidence in the momentum and financial strength across the Group, the Board of Directors
confirms the payment of a 0.65 euro dividend for fiscal year 20173 and will propose at the 2019
Annual General Meeting of Shareholders a dividend payment of 0.70 euro per share for the 2018
fiscal year. The 5 euro cents increase in dividend will be reflected in the interim dividend (0.30euro
per share), which is payable in December 2018.
* Data on a comparable basis. 1 Excluding machine to machine 2 Download speeds greater than or equal to 100 Mbps. 3 Subject to the approval of the Annual General Meeting of Shareholders.
2
Commenting on the 2017 earnings report, Stéphane Richard, Chairman and CEO of Orange
Group, said:
“2017 was a remarkable year for Orange in more ways than one. The Group delivered an excellent commercial performance, driven by very high-speed broadband. We now have 4.7 million fibre customers and 46 million 4G customers across the Group. This performance has translated into solid financial results. Thanks to a strong fourth quarter, revenues in France returned to growth for the first time since 2009. Spain maintained its impressive growth, while our Africa & Middle East segment recovered strong momentum, with 3% revenue growth year on year. Buoyed by these positive results, the Group’s operating cash flow grew for the first time since 2009. 2017 also saw the launch of Orange Bank, which has succeeded in attracting close to 100,000 customers in less than four months. Our expertise in financial services is now recognised and the success of Orange Money, with its 37 million customers, shows no signs of slowing. This strong performance can be attributed to the significant contribution of the women and men of Orange and I would like to warmly thank them for their commitment. Our strategy, based on sustainable value creation, is delivering. This has enabled us to reaffirm our objectives for 2018 and to recommend an increase in the 2018 dividend for our shareholders.”
2018 and mid-term outlook4 Orange re-affirms the 2018 objectives announced at its Investor Day on December 7:
growth in adjusted EBITDA greater than that achieved in 2017 on a comparable basis;
higher CAPEX, peaking at 7.4 billion euros in 2018;
growth in Operating Cash Flow greater than in 2017 on a comparable basis;
net debt to adjusted EBITDA for telecom activities to be held at about 2x in the medium term, to
maintain Orange's financial strength and investment capacity.
For 2019 and 2020, growth in adjusted EBITDA, decrease in CAPEX and growth in Operating
Cash Flow.
4 These objectives, originally announced on the basis of the financial data presented in accordance with accounting standard IAS 18, are
maintained under the application of the new accounting standard IFRS 15 in effect since January 1, 2018. They do not include the effects
of IFRS 16, which will take effect on January 1, 2019.

3
Key figures
Full year data
2017 2016 2016 change change
In millions of euros comparable
basis
historical
basis
comparable
basis
historical
basis
Revenues 41,096 40,593 40,918 1.2 % 0.4 %
Of which :
France 18,052 17,945 17,945 0.6 % 0.6 %
Europe 11,026 10,614 10,541 3.9 % 4.6 %
Spain 5,371 5,014 5,014 7.1 % 7.1 %
Poland 2,674 2,711 2,644 (1.4)% 1.1 %
Belgium & Luxembourg 1,251 1,242 1,242 0.8 % 0.8 %
Central European countries 1,749 1,654 1,648 5.7 % 6.2 %
Intra-Europe eliminations (19) (7) (7) - -
Africa & Middle East 5,030 4,881 5,245 3.0 % (4.1)%
Enterprise 7,252 7,323 7,353 (1.0)% (1.4)%
International Carriers & Shared Services 1,651 1,806 1,812 (8.6)% (8.9)%
Intra-Group eliminations (1,915) (1,976) (1,978) - -
Adjusted EBITDA* 12,819 12,538 12,682 2.2 % 1.1 %
of which telecom activities 12,880 12,573 12,694 2.4 % 1.5 %
As % of revenues 31.3 % 31.0 % 31.0 % 0.4 pt 0.3 pt
France 6,901 6,808 6,806 1.4 % 1.4 %
Europe 3,138 2,967 2,944 5.8 % 6.6 %
Spain 1,582 1,351 1,349 17.0 % 17.2 %
Poland 707 743 725 (4.8)% (2.4)%
Belgium & Luxembourg 302 316 316 (4.3)% (4.3)%
Central European countries 547 557 554 (1.7)% (1.2)%
Africa & Middle East 1,612 1,506 1,658 7.0 % (2.8)%
Enterprise 1,307 1,337 1,342 (2.3)% (2.7)%
International Carriers & Shared Services (78) (45) (56) (81.8)% (39.5)%
of which Orange Bank (62) (35) (12) - -
Operating Income 4,917 4,077 20.6%
of which telecom activities 5,009 3,992 25.5%
of which Orange Bank (93) 85 -
Consolidated net income of continuing operations 2,114 1,010
Consolidated net income of discontinued operations
(EE) 29 2,253
Consolidated net income 2,143 3,263
Net income attributable to equity owners of the Group 1,906 2,935
CAPEX (excluding licences) 7,209 6,974 6,971 3.4 % 3.4 %
of which telecom activities 7,148 6,959 6,956 2.7 % 2.8 %
As % of revenues 17.4 % 17.1 % 17.0 % 0.3 pt 0.4 pt
of which Orange Bank 61 15 15
Operating Cash Flow 5,610 5,564 5,711 0.8 % (1.8)%
December
31, 2017
December
31, 2016
Net financial debt 23,843 24,444
Ratio of “net financial debt / Adjusted EBITDA of telecom
activities”
1.85x 1.93x
* EBITDA adjustments are described in appendix 6.

4
Quarterly data
4rth
quarter
4rth
quarter
4rth
quarter
change
comparable
change
historical
2017 2016 2016 basis basis
In millions of euros comparable
basis
historical
basis
Revenues 10,546 10,361 10,516 1.8 % 0.3 %
Of which:
France 4,644 4,566 4,566 1.7 % 1.7 %
Europe 2,832 2,767 2,742 2.3 % 3.3 %
Spain 1,373 1,307 1,307 5.0 % 5.0 %
Poland 688 704 681 (2.4)% 0.9 %
Belgium & Luxembourg 318 322 322 (1.3)% (1.3)%
Central European countries 459 435 433 5.6 % 6.1 %
Intra-Europe eliminations (5) (1) (1) - -
Africa & Middle East 1,274 1,205 1,359 5.7 % (6.2)%
Enterprise 1,859 1,860 1,887 (0.1)% (1.5)%
International Carriers & Shared Services 417 449 451 (7.2)% (7.7)%
Intra-Group eliminations (479) (486) (488) - -
Adjusted EBITDA* 3,220 3,141 3,172 2.5 % 1.5 %
of which telecom activities 3,237 3,153 3,184 2.7 % 1.7 %
As % of revenues 30.7 % 30.4 % 30.3 % 0.3 pt 0.4 pt
of which Orange Bank (19) (12) (12) - -
CAPEX (excluding licenses) 2,336 2,234 2,238 4.5 % 4.4 %
of which telecom activities 2,312 2,220 2,224 4.2 % 4.0 %
As % of revenues 21.9 % 21.4 % 21.1 % 0.5 pt 0.8 pt
of which Orange Bank 24 14 14 - -
Operating Cash Flow 884 907 934 (2.5)% (5.3)%
* EBITDA adjustments are described in appendix 6.
The Orange S.A. Board of Directors met on February 20, 2018 and examined the financial statements
of the Group.
The Group’s statutory auditors audited those financial statements, and the audit reports relative to
their certification are in the process of being issued.
More detailed information is available on the Orange website:
www.orange.com

5
Comments on key Group figures
Revenues
Orange Group revenues were 41.096 billion euros in 2017, an increase of 1.2% (+503 million euros) on a
comparable basis5, twice that achieved in 2016 (+0.6%, or 249 million euros). In the fourth quarter of
2017, Group revenues were up 1.8% on a comparable basis, having risen 0.9% in the third quarter
and 1.1% in the first half. Faster growth in the fourth quarter was primarily due to the inclusion of
digital media apps in France from October 5, as well as the recovery in the Africa & Middle East
segment.
The fourth quarter 2017 revenue trends by region were as follows (on a comparable basis):
In France, revenue increased to 1.7% in the fourth quarter, following growth of 0.2% in the third quarter
and 0.5% in the second quarter. Fixed-line broadband and mobile services saw improved growth,
thanks in part to the inclusion of digital media apps.
In the Europe segment, revenues rose 2.3% in the fourth quarter of 2017:
- in Spain, mobile services grew 6.1% in the fourth quarter, reflecting additional services and 4G, and
fixed-line broadband grew 5.4% driven by fibre and TV services;
- in Poland, revenues fell 2.4% in the fourth quarter. Mobile services remained down while growth in
fixed-line broadband accelerated, driven by convergence and fibre;
- in Belgium & Luxembourg, revenues in the fourth quarter fell 1.3% with a decline in MVNOs and mobile
equipment sales. Growth of mobile services excluding MVNOs and of fixed-line broadband improved,
driven by consumer convergence offers;
- in Central European countries revenues were up 5.6% in the fourth quarter, driven by growth in
Romania (+7.7%) and Slovakia (+2.5%).
In the Africa & Middle East segment, revenues rebounded 5.7% in the fourth quarter of 2017, driven by
accelerated growth in Morocco and Egypt, and with growth resuming in the Democratic Republic of
Congo. Growth in 2017 was 3.0%, up from 2.6% in 2016;
In the Enterprise segment, the revenue trend has been gradually improving (-0.1% in the fourth quarter
compared to -0.5% in the third quarter and -1.6% in the first half). Growth in Cyberdefence and the
Cloud remained strong (+17% and +15% respectively).
Customer base growth
In France6, fibre set a new annual record with 546,000 net sales in 2017 (including 164,000 in the
fourth quarter) and reaching 2.0 million customers at December 31, 2017. The momentum in mobile
contract sales7 was also very strong with 826,000 net sales in 2017 (including 236,000 in the fourth
quarter), driven by Open offers and Sosh.
In Spain, the sales trend remained strong in the fourth quarter, both in fibre with 175,000 net sales, and
in mobile contracts7 with 61,000 net sales in a highly competitive environment.
In Poland, fixed-line broadband had 61,000 net sales in the fourth quarter (driven by fixed 4G and
fibre) and convergent offers represented 50% of the consumer customer base at the close of 2017.
There were 64,000 mobile contracts net sales in the fourth quarter.
5 Expressed as data on a historical basis, 2017 revenues showed an increase of 0.4% over 2016. This includes:
- the impact of changes in scope of consolidation (+0.4 percentage points), mainly the acquisition of Cellcom in Liberia and Tigo in the
Democratic Republic of Congo (nine months and six months of activity in 2016 respectively), and the acquisition of entities from the Bharti
group in Burkina Faso (with six months of activity in 2016) and in Sierra Leone (with five months of activity in 2016);
- the effect of exchange rate fluctuations (-1.2 percentage points) and primarily the decline in the Egyptian pound. 6 Includes Orange France customers and Enterprise customers in France. 7 Excluding machine-to-machine.

6
In Belgium, mobile contracts8 saw record net sales in the fourth quarter (28,000 net sales), the highest
level since the fourth quarter of 2011. The contract customer base8 of the Belgium & Luxembourg
segment (2.4 million customers at the end of 2017) rose 3.3% year on year.
In the Africa & Middle East segment, the mobile customer base reached 130.5 million at December 31,
2017, an increase of 8.2% (up 9.9 million customers) year on year. Orange Money had 36.9 million
customers and an active customer base of 12.1 million at December 31, 2017.
Group-wide, the number of mobile customers was 211.4 million at December 31, 2017, up 5.0% year
on year (+10.1 million net sales) on a comparable basis. Customer contracts (74.6 million) grew 7.2%
year on year, while 4G reached 46.2 million customers.
Fixed-line broadband customers (19.5 million at December 31, 2017) grew 4.7% year on year; fibre,
with 4.7 million customers, grew 43%.
Consumer convergent offers had 10.3 million customers (up 11.1%), of which 6.0 million were in
France, 3.1 million in Spain and 1.0 million in Poland.
TV services increased 6.9% year on year to 9.1 million customers as of December 31, 2017.
Orange Bank had 55,000 accounts open at December 31, 2017, which is ahead of the Group’s initial
forecasts.
Adjusted EBITDA
The adjusted EBITDA of the Group was 12.819 billion euros in 2017, an increase of 2.2% on a
comparable basis. Adjusted EBITDA from telecom activities was 12.880 billion euros, an increase of
2.4% on a comparable basis (+306 million euros), despite the impact of the new roaming regulation in
Europe. This increase is primarily due to a good performance in Spain, France and the Africa & Middle
East segment.
Improvements to the cost structure provided the necessary flexibility to expand content offers and
maintain commercial focus, particularly in the area of mobile equipment sales. At the same time,
labour costs in the telecom activities declined 1.9% in 2017, reflecting the decrease in the average
number of full-time equivalent employees during the year (-2.8%). Service fees and inter-operator
costs as well as advertising and promotion costs were also down for the year.
In the fourth quarter of 2017, the adjusted EBITDA from telecom activities was 3.237 billion euros, an
increase of 2.7% (+84 million euros) on a comparable basis. That increase was primarily due to
revenue growth (+185 million euros), partially offset by an increase in operating costs (-102 million
euros) related mainly to content costs and commercial expenses (purchases of equipment intended for
customers). Labour costs increased 1.2% in the fourth quarter, related to an adjustment of the variable
portion of compensation and profit-sharing, and to the share award plan for employees apportioned to
2017 (Orange Vision 2020).
Operating income
Orange Group operating income stood at 4.917 billion euros in 2017, an increase of 840 million euros on
a historical basis compared with 2016, due to:
- a 769 million-euro decrease in the impairment of goodwill and fixed assets, with 210 million euros of
impairment in 2017 (Democratic Republic of Congo, Niger and Luxembourg) compared with 979 million
euros in 2016;
- an EBITDA increase of 283 million euros;
- and a rise in income from associates and joint ventures amounting to 52 million euros.
These positive items were partially offset by:
- the impact of the acquisition of 65% of Groupama Bank (subsequently Orange Bank) for 124 million
euros, with a loss of 27 million euros in 2017 versus a gain of 97 million euros in 2016;
- and the rise in depreciation and amortisation to 118 million euros.
8 Excluding machine to machine.

7
Net income
Net income from continuing operations (2.114 billion in 2017) showed an increase of 1.104 billion
euros over 2016 due to:
- an 840 million-euro increase in operating income;
- an improvement in net finance costs of 382 million euros, including a reduced impairment of the
retained BT stock; a decrease in the cost of gross financial debt; and an increase in income from
foreign exchange;
- partially offset by a 118 million euro increase in corporate tax.
Net income from discontinued operations fell 2.224 billion euros due to the disposal of EE in 20169,
which resulted in a positive income impact of 2.253 billion euros.
In total, Orange Group’s consolidated net income was 2.143 billion euros in 2017, down 1.120 billion
euros from 2016.
CAPEX
CAPEX for the Group was 7.209 billion euros in 2017, an increase of 3.4% compared to the previous
year.
Growth in investment in very high speed broadband continued to increase, with a third of investment
growth attributable to fibre mainly in France, Spain and Poland. In France, the growth in fibre
investment remained strong and benefits in part from greater co-financing from other operators. At
December 31, 2017, 26.6 million households had connectivity to very high-speed broadband10 (an
increase of 6.3 million or 31% year on year), including 12.0 million in Spain, 9.1 million in France, 2.5
million in Poland and 2.3 million in Romania (following the mutual network sharing agreement with
Telekom Romania).
The increase in capital spending on 4G and 4G+ mobile services represented around two thirds of
investment growth in very high-speed broadband. This was largely due to accelerated rollouts in Africa
& the Middle East, France and Spain. At December 31, 2017, 4G coverage as a percentage of the
population was 95.9% in France, 95.7% in Spain, 99.8% in Poland, 99.7% in Belgium, 93.2% in
Romania, 90% in Slovakia and 98% in Moldova. In France and Spain, investments focused on
improving service quality in public spaces and on public transport.
The increased investment in information systems and services platforms is attributable to the launch of
Orange Bank services.
Investments in customer equipment increased slightly: the expansion of convergent offers in Belgium
and Spain was offset by optimising box costs in France.
The store modernisation program continues: at the end of 2017, the Group had 327 stores based on the
new Smart Store concept, including 123 in France, 170 in the other European countries and 34 in Africa &
the Middle East.
Changes in asset portfolio
At December 31, 2016, Orange had a 4% stake in the BT Group, following the sale of its investment in
EE in January 2016. As part of the sale agreement, Orange agreed to hold onto its shares for a one year
period. In June 2017, Orange chose to further reduce its exposure to BT by selling 133 million BT shares
(or 1.33% of BT equity, for 433 million euros net of fees at June 22, 2017), and by issuing bonds11
exchangeable into BT stock to the amount of 517 million pounds sterling (585 million euros). At
December 31, 2017, Orange retained a 2.67% equity interest in BT Group. 9 Consisting of the income on disposal of EE of 2.080 billion euros and the EE dividends of 173 million euros received in January 2016, prior
to its sale. 10 Download speeds greater than or equal to 100 Mbps. 11 These 4-year bonds were issued on the basis of a reference price of 2.88 pounds sterling per BT share. They include an exchange
premium of 35% corresponding to an exchange price of 3.89 pounds sterling per BT share, and bear interest at a rate of 0.375% per year,
which is a negative rate of interest after conversion into euros.

8
In October 2017, Orange signed an agreement to purchase a majority share in Business & Decision, a
data and digital specialist in the Business Intelligence and Customer Relationship Management space.
This transaction, due to be completed in the first half of 2018, is subject to the regulatory approval. If
the transaction is approved, Orange will issue a simplified tender offer to acquire all the capital stock
of Business & Decision. The acquisition of 100% of the equity is valued at approximately 63 million
euros.
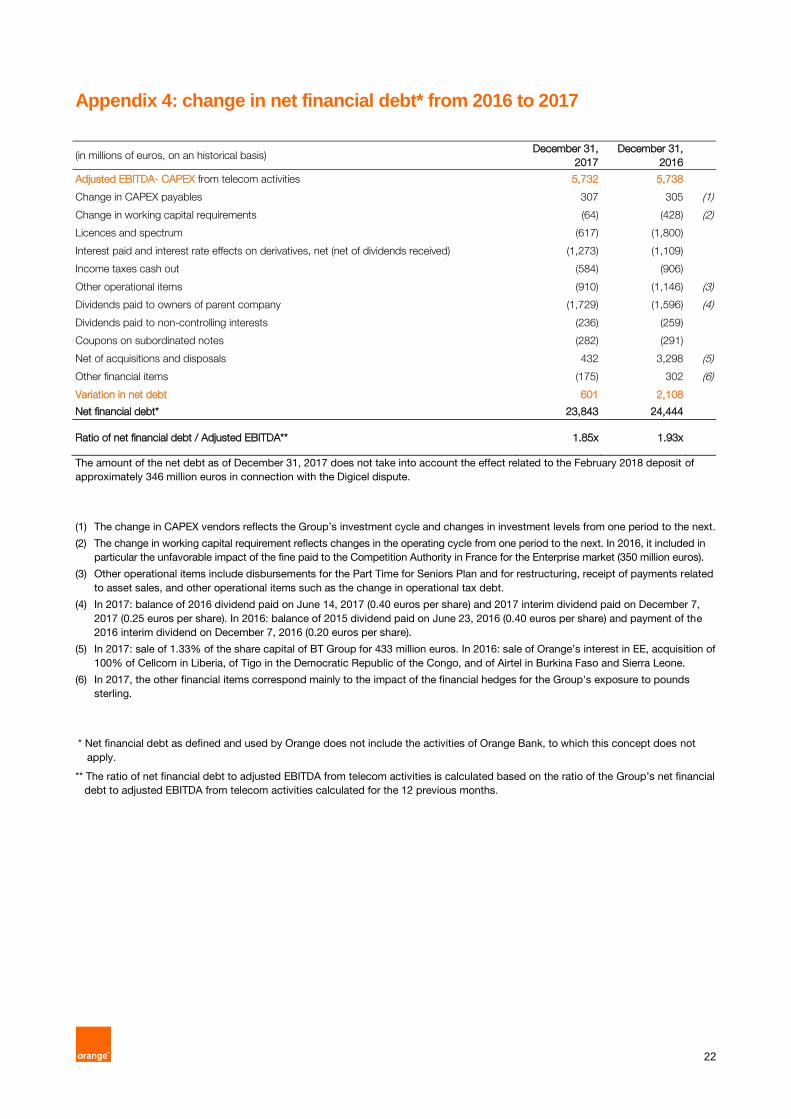
Net financial debt
Orange Group's net financial debt was 23.843 billion euros at December 31, 2017, representing a
reduction of 601 million euros compared to December 31, 2016. The strict discipline observed in
allocating resources made it possible both to support a proactive investment strategy and to maintain
the Board’s commitment to increase the dividend for 2017 by 5 euro cents12.
The ratio of "net financial debt to adjusted EBITDA from telecom activities" was 1.85x at December 31,
2017, compared to 1.93x at December 31, 2016, due primarily to growth in adjusted EBITDA from
telecom activities. This is in line with the Group’s medium-term objective of a net debt to adjusted
EBITDA ratio for telecom activities of around 2x.
Items related to the change in net financial debt and to the ratio of net debt to adjusted EBITDA for
telecom activities are presented in appendix 4.
Dividend 2017
The Group confirms payment of a 0.65 euro per share dividend for 201712. An interim dividend of 0.25
euros per share was paid on December 7, 2017 and the remainder of 0.40 euros per share will be paid
on June 7. The ex-dividend date will be June 5, 2018 and the record date will be June 6, 2018.
12 Subject to the approval of the Annual General Meeting of Shareholders.

9
Review by operating segment
France
2017 2016 2016 17/16 17/16
In millions of euros
comparable
basis
historical
basis
comparable
basis
historical
basis
Revenues 18,052 17,945 17,945 0.6 % 0.6 %
Adjusted EBITDA 6,901 6,808 6,806 1.4 % 1.4 %
Adjusted EBITDA / Revenues 38.2 % 37.9 % 37.9 % 0
Operating Income 3,392 - 3,381 - 0.3 %
CAPEX 3,451 3,431 3,421 0.6 % 0.9 %
CAPEX / Revenues 19.1 % 19.1 % 19.1 % 0
In France, revenues grew for the third consecutive quarter: +1.7% in the fourth quarter of 2017 after
rising 0.2% in the third quarter and 0.5% in the second quarter. The fourth quarter of 2017 benefitted
from the impact of digital media apps, available since October 5, and the recovery in mobile
equipment sales (+10.0% after -0.8% in the third quarter).
Mobile services rose 2.5% in the fourth quarter of 2017 for the first time since 2011. Excluding the impact
of the digital media apps, mobile services still recorded growth. The increase was driven by the excellent
sales performance throughout the year. The increase in the contract customer base13 strengthened in the
second half of the year, at +4.0% at the end of 2017. With 717,000 net contract sales13, 2017 had the
highest net sales since 2008; 70% of net customer sales were made in the high end of the market. The
number of customer convergent SIM card offers was 9.2 million at December 31, 2017 (+11.7% year on
year). At that date, 73% of customer contracts included 4G (+11 percentage points year on year) and SIM-
only offers represented 73% of the customer contracts (+8 percentage points year on year).
Fixed broadband services grew by 7.5% in the fourth quarter after rising 4.8% in the third quarter.
Excluding the impact of the inclusion of digital media apps, growth is comparable to previous quarters
and was driven by the commercial success of FTTH (fibre to the home) offers, which continue to
penetrate the market at a steady pace. The fixed broadband customer base (11.2 million at the end of
2017) is up 3.1% year on year and includes 2.0 million FTTH customers (+37.6% year on year). Fixed
broadband ARPU was up 4.2% in the fourth quarter. Excluding the impact of the inclusion of digital
media apps, ARPU growth is comparable to previous quarters. Consumer convergent offers (6.0
million customers at December 31, 2017, a year on year increase of 8.5%) represented 59.3% of the
fixed broadband customer base (+2.7 percentage points in one year). The continued decline of
traditional telephony reached -10.9% in the fourth quarter. Wholesale and other fixed services were
down 0.7% in the fourth quarter compared to a strong fourth quarter in 2016. Throughout 2017, they
grew 2.9%, driven by unbundling and fibre.
In France, adjusted EBITDA rose 1.4% in 2017, and the adjusted EBITDA margin (38.2%) improved 0.3
percentage points compared to 2016. The increase in revenues, the decrease in labour expenses and
the savings achieved under the Explore2020 operational efficiency plan were partially offset by the
increase in content costs and other operating expenses related to business development.
In France, CAPEX was up 0.6% on a comparable basis. The growth of investments in very high-speed
broadband (FTTH and 4G) remained strong, offset by the decrease in other investments. At December
31, 2017, 9.1 million households in France had access to Orange’s fibre network (+2.2 million
households year on year). At that date, 4G coverage reached 95.9% of the population (+8.3
percentage points year on year) and 49% of the 4G sites were equipped with 4G+.
13 Excluding machine-to-machine.

10
Europe
2017 2016 2016 17/16 17/16
In millions of euros
comparable
basis
historical
basis
comparable
basis
historical
basis
Revenues 11,026 10,614 10,541 3.9 % 4.6 %
Adjusted EBITDA 3,138 2,967 2,944 5.8 % 6.6 %
Adjusted EBITDA / Revenues 28.5 % 27.9 % 27.9 % 0
Operating Income 909 - 186 - 390.3 %
CAPEX 2,012 1,972 1,960 2.1 % 2.8 %
CAPEX / Revenues 18.3 % 18.6 % 18.6 % 0
Revenues in the Europe segment grew 2.3% in the fourth quarter of 2017 after rising 3.9% in the third
quarter on a comparable basis.
Mobile services rose 1.1% in the fourth quarter of 2017 after increasing 2.3% in the third quarter, on a
comparable basis. The slowdown in growth is linked to services provided to other operators, including
the decline of MVNOs in Belgium. Commercial momentum continued to be high, with 346,000 net
contract sales in the fourth quarter. The contract customer base was 34.6 million at December 31,
2017, an increase of 4.1% year on year, representing 70.4% of the total mobile customer base at that
date (+4.8 percentage points year on year).
Fixed services rose 2.6% in the fourth quarter after increasing 3.5% in the third quarter on a
comparable basis. Broadband growth remains strong (+7.8% in the fourth quarter following 10.0%
growth in the third quarter) and was driven by a customer base increase of 7.5% year on year to 7.1
million at December 31, 2017, including 2.6 million fibre customers (+46.2% year on year).
Customer convergent offers in the Europe segment reached 4.3 million customers at December 31,
2017 (+15.0% year on year) and 142,000 net sales in the fourth quarter of 2017, driven by Poland,
Romania and Belgium.
Adjusted EBITDA for the Europe segment increased 5.8% in 2017 on a comparable basis. The
increase in revenues was partially offset by higher content costs, interconnection costs and, to a lesser
extent, increased labour expenses.
CAPEX in the Europe segment rose 2.1% on a comparable basis. The significant increase in fibre and
mobile services (4G and 4G+) investments was largely offset by a decrease in other investments.

11
Spain
2017 2016 2016 17/16 17/16
In millions of euros
comparable
basis
historical
basis
comparable
basis
historical
basis
Revenues 5,371 5,014 5,014 7.1 % 7.1 %
Adjusted EBITDA 1,582 1,351 1,349 17.0 % 17.2 %
Adjusted EBITDA / Revenues 29.4 % 26.9 % 26.9 % 0
Operating Income 569 - 276 - 106.2 %
CAPEX 1,115 1,086 1,086 2.7 % 2.7 %
CAPEX / Revenues 20.8 % 21.7 % 21.7 % 0
In Spain, revenues grew a record 7.1% in 2017 after a 6.0% rise in 2016 on a comparable basis, driven
by convergence and rapid development of fibre.
In the fourth quarter, revenues were up 5.0% after a 6.4% rise in the third quarter. Revenues from
consumer convergence rose 9.2% (after an 11.8% increase in the third quarter of 2017), driven by 1.9%
growth in the customer base year on year (3.1 million customers at December 31, 2017) and a 6.7% rise
in revenues per unit (ARPCO14) in the fourth quarter. The consumer convergence base represented
83.1% of consumer fixed broadband customers at December 31, 2017 (+1.7 percentage points year on
year).
Mobile services rose 6.1% in the fourth quarter of 2017 after a 7.5% rise in the third quarter, driven by
the enrichment of offers and the deployment of 4G (to 9.3 million customers at December 31, 2017,
+18% year on year), which is reflected by the 5.7% rise of mobile ARPU in the fourth quarter. Contract
customer base15 increased 1.8% year on year (11.446 million customers at the end of 2017), with 61,000
net sales in the fourth quarter. At the same time, the growth of mobile services provided to other
operators remained strong (national roaming, network sharing and visitor roaming).
Fixed services rose 3.1% in the fourth quarter of 2017 after a 4.8% rise in the third quarter, driven by
fixed broadband (+5.4% in the fourth quarter and +8.3% in the third quarter). Fixed broadband had 4.2
million customers as of December 31, 2017 (+0.5% year on year), and saw ARPU increase 4.2% in the
fourth quarter. Fibre net sales were 175,000 in the fourth quarter. With 2.3 million customers at the end
of 2017 (+40.4% year on year), this represents 54.4% of the fixed broadband customer base (+15.5
percentage points year on year). TV services also grew rapidly, with 626,000 customers at the end of
2017 (+23.4% year on year).
In Spain, adjusted EBITDA increased sharply in 2017 (+17.0% on a comparable basis) and the
adjusted EBITDA margin (29.4%) improved by 2.5 percentage points compared to 2016. Sustained
revenue growth (partially offset by increased content costs and commercial expenses) was
complemented by favourable developments in network costs related to the migration of ADSL
customers to the Orange Spain fibre network.
CAPEX in Spain rose 2.7% in 2017, driven by very high-speed broadband. 4G coverage reached
95.7% of the population as of December 31, 2017 (+5.4 percentage points year on year) and a total of
12.0 million homes had access to fibre connectivity at that date (+2.4 million in one year).
14 See glossary. 15 Excluding machine-to-machine.

12
Poland
2017 2016 2016 17/16 17/16
In millions of euros
comparable
basis
historical
basis
comparable
basis
historical
basis
Revenues 2,674 2,711 2,644 (1.4)% 1.1 %
Adjusted EBITDA 707 743 725 (4.8)% (2.4)%
Adjusted EBITDA / Revenues 26.4 % 27.4 % 27.4 % 0
Operating Income 52 - (405) - -
CAPEX 443 466 455 (4.9)% (2.5)%
CAPEX / Revenues 16.6 % 17.2 % 17.2 % 0
Revenues for Poland fell 2.4% in the fourth quarter of 2017 after a 1.3% drop in the third quarter of
2017 on a comparable basis. The slowdown in the fourth quarter is attributable to mobile equipment
sales, which fell 12.8% (after a 13.3% rise in the third quarter) following a sales strategy changes to
focus on value rather than volumes (reduction of subsidies).
Consumer convergent offers continued to grow steadily, with 90,000 net additions in the fourth quarter
of 2017, driven by the success of the Orange Love offers. By the end of 2017, consumer convergent
offers reached 1.035 million customers (+55% year on year), and represented 50% of the consumer
fixed broadband customer base (+15 percentage points year on year).
Mobile services, which were down 5.9% in the fourth quarter of 2017 on a comparable basis (after a
7.1% drop in the third quarter), continued to be impacted by the development of instalment payments
and SIM-only offers.
Sales momentum remained solid in the fourth quarter with contract net sales of 64,000, following a
rationalisation of offers last September. As of December 31, 2017, the contract customer base was 9.7
million, up 5.0% year on year, while 4G had 5.7 million users (+34% year on year).
Fixed services fell 1.2% on a comparable basis in the fourth quarter of 2017, (after a 1.7% drop in the
third quarter). Fixed broadband growth accelerated, with revenues up 7.8% in the fourth quarter
(following a 6.6% rise in the third quarter) driven by convergent offers, fibre and fixed 4G. The fixed
broadband customer base stood at 2.4 million at the end of 2017 (+10.5% year on year), of which
214,000 were fibre customers (+143% year on year). At the same time, traditional telephony revenues
declined 13.5% in the fourth quarter.
Growth in other revenues remained strong, driven by fixed equipment sales (ICT and fixed 4G) and the
development of energy distribution offers.
Adjusted EBITDA for Poland was down 4.8% in 2017 on a comparable basis, an improvement of 5.4
percentage points from 2016 (-10.2%). Lower revenues and higher interconnection costs (notably
roaming) were partially offset by lower commercial costs.
The improvement was particularly significant in the second half of the year, with a limited decrease of
1.8% after a 7.4% drop in the first half of the year. This was mostly due to the greater decrease in
commercial costs (reduction of mobile handset subsidies and distribution channel optimisation).
The lower CAPEX in Poland in 2017 (-4.9%) on a comparable basis is related to mobile 4G, which had
a coverage rate of 99.8% of the population at the end of 2017. At the same time, investments in fibre
increased significantly. As of December 31, 2017, there were 2.5 million connectable households to
fibre (+1 million year on year).

13
Belgium & Luxembourg
2017 2016 2016 17/16 17/16
In millions of euros
comparable
basis
historical
basis
comparable
basis
historical
basis
Revenues 1,251 1,242 1,242 0.8 % 0.8 %
Adjusted EBITDA 302 316 316 (4.3)% (4.3)%
Adjusted EBITDA / Revenues 24.2 % 25.4 % 25.4 % 0
Operating Income 62 - 113 - (44.8)%
CAPEX 188 168 168 12.4 % 12.4 %
CAPEX / Revenues 15.1 % 13.5 % 13.5 % 0
Revenues from Belgium & Luxembourg fell 1.3% in the fourth quarter of 2017, compared with a 1.7%
rise in the third quarter. The fourth quarter was marked by the sharp decline of MVNOs, in connection
with the migration of Telenet customers to the BASE network and the end of the Lycamobile contract
last July. In addition, there was a 7.3% decline in mobile equipment sales (after a 4.4% rise in the third
quarter).
Excluding MVNO, mobile services grew 2.9% in the fourth quarter. In Belgium, there were 28,000 net
additions to contracts16 in the fourth quarter, the highest level since the fourth quarter of 2011, and
quarterly ARPU rose 3.2%. The contract16 customer base in Belgium & Luxembourg rose to 2.423
million customers at December 31, 2017 (+3.3% year on year).
Fixed services were up 29.2% in the fourth quarter (after a 27.7% rise in the third quarter), driven by
the success of consumer convergent offers with 97,000 customers as of December 31, 2017,
compared to 31,000 a year earlier.
Adjusted EBITDA for Belgium and Luxembourg was down 4.3% in 2017. Excluding the impact on
2016 results of the agreement with the Walloon Region regarding pylon tax (16 million euros), adjusted
EBITDA rose by 0.7%. Revenue growth and lower commercial costs were partly offset by higher
interconnection costs (roaming) and connectivity costs (cable network access).
CAPEX for Belgium & Luxembourg increased 12.4% in 2017, and was attributable to the development
of convergent cable offers (IT and customer equipment). This was partially offset by the decrease in
4G mobile investments, from which coverage reached 99.7% in Belgium at the end of 2017 (62.9% for
4G+).
16 Excluding machine-to-machine.

14
Central European countries
2017 2016 2016 17/16 17/16
In millions of euros
comparable
basis
historical
basis
comparable
basis
historical
basis
Revenues 1,749 1,654 1,648 5.7 % 6.2 %
Adjusted EBITDA 547 557 554 (1.7)% (1.2)%
Adjusted EBITDA / Revenues 31.3 % 33.6 % 33.6 %
Operating Income 226 - 202 - 11.9 %
CAPEX 266 252 251 5.6 % 6.0 %
CAPEX / Revenues 15.2 % 15.2 % 15.2 % 0
Revenues from Central European countries rose 5.6% in the fourth quarter of 2017, compared with
6.9% in the third quarter on a comparable basis. The mobile contract customer base17 grew 2.3% year
on year on a comparable basis, to 7.9 million at the end of 2017, and the 4G mobile base (4.6 million
customers) experienced very strong growth (+44% year on year). Fixed broadband had 394,000
customers at 31 December 2017 and consumer convergent offers (sold in all three countries) had
127,000 customers at that date.
In Romania, revenues rose 7.7% in the fourth quarter after a 10.4% rise in the third quarter, driven by
mobile services and mobile equipment sales. Fixed broadband growth was boosted by the success of
convergent offers (+33,000 net sales in the fourth quarter).
In Slovakia, revenues were up 2.5% in the fourth quarter after a 0.4% rise in the third quarter. In
addition to a recovery in mobile equipment sales, mobile services trends and fixed broadband services
also improved in the fourth quarter. .
In Moldova, revenues fell 0.4% in the fourth quarter. Mobile services continued to be affected by the
decline in international traffic, while steady growth in mobile equipment and fixed broadband sales
(driven by convergent offers) continued.
Adjusted EBITDA for Central European countries fell 1.7% in 2017 on a comparable basis. The
increase in interconnection costs18 and commercial expenses (purchases of mobile handsets) was
largely offset by growth in revenues.
CAPEX in the Central European countries rose 5.6% in 2017 on a comparable basis, with the
acceleration of fibre roll-out in Slovakia and 4G in Romania. As of December 31, 2017, 4G covered
93.2% of the population in Romania, 90% in Slovakia and 98% in Moldova, and the number of
households connected to very high-speed broadband reached 2.3 million in Romania, 0.4 million in
Slovakia and 0.2 million in Moldova.
17 Excluding machine-to-machine. 18 The end of roaming charges in Europe generated a very strong increase in traffic volumes in the second half of the year from customers to
other European countries.

15
Africa & Middle East
2017 2016 2016 17/16 17/16
In millions of euros
comparable
basis
historical
basis
comparable
basis
historical
basis
Revenues 5,030 4,881 5,245 3.0 % (4.1)%
Adjusted EBITDA 1,612 1,506 1,658 7.0 % (2.8)%
Adjusted EBITDA / Revenues 32.1 % 30.9 % 31.6 % 0
Operating Income 522 - 68 - -
CAPEX 1,021 954 962 7.0 % 6.1 %
CAPEX / Revenues 20.3 % 19.5 % 18.3 % 0
Revenue growth in the Africa & Middle East segment continued to increase, up 5.7% in the fourth
quarter after 3.1% growth in the third quarter, on a comparable basis. Alongside faster growth in
Morocco and Egypt, the Democratic Republic of Congo returned to growth. The Sonatel Group19
(mainly Mali and Guinea) and the Côte d'Ivoire Group20 (particularly Burkina Faso) also contributed to
the quarterly growth of the segment.
The growth of mobile data services remained very strong (+36% in the fourth quarter) and driven by
4G, which is now available in 11 countries21 (with 11.1 million customers as of December 31, 2017,
+16% in three months). Likewise, Orange Money revenues rose 58% in the fourth quarter, with 36.9
million customers at December 31, 2017 (including 12.1 million active customers). The enterprise
market accounted for a third of the segment’s growth in 2017.
In the Africa & Middle East segment, the mobile customer base was 130.5 million at December 31,
2017, a year-on-year increase of 8.2% (+9.9 million customers). In particular, contract offers (11.2
million as of December 31, 2017) grew 13.5% (+1.3 million) year on year, mainly in Egypt and
Morocco.
Adjusted EBITDA for the Africa & Middle East segment rose 7.0% in 2017 on a comparable basis, and
the adjusted EBITDA margin (32.1%) improved 1.2 percentage points compared to 2016. The growth
in revenues and the decrease in interconnection costs offset the increase in technical maintenance
costs (in line with network expansion) and the increase in operational taxes.
CAPEX for the Africa & Middle East segment rose 7.0% in 2017 on a comparable basis. The increase
in investments related to the deployment of 4G networks in the 11 countries covered and, to a lesser
extent, the deployment of fibre.
19 The managerial entity known as “Sonatel group” combines Orange’s operations in Senegal, Mali, Guinea, Sierra Leone and Guinea
Bissau. 20 The managerial entity known as “Côte d’Ivoire group” combines Orange’s operations in Côte d’Ivoire, Burkina Faso and Liberia. 21 Excluding entities accounted for by the equity method, i.e.: Botswana, Cameroon, Côte d'Ivoire, Egypt, Guinea-Bissau, Jordan, Liberia,
Madagascar, Mali, Morocco and Senegal.

16
Enterprise
2017 2016 2016 17/16 17/16
In millions of euros
comparable
basis
historical
basis
comparable
basis
historical
basis
Revenues 7,252 7,323 7,353 (1.0)% (1.4)%
Adjusted EBITDA 1,307 1,337 1,342 (2.3)% (2.7)%
Adjusted EBITDA / Revenues 18.0 % 18.3 % 18.3 % 0
Operating Income 890 - 922 - (3.5)%
CAPEX 382 335 336 13.9 % 13.5 %
CAPEX / Revenues 5.3 % 4.6 % 4.6 % 0
Revenues from the Enterprise segment was relatively stable in the fourth quarter of 2017, -0.1% after a
0.5% drop in the third quarter on a comparable basis. The improved trends, notably IT and integration
services, which grew 3.6% in the fourth quarter after a 0.8% rise in the third quarter. Cyberdefence
grew 17% in the fourth quarter, the Cloud +15%, and Applications22 +8%.
Mobile was up 3.0% in the fourth quarter, driven by equipment sales, while services remained
impacted by the end of roaming charges in Europe last July. The number of contract customers23 was
2.767 million at December 31, 2017 (+4.1% year over year) and the number of machine-to-machine
SIM cards grew sharply (26.5% over one year).
Data services fell slightly (-2.3%) in the fourth quarter after a 3.8% drop in the third quarter.
Improvements mainly affected IP-VPN services, which had 352,000 subscribers as of December 31,
2017 (+0.3% year on year).
Voice services fell 3.6% in the fourth quarter. The downward trend in traditional fixed telephony was
partially offset by the rise in voice over IP and customer relationship services (contact number
services).
Adjusted EBITDA for the Enterprise segment fell 2.3% in 2017 on a comparable basis. The decrease in
revenues (-1.0%) and the increase in commercial expenses (cost of equipment sold) were partially
offset by lower network costs and reduction in other operational charges.
CAPEX for the Enterprise segment increased 13.9% in 2017 on a comparable basis, due to the
accelerated transformation of the segment's IT system and the development of network virtualisation.
22 Applications include projects in the machine-to-machine and connected objects fields, the digital customer experience, data analysis (Big
Data) and systems integration. 23 Excluding machine-to-machine.

17
International Carriers & Shared Services
2017 2016 2016 17/16 17/16
In millions of euros
comparable
basis
historical
basis
comparable
basis
historical
basis
Revenues 1,651 1,806 1,812 (8.6)% (8.9)%
Adjusted EBITDA (78) (45) (56) (81.8)% (39.5)%
Adjusted EBITDA / Revenues (4.8)% (2.4)% (3.1)%
Operating Income (704) - (565) - (24.8)%
CAPEX 282 267 277 5.1 % 1.5 %
CAPEX / Revenues 17.1 % 14.8 % 15.3 %
Revenues from the International Carriers and Shared Services segment recorded an 8.6% decline on a
comparable basis in 2017, which was linked to the decline in voice services to international operators,
particularly for African destinations and Maghreb.
Adjusted EBITDA in 2017 was down 33 million euros compared to 2016, on a comparable basis. The
decrease in revenues and the decrease in income from the sale of fixed assets were partly offset by
the decrease in interconnection costs and lower expenses related to brand development.
CAPEX reached 282 million euros in 2017, an increase of 15 million euros on a comparable basis,
relating to investments in submarine cables (including the Kanawa submarine cable between French
Guyana, Martinique and Guadeloupe) and in content (Orange Studio).
Orange Bank
2017 2016 2016 17/16 17/16
In millions of euros
comparable
basis
historical
basis
comparable
basis
historical
basis
Net Banking Income 73 73 21 0.4 % 257.2 %
Cost of risk of bank credit (6) (10) (2) (41.4)% 203.5 %
Operating Income (93) - 85 - -
CAPEX 61 15 15 322.1 % 322.1 %
Launched on November 2, 2017 in metropolitan France, Orange Bank's new banking and digital offer
already had 55,000 customers as of December 31, 2017.
Orange Bank's operating income in 2017 was a loss of 93 million euros, compared to an operating
profit of 85 million euros in 2016 (historical basis), mainly due to:
- integration of the bank's activities over twelve months in 2017, compared with three months in 2016;
- costs incurred in preparation for the launch of the Orange Bank offer;
- and effects related to Orange's new majority stake in Groupama Banque, now Orange Bank (loss of 27
million euros in 2017, compared to a profit of 97 million euros in 2016).
CAPEX rose 46 million euros, mainly due to IT investments, in preparation for the commercial launch
of the Orange Bank offer in November 2017.

18
Schedule of upcoming events
26 April 2018: 1st quarter 2018 results
Contacts
press: +33 1 44 44 93 93
Jean-Bernard Orsoni
Tom Wright
Olivier Emberger
financial communications: +33 1 44 44 04 32
(analysts and investors)
Patrice Lambert-de Diesbach
Isabelle Casado
Samuel Castelo
Luca Gaballo
Didier Kohn
Anna Vanova
individual shareholders: 0 800 05 10 10
Disclaimer
This press release contains forward-looking statements about Orange. Although we believe these statements are based on reasonable
assumptions, they are subject to numerous risks and uncertainties, including matters not yet known to us or not currently considered
material by us, and there can be no assurance that anticipated events will occur or that the objectives set out will actually be achieved.
Important factors that could cause actual results to differ from the results anticipated in the forward-looking statements include,
among others: the success of Orange’s strategy, particularly its ability to maintain control over customer relations when facing
competition with OTT players, risks related to banking activities, loss or disclosure to third parties of customers’ data, Orange’s ability
to withstand intense competition in mature markets, networks or software failures due to cyberattacks, damage to networks caused by
natural disasters, terrorist acts or other reasons, various frauds affecting Orange or its customers, Orange’s ability to retain the
necessary skills given the high level of employee retirements and the development of new needs, difficulties in integrating newly
acquired businesses as part of the telecommunication sector’s consolidation in Europe, its ability to capture growth opportunities in
emerging markets and the risks specific to those markets, possible adverse health effects associated with the use of
telecommunications equipment, risks related to the single brand strategy, the eruption of a global financial or economic crisis, fiscal
and regulatory constraints and changes, the results of litigation regarding regulations, competition and other matters, disagreements
with its co-shareholders in companies that Orange does not control, the terms of access to capital markets, interest rate or exchange
rate fluctuations, Orange's credit ratings, changes in assumptions underlying the accounting value of certain assets resulting in their
impairment, and credit risks or counterparty risks on financial transactions. More detailed information on the potential risks that could
affect our financial results is included in the Registration Document filed on 6 April 2017 with the French Autorité des Marchés Financiers (AMF) and in the annual report on Form 20-F filed on 7 April 2017 with the U.S. Securities and Exchange Commission.
Forward-looking statements speak only as of the date they are made. Other than as required by law, Orange does not undertake any
obligation to update them in light of new information or future developments.

19
Appendix 1: consolidated income statement
(in millions of euros, except for per share data) 2017 2016 2015
Revenues 41,096 40,918 40,236
External purchases (18,475) (18,281) (17,697)
Other operating income 701 739 642
Other operating expense (730) (543) (1,069)
Labor expenses (8,572) (8,866) (9,058)
Operating taxes and levies (1,846) (1,808) (1,783)
Gains (losses) on disposal of investments and activities (5) 59 178
Restructuring and integration costs (167) (499) (172)
Depreciation and amortization (6,846) (6,728) (6,465)
Effects resulting from business combinations (27) 97 6
Reclassification of translation adjustment from liquidated entities (8) 14 -
Impairment of goodwill (20) (772) -
Impairment of fixed assets (190) (207) (38)
Share of profits (losses) of associates and joint ventures 6 (46) (38)
Operating income 4,917 4,077 4,742
Cost of gross financial debt (1,274) (1,407) (1,597)
Gains (losses) on assets contributing to net financial debt 11 23 39
Foreign exchange gains (losses) (63) (149) 1
Other net financial expenses (17) (31) (26)
Effects resulting from BT stake (372) (533) -
Finance costs, net (1,715) (2,097) (1,583)
Income tax (1,088) (970) (649)
Consolidated net income of continuing operations 2,114 1,010 2,510
Consolidated net income of discontinued operations (EE) 29 2,253 448
Consolidated net income 2,143 3,263 2,958
Net income attributable to owners of the parent 1,906 2,935 2,652
Non-controlling interests 237 328 306
Earnings per share (in euros) attributable to parent company
Net income of continuing operations
• basic 0.61 0.15 0.72
• diluted 0.61 0.15 0.72
Net income of discontinued operations
• basic 0.01 0.85 0.17
• diluted 0.01 0.85 0.17
Net income
• basic 0.62 1.00 0.89
• diluted 0.62 1.00 0.89
0

20
Appendix 2: consolidated statement of financial position
(in millions of euros) December 31,
2017
December 31,
2016
December 31,
2015
Assets
Goodwill 27,095 27,156 27,071
Other Intangible assets 14,339 14,602 14,327
Property, plant and equipment 26,665 25,912 25,123
Interests in associates and joint ventures 77 130 162
Non-current financial assets 3,711 3,882 835
Non-current derivatives assets 213 915 1,297
Other non-current assets 110 106 85
Deferred tax assets 1,825 2,116 2,430
Total non-current assets 74,035 74,819 71,330
Inventories 827 819 763
Trade receivables 5,175 4,964 4,876
Loans and receivables of Orange Bank (1) 3,096 3,091 -
Current financial assets 2,865 1,862 1,283
Current derivatives assets 34 57 387
Other current assets 1,101 1,073 983
Operating taxes and levies receivables 1,045 918 893
Current tax assets 132 170 163
Prepaid expenses 594 540 495
Cash and cash equivalent 5,810 6,355 4,469
Total current assets 20,679 19,849 14,312
Assets held for sale (2) - - 5,788
Total assets 94,714 94,668 91,430
Equity and liabilities
Share capital 10,640 10,640 10,596
Share premiums and statutory reserve 16,859 16,859 16,790
Subordinated notes 5,803 5,803 5,803
Retained earnings (2,814) (2,614) (2,282)
Equity attributable to the owners of the parent company 30,488 30,688 30,907
Non-controlling interest 2,454 2,486 2,360
Total equity 32,942 33,174 33,267
Non-current financial liabilities 26,293 28,909 29,528
Non-current derivatives liabilities 1,002 578 252
Non-current fixed assets payable 610 907 1,004
Non-current employee benefits 2,674 3,029 3,142
Non-current provisions for dismantling 774 716 715
Non-current restructuring provisions 251 185 225
Other non-current liabilities 521 608 792
Deferred tax liabilities 611 658 879
Total non-current liabilities 32,736 35,590 36,537
Current financial liabilities 6,311 4,759 4,536
Current derivatives liabilities 34 50 131
Current fixed assets payable 3,046 2,800 2,728
Trade payables 6,522 6,211 6,227
Debts related to Orange Bank activities (1) 4,660 4,364 -
Current employee benefits 2,448 2,266 2,214
Current provisions for dismantling 15 21 18
Current restructuring provisions 126 190 189
Other current liabilities 1,935 1,530 1,695
Operating taxes and levies payables 1,262 1,241 1,318
Current tax payables 596 338 434
Deferred income 2,081 2,134 2,136
Total current liabilities 29,036 25,904 21,626
Liabilities related to assets held for sale (2) - - -
Total equity and liabilities 94,714 94,668 91,430 (1) Financial assets and liabilities, related to loans and debts to customers and credit institutions, classified as non-current as at December 31, 2016, have been fully reclassified as current
in 2017.
(2) Telkom Kenya and EE in 2015.

21
Appendix 3: consolidated statement of cash flows
(in millions of euros) 2017 2016 2015
Operating activities
Consolidated net income 2,143 3,263 2,958
Non-monetary items and reclassified items for presentation 11,542 10,019 9,921
Changes in working capital(1) 265 (631) 275
Other net cash out (3,776) (3,901) (3,627)
Net cash provided by operating activities (a) 10,174 8,750 9,527
o/w discontinued operations (EE) - 208 535
Investing activities
Purchases (sales) of property, plant and equipment and intangible assets(2) (7,378) (8,315) (6,441)
Cash paid for investment securities, net of cash acquired (34) (1,189) (3,455)
Investments in associates and joint ventures - (17) -
Others purchases of assets available for sale (43) (12) -
Purchases of equity securities measured at fair value (7) (1) (10)
Proceeds from sales of EE 50 4,481 -
Proceeds from sales of BT 433 - -
Proceeds from sales of investment securities, net of cash transferred 32 107 297
Decrease (increase) in securities and other financial assets (994) 67 203
Net cash used in investing activities (b) (7,941) (4,879) (9,406)
o/w discontinued operations (EE) - 4,481 -
Financing activities
Medium and long-term debt issuances 2,450 3,411 817
Medium and long-term debt redemptions and repayments (2,728) (2,694) (4,412)
Increase (decrease) of bank overdrafts and short-term borrowings 949 134 (101)
Decrease (increase) of cash collateral deposits (1,127) (884) 1,809
Exchange rates effects on derivatives, net (66) 201 320
Coupon on subordinated notes issuance (282) (291) (272)
Proceeds (purchases) from treasury shares (4) 2 (0)
Employees shareholding plans - - 32
Capital increase (decrease) - owners of the parent company - 113 -
Capital increase (decrease) - non-controlling interests 34 (4) -
Changes in ownership interests with no gain / loss of control 1 (16) (222)
Dividends paid to owners of the parent company (1,729) (1,596) (1,589)
Dividends paid to non-controlling interests (236) (259) (306)
Net cash used in financing activities (c) (2,738) (1,883) (3,924)
o/w discontinued operations (EE) - (220) (16)
Net change in cash and cash equivalents (a) + (b) + (c) (505) 1,988 (3,803)
Net change in cash and cash equivalents
Cash and cash equivalents - opening balance 6,355 4,469 6,758
o/w continuing operations 6,355 4,469 6,758
o/w discontinued operations - - -
Cash change in cash and cash equivalents (505) 1,988 (3,803)
Non-cash change in cash and cash equivalents (40) (102) 1,514
Monetary financial securities in connection with the offer on Jazztel - - 1,501
Effect of exchange rates changes on cash and cash equivalents and other non-
monetary effects (40) (102) 13
Cash and cash equivalents - closing balance 5,810 6,355 4,469 (1) Of which flows from operating activities related to Orange Bank and excluding operating tax receivables and payables. In 2016, the variance is mainly due to the payment of the fine for
the Enterprises Market litigation for (350) million euros.
(2) Investments in property, plant, equipment and intangible assets financed through finance leases amounting to 43 million euros (91 million euros at December 31, 2016 and
43 million euros at December 31, 2015) have no impact on the statement of cash flows at the time of acquisition.
22
Appendix 4: change in net financial debt* from 2016 to 2017
(in millions of euros, on an historical basis) December 31,
2017
December 31,
2016
Adjusted EBITDA- CAPEX from telecom activities 5,732 5,738
Change in CAPEX payables 307 305 (1)
Change in working capital requirements (64) (428) (2)
Licences and spectrum (617) (1,800)
Interest paid and interest rate effects on derivatives, net (net of dividends received) (1,273) (1,109)
Income taxes cash out (584) (906)
Other operational items (910) (1,146) (3)
Dividends paid to owners of parent company (1,729) (1,596) (4)
Dividends paid to non-controlling interests (236) (259)
Coupons on subordinated notes (282) (291)
Net of acquisitions and disposals 432 3,298 (5)
Other financial items (175) 302 (6)
Variation in net debt 601 2,108
Net financial debt* 23,843 24,444
Ratio of net financial debt / Adjusted EBITDA** 1.85x 1.93x
The amount of the net debt as of December 31, 2017 does not take into account the effect related to the February 2018 deposit of
approximately 346 million euros in connection with the Digicel dispute.
(1) The change in CAPEX vendors reflects the Group’s investment cycle and changes in investment levels from one period to the next.
(2) The change in working capital requirement reflects changes in the operating cycle from one period to the next. In 2016, it included in
particular the unfavorable impact of the fine paid to the Competition Authority in France for the Enterprise market (350 million euros).
(3) Other operational items include disbursements for the Part Time for Seniors Plan and for restructuring, receipt of payments related
to asset sales, and other operational items such as the change in operational tax debt.
(4) In 2017: balance of 2016 dividend paid on June 14, 2017 (0.40 euros per share) and 2017 interim dividend paid on December 7,
2017 (0.25 euros per share). In 2016: balance of 2015 dividend paid on June 23, 2016 (0.40 euros per share) and payment of the
2016 interim dividend on December 7, 2016 (0.20 euros per share).
(5) In 2017: sale of 1.33% of the share capital of BT Group for 433 million euros. In 2016: sale of Orange’s interest in EE, acquisition of
100% of Cellcom in Liberia, of Tigo in the Democratic Republic of the Congo, and of Airtel in Burkina Faso and Sierra Leone.
(6) In 2017, the other financial items correspond mainly to the impact of the financial hedges for the Group's exposure to pounds
sterling.
* Net financial debt as defined and used by Orange does not include the activities of Orange Bank, to which this concept does not
apply.
** The ratio of net financial debt to adjusted EBITDA from telecom activities is calculated based on the ratio of the Group’s net financial
debt to adjusted EBITDA from telecom activities calculated for the 12 previous months.

23
Appendix 5: analysis of adjusted consolidated EBITDA
2017 2016 change
comparable
basis
comparable
basis
In millions of euros (in %)
Full year data
Revenues 41,096 40,593 1.2 %
External purchases (18,475) (18,176) 1.6 %
as % of revenues 45.0 % 44.8 % 0.2 pt
of which:
Interconnection costs (5,252) (5,384) (2.5)%
as % of revenues 12.8 % 13.3 % (0.5) pt
Other network and IT expenses (3,074) (3,023) 1.7 %
as % of revenues 7.5 % 7.4 % 0.0 pt
Property, overheads, other expenses and capitalised costs (3,062) (3,018) 1.5 %
as % of revenues 7.5 % 7.4 % 0.0 pt
Commercial expenses and content costs (7,087) (6,751) 5.0 %
as % of revenues 17.2 % 16.6 % 0.6 pt
Labour expenses (8,198) (8,340) (1.7)%
as % of revenues 19.9 % 20.5 % (0.6) pt
Operating taxes and levies (1,851) (1,874) (1.2)%
Other operating income and expenses 247 335 -
Adjusted EBITDA* 12,819 12,538 2.2 %
2017 2016 change
comparable basis comparable basis
In millions of euros (in %)
4rth quarter
Revenues 10,546 10,361 1.8 %
External purchases (5,004) (4,902) 2.1 %
as % of revenues 47.5 % 47.3 % 0.1 pt
of which:
Interconnection costs (1,289) (1,377) (6.4)%
as % of revenues 12.2 % 13.3 % (1.1) pt
Other network and IT expenses (809) (788) 2.7 %
as % of revenues 7.7 % 7.6 % 0.1 pt
Property, overheads, other expenses and capitalized costs (788) (743) 6.1 %
as % of revenues 7.5 % 7.2 % 0.3 pt
Commercial expenses and content costs (2,118) (1,995) 6.2 %
as % of revenues 20.1 % 19.3 % 0.8 pt
Labour expenses (2,112) (2,084) 1.3 %
as % of revenues 20.0 % 20.1 % (0.1) pt
Operating taxes and levies (307) (313) (2.0)%
Other operating income and expenses 96 80 -
Adjusted EBITDA* 3,220 3,141 2.5 %
* Adjustments to the presentation of EBITDA are described in appendix 6.

24
Appendix 6: bridge table of adjusted data to consolidated income statement
2017 data 4rth quarter Full year data
In millions of euros Adjusted data
Presentation
adjustements
Income
statement Adjusted data
Presentation
adjustements
Income
statement
Revenues 10,546 10,546 41,096 41,096
External purchases (5,004) - (5,004) (18,475) - (18,475)
Other operating income 208 - 208 687 14 701
Other operating expense (111) (210) (321) (440) (290) (730)
Labour expenses (2,112) (287) (2,399) (8,198) (374) (8,572)
Operating taxes and levies (307) - (307) (1,851) 5 (1,846)
Gains (losses) on disposal - - - - (5) (5)
Restructuring and integration costs - (92) (92) - (167) (167)
Adjusted EBITDA 3,220 (589) 12,819 (817)
Significant litigation (210) 210 (271) 271
Specific labour expenses (287) 287 (374) 374
Review of the investments and business portfolio - - (5) 5
Restructuring and integration costs (92) 92 (167) 167
Other specific items - - - -
Reported EBITDA 2,631 2,631 12,002 12,002
2016 proforma data 4rth quarter Full year data
In millions of euros Adjusted data
Presentation
adjustements
Income
statement Adjusted data
Presentation
adjustements
Income
statement
Revenues 10,361 10,361 40,593 40,593
External purchases (4,902) - (4,902) (18,176) - (18,176)
Other operating income 192 - 192 779 7 787
Other operating expense (113) (27) (140) (444) (89) (533)
Labour expenses (2,084) (405) (2,489) (8,340) (526) (8,867)
Operating taxes and levies (313) (5) (318) (1,874) 85 (1,789)
Gains (losses) on disposal - - - - - -
Restructuring and integration costs - (148) (148) - (497) (497)
Adjusted EBITDA 3,141 (586) 12,538 (1,020)
Significant litigation (27) 27 10 (10)
Specific labour expenses (411) 411 (525) 525
Review of the investments and business portfolio - - - -
Restructuring and integration costs (148) 148 (497) 497
Other specific items* - - (8) 8
Reported EBITDA 2,555 2,555 11,518 11,518
2016 historical data 4rth quarter Full year data
In millions of euros Adjusted data
Presentation
adjustements
Income
statement Adjusted data
Presentation
adjustements
Income
statement
Revenues 10,516 10,516 40,918 40,918
External purchases (4,966) - (4,966) (18,281) - (18,281)
Other operating income 207 - 207 732 7 739
Other operating expense (161) (27) (188) (454) (89) (543)
Labour expenses (2,100) (405) (2,505) (8,340) (526) (8,866)
Operating taxes and levies (325) (5) (330) (1,893) 85 (1,808)
Gains (losses) on disposal - (9) (9) - 59 59
Restructuring and integration costs - (149) (149) - (499) (499)
Adjusted EBITDA 3,172 (596) 12,682 (963)
Significant litigation (27) 27 10 (10)
Specific labour expenses (411) 411 (525) 525
Review of the investments and business portfolio (9) 9 59 (59)
Restructuring and integration costs (149) 149 (499) 499
Other specific items* - - (8) 8
Reported EBITDA 2,576 2,576 11,719 11,719
* Transaction expenses related to negotiations with Bouygues Telecom in connection with discussions that had begun in the first quarter of 2016 concerning a business combination
between the two companies.
25
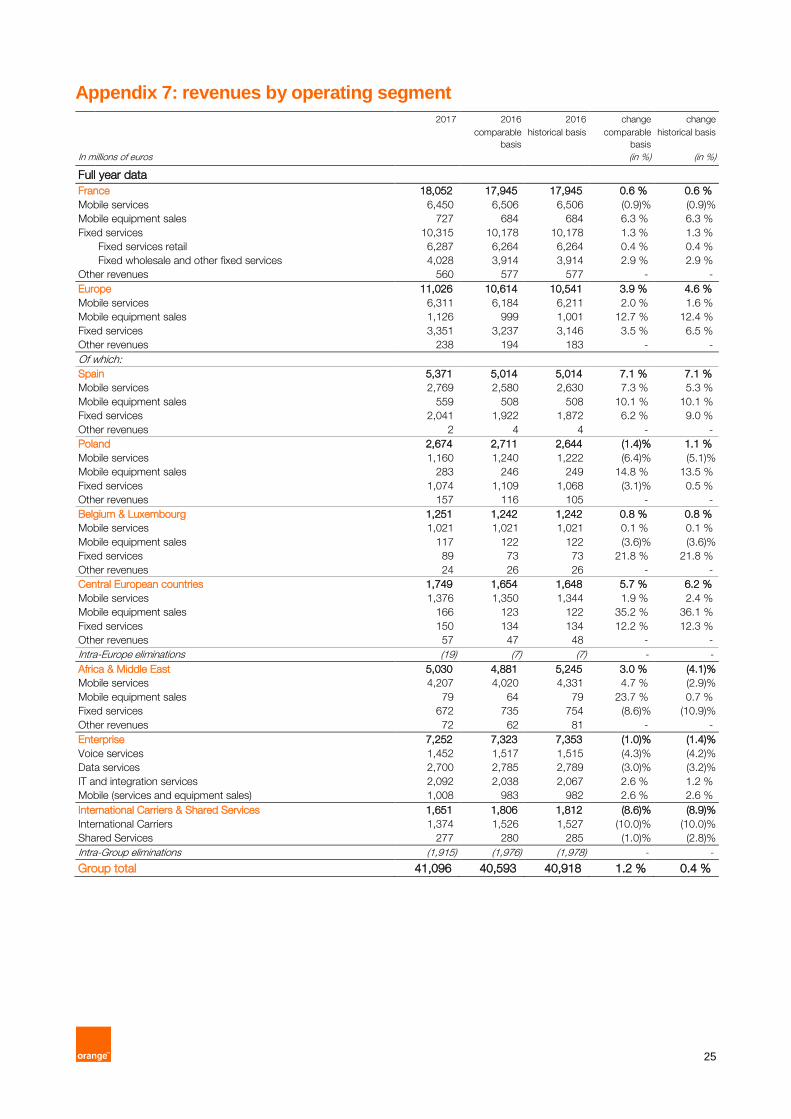
Appendix 7: revenues by operating segment
2017 2016 2016 change change
comparable
basis
historical basis comparable
basis
historical basis
In millions of euros (in %) (in %)
Full year data
France 18,052 17,945 17,945 0.6 % 0.6 %
Mobile services 6,450 6,506 6,506 (0.9)% (0.9)%
Mobile equipment sales 727 684 684 6.3 % 6.3 %
Fixed services 10,315 10,178 10,178 1.3 % 1.3 %
Fixed services retail 6,287 6,264 6,264 0.4 % 0.4 %
Fixed wholesale and other fixed services 4,028 3,914 3,914 2.9 % 2.9 %
Other revenues 560 577 577 - -
Europe 11,026 10,614 10,541 3.9 % 4.6 %
Mobile services 6,311 6,184 6,211 2.0 % 1.6 %
Mobile equipment sales 1,126 999 1,001 12.7 % 12.4 %
Fixed services 3,351 3,237 3,146 3.5 % 6.5 %
Other revenues 238 194 183 - -
Of which:
Spain 5,371 5,014 5,014 7.1 % 7.1 %
Mobile services 2,769 2,580 2,630 7.3 % 5.3 %
Mobile equipment sales 559 508 508 10.1 % 10.1 %
Fixed services 2,041 1,922 1,872 6.2 % 9.0 %
Other revenues 2 4 4 - -
Poland 2,674 2,711 2,644 (1.4)% 1.1 %
Mobile services 1,160 1,240 1,222 (6.4)% (5.1)%
Mobile equipment sales 283 246 249 14.8 % 13.5 %
Fixed services 1,074 1,109 1,068 (3.1)% 0.5 %
Other revenues 157 116 105 - -
Belgium & Luxembourg 1,251 1,242 1,242 0.8 % 0.8 %
Mobile services 1,021 1,021 1,021 0.1 % 0.1 %
Mobile equipment sales 117 122 122 (3.6)% (3.6)%
Fixed services 89 73 73 21.8 % 21.8 %
Other revenues 24 26 26 - -
Central European countries 1,749 1,654 1,648 5.7 % 6.2 %
Mobile services 1,376 1,350 1,344 1.9 % 2.4 %
Mobile equipment sales 166 123 122 35.2 % 36.1 %
Fixed services 150 134 134 12.2 % 12.3 %
Other revenues 57 47 48 - -
Intra-Europe eliminations (19) (7) (7) - -
Africa & Middle East 5,030 4,881 5,245 3.0 % (4.1)%
Mobile services 4,207 4,020 4,331 4.7 % (2.9)%
Mobile equipment sales 79 64 79 23.7 % 0.7 %
Fixed services 672 735 754 (8.6)% (10.9)%
Other revenues 72 62 81 - -
Enterprise 7,252 7,323 7,353 (1.0)% (1.4)%
Voice services 1,452 1,517 1,515 (4.3)% (4.2)%
Data services 2,700 2,785 2,789 (3.0)% (3.2)%
IT and integration services 2,092 2,038 2,067 2.6 % 1.2 %
Mobile (services and equipment sales) 1,008 983 982 2.6 % 2.6 %
International Carriers & Shared Services 1,651 1,806 1,812 (8.6)% (8.9)%
International Carriers 1,374 1,526 1,527 (10.0)% (10.0)%
Shared Services 277 280 285 (1.0)% (2.8)%
Intra-Group eliminations (1,915) (1,976) (1,978) - -
Group total 41,096 40,593 40,918 1.2 % 0.4 %

26
2017 2016 2016 change change
comparable
basis
historical basis comparable
basis
historical basis
In millions of euros (in %) (in %) 4rth quarter
France 4,644 4,566 4,566 1.7 % 1.7 %
Mobile services 1,650 1,609 1,609 2.5 % 2.5 %
Mobile equipment sales 249 227 227 10.0 % 10.0 %
Fixed services 2,597 2,575 2,575 0.8 % 0.8 %
Fixed services retail 1,594 1,564 1,564 1.9 % 1.9 %
Fixed wholesale and other fixed services 1,003 1,011 1,011 (0.7)% (0.7)%
Other revenues 148 155 155 - -
Europe 2,832 2,767 2,742 2.3 % 3.3 %
Mobile services 1,581 1,565 1,572 1.1 % 0.6 %
Mobile equipment sales 313 305 306 2.7 % 2.2 %
Fixed services 855 833 805 2.6 % 6.1 %
Other revenues 83 65 59 - -
Of which:
Spain 1,373 1,307 1,307 5.0 % 5.0 %
Mobile services 698 658 671 6.1 % 4.1 %
Mobile equipment sales 153 142 142 7.6 % 7.6 %
Fixed services 521 505 492 3.1 % 5.8 %
Other revenues 0 2 2 - -
Poland 688 704 681 (2.4)% 0.9 %
Mobile services 287 305 300 (5.9)% (4.4)%
Mobile equipment sales 72 82 84 (12.8)% (14.4)%
Fixed services 272 275 260 (1.2)% 4.4 %
Other revenues 58 43 37 - -
Belgium & Luxembourg 318 322 322 (1.3)% (1.3)%
Mobile services 250 259 259 (3.3)% (3.3)%
Mobile equipment sales 35 38 38 (7.3)% (7.3)%
Fixed services 25 19 19 29.2 % 29.2 %
Other revenues 8 6 6 - -
Central European countries 459 435 433 5.6 % 6.1 %
Mobile services 350 344 343 1.7 % 2.1 %
Mobile equipment sales 53 43 42 24.8 % 25.7 %
Fixed services 38 34 34 11.5 % 11.7 %
Other revenues 18 14 14 - -
Intra-Europe eliminations (5) (1) (1) - -
Africa & Middle East 1,274 1,205 1,359 5.7 % (6.2)%
Mobile services 1,056 989 1,141 6.8 % (7.4)%
Mobile equipment sales 26 18 22 42.0 % 15.9 %
Fixed services 173 184 182 (6.0)% (4.8)%
Other revenues 20 15 14 - -
Enterprise 1,859 1,860 1,887 (0.1)% (1.5)%
Voice services 362 376 378 (3.6)% (4.1)%
Data services 660 676 689 (2.3)% (4.1)%
Data services 576 556 566 3.6 % 1.8 %
Mobile (services and equipment sales) 260 252 254 3.0 % 2.1 %
International Carriers & Shared Services 417 449 451 (7.2)% (7.7)%
International Carriers 339 383 384 (11.4)% (11.6)%
Shared Services 77 66 67 17.4 % 14.4 %
Intra-Group eliminations (479) (486) (488) - -
Group total 10,546 10,361 10,516 1.8 % 0.3 %

27
Appendix 8: key performance indicators
December 31,
2017
December 31,
2016
Orange Group historical basis
Total number of customers* (millions) 272.810 262.830
Mobile customers* (millions) 211.419 201.350
- of which contract customers (millions) 74.582 69.556
Fixed broadband customers (millions) 19.534 18.658
TV customers (millions) 9.065 8.483
Orange - French market**
Mobile services
Number of customers* (millions) 31.777 30.033
- of which contract customers (millions) 28.821 26.486
Fixed services
Number of broadband customers (millions) 11.485 11.151
Broadband market share at end of period (%) 40.4*** 40.2
Number of fixed line subscribers (millions) 18.380 18.831
France
Mobile services
Number of customers* (millions) 21.803 21.677
- of which contract customers (millions) 18.847 18.130
Blended ARPU quarterly (euros) 22.4 21.9
Fixed services
Number of broadband customers (millions) 11.228 10.889
- of which FTTH customers (millions) 1.999 1.452
Number of TV customers (millions) 6.861 6.609
Broadband ARPU quarterly (euros) 34.9 33.5
Number of fixed line subscribers (millions) 15.804 16.038
Number of wholesale lines (millions) 13.736 14.008
Europe****
Mobile services
Number of customers* (millions) 49.103 50.628
- of which contract customers (millions) 34.571 33.211
Fixed services
Number of broadband customers (millions) 7.104 6.609
Number of TV customers (millions) 2.147 1.820
Number of fixed lines (millions) 8.594 8.794
Spain
Mobile services
Number of customers* (millions) 15.893 15.727
- of which contract customers (millions) 13.069 12.531
Blended ARPU quarterly (euros) 14.2 13.5
Number of MVNO customers (millions) 2.970 2.403
Fixed services
Number of broadband customers (millions) 4.152 4.132
- of which FTTH customers (millions) 2.260 1.610
Number of TV customers (thousands) 626 507
Broadband ARPU quarterly (euros) 33.1 31.7
* Excluding customers of MVNOs ** Customers from Orange France and Enterprise sector in France. *** Company estimate.
**** Europe: Spain, Poland, Belgium & Luxembourg, and Central European countries.
28
December 31,
2017
December 31,
2016
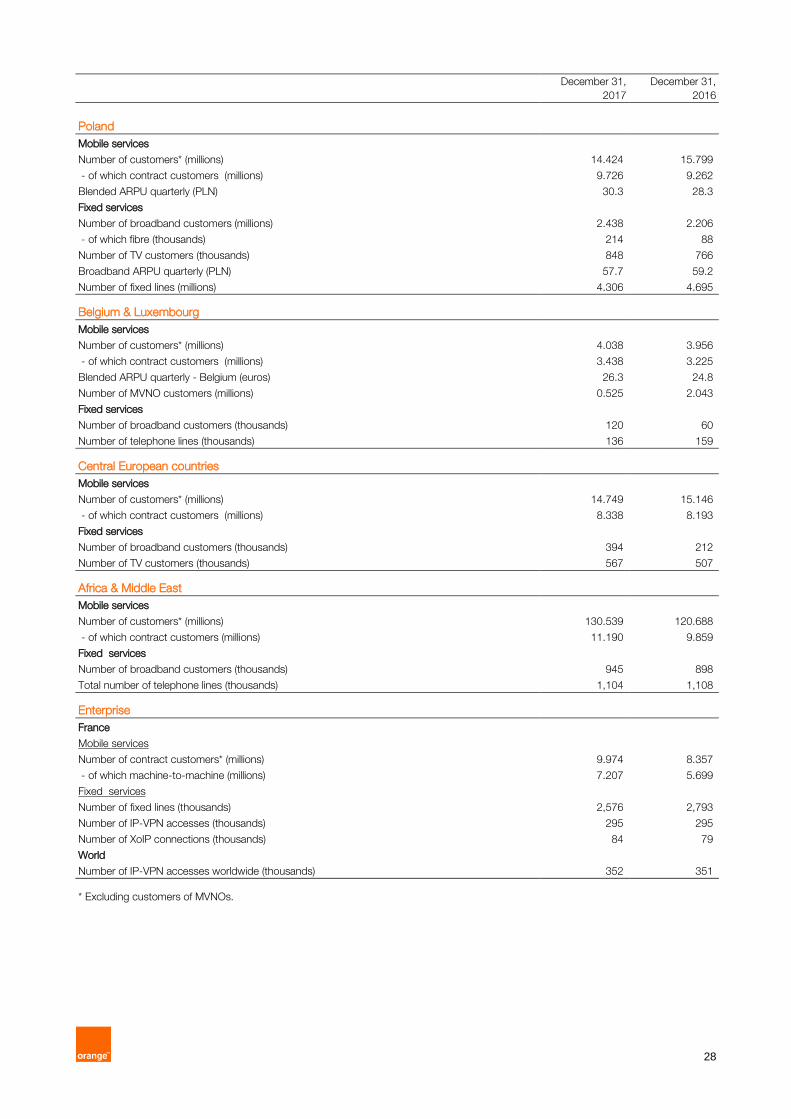
Poland
historical basis
Mobile services
Number of customers* (millions) 14.424 15.799
- of which contract customers (millions) 9.726 9.262
Blended ARPU quarterly (PLN) 30.3 28.3
Fixed services
Number of broadband customers (millions) 2.438 2.206
- of which fibre (thousands) 214 88
Number of TV customers (thousands) 848 766
Broadband ARPU quarterly (PLN) 57.7 59.2
Number of fixed lines (millions) 4.306 4.695
Belgium & Luxembourg
Mobile services
Number of customers* (millions) 4.038 3.956
- of which contract customers (millions) 3.438 3.225
Blended ARPU quarterly - Belgium (euros) 26.3 24.8
Number of MVNO customers (millions) 0.525 2.043
Fixed services
Number of broadband customers (thousands) 120 60
Number of telephone lines (thousands) 136 159
Central European countries
Mobile services
Number of customers* (millions) 14.749 15.146
- of which contract customers (millions) 8.338 8.193
Fixed services
Number of broadband customers (thousands) 394 212
Number of TV customers (thousands) 567 507
Africa & Middle East
Mobile services
Number of customers* (millions) 130.539 120.688
- of which contract customers (millions) 11.190 9.859
Fixed services
Number of broadband customers (thousands) 945 898
Total number of telephone lines (thousands) 1,104 1,108
Enterprise
France
Mobile services
Number of contract customers* (millions) 9.974 8.357
- of which machine-to-machine (millions) 7.207 5.699
Fixed services
Number of fixed lines (thousands) 2,576 2,793
Number of IP-VPN accesses (thousands) 295 295
Number of XoIP connections (thousands) 84 79
World
Number of IP-VPN accesses worldwide (thousands) 352 351
* Excluding customers of MVNOs.

29
Appendix 9: glossary
Key figures
Data on a comparable basis: data based on comparable accounting principles, scope of consolidation and exchange rates are
presented for previous periods. The transition from data on an historical basis to data on a comparable basis consists of keeping the
results for the period ended and then restating the results for the corresponding period of the preceding year for the purpose of
presenting, over comparable periods, financial data with comparable accounting principles, scope of consolidation and exchange rate.
The method used is to apply to the data of the corresponding period of the preceding year, the accounting principles and scope of
consolidation for the period just ended as well as the average exchange rate used for the income statement for the period ended.
Changes in data on a comparable basis reflect organic business changes. Data on a comparable basis is not a financial aggregate as
defined by IFRS and may not be comparable to similarly-named indicators used by other companies.
Reported EBITDA: operating income before depreciation and amortisation, before impacts related to acquisitions of controlling interests,
before reversal of reserves of liquidated entities, before impairment of goodwill and assets, and before income from associates. Reported
EBITDA is not a financial aggregate as defined by IFRS standards and may not be directly comparable to similarly-named indicators in other
companies.
Adjusted EBITDA: reported EBITDA (see definition), adjusted for the impacts of key disputes, specific personnel expenses, the review
of the portfolio of shares and operations, restructuring and consolidation costs, and, as applicable, other specific and systematically
identified items. Adjusted EBITDA is not a financial aggregate as defined by IFRS standards and may not be directly comparable to
similarly-named indicators in other companies.
CAPEX: capital expenditure on tangible and intangible assets excluding telecommunication licences and investments through finance leases.
CAPEX is not a financial performance indicator as defined by IFRS standards and may not be directly comparable to indicators referenced by
similarly-named indicators in other companies.
Operating Cash Flow: Equals adjusted EBITDA minus CAPEX. Orange uses this indicator to measure the performance of the Group in
generating cash from its operations. Operating Cash Flow is not a financial aggregate defined by IFRS and may not be comparable to
similarly-named indicators used by other companies.
Mobile services
Revenues from mobile services: include revenues generated by incoming and outgoing calls (voice, SMS and data services), network
access fees, added-value services, machine to machine, roaming revenues from customers of other networks (national and
international roaming), revenues with mobile virtual network operators (MVNO) and revenues from network sharing.
Mobile ARPU: the quarterly average revenues per user (ARPU) are calculated by dividing the revenues from incoming and outgoing
calls (voice, SMS and data services), network access fees, added-value services and international roaming over the past three months,
by the weighted average number of customers over the same period, excluding "machine to machine" customers. The weighted
average number of customers is the average of the monthly averages during the period in question. The monthly average is the
arithmetic mean of the number of customers at the start and end of the month. Mobile ARPU is expressed as monthly revenues per
customer.
Roaming: use of a mobile service on the network of an operator other than that of the subscriber.
MVNO: Mobile Virtual Network Operator. These are operators that do not have their own radio network and thus use the infrastructure
of third-party networks.
Fixed services
Includes traditional fixed telephony, fixed broadband services, enterprise solutions and networks24 and carrier services (notably
national and international interconnections, unbundling and wholesale telephone line rentals).
Fixed broadband ARPU (ADSL, Fibre, VDSL, Fixed-4G, satellite and WiMAX): the quarterly average revenues per user (ARPU) of
broadband services per year are calculated by dividing the revenues generated by consumer broadband services over the past three
months by the weighted average number of connections over the same period. The weighted average number of connections is the
average of the monthly averages during the period in question. The monthly average is the arithmetic mean of the number of
connections at the start and end of the month. Fixed broadband ARPU is expressed as monthly revenues per connection.
Fixed 4G (fLTE): fixed broadband offer using 4G technology as a substitute for the fixed-line network.
Convergence
Convergent offers customer base: consists of customers that have subscribed to offers combining at least a fixed broadband
connection and a mobile contract.
ARPCO (Average quarterly Revenues Per Convergent Offer): ARPCO is calculated by dividing the revenues from consumer convergent
offers (excluding equipment sales) generated in the preceding three months by the weighted average number of consumer convergent
offers in the same period. ARPCO is expressed by monthly revenues per convergent offer.
24 With the exception of France, where enterprise solutions and networks are listed under the Enterprise business segment.