academic strategies committee june 20, 2013
TRANSCRIPT

Academic Strategies Committee June 20, 2013
Oregon State Board of Higher Education Academic Strategies Committee Page ii May 2013
Oregon State Board of Higher Education Academic Strategies Committee
Thursday, June 20, 2013
3:00-5:00 p.m. ASRC 515, Portland State University
Agenda
Page ACTION ITEMS 1. Approval of May 2013 Minutes (5 minutes) ............................................................................. 1
2. Program Approvals (10 minutes)
• PSU, MS in Global Supply Chain Management ........................................................... 5 • WOU, BA/BS in Early Childhood Studies ..................................................................... 7 • WOU, Applied Baccalaureate in Gerontology ............................................................. 9 • WOU, Applied Baccalaureate in Psychology ............................................................. 11
3. Credit for Prior Learning Policy (Marrongelle, 10 minutes) ................................................... 13
4. Achievement Compact Targets (Kieran, 20 minutes) ............................................................. 19 DISCUSSION/ACTION ITEMS 5. Campus Diversity Goals and Strategies (Marrongelle, 30 minutes) ....................................... 65
6. Oregon Education Investment Board Equity Lens (Marrongelle, 20 minutes) ...................... 87
DISCUSSION ITEMS
7. Campus 40-40-20 Strategies (Marrongelle, 15 minutes) ....................................................... 95
INFORMATION ITEMS
8. Board Policy on Accreditation Virtual Site Visits (Marrongelle, 10 minutes) OTHER ITEMS 9. Other items put forward by the Committee
10. Adjournment

Oregon State Board of Higher Education Academic Strategies Committee Page 1 ACTION ITEMS
Academic Strategies Committee May 2, 2013
ASRC 515, Portland State University
Minutes
Committee members present: Chair James Francesconi, Brianna Coulombe, Jill Eiland, Emily Plec, and David Yaden. Jim Middleton was absent.
Chancellor’s staff present: Karen Marrongelle, Bridget Burns, Rod Johnson, Laura McKinney, Melody Rose, Di Saunders, Bruce Schafer, Anna Teske, and Charles Triplett.
Campus representatives present: Steve Adkison (EOU), Brad Burda (OIT), Sona Andrews and Jilma Meneses (PSU), Jim Klein (SOU), Steve Scheck (WOU), and David Robinson (OSHU).
ACTION ITEMS 1. Call to Order
Chair Francesconi called the meeting of the Academic Strategies Committee to order at 2:15 p.m. 2. Approval of March 27th Minutes
ACTION: Directors Jill Eiland made the motion to approve the minutes and Emily Plec seconded. Motion carried.
3. Consideration of Board Policy on Student Loan Debt Management Chair Francesconi called on Di Saunders, Director of Communications, to summarize the development of a policy on Student Loan Debt Management. In recent years, the number of students that use student loans and the amount of debt incurred has increased. In light of this trend, Oregon University System (OUS) staff convened a Working Group on Student Loan Management with representation from each OUS institutions. To date, the work has included summarizing current institutional practices that assist students manage student loan debt, and exercises that detail what campuses plan to do in the future, and what they would do with additional resources. It was pointed out that borrowing becomes a problem for some students when they assume debt that will cause a high debt-to income ratio, affecting students in low-paying professions; students who do not graduate; students that are unable to secure employment for an extended period of time following graduation; or students with little or no borrowing experience.

Oregon State Board of Higher Education Academic Strategies Committee Page 2 ACTION ITEMS
As a result of this work, staff recommends the State Board of Higher Education adopt the proposed policy on Student Loan Debt Management. The policy requires all OUS institutions to help students who borrow federal student loans to understand their rights and responsibilities regarding their student loan borrowing, debt, and repayment. In addition, the policy calls for additional support and programs beyond federally mandated counseling to assist students, especially those considered most at risk for default.
ACTION: Directors Jill Eiland made the motion to approve the Student Debt Management policy and David Yaden seconded. Motion carried.
NEXT STEPS: The policy on Student Loan Debt Management will be placed on the June 21, 2013, agenda for consideration of the full Board.
INFORMATIONAL ITEMS 4. Credit for Prior Learning Update Chair Francesconi called upon Karen Marrongelle, Interim Vice Chancellor for Academic Strategies, to provide an overview of Systemwide work on Credit for Prior Learning (CPL). The CPL task force has crafted a policy recommendation, which is currently under review by the Provosts’ Council. This recommendation will act as a roadmap to major best practices and policy issues related to CPL. Discussion centered on how institutions can make CPL more transparent and understandable for students, and the importance of clarifying roles and responsibilities for faculty and staff. Concern was expressed about the impact CPL may have on degree quality, noting that the key to quality control rests in the modes of assessment utilized by the faculty.
NEXT STEPS: Staff will work with the Provosts’ Council to finalize feedback on the CPL Policy Framework, and offer a final policy recommendation for consideration at the June 20th ASC meeting.
5. Research Collaboratory Update Chair Francesconi provided a status update on funding for the proposed Research Collaboratory. It was noted that the likelihood of the proposal receiving funding is high, with estimates of $10.5 million allocated to the operating budget and $10 million in capital. In April, Governor Kitzhaber designated the Regional Accelerator Innovation Network (RAIN), as an Oregon Solutions project, with the intent of assisting technology start-ups by offering support that will promote collaborations through public-private partnerships, and advancing ideas and research that benefit both local economies and institutions.
NEXT STEPS: Chair Francesconi will continue to update the committee on an as needed basis.

Oregon State Board of Higher Education Academic Strategies Committee Page 3 ACTION ITEMS
DISCUSSION ITEMS 6. Campus Work on Diversity and 40-40-20 Chair Francesconi called on Dr. Marrongelle to provide the committee with an update on campus diversity goals and 40-40-20 strategies. At the January 2013 meeting, the Academic Strategies Committee requested information from campuses around their diversity initiatives to address student and faculty/staff recruitment and retention. This type of reporting is meant to allow for both Systemwide- and campus-level review of institutional diversity goals. In addition, staff created a framework of state demographic data, including high school graduation rates, broken down by race and ethnicity. Discussion centered on the flat trend in public high school graduation rates, and the growing number of students of color. In addition, the committee agreed that there is considerable work to do to address the issue of retention, noting that the state has lost ground with African American and Hispanic students.
After a lengthy discussion, the committee offered its reaction to the draft diversity report, and requested feedback from the Provosts’ Council regarding institutional goals. Feedback included: the inclusion of a section addressing retention issues, transfer rates, more specificity about the types of problems and issues that need to be addressed in the report and tactics currently in use to help, and the development of a call to action that translates the report’s findings into action-oriented strategies. In addition, emphasis should be placed on collaborations at the middle and high school level, by creating a robust college going culture, and addressing unmet need.
The committee discussed the intersection of campus diversity goals and 40-40-20 noting that campuses will likely see a trend in enrollment diversification. Discussion pointed to the basic assumptions that should be made in order to serve all Oregonians, noting that the definition of Oregonian should be further refined, in part due to shifting demographics as a result of the state’s current economic conditions. It was agreed that staff should develop a definitions and general assumptions section in order to flesh out the intricacies of the 40-40-20 goal. Attention was drawn to capacity needs and how institutions may target resources toward strategies that will help achieve the state-wide goal. The committee agreed that campuses need to be prepared to enact strategies to meet 40-40-20 with or without additional fiscal resources, noting that some things may be achievable while others are not.
NEXT STEPS: Campuses will continue to work with staff to establish realistic stretch goals. The Academic Strategies Committee will consider campus diversity goals and strategies for achieving 40-40-20. The Committee will discuss a plan for presenting this work to the full Board in June.
OTHER ITEMS 7. No other items were put forward by the committee
8. Adjournment With no further business, the meeting was adjourned at 4:31 p.m.

Oregon State Board of Higher Education Academic Strategies Committee Page 4 ACTION ITEMS
(This page intentionally left blank.)

Oregon State Board of Higher Education Academic Strategies Committee Page 5 ACTION ITEMS
Academic Strategies Committee New Academic Program Proposal
Portland State University – M.S. in Global Supply Chain Management
Portland State University seeks Board approval to offer an instructional program leading to a M.S. degree in Global Supply Chain Management. 1. Describe the purpose and relationship of the proposed program to the institution’s mission
and strategic plan.
The proposed M.S. in Global Supply Chain Management is connected most directly to three of Portland State University’s strategic priorities:
Global Excellence – This program takes a global perspective in each course. It will teach students about the structure and complexity of global supply chains and connect them to regional, national and international companies operating such supply chains. Furthermore, all students will be required to participate in an international field study, extending their knowledge of the value chain to the context of different countries.
Community Engagement – Given the breadth of professional working in the supply and logistics area within the Portland Metro region, guest speakers will be used often in the courses. Also, student teams will conduct capstone projects to assist small, medium, and large companies in the community improve their operations.
Sustainability – A key differentiator for this program is its emphasis on corporate social responsibility and environmental stewardship. One of the core courses is Reverse Logistics and Sustainability; the Global Sourcing, Global Logistics, and Supply Chain Strategy courses will cover key issues is socially and ethical responsible practices in supply chain management.
2. What evidence of need does the institution have for the program?
There is a well-recognized shortage of supply chain management professionals: According to Analytics, “Our Hiring Scale™ shows that supply chain professionals are likely to be moderately difficult to recruit. Hiring has increased, while the talent supply of supply chain skilled workers has not grown as fast.” The regional business community is highly supportive of the proposed degree. Letters of support from regional and national business leaders include: Eric Anderson, General Manager of Direct Marking Products, Xerox Corporation; Anita Decker, Chief Operating Officer, Bonneville Power Administration; Steve Flunker, Director of International Transportation, Abercrombie & Fitch; Calvin Johnston, President and CEO, Leopold & Stevens, Inc.; and Gerry Rogers, Vice President, Global Supply Chain, Nike, Inc.
Oregon State Board of Higher Education Academic Strategies Committee Page 6 ACTION ITEMS
The concept and plan for this proposed degree has been presented to the School of Business Administration’s Business Advisory Council on two occasions. On each occasion, the Council members have voiced unanimous, strong support for the degree.
3. Are there similar programs in the state? If so, how does the proposed program supplement, complement, or collaborate with those programs?
There are no programs of this nature in the state of Oregon.
4. What new resources will be needed initially and on a recurring basis to implement the program? How will the institution provide these resources? What efficiencies or revenue enhancements are achieved with this program, including consolidation or elimination of programs over time, if any?
The new program will fund one tenure-track position starting in year two of the program. The current recourses with this new position appear adequate to support the new program and reach the AQ status required for accreditation. The program is planned to be revenue positive for the School of Business. While some small efficiencies will exist with consolidation of elective courses for the MBA students taking the M.S. in Global Supply Chain Management courses, the program will not eliminate another program in the Graduate School of Business.
All appropriate University committees and the OUS Provosts’ Council have positively reviewed the proposed program. RECOMMENDATION TO THE COMMITTEE The OUS Provosts’ Council recommends that the Board’s Academic Strategies Committee authorize Portland State University to establish an instructional program leading to a Master of Science (M.S.) degree in Global Supply Chain Management, effective Fall 2013. With the Committee approval, a five-year follow-up review of this program will be conducted in 2018-19. (Committee action required.)
Oregon State Board of Higher Education Academic Strategies Committee Page 7 ACTION ITEMS
Academic Strategies Committee New Academic Program Proposal
Western Oregon University – B.A./B.S. in Early Childhood Studies
Western Oregon University seeks Board approval to offer an instructional program leading to a B.A./B.S. degree in Early Childhood Studies. 1. Describe the purpose and relationship of the proposed program to the institution’s mission
and strategic plan. The Early Childhood Studies major is a non-licensure option for students interested in working with children, birth-4th grade, in inclusive early childhood settings. This new major will prepare skillful and reflective leaders that are advocates for children and families. The interdisciplinary major prepares students for careers in Head Start, child care, preschools, therapeutic early childhood settings, and early childhood special education settings. The proposed major complements Western Oregon University’s (WOU) institutional mission to “work in partnership with PK-12 schools, community colleges, and local communities” and addresses WOU’s new Achievement Compact goals aligned to the following: (a) more bachelor’s degrees awarded to transfer students from community colleges; (b) more degrees awarded in targeted workforce areas (e.g., Head Start) to meet state needs; (c) more degrees, certificates, and endorsements in teacher education areas; (d) increased total enrollment and retention for first generation/low income students; and (e) more bachelor’s degrees awarded to underrepresented minority Oregonians.
2. What evidence of need does the institution have for the program? According to the US Department of Labor, Bureau of Labor Statistics, employment of preschool teachers is expected to grow nationally by 25 percent from 2010 to 2020, which is a rate faster than for the average of other occupations. Oregon Head Start Collaborative has identified a large need for trained staff with skills blending early childhood and special education. In addition, the current American Association for Employment in Education (AAEE) survey shows a shortage of early childhood personnel for Oregon, Washington, and Idaho. Federal Head Start guidelines have also changed requiring all program teachers to obtain a bachelor’s degree. This program has been developed in partnership with Chemeketa Community College and in consultation with Linn-Benton Community College to assure smooth transitions between Applied Associates degrees in early childhood fields.
3. Are there similar programs in the state? If so, how does the proposed program supplement, complement, or collaborate with those programs? There are several online Early Childhood degree completion programs in the OUS but no program has a systematic emphasis on inclusive practices and early childhood special

Oregon State Board of Higher Education Academic Strategies Committee Page 8 ACTION ITEMS
education. Feedback through WOU’s partnership work at Chemeketa Community College indicates this student population prefers a face-to-face program. Collaboration between WOU and other universities, as well as community colleges, happens through ongoing conversation and events such as the Articulation Summit, the annual meeting between early childhood faculty members in order to ensure the preparation of a highly qualified early childhood workforce.
4. What new resources will be needed initially and on a recurring basis to implement the program? How will the institution provide these resources? What efficiencies or revenue enhancements are achieved with this program, including consolidation or elimination of programs over time, if any? No consolidation or program elimination is necessary and much of the faculty and programmatic infrastructure for this new major already exists at WOU. Small increases in staffing will be offset by increased enrollment. Initial estimates suggest up to 30 students per year transferring from Chemeketa Community College as well as others from the existing early childhood education workforce.
All appropriate University committees and the OUS Provosts’ Council have positively reviewed the proposed program. RECOMMENDATION TO THE COMMITTEE The OUS Provosts’ Council recommends that the Board’s Academic Strategies Committee authorize Western Oregon University to establish an instructional program leading to a B.A./B.S. degree in Early Childhood Studies, effective Fall 2013. With Committee approval, a five-year follow-up review of this program will be conducted in 2018-19. (Committee action required.)
Oregon State Board of Higher Education Academic Strategies Committee Page 9 ACTION ITEMS
Academic Strategies Committee New Academic Program Proposal
Western Oregon University – Applied Baccalaureate in Gerontology
Western Oregon University seeks Board approval to offer an instructional program leading to an Applied Baccalaureate degree in Gerontology. 1. Describe the purpose and relationship of the proposed program to the institution’s mission
and strategic plan. The proposed Applied Baccalaureate (AB) degree in Gerontology will provide students with terminal associate of science level credits the option to continue their education in a time-expeditious fashion currently not available with the B.A./B.S. degree. This is in keeping with Western Oregon University’s (WOU) mission to provide accessible, effective learning opportunities that serve the public good and addresses HB 3093’s call for the development of applied baccalaureates. Townsend, Bragg, and Ruud (2008) defined the applied baccalaureate degree as “a bachelor’s degree designed to incorporate applied associate courses and degrees once considered as ‘terminal’ or non-baccalaureate level while providing students with the higher-order thinking skills and advanced technical knowledge and skills so desired in today’s job market.” The Applied Baccalaureate degree will be an efficient degree route for students already holding Associates degrees; these students will be able to apply their associate’s degree coursework directly to the AB degree.
2. What evidence of need does the institution have for the program? There is a need for trained professionals to work in the numerous fields related to gerontology, elder care services, and geriatric medicine. The proposed major will positively contribute to the state’s economy (and 40-40-20 goals) through creating a more competitive workforce. In Oregon and nationally, the percentage of older adults in the population is undergoing a dramatic increase. According to data compiled by the Administration on Aging, by the year 2030 there will be approximately 70 million Americans age 65 and over, up from 40 million in 2010. The U.S. Census Bureau estimated that Oregon’s older adult population is increasing at a rate of 3.5 percent as compared to the national median of 2.6 percent. In addition to the growing older adult population requiring specialized services, there are also unmet work force training needs. According the U.S. Department of Labor, employment in home health care services are expected to increase 69.5 percent between 2004 and 2014, during the same time period, community care services for the elderly are expected to see a 54.8 percent increase in the need for qualified employees. People from a broad range of career fields who have received training in gerontology will be very marketable and provide important services for our community.

Oregon State Board of Higher Education Academic Strategies Committee Page 10 ACTION ITEMS
3. Are there similar programs in the state? If so, how does the proposed program supplement, complement, or collaborate with those programs? Our review indicates that while there are various gerontology minors, concentrations within majors, graduate programs, and gerontology certificates in Oregon, there are no other AB degree offerings specifically in gerontology. This degree will complement WOU’s existing undergraduate B.A./B.S. degree in Gerontology.
4. What new resources will be needed initially and on a recurring basis to implement the program? How will the institution provide these resources? What efficiencies or revenue enhancements are achieved with this program, including consolidation or elimination of programs over time, if any? The AB in Gerontology is cost neutral, using existing course offerings, faculty, and library resources, making use of current unused curricular capacity. This new program will bring new students to WOU. Indeed, additional enrollment in the curriculum associated with this proposed degree is desirable and is part of the University’s Window of Opportunity sustainability plan.
All appropriate University committees and the OUS Provosts’ Council have positively reviewed the proposed program. RECOMMENDATION TO THE COMMITTEE The OUS Provosts’ Council recommends that the Board’s Academic Strategies Committee authorize Western Oregon University to establish an instructional program leading to an Applied Baccalaureate degree in Gerontology, effective Fall 2013. With Committee approval, a five-year follow-up review of this program will be conducted in 2018-19. (Committee action required.)
Oregon State Board of Higher Education Academic Strategies Committee Page 11 ACTION ITEMS
Academic Strategies Committee New Academic Program Proposal
Western Oregon University – Applied Baccalaureate in Psychology
Western Oregon University seeks Board approval to offer an instructional program leading to an Applied Baccalaureate degree in Psychology. 1. Describe the purpose and relationship of the proposed program to the institution’s mission
and strategic plan. The proposed Applied Baccalaureate (AB) degree in Psychology will provide students with terminal associate of science level credits the option to continue their education in a time-expeditious fashion currently not available with the B.A./B.S. degree. This is in keeping with Western Oregon University’s (WOU) mission to provide accessible, effective learning opportunities that serve the public good and addresses HB 3093’s call for the development of applied baccalaureates. Townsend, Bragg and Ruud (2008) defined the applied baccalaureate degree as “a bachelor’s degree designed to incorporate applied associate courses and degrees once considered as ‘terminal’ or non-baccalaureate level while providing students with the higher-order thinking skills and advanced technical knowledge and skills so desired in today’s job market.” The Applied Baccalaureate degree will be an efficient degree route for students already holding Associates degrees; these students will be able to apply their Associates degree coursework directly to the AB degree.
2. What evidence of need does the institution have for the program? WOU currently has over 400 Psychology majors pursuing either a B.A. or B.S. Western frequently encounter students who have a terminal associate degree from an Oregon community college that note it will take excessive time to complete the traditional B.A./B.S. degree. The AB degree option would tap into that underserved market. This additional degree option will open up the opportunity for students who have a terminal associate degree to be able to earn a bachelor degree in shorter time that the B.A./B.S. tracks. The proposed major will positively contribute to the state’s economy (and 40-40-20 goals) through creating a more competitive workforce. The American Psychology Association recently reported that the United States will need an additional 19,700 additional psychologists between 2008 and 2018, a 12 percent increase. But other professions such as social work are also experiencing growth. For example, the U.S. Department of Labor predicts a 22 percent increase in the need for social workers between 2006 and 2016 and a 30 percent increase in substance abuse social workers for the same time period.

Oregon State Board of Higher Education Academic Strategies Committee Page 12 ACTION ITEMS
3. Are there similar programs in the state? If so, how does the proposed program supplement, complement, or collaborate with those programs? Our review indicates that while there are various psychology minors, concentrations within majors, graduate programs, and certificates in Oregon, there are no other AB degrees in psychology available in Oregon that are targeted to the student with a terminal AS degree.
4. What new resources will be needed initially and on a recurring basis to implement the
program? How will the institution provide these resources? What efficiencies or revenue enhancements are achieved with this program, including consolidation or elimination of programs over time, if any? The AB in Psychology is cost neutral, using existing course offerings, faculty, and library resources, making use of current unused curricular capacity. This new program will bring new students to WOU. Indeed, additional enrollment in the curriculum associated with this proposed degree is desirable and is part of the University’s Window of Opportunity sustainability plan.
All appropriate University committees and the OUS Provosts’ Council have positively reviewed the proposed program. RECOMMENDATION TO THE COMMITTEE The OUS Provosts’ Council recommends that the Board’s Academic Strategies Committee authorize Western Oregon University to establish an instructional program leading to an Applied Baccalaureate degree in Psychology, effective Fall 2013. With Committee approval, a five-year follow-up review of this program will be conducted in 2018-19. (Committee action required.)

Oregon State Board of Higher Education Academic Strategies Committee Page 13 ACTION ITEMS
Academic Strategies Committee Oregon University System
Credit for Prior Learning Policy Each Oregon University System institution will establish, if not already in place, a policy on Credit for Prior Learning. Credit for Prior Learning policies should be established and regularly updated at the institutional level by the faculty. Decisions about the components of the policy should be made at the campus-level and should support the campus culture and mission. Credit for Prior Learning policies should be transparent and accessible to students; materials and information about Credit for Prior Learning should be transparent to students. Further, Credit for Prior Learning policies should not necessarily result in fundamental changes in faculty work. The Credit for Prior Learning Policy Framework, stated below, outlines twelve policy components that each campus policy should address. The Framework was developed by the OUS Credit for Prior Learning Workgroup and endorsed by the OUS Provosts’ Council, and is a roadmap to the major best practices and policy issues related to Credit for Prior Learning.
CREDIT FOR PRIOR LEARNING (CPL) POLICY FRAMEWORK
Institutions will:
I. Establish Guiding Principles for a CPL Policy
Such principles might cover the value of offering credit for prior learning, the essential role of the faculty, or the application of assessment methods to emerging sites of learning.
II. Determine the Types of Assessment Accepted, for Example: i. Portfolio-Based Assessment;1
ii. Standardized Exams;2 1. Advanced Placement (AP) examinations; 2. International Baccalaureate (IB) examinations; 3. College Level Examination Program (CLEP) examinations; 4. Excelsior examination; 5. DANTES Subject Standardized Tests (DSST). NOTE: Many schools do not accept
DANTES and DSST. ii. Challenge Exams;3 iii. Published Guides;
1. American Council on Education (ACE) for military training and experience and corporate training;
1 Through portfolio-based assessment, students produce evidence of prior learning comparable to identified course outcomes. CAEL offers a portfolio-based review service, but many institutions develop their portfolio review processes in closer partnership with faculty in the appropriate area of expertise. 2 The minimum score to earn academic credit should be clearly identified in the policy, as should the courses at each institution that can be earned through specific standardized tests. 3 Challenge exams are faculty created and graded examinations.

Oregon State Board of Higher Education Academic Strategies Committee Page 14 ACTION ITEMS
2. ACE (non-collegiate) for industrial and corporate training programs. iv. “Other” category reserved for new assessments addressing emerging types of
learning, e.g., MOOCs.
III. Develop Standards/Criteria for Awarding CPL, which might include: i. Enrollment. For how long or how many credits should a student have been enrolled prior to
receiving or applying for CPL? ii. Type of credits: Can CPL apply to only general education courses? Electives? Major
requirements? Lower division only? iii. Number of credits4: How many CPL credits can a student apply to his or her degree? To major
requirements? iv. Residency: Do CPL credits count toward institutional residency requirement? v. Other credit thresholds: For instance, professional school requirements and financial aid
eligibility.
IV. Develop a Cost/Tuition Structure5 A comprehensive policy should determine a tuition or fee structure for awarding various types of CPL.6 CPL may cause new patterns of enrollment that will impact university finances. Upper division courses are often more expensive to deliver. The more students who “bypass” lower division courses, the more resources are diverted from other services on campus.
V. Collaborate with other institutions to determine CPL Transferability
VI. Develop a Clear and Consistent Method of CPL Transcription
VII. Collect Data and Respond to Reporting Requests Data will be an essential part of policy review. Data on CPL should be tracked and reported to the System as requested to study the effects of CPL policies on campuses.
VIII. Provide Faculty and Staff Development a. Build capacity amongst faculty/staff to support CPL advising and portfolio or other assessment; b. Provide space and support for developing these shared assessment tools.
IX. Determine Authority a. Identify at the institutional level, the body with decision-making authority regarding CPL policy b. Establish an ongoing, Systemwide coordinating or advisory group.
4 Care should be taken here to align CPL policies with potential excess credit differential policies so as not to inappropriately penalize students for taking advantage of CPL. 5 Note: CPL does not count as part of a student’s financial aid eligibility. 6 E.g., EOU APEL fees are $50 per credit. CAEL Portfolio Review fees are $250 for up to 12 credits in any one discipline (For example, 1-12 credits attempted in business: $250; 12-24 credits attempted in the same discipline: $500. Credits attempted in additional disciplines follow the same structure). ACE credit transcription requires a registration fee of $40 which includes one copy of a student transcript. Each additional copy is $15.
Oregon State Board of Higher Education Academic Strategies Committee Page 15 ACTION ITEMS
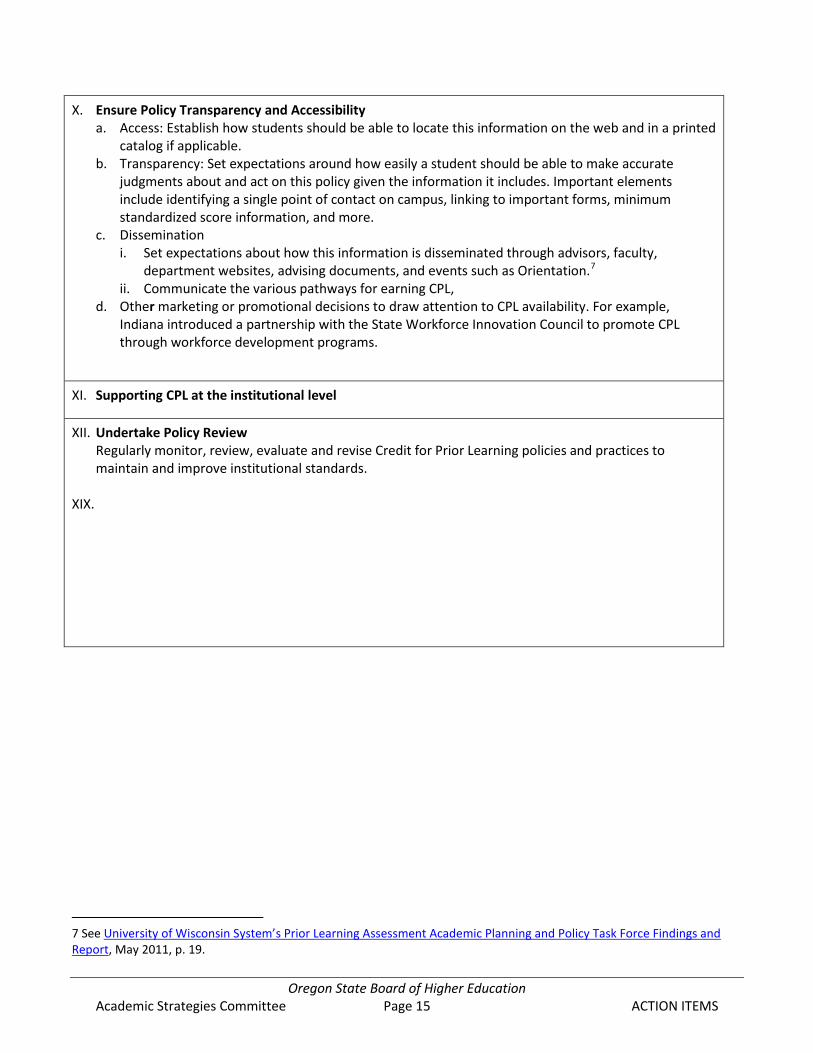
X. Ensure Policy Transparency and Accessibility a. Access: Establish how students should be able to locate this information on the web and in a printed
catalog if applicable. b. Transparency: Set expectations around how easily a student should be able to make accurate
judgments about and act on this policy given the information it includes. Important elements include identifying a single point of contact on campus, linking to important forms, minimum standardized score information, and more.
c. Dissemination i. Set expectations about how this information is disseminated through advisors, faculty,
department websites, advising documents, and events such as Orientation.7 ii. Communicate the various pathways for earning CPL,
d. Other marketing or promotional decisions to draw attention to CPL availability. For example, Indiana introduced a partnership with the State Workforce Innovation Council to promote CPL through workforce development programs.
XI. Supporting CPL at the institutional level
XII. Undertake Policy Review Regularly monitor, review, evaluate and revise Credit for Prior Learning policies and practices to maintain and improve institutional standards.
XIX.
7 See University of Wisconsin System’s Prior Learning Assessment Academic Planning and Policy Task Force Findings and Report, May 2011, p. 19.
Oregon State Board of Higher Education Academic Strategies Committee Page 16 ACTION ITEMS
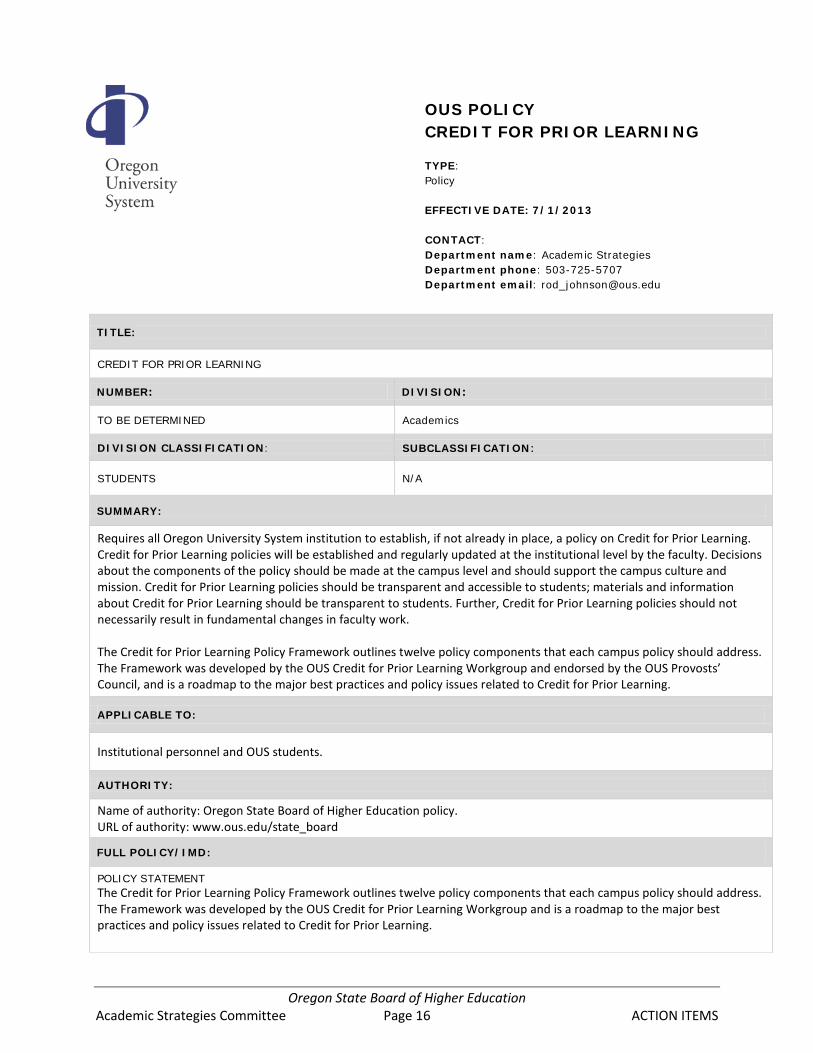
OUS POLICY CREDIT FOR PRIOR LEARNING TYPE: Policy EFFECTIVE DATE: 7/1/2013 CONTACT: Department name: Academic Strategies Department phone: 503-725-5707 Department email: [email protected]
TITLE:
CREDIT FOR PRIOR LEARNING
NUMBER: DIVISION:
TO BE DETERMINED Academics
DIVISION CLASSIFICATION: SUBCLASSIFICATION:
STUDENTS N/A
SUMMARY:
Requires all Oregon University System institution to establish, if not already in place, a policy on Credit for Prior Learning. Credit for Prior Learning policies will be established and regularly updated at the institutional level by the faculty. Decisions about the components of the policy should be made at the campus level and should support the campus culture and mission. Credit for Prior Learning policies should be transparent and accessible to students; materials and information about Credit for Prior Learning should be transparent to students. Further, Credit for Prior Learning policies should not necessarily result in fundamental changes in faculty work. The Credit for Prior Learning Policy Framework outlines twelve policy components that each campus policy should address. The Framework was developed by the OUS Credit for Prior Learning Workgroup and endorsed by the OUS Provosts’ Council, and is a roadmap to the major best practices and policy issues related to Credit for Prior Learning.
APPLICABLE TO:
Institutional personnel and OUS students.
AUTHORITY:
Name of authority: Oregon State Board of Higher Education policy. URL of authority: www.ous.edu/state_board
FULL POLICY/IMD:
POLICY STATEMENT The Credit for Prior Learning Policy Framework outlines twelve policy components that each campus policy should address. The Framework was developed by the OUS Credit for Prior Learning Workgroup and is a roadmap to the major best practices and policy issues related to Credit for Prior Learning.
Oregon State Board of Higher Education Academic Strategies Committee Page 17 ACTION ITEMS
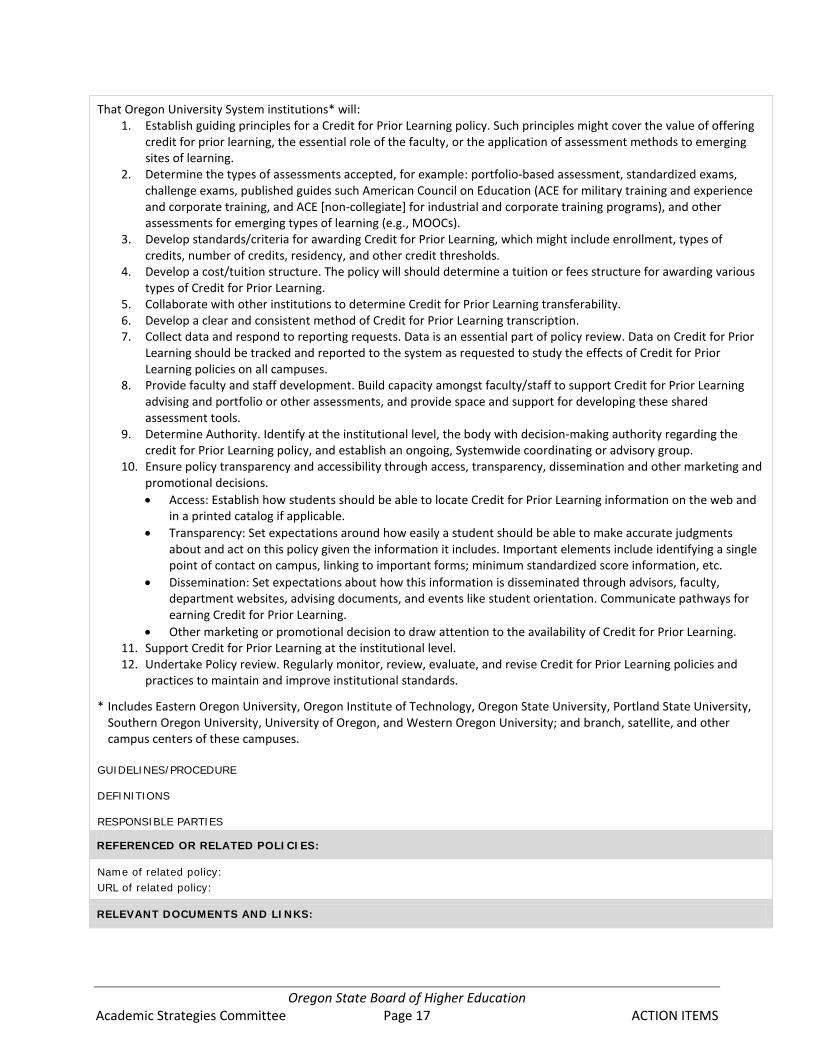
That Oregon University System institutions* will: 1. Establish guiding principles for a Credit for Prior Learning policy. Such principles might cover the value of offering
credit for prior learning, the essential role of the faculty, or the application of assessment methods to emerging sites of learning.
2. Determine the types of assessments accepted, for example: portfolio-based assessment, standardized exams, challenge exams, published guides such American Council on Education (ACE for military training and experience and corporate training, and ACE [non-collegiate] for industrial and corporate training programs), and other assessments for emerging types of learning (e.g., MOOCs).
3. Develop standards/criteria for awarding Credit for Prior Learning, which might include enrollment, types of credits, number of credits, residency, and other credit thresholds.
4. Develop a cost/tuition structure. The policy will should determine a tuition or fees structure for awarding various types of Credit for Prior Learning.
5. Collaborate with other institutions to determine Credit for Prior Learning transferability. 6. Develop a clear and consistent method of Credit for Prior Learning transcription. 7. Collect data and respond to reporting requests. Data is an essential part of policy review. Data on Credit for Prior
Learning should be tracked and reported to the system as requested to study the effects of Credit for Prior Learning policies on all campuses.
8. Provide faculty and staff development. Build capacity amongst faculty/staff to support Credit for Prior Learning advising and portfolio or other assessments, and provide space and support for developing these shared assessment tools.
9. Determine Authority. Identify at the institutional level, the body with decision-making authority regarding the credit for Prior Learning policy, and establish an ongoing, Systemwide coordinating or advisory group.
10. Ensure policy transparency and accessibility through access, transparency, dissemination and other marketing and promotional decisions. • Access: Establish how students should be able to locate Credit for Prior Learning information on the web and
in a printed catalog if applicable. • Transparency: Set expectations around how easily a student should be able to make accurate judgments
about and act on this policy given the information it includes. Important elements include identifying a single point of contact on campus, linking to important forms; minimum standardized score information, etc.
• Dissemination: Set expectations about how this information is disseminated through advisors, faculty, department websites, advising documents, and events like student orientation. Communicate pathways for earning Credit for Prior Learning.
• Other marketing or promotional decision to draw attention to the availability of Credit for Prior Learning. 11. Support Credit for Prior Learning at the institutional level. 12. Undertake Policy review. Regularly monitor, review, evaluate, and revise Credit for Prior Learning policies and
practices to maintain and improve institutional standards.
* Includes Eastern Oregon University, Oregon Institute of Technology, Oregon State University, Portland State University, Southern Oregon University, University of Oregon, and Western Oregon University; and branch, satellite, and other campus centers of these campuses.
GUIDELINES/PROCEDURE DEFINITIONS RESPONSIBLE PARTIES
REFERENCED OR RELATED POLICIES:
Name of related policy: URL of related policy:
RELEVANT DOCUMENTS AND LINKS:

Oregon State Board of Higher Education Academic Strategies Committee Page 18 ACTION ITEMS
Name of document or link: URL of document or link:
HISTORY:
APPROVAL DATE: Click here to enter a date. EFFECTIVE DATE: Click here to enter a date. LAST UPDATED: Click here to enter a date. HISTORICAL DETAIL NOTES: To be reviewed by OSBHE, not yet approved. SOURCE: None of the above
FOR POLICY WEBSITE INPUT
PUBLIC AUDIENCE SEARCH
☒ Students ☐ Faculty ☐ CO Employees ☒ University Employees ☐ Visitors/Other

Oregon State Board of Higher Education Academic Strategies Committee Page 19 ACTION ITEMS
Academic Strategies Committee Oregon University System
Achievement Compact Targets BACKGROUND Target setting for the Achievement Compacts was a collaborative process between the OUS Chancellor’s Office and campus provosts, including campus institutional research and enrollment management offices. The OUS office of institutional research, in conjunction with the director of performance measurement and surveys, compiled all data, including preliminary projections and targets. Campuses were provided with drafts of 2011-12 actuals, 2012-13 projections, and 2013-14 targets prior to the Provosts’ Council meeting held on May 9, 2013. The draft document was discussed during the May 9 Provosts’ Council and a small subcommittee of provosts and OUS staff also met on May 16 to refine metrics being reported under the Quality section of the document. Campus provosts, along with their offices of institutional research or enrollment management, checked all reported data for accuracy, reconciled it with their own reports, consulted with OUS institutional research, and made recommendations for changes to targets on or by May 23. OUS made appropriate adjustments, including updating targets where necessary. STAFF RECOMMENDATION TO THE COMMITTEE It is the recommendation of the staff that the Academic Strategies Committee to approve the 2011-12 actuals, 2012-13 projections, and 2013-14 targets in these 2013-14 Achievement Compacts and forward to the full Board for approval at the June 21st meeting, for submission to the OEIB by their July 1 deadline. (Committee action required.)
June 2013 Academic Strategies Committee/ OUS Board Meetings Page | 1
OUS ACHIEVEMENT COMPACT 2013-14
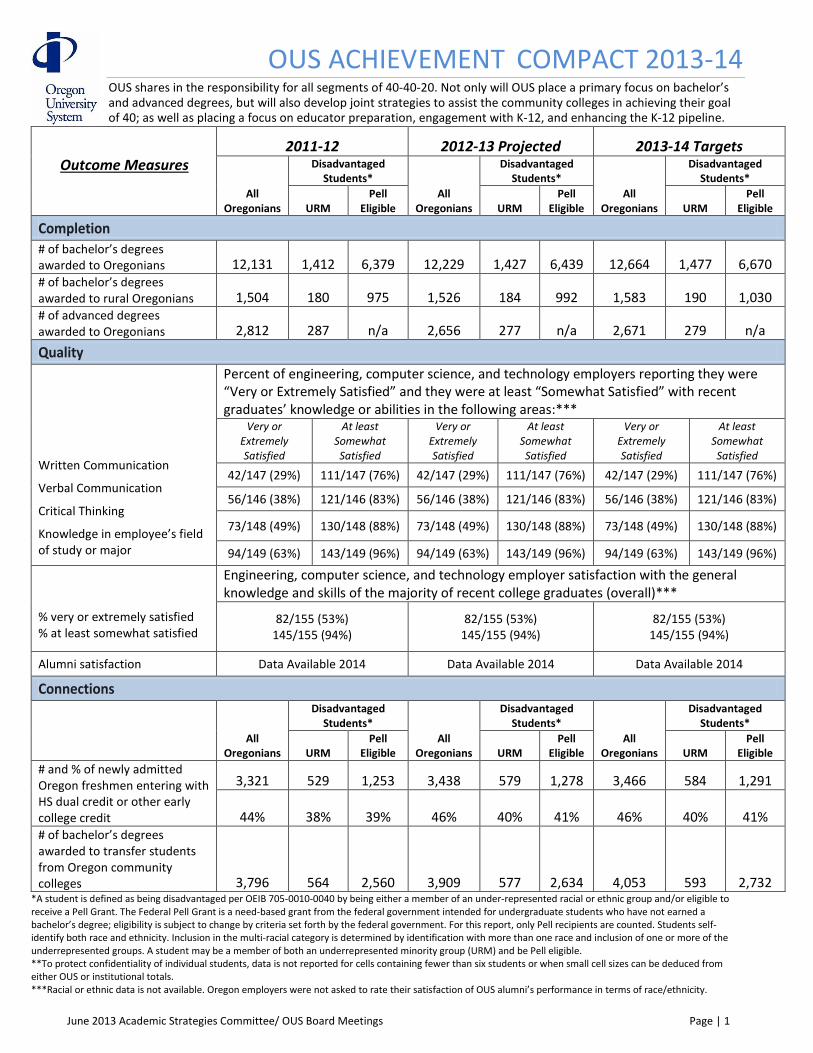
OUS shares in the responsibility for all segments of 40-40-20. Not only will OUS place a primary focus on bachelor’s and advanced degrees, but will also develop joint strategies to assist the community colleges in achieving their goal of 40; as well as placing a focus on educator preparation, engagement with K-12, and enhancing the K-12 pipeline.
Outcome Measures
2011-12 2012-13 Projected 2013-14 Targets
All Oregonians
Disadvantaged Students*
All Oregonians
Disadvantaged Students*
All Oregonians
Disadvantaged Students*
URM Pell
Eligible URM Pell
Eligible URM Pell
Eligible
Completion # of bachelor’s degrees awarded to Oregonians 12,131 1,412 6,379 12,229 1,427 6,439 12,664 1,477 6,670 # of bachelor’s degrees awarded to rural Oregonians 1,504 180 975 1,526 184 992 1,583 190 1,030 # of advanced degrees awarded to Oregonians 2,812 287 n/a 2,656 277 n/a 2,671 279 n/a Quality
Written Communication
Verbal Communication
Critical Thinking
Knowledge in employee’s field of study or major
Percent of engineering, computer science, and technology employers reporting they were “Very or Extremely Satisfied” and they were at least “Somewhat Satisfied” with recent graduates’ knowledge or abilities in the following areas:***
Very or Extremely Satisfied
At least Somewhat Satisfied
Very or Extremely Satisfied
At least Somewhat Satisfied
Very or Extremely Satisfied
At least Somewhat Satisfied
42/147 (29%) 111/147 (76%) 42/147 (29%) 111/147 (76%) 42/147 (29%) 111/147 (76%)
56/146 (38%) 121/146 (83%) 56/146 (38%) 121/146 (83%) 56/146 (38%) 121/146 (83%)
73/148 (49%) 130/148 (88%) 73/148 (49%) 130/148 (88%) 73/148 (49%) 130/148 (88%)
94/149 (63%) 143/149 (96%) 94/149 (63%) 143/149 (96%) 94/149 (63%) 143/149 (96%)
% very or extremely satisfied % at least somewhat satisfied
Engineering, computer science, and technology employer satisfaction with the general knowledge and skills of the majority of recent college graduates (overall)***
82/155 (53%) 145/155 (94%)
82/155 (53%) 145/155 (94%)
82/155 (53%) 145/155 (94%)
Alumni satisfaction Data Available 2014 Data Available 2014 Data Available 2014
Connections
All Oregonians
Disadvantaged Students*
All Oregonians
Disadvantaged Students*
All Oregonians
Disadvantaged Students*
URM Pell
Eligible URM Pell
Eligible URM Pell
Eligible # and % of newly admitted Oregon freshmen entering with HS dual credit or other early college credit
3,321 529 1,253 3,438 579 1,278 3,466 584 1,291
44% 38% 39% 46% 40% 41% 46% 40% 41% # of bachelor’s degrees awarded to transfer students from Oregon community colleges 3,796 564 2,560 3,909 577 2,634 4,053 593 2,732
*A student is defined as being disadvantaged per OEIB 705-0010-0040 by being either a member of an under-represented racial or ethnic group and/or eligible to receive a Pell Grant. The Federal Pell Grant is a need-based grant from the federal government intended for undergraduate students who have not earned a bachelor’s degree; eligibility is subject to change by criteria set forth by the federal government. For this report, only Pell recipients are counted. Students self-identify both race and ethnicity. Inclusion in the multi-racial category is determined by identification with more than one race and inclusion of one or more of the underrepresented groups. A student may be a member of both an underrepresented minority group (URM) and be Pell eligible. **To protect confidentiality of individual students, data is not reported for cells containing fewer than six students or when small cell sizes can be deduced from either OUS or institutional totals. ***Racial or ethnic data is not available. Oregon employers were not asked to rate their satisfaction of OUS alumni’s performance in terms of race/ethnicity.
June 2013 Academic Strategies Committee/ OUS Board Meetings Page | 2
OUS ACHIEVEMENT COMPACT 2013-14 Investment:
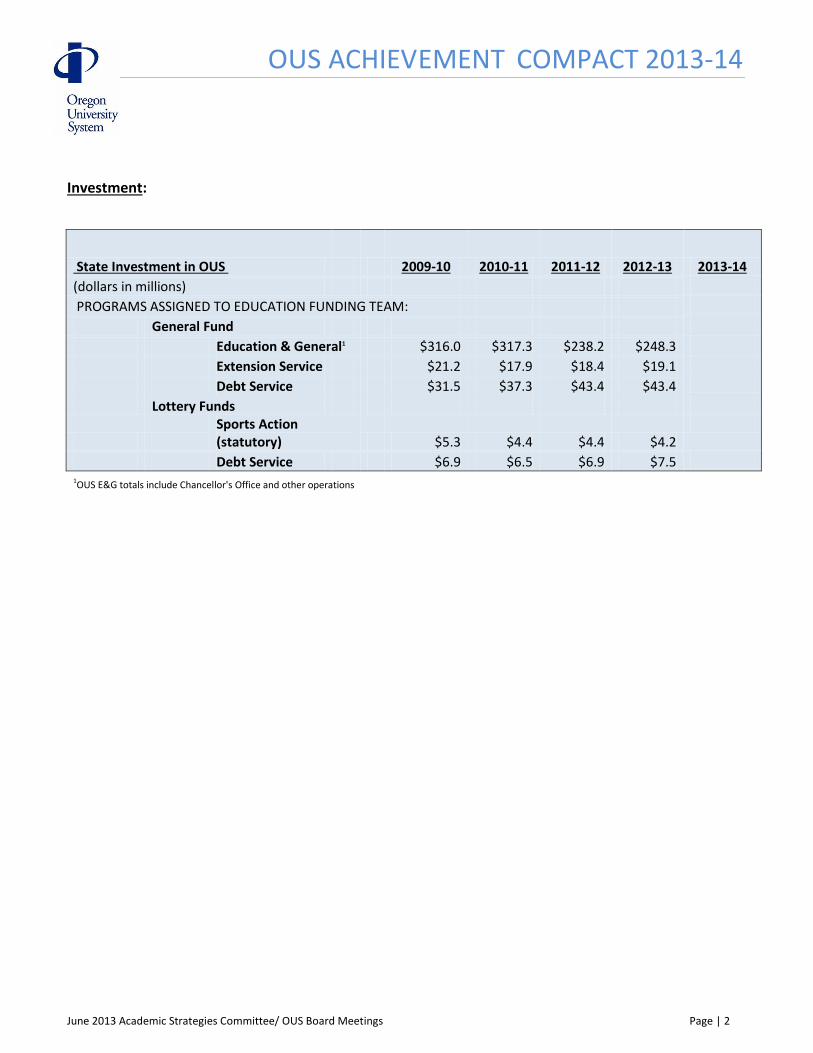
State Investment in OUS 2009-10 2010-11 2011-12 2012-13 2013-14 (dollars in millions) PROGRAMS ASSIGNED TO EDUCATION FUNDING TEAM: General Fund Education & General1 $316.0 $317.3 $238.2 $248.3 Extension Service $21.2 $17.9 $18.4 $19.1 Debt Service $31.5 $37.3 $43.4 $43.4 Lottery Funds
Sports Action (statutory) $5.3 $4.4 $4.4 $4.2
Debt Service $6.9 $6.5 $6.9 $7.5 1OUS E&G totals include Chancellor's Office and other operations

June 2013 Academic Strategies Committee/ OUS Board Meetings Page | 3
OUS ACHIEVEMENT COMPACT 2013-14
Disadvantaged Students 2011-12
Outcome Measures Actual for 2011-12
Disadvantaged Students*
African-American
Hispanic/ Latino
Native Amer.
or Alaskan Native
Pacific Islander
Multi- Racial or Multi-
Ethnic Pell
Eligible
Completion
# of bachelor’s degrees awarded to Oregonians 222 715 204 61 210 6,379 # of bachelor’s degrees awarded to rural Oregonians 7 103 35 8 27 975 # of advanced degrees awarded to Oregonians 46 145 38 8 50 n/a Quality
Alumni Satisfaction Data Available 2014
Connections
# and % of newly admitted Oregon freshmen entering with HS dual credit or other early college credit
33 263 33 11 189 1,253
24% 36% 38% 31% 46% 39% # of bachelor’s degrees awarded to transfer students from Oregon community colleges 85 297 87 20 75 2,560
*A student is defined as being disadvantaged per OEIB 705-0010-0040 by being either a member of an under-represented racial or ethnic group and/or eligible to receive a Pell Grant. The Federal Pell Grant is a need-based grant from the federal government intended for undergraduate students who have not earned a bachelor’s degree; eligibility is subject to change by criteria set forth by the federal government. For this report, only Pell recipients are counted. Students self-identify both race and ethnicity. Inclusion in the multi-racial category is determined by identification with more than one race and inclusion of one or more of the underrepresented groups. A student may be a member of both an underrepresented minority group (URM) and be Pell eligible. **To protect confidentiality of individual students, data is not reported for cells containing fewer than six students or when small cell sizes can be deduced from either OUS or institutional totals.

June 2013 Academic Strategies Committee/ OUS Board Meetings Page | 4
OUS ACHIEVEMENT COMPACT 2013-14
Disadvantaged Students 2012-13 Projections
Outcome Measures 2012-13 Projections
Disadvantaged Students*
African-American
Hispanic/ Latino
Native Amer.
or Alaskan Native
Pacific Islander
Multi- Racial or Multi-
Ethnic Pell
Eligible
Completion
# of bachelor’s degrees awarded to Oregonians 223 722 207 61 214 6,439 # of bachelor’s degrees awarded to rural Oregonians 7 106 36 8 27 992 # of advanced degrees awarded to Oregonians 45 138 37 8 49 n/a Quality
Alumni Satisfaction Data Available 2014
Connections
# and % of newly admitted Oregon freshmen entering with HS dual credit or other early college credit
36 296 33 7 207 1,278
23% 41% 42% 20% 47% 41% # of bachelor’s degrees awarded to transfer students from Oregon community colleges 84 306 89 20 78 2,634
*A student is defined as being disadvantaged per OEIB 705-0010-0040 by being either a member of an under-represented racial or ethnic group and/or eligible to receive a Pell Grant. The Federal Pell Grant is a need-based grant from the federal government intended for undergraduate students who have not earned a bachelor’s degree; eligibility is subject to change by criteria set forth by the federal government. For this report, only Pell recipients are counted. Students self-identify both race and ethnicity. Inclusion in the multi-racial category is determined by identification with more than one race and inclusion of one or more of the underrepresented groups. A student may be a member of both an underrepresented minority group (URM) and be Pell eligible. **To protect confidentiality of individual students, data is not reported for cells containing fewer than six students or when small cell sizes can be deduced from either OUS or institutional totals.

June 2013 Academic Strategies Committee/ OUS Board Meetings Page | 5
OUS ACHIEVEMENT COMPACT 2013-14
Disadvantaged Students 2013-14 Targets
Outcome Measures 2013-14 Targets
Disadvantaged Students*
African-American
Hispanic/ Latino
Native Amer.
or Alaskan Native
Pacific Islander
Multi- Racial or Multi-
Ethnic Pell
Eligible
Completion
# of bachelor’s degrees awarded to Oregonians 230 749 213 63 222 6,670 # of bachelor’s degrees awarded to rural Oregonians 7 109 39 8 27 1,030 # of advanced degrees awarded to Oregonians 45 140 37 8 49 n/a Quality
Alumni Satisfaction Data Available 2014
Connections
# and % of newly admitted Oregon freshmen entering with HS dual credit or other early college credit
36 298 33 7 209 1,291
23% 41% 42% 20% 47% 41% # of bachelor’s degrees awarded to transfer students from Oregon community colleges 87 316 90 21 79 2,732 *A student is defined as being disadvantaged per OEIB 705-0010-0040 by being either a member of an under-represented racial or ethnic group and/or eligible to receive a Pell Grant. The Federal Pell Grant is a need-based grant from the federal government intended for undergraduate students who have not earned a bachelor’s degree; eligibility is subject to change by criteria set forth by the federal government. For this report, only Pell recipients are counted. Students self-identify both race and ethnicity. Inclusion in the multi-racial category is determined by identification with more than one race and inclusion of one or more of the underrepresented groups. A student may be a member of both an underrepresented minority group (URM) and be Pell eligible **To protect confidentiality of individual students, data is not reported for cells containing fewer than six students or when small cell sizes can be deduced from either OUS or institutional totals.

June 2013 Academic Strategies Committee/ OUS Board Meetings Page | 6
OUS ACHIEVEMENT COMPACT 2013-14 Eastern Oregon University Mission: EOU guides student inquiry through integrated, high-quality liberal arts and professional programs that lead to responsible and reflective action in a diverse and interconnected world. As an educational, cultural, and scholarly center, EOU connects the rural regions of Oregon to a wider world. Our beautiful setting and small size enhance the personal attention our students receive, while partnerships with colleges, universities, agencies, and communities add to the educational possibilities of our region and state. EOU Institutional Core Themes & Associated Goals Theme 1: EOU has high quality liberal arts and professional programs that prepare students for the world beyond
college. Goal 1: Foster and assess student learning Goal 2: Ensure faculty and staff success
Theme 2: EOU is a regional University with a deep sense of commitment to students where they are. Goal 3: Serve students where they are Goal 4: Make excellence inclusive Goal 5: Adopt and enhance appropriate educational technologies
Theme 3: EOU is the educational, cultural and economic engine of eastern Oregon.
Goal 6: Foster Partnerships Goal 7: Ensure a fiscally and environmentally sustainable university environment Goal 8: Provide programs and resources to respond to high demand regional needs
Theme 4: EOU provides personal, student-centered experience in both the curricular and co-curricular programs.
Goal 9: Ensure access and success for all students Goal 10: Provide opportunities for students and faculty to engage with their community

June 2013 Academic Strategies Committee/ OUS Board Meetings Page | 7
OUS ACHIEVEMENT COMPACT 2013-14
Outcome Measures
2011-12 2012-13 Projected 2013-14 Targets
All Oregonians
Disadvantaged Students*
All Oregonians
Disadvantaged Students*
All Oregonians
Disadvantaged Students*
URM Pell
Eligible URM Pell
Eligible URM Pell
Eligible
Completion # of bachelor’s degrees awarded to Oregonians 448 34 291 487 37 316 506 39 328 # of bachelor’s degrees awarded to rural Oregonians 247 16 176 267 17 190 278 18 198 # of advanced degrees awarded to Oregonians 89 ** n/a 74 ** n/a 75 ** n/a Quality
Written Communication Verbal Communication Critical Thinking Knowledge in employee’s field of study
Percent of engineering, computer science, and technology employers reporting they were “Very or Extremely Satisfied” and they were at least “Somewhat Satisfied” with recent graduates’ knowledge or abilities in the following areas:***
Very or Extremely Satisfied
At least Somewhat Satisfied
Very or Extremely Satisfied
At least Somewhat Satisfied
Very or Extremely Satisfied
At least Somewhat Satisfied
Sample size <10 Sample size <10 Sample size <10
Sample size < 10 Sample size <10 Sample size <10
Sample size <10 Sample size <10 Sample size <10
Sample size <10 Sample size <10 Sample size <10
% very or extremely satisfied % at least somewhat satisfied
Engineering, computer science, and technology employer satisfaction with the general knowledge and skills of the majority of recent college graduates (overall)***
12/34 (35%) 31/34 (91%)
12/34 (35%) 31/34 (91%)
12/34 (35%) 31/34 (91%)
Alumni Satisfaction Data Available 2014 Data Available 2014 Data Available 2014
June 2013 Academic Strategies Committee/ OUS Board Meetings Page | 8
OUS ACHIEVEMENT COMPACT 2013-14
(Continued)
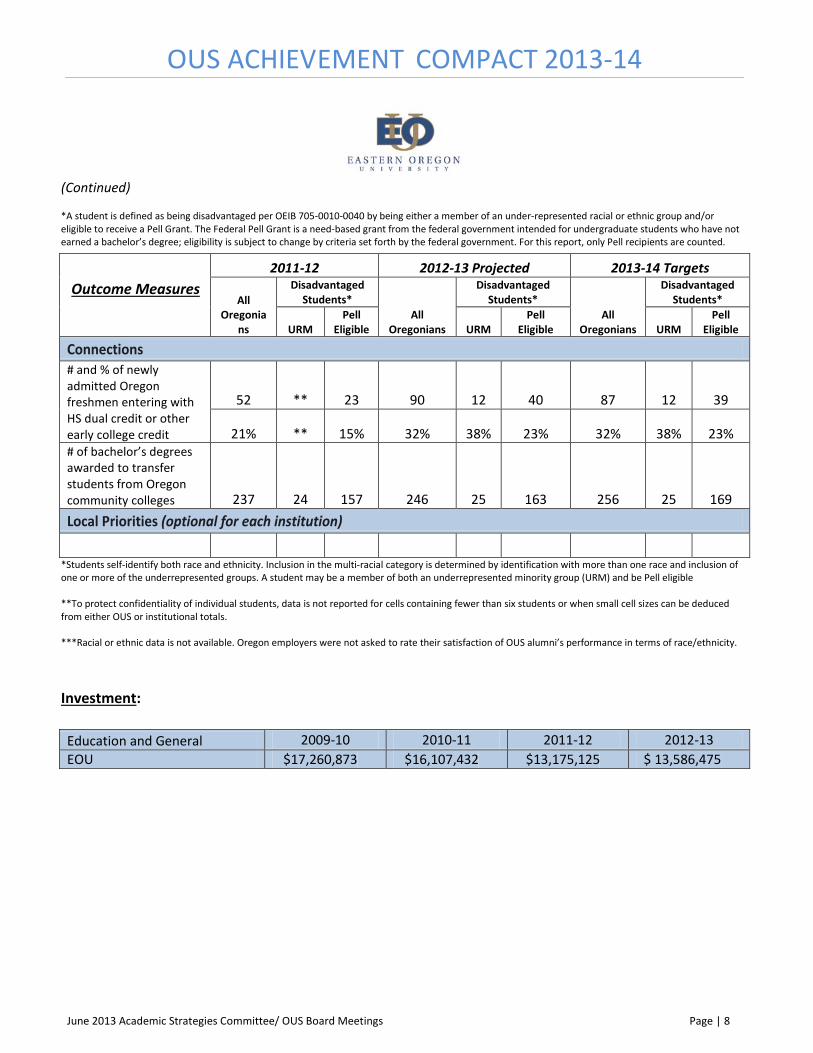
*A student is defined as being disadvantaged per OEIB 705-0010-0040 by being either a member of an under-represented racial or ethnic group and/or eligible to receive a Pell Grant. The Federal Pell Grant is a need-based grant from the federal government intended for undergraduate students who have not earned a bachelor’s degree; eligibility is subject to change by criteria set forth by the federal government. For this report, only Pell recipients are counted.
*Students self-identify both race and ethnicity. Inclusion in the multi-racial category is determined by identification with more than one race and inclusion of one or more of the underrepresented groups. A student may be a member of both an underrepresented minority group (URM) and be Pell eligible
**To protect confidentiality of individual students, data is not reported for cells containing fewer than six students or when small cell sizes can be deduced from either OUS or institutional totals. ***Racial or ethnic data is not available. Oregon employers were not asked to rate their satisfaction of OUS alumni’s performance in terms of race/ethnicity. Investment:
Outcome Measures
2011-12 2012-13 Projected 2013-14 Targets
All Oregonia
ns
Disadvantaged Students*
All Oregonians
Disadvantaged Students*
All Oregonians
Disadvantaged Students*
URM Pell
Eligible URM Pell
Eligible URM Pell
Eligible Connections
# and % of newly admitted Oregon freshmen entering with HS dual credit or other early college credit
52 ** 23 90 12 40 87 12 39
21% ** 15% 32% 38% 23% 32% 38% 23% # of bachelor’s degrees awarded to transfer students from Oregon community colleges 237 24 157 246 25 163 256 25 169 Local Priorities (optional for each institution)
Education and General 2009-10 2010-11 2011-12 2012-13 EOU $17,260,873 $16,107,432 $13,175,125 $ 13,586,475

June 2013 Academic Strategies Committee/ OUS Board Meetings Page | 9
OUS ACHIEVEMENT COMPACT 2013-14
Disadvantaged Students 2011-12
Outcome Measures Actual for 2011-12
Disadvantaged Students*
African-American
Hispanic/ Latino
Native Amer.
or Alaskan Native
Pacific Islander
Multi- Racial or Multi-
Ethnic Pell
Eligible
Completion
# of bachelor’s degrees awarded to Oregonians ** 20 7 ** 0 291 # of bachelor’s degrees awarded to rural Oregonians ** 10 ** ** 0 176 # of advanced degrees awarded to Oregonians ** ** 0 ** 0 n/a Quality Alumni satisfaction Data Available 2014 Connections
# and % of newly admitted Oregon freshmen entering with HS dual credit or other early college credit
0 ** ** ** 0 23
0% ** ** ** n/a 15% # of bachelor’s degrees awarded to transfer students from Oregon community colleges ** 14 ** ** 0 157
Local Priorities (optional for each institution)
*A student is defined as being disadvantaged per OEIB 705-0010-0040 by being either a member of an under-represented racial or ethnic group and/or eligible to receive a Pell Grant. The Federal Pell Grant is a need-based grant from the federal government intended for undergraduate students who have not earned a bachelor’s degree; eligibility is subject to change by criteria set forth by the federal government. For this report, only Pell recipients are counted. Students self-identify both race and ethnicity. Inclusion in the multi-racial category is determined by identification with more than one race and inclusion of one or more of the underrepresented groups. A student may be a member of both an underrepresented minority group (URM) and be Pell eligible **To protect confidentiality of individual students, data is not reported for cells containing fewer than six students or when small cell sizes can be deduced from either OUS or institutional totals.

June 2013 Academic Strategies Committee/ OUS Board Meetings Page | 10
OUS ACHIEVEMENT COMPACT 2013-14
Disadvantaged Students 2012-13 Projections
Outcome Measures 2012-13 Projections
Disadvantaged Students*
African-American
Hispanic/ Latino
Native Amer.
or Alaskan Native
Pacific Islander
Multi- Racial or Multi-
Ethnic Pell
Eligible
Completion
# of bachelor’s degrees awarded to Oregonians ** 22 8 ** 0 316 # of bachelor’s degrees awarded to rural Oregonians ** 11 ** ** 0 190 # of advanced degrees awarded to Oregonians ** ** 0 ** 0 n/a Quality
Alumni satisfaction Data Available 2014
Connections
# and % of newly admitted Oregon freshmen entering with HS dual credit or other early college credit
** 9 ** 0 ** 40
** 43% ** 0% ** 23% # of bachelor’s degrees awarded to transfer students from Oregon community colleges ** 15 ** ** 0 163 Local Priorities (optional for each institution)
*A student is defined as being disadvantaged per OEIB 705-0010-0040 by being either a member of an under-represented racial or ethnic group and/or eligible to receive a Pell Grant. The Federal Pell Grant is a need-based grant from the federal government intended for undergraduate students who have not earned a bachelor’s degree; eligibility is subject to change by criteria set forth by the federal government. For this report, only Pell recipients are counted. Students self-identify both race and ethnicity. Inclusion in the multi-racial category is determined by identification with more than one race and inclusion of one or more of the underrepresented groups. A student may be a member of both an underrepresented minority group (URM) and be Pell eligible **To protect confidentiality of individual students, data is not reported for cells containing fewer than six students or when small cell sizes can be deduced from either OUS or institutional totals.

June 2013 Academic Strategies Committee/ OUS Board Meetings Page | 11
OUS ACHIEVEMENT COMPACT 2013-14
Disadvantaged Students 2013-14 Targets
Outcome Measures 2013-14 Targets
Disadvantaged Students*
African-American
Hispanic/ Latino
Native Amer.
or Alaskan Native
Pacific Islander
Multi- Racial or Multi-
Ethnic Pell
Eligible
Completion
# of bachelor’s degrees awarded to Oregonians ** 23 8 ** 0 328 # of bachelor’s degrees awarded to rural Oregonians ** 11 ** ** 0 198 # of advanced degrees awarded to Oregonians ** ** 0 ** 0 n/a Quality
Alumni satisfaction Data Available 2014
Connections
# and % of newly admitted Oregon freshmen entering with HS dual credit or other early college credit
** 9 ** 0 ** 39
** 43% ** 0% ** 23% # of bachelor’s degrees awarded to transfer students from Oregon community colleges ** 15 ** ** 0 169
Local Priorities (optional for each institution)
*A student is defined as being disadvantaged per OEIB 705-0010-0040 by being either a member of an under-represented racial or ethnic group and/or eligible to receive a Pell Grant. The Federal Pell Grant is a need-based grant from the federal government intended for undergraduate students who have not earned a bachelor’s degree; eligibility is subject to change by criteria set forth by the federal government. For this report, only Pell recipients are counted. Students self-identify both race and ethnicity. Inclusion in the multi-racial category is determined by identification with more than one race and inclusion of one or more of the underrepresented groups. A student may be a member of both an underrepresented minority group (URM) and be Pell eligible. **To protect confidentiality of individual students, data is not reported for cells containing fewer than six students or when small cell sizes can be deduced from either OUS or institutional totals.

June 2013 Academic Strategies Committee/ OUS Board Meetings Page | 12
OUS ACHIEVEMENT COMPACT 2013-14
Oregon Institute of Technology Mission: Oregon Institute of Technology, a member of the Oregon University System, offers innovative and rigorous applied degree programs in the areas of engineering, engineering technologies, health technologies, management, and the arts and sciences. To foster student and graduate success, the university provides an intimate, hands-on learning environment, focusing on application of theory to practice. Oregon Tech offers statewide educational opportunities for the emerging needs of Oregon’s citizens and provides information and technical expertise to state, national, and international constituents. Mission Core Themes
• Applied degree programs • Student and graduate success • Statewide educational opportunities • Public Service
Outcome Measures
2011-12 2012-13 Projected 2013-14 Targets
All Oregonians
Disadvantaged Students*
All Oregonians
Disadvantaged Students*
All Oregonians
Disadvantaged Students*
URM Pell
Eligible URM Pell
Eligible URM Pell
Eligible
Completion # of bachelor’s degrees awarded to Oregonians 418 57 235 436 59 245 442 59 248 # of bachelor’s degrees awarded to rural Oregonians 164 24 129 165 24 130 167 24 132 # of advanced degrees awarded to Oregonians ** 0 n/a ** 0 n/a ** 0 n/a Quality
Written Communication Verbal Communication Critical Thinking Knowledge in employee’s field of study or major
Percent of engineering, computer science, and technology employers reporting they were “Very or Extremely Satisfied” and they were at least “Somewhat Satisfied” with recent graduates’ knowledge or abilities in the following areas:***
Very or Extremely Satisfied
At least Somewhat Satisfied
Very or Extremely Satisfied
At least Somewhat Satisfied
Very or Extremely Satisfied
At least Somewhat Satisfied
11/57 (19%) 38/57 (67%) 11/57 (19%) 38/57 (67%) 11/57 (19%) 38/57 (67%) 15/56 (27%) 42/56 (75%) 15/56 (27%) 42/56 (75%) 15/56 (27%) 42/56 (75%)
24/58 (41%) 51/58 (88%) 24/58 (41%) 51/58 (88%) 24/58 (41%) 51/58 (88%)
36/58 (62%) 58/58 (100%) 36/58 (62%) 58/58 (100%) 36/58 (62%) 58/58 (100%)
% very or extremely satisfied % at least somewhat satisfied
Engineering, computer science, and technology employer satisfaction with the general knowledge and skills of the majority of recent college graduates (overall)***
49/79 (62%) 76/79 (96%)
49/79 (62%) 76/79 (96%)
49/79 (62%) 76/79 (96%)
Alumni Satisfaction Data Available 2014 Data Available 2014 Data Available 2014
June 2013 Academic Strategies Committee/ OUS Board Meetings Page | 13
OUS ACHIEVEMENT COMPACT 2013-14
(Continued)
Outcome Measures
2011-12 2012-13 Projected 2013-14 Targets
All Oregonians
Disadvantaged Students*
All Oregonians
Disadvantaged Students*
All Oregonians
Disadvantaged Students*
Minority Pell
Eligible Minority Pell
Eligible Minority Pell
Eligible
Connections
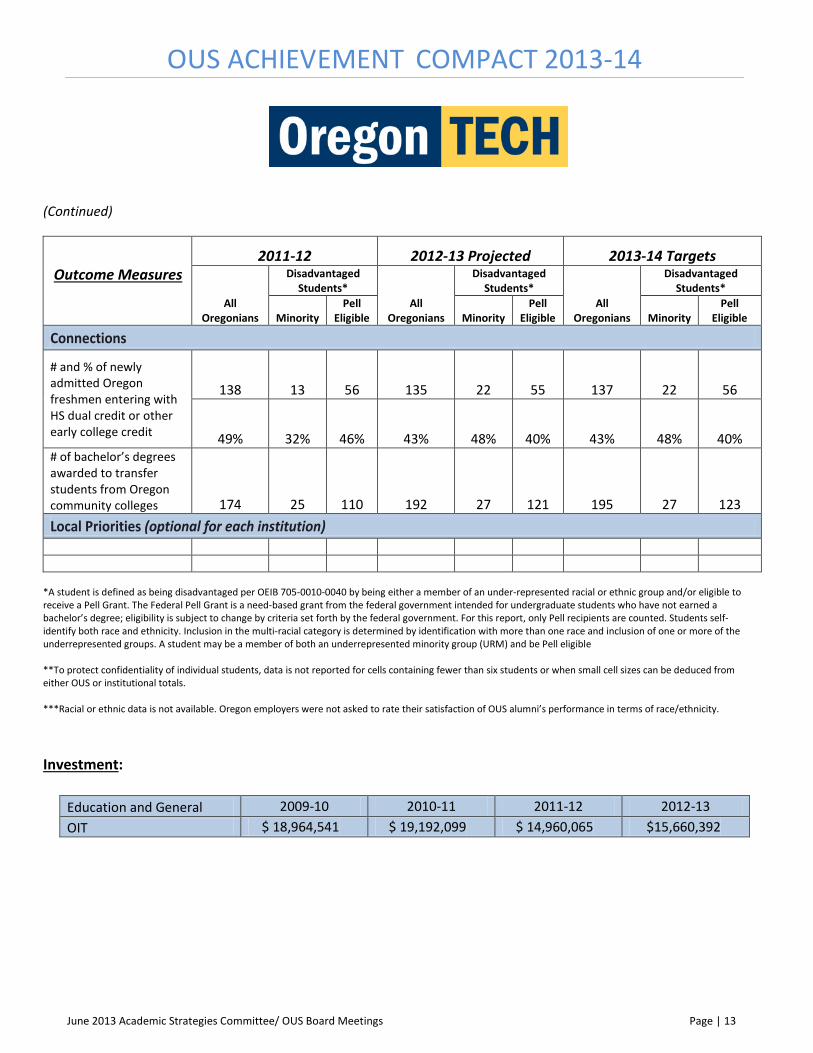
# and % of newly admitted Oregon freshmen entering with HS dual credit or other early college credit
138 13 56 135 22 55 137 22 56
49% 32% 46% 43% 48% 40% 43% 48% 40% # of bachelor’s degrees awarded to transfer students from Oregon community colleges 174 25 110 192 27 121 195 27 123 Local Priorities (optional for each institution)
*A student is defined as being disadvantaged per OEIB 705-0010-0040 by being either a member of an under-represented racial or ethnic group and/or eligible to receive a Pell Grant. The Federal Pell Grant is a need-based grant from the federal government intended for undergraduate students who have not earned a bachelor’s degree; eligibility is subject to change by criteria set forth by the federal government. For this report, only Pell recipients are counted. Students self-identify both race and ethnicity. Inclusion in the multi-racial category is determined by identification with more than one race and inclusion of one or more of the underrepresented groups. A student may be a member of both an underrepresented minority group (URM) and be Pell eligible **To protect confidentiality of individual students, data is not reported for cells containing fewer than six students or when small cell sizes can be deduced from either OUS or institutional totals. ***Racial or ethnic data is not available. Oregon employers were not asked to rate their satisfaction of OUS alumni’s performance in terms of race/ethnicity.
Investment:
Education and General 2009-10 2010-11 2011-12 2012-13 OIT $ 18,964,541 $ 19,192,099 $ 14,960,065 $15,660,392
June 2013 Academic Strategies Committee/ OUS Board Meetings Page | 14
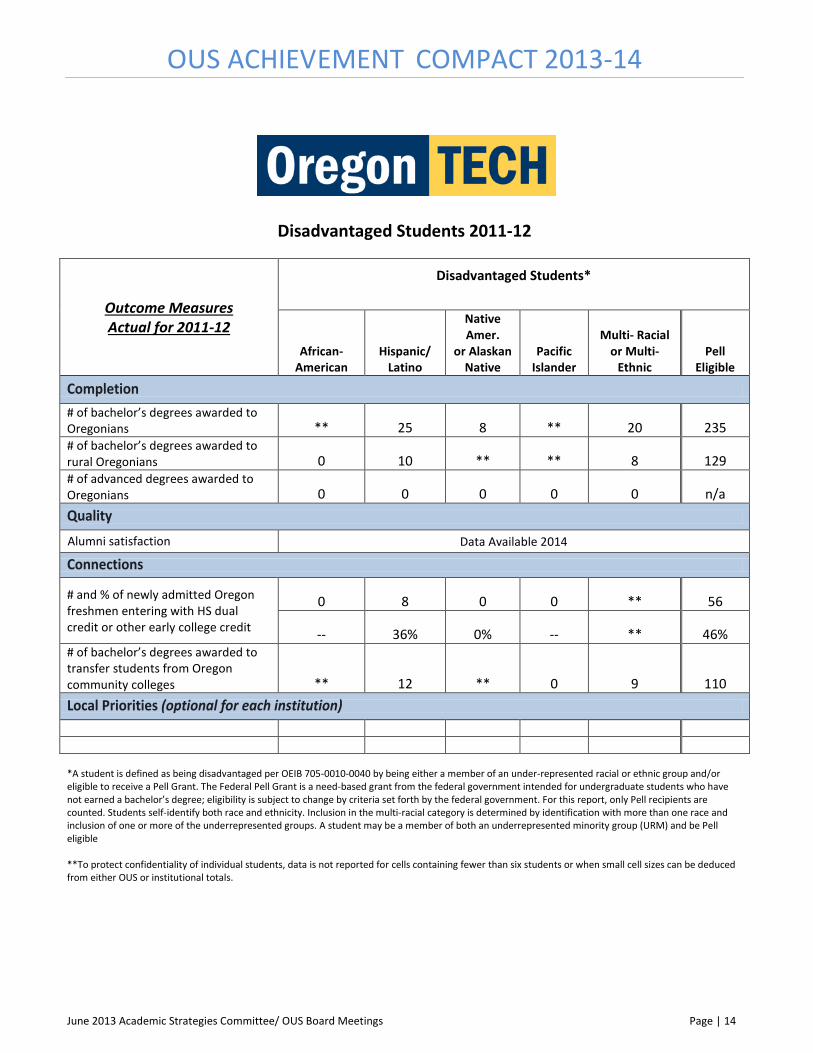
OUS ACHIEVEMENT COMPACT 2013-14
Disadvantaged Students 2011-12
Outcome Measures Actual for 2011-12
Disadvantaged Students*
African-American
Hispanic/ Latino
Native Amer.
or Alaskan Native
Pacific Islander
Multi- Racial or Multi-
Ethnic Pell
Eligible
Completion
# of bachelor’s degrees awarded to Oregonians ** 25 8 ** 20 235 # of bachelor’s degrees awarded to rural Oregonians 0 10 ** ** 8 129 # of advanced degrees awarded to Oregonians 0 0 0 0 0 n/a Quality
Alumni satisfaction Data Available 2014
Connections
# and % of newly admitted Oregon freshmen entering with HS dual credit or other early college credit
0 8 0 0 ** 56
-- 36% 0% -- ** 46% # of bachelor’s degrees awarded to transfer students from Oregon community colleges ** 12 ** 0 9 110 Local Priorities (optional for each institution) *A student is defined as being disadvantaged per OEIB 705-0010-0040 by being either a member of an under-represented racial or ethnic group and/or eligible to receive a Pell Grant. The Federal Pell Grant is a need-based grant from the federal government intended for undergraduate students who have not earned a bachelor’s degree; eligibility is subject to change by criteria set forth by the federal government. For this report, only Pell recipients are counted. Students self-identify both race and ethnicity. Inclusion in the multi-racial category is determined by identification with more than one race and inclusion of one or more of the underrepresented groups. A student may be a member of both an underrepresented minority group (URM) and be Pell eligible **To protect confidentiality of individual students, data is not reported for cells containing fewer than six students or when small cell sizes can be deduced from either OUS or institutional totals.
June 2013 Academic Strategies Committee/ OUS Board Meetings Page | 15
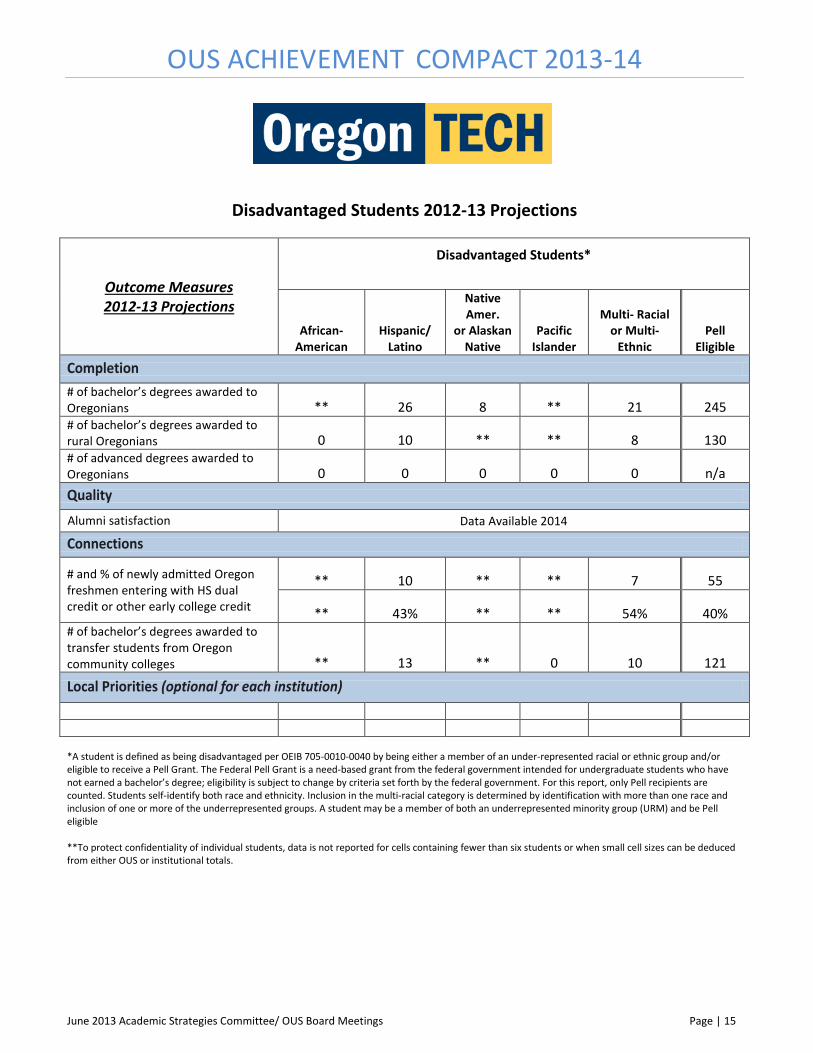
OUS ACHIEVEMENT COMPACT 2013-14
Disadvantaged Students 2012-13 Projections
Outcome Measures 2012-13 Projections
Disadvantaged Students*
African-American
Hispanic/ Latino
Native Amer.
or Alaskan Native
Pacific Islander
Multi- Racial or Multi-
Ethnic Pell
Eligible
Completion
# of bachelor’s degrees awarded to Oregonians ** 26 8 ** 21 245 # of bachelor’s degrees awarded to rural Oregonians 0 10 ** ** 8 130 # of advanced degrees awarded to Oregonians 0 0 0 0 0 n/a Quality
Alumni satisfaction Data Available 2014
Connections
# and % of newly admitted Oregon freshmen entering with HS dual credit or other early college credit
** 10 ** ** 7 55
** 43% ** ** 54% 40% # of bachelor’s degrees awarded to transfer students from Oregon community colleges ** 13 ** 0 10 121
Local Priorities (optional for each institution)
*A student is defined as being disadvantaged per OEIB 705-0010-0040 by being either a member of an under-represented racial or ethnic group and/or eligible to receive a Pell Grant. The Federal Pell Grant is a need-based grant from the federal government intended for undergraduate students who have not earned a bachelor’s degree; eligibility is subject to change by criteria set forth by the federal government. For this report, only Pell recipients are counted. Students self-identify both race and ethnicity. Inclusion in the multi-racial category is determined by identification with more than one race and inclusion of one or more of the underrepresented groups. A student may be a member of both an underrepresented minority group (URM) and be Pell eligible **To protect confidentiality of individual students, data is not reported for cells containing fewer than six students or when small cell sizes can be deduced from either OUS or institutional totals.
June 2013 Academic Strategies Committee/ OUS Board Meetings Page | 16
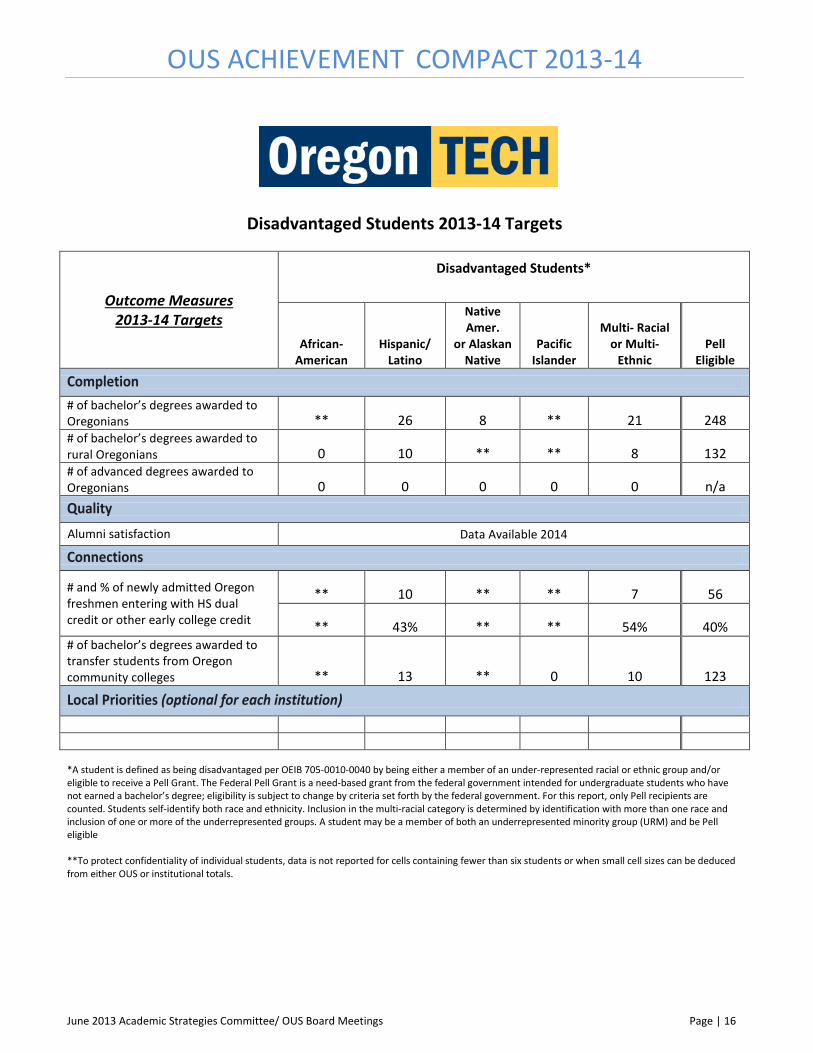
OUS ACHIEVEMENT COMPACT 2013-14
Disadvantaged Students 2013-14 Targets
Outcome Measures 2013-14 Targets
Disadvantaged Students*
African-American
Hispanic/ Latino
Native Amer.
or Alaskan Native
Pacific Islander
Multi- Racial or Multi-
Ethnic Pell
Eligible
Completion
# of bachelor’s degrees awarded to Oregonians ** 26 8 ** 21 248 # of bachelor’s degrees awarded to rural Oregonians 0 10 ** ** 8 132 # of advanced degrees awarded to Oregonians 0 0 0 0 0 n/a Quality
Alumni satisfaction Data Available 2014
Connections
# and % of newly admitted Oregon freshmen entering with HS dual credit or other early college credit
** 10 ** ** 7 56
** 43% ** ** 54% 40% # of bachelor’s degrees awarded to transfer students from Oregon community colleges ** 13 ** 0 10 123
Local Priorities (optional for each institution)
*A student is defined as being disadvantaged per OEIB 705-0010-0040 by being either a member of an under-represented racial or ethnic group and/or eligible to receive a Pell Grant. The Federal Pell Grant is a need-based grant from the federal government intended for undergraduate students who have not earned a bachelor’s degree; eligibility is subject to change by criteria set forth by the federal government. For this report, only Pell recipients are counted. Students self-identify both race and ethnicity. Inclusion in the multi-racial category is determined by identification with more than one race and inclusion of one or more of the underrepresented groups. A student may be a member of both an underrepresented minority group (URM) and be Pell eligible **To protect confidentiality of individual students, data is not reported for cells containing fewer than six students or when small cell sizes can be deduced from either OUS or institutional totals.

June 2013 Academic Strategies Committee/ OUS Board Meetings Page | 17
OUS ACHIEVEMENT COMPACT 2013-14 Oregon State University Mission: As a land grant institution committed to teaching, research, and outreach and engagement, Oregon State University promotes economic, social, cultural and environmental progress for the people of Oregon, the nation and the world. This mission is achieved by producing graduates competitive in the global economy, supporting a continuous search for new knowledge and solutions, and maintaining a rigorous focus on academic excellence, particularly in the three Signature Areas: Advancing the Science of Sustainable Earth Ecosystems; Improving Human Health and Wellness; and Promoting Economic Growth and Social Progress.
Outcome Measures
2011-12 2012-13 Projected 2013-14 Targets
All Oregonians
Disadvantaged Students*
All Oregonians
Disadvantaged Students*
All Oregonians
Disadvantaged Students*
URM Pell
Eligible URM Pell
Eligible URM Pell
Eligible
Completion # of bachelor’s degrees awarded to Oregonians 3,330 272 1,610 3,357 273 1,623 3,547 290 1,715 # of bachelor’s degrees awarded to rural Oregonians 438 47 264 459 49 277 485 51 293 # of advanced degrees awarded to Oregonians 582 56 n/a 571 55 n/a 585 56 n/a Quality
Written Communication
Verbal Communication
Critical Thinking
Knowledge in employee’s field of study or major
Percent of engineering, computer science, and technology employers reporting they were “Very or Extremely Satisfied” and they were at least “Somewhat Satisfied” with recent graduates’ knowledge or abilities in the following areas:***
Very or Extremely Satisfied
At least Somewhat Satisfied
Very or Extremely Satisfied
At least Somewhat Satisfied
Very or Extremely Satisfied
At least Somewhat Satisfied
32/119 (27%) 89/119 (75%) 32/119 (27%) 89/119 (75%) 32/119 (27%) 89/119 (75%)
44/118 (37%) 95/118 (81%) 44/118 (37%) 95/118 (81%) 44/118 (37%) 95/118 (81%)
56/120 (47%) 107/120 (89%) 56/120 (47%) 107/120 (89%) 56/120 (47%) 107/120 (89%)
77/121 (64%) 117/121 (97%) 77/121 (64%) 117/121 (97%) 77/121 (64%) 117/121 (97%)
% very or extremely satisfied % at least somewhat satisfied
Engineering, computer science, and technology employer satisfaction with the general knowledge and skills of the majority of recent college graduates (overall)***
91/132 (69%) 127/132 (96%)
91/132 (69%) 127/132 (96%)
91/132 (69%) 127/132 (96%)
Alumni Satisfaction Data Available 2014 Data Available 2014 Data Available 2014

June 2013 Academic Strategies Committee/ OUS Board Meetings Page | 18
OUS ACHIEVEMENT COMPACT 2013-14
(Continued)
Outcome Measures
2011-12 2012-13 Projected 2013-14 Targets
All Oregonians
Disadvantaged Students*
All Oregonians
Disadvantaged Students*
All Oregonians
Disadvantaged Students*
URM Pell
Eligible URM Pell
Eligible URM Pell
Eligible
Connections
# and % of newly admitted Oregon freshmen entering with HS dual credit or other early college credit
1,192 160 388 1,371 216 446 1,393 219 453
46% 39% 41% 53% 46% 47% 53% 46% 47% # of bachelor’s degrees awarded to transfer students from Oregon community colleges 749 85 502 808 92 542 853 96 572 Local Priorities (optional for each institution) # of Oregon residents and youth participants in activities sponsored by the OSU Extension Service per million dollars invested1
116,077 n/a n/a 117,700 n/a n/a 118,000 n/a n/a
*A student is defined as being disadvantaged per OEIB 705-0010-0040 by being either a member of an under-represented racial or ethnic group and/or eligible to receive a Pell Grant. The Federal Pell Grant is a need-based grant from the federal government intended for undergraduate students who have not earned a bachelor’s degree; eligibility is subject to change by criteria set forth by the federal government. For this report, only Pell recipients are counted. Students self-identify both race and ethnicity. Inclusion in the multi-racial category is determined by identification with more than one race and inclusion of one or more of the underrepresented groups. A student may be a member of both an underrepresented minority group (URM) and be Pell eligible
**To protect confidentiality of individual students, data is not reported for cells containing fewer than six students or when small cell sizes can be deduced from either OUS or institutional totals. ***Racial or ethnic data is not available. Oregon employers were not asked to rate their satisfaction of OUS alumni’s performance in terms of race/ethnicity.
1 Statewide Public Service (SWPS) Programs
Investment: Education and General 2009-10 2010-11 2011-12 2012-13 OSU $ 94,483,547 $ 96,289,665 $ 72,864,677 $ 75,775,852 OSU-Cascades $ 4,682,199 $ 4,780,251 $ 4,049,137 $ 4,292,531 Extension Service $ 21,161,731 $ 17,925,822 $ 18,357,067 $ 19,106,335
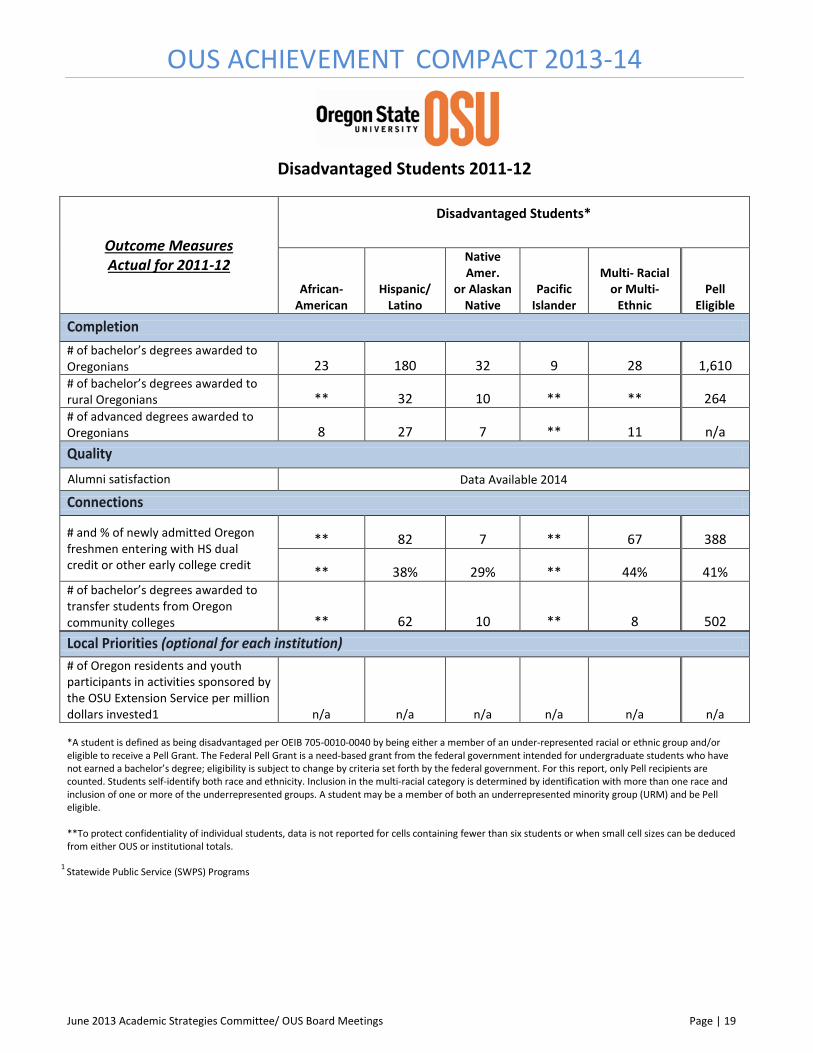
June 2013 Academic Strategies Committee/ OUS Board Meetings Page | 19
OUS ACHIEVEMENT COMPACT 2013-14
Disadvantaged Students 2011-12
Outcome Measures Actual for 2011-12
Disadvantaged Students*
African-American
Hispanic/ Latino
Native Amer.
or Alaskan Native
Pacific Islander
Multi- Racial or Multi-
Ethnic Pell
Eligible
Completion
# of bachelor’s degrees awarded to Oregonians 23 180 32 9 28 1,610 # of bachelor’s degrees awarded to rural Oregonians ** 32 10 ** ** 264 # of advanced degrees awarded to Oregonians 8 27 7 ** 11 n/a Quality
Alumni satisfaction Data Available 2014
Connections
# and % of newly admitted Oregon freshmen entering with HS dual credit or other early college credit
** 82 7 ** 67 388
** 38% 29% ** 44% 41% # of bachelor’s degrees awarded to transfer students from Oregon community colleges ** 62 10 ** 8 502 Local Priorities (optional for each institution)
# of Oregon residents and youth participants in activities sponsored by the OSU Extension Service per million dollars invested1 n/a n/a n/a n/a n/a n/a *A student is defined as being disadvantaged per OEIB 705-0010-0040 by being either a member of an under-represented racial or ethnic group and/or eligible to receive a Pell Grant. The Federal Pell Grant is a need-based grant from the federal government intended for undergraduate students who have not earned a bachelor’s degree; eligibility is subject to change by criteria set forth by the federal government. For this report, only Pell recipients are counted. Students self-identify both race and ethnicity. Inclusion in the multi-racial category is determined by identification with more than one race and inclusion of one or more of the underrepresented groups. A student may be a member of both an underrepresented minority group (URM) and be Pell eligible. **To protect confidentiality of individual students, data is not reported for cells containing fewer than six students or when small cell sizes can be deduced from either OUS or institutional totals.
1 Statewide Public Service (SWPS) Programs
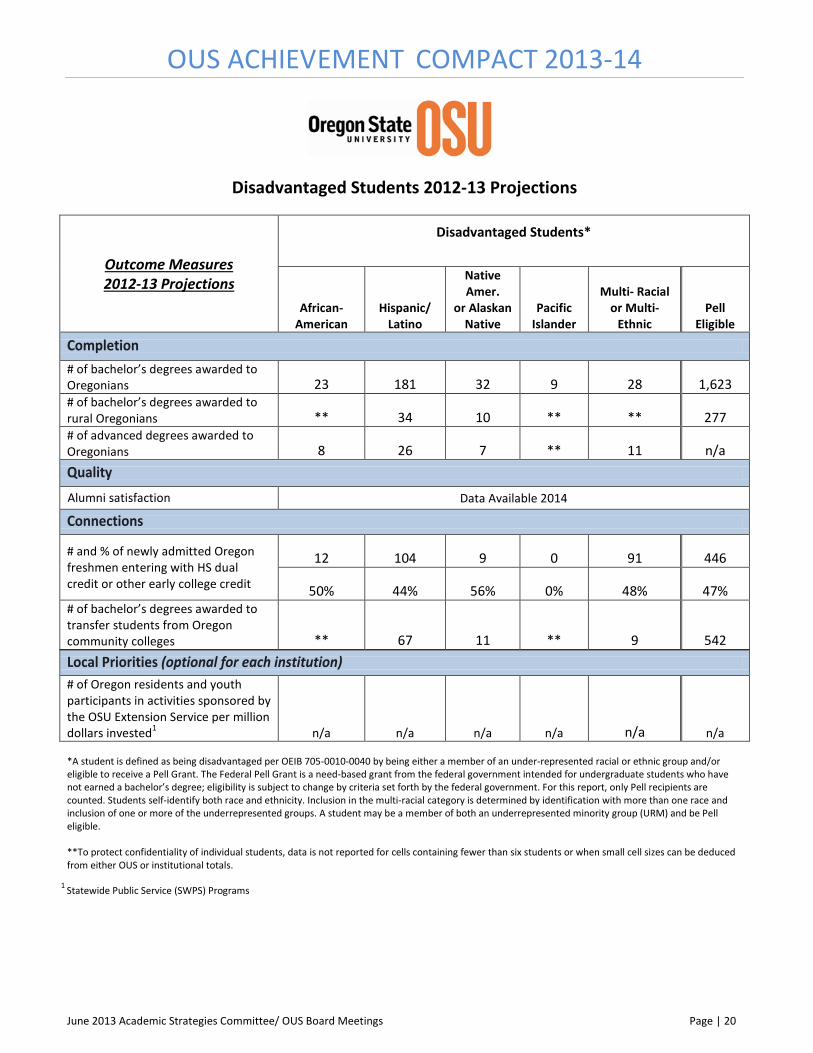
June 2013 Academic Strategies Committee/ OUS Board Meetings Page | 20
OUS ACHIEVEMENT COMPACT 2013-14
Disadvantaged Students 2012-13 Projections
Outcome Measures 2012-13 Projections
Disadvantaged Students*
African-American
Hispanic/ Latino
Native Amer.
or Alaskan Native
Pacific Islander
Multi- Racial or Multi-
Ethnic Pell
Eligible
Completion
# of bachelor’s degrees awarded to Oregonians 23 181 32 9 28 1,623 # of bachelor’s degrees awarded to rural Oregonians ** 34 10 ** ** 277 # of advanced degrees awarded to Oregonians 8 26 7 ** 11 n/a Quality
Alumni satisfaction Data Available 2014
Connections
# and % of newly admitted Oregon freshmen entering with HS dual credit or other early college credit
12 104 9 0 91 446
50% 44% 56% 0% 48% 47% # of bachelor’s degrees awarded to transfer students from Oregon community colleges ** 67 11 ** 9 542 Local Priorities (optional for each institution)
# of Oregon residents and youth participants in activities sponsored by the OSU Extension Service per million dollars invested1 n/a n/a n/a n/a n/a n/a *A student is defined as being disadvantaged per OEIB 705-0010-0040 by being either a member of an under-represented racial or ethnic group and/or eligible to receive a Pell Grant. The Federal Pell Grant is a need-based grant from the federal government intended for undergraduate students who have not earned a bachelor’s degree; eligibility is subject to change by criteria set forth by the federal government. For this report, only Pell recipients are counted. Students self-identify both race and ethnicity. Inclusion in the multi-racial category is determined by identification with more than one race and inclusion of one or more of the underrepresented groups. A student may be a member of both an underrepresented minority group (URM) and be Pell eligible. **To protect confidentiality of individual students, data is not reported for cells containing fewer than six students or when small cell sizes can be deduced from either OUS or institutional totals.
1 Statewide Public Service (SWPS) Programs

June 2013 Academic Strategies Committee/ OUS Board Meetings Page | 21
OUS ACHIEVEMENT COMPACT 2013-14
Disadvantaged Students 2013-14 Targets
Outcome Measures 2013-14 Targets
Disadvantaged Students*
African-American
Hispanic/ Latino
Native Amer.
or Alaskan Native
Pacific Islander
Multi- Racial or Multi-
Ethnic Pell
Eligible
Completion
# of bachelor’s degrees awarded to Oregonians 24 192 34 10 30 1,715 # of bachelor’s degrees awarded to rural Oregonians ** 35 11 ** ** 293 # of advanced degrees awarded to Oregonians 8 27 7 ** 11 n/a Quality
Alumni satisfaction Data Available 2014
Connections
# and % of newly admitted Oregon freshmen entering with HS dual credit or other early college credit
12 106 9 0 92 453
50% 44% 56% 0% 48% 47% # of bachelor’s degrees awarded to transfer students from Oregon community colleges ** 71 11 ** 9 572 Local Priorities (optional for each institution)
# of Oregon residents and youth participants in activities sponsored by the OSU Extension Service per million dollars invested1 n/a n/a n/a n/a n/a n/a *A student is defined as being disadvantaged per OEIB 705-0010-0040 by being either a member of an under-represented racial or ethnic group and/or eligible to receive a Pell Grant. The Federal Pell Grant is a need-based grant from the federal government intended for undergraduate students who have not earned a bachelor’s degree; eligibility is subject to change by criteria set forth by the federal government. For this report, only Pell recipients are counted. Students self-identify both race and ethnicity. Inclusion in the multi-racial category is determined by identification with more than one race and inclusion of one or more of the underrepresented groups. A student may be a member of both an underrepresented minority group (URM) and be Pell eligible. **To protect confidentiality of individual students, data is not reported for cells containing fewer than six students or when small cell sizes can be deduced from either OUS or institutional totals.
1 Statewide Public Service (SWPS) Programs
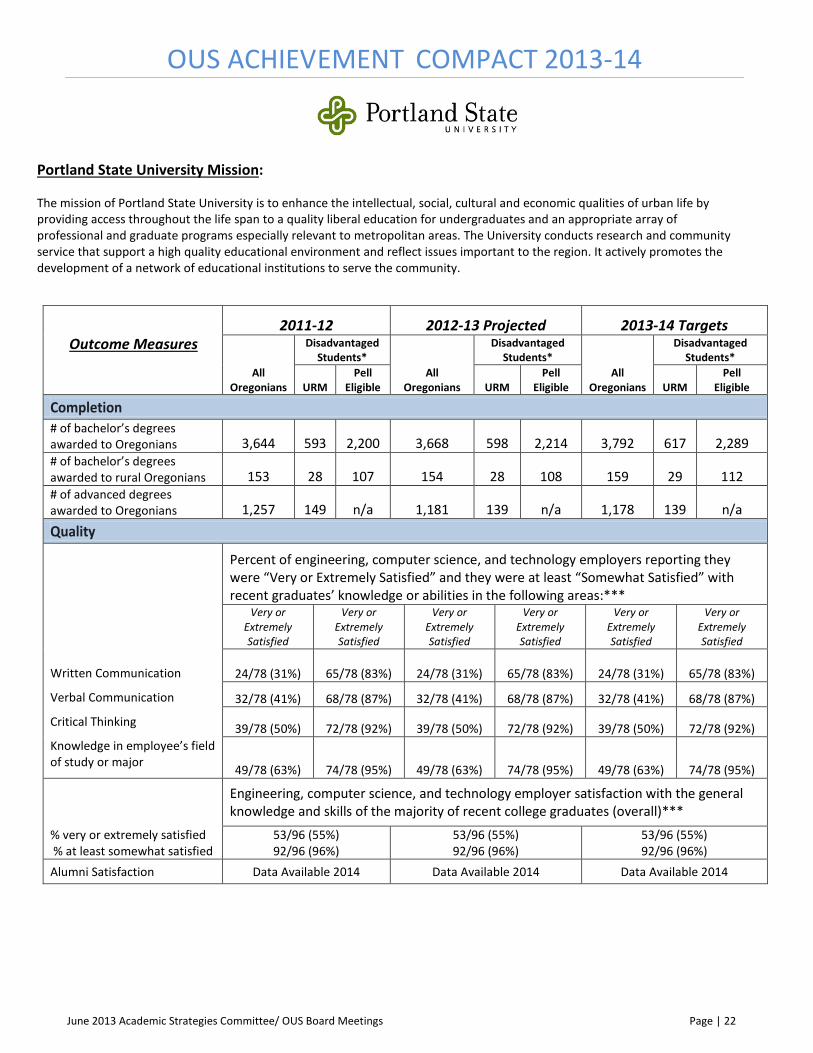
June 2013 Academic Strategies Committee/ OUS Board Meetings Page | 22
OUS ACHIEVEMENT COMPACT 2013-14
Portland State University Mission:
The mission of Portland State University is to enhance the intellectual, social, cultural and economic qualities of urban life by providing access throughout the life span to a quality liberal education for undergraduates and an appropriate array of professional and graduate programs especially relevant to metropolitan areas. The University conducts research and community service that support a high quality educational environment and reflect issues important to the region. It actively promotes the development of a network of educational institutions to serve the community.
Outcome Measures
2011-12 2012-13 Projected 2013-14 Targets
All Oregonians
Disadvantaged Students*
All Oregonians
Disadvantaged Students*
All Oregonians
Disadvantaged Students*
URM Pell
Eligible URM Pell
Eligible URM Pell
Eligible
Completion # of bachelor’s degrees awarded to Oregonians 3,644 593 2,200 3,668 598 2,214 3,792 617 2,289 # of bachelor’s degrees awarded to rural Oregonians 153 28 107 154 28 108 159 29 112 # of advanced degrees awarded to Oregonians 1,257 149 n/a 1,181 139 n/a 1,178 139 n/a Quality
Written Communication
Verbal Communication
Critical Thinking
Knowledge in employee’s field of study or major
Percent of engineering, computer science, and technology employers reporting they were “Very or Extremely Satisfied” and they were at least “Somewhat Satisfied” with recent graduates’ knowledge or abilities in the following areas:***
Very or Extremely Satisfied
Very or Extremely Satisfied
Very or Extremely Satisfied
Very or Extremely Satisfied
Very or Extremely Satisfied
Very or Extremely Satisfied
24/78 (31%) 65/78 (83%) 24/78 (31%) 65/78 (83%) 24/78 (31%) 65/78 (83%)
32/78 (41%) 68/78 (87%) 32/78 (41%) 68/78 (87%) 32/78 (41%) 68/78 (87%)
39/78 (50%) 72/78 (92%) 39/78 (50%) 72/78 (92%) 39/78 (50%) 72/78 (92%)
49/78 (63%) 74/78 (95%) 49/78 (63%) 74/78 (95%) 49/78 (63%) 74/78 (95%)
% very or extremely satisfied % at least somewhat satisfied
Engineering, computer science, and technology employer satisfaction with the general knowledge and skills of the majority of recent college graduates (overall)***
53/96 (55%) 92/96 (96%)
53/96 (55%) 92/96 (96%)
53/96 (55%) 92/96 (96%)
Alumni Satisfaction Data Available 2014 Data Available 2014 Data Available 2014

June 2013 Academic Strategies Committee/ OUS Board Meetings Page | 23
OUS ACHIEVEMENT COMPACT 2013-14
(Continued)
Outcome Measures
2011-12 2012-13 Projected 2013-14 Targets
All Oregonians
Disadvantaged Students*
All Oregonians
Disadvantaged Students*
All Oregonians
Disadvantaged Students*
Minority Pell
Eligible Minority Pell
Eligible Minority Pell
Eligible
Connections # and % of newly admitted Oregon freshmen entering with HS dual credit or other early college credit
341 93 163 301 73 141 306 74 146
34% 37% 32% 28% 26% 26% 28% 26% 26% # of bachelor’s degrees awarded to transfer students from Oregon community colleges 1,670 305 1,162 1,654 303 1,151 1,709 312 1,189 Local Priorities (optional for each institution) *A student is defined as being disadvantaged per OEIB 705-0010-0040 by being either a member of an under-represented racial or ethnic group and/or eligible to receive a Pell Grant. The Federal Pell Grant is a need-based grant from the federal government intended for undergraduate students who have not earned a bachelor’s degree; eligibility is subject to change by criteria set forth by the federal government. For this report, only Pell recipients are counted. Students self-identify both race and ethnicity. Inclusion in the multi-racial category is determined by identification with more than one race and inclusion of one or more of the underrepresented groups. A student may be a member of both an underrepresented minority group (URM) and be Pell eligible. **To protect confidentiality of individual students, data is not reported for cells containing fewer than six students or when small cell sizes can be deduced from either OUS or institutional totals.
***Racial or ethnic data is not available. Oregon employers were not asked to rate their satisfaction of OUS alumni’s performance in terms of race/ethnicity.
Investment: Education and General 2009-10 2010-11 2011-12 2012-13 PSU $ 68,630,709 $ 70,656,270 $ 54,295,004 $ 55,264,031
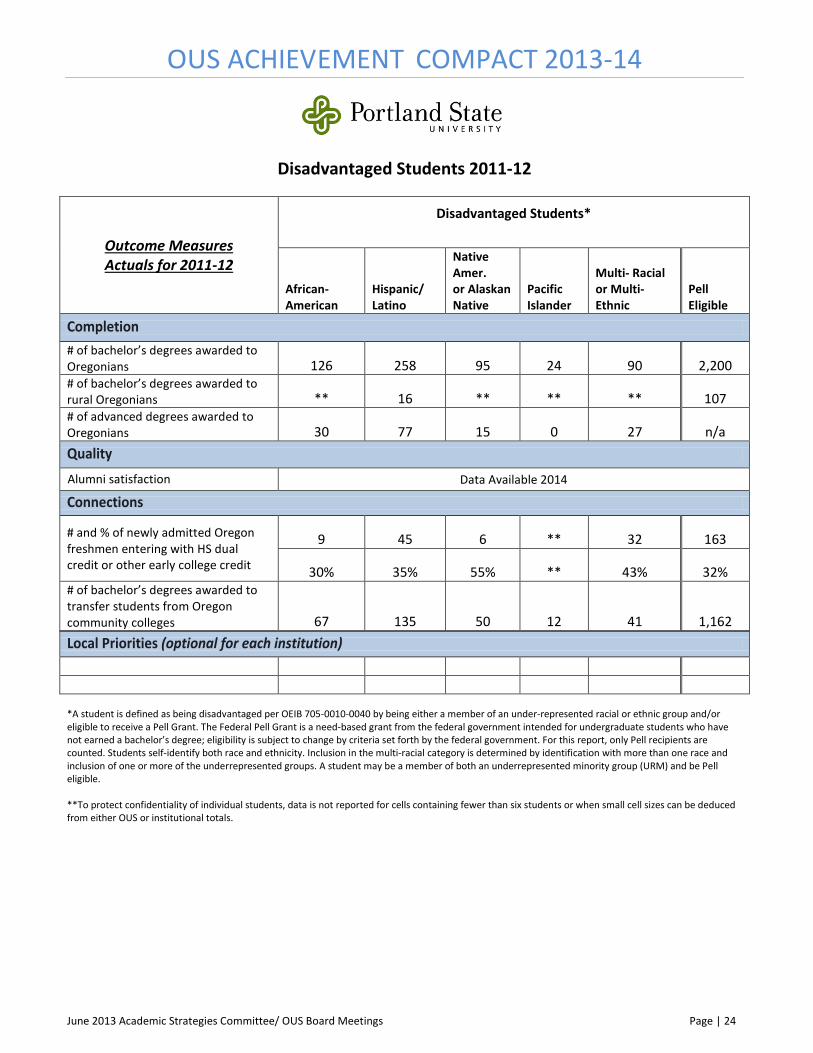
June 2013 Academic Strategies Committee/ OUS Board Meetings Page | 24
OUS ACHIEVEMENT COMPACT 2013-14
Disadvantaged Students 2011-12
Outcome Measures Actuals for 2011-12
Disadvantaged Students*
African-American
Hispanic/ Latino
Native Amer. or Alaskan Native
Pacific Islander
Multi- Racial or Multi-Ethnic
Pell Eligible
Completion
# of bachelor’s degrees awarded to Oregonians 126 258 95 24 90 2,200 # of bachelor’s degrees awarded to rural Oregonians ** 16 ** ** ** 107 # of advanced degrees awarded to Oregonians 30 77 15 0 27 n/a Quality
Alumni satisfaction Data Available 2014
Connections
# and % of newly admitted Oregon freshmen entering with HS dual credit or other early college credit
9 45 6 ** 32 163
30% 35% 55% ** 43% 32% # of bachelor’s degrees awarded to transfer students from Oregon community colleges 67 135 50 12 41 1,162 Local Priorities (optional for each institution) *A student is defined as being disadvantaged per OEIB 705-0010-0040 by being either a member of an under-represented racial or ethnic group and/or eligible to receive a Pell Grant. The Federal Pell Grant is a need-based grant from the federal government intended for undergraduate students who have not earned a bachelor’s degree; eligibility is subject to change by criteria set forth by the federal government. For this report, only Pell recipients are counted. Students self-identify both race and ethnicity. Inclusion in the multi-racial category is determined by identification with more than one race and inclusion of one or more of the underrepresented groups. A student may be a member of both an underrepresented minority group (URM) and be Pell eligible. **To protect confidentiality of individual students, data is not reported for cells containing fewer than six students or when small cell sizes can be deduced from either OUS or institutional totals.

June 2013 Academic Strategies Committee/ OUS Board Meetings Page | 25
OUS ACHIEVEMENT COMPACT 2013-14
Disadvantaged Students 2012-13 Projections
Outcome Measures 2012-13 Projections
Disadvantaged Students*
African-American
Hispanic/ Latino
Native Amer.
or Alaskan Native
Pacific Islander
Multi- Racial or Multi-
Ethnic Pell
Eligible
Completion
# of bachelor’s degrees awarded to Oregonians 127 260 96 24 91 2,214 # of bachelor’s degrees awarded to rural Oregonians ** 16 ** ** ** 108 # of advanced degrees awarded to Oregonians 28 72 14 0 25 n/a Quality
Alumni satisfaction Data Available 2014
Connections
# and % of newly admitted Oregon freshmen entering with HS dual credit or other early college credit
6 44 ** ** 19 141
19% 27% ** ** 27% 26% # of bachelor’s degrees awarded to transfer students from Oregon community colleges 66 134 50 12 41 1,151 Local Priorities (optional for each institution) *A student is defined as being disadvantaged per OEIB 705-0010-0040 by being either a member of an under-represented racial or ethnic group and/or eligible to receive a Pell Grant. The Federal Pell Grant is a need-based grant from the federal government intended for undergraduate students who have not earned a bachelor’s degree; eligibility is subject to change by criteria set forth by the federal government. For this report, only Pell recipients are counted. Students self-identify both race and ethnicity. Inclusion in the multi-racial category is determined by identification with more than one race and inclusion of one or more of the underrepresented groups. A student may be a member of both an underrepresented minority group (URM) and be Pell eligible. **To protect confidentiality of individual students, data is not reported for cells containing fewer than six students or when small cell sizes can be deduced from either OUS or institutional totals.
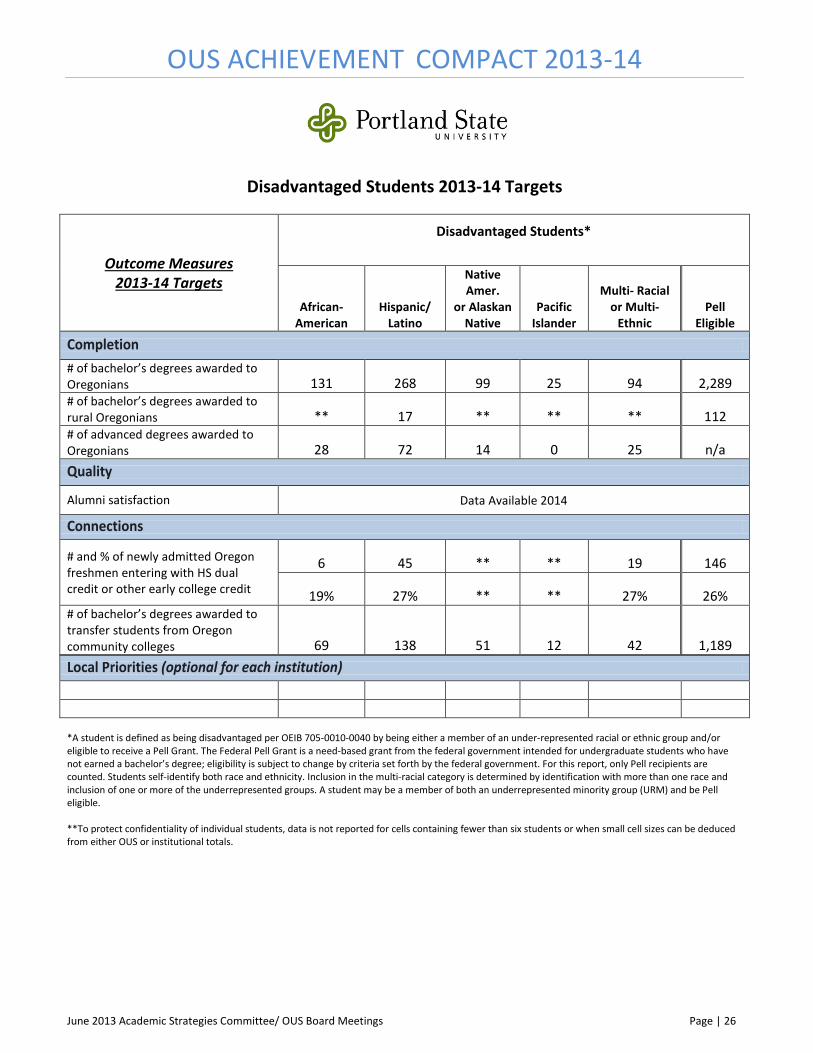
June 2013 Academic Strategies Committee/ OUS Board Meetings Page | 26
OUS ACHIEVEMENT COMPACT 2013-14
Disadvantaged Students 2013-14 Targets
Outcome Measures 2013-14 Targets
Disadvantaged Students*
African-American
Hispanic/ Latino
Native Amer.
or Alaskan Native
Pacific Islander
Multi- Racial or Multi-
Ethnic Pell
Eligible
Completion
# of bachelor’s degrees awarded to Oregonians 131 268 99 25 94 2,289 # of bachelor’s degrees awarded to rural Oregonians ** 17 ** ** ** 112 # of advanced degrees awarded to Oregonians 28 72 14 0 25 n/a Quality
Alumni satisfaction Data Available 2014
Connections
# and % of newly admitted Oregon freshmen entering with HS dual credit or other early college credit
6 45 ** ** 19 146
19% 27% ** ** 27% 26% # of bachelor’s degrees awarded to transfer students from Oregon community colleges 69 138 51 12 42 1,189 Local Priorities (optional for each institution) *A student is defined as being disadvantaged per OEIB 705-0010-0040 by being either a member of an under-represented racial or ethnic group and/or eligible to receive a Pell Grant. The Federal Pell Grant is a need-based grant from the federal government intended for undergraduate students who have not earned a bachelor’s degree; eligibility is subject to change by criteria set forth by the federal government. For this report, only Pell recipients are counted. Students self-identify both race and ethnicity. Inclusion in the multi-racial category is determined by identification with more than one race and inclusion of one or more of the underrepresented groups. A student may be a member of both an underrepresented minority group (URM) and be Pell eligible. **To protect confidentiality of individual students, data is not reported for cells containing fewer than six students or when small cell sizes can be deduced from either OUS or institutional totals.
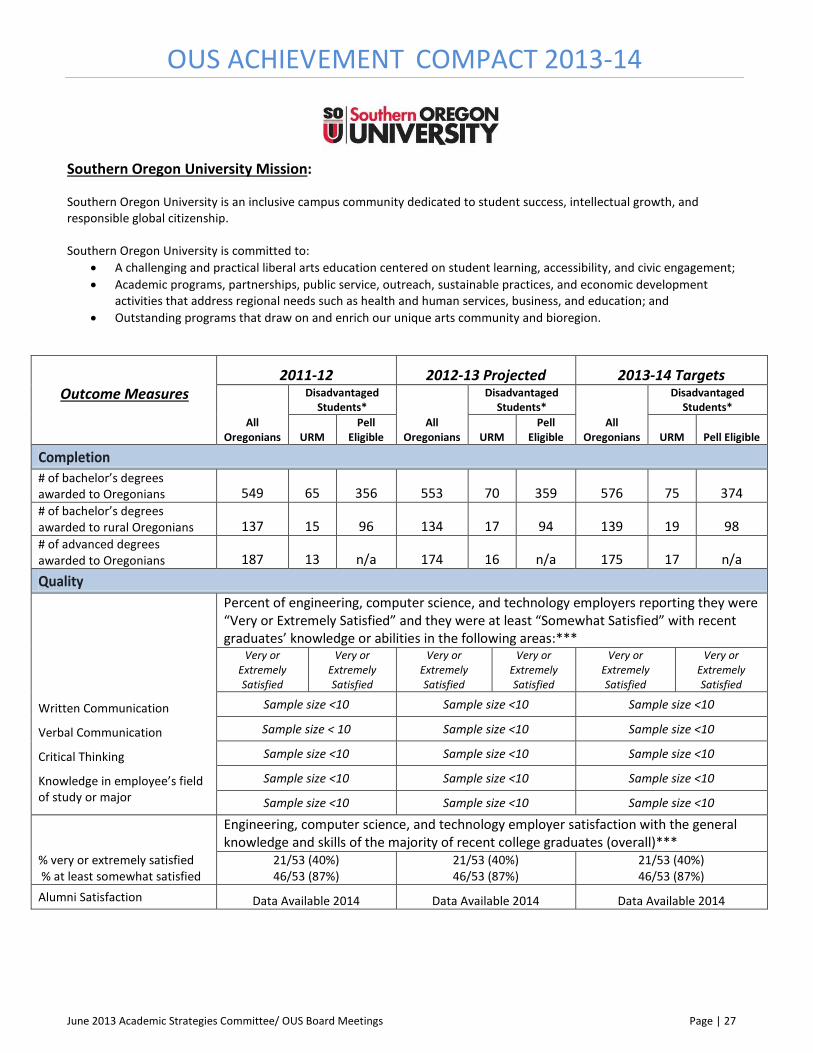
June 2013 Academic Strategies Committee/ OUS Board Meetings Page | 27
OUS ACHIEVEMENT COMPACT 2013-14
Southern Oregon University Mission: Southern Oregon University is an inclusive campus community dedicated to student success, intellectual growth, and responsible global citizenship. Southern Oregon University is committed to:
• A challenging and practical liberal arts education centered on student learning, accessibility, and civic engagement; • Academic programs, partnerships, public service, outreach, sustainable practices, and economic development
activities that address regional needs such as health and human services, business, and education; and • Outstanding programs that draw on and enrich our unique arts community and bioregion.
Outcome Measures
2011-12 2012-13 Projected 2013-14 Targets
All Oregonians
Disadvantaged Students*
All Oregonians
Disadvantaged Students*
All Oregonians
Disadvantaged Students*
URM Pell
Eligible URM Pell
Eligible URM Pell Eligible
Completion # of bachelor’s degrees awarded to Oregonians 549 65 356 553 70 359 576 75 374 # of bachelor’s degrees awarded to rural Oregonians 137 15 96 134 17 94 139 19 98 # of advanced degrees awarded to Oregonians 187 13 n/a 174 16 n/a 175 17 n/a Quality
Written Communication
Verbal Communication
Critical Thinking
Knowledge in employee’s field of study or major
Percent of engineering, computer science, and technology employers reporting they were “Very or Extremely Satisfied” and they were at least “Somewhat Satisfied” with recent graduates’ knowledge or abilities in the following areas:***
Very or Extremely Satisfied
Very or Extremely Satisfied
Very or Extremely Satisfied
Very or Extremely Satisfied
Very or Extremely Satisfied
Very or Extremely Satisfied
Sample size <10 Sample size <10 Sample size <10
Sample size < 10 Sample size <10 Sample size <10
Sample size <10 Sample size <10 Sample size <10
Sample size <10 Sample size <10 Sample size <10
Sample size <10 Sample size <10 Sample size <10
% very or extremely satisfied % at least somewhat satisfied
Engineering, computer science, and technology employer satisfaction with the general knowledge and skills of the majority of recent college graduates (overall)***
21/53 (40%) 46/53 (87%)
21/53 (40%) 46/53 (87%)
21/53 (40%) 46/53 (87%)
Alumni Satisfaction Data Available 2014 Data Available 2014 Data Available 2014

June 2013 Academic Strategies Committee/ OUS Board Meetings Page | 28
OUS ACHIEVEMENT COMPACT 2013-14
(Continued)
Outcome Measures
2011-12 2012-13 Projected 2013-14 Targets
All Oregonians
Disadvantaged Students*
All Oregonians
Disadvantaged Students*
All Oregonians
Disadvantaged Students*
Minority Pell
Eligible Minority Pell
Eligible Minority Pell
Eligible
Connections
# and % of newly admitted Oregon freshmen entering with HS dual credit or other early college credit
204 37 97 173 33 82 176 33 83
43% 39% 44% 43% 46% 44% 43% 46% 44% # of bachelor’s degrees awarded to transfer students from Oregon community colleges 160 19 126 172 20 136 186 22 147 Local Priorities (optional for each institution) *A student is defined as being disadvantaged per OEIB 705-0010-0040 by being either a member of an under-represented racial or ethnic group and/or eligible to receive a Pell Grant. The Federal Pell Grant is a need-based grant from the federal government intended for undergraduate students who have not earned a bachelor’s degree; eligibility is subject to change by criteria set forth by the federal government. For this report, only Pell recipients are counted. Students self-identify both race and ethnicity. Inclusion in the multi-racial category is determined by identification with more than one race and inclusion of one or more of the underrepresented groups. A student may be a member of both an underrepresented minority group (URM) and be Pell eligible. **To protect confidentiality of individual students, data is not reported for cells containing fewer than six students or when small cell sizes can be deduced from either OUS or institutional totals. ***Racial or ethnic data is not available. Oregon employers were not asked to rate their satisfaction of OUS alumni’s performance in terms of race/ethnicity.
Investment:
Education and General 2009-10 2010-11 2011-12 2012-13 SOU $ 16,778,447 $ 16,330,133 $ 12,642,338 $ 13,373,666
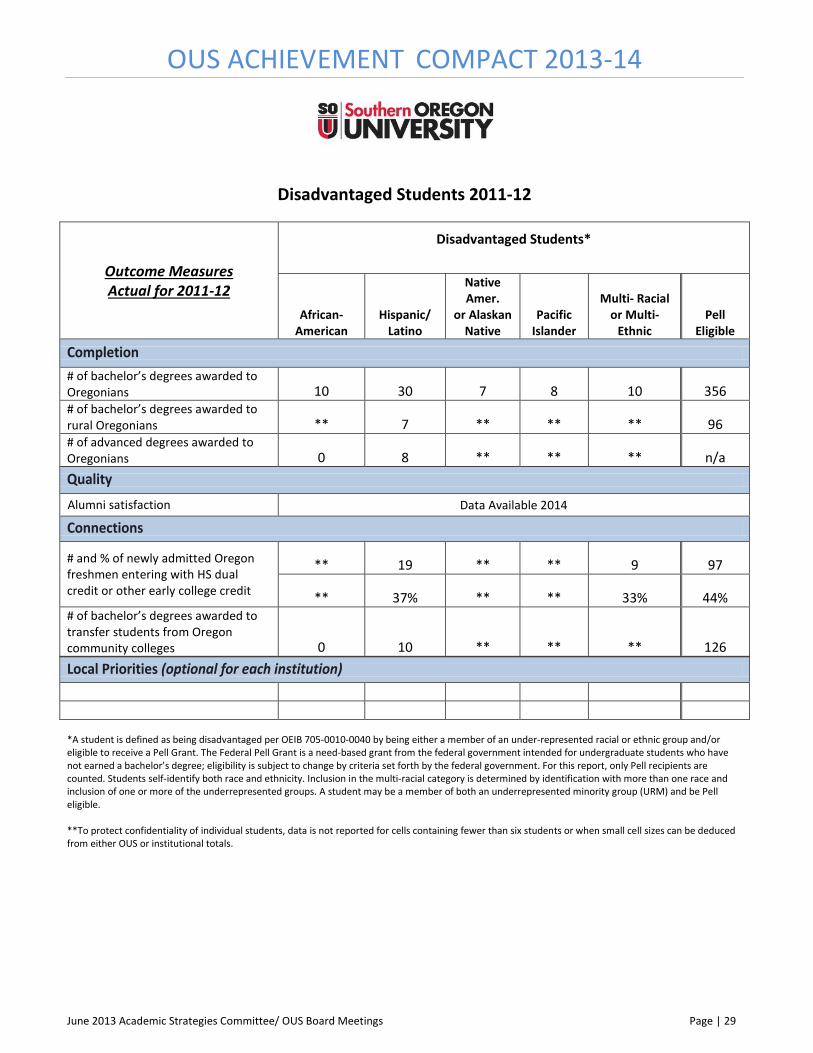
June 2013 Academic Strategies Committee/ OUS Board Meetings Page | 29
OUS ACHIEVEMENT COMPACT 2013-14
Disadvantaged Students 2011-12
Outcome Measures Actual for 2011-12
Disadvantaged Students*
African-American
Hispanic/ Latino
Native Amer.
or Alaskan Native
Pacific Islander
Multi- Racial or Multi-
Ethnic Pell
Eligible
Completion
# of bachelor’s degrees awarded to Oregonians 10 30 7 8 10 356 # of bachelor’s degrees awarded to rural Oregonians ** 7 ** ** ** 96 # of advanced degrees awarded to Oregonians 0 8 ** ** ** n/a Quality
Alumni satisfaction Data Available 2014
Connections
# and % of newly admitted Oregon freshmen entering with HS dual credit or other early college credit
** 19 ** ** 9 97
** 37% ** ** 33% 44% # of bachelor’s degrees awarded to transfer students from Oregon community colleges 0 10 ** ** ** 126 Local Priorities (optional for each institution) *A student is defined as being disadvantaged per OEIB 705-0010-0040 by being either a member of an under-represented racial or ethnic group and/or eligible to receive a Pell Grant. The Federal Pell Grant is a need-based grant from the federal government intended for undergraduate students who have not earned a bachelor’s degree; eligibility is subject to change by criteria set forth by the federal government. For this report, only Pell recipients are counted. Students self-identify both race and ethnicity. Inclusion in the multi-racial category is determined by identification with more than one race and inclusion of one or more of the underrepresented groups. A student may be a member of both an underrepresented minority group (URM) and be Pell eligible. **To protect confidentiality of individual students, data is not reported for cells containing fewer than six students or when small cell sizes can be deduced from either OUS or institutional totals.
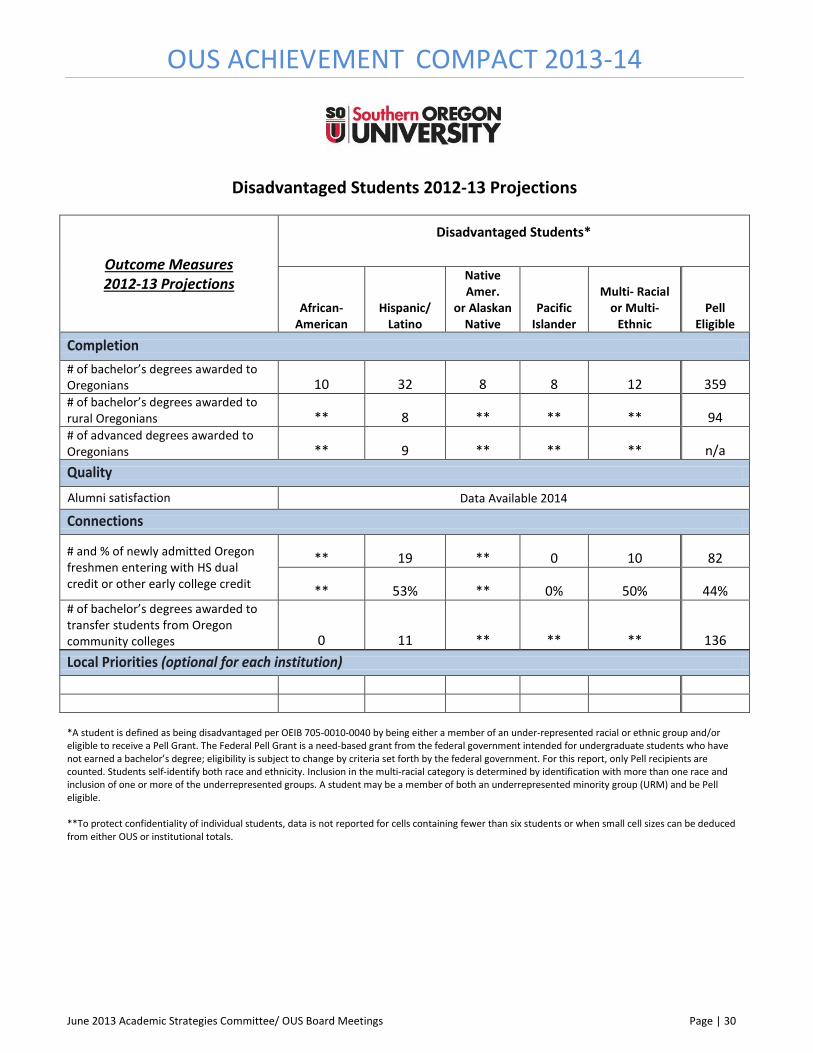
June 2013 Academic Strategies Committee/ OUS Board Meetings Page | 30
OUS ACHIEVEMENT COMPACT 2013-14
Disadvantaged Students 2012-13 Projections
Outcome Measures 2012-13 Projections
Disadvantaged Students*
African-American
Hispanic/ Latino
Native Amer.
or Alaskan Native
Pacific Islander
Multi- Racial or Multi-
Ethnic Pell
Eligible
Completion
# of bachelor’s degrees awarded to Oregonians 10 32 8 8 12 359 # of bachelor’s degrees awarded to rural Oregonians ** 8 ** ** ** 94 # of advanced degrees awarded to Oregonians ** 9 ** ** ** n/a Quality
Alumni satisfaction Data Available 2014
Connections
# and % of newly admitted Oregon freshmen entering with HS dual credit or other early college credit
** 19 ** 0 10 82
** 53% ** 0% 50% 44% # of bachelor’s degrees awarded to transfer students from Oregon community colleges 0 11 ** ** ** 136 Local Priorities (optional for each institution) *A student is defined as being disadvantaged per OEIB 705-0010-0040 by being either a member of an under-represented racial or ethnic group and/or eligible to receive a Pell Grant. The Federal Pell Grant is a need-based grant from the federal government intended for undergraduate students who have not earned a bachelor’s degree; eligibility is subject to change by criteria set forth by the federal government. For this report, only Pell recipients are counted. Students self-identify both race and ethnicity. Inclusion in the multi-racial category is determined by identification with more than one race and inclusion of one or more of the underrepresented groups. A student may be a member of both an underrepresented minority group (URM) and be Pell eligible. **To protect confidentiality of individual students, data is not reported for cells containing fewer than six students or when small cell sizes can be deduced from either OUS or institutional totals.

June 2013 Academic Strategies Committee/ OUS Board Meetings Page | 31
OUS ACHIEVEMENT COMPACT 2013-14
Disadvantaged Students 2013-14 Targets
Outcome Measures 2013-14 Targets
Disadvantaged Students*
African-American
Hispanic/ Latino
Native Amer.
or Alaskan Native
Pacific Islander
Multi- Racial or Multi-
Ethnic Pell
Eligible
Completion
# of bachelor’s degrees awarded to Oregonians 10 34 9 8 14 374 # of bachelor’s degrees awarded to rural Oregonians ** 9 ** ** ** 98 # of advanced degrees awarded to Oregonians ** 10 ** ** ** n/a Quality
Alumni satisfaction Data Available 2014
Connections
# and % of newly admitted Oregon freshmen entering with HS dual credit or other early college credit
** 19 ** 0 10 83
** 53% ** 0% 50% 44% # of bachelor’s degrees awarded to transfer students from Oregon community colleges 0 12 ** ** ** 147 Local Priorities (optional for each institution) *A student is defined as being disadvantaged per OEIB 705-0010-0040 by being either a member of an under-represented racial or ethnic group and/or eligible to receive a Pell Grant. The Federal Pell Grant is a need-based grant from the federal government intended for undergraduate students who have not earned a bachelor’s degree; eligibility is subject to change by criteria set forth by the federal government. For this report, only Pell recipients are counted. Students self-identify both race and ethnicity. Inclusion in the multi-racial category is determined by identification with more than one race and inclusion of one or more of the underrepresented groups. A student may be a member of both an underrepresented minority group (URM) and be Pell eligible. **To protect confidentiality of individual students, data is not reported for cells containing fewer than six students or when small cell sizes can be deduced from either OUS or institutional totals.

June 2013 Academic Strategies Committee/ OUS Board Meetings Page | 32
OUS ACHIEVEMENT COMPACT 2013-14
University of Oregon Mission: The University of Oregon is a comprehensive research university that serves its students and the people of Oregon, the nation, and the world through the creation and transfer of knowledge in the liberal arts, the natural and social sciences, and the professions. It is the Association of American Universities flagship institution of the Oregon University System. The University is a community of scholars dedicated to the highest standards of academic inquiry, learning, and service. Recognizing that knowledge is the fundamental wealth of civilization, the University strives to enrich the public that sustains it through
• a commitment to undergraduate education, with a goal of helping the individual learn to question critically, think logically, communicate clearly, act creatively, and live ethically
• a commitment to graduate education to develop creators and innovators who will generate new knowledge and shape experience for the benefit of humanity
• a recognition that research, both basic and applied, is essential to the intellectual health of the University, as well as to the enrichment of the lives of Oregonians, by energizing the state’s economic, cultural, and political structure
• the establishment of a framework for lifelong learning that leads to productive careers and to the enduring joy of inquiry
• the integration of teaching, research, and service as mutually enriching enterprises that together accomplish the University’s mission and support its spirit of community
• the acceptance of the challenge of an evolving social, political, and technological environment by welcoming and guiding change rather than reacting to it
• a dedication to the principles of equality of opportunity and freedom from unfair discrimination for all members of the University community and an acceptance of true diversity as an affirmation of individual identity within a welcoming community
• a commitment to international awareness and understanding, and to the development of a faculty and student body that are capable of participating effectively in a global society
• the conviction that freedom of thought and expression is the bedrock principle on which University activity is based
• the cultivation of an attitude toward citizenship that fosters a caring, supportive atmosphere on campus and the wise exercise of civic responsibilities and individual judgment throughout life
• a continuing commitment to affordable public higher education
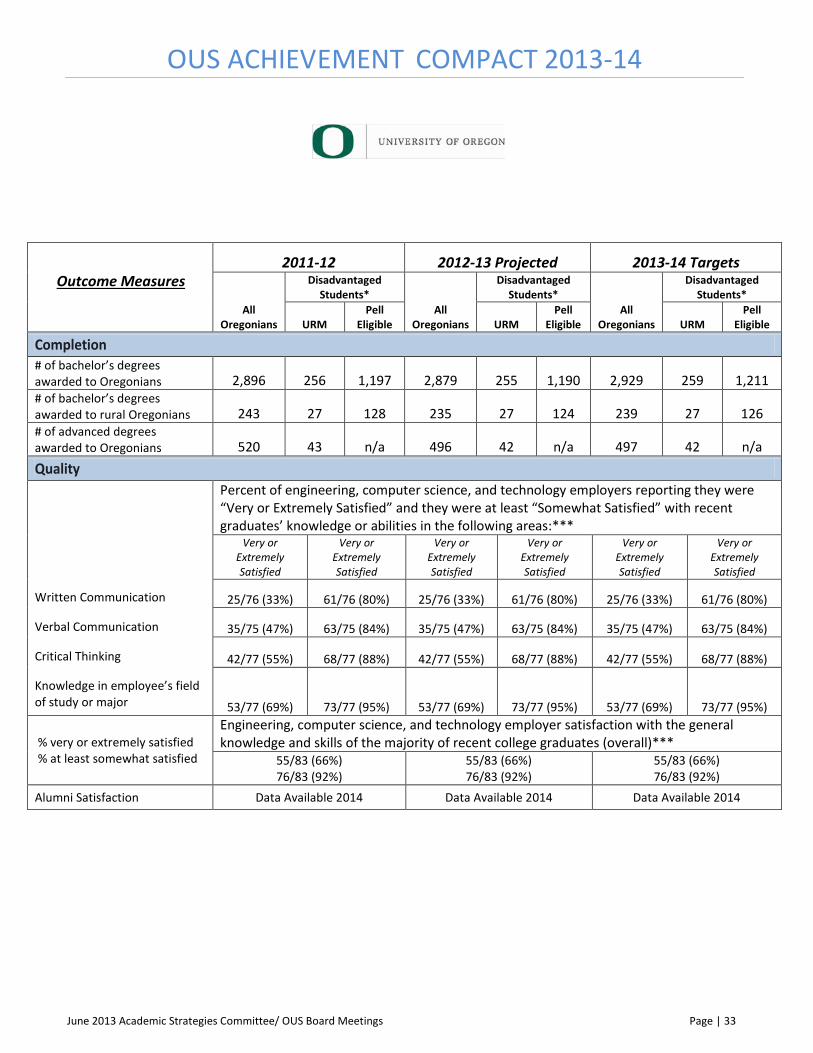
June 2013 Academic Strategies Committee/ OUS Board Meetings Page | 33
OUS ACHIEVEMENT COMPACT 2013-14
Outcome Measures
2011-12 2012-13 Projected 2013-14 Targets
All Oregonians
Disadvantaged Students*
All Oregonians
Disadvantaged Students*
All Oregonians
Disadvantaged Students*
URM Pell
Eligible URM Pell
Eligible URM Pell
Eligible
Completion # of bachelor’s degrees awarded to Oregonians 2,896 256 1,197 2,879 255 1,190 2,929 259 1,211 # of bachelor’s degrees awarded to rural Oregonians 243 27 128 235 27 124 239 27 126 # of advanced degrees awarded to Oregonians 520 43 n/a 496 42 n/a 497 42 n/a Quality
Written Communication
Verbal Communication
Critical Thinking
Knowledge in employee’s field of study or major
Percent of engineering, computer science, and technology employers reporting they were “Very or Extremely Satisfied” and they were at least “Somewhat Satisfied” with recent graduates’ knowledge or abilities in the following areas:***
Very or Extremely Satisfied
Very or Extremely Satisfied
Very or Extremely Satisfied
Very or Extremely Satisfied
Very or Extremely Satisfied
Very or Extremely Satisfied
25/76 (33%) 61/76 (80%) 25/76 (33%) 61/76 (80%) 25/76 (33%) 61/76 (80%)
35/75 (47%) 63/75 (84%) 35/75 (47%) 63/75 (84%) 35/75 (47%) 63/75 (84%)
42/77 (55%) 68/77 (88%) 42/77 (55%) 68/77 (88%) 42/77 (55%) 68/77 (88%)
53/77 (69%) 73/77 (95%) 53/77 (69%) 73/77 (95%) 53/77 (69%) 73/77 (95%)
% very or extremely satisfied % at least somewhat satisfied
Engineering, computer science, and technology employer satisfaction with the general knowledge and skills of the majority of recent college graduates (overall)***
55/83 (66%) 76/83 (92%)
55/83 (66%) 76/83 (92%)
55/83 (66%) 76/83 (92%)
Alumni Satisfaction Data Available 2014 Data Available 2014 Data Available 2014
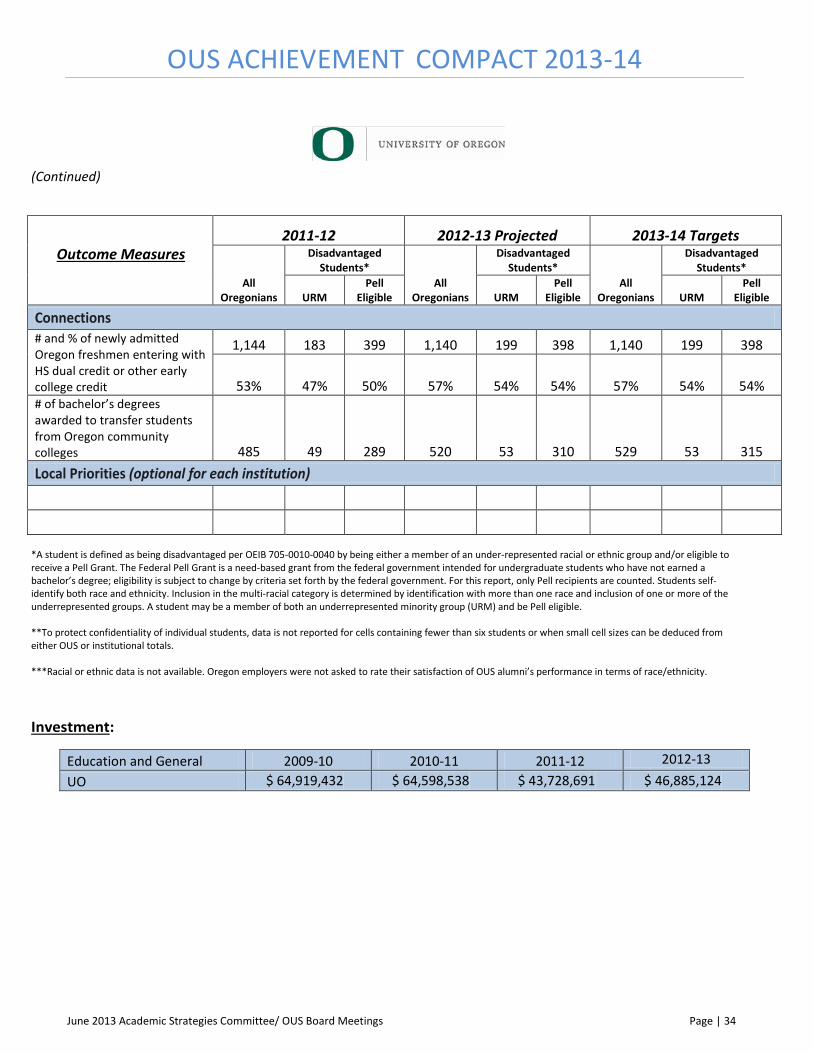
June 2013 Academic Strategies Committee/ OUS Board Meetings Page | 34
OUS ACHIEVEMENT COMPACT 2013-14
(Continued)
*A student is defined as being disadvantaged per OEIB 705-0010-0040 by being either a member of an under-represented racial or ethnic group and/or eligible to receive a Pell Grant. The Federal Pell Grant is a need-based grant from the federal government intended for undergraduate students who have not earned a bachelor’s degree; eligibility is subject to change by criteria set forth by the federal government. For this report, only Pell recipients are counted. Students self-identify both race and ethnicity. Inclusion in the multi-racial category is determined by identification with more than one race and inclusion of one or more of the underrepresented groups. A student may be a member of both an underrepresented minority group (URM) and be Pell eligible. **To protect confidentiality of individual students, data is not reported for cells containing fewer than six students or when small cell sizes can be deduced from either OUS or institutional totals. ***Racial or ethnic data is not available. Oregon employers were not asked to rate their satisfaction of OUS alumni’s performance in terms of race/ethnicity.
Investment:
Education and General 2009-10 2010-11 2011-12 2012-13 UO $ 64,919,432 $ 64,598,538 $ 43,728,691 $ 46,885,124
Outcome Measures
2011-12 2012-13 Projected 2013-14 Targets
All Oregonians
Disadvantaged Students*
All Oregonians
Disadvantaged Students*
All Oregonians
Disadvantaged Students*
URM Pell
Eligible URM Pell
Eligible URM Pell
Eligible
Connections # and % of newly admitted Oregon freshmen entering with HS dual credit or other early college credit
1,144 183 399 1,140 199 398 1,140 199 398
53% 47% 50% 57% 54% 54% 57% 54% 54% # of bachelor’s degrees awarded to transfer students from Oregon community colleges 485 49 289 520 53 310 529 53 315 Local Priorities (optional for each institution)

June 2013 Academic Strategies Committee/ OUS Board Meetings Page | 35
OUS ACHIEVEMENT COMPACT 2013-14
Disadvantaged Students 2011-12
Outcome Measures Actual for 2011-12
Disadvantaged Students*
African-American
Hispanic/ Latino
Native Amer.
or Alaskan Native
Pacific Islander
Multi- Racial or Multi-
Ethnic Pell
Eligible
Completion
# of bachelor’s degrees awarded to Oregonians 45 113 39 13 46 1,197 # of bachelor’s degrees awarded to rural Oregonians ** 12 10 0 ** 128 # of advanced degrees awarded to Oregonians 7 19 10 ** 6 n/a Quality
Alumni satisfaction Data Available 2014
Connections
# and % of newly admitted Oregon freshmen entering with HS dual credit or other early college credit
16 79 7 ** 76 399
33% 47% 47% ** 52% 50% # of bachelor’s degrees awarded to transfer students from Oregon community colleges ** 25 10 0 10 289 Local Priorities (optional for each institution) *A student is defined as being disadvantaged per OEIB 705-0010-0040 by being either a member of an under-represented racial or ethnic group and/or eligible to receive a Pell Grant. The Federal Pell Grant is a need-based grant from the federal government intended for undergraduate students who have not earned a bachelor’s degree; eligibility is subject to change by criteria set forth by the federal government. For this report, only Pell recipients are counted. Students self-identify both race and ethnicity. Inclusion in the multi-racial category is determined by identification with more than one race and inclusion of one or more of the underrepresented groups. A student may be a member of both an underrepresented minority group (URM) and be Pell eligible. **To protect confidentiality of individual students, data is not reported for cells containing fewer than six students or when small cell sizes can be deduced from either OUS or institutional totals.

June 2013 Academic Strategies Committee/ OUS Board Meetings Page | 36
OUS ACHIEVEMENT COMPACT 2013-14
Disadvantaged Students 2012-13 Projections
Outcome Measures 2012-13 Projections
Disadvantaged Students*
African-American
Hispanic/ Latino
Native Amer.
or Alaskan Native
Pacific Islander
Multi- Racial or Multi-
Ethnic Pell
Eligible
Completion
# of bachelor’s degrees awarded to Oregonians 45 112 39 13 46 1,190 # of bachelor’s degrees awarded to rural Oregonians ** 12 10 0 ** 124 # of advanced degrees awarded to Oregonians 7 18 10 ** 6 n/a Quality Alumni satisfaction Data Available 2014 Connections
# and % of newly admitted Oregon freshmen entering with HS dual credit or other early college credit
10 97 10 ** 79 398
31% 59% 59% ** 52% 54% # of bachelor’s degrees awarded to transfer students from Oregon community colleges ** 27 11 0 11 310 Local Priorities (optional for each institution) *A student is defined as being disadvantaged per OEIB 705-0010-0040 by being either a member of an under-represented racial or ethnic group and/or eligible to receive a Pell Grant. The Federal Pell Grant is a need-based grant from the federal government intended for undergraduate students who have not earned a bachelor’s degree; eligibility is subject to change by criteria set forth by the federal government. For this report, only Pell recipients are counted. Students self-identify both race and ethnicity. Inclusion in the multi-racial category is determined by identification with more than one race and inclusion of one or more of the underrepresented groups. A student may be a member of both an underrepresented minority group (URM) and be Pell eligible. **To protect confidentiality of individual students, data is not reported for cells containing fewer than six students or when small cell sizes can be deduced from either OUS or institutional totals.
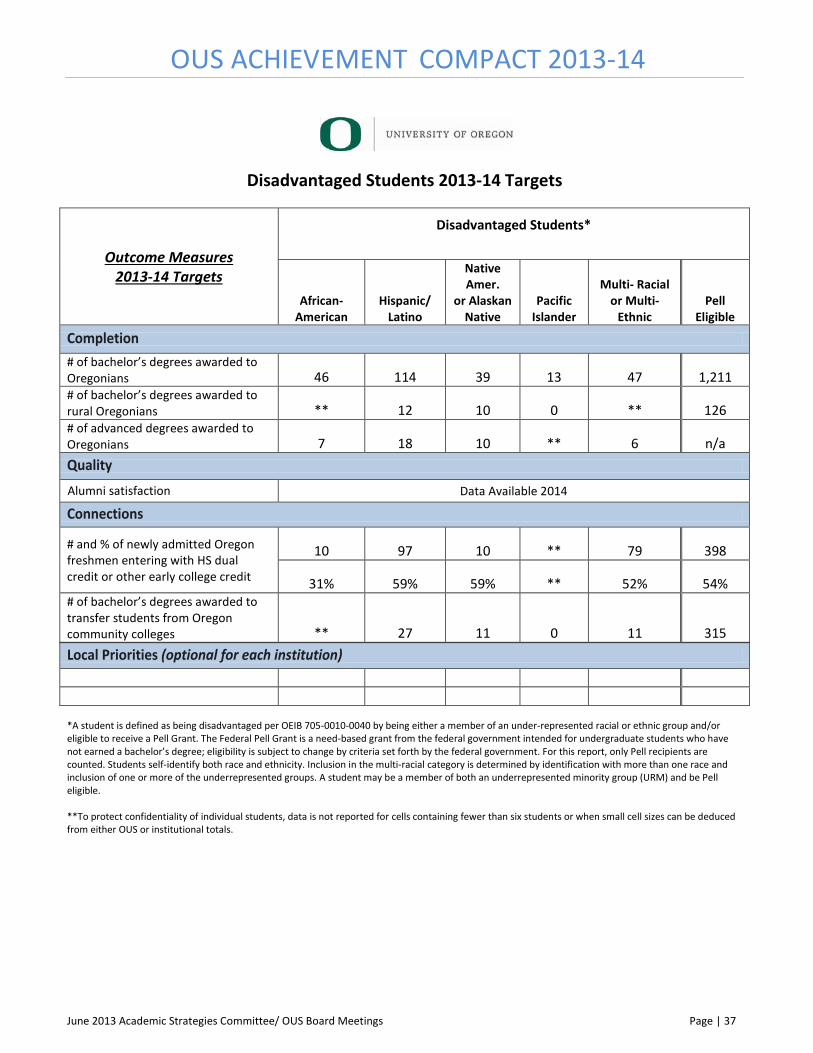
June 2013 Academic Strategies Committee/ OUS Board Meetings Page | 37
OUS ACHIEVEMENT COMPACT 2013-14
Disadvantaged Students 2013-14 Targets
Outcome Measures 2013-14 Targets
Disadvantaged Students*
African-American
Hispanic/ Latino
Native Amer.
or Alaskan Native
Pacific Islander
Multi- Racial or Multi-
Ethnic Pell
Eligible
Completion
# of bachelor’s degrees awarded to Oregonians 46 114 39 13 47 1,211 # of bachelor’s degrees awarded to rural Oregonians ** 12 10 0 ** 126 # of advanced degrees awarded to Oregonians 7 18 10 ** 6 n/a Quality
Alumni satisfaction Data Available 2014
Connections
# and % of newly admitted Oregon freshmen entering with HS dual credit or other early college credit
10 97 10 ** 79 398
31% 59% 59% ** 52% 54% # of bachelor’s degrees awarded to transfer students from Oregon community colleges ** 27 11 0 11 315 Local Priorities (optional for each institution) *A student is defined as being disadvantaged per OEIB 705-0010-0040 by being either a member of an under-represented racial or ethnic group and/or eligible to receive a Pell Grant. The Federal Pell Grant is a need-based grant from the federal government intended for undergraduate students who have not earned a bachelor’s degree; eligibility is subject to change by criteria set forth by the federal government. For this report, only Pell recipients are counted. Students self-identify both race and ethnicity. Inclusion in the multi-racial category is determined by identification with more than one race and inclusion of one or more of the underrepresented groups. A student may be a member of both an underrepresented minority group (URM) and be Pell eligible. **To protect confidentiality of individual students, data is not reported for cells containing fewer than six students or when small cell sizes can be deduced from either OUS or institutional totals.
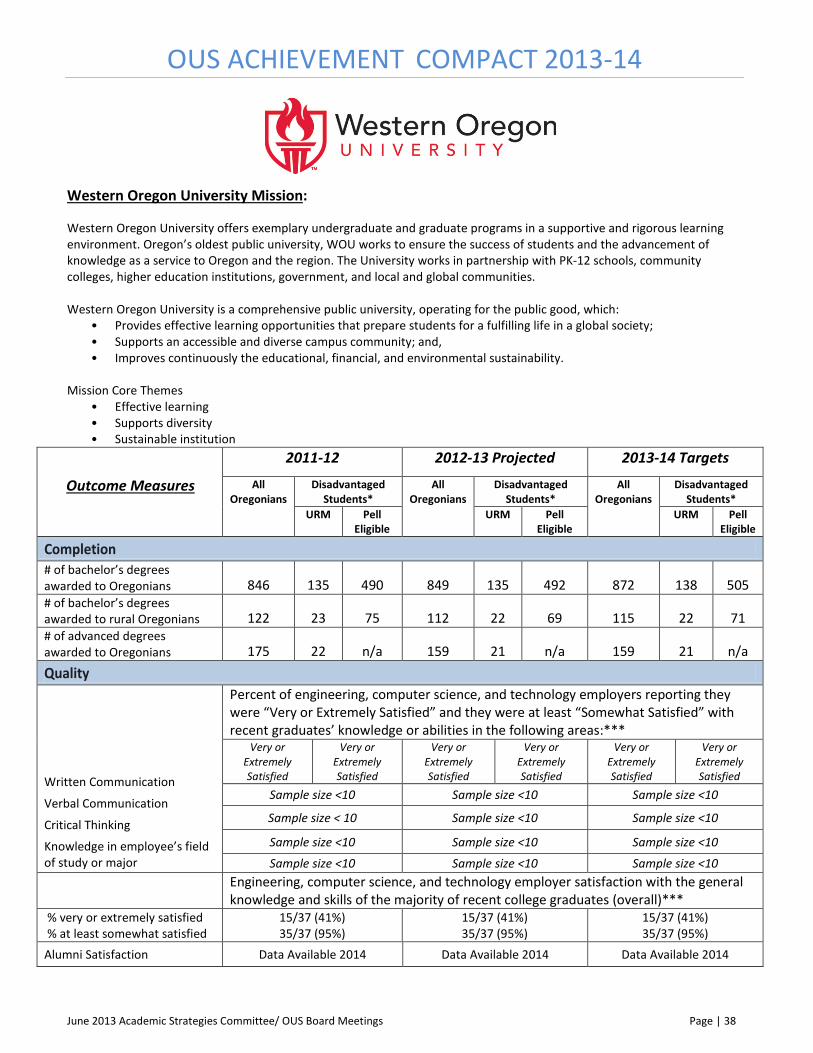
June 2013 Academic Strategies Committee/ OUS Board Meetings Page | 38
OUS ACHIEVEMENT COMPACT 2013-14 Western Oregon University Mission: Western Oregon University offers exemplary undergraduate and graduate programs in a supportive and rigorous learning environment. Oregon’s oldest public university, WOU works to ensure the success of students and the advancement of knowledge as a service to Oregon and the region. The University works in partnership with PK-12 schools, community colleges, higher education institutions, government, and local and global communities. Western Oregon University is a comprehensive public university, operating for the public good, which:
• Provides effective learning opportunities that prepare students for a fulfilling life in a global society; • Supports an accessible and diverse campus community; and, • Improves continuously the educational, financial, and environmental sustainability.
Mission Core Themes
• Effective learning • Supports diversity • Sustainable institution
Outcome Measures
2011-12 2012-13 Projected 2013-14 Targets
All Oregonians
Disadvantaged Students*
All Oregonians
Disadvantaged Students*
All Oregonians
Disadvantaged Students*
URM Pell Eligible
URM Pell Eligible
URM Pell Eligible
Completion # of bachelor’s degrees awarded to Oregonians 846 135 490 849 135 492 872 138 505 # of bachelor’s degrees awarded to rural Oregonians 122 23 75 112 22 69 115 22 71 # of advanced degrees awarded to Oregonians 175 22 n/a 159 21 n/a 159 21 n/a Quality
Written Communication
Verbal Communication
Critical Thinking
Knowledge in employee’s field of study or major
Percent of engineering, computer science, and technology employers reporting they were “Very or Extremely Satisfied” and they were at least “Somewhat Satisfied” with recent graduates’ knowledge or abilities in the following areas:***
Very or Extremely Satisfied
Very or Extremely Satisfied
Very or Extremely Satisfied
Very or Extremely Satisfied
Very or Extremely Satisfied
Very or Extremely Satisfied
Sample size <10 Sample size <10 Sample size <10
Sample size < 10 Sample size <10 Sample size <10
Sample size <10 Sample size <10 Sample size <10
Sample size <10 Sample size <10 Sample size <10
Engineering, computer science, and technology employer satisfaction with the general knowledge and skills of the majority of recent college graduates (overall)***
% very or extremely satisfied % at least somewhat satisfied
15/37 (41%) 35/37 (95%)
15/37 (41%) 35/37 (95%)
15/37 (41%) 35/37 (95%)
Alumni Satisfaction Data Available 2014 Data Available 2014 Data Available 2014

June 2013 Academic Strategies Committee/ OUS Board Meetings Page | 39
OUS ACHIEVEMENT COMPACT 2013-14
(Continued)
Outcome Measures
2011-12 2012-13 Projected 2013-14 Targets
All Oregonians
Disadvantaged Students*
All Oregonians
Disadvantaged Students*
All Oregonians
Disadvantaged Students*
Minority Pell Eligible
Minority Pell Eligible
Minority Pell Eligible
Connections
# and % of newly admitted Oregon freshmen entering with HS dual credit or other early college credit
250 38 127 228 24 116 228 24 116
29% 20% 28% 28% 15% 28% 28% 15% 28% # of bachelor’s degrees awarded to transfer students from Oregon community colleges 321 57 214 317 57 211 326 58 217 Local Priorities (optional for each institution)
*A student is defined as being disadvantaged per OEIB 705-0010-0040 by being either a member of an under-represented racial or ethnic group and/or eligible to receive a Pell Grant. The Federal Pell Grant is a need-based grant from the federal government intended for undergraduate students who have not earned a bachelor’s degree; eligibility is subject to change by criteria set forth by the federal government. For this report, only Pell recipients are counted. Students self-identify both race and ethnicity. Inclusion in the multi-racial category is determined by identification with more than one race and inclusion of one or more of the underrepresented groups. A student may be a member of both an underrepresented minority group (URM) and be Pell eligible. **To protect confidentiality of individual students, data is not reported for cells containing fewer than six students or when small cell sizes can be deduced from either OUS or institutional totals. ***Racial or ethnic data is not available. Oregon employers were not asked to rate their satisfaction of OUS alumni’s performance in terms of race/ethnicity.
Investment: Education and General 2009-10 2010-11 2011-12 2012-13 WOU $ 18,736,888 $ 17,837,457 $ 13,386,427 $ 13,943,665

June 2013 Academic Strategies Committee/ OUS Board Meetings Page | 40
OUS ACHIEVEMENT COMPACT 2013-14
Disadvantaged Students 2011-12
Outcome Measures Actuals for 2011-12
Disadvantaged Students*
African-American
Hispanic/ Latino
Native Amer.
or Alaskan Native
Pacific Islander
Multi- Racial or Multi-
Ethnic Pell
Eligible
Completion
# of bachelor’s degrees awarded to Oregonians 11 89 16 ** 16 490 # of bachelor’s degrees awarded to rural Oregonians ** 16 ** ** ** 75 # of advanced degrees awarded to Oregonians 0 12 ** ** ** n/a Quality Alumni satisfaction Data Available 2014 Connections
# and % of newly admitted Oregon freshmen entering with HS dual credit or other early college credit
** 28 7 0 0 127
** 22% 33% 0% n/a 28% # of bachelor’s degrees awarded to transfer students from Oregon community colleges ** 39 9 0 ** 214 Local Priorities (optional for each institution) *A student is defined as being disadvantaged per OEIB 705-0010-0040 by being either a member of an under-represented racial or ethnic group and/or eligible to receive a Pell Grant. The Federal Pell Grant is a need-based grant from the federal government intended for undergraduate students who have not earned a bachelor’s degree; eligibility is subject to change by criteria set forth by the federal government. For this report, only Pell recipients are counted. Students self-identify both race and ethnicity. Inclusion in the multi-racial category is determined by identification with more than one race and inclusion of one or more of the underrepresented groups. A student may be a member of both an underrepresented minority group (URM) and be Pell eligible. **To protect confidentiality of individual students, data is not reported for cells containing fewer than six students or when small cell sizes can be deduced from either OUS or institutional totals.

June 2013 Academic Strategies Committee/ OUS Board Meetings Page | 41
OUS ACHIEVEMENT COMPACT 2013-14
Disadvantaged Students 2012-13 Projections
Outcome Measures 2012-13 Projections
Disadvantaged Students*
African-American
Hispanic/ Latino
Native Amer.
or Alaskan Native
Pacific Islander
Multi- Racial or Multi-
Ethnic Pell
Eligible
Completion
# of bachelor’s degrees awarded to Oregonians 11 89 16 ** 16 492 # of bachelor’s degrees awarded to rural Oregonians ** 15 ** ** ** 69 # of advanced degrees awarded to Oregonians 0 11 ** ** ** n/a
Quality
Alumni satisfaction Data Available 2014
Connections
# and % of newly admitted Oregon freshmen entering with HS dual credit or other early college credit
** 13 6 ** 0 116
** 16% 33% ** n/a 28% # of bachelor’s degrees awarded to transfer students from Oregon community colleges ** 39 9 0 ** 211
Local Priorities (optional for each institution) *A student is defined as being disadvantaged per OEIB 705-0010-0040 by being either a member of an under-represented racial or ethnic group and/or eligible to receive a Pell Grant. The Federal Pell Grant is a need-based grant from the federal government intended for undergraduate students who have not earned a bachelor’s degree; eligibility is subject to change by criteria set forth by the federal government. For this report, only Pell recipients are counted. Students self-identify both race and ethnicity. Inclusion in the multi-racial category is determined by identification with more than one race and inclusion of one or more of the underrepresented groups. A student may be a member of both an underrepresented minority group (URM) and be Pell eligible. **To protect confidentiality of individual students, data is not reported for cells containing fewer than six students or when small cell sizes can be deduced from either OUS or institutional totals.

June 2013 Academic Strategies Committee/ OUS Board Meetings Page | 42
OUS ACHIEVEMENT COMPACT 2013-14
Disadvantaged Students 2013-14 Targets
Outcome Measures 2013-14 Targets
Disadvantaged Students*
African-American
Hispanic/ Latino
Native Amer.
or Alaskan Native
Pacific Islander
Multi- Racial or Multi-
Ethnic Pell
Eligible
Completion
# of bachelor’s degrees awarded to Oregonians 11 92 16 ** 16 505 # of bachelor’s degrees awarded to rural Oregonians ** 15 ** ** ** 71 # of advanced degrees awarded to Oregonians 0 11 ** ** ** n/a
Quality
Alumni satisfaction Data Available 2014
Connections
# and % of newly admitted Oregon freshmen entering with HS dual credit or other early college credit
** 13 6 ** 0 116
** 16% 33% ** n/a 28% # of bachelor’s degrees awarded to transfer students from Oregon community colleges ** 40 9 0 ** 217
Local Priorities (optional for each institution) *A student is defined as being disadvantaged per OEIB 705-0010-0040 by being either a member of an under-represented racial or ethnic group and/or eligible to receive a Pell Grant. The Federal Pell Grant is a need-based grant from the federal government intended for undergraduate students who have not earned a bachelor’s degree; eligibility is subject to change by criteria set forth by the federal government. For this report, only Pell recipients are counted. Students self-identify both race and ethnicity. Inclusion in the multi-racial category is determined by identification with more than one race and inclusion of one or more of the underrepresented groups. A student may be a member of both an underrepresented minority group (URM) and be Pell eligible. **To protect confidentiality of individual students, data is not reported for cells containing fewer than six students or when small cell sizes can be deduced from either OUS or institutional totals.

June 2013 Academic Strategies Committee/ OUS Board Meetings Page | 43
OUS ACHIEVEMENT COMPACT 2013-14
D A T A D E F I N I T I O N S
Independent Variables Definition Source All All Oregonians OUS
Disadvantaged students:
Underrepresented Ethnic Minorities (URM)
(OEIB Disadvantaged Student Groups 705-0010-0040, part 4)
Oregonians who are Hispanic/Latino, Pacific Islander, African American, Native American/Alaskan Native, and those with ‘two or more races’ who identify as one of the above.
OUS
Disadvantaged Students:
Pell Eligibility
(OEIB Disadvantaged Student Groups 705-0010-0040, part 4)
The Federal Pell Grant is a need-based grant from the federal government intended for undergraduate students who have not earned a bachelor’s degree. Each student’s award amount is determined on the basis of financial need and cost of attendance by a formula applied to information a student or their parents supply on the FAFSA. For this report, only Pell recipients are counted.
For the metrics pertaining to degrees, a student is counted as being Pell eligible if he/she was awarded a Pell Grant at any time while he/she was attending an OUS university. For the metric on freshmen entering with high school dual credit or other early entry credit, a student is counted as Pell eligible if he/she received a Pell Grant during the year he/she was a first-time freshman.
OUS
Achievement Compact Metrics Definition Source
Completion
# of bachelor’s degrees awarded to Oregonians
SCARF Annual Degrees, Academic Year, Summer through Spring, using residency during year bachelor’s degree was awarded
OUS
# of bachelor’s degrees awarded to rural Oregonians
SCARF Annual Degrees, Academic Year, Summer through Spring, using residency during year degree was awarded, to include the following rural Oregon counties: Baker, Clatsop, Coos, Crook, Curry, Douglas, Gilliam, Grant, Harney, Hood River, Jefferson, Josephine, Klamath, Lake, Lincoln, Malheur, Morrow, Sherman, Tillamook, Umatilla, Union, Wallowa, Wasco, and Wheeler
OUS
# of advanced degrees awarded to Oregonians
SCARF Annual Degrees, Academic Year, Summer through Spring, using residency during year Master’s or Doctoral degrees were awarded
OUS

June 2013 Academic Strategies Committee/ OUS Board Meetings Page | 44
OUS ACHIEVEMENT COMPACT 2013-14 D A T A D E F I N I T I O N S
Achievement Compact Metrics (continued) Definition Source
Quality Percent of engineering, computer science, and technology employers reporting they were “very or extremely satisfied” with recent graduates’ knowledge or abilities in the following areas: Written Communication Verbal Communication Critical Thinking
Knowledge in employee’s field of study or major
Percentages are also reported for those employers who reported being “extremely, very, or somewhat” satisfied.
OUS Employer Survey 2012 Survey conducted in 2012 by OUS reflecting responses of employers hiring recent OUS graduates with engineering, computer science, and materials science degrees. Four (4) digit NAICS industry codes were used to obtain industries that would potentially hire engineering and technology graduates. A study conducted by Carnegie Mellon University was used as a baseline for these industry codes. In order to help ensure that respondents were directly dealing and had familiarity with OUS graduates, three separate employer contact lists were used for a total number of 286 respondents out of a total list of 3,350 contacts for a 8.5% response rate. The first contact list was executives and hiring managers from ETIC members and OUS engineering contractors comprised 29% of the total sample (84 responses out of 175 total, and a 48% response rate); a list of ‘C-level’ executives and hiring managers from a DMX mailing list for 26 of the entire sample (14 respondents out of 1027 records for a 7% response rate); and a list from the Oregon Employment Department comprising of primarily of accounting, payroll, and HR managers for engineering and technology industries for 45% of the entire sample (128 respondents out of 2,148 records for a 6% response rate) For those respondents who reported being at least ‘somewhat familiar’ with graduates from the Oregon University System, skills were assessed for an institution if it was among the top three institutions from which the company hires recent graduates. Employers were not asked to rate OUS alumni’s skills or knowledge in terms of race or ethnicity.
OUS
Employer satisfaction
OUS Employer Survey 2012 For those respondents who reported being at least ‘somewhat familiar’ with graduates from the Oregon University System, employer satisfaction is measured by the percent response of “Extremely” or “Very satisfied” to the following question: “Overall, how satisfied are you with the general skills of the majority of recent graduates of (institution name) as they relate to the requirements of the job(s) for which they are hired?” Data is also shown for the percent responding “Extremely” “Very” and “Somewhat” satisfied. Employers were not asked to rate OUS alumni’s skills or knowledge in terms of race or ethnicity. Employers were not asked to rate their satisfaction levels in terms of student race/ethnicity.
OUS
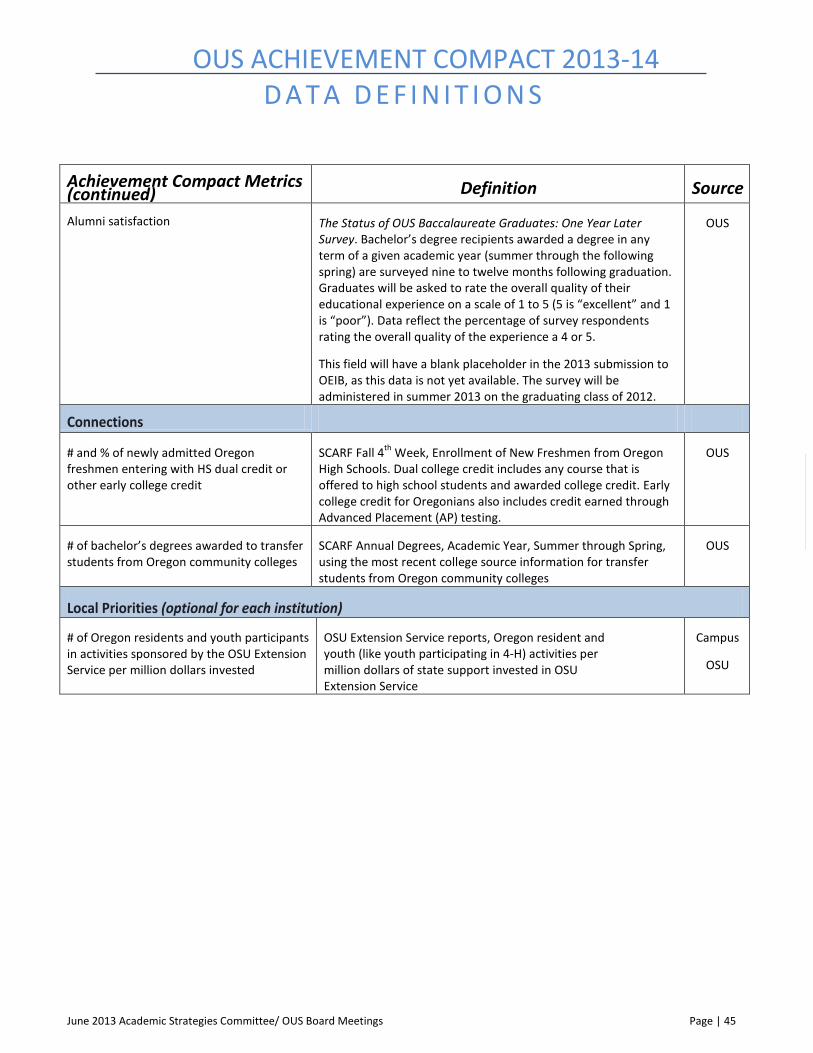
June 2013 Academic Strategies Committee/ OUS Board Meetings Page | 45
OUS ACHIEVEMENT COMPACT 2013-14 D A T A D E F I N I T I O N S
Achievement Compact Metrics (continued) Definition Source
Alumni satisfaction The Status of OUS Baccalaureate Graduates: One Year Later Survey. Bachelor’s degree recipients awarded a degree in any term of a given academic year (summer through the following spring) are surveyed nine to twelve months following graduation. Graduates will be asked to rate the overall quality of their educational experience on a scale of 1 to 5 (5 is “excellent” and 1 is “poor”). Data reflect the percentage of survey respondents rating the overall quality of the experience a 4 or 5.
This field will have a blank placeholder in the 2013 submission to OEIB, as this data is not yet available. The survey will be administered in summer 2013 on the graduating class of 2012.
OUS
Connections
# and % of newly admitted Oregon freshmen entering with HS dual credit or other early college credit
SCARF Fall 4th Week, Enrollment of New Freshmen from Oregon High Schools. Dual college credit includes any course that is offered to high school students and awarded college credit. Early college credit for Oregonians also includes credit earned through Advanced Placement (AP) testing.
OUS
# of bachelor’s degrees awarded to transfer students from Oregon community colleges
SCARF Annual Degrees, Academic Year, Summer through Spring, using the most recent college source information for transfer students from Oregon community colleges
OUS
Local Priorities (optional for each institution)
# of Oregon residents and youth participants in activities sponsored by the OSU Extension Service per million dollars invested
OSU Extension Service reports, Oregon resident and youth (like youth participating in 4-H) activities per million dollars of state support invested in OSU Extension Service
Campus
OSU

Oregon State Board of Higher Education Academic Strategies Committee Page 20 ACTION ITEMS
(This page intentionally left blank.)
Oregon State Board of Higher Education Academic Strategies Committee Page 65 DISCUSSION/ACTION ITEMS
Diversity: Empowering Student Success through Inclusion
Oregon’s demographics, like many states in the nation, are rapidly changing. In 2011-2012, 26% of Oregon’s public high school graduates were students of color; 17% of Oregon’s high school graduates were Hispanic. By 2015-2016, 31% of Oregon’s public high school graduates are projected to be students of color, with 23% of all Oregon high school graduates projected to be Hispanic. Yet, in 2011, 19.2% of Oregon University students identified as students of color and in 2010-2011, only 15% of the degrees awarded were to students of color. This raises the questions: What are OUS institutions doing to prepare for a much more ethnically diverse student body? Are OUS institutions fully serving the ethnic diversity of Oregon’s student population? This report describes disaggregated data at two important junctures: enrollment data (representing the racial and ethnic diversity on OUS campuses) and graduation data (representing how well OUS serves all of its students). We point out gaps between admission and enrollment and gaps between enrollment and graduation – disaggregated for students in the OUS. It is important to examine these gaps, why they exist, and the actions necessary to close them. A future examination should also consider admissions data (representing opportunities for students to study at OUS institutions) and the gaps between high school graduation and admissions. Oregon’s high school demographic data is an important tool in this analysis. For institutions with a statewide mission (Oregon State, Oregon Tech, and the University of Oregon), one lens to view campus diversity is statewide high school graduation data, as high school graduates represent the potential pool of resident students for these institutions. Oregon Tech has the unique mission of serving statewide STEM needs, and the particularities of serving a STEM population must also be considered for Oregon Tech. Portland State, Eastern Oregon University, Southern Oregon University, and Western Oregon University have regionalized missions and we can apply the same principle: that one lens to view campus diversity is through regional high school graduation data. It is important to note that the portfolio of OUS campuses will illustrate diversity on their campuses differently. As a system, however, we strive to close all achievement gaps and ensure equitable access for all students. System wide data show that Oregon Universities are not keeping pace enrolling and graduating students of color. In particular, OUS institutions are not enrolling Hispanic and African-American students at the same pace at which Hispanic and African American students are graduating from Oregon high schools. Further, OUS institutions are not graduating Hispanic and African-American students at the same pace as other students. It is incumbent upon the OUS institutions to recruit and retain students – including student of color – statewide in order to meet the 40-40-20 goal.
Oregon State Board of Higher Education Academic Strategies Committee Page 66 DISCUSSION/ACTION ITEMS
Further troubling is the graduation gap between White, non-Hispanic students and their African-American, American Indian, and Latino/a counterparts. Systemwide, White, non-Hispanic students graduate at a rate of 11.1% higher than their African-American counterparts, 14.8% higher than their American Indian counterparts, and 7.1% higher than their Latino/a counterparts. The graduation gap is not spread evenly across all campuses, as we explore later in this report. Two campuses –Portland State University and Western Oregon University – are standout examples of how institutions can redirect campus resources and implement proven strategies and practices to recruit and retain a diverse population of students. We highlight some of the excellent work happening at PSU and WOU: PSU has undertaken a portfolio of initiatives on campus to recruit and retain a diverse population of students and ensure their success on campus. These initiatives include developing a welcoming, inclusive, and diverse environment on campus (e.g., Top of the Class event to celebrate SEIU-represented staff) to producing Spanish-language student and family recruitment videos, with more to come in Mandarin, Russian, Vietnamese, Japanese, and Arabic. PSU has a host of Multicultural Student Services, including a recent reorganization and transition of the Cultural Centers on campus. The centers offer programs such as Latino Hip Hop, Indigenous Solidarity Day, Essence of Chinese Culture lecture, and Black Music and Black Resistance lectures. WOU has a well-established commitment to serving all students, especially those from underserved ethnic and cultural backgrounds. In 2013 WOU was the only college or university in the Pacific Northwest to receive the Higher Education Excellence in Diversity Award by Insight into Diversity. In 2010 The Education Trust named WOU as the top university in the country in eliminating the graduation gap between Latino and White students and as one of the top ten universities in the country in eliminating the graduation gap between all minority and White students. In the upcoming years, WOU will continue to build upon its strengths in these areas by focusing on both recruitment and retention of Students of Color. In particular the expanded MAPS Peer Mentor Program will provide greater support for students in the residence halls (WOU requires first year students to live in the residence halls) and greatly enhance the financial literacy of all students. The continued implementation of the WOU Connect communication and support system will support the implementation of retention and student success efforts at students and groups in need. A final retention effort is the revamping of math placement and developmental course support. WOU will continue to work with high schools that enroll high numbers and percentages of minority students. The WOU Mentor program with McKay (Salem) and Roosevelt (Portland) high schools has completed its second year and should increase student enrollment from those high schools.

Oregon State Board of Higher Education Academic Strategies Committee Page 67 DISCUSSION/ACTION ITEMS
I. Admissions and Enrollment
The Landscape: Demographics of Oregon’s Public High School Graduates We begin with an examination of trends in Oregon’s public high school graduation data. Figure 1 shows actual and projected demographics of Oregon’s public high school graduates from 2002-2003 to 2030-2031. The number of public high school graduates in Oregon is projected to be fairly flat, with growth not expected for about a decade. However, the number of total students of color in Oregon’s public high school graduating classes has been and is expected to show increased growth over the next decade. Prescott & Bransberger’s (2012) analysis of high school graduation trends in the United States indicates that Oregon is a state characterized by a slight contraction of high school graduates but a high diversification rate (see Figure 2).
Figure 1: Demographics of Oregon's Public High School Graduates 2002-2031
-
5,000
10,000
15,000
20,000
25,000
30,000
35,000
40,000
45,000
Asian Black Hispanic Native American White
Public Oregon High School Graduates
SOURCE: OUS Office of Institutional Research, Projections made November
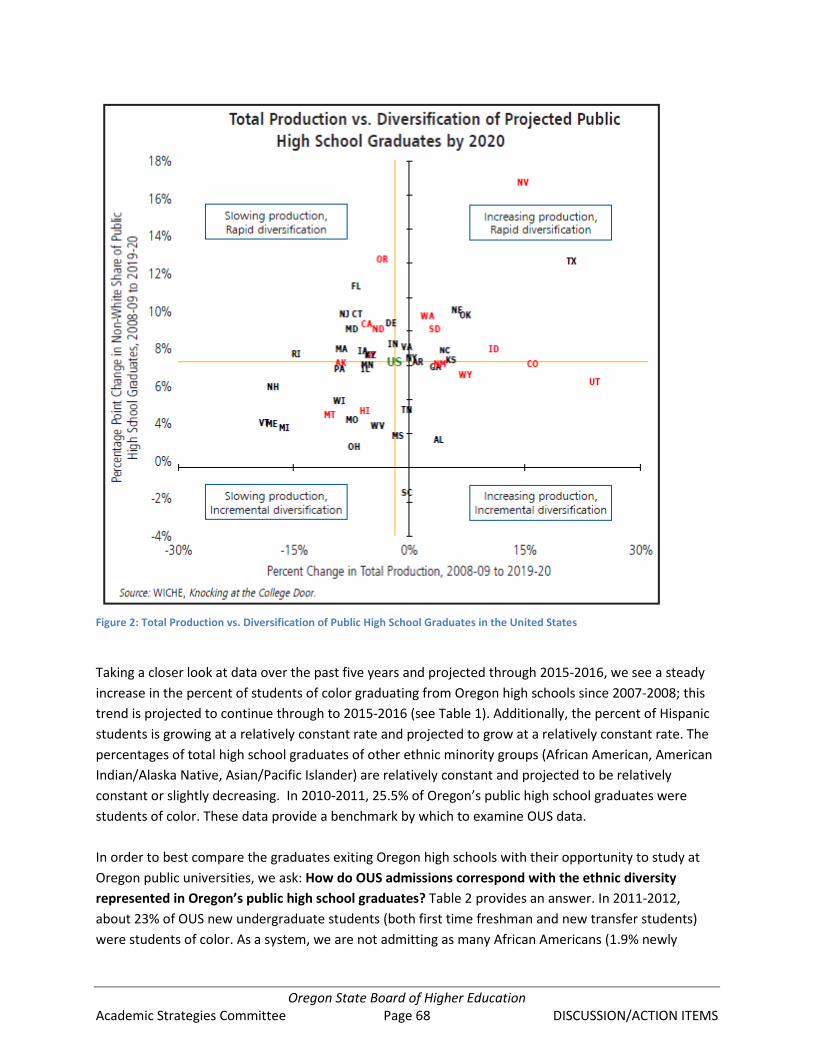
Oregon State Board of Higher Education Academic Strategies Committee Page 68 DISCUSSION/ACTION ITEMS
Figure 2: Total Production vs. Diversification of Public High School Graduates in the United States
Taking a closer look at data over the past five years and projected through 2015-2016, we see a steady increase in the percent of students of color graduating from Oregon high schools since 2007-2008; this trend is projected to continue through to 2015-2016 (see Table 1). Additionally, the percent of Hispanic students is growing at a relatively constant rate and projected to grow at a relatively constant rate. The percentages of total high school graduates of other ethnic minority groups (African American, American Indian/Alaska Native, Asian/Pacific Islander) are relatively constant and projected to be relatively constant or slightly decreasing. In 2010-2011, 25.5% of Oregon’s public high school graduates were students of color. These data provide a benchmark by which to examine OUS data. In order to best compare the graduates exiting Oregon high schools with their opportunity to study at Oregon public universities, we ask: How do OUS admissions correspond with the ethnic diversity represented in Oregon’s public high school graduates? Table 2 provides an answer. In 2011-2012, about 23% of OUS new undergraduate students (both first time freshman and new transfer students) were students of color. As a system, we are not admitting as many African Americans (1.9% newly
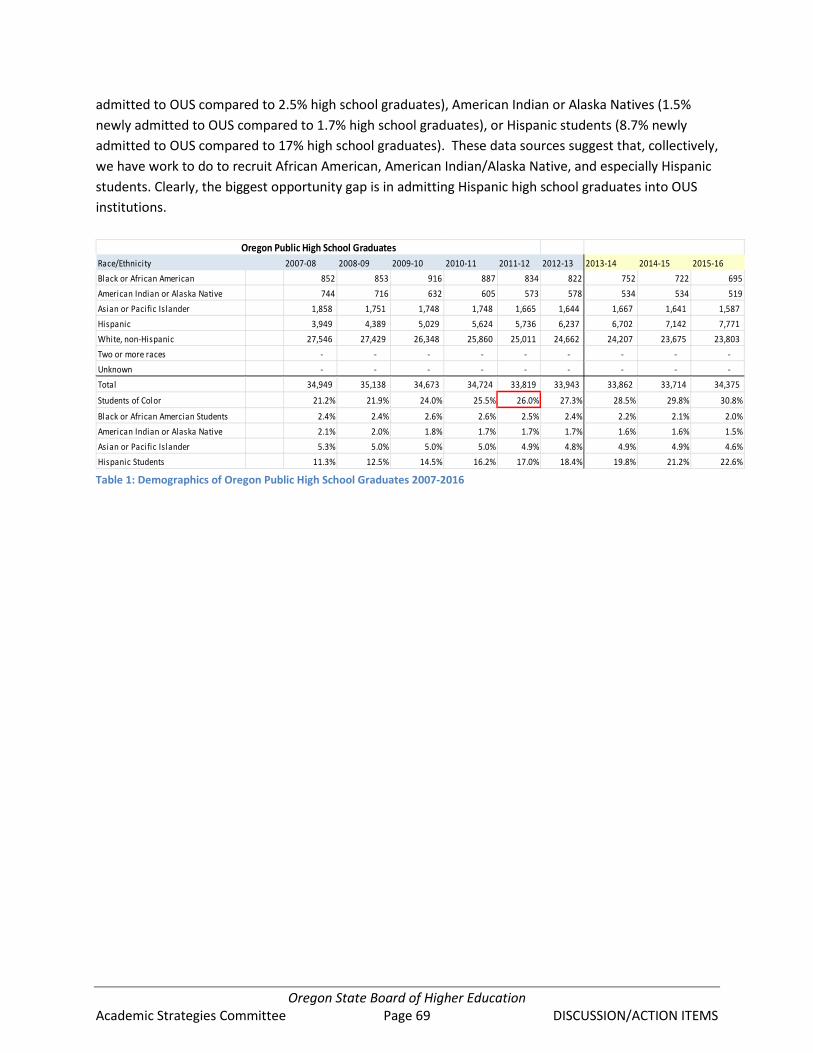
Oregon State Board of Higher Education Academic Strategies Committee Page 69 DISCUSSION/ACTION ITEMS
admitted to OUS compared to 2.5% high school graduates), American Indian or Alaska Natives (1.5% newly admitted to OUS compared to 1.7% high school graduates), or Hispanic students (8.7% newly admitted to OUS compared to 17% high school graduates). These data sources suggest that, collectively, we have work to do to recruit African American, American Indian/Alaska Native, and especially Hispanic students. Clearly, the biggest opportunity gap is in admitting Hispanic high school graduates into OUS institutions.
Table 1: Demographics of Oregon Public High School Graduates 2007-2016
Race/Ethnicity 2007-08 2008-09 2009-10 2010-11 2011-12 2012-13 2013-14 2014-15 2015-16Black or African American 852 853 916 887 834 822 752 722 695American Indian or Alaska Native 744 716 632 605 573 578 534 534 519Asian or Pacific Islander 1,858 1,751 1,748 1,748 1,665 1,644 1,667 1,641 1,587 Hispanic 3,949 4,389 5,029 5,624 5,736 6,237 6,702 7,142 7,771 White, non-Hispanic 27,546 27,429 26,348 25,860 25,011 24,662 24,207 23,675 23,803 Two or more races - - - - - - - - - Unknown - - - - - - - - - Total 34,949 35,138 34,673 34,724 33,819 33,943 33,862 33,714 34,375
Students of Color 21.2% 21.9% 24.0% 25.5% 26.0% 27.3% 28.5% 29.8% 30.8%
Black or African Amercian Students 2.4% 2.4% 2.6% 2.6% 2.5% 2.4% 2.2% 2.1% 2.0%American Indian or Alaska Native 2.1% 2.0% 1.8% 1.7% 1.7% 1.7% 1.6% 1.6% 1.5%Asian or Pacific Islander 5.3% 5.0% 5.0% 5.0% 4.9% 4.8% 4.9% 4.9% 4.6%Hispanic Students 11.3% 12.5% 14.5% 16.2% 17.0% 18.4% 19.8% 21.2% 22.6%
Oregon Public High School Graduates
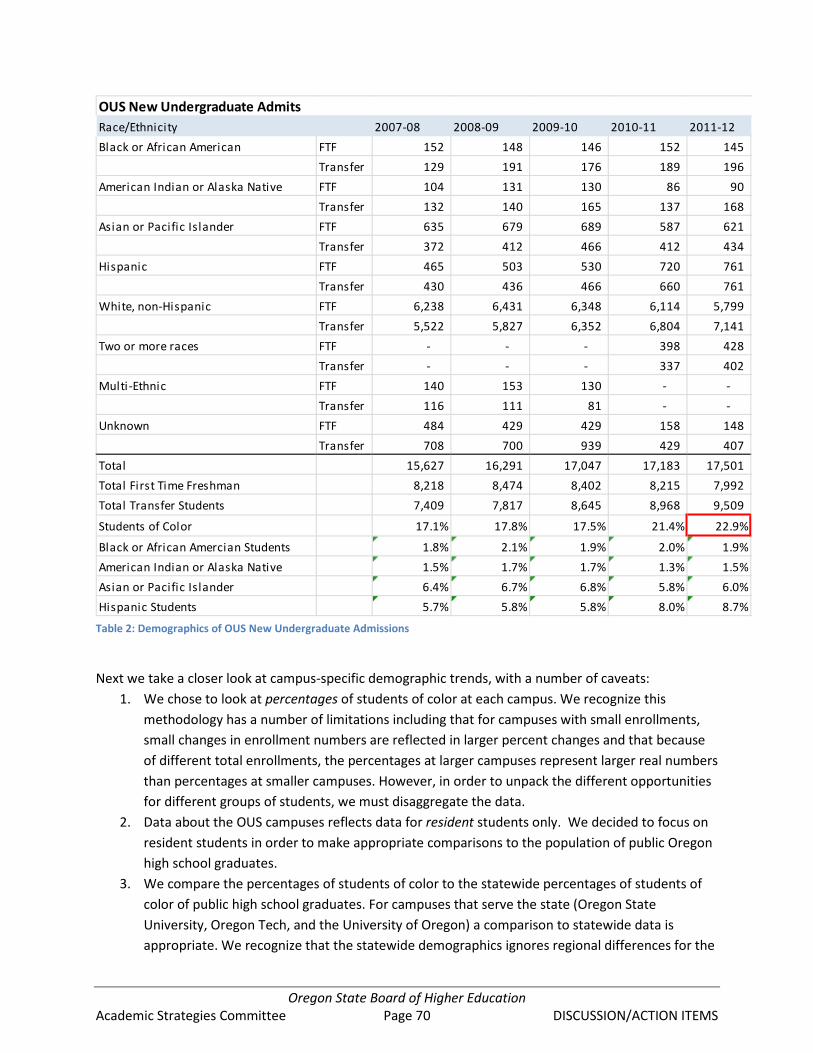
Oregon State Board of Higher Education Academic Strategies Committee Page 70 DISCUSSION/ACTION ITEMS
Table 2: Demographics of OUS New Undergraduate Admissions
Next we take a closer look at campus-specific demographic trends, with a number of caveats:
1. We chose to look at percentages of students of color at each campus. We recognize this methodology has a number of limitations including that for campuses with small enrollments, small changes in enrollment numbers are reflected in larger percent changes and that because of different total enrollments, the percentages at larger campuses represent larger real numbers than percentages at smaller campuses. However, in order to unpack the different opportunities for different groups of students, we must disaggregate the data.
2. Data about the OUS campuses reflects data for resident students only. We decided to focus on resident students in order to make appropriate comparisons to the population of public Oregon high school graduates.
3. We compare the percentages of students of color to the statewide percentages of students of color of public high school graduates. For campuses that serve the state (Oregon State University, Oregon Tech, and the University of Oregon) a comparison to statewide data is appropriate. We recognize that the statewide demographics ignores regional differences for the
Race/Ethnicity 2007-08 2008-09 2009-10 2010-11 2011-12Black or African American FTF 152 148 146 152 145
Transfer 129 191 176 189 196 American Indian or Alaska Native FTF 104 131 130 86 90
Transfer 132 140 165 137 168 Asian or Pacific Islander FTF 635 679 689 587 621
Transfer 372 412 466 412 434 Hispanic FTF 465 503 530 720 761
Transfer 430 436 466 660 761 White, non-Hispanic FTF 6,238 6,431 6,348 6,114 5,799
Transfer 5,522 5,827 6,352 6,804 7,141 Two or more races FTF - - - 398 428
Transfer - - - 337 402 Multi-Ethnic FTF 140 153 130 - -
Transfer 116 111 81 - - Unknown FTF 484 429 429 158 148
Transfer 708 700 939 429 407 Total 15,627 16,291 17,047 17,183 17,501 Total First Time Freshman 8,218 8,474 8,402 8,215 7,992 Total Transfer Students 7,409 7,817 8,645 8,968 9,509
Students of Color 17.1% 17.8% 17.5% 21.4% 22.9%
Black or African Amercian Students 1.8% 2.1% 1.9% 2.0% 1.9%American Indian or Alaska Native 1.5% 1.7% 1.7% 1.3% 1.5%Asian or Pacific Islander 6.4% 6.7% 6.8% 5.8% 6.0%Hispanic Students 5.7% 5.8% 5.8% 8.0% 8.7%
OUS New Undergraduate Admits

Oregon State Board of Higher Education Academic Strategies Committee Page 71 DISCUSSION/ACTION ITEMS
other campuses and will conduct further analysis in the future to compare Portland State University, Eastern Oregon University, Southern Oregon University, and Western Oregon University with the demographics specific to their regions.
4. We compare 2011-2012 new undergraduate admissions and enrollment percentages to 2010-2011 Oregon public high school graduates with the thinking that students graduating from high school in spring 2011 will enter college as first time freshman in the fall of 2011. We also include new transfer students in our counts.
5. We are sensitive to the issues regarding how we count students of color (e.g., concerns as raised by the Communities of Color report). However, it was beyond our purview in this paper to address these issues for the data collected for this report. We recognize that students might not self-identify and that the data may represent inaccurate counts of students of color. As such, we posit this analysis as a starting point for further conversation and action, rather than an end.
Eastern Oregon University New, Undergraduate Resident Admissions 2007-08 2009-09 2009-10 2010-11 2011-12 Total Students 741 821 975 1,024 1,005 Total First Time Freshman 257 313 403 389 310 Total Transfer Students 484 508 572 635 695 Total Students of Color 161 149 162 137 159 Students of Color 9.7% 10.5% 12.7% 11.5% 14.5% Black or African American 0.5% 1.7% 1.3% 0.7% 1.9% Am. Indian or Alaska Native 1.9% 2.6% 2.7% 2.1% 3.2% Asian or Pacific Islander 1.6% 1.5% 3.2% 2.5% 3.1% Hispanic Students 3.5% 3.8% 5.2% 5.8% 5.9% White, non-Hispanic 78.3% 81.9% 83.4% 86.6% 84.2% Two or more races 0.0% 0.0% 0.0% 0.5% 0.5% Multi-Ethnic 2.2% 1.0% 0.3% 0.0% 0.0% Unknown 12.0% 7.7% 3.9% 1.9% 1.3% In 2011-12, EOU’s percentage of American Indian/Alaska Native students (3.2% of new undergraduate admissions) was almost double the percentage of American Indian/Alaska Native public high school graduates (1.7% in 2010-2011). EOU’s percentage of Hispanic students (5.9%) is considerably lower than the percentage of Hispanic Oregon high school graduates (16.2% in 2010-2011). However, the trend in Hispanic admission has been increasing since 2007-2008. As such, we recommend EOU focus on increasing the enrollment of Hispanic students and continuing to recruit and enroll American Indian/Alaska Native students to achieve an entering student body demographic that more closely mirrors that of Oregon’s graduating high school class. The ramping up of EOU’s Hermiston Eastern Oregon Higher Education Center should help increase student diversity by 10-12% over the next 2-3 years.

Oregon State Board of Higher Education Academic Strategies Committee Page 72 DISCUSSION/ACTION ITEMS
Oregon Tech New, Undergraduate, Resident Admissions 2007-08 2008-09 2009-10 2010-11 2011-12 Total 679 720 740 744 797 Total First Time Freshman 267 320 324 274 294 Total Transfer Students 412 400 416 470 503 Total Students of Color 153 169 198 150 162 Students of Color 12.7% 13.8% 16.4% 17.5% 18.2% Black or African American 0.4% 0.7% 0.5% 0.8% 0.6% Am. Indian or Alaska Native 2.2% 2.8% 2.2% 0.8% 1.6% Asian or Pacific Islander 4.4% 5.3% 6.1% 4.2% 5.0% Hispanic Students 5.6% 5.0% 6.9% 6.0% 6.3% White, non-Hispanic 77.5% 76.5% 73.2% 79.8% 79.7%
Two or more races 0.0% 0.0% 0.0% 5.6% 4.6% Multi-Ethnic 0.0% 0.0% 0.7% 0.0% 0.0% Unknown 9.9% 9.7% 10.4% 2.7% 2.1% In 2011-2012, Oregon Tech’s percentage of admitted Asian/Pacific Islander students (5.0%) matched the percentage of Asian/Pacific Islander public high school graduates in 2010-2011. Oregon Tech’s percentage of admitted African American students (0.6%) was significantly lower than the percentage of African American public high school graduates (2.6% in 2010-2011). Given Oregon Tech’s new presence in Wilsonville and its statewide mission, we encourage a focus on increasing enrollments of African American students at the Wilsonville campus. Similarly, Oregon Tech’s percentage of admitted Hispanic students (8.7%) is considerably lower than the percentage of Hispanic Oregon high school graduates (16.2% in 2010-2011). As such, we recommend Oregon Tech focus on increasing the enrollment of Hispanic and African American students by 8-9% over the next 2-3 years to achieve an entering student body demographic that more closely mirrors that of Oregon’s graduating high school class. Because of its focus on STEM, OIT is poised to take advantage of a rich base of research, including practices for increasing the participation of African-American men in STEM (e.g., Marks, 2011; Wright, 2011) and taking advantage of research showing, for instance, that African-American women are more likely to enter STEM majors at higher rates than their white counterparts (Hanson, 2004).

Oregon State Board of Higher Education Academic Strategies Committee Page 73 DISCUSSION/ACTION ITEMS
Oregon State University New, Undergraduate, Resident Admissions 2007-08 2008-09 2009-10 2010-11 2011-12 Total 3,857 4,049 4,453 4,482 4,428 Total First Time Freshman 2,600 2,659 2,761 2,773 2,646 Total Transfer Students 1,257 1,390 1,692 1,709 1,782 Total Students of Color 1,021 1,036 1,215 1.078 1,087 Students of Color 15.4% 15.7% 15.4% 20.1% 22.1% Black or African American 1.2% 1.1% 0.9% 0.6% 0.6% Am. Indian or Alaska Native 1.2% 1.7% 1.5% 1.0% 1.0% Asian or Pacific Islander 7.5% 7.5% 7.6% 6.1% 7.2% Hispanic Students 5.3% 5.3% 5.3% 6.9% 7.5% White, non-Hispanic 73.5% 74.4% 72.7% 75.9% 75.5% Two or more races 0.0% 0.0% 0.0% 5.5% 5.8% Multi-Ethnic 0.2% 0.1% 0.1% 0.0% 0.0% Unknown 11.1% 9.9% 11.9% 3.9% 2.5% In 2011-2012, OSU’s percentage of admitted African American students (0.6%) was significantly lower than the percentage of African American public high school graduates (2.6% in 2010-2011). Furthermore, the percentage of newly admitted African American students at OSU has decreased since 2007-2008. We encourage a focus on increasing enrollments of African American students- by 1.5-2% over the next 2-3 years- to more closely mirror that of Oregon’s graduating high school class. OSU’s admission rate of Hispanic students (7.5%) is considerably lower than the percentage of Hispanic Oregon high school graduates (16.2% in 2010-2011). However, the trend in Hispanic admission has been increasing since 2007-2008. As such, we recommend OSU also focus on increasing the enrollment of Hispanic students. All in all, OSU should achieve overall increases in student of color by 1.5-2% over the next 2-3 years to achieve an entering student body demographic that more closely mirrors that of Oregon’s graduating high school class. OSU is doing well recruiting Asian and Pacific Islander student, as the percentage of newly admitted Asian/Pacific Islander students (7.2% in 2011-2012) exceeds the percentage of Asian and Pacific Islander public high school graduates (5.0% in 2010-2011).

Oregon State Board of Higher Education Academic Strategies Committee Page 74 DISCUSSION/ACTION ITEMS
Portland State University New, Undergraduate, Resident Admissions 2007-08 2008-09 2009-10 2010-11 2011-12 Total 4,523 4,794 4,989 4,842 4,991 Total First Time Freshman 1,369 1,402 1,317 1,214 1,090 Total Transfer Students 3,154 3,392 3,672 3,628 3,901 Total Students of Color 1,372 1,445 1,460 1,425 2,568 Students of Color 22.2% 21.9% 21.0% 25.3% 28.3% Black or African American 3.3% 3.4% 3.2% 3.6% 3.3% Am. Indian or Alaska Native 1.6% 1.4% 1.7% 1.3% 1.5% Asian or Pacific Islander 9.0% 8.6% 9.4% 8.1% 7.7% Hispanic Students 6.3% 6.7% 6.2% 8.5% 10.7% White, non-Hispanic 69.7% 69.9% 70.7% 70.6% 68.6% Two or more races 0.0% 0.0% 0.0% 3.8% 5.0% Multi-Ethnic 2.0% 1.9% 0.5% 0.0% 0.0% Unknown 8.2% 8.2% 8.2% 4.2% 3.1% PSU is the only OUS campus whose percentage of students of color of new undergraduate admissions (28.3% in 2011-2012) exceeds that of the state’s public high school graduates (25.5% in 2010-2011). The percentage of PSU new undergraduate admissions of African Americans and American Indian/Alaska Native students has remained relatively stable since 2007-2008 and exceeds (in the case of African Americans) or slightly below (in the case of American Indian/Alaska Natives) as compared to Oregon’s public high school graduates. PSU’s Hispanic student admissions (10.7%) are lower than the percentage of Hispanic Oregon high school graduates (16.2% in 2010-2011). However, the trend in Hispanic admission has been increasing since 2007-2008, and increasing at a constant rate since 2009-2010. We encourage PSU to continue its efforts to recruit all students of color.
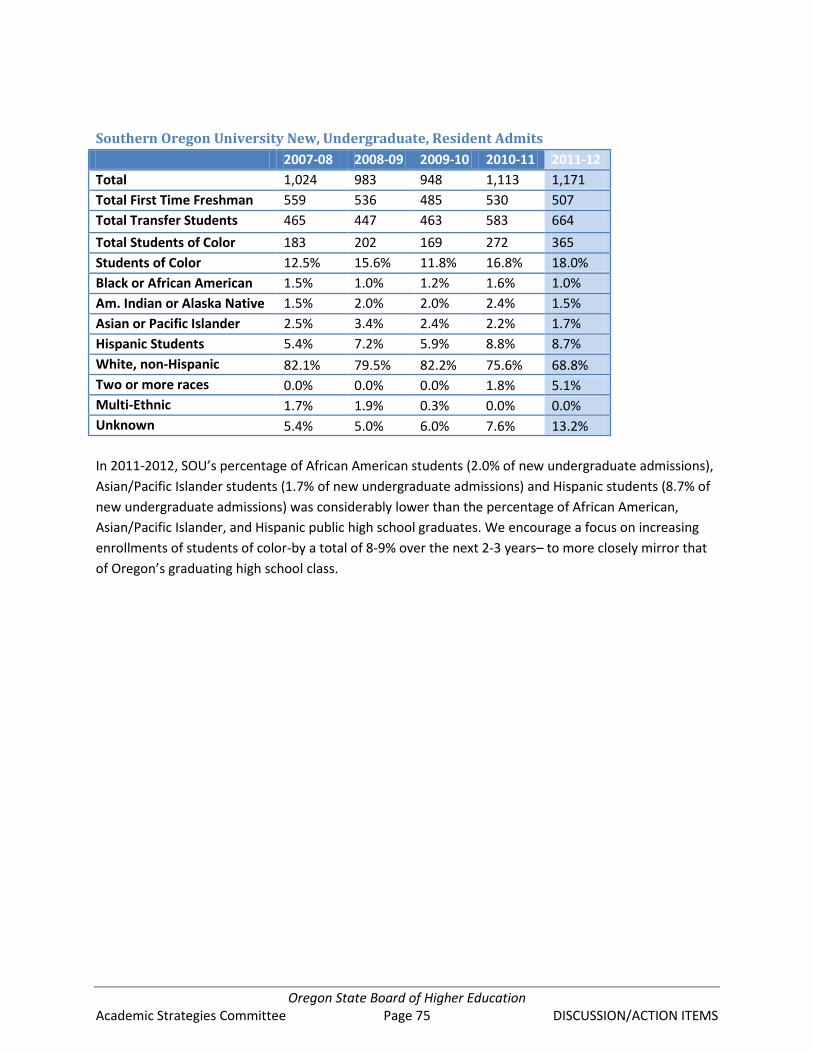
Oregon State Board of Higher Education Academic Strategies Committee Page 75 DISCUSSION/ACTION ITEMS
Southern Oregon University New, Undergraduate, Resident Admits 2007-08 2008-09 2009-10 2010-11 2011-12 Total 1,024 983 948 1,113 1,171 Total First Time Freshman 559 536 485 530 507 Total Transfer Students 465 447 463 583 664 Total Students of Color 183 202 169 272 365 Students of Color 12.5% 15.6% 11.8% 16.8% 18.0% Black or African American 1.5% 1.0% 1.2% 1.6% 1.0% Am. Indian or Alaska Native 1.5% 2.0% 2.0% 2.4% 1.5% Asian or Pacific Islander 2.5% 3.4% 2.4% 2.2% 1.7% Hispanic Students 5.4% 7.2% 5.9% 8.8% 8.7% White, non-Hispanic 82.1% 79.5% 82.2% 75.6% 68.8% Two or more races 0.0% 0.0% 0.0% 1.8% 5.1% Multi-Ethnic 1.7% 1.9% 0.3% 0.0% 0.0% Unknown 5.4% 5.0% 6.0% 7.6% 13.2% In 2011-2012, SOU’s percentage of African American students (2.0% of new undergraduate admissions), Asian/Pacific Islander students (1.7% of new undergraduate admissions) and Hispanic students (8.7% of new undergraduate admissions) was considerably lower than the percentage of African American, Asian/Pacific Islander, and Hispanic public high school graduates. We encourage a focus on increasing enrollments of students of color-by a total of 8-9% over the next 2-3 years– to more closely mirror that of Oregon’s graduating high school class.

Oregon State Board of Higher Education Academic Strategies Committee Page 76 DISCUSSION/ACTION ITEMS
University of Oregon New, Undergraduate, Resident Admits 2007-08 2008-09 2009-10 2010-11 2011-12 Total 3,488 3,551 3,523 3,376 3,506 Total First Time Freshman 2,355 2,445 2,258 2,063 2,220 Total Transfer Students 1,133 1,106 1,265 1,313 1,286 Total Students of Color 705 754 823 791 828 Students of Color 16.0% 18.1% 17.3% 21.4% 22.6% Black or African American 1.3% 1.8% 1.4% 1.7% 2.0% Am. Indian or Alaska Native 1.5% 1.4% 1.3% 0.9% 0.8% Asian or Pacific Islander 5.8% 7.1% 6.0% 6.3% 5.9% Hispanic Students 4.0% 4.1% 4.2% 6.8% 7.5% White, non-Hispanic 79.8% 78.8% 76.6% 76.6% 76.4% Two or more races 0.0% 0.0% 0.0% 5.7% 6.3% Multi-Ethnic 3.3% 3.7% 4.4% 0.0% 0.0% Unknown 4.2% 3.1% 6.1% 2.0% 1.1% In 2011-2012, UO’s percentage of admitted African American students (2.0%) was lower than the percentage of African American public high school graduates (2.6% in 2010-2011). We encourage a focus on increasing enrollments of African American students to more closely mirror that of Oregon’s graduating high school class. Similarly, UO’s percentage of admitted Hispanic students (7.5%) is considerably lower than the percentage of Hispanic Oregon high school graduates (16.2% in 2010-2011). However, the trend in Hispanic admission has been increasing since 2007-2008. As such, we recommend UO also focus on increasing the enrollment of Hispanic students by 8-9% over the next 2-3 years to achieve an entering student body demographic that more closely mirrors that of Oregon’s graduating high school class. UO is doing well recruiting Asian and Pacific Islander student, as the percentage of newly admitted Asian/Pacific Islander students (5.9% in 2011-2012) exceeds the percentage of Asian and Pacific Islander public high school graduates (5.0% in 2010-2011).

Oregon State Board of Higher Education Academic Strategies Committee Page 77 DISCUSSION/ACTION ITEMS
Western Oregon University New, Undergraduate, Resident Admits 2007-08 2008-09 2009-10 2010-11 2011-12 Total 1,315 1,373 1,419 1,602 1,603 Total First Time Freshman 811 799 854 972 925 Total Transfer Students 504 574 565 630 678 Total Students of Color 272 278 320 412 392 Students of Color 17.8% 17.1% 19.6% 24.7% 20.2% Black or African American 1.4% 2.5% 3.2% 3.6% 2.5% Am. Indian or Alaska Native 1.5% 2.0% 2.3% 1.7% 2.9% Asian or Pacific Islander 3.0% 3.0% 2.6% 2.6% 3.2% Hispanic Students 11.0% 8.8% 10.2% 14.2% 11.5% White, non-Hispanic 79.3% 79.8% 77.4% 74.3% 75.5% Two or more races 0.0% 0.0% 0.0% 2.6% 0.0% Multi-Ethnic 0.8% 0.7% 1.2% 0.0% 0.0% Unknown 2.9% 3.1% 3.0% 1.1% 4.2% WOU’s percent enrollment of newly admitted African American and American Indian/Alaska Native students matches or exceeds the percentage of African American and American Indian/Alaska Native graduates from Oregon public high schools. WOU enrolled a smaller percentage of newly admitted Asian or Pacific Islander students (3.2%) than graduates from Oregon’s public high schools (4.9%). In 2011-2012, WOU’s percent enrollment of newly admitted Hispanic students was 11.5%, lower than the percentage of Hispanic Oregon high school graduates (16.2% in 2010-2011), but a number that reflects WOU’s concentrated efforts on recruiting and retaining Hispanic students. We encourage WOU to continue its efforts to recruit all students of color.

Oregon State Board of Higher Education Academic Strategies Committee Page 78 DISCUSSION/ACTION ITEMS
II. Retention and Graduation System-wide, OUS institutions must continue to focus efforts on retaining and graduating students of color. Figure 3 shows the gaps in graduating American Indian/Alaska Native, African American, and Hispanic students as compared to their White and Asian/Pacific Islander peers. Most troubling, the graduation rates for African Americans has fallen since 2001, a trend that must be reversed. We also see declines, since 2006, in the graduation rates of Hispanic students; again, a trend that must be reversed. Campuses have outlined retention strategies, but a press on reversing the troubling trends in African American and Hispanic graduation rates must be sustained.
Figure 3: OUS 6-Year Graduation Rates for Students of Color
The charts below show 6-year graduation rates for each campus, disaggregated by race/ethnicity, and only including populations with 10 or more students. Trends to pay attention to:
• At four of seven campuses (EOU, OIT, PSU, and WOU), the graduation rates of Latino students are equal to or higher than the graduation rates of their white counterparts.
• There is an achievement gap between African-American and Native American students and their white counterparts. African-American and Native American students lag their white counterparts in graduation rates on every campus (where numbers were large enough to report).

Oregon State Board of Higher Education Academic Strategies Committee Page 79 DISCUSSION/ACTION ITEMS
• The graduation gap between African-American and white students is most pronounced at Oregon State University (10.6% gap); Southern Oregon University (17.6% gap), and the University of Oregon (12.4% gap).
All institutions must take steps to increase the graduation rates for all students and close achievement gaps. As the charts below indicate, each campus has a unique graduation profile and unique achievement gaps.
Graduation rates for all students at Eastern Oregon University are below the OUS average. Latino students are graduating at a higher rate than their White and Asian/Pacific Islander peers. EOU must take steps to improve the graduation rates of all of its students and close achievement gaps, where they exist.
0.0% 0.0% 4.0%
20.0%
27.3%
35.7% 32.0%
40.0%
72.7%
64.3% 64.0%
40.0%
0.0%
10.0%
20.0%
30.0%
40.0%
50.0%
60.0%
70.0%
80.0%
Asian/Pacific Islander Hispanic/Latino White, non-Hispanic Unknown
Eastern Oregon University
Continuing Graduated Stopped Out *Only included populations with n<10
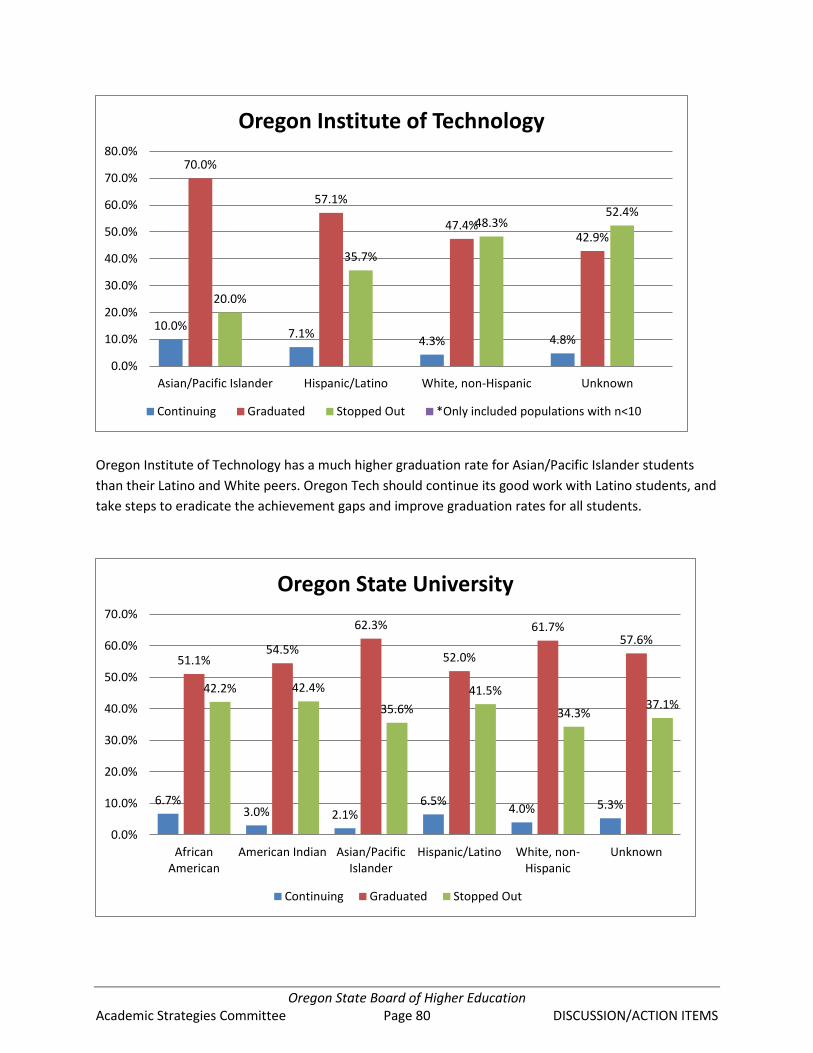
Oregon State Board of Higher Education Academic Strategies Committee Page 80 DISCUSSION/ACTION ITEMS
Oregon Institute of Technology has a much higher graduation rate for Asian/Pacific Islander students than their Latino and White peers. Oregon Tech should continue its good work with Latino students, and take steps to eradicate the achievement gaps and improve graduation rates for all students.
10.0% 7.1% 4.3% 4.8%
70.0%
57.1%
47.4% 42.9%
20.0%
35.7%
48.3% 52.4%
0.0%
10.0%
20.0%
30.0%
40.0%
50.0%
60.0%
70.0%
80.0%
Asian/Pacific Islander Hispanic/Latino White, non-Hispanic Unknown
Oregon Institute of Technology
Continuing Graduated Stopped Out *Only included populations with n<10
6.7% 3.0% 2.1%
6.5% 4.0% 5.3%
51.1% 54.5%
62.3%
52.0%
61.7% 57.6%
42.2% 42.4%
35.6% 41.5%
34.3% 37.1%
0.0%
10.0%
20.0%
30.0%
40.0%
50.0%
60.0%
70.0%
AfricanAmerican
American Indian Asian/PacificIslander
Hispanic/Latino White, non-Hispanic
Unknown
Oregon State University
Continuing Graduated Stopped Out

Oregon State Board of Higher Education Academic Strategies Committee Page 81 DISCUSSION/ACTION ITEMS
Oregon State University has higher graduation rates for Asian/Pacific Islander and White students than their African-American, Native American, and Latino counterparts. OSU must take steps to eradicate the achievement gaps between African-American, Native American, and Latino students and their White and Asian/Pacific Islander counterparts.
Portland State University has higher graduation rates for Asian/Pacific Islander, Latino and White students than their African-American, and Native American counterparts. PSU must take steps to eradicate the achievement gaps between African-American, and Native American student and their White and Asian/Pacific Islander, and Latino counterparts.
17.4%
7.7% 9.2% 7.9% 7.9% 3.9%
39.1%
23.1%
47.1% 44.4% 40.0% 40.2%
43.5%
69.2%
43.7% 47.6%
52.2% 55.9%
0.0%
10.0%
20.0%
30.0%
40.0%
50.0%
60.0%
70.0%
80.0%
AfricanAmerican
AmericanIndian
Asian/PacificIslander
Hispanic/Latino White, non-Hispanic
Unknown
Portland State University
Continuing Graduated Stopped Out
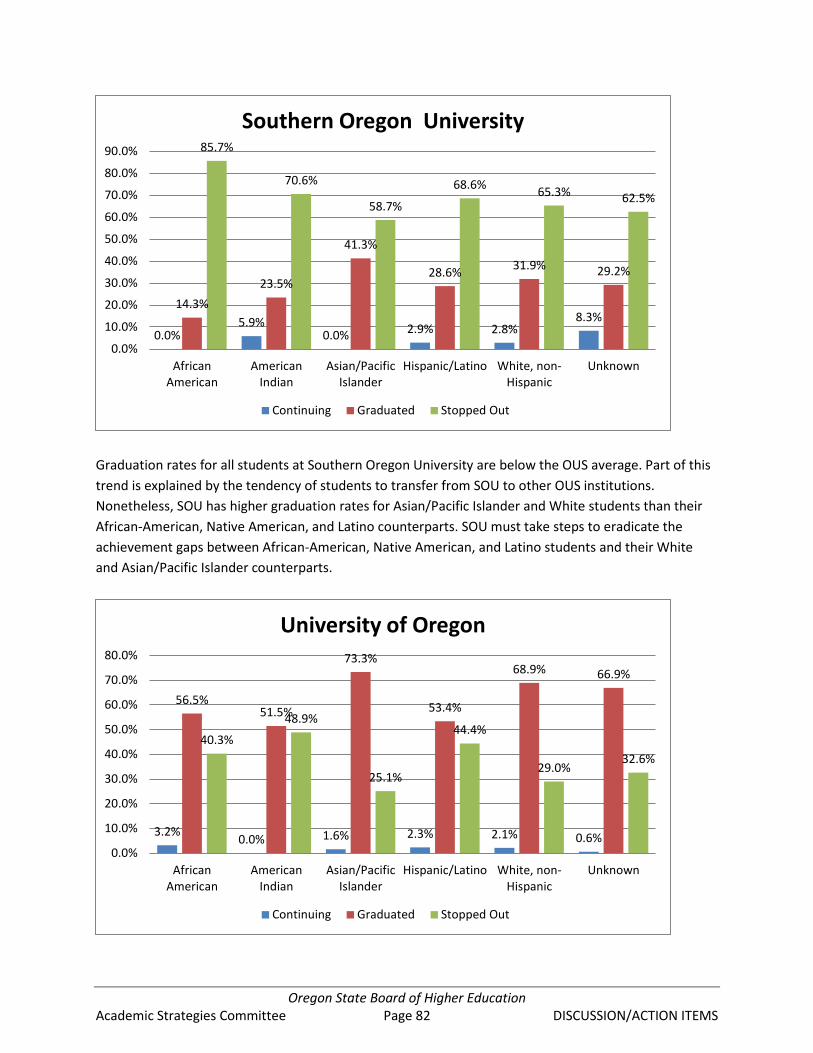
Oregon State Board of Higher Education Academic Strategies Committee Page 82 DISCUSSION/ACTION ITEMS
Graduation rates for all students at Southern Oregon University are below the OUS average. Part of this trend is explained by the tendency of students to transfer from SOU to other OUS institutions. Nonetheless, SOU has higher graduation rates for Asian/Pacific Islander and White students than their African-American, Native American, and Latino counterparts. SOU must take steps to eradicate the achievement gaps between African-American, Native American, and Latino students and their White and Asian/Pacific Islander counterparts.
0.0% 5.9%
0.0% 2.9% 2.8% 8.3%
14.3% 23.5%
41.3%
28.6% 31.9% 29.2%
85.7%
70.6%
58.7%
68.6% 65.3% 62.5%
0.0%
10.0%
20.0%
30.0%
40.0%
50.0%
60.0%
70.0%
80.0%
90.0%
AfricanAmerican
AmericanIndian
Asian/PacificIslander
Hispanic/Latino White, non-Hispanic
Unknown
Southern Oregon University
Continuing Graduated Stopped Out
3.2% 0.0% 1.6% 2.3% 2.1% 0.6%
56.5% 51.5%
73.3%
53.4%
68.9% 66.9%
40.3%
48.9%
25.1%
44.4%
29.0% 32.6%
0.0%
10.0%
20.0%
30.0%
40.0%
50.0%
60.0%
70.0%
80.0%
AfricanAmerican
AmericanIndian
Asian/PacificIslander
Hispanic/Latino White, non-Hispanic
Unknown
University of Oregon
Continuing Graduated Stopped Out

Oregon State Board of Higher Education Academic Strategies Committee Page 83 DISCUSSION/ACTION ITEMS
The University of Oregon has higher graduation rates for Asian/Pacific Islander and White students than their African-American, Native American, and Latino counterparts. UO must take steps to eradicate the achievement gaps between African-American, Native American, and Latino students and their White and Asian/Pacific Islander counterparts.
Western Oregon University has higher graduation rates for Hispanic/Latino and White, non-Hispanic students than their African American, Native American, and Asian/Pacific Islander counterparts. WOU must continue to take steps to close the achievement gaps between African American, Native American and Asian Pacific Islanders by addressing the stop out rate of students attending the university.
0.0% 7.1%
0.0% 1.5% 2.3% 3.8%
35.7% 35.7% 32.4%
52.9% 44.7% 47.2%
64.3% 57.1%
67.6%
45.6% 53.0%
49.1%
0.0%
10.0%
20.0%
30.0%
40.0%
50.0%
60.0%
70.0%
80.0%
AfricanAmerican
AmericanIndian
Asian/PacificIslander
Hispanic/Latino White, non-Hispanic
Unknown
Western Oregon University
Continuing Graduated Stopped Out
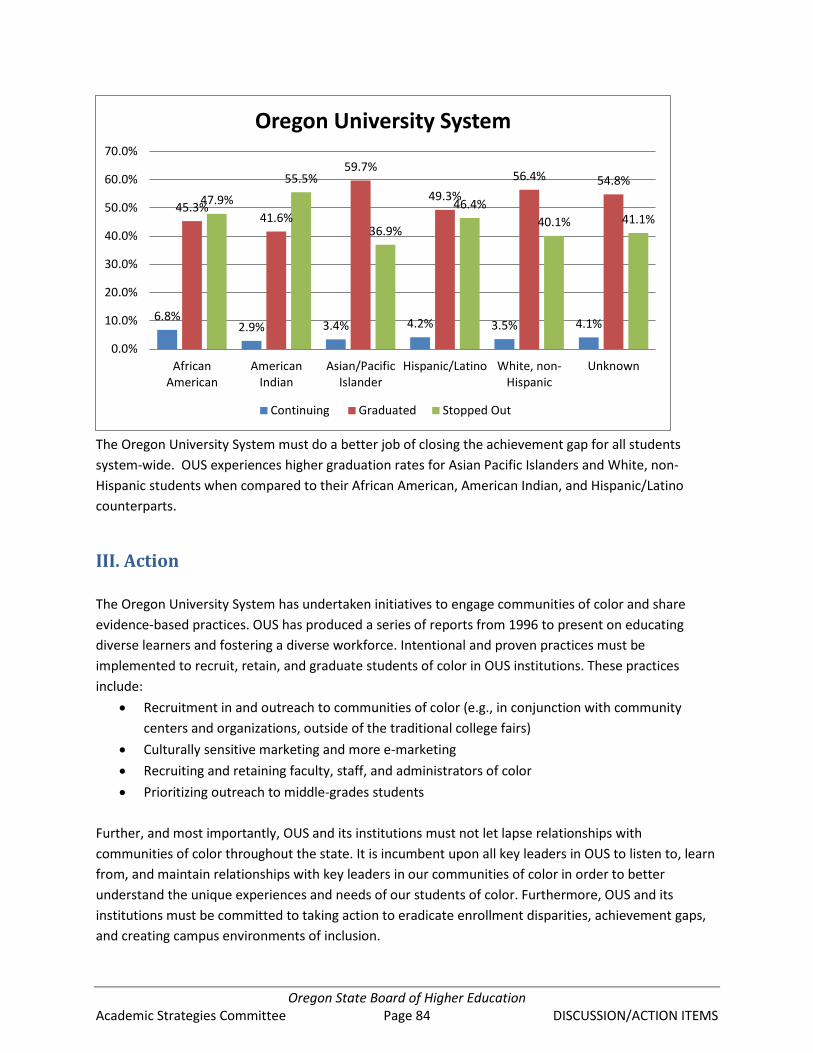
Oregon State Board of Higher Education Academic Strategies Committee Page 84 DISCUSSION/ACTION ITEMS
The Oregon University System must do a better job of closing the achievement gap for all students system-wide. OUS experiences higher graduation rates for Asian Pacific Islanders and White, non-Hispanic students when compared to their African American, American Indian, and Hispanic/Latino counterparts.
III. Action The Oregon University System has undertaken initiatives to engage communities of color and share evidence-based practices. OUS has produced a series of reports from 1996 to present on educating diverse learners and fostering a diverse workforce. Intentional and proven practices must be implemented to recruit, retain, and graduate students of color in OUS institutions. These practices include:
• Recruitment in and outreach to communities of color (e.g., in conjunction with community centers and organizations, outside of the traditional college fairs)
• Culturally sensitive marketing and more e-marketing • Recruiting and retaining faculty, staff, and administrators of color • Prioritizing outreach to middle-grades students
Further, and most importantly, OUS and its institutions must not let lapse relationships with communities of color throughout the state. It is incumbent upon all key leaders in OUS to listen to, learn from, and maintain relationships with key leaders in our communities of color in order to better understand the unique experiences and needs of our students of color. Furthermore, OUS and its institutions must be committed to taking action to eradicate enrollment disparities, achievement gaps, and creating campus environments of inclusion.
6.8% 2.9% 3.4% 4.2% 3.5% 4.1%
45.3% 41.6%
59.7%
49.3% 56.4% 54.8%
47.9%
55.5%
36.9%
46.4% 40.1% 41.1%
0.0%
10.0%
20.0%
30.0%
40.0%
50.0%
60.0%
70.0%
AfricanAmerican
AmericanIndian
Asian/PacificIslander
Hispanic/Latino White, non-Hispanic
Unknown
Oregon University System
Continuing Graduated Stopped Out
Oregon State Board of Higher Education Academic Strategies Committee Page 85 DISCUSSION/ACTION ITEMS
References Prescott, B. T. and Bransberger, P. Knocking at the College Door: Projections of High School
Graduates (eighth edition). Boulder, CO: Western Interstate Commission for Higher Education, 2012.

Oregon State Board of Higher Education Academic Strategies Committee Page 86 DISCUSSION/ACTION ITEMS
(This page intentionally left blank.)
1
Oregon Education Investment Board:
Equity Lens
OEIB Vision Statement
To advise and support the building, implementation and investment in a unified public education system in Oregon that meets the diverse learning needs of every pre-K through postsecondary student and provides boundless opportunities that support success; ensuring a 100 percent high school graduation rate by 2025 and reaching the 40-40-20 goal. OEIB Equity Lens: Preamble The Oregon Educational Investment Board has a vision of educational equity and excellence for
each and every child and learner in Oregon. We must ensure that sufficient resource is available
to guarantee their success and we understand that the success of every child and learner in
Oregon is directly tied to the prosperity of all Oregonians. The attainment of a quality education
strengthens all Oregon communities and promotes prosperity, to the benefit of us all. It is
through educational equity that Oregon will continue to be a wonderful place to live, and make
progress towards becoming a place of economic, technologic and cultural innovation.
Oregon faces two growing opportunity gaps that threaten our economic competitiveness and
our capacity to innovate. The first is the persistent achievement gap between our growing
populations of communities of color, immigrants, migrants, and low income rural students with
our more affluent white students. While students of color make up over 30% of our state- and
are growing at an inspiriting rate- our achievement gap has continued to persist. As our
diversity grows and our ability to meet the needs of these students remains stagnant or
declines- we limit the opportunity of everyone in Oregon. The persistent educational disparities
have cost Oregon billions of dollars in lost economic output1 and these losses are compounded
every year we choose not to properly address these inequalities.
1 Alliance for Excellent Education. (November 2011). The high cost of high school dropouts: What the nation pays for
inadequate high schools. www.all4ed.org
2
The second achievement gap is one of growing disparity between Oregon and the rest of the
United States. Our achievement in state benchmarks has remained stagnant and in some
communities of color has declined while other states have begun to, or have already
significantly surpassed our statewide rankings. If this trend continues, it will translate into
economic decline and a loss of competitive and creative capacity for our state. We believe that
one of our most critical responsibilities going forward is to implement a set of concrete criteria
and policies in order to reverse this trend and deliver the best educational continuum and
educational outcomes to Oregon's Children.
The primary focus of the equity lens is on race and ethnicity. While there continues to be a deep
commitment to many other areas of the opportunity gap, we know that a focus on race by
everyone connected to the educational milieu allows direct improvements in the other areas.
We also know that race and ethnicity continue to compound disparity. We are committed to
explicitly identifying disparities in education outcomes for the purpose of targeting areas for
action, intervention and investment.
Beliefs:
We believe that everyone has the ability to learn and that we have an ethical responsibility and
a moral responsibility to ensure an education system that provides optimal learning
environments that lead students to be prepared for their individual futures.
We believe that speaking a language other than English is an asset and that our education
system must celebrate and enhance this ability alongside appropriate and culturally responsive
support for English as a second language.
We believe students receiving special education services are an integral part of our educational
responsibility and we must welcome the opportunity to be inclusive, make appropriate
accommodations, and celebrate their assets. We must directly address the over-representation
of children of color in special education and the under-representation in “talented and gifted.”
We believe that the students who have previously been described as “at risk,”
“underperforming,” “under-represented,” or minority actually represent Oregon’s best
opportunity to improve overall educational outcomes. We have many counties in rural and
urban communities that already have populations of color that make up the majority. Our
ability to meet the needs of this increasingly diverse population is a critical strategy for us to
successfully reach our 40/40/20 goals.

3
We believe that intentional and proven practices must be implemented to return out of school
youth to the appropriate educational setting. We recognize that this will require us to
challenge and change our current educational setting to be more culturally responsive, safe,
and responsive to the significant number of elementary, middle, and high school students who
are currently out of school. We must make our schools safe for every learner.
We believe that ending disparities and gaps in achievement begin in the delivery of quality
Early Learner programs and appropriate parent engagement and support. This is not simply an
expansion of services -- it is a recognition that we need to provide services in a way that best
meets the needs of our most diverse segment of the population, 0-5 year olds and their
families.
We believe that resource allocation demonstrates our priorities and our values and that we
demonstrate our priorities and our commitment to rural communities, communities of color,
English language learners, and out of school youth in the ways we allocate resources and make
educational investments.
We believe that communities, parents, teachers, and community-based organizations have
unique and important solutions to improving outcomes for our students and educational
systems. Our work will only be successful if we are able to truly partner with the community,
engage with respect, authentically listen -- and have the courage to share decision making,
control, and resources.
We believe every learner should have access to information about a broad array of career/job
opportunities and apprenticeships that will show them multiple paths to employment yielding
family-wage incomes, without diminishing the responsibility to ensure that each learner is
prepared with the requisite skills to make choices for their future.
We believe that our community colleges and university systems have a critical role in serving
our diverse populations, rural communities, English language learners and students with
disabilities. Our institutions of higher education, and the P-20 system, will truly offer the best
educational experience when their campus faculty, staff and students reflect this state, its
growing diversity and the ability for all of these populations to be educationally successful and
ultimately employed.
We believe the rich history and culture of learners is a source of pride and an asset to embrace
and celebrate.

4
And, we believe in the importance of supporting great teaching. Research is clear that
“teachers are among the most powerful influences in (student) learning.”2 An equitable
education system requires providing teachers with the tools and support to meet the needs of
each student.
Purpose of the OEIB Equity Lens: The purpose of the equity lens is to clearly articulate the
shared goals we have for our state, the intentional investments we will make to reach our goals
of an equitable educational system, and to create clear accountability structures to ensure that
we are actively making progress and correcting where there is not progress. As the OEIB
executes its charge to align and build a P-20 education system, an equity lens will prove useful
to ensure every learner is adequately prepared by educators focused on equity for meaningful
contributions to society. The equity lens will confirm the importance of recognizing institutional
and systemic barriers and discriminatory practices that have limited access for many students in
the Oregon education system. The equity lens emphasizes underserved students, such as out of
school youth, English Language Learners, and students in some communities of color and some
rural geographical locations, with a particular focus on racial equity. The result of creating a
culture of equity will focus on the outcomes of academic proficiency, civic awareness,
workplace literacy, and personal integrity. The system outcomes will focus on resource
allocation, overall investments, hiring and professional learning.
Oregon Educational Investment Board Case for Equity:
Oregonians have a shared destiny. Individuals within a community and communities within a
larger society need the ability to shape their own present and future and we believe that
education is a fundamental aspect of Oregon’s ability to thrive. Equity is both the means to
educational success and an end that benefits us all. Equity requires the intentional examination
of systemic policies and practices that, even if they have the appearance of fairness, may in
effect serve to marginalize some and perpetuate disparities. Data are clear that Oregon
demographics are changing to provide rich diversity in race, ethnicity, and language.3 Working
toward equity requires an understanding of historical contexts and the active investment in
changing social structures and changing practice over time to ensure that all communities can
reach the goal and the vision of 40/40/20.
2 Hattie, J. (2009), Visible learning: A synthesis of over 800 meta-analyses relating to student achievement. P. 238.
3 Oregon Statewide Report Card 2011-2012. www.ode.state.or.us
5
ADDENDUMS
Basic Features of the Equity Lens:
Objective: By utilizing an equity lens, the OEIB aims to provide a common vocabulary and
protocol for resource allocation and evaluating strategic investments.
The following questions will be considered for resource allocation and evaluating strategic
investments:
1. Who are the racial/ethnic and underserved groups affected? What is the potential
impact of the resource allocation and strategic investment to these groups?
2. Does the decision being made ignore or worsen existing disparities or produce other
unintended consequences? What is the impact on eliminating the opportunity gap?
3. How does the investment or resource allocation advance the 40/40/20 goal?
4. What are the barriers to more equitable outcomes? (e.g. mandated, political,
emotional, financial, programmatic or managerial)
5. How have you intentionally involved stakeholders who are also members of the
communities affected by the strategic investment or resource allocation? How do you
validate your assessment in (1), (2) and (3)?
6. How will you modify or enhance your strategies to ensure each learner and
communities’ individual and cultural needs are met?
7. How are you collecting data on race, ethnicity, and native language?
8. What is your commitment to P-20 professional learning for equity? What resources
are you allocating for training in cultural responsive instruction?
Creating a culture of equity requires monitoring, encouragement, resources, data, and
opportunity. OEIB will apply the equity lens to strategic investment proposals reviews, as well
as its practices as a board.

6
Definitions:
Equity: in education is the notion that EACH and EVERY learner will receive the
necessary resources they need individually to thrive in Oregon’s schools no matter what
their national origin, race, gender, sexual orientation, differently abled, first language, or
other distinguishing characteristic.
Underserved students: Students whom systems have placed at risk because of their
race, ethnicity, English language proficiency, socioeconomic status, gender, sexual
orientation, differently abled, and geographic location. Many students are not served
well in our education system because of the conscious and unconscious bias,
stereotyping, and racism that is embedded within our current inequitable education
system.
Achievement gap: Achievement gap refers to the observed and persistent disparity on
a number of educational measures between the performance of groups of students,
especially groups defined by gender, race/ethnicity, and socioeconomic status.
Race: Race is a social – not biological – construct. We understand the term “race” to
mean a racial or ethnic group that is generally recognized in society and often, by
government. When referring to those groups, we often use the terminology “people of
color” or “communities of color” (or a name of the specific racial and/or ethnic group)
and “white.”
We also understand that racial and ethnic categories differ internationally, and that
many of local communities are international communities. In some societies, ethnic,
religious and caste groups are oppressed and racialized. These dynamics can occur even
when the oppressed group is numerically in the majority.
White privilege: A term used to identify the privileges, opportunities, and gratuities
offered by society to those who are white.
Embedded racial inequality: Embedded racial inequalities are also easily produced and
reproduced – usually without the intention of doing so and without even a reference to
race. These can be policies and practices that intentionally and unintentionally enable
white privilege to be reinforced.
40-40-20: Senate Bill 253 - states that by 2025 all adult Oregonians will hold a high school diploma or equivalent, 40% of them will have an associate’s degree or a meaningful postsecondary certificate, and 40% will hold a bachelor’s degree or
7
advanced degree. 40-40-20 means representation of every student in Oregon, including students of color.
Disproportionality: Over-representation of students of color in areas that impact their
access to educational attainment. This term is a statistical concept that actualizes the
disparities across student groups.
Opportunity Gap: the lack of opportunity that many social groups face in our common quest
for educational attainment and the shift of attention from the current overwhelming emphasis
on schools in discussions of the achievement gap to more fundamental questions about social
and educational opportunity.4
Culturally Responsive: Recognize the diverse cultural characteristics of learners as
assets. Culturally responsive teaching empowers students intellectually, socially,
emotionally and politically by using cultural referents to impart knowledge, skills and
attitudes.5
4 (The Opportunity Gap (2007). Edited by Carol DeShano da Silva, James Philip Huguley, Zenub Kakli, and Radhika
Rao.
5 Ladson-Billings, Gloria (1994). The Dreamkeepers: Successful Teachers of African American Children.

June
201
3
DISCUSSION: OUS 40-40-20 STRATEGY

Oregon State Board of Higher Education Page ii
OUS 40-40-20 Strategy Discussion Paper
Dated December 2012
Page
Table of Contents PURPOSE OF PAPER ........................................................................................................................ 1
PURPOSE OF THE 40-40-20 STRATEGY........................................................................................... 1
UNDERSTANDING THE GOAL ......................................................................................................... 3
Defining the goal ......................................................................................................................... 3
All adults, working-age adults, students now in school…? ......................................................... 3
Resident and non-resident degrees ............................................................................................ 4
So the goal is… ............................................................................................................................ 4
The gap to reaching the goal ...................................................................................................... 5
Role of private universities ......................................................................................................... 6
DEFINITIONS AND ASSUMPTIONS ................................................................................................. 6
Graduate degrees ....................................................................................................................... 7
Geographic and regional equity .................................................................................................. 7
Demographic diversity and underserved populations ............................................................... 7
Targeted degrees ........................................................................................................................ 7
Affordability ................................................................................................................................ 7
Quality of degree ........................................................................................................................ 8
Allocating targets and improving performance .......................................................................... 8
MODELING FOR 40-40-20: WHAT MORE DO WE NEED TO KNOW? ............................................. 9
MAJOR AVENUES FOR IMPROVING PERFORMANCE .................................................................. 10
One possibility ........................................................................................................................... 16

Oregon State Board of Higher Education Page 1
Academic Strategies Committee OUS 40-40-20 Strategy
Discussion Paper
PURPOSE OF PAPER Oregon has set a high goal for educational attainment. That goal is widely cited but little understood. Nor has there been any significant consideration in any forum about intent, meaning, or consequence of the goal. There is no consensus on what the goal means. Taken literally, the goal masks important questions about:
• The exact target to be achieved, especially who and by when.
• The trade-offs between quantitative achievement of the goal and other important public policy goals, including equity, regional and demographic diversity, research and public service, and quality of education.
The purpose of this paper is to present these issues for discussion. Setting targets and strategies is a matter for policy decision makers. Since the Board retreat in September 2012, several events have caused a refocus of the project to simplify it, to recognize the uncertainty from pending organizational changes, and to take into account limitations of the financial and forecasting models available. A 40-40-20 strategy by itself is not a mission statement for higher education and any successful strategy must recognize the distinct research and public service missions of university education. Nor is 40-40-20 a plan for financial stability and sustainability—it is an essential part of such a plan, but only a part. The strategy development process should be iterative and collaborative between the Oregon University System (OUS) and the campuses, particularly when it comes to evaluating alternative means of improving performance and allocating specific targets, presumably through achievement compacts. Proposals for organizational change pending before the OEIB (Oregon Education Investment Board) may change how 40-40-20 is implemented. In view of this, one potential strategy (outlined below) is for the state or System to set an amount it will pay for each degree and leave it to the campuses to manage how they will meet the targets.
PURPOSE OF THE 40-40-20 STRATEGY The purpose of the OUS 40-40-20 strategy project is to provide an analytical framework and tools for policy-makers to make academic and financial decisions in pursuit of the goal of 40 percent of adult Oregonians holding a bachelor’s degree. At a policy level, a 40-40-20 strategy needs to answer these questions:

Oregon State Board of Higher Education Page 2
• What trajectory are we on for level of educational achievement by adult Oregonians in 2025 and what is the gap to achieving the 40 percent goal, given demographic forecasts and trends for policy and investment?
• What is the policy and value context, and how do we incorporate important values (e.g., geographic and demographic diversity and equity, graduate education, affordability, etc.)?
• How might targets and investments be allocated among institutions?
Depending on how the last question is answered, either the campuses or the System will have relatively more responsibility for answering:
• What are the key points of leverage for affecting level of achievement (attainment of 40 percent…)?
• What effects, over what time frame, and at what costs might we expect from a variety of policy and investment alternatives?
• Given reasonable prospects for improvements in performance, what additional capacity is required?
The strategy by itself will not dictate OUS or campus decisions but should serve as backdrop and overall framework, namely:
• Allocation of resources including, operating, capital, and strategically targeted appropriations.
• Allocation of degree targets among campuses (achievement compact targets).
• Approval of missions and programs.
• Priorities for pedagogical reform and pipeline initiatives.
• Governance policies and choices that affect degree attainment.
The strategy also should inform the overall state program for education by:
• Making the case for public funding, including affordability.
• Informing the work of the OEIB budget process and legislature in developing their 40-40-20 strategies.
• Making clear that the use of a singular strategy does not incorporate other essential roles of higher education, namely research and public service.

Oregon State Board of Higher Education Page 3
UNDERSTANDING THE GOAL Defining the goal
Senate Bill 253, adopted in 2011, is explicit in setting a target for 40 percent of adult Oregonians to hold a bachelor’s degree or higher by 2025. This sparse specification begs a number of questions about what the target means and how it relates to other state and OUS policies. Taken as an aspirational goal (the Governor has referred to it as a “North Star” – a direction rather than a destination), it requires some fundamental policy decisions. This is important guidance.
All adults, working-age adults, students now in school…?
Whether the goal is taken to be 40 percent of all adults, all working age adults, or some other age cohort makes a difference in, not only in the number of degrees to be held by Oregonians by 2025, but also in the focus of policy and investment toward the goal. It is important to realize that over time any definition will result in “all adults” achieving the desired result, with timing being the primary, yet significant difference. Nonetheless, there is reason to believe that the intent behind the goal is to improve Oregon’s economic competitiveness and the economic and civic capabilities of its citizens. Thus, it is reasonable to take the goal to mean all working age Oregonians. There seems to be little question about this. This still leaves a question about timing and focus of strategies. If the goal is taken literally to mean “all working age adults” by the year 2025, it will require a massive investment in adult education for the simple reason that so many individuals who will be in the workforce in 13 years are already in the workforce. As a consequence, many believe the focus of 40-40-20 should be on the cohort of those presently in school who will be entering the workforce by 2025. Beyond the ease of achieving the goal lays a fundamental policy decision. A focus on adult education might be extremely productive from the standpoint of rapidly improving the economic performance of Oregon and Oregonians. In contrast, a “cohort” focus will orient us toward making permanent improvements in educational performance, with deeper and longer-lasting benefits. For the purposes of this initial framework, we define the age group to be 22-35 year olds. The rationale is that, as stated above, over time any definition will result in 40% of the adult population (however defined) as holding at least a Bachelor’s degree. Further, adult returning students are more likely to start at community colleges than at universities when returning to school to earn a degree. For these reasons, we recommend limiting our age group to 22-35 year olds, with the understanding that as we continue to monitor trends, we may modify this age group in the future.

Oregon State Board of Higher Education Page 4
Resident and non-resident degrees
The 40-40-20 goal is silent about whether it is to be met by degrees granted to Oregonians or in part by degree-holders that migrate to Oregon. Looking at the balance of in-migrants and out-migrants, Oregon currently gains about 14,800 bachelor’s degree-holders each year. However, if the goal of 40-40-20 is developing a high-performing educational system offering access, affordability, and success to Oregon students, there is an argument for ignoring the net gains and losses from migration. Among the reasons, there is little public policy available to shape migration patterns, which varies with economic circumstance.
The issue of enrollment of non-resident students is more hotly contested. For purposes of 40-40-20, one could adopt the view that the state policy is silent about non-resident enrollment as long as all qualified Oregon students have access at affordable prices, including capital for capacity. In other words, once enrollment and degree targets are agreed and met and an affordability standard is in place, there is freedom on campuses to manage enrollment. Indeed, some will argue that without this flexibility there is no way to arrive at a reasonable affordability standard for Oregonians nor to allow universities to pursue excellence. On the other hand, the point at which non-resident enrollment begins to crowd out resident enrollment will no doubt be controversial. In the end, it seems difficult, more likely fruitless, to debate the value of an Oregon resident who leaves the state after graduation versus someone who pays non-resident tuition and remains in Oregon after graduation. For these reasons, we do not recommend differentiating between resident and non-resident degrees. So the goal is…
For purposes of this project, the goal is to have 40 percent of 22-35 year-old Oregonians achieve at least a Bachelor’s degree by 2025.

Oregon State Board of Higher Education Page 5
The gap to reaching the goal
The table below shows the increase, each year, in the number of degrees that need to be awarded to achieve the goal. In order to reach this goal, OUS institutions needs to collectively produce about 500 more degrees per year, compounding annually.
To produce the additional 500 degrees per year, OUS must enroll about 700 more students, system-wide, each year, compounding annually. There are some gaps associated with this projected increase in enrollment and degree completion:
1. Financial Resources Currently the state underfunds resident students by approximately $3,000 per year. OUS institutions need to collectively produce about 500 more degrees per year compounding annually to reach the 40-40-20 goal by 2025. To produce 500 degrees OUS must enroll roughly 700 students system-wide. To fund the additional students for the next biennium, OUS would require ($3,000 × 700 in the first year) + ($3,000 × 1,400 in the second year) = $6.3 million over just the next two years. Going out to 2025, this totals about $163.8 million additional. Without these critical funds, OUS campuses will fall short of reaching the 40-40-20 goal.
2. Space Campus capacity must be further studied to determine which campuses can accommodate more students, how many more students, and where recourses should be allocated to increase space on campuses to accommodate more students once capacity is reached on all campuses.
3. Disparities Educating Students of Color Oregon and national data continues to paint a picture of marked disparities in educational attainment according to ethnicity, rural/urban divides, and economic divides. While Oregon’s public universities have enrolled more students of color than ever before, educational attainment rates continue to show major differentiation by ethnicity and age. Oregon has far to go to improve attainment rates for American Indian/Alaska Native students and Hispanics,
2010 Bachelor's Degrees by InstitutionEOU OIT OSU PSU SOU UO WOU Total
2010 4.30% 3.72% 25.93% 26.53% 5.41% 28.05% 6.07% 100.00%
Bachelor's Degrees Needed fo 40-40-20 (Based on Historical Proportions)2013 633 548 3,823 3,911 797 4,135 895 14,742 2014 652 564 3,936 4,026 821 4,257 921 15,176 2.94%2015 671 580 4,048 4,141 844 4,379 947 15,610 2.86%2016 689 596 4,161 4,256 868 4,501 974 16,044 2.78%2017 708 613 4,273 4,371 891 4,622 1,000 16,478 2.71%2018 727 629 4,386 4,486 915 4,744 1,026 16,912 2.63%2019 745 645 4,498 4,601 938 4,866 1,053 17,346 2.57%2020 764 661 4,611 4,716 961 4,987 1,079 17,780 2.50%2021 782 677 4,723 4,832 985 5,109 1,105 18,214 2.44%2022 801 693 4,836 4,947 1,008 5,231 1,132 18,648 2.38%2023 820 709 4,949 5,062 1,032 5,353 1,158 19,082 2.33%2024 838 726 5,061 5,177 1,055 5,474 1,184 19,516 2.27%2025 857 742 5,174 5,292 1,079 5,596 1,211 19,950 2.22%2026 876 758 5,286 5,407 1,102 5,718 1,237 20,384 2.18%

Oregon State Board of Higher Education Page 6
which are below both the regional and national averages for both younger and older age groups. In addition, the bachelor’s level attainment rate in urban/metropolitan areas continues to be significantly greater than that of the more rural regions, begging the question of how to create a college going culture in communities that have not traditionally placed emphasis on post-secondary education.
4. Educating Low-Income and First-Generation Students Another obstacle to 40-40-20 is the proliferation of low-income populations throughout the state. According to Children First for Oregon, roughly 44% of children in Oregon were poor or low-income, with roughly 23.4% of children living below the poverty line in 2011.1 Given this reality, campus and system finance strategies aim to improve and protect the affordability of public higher education by balancing cost-savings measures with tuition levels and financial aid so that students are not priced out of a quality college education. Role of private universities
What role should an OUS strategy envision for private colleges and universities? By way of background, there are 24 private non-profit colleges and universities in Oregon. Currently they enroll about 10,000 Oregonians and graduate about 2,400 resident students each year. According to the Oregon Alliance of Independent Colleges and Universities, its post-secondary institutions plan on expanding degree production by adding as many as 1,000 degrees to help contribute to the 40-40-20 goal by 2025. Beyond factoring in the likely degree production of the privates, there are two questions to resolve:
1. If privates should be engaged directly in the strategy, who engages them and how?
2. Are there particular aspects of an overall strategy that the privates may be particularly well-suited to address? For example, some have suggested that some of the privates might play a strong role in adult education.
DEFINITIONS AND ASSUMPTIONS The straight-forward 40-40-20 goal leaves open questions about who gets degrees, where they live, and the quality and nature of those degrees. These questions provide the policy context within which 40-40-20 must operate. Some were introduced in the section on “defining the goal” (age cohort, residency, role of private universities). Others reflect important OUS policies and values, and require some specification 1 Insert citation (Oregonian Tuesday, April 24)
Oregon State Board of Higher Education Page 7
for how they should be incorporated into a 40-40-20 strategy. Below we articulate key definitions, assumptions, and questions. Graduate degrees
Graduate degrees should have some special consideration. Questions that will need to be answered in the future are:
• How should a 40-40-20 strategy include consideration of graduate degrees? • Should an overall target be set? How? • Should institutional missions be more precise on this score?
Geographic and regional equity
The 40-40-20 goal for OUS assumes that the goal will be met through statewide engagement. The State Board of Higher Education is committed to a set of goals for statewide public higher-education that includes positive contributions to the economy, civic and cultural life of communities across the state. By providing access to higher education throughout the state, investments are being made in local economies, workforce development and civic engagement. Demographic diversity and underserved populations
In order to reach the 40-40-20 goal, OUS institutions must (1) reduce their achievement gaps; (2) increase retention and graduate rates for all students and (3) increase enrollment of more
• Students from rural parts of Oregon
• Students of color
• Students from lower socio-economic backgrounds than current students
• Students who require more financial aid to realize their college aspirations
• Adult learners Targeted degrees
Funding for targeted degrees is now provided directly, making it easier to incorporate these directly into a 40-40-20 strategy. Affordability
For the state’s overall 40-40-20 goal, access and affordability are key. They link directly back to the importance of students in middle and high school having the motivation and belief that college is and should be in their future. The Shared Responsibility Model, control of tuition, and the set-aside of part of tuition increases for financial aid are the basis of the existing affordability policy for students.

Oregon State Board of Higher Education Page 8
However, the missing piece is that a mechanism does not exist to link state enrollment funding, tuition, and shared responsibility together in a way that effectively puts the burden on the legislature to be transparent about the number of degrees it is actually willing to fund. Nor is there any direct link to the actual costs of degrees. Without such a link, costs can continue to rise, with tuition and aid both chasing, and access becomes a variable rather than a guarantee or real target. It is possible to address this in 40-40-20 by way of the weight given to students for whom price and cost are barriers. It is also possible to address, perhaps, through a strategy of paying for degrees (outlined below). Quality of degree
The quality of OUS degrees cannot suffer as a result of meeting the 40-40-20 goal. Questions that will need to be addressed in the future include:
• What consideration should be given to quality of degree, however measured? What is the future for moving more toward proficiency assessment for degrees?
• Should the idea of “value” of different types of degrees (majors, employability, etc.) be
given more consideration?
• Should there be some weight for degrees with public service and/or research components in them?
Allocating targets and improving performance
Once a target for degrees is set or assumed for the state, how should responsibility be divided among OUS institutions? There is simplicity but no strategic reason for simply scaling up each institution’s existing share of degree production; there are strong reasons for not doing so, primarily that it may be neither the most efficient nor the most equitable. Potential factors to be weighed might include:
• Fit with mission.2 Should missions be more specific about expectations for 40-40-20? Should there be greater differentiation about roles in achieving regional and demographic equity, or carrying responsibility for access and affordability?
• Efficiency. Which institutions can provide additional degrees at least cost, including capital investment? Which institutions can contribute effectively and efficiently to the qualitative aspects of 40-40-20 (equity, diversity, high-value degrees, etc.)?
2 By “mission” I here mean the role and identify of the institution within OUS, not just the formal mission statement. This requires, for example, a deeper understanding of what SOU’s role as a regional institution means and what it means for UO to be a “flagship.” It requires good understanding of student and faculty “markets” and competitive situation.

Oregon State Board of Higher Education Page 9
• Institutional considerations. If targets for 40-40-20 will affect competitive and financial
position of institutions, how should this be factored? Related to this is where leadership for improving institutional performance resides. That is playing out in large measure through discussions around “shared services” and collaboration. At what level do we understand and act on how much and at what cost might enrollment rates, graduation rates, time-to-degree, etc., improve from:
• Changed pedagogy at universities, including course redesign, use of technology?
• Distance learning and on-line learning?
• Improved performance of “pipeline”?
• Readiness of high school graduates?
• Transfer from community colleges and among universities, and reverse transfer?
• Completion for adults with some progress?
MODELING FOR 40-40-20: WHAT MORE DO WE NEED TO KNOW? A fully-developed and mature 40-40-20 strategy would make use of a model that, ideally, would help with a number of tasks:
• Estimating a “base case” (no change in policy, investment, or performance trends but with expected demographic changes) for level of educational achievement of Oregonians by 2025 (and perhaps beyond). This would provide the necessary comparison with the simple flow model proposed above.
• Scenario analysis for performance indicators (“If 6-year graduation rates improve by X-percent, then degrees increase by Y-percent at $Z cost…”).
• Analysis of policy and investment alternatives (“If best practice-Y is adopted at all schools, then…”).
• Estimating costs of inputs and outputs (Marginal cost of adding one more student has what effect on marginal and average cost-per-degree? Marginal cost of expanding program y to x students has what effect on marginal and average cost-per-degree?). Costs include operating and capital costs.
• Estimating levels of achievement within scenarios for key demographic and geographic groupings.
• Showing effects and costs for alternatives for allocation of targets and investments among institutions.

Oregon State Board of Higher Education Page 10
Existing models fall short of this outcome. They are useful for pointing to the big points of leverage (retention, etc.) but are inadequate for comparing costs and timing of alternative programs and strategies. Existing models also do not include campus-level data. The limitations of good cost data at the campus level makes it particularly difficult for the System to develop finely-tuned strategies. The cost and effort to build out the models to achieve what is needed to answer the questions posed above are beyond this project. Nor does it make sense from the state perspective to build an “OUS” model. This is something that should be done by OEIB, and built upon the work so far done by consultants. The simplified framework outline in this paper, in part, reflects the limitations of models in the present state but also—more importantly—the emerging organizational and budgeting structure of higher education. We point out that the framework cannot and likely will not do the following:
• Develop a robust model capable of comparing marginal cost of producing degrees at different institutions or from various programs and initiatives.
• Develop scenarios of the most cost-effective initiatives or programs.
MAJOR AVENUES FOR IMPROVING PERFORMANCE Eastern Oregon University
Constraints & Obstacles
Current Practices & Strategies
• Eastern Promise focuses on Multi-Sector Collaboration: Eastern Oregon University offers co-enrollment, bridge, dual credit, and completion program opportunities to Oregon students with neighboring community colleges and school districts. EOU also offers an array of distance education programs across the state through their 16 Regional Centers to create a strong and unique ladder of opportunity for students throughout Oregon.
Oregon Institute of Technology
Constraints & Obstacles
• Financial Obstacles: 40-40-20 requires a sizable financial investment from the state to meet capacity demands. With limit funds for additional staffing and programs, it is difficult to impact student retention, and to add capacity for working with partner schools and community-based programs like MESA. Unlike other campuses with targeted investments, Oregon Tech has been absorbing the cost of these initiatives, including a Director of Academic Agreements, Admissions positions, expanded tutoring, and reassignment of a Vice President to work on STEM Partnerships, cost of dual credit, high school transition courses, reverse transfer, etc.

Oregon State Board of Higher Education Page 11
• Capacity: While current programs are market driven and many are on the verge of saturating their market. Graduate placement rates are hallmark of our university and we will not grow those programs.
• Facilities: Cornett Hall needs to be renovated and/or replaced. Cornett Hall houses Mechanical Engineering Technology, Manufacturing Engineering Technology, Civil Engineering, and the Oregon Renewable Energy Trust.
Current Practices & Strategies
• Articulation Experts: Oregon Institute of Technology has created an office of Academic Agreements to create greater access for high school students, community-college students and practicing professionals to its programs. The Office’s charge is to manage over 100 articulation and dual-enrollment agreements, direct OIT’s extensive Advanced Credit Program and High School Transitions programs, and represent the campus on the pathways work with community colleges.
• Enrollment: Oregon Tech has a Strategic Enrollment Management Committee that is focused on enrollment growth and retention. Oregon Tech’s enrollment target for 2025 is 5,400 student; with growth to 1,000 students at the Wilsonville Campus and 4,400 students in Klamath Falls, distance education, and partner sites. This represents a 35% growth projection by 2025.
• Targeted Recruitment: In January 2013, Oregon Tech added created several work groups to take action on Targeted Recruitment, STEM and Pre-College Programs, and Equity/Diversity.
• STEM Partnerships: Oregon Tech is leading the formation of a STEM Partnership with 13 school districts, two universities, three community colleges, five community-based organizations and 10 private businesses to increase the number of students that earn STEM degrees and certificates, and to increase access and excitement among students in these courses.
Oregon State University
Constraints & Obstacles
• Financial Obstacles: 40-40-20 requires a sizable financial investment from the state to meet capacity demands.
• Local Support: OSU needs support of local communities for changes in campus size, programs, and student mix. It is important to keep community leaders engaged as we plan for campus changes to meet this goal.
• Governance: Navigating any changes to the governance structure and relationships between the University System, community college and k-12. Need to ensure clear roles and responsibilities.

Oregon State Board of Higher Education Page 12
• Federal Landscape: Federal support is very important to our research work and graduate programs. Changes in Federal student aid can also have large consequences for students.
Current Practices & Strategies
• Empowering Students to Plan: Oregon State University is using MyDegrees Degree Audit, which allows students the ability at any time to review their progress toward degree, model possible scenarios for courses yet to be taken, and look at the classes they need if they choose to change their major. This provides yet one more support tool that students can use to achieve timely graduation.
• Enrollment Strategy: Oregon State University is developing a comprehensive enrollment strategy that includes the Corvallis campus, Bend Campus, Hatfield Marine Science Center, and online education programs. This includes maximizing the Corvallis campus, while staying within a total population of 28,000, while growing the Bend Campus to OSU also plans to approximately 5,000 students by 2025.
• Infrastructure: Oregon State University is developing its infrastructure and program plans to allow for the next five to six years of growth required for the 40-40-20 goal, including transitioning Cascades to a four year program. Investments to provide facilities and educational tools for students are a necessary component of educating students for the 21st century.
• Student Support: It is important that we improve the success rate for all students that attend OSU, and work to shorten the time to degree for all students. Though the Strategic Plan, OSU has increased its emphasis on student success and engaged in several initiatives to advance this strategy, namely, hybrid courses, improvements to the online data system that allows faculty and advisors access to information that is helpful in advising students, expanded outreach for under-represented students including CAMP, SMILE, SSS, MANRRS, SACNAS and LSAMP. In addition, OSU has constructed four new cultural centers, has worked to improve coordinated advising with community colleges, and has initiated a comprehensive First Year Experience program.
• Scholarships: OSU plans to make expanded scholarship support a central component of the Campaign for OSU to build substantially increased resources for scholarship support.
Portland State University
Constraints & Obstacles
• Funding: The current level of state funding Portland State receives per student creates a significant gap in the total cost. In addition, unmet need continues to grow as tuition is already very high for students.
• Infrastructure and Capacity: PSU is challenged to meet the demand for lack of infrastructure to support student needs. The campus is in need of renovations for classroom that keep pace with current pedagogy, along with a documented need for

Oregon State Board of Higher Education Page 13
improvements to building systems. In addition, improved student community space, along with married and low-income housing is needed to support students.
Current Practices & Strategies
• College Pipeline: To create the pipeline for high school students, Portland State University is pursing the following strategies: leadership role in All Hands Raised, participation in the OUS tours, high school visitations, campus Preview Day, Viking 101 Days, Orientations, etc.
• Affordability: PSU leverages remission dollars and scholarships to assist students in paying for their education, provides workshops at community sites on scholarships and FAFSA, and implements marketing and advertising campaigns that message the value of a PSU education. In addition, PSU engages in pre-college outreach to families of underrepresented minority students, and provides on-campus events that are culturally and language appropriate for families on underrepresented minority students.
• Transfer Students: In order to serve transfer students, PSU plans to expand its work with reverse transfer, co-admissions opportunities, events that target transfer students, work with community college counselors and participation in transfer fairs, the development of a virtual transfer center what assists students in navigating admissions, advising and financial aid, and a strategy for targeting students who attended PSU by did not complete.
• Degree Completion Programs: Portland State University, in collaboration with community colleges in the region, has developed degree-completion programs to serve returning adult students. The programs build on the previous higher-education experience of the student and the lower-division offerings at the community college to provide the final two years of a Bachelor's degree.
Southern Oregon University
Constraints & Obstacles
• Financial Resources: Limited financial resources, and the task of doing more with less. • Adequate Student Support Services: SOU is partnering with K-12 and community
colleges to help more students move into the pipeline for a university degree. However, SOU is not funded for this work, and has limited resources to assist economically disadvantaged students once they are admitted.
Current Practices & Strategies
• Student Success Coursework: Southern Oregon University has created a program for students with a focus on study skills, time management, reading comprehension, and campus resources. SOU offers these courses in the winter and spring terms when students need them to get back on track, providing them with the assistance they need to prevent them from dropping out.

Oregon State Board of Higher Education Page 14
• Destination Campus: Southern Oregon University is working to brand itself as a destination campus and have developed initiatives to (1) heighten distinctiveness, (2) increase student’ retention and completion, and strengthen career readiness, and (3) ensure financial sustainability.
• Honors College: In the fall of 2013, SOU will open an Honors College that serves 25 high achieving students. An additional 25 students will be admitted every fall, with a total cap of 100 students. Honors College students will work collaboratively in small seminars and will also focus on applied, real-world projects. Every Honors College student will be paired with a mentor in the community who will help the student navigate a career pathway.
• Campus Houses: In the fall of 2013, SOU will launch two Houses (Interdisciplinary learning communities, not physical houses), that allow students to work collaboratively on projects that address regional needs. Students will apply their classroom learning to real-life issues and learn firsthand the workings of regional problem-solving and collaboration. Research suggests that students who connect with faculty and staff on applied projects retain at higher rates than students with weaker campus connections.
• Jobs on Campus: Beginning fall 2013, this initiative will add 50 new jobs a year to the currently available 1,100 student jobs on campus. We are developing supervisory and mentoring components to assist students more intentionally in gaining professional skills and capacities that will increase their career preparedness and options when they leave SOU.
• Hawks: In winder 2014, SOU will launch a pilot program at the Higher Education Center in Medford that focuses on non-traditional students already in the workforce. The Hawks will consist of 25-40 working professions who seek an undergraduate degree for personal or career advancement. These students will be eligible to earn credit for prior experience and connect theory to practice through online and face-to-face modules. Students will be able to test their competencies, accelerating quickly when they have demonstrated learning. Additional Hawk cohorts will launch in response to identified needs.
• Pirates to Raiders: SOU in conjunction with the Phoenix-Talent School District have created a program to help prepare more k-12 students for admission to college. This initiative takes a cohort of eighth grade students and follows them through high school graduation and matriculation into college. The program includes intrusive advising, tutoring, SAT/ACT test preparation, financial aid tutorials, trips to campus, and other activities for students and parents.
• Summer Programs: SOU sponsors two summer programs Academic Latina for Hispanic students and Konoway Nicum Tillicum for Native-American students. These programs are designed to give middle school students the tools to succeed in high school and matriculate into college.

Oregon State Board of Higher Education Page 15
University of Oregon
Constraints & Obstacles
• Modern Facilities: The University of Oregon needs modern facilities to educate students for the 21st century. To provide the academic infrastructure to meet 40-40-20, the university needs access to capital.
• Revenue Bonds: The UO seeks authority to issue and sell revenue bonds and to enter into a variety of financing agreements to meet institutional demands on resources. A public UO board will have the same fiduciary obligations as any other governing board, and the revenue bonds would not be indebtedness to the State of Oregon.
Current Practices & Strategies
• Affordability with Need-Based Aid and Services: University of Oregon started the “Pathway Oregon” program to ensure that academically qualified, lower-income Oregonians have their tuition and fees covered with a combination of federal, state, and university funds. The highest achieving students in the program have the opportunity to be selected for a grant to cover housing costs as well. Students in this program receive targeted orientation and advising throughout their UO career.
• Financial Aid and Scholarships: Resident students have access to a wide variety of financial aid through federal and state government need-based aid and through scholarships provided by UO. Currently, 65% of UO undergraduates receive financial aid; 26% receive federal Pell grants. Examples of institutional scholarships include the Solari Scholarship, Stamps Scholarship, Summit and Apex Scholarships, Presidential Scholarship, General University Scholarship and Diversity Excellence Scholarship.
• New Models for Delivering Education: Current trends in education are rapidly moving toward flexible delivery models to reach varied learning styles across multiple generations of learners and geographically dispersed audiences. Students are seeking flexible schedules and demanding media-rich engagement in the learning process.
• Technology: Technology at the UO has been supported through campus-wide units, include IS, Library, Teaching Effectiveness Program, and Academic Extension. In the last five years, there has been approximately 50% growth in enrollments and double the number of unique course titles available.
• Educational Partnerships: UO is working with Lane Community College, the United Way and Lane County’s school districts to create an Educational Partnership. This partnership is committed to increasing college enrollment, retention, and completion for a wider range of students from our local community. Furthermore, the Education Partnership is committed to ensuring that Lane County students are college and career ready.
Western Oregon University
Constraints & Obstacles

Oregon State Board of Higher Education Page 16
• Affordability: Cost critical factor that influences the ability of students to begin and complete college. Affordability has both real and perceived components. Perceived affordability is driven by fear and ignorance regarding true costs, and affects completion of high school and entry to college. Actual affordability describes the real struggle that current students face in paying their tuition and fees, room and board and books. WOU lacks the donor base or larger overall budget to create and maintain an impactful scholarship and aid program that would eliminate the perceived affordability barrier and also support students through the completion of their degree.
• Academic preparation: College readiness is a critical challenge that reflects the curriculum gaps between high school and university study, the reduction of high school curriculums in response to budget cuts, increased class sizes for high schools and reduction in counseling services.
• Staffing Limitations: WOU doing more to fill the counseling gap or mounting an effort to better align high school and university curriculum. The Common Core is an important step, but joint faculty development is a critical component to have a more seamless system.
• Overall institutional fatigue.
Current Practices & Strategies
• Mandatory Advising: Western Oregon University has created an Academic Advising and Learning Center that provides mandatory advising for all undergraduate students with required regular meetings. Advising staff members are multilingual and overlapping advising is provided for first-generation and low-income students as well as students with disabilities who need additional support.
• Student Success Strategies: Student success specialist, early-alert software and degree audit software. In addition, joint academic advising to assist students in making the most effective choices of which community college courses to take. Finally, Tuition Choice provides student with a stable, predicable and cost-saving tuition programs.
• High school completion: increasing number of bilingual teachers WOU prepares for entry into Oregon Schools. Statewide workshops on improving Latino student achievement for high school principals and district leaders.
One possibility…
The situation surrounding 40-40-20 now seems to entail the following:
• First, the lay of the land about where decisions will get made is changing. It appears that the OEIB, the HECC (Higher Education Coordinating Commission) and individual institutional boards will have greater authority over the decisions central to 40-40-20.
• State policy appears to be committed to moving toward paying for degrees as the primary means of funding institutions. This creates an important avenue for pursuing 40-40-20 within the “tight-loose” principle.

Oregon State Board of Higher Education Page 17
• There is wariness at the campuses about a top-down approach to 40-40-20, including wariness about the use of any model to set targets or allocate costs and revenues that does not recognize campus differences.
• The existing models are useful for pointing to the big points of leverage (retention, etc.) but are inadequate for comparing costs and timing of alternative programs and strategies. They also do not include campus-level data. The limitations of good cost data at the campus level makes it particularly difficult for the System develop finely-tuned strategies. The cost and effort to build out the models to achieve what is needed to answer the questions posed above are beyond this project. Nor does it make sense from the state’s perspective to build an “OUS” model. This is something that should be done by the OEIB.
Taking all this into consideration leads to considering an approach that would:
• Anticipate more responsibility at the campus level for responding to a 40-40-20 framework and targets, with OUS in a more “steering” and support role.
• Put the burden on campuses for cost control.
• Put the burden on the state for funding levels to meet degree and affordability goals (ensure that compacts link targets and funding).
• Put the burden for developing a strong performance and cost model at a higher level, namely the OEIB
###