academic report a literature review on the reporting …
TRANSCRIPT

ACADEMIC REPORTA LITERATURE REVIEW
ON THE REPORTING OF INTANGIBLES
FEBRUARY 2020
Authors:Prof. Dr Stefano ZambonProf. Dr Giuseppe MarzoDr Laura GirellaMr Mario AbelaMr Nicola D’Albore
2
Report prepared for EFRAG (European Financial Reporting Advisory Group)
by
Prof. Dr Stefano ZambonUniversity of Ferrara
Prof. Dr Giuseppe MarzoUniversity of Ferrara
Dr Laura GirellaUniversity of Modena and Reggio Emilia, and Technical and Research Manager, International Integrated Reporting Council (IIRC)
Mr Mario AbelaConsultant, and Queen Mary University of London
Mr Nicola D’AlboreUniversity of Ferrara
© EFRAG (2020)
This report is published by EFRAG.
The views expressed in this report are those of the authors and do not necessarily represent the views of EFRAG.
No responsibility for loss occasioned to any person acting or refraining from action as a result of any material in this publication can be accepted by the authors or publishers. All rights reserved. No part of this publication may be reproduced, stored in a retrieval system, or transmitted, in any form or by any means, electronic, mechanical, photocopy, recording or otherwise, without prior permission of the publishers.
Despite the work is the outcome of a joint effort, the Executive Summary, the Introduction and the Chapters 1, 3, 4, 9 and 10 are to be attributed to Stefano Zambon, Chapters 2 and 5 to Giuseppe Marzo, Chapter 6 to Nicola D’Albore, and Chapters 7 and 8 to Laura Girella. Mario Abela has acted as general supervisor and discussant of the whole work.
3
TABLE OF CONTENTS
EXECUTIVE SUMMARY 5
CHAPTER 1: INTRODUCTION 20
CHAPTER 2: CONTENTS, ARCHITECTURE, METHODOLOGY AND CHARACTERISTICS OF THE LITERATURE REVIEW 22 THE INVESTIGATED AREAS 22 THE METHODOLOGY OF THE REVIEW 23
CHAPTER 3: INTANGIBLES IN A MACRO-PERSPECTIVE 27
CHAPTER 4: PRE-2007 KEY PAPERS ON ACCOUNTING FOR INTANGIBLES 34
CHAPTER 5: UNACCOUNTED INTANGIBLES AND THEIR IMPACT ON THE RELEVANCE OF FINANCIAL REPORTING 36 THE MAIN TOPICS ADDRESSED 36 MAIN FINDINGS 38
CHAPTER 6: INFORMATION ON SPECIFIC UNACCOUNTED INTANGIBLES AND THEIR IMPACT ON COMPANY PERFORMANCE, MARKET VALUE, AND USERS 40 THE PAPERS OF THE CHAPTER 40 THE MAIN TOPICS ADDRESSED 40 MAIN FINDINGS 48
CHAPTER 7: INFORMATION ON INTELLECTUAL CAPITAL AND ITS EFFECTS ON COMPANY PERFORMANCE, MARKET VALUE, AND USERS 58 INTRODUCTION 58 MAIN TOPICS ADDRESSED 58 INTELLECTUAL CAPITAL AND ITS EFFECTS ON COMPANY PERFORMANCE 58 INTELLECTUAL CAPITAL AND ITS EFFECTS ON MARKET VALUE 61 INTELLECTUAL CAPITAL AND ITS EFFECTS ON FINANCIAL ANALYSTS 62 MAIN FINDINGS 62
CHAPTER 8: FRAMEWORKS AND MODELS FOR MEASURING AND REPORTING ON INTANGIBLES AND THEIR CONSEQUENCES ON COMPANY PERFORMANCE, MARKET VALUE, AND USERS 65 THE WORKS OF THIS CHAPTER 65 THE MODELS AND TOOLS PROPOSED FOR INTANGIBLES/INTELLECTUAL
CAPITAL DISCLOSURE, REPORTING AND VALUATION 65 THE FRAMEWORKS RELATED TO INTELLECTUAL CAPITAL/INTANGIBLES
DISCLOSURE AND REPORTING 72 MAIN FINDINGS 74

4
CHAPTER 9: THE STUDIES ON INTANGIBLES REPORTING BY THE EUROPEAN COMMISSION, THE OECD AND THE EFFAS: A SYNTHESIS 77 THE EUROPEAN COMMISSION STUDIES ON INTANGIBLES (2000-2017):
A SYNTHESIS IN A REPORTING PERSPECTIVE 77 THE OECD STUDIES ON ACCOUNTING AND REPORTING FOR INTANGIBLES (2006-2017):
A SYNTHESIS 84 THE 2008 EFFAS “PRINCIPLES FOR EFFECTIVE COMMUNICATION OF
INTELLECTUAL CAPITAL” 89
CHAPTER 10: CONCLUDING REMARKS 90
APPENDIX 1: KEYWORDS USED AND RELATED NUMBER OF RESULTS PER SEARCH ENGINE EMPLOYED 94

5
INTRODUCTION AND METHODOLOGY
The focus of the present academic literature review is on internally generated intangibles (here referred to also as “unaccounted intangibles”) that are not purchased separately or in business combinations, because those would be already dealt with in traditional accounting. Also, not separable intangibles (e.g. reputation, business model, and human capital) will be considered owing to their relevance for companies and their value creation broadly conceived.
The aim of the present academic literature review is primarily to match the knowledge interests and information needs of the European Financial Reporting Advisory Group (EFRAG), and, more in general, those of a non-academic audience. However, the aim of the literature review is not to provide recommendations on how to provide additional information on intangibles in the financial statements.
The review will concentrate to the extent possible on quantitative – but considering also relevant qualitative – papers published from 2007 onwards. The papers selected for the review are those analysing the capability of intangible resources that are internally developed by entities to contribute to the entity’s financial performance (current profit, future earnings and cash flows) and its financial market value, as well as the view by investors and financial analysts, focusing on information outside financial statements.
The quality of the papers considered comes from the fact that they are published in double-blind refereed journals, which is deemed to assure their scientific soundness, or in international books. In addition, the good quality of the works analysed is assured by the methodology followed for their selection (see below), which is based on the scientific impact of each paper on the literature measured with the number of citations received divided by the number of years from publication: only the research products that have received the highest score will be examined. A further number of papers that have been judged of interest by the EFRAG team and experts of the field enriches this first bunch of works, for a total amount of more than 100 papers scrutinised.
A general limitation is that not many companies produce information and numbers on unaccounted intangibles, and this lack of data entails some limitations for the academic researchers working in this area. Another general warning relates to the inconsistent and discontinuous terminology that is used in the papers analysed. A reader may find confusing the recurrence of different terms such as “intangibles”, “intangible assets”, “intellectual capital”, “intellectual asset”, “intangible resource” and “intangible capital”. It is not an aim of this review to introduce univocal definitions for each of these concepts because in the literature there is not convergence, nor a consensus on their meaning. In very general terms, when the term “assets” is employed there may be an implicit reference to accounting-recognised resources, whilst the concept of “intellectual capital” is wider (see in Ch. 8 its definition provided by the WICI Framework) and the term “intangibles” is a generic one (it may include positive and negative intangible resources).
This literature review has analysed papers relevant to five main research areas:
A) Intangibles in a macro-perspective;
B) Unaccounted intangibles and their impact on the relevance of financial reporting;
C) Information on specific unaccounted intangibles and its impact on company performance, market value, and users;
D) Information on intellectual capital and its effects on company performance, market value, and users;
E) Frameworks and models for measuring and reporting on intangibles and their consequences on company performance, market value, and users.
EXECUTIVE SUMMARY

66
As aforementioned, the methodology followed for selecting the most relevant papers on intangibles is composed of two parts:
• A 1st step devoted to a rigorous selection based on bibliographical features of the academic works, drawing on papers’ key-words and the most recognised international bibliographical databases, with the aim of detecting the papers that have received the largest annual citations in the literature, conceived as a proxy for the scientific importance of the work considered;
• A 2nd step that is based on EFRAG’s manifested needs and suggestions as well as expert judgements, in which some other papers on intangibles were introduced in the review, owing to their perceived relevance by the EFRAG team and a number of academics and field specialists.
INTANGIBLES IN A MACRO-PERSPECTIVE
This section serves as a general introduction to the systemic importance of intangibles in today’s economic systems, and to document this new phase of the capitalism, where investments in intangibles have taken the lead and drive the growth of several national economic systems.
Graph 1: Non-residential intangible and tangible investments in the EU-28 and the U.S., total economy; Chain linked volumes, index 1995 = 100
100
120
140
160
180
200
220
240
1995 1996 1997 1998 1999 2000 2001 2002 2003 2004 2005 2006 2007 2008 2009 2010 2011 2012 2013 2014US national accounts intangibles EU28 national accounts intangibles
US non-residential tangibles EU28 non-residential tangibles
Source: Thum-Thysen et al., European Commission, 2017, p. 12.
Indeed, this revolutionary trend has been showing in a stronger way in some specific European nations and regions, such the UK, Germany, France and the Scandinavian countries.
In particular, in an ad hoc Study the European Central Bank observes that, although the percentage of intangible assets that are reported in firms’ annual accounts is gradually increasing, particularly in the service sector, the underreporting of intangible assets could mean that real output is also being underreported. Moreover, the classification of intangibles as expenses to be deducted from earnings – as opposed to assets – is weighing on profits.
There is therefore plenty of evidence that this macro-economic phenomenon of investment in intangibles has nowadays become quite extensive, and it appears to characterise a new economic phase that has been incisively defined as “capitalism without capital” (Haskel and Westlake, 2017): financial capital remains an important resource, but intangibles and intellectually derived resources mark a new form of capitalism, i.e. a new way to produce wealth and growth. However, as the last European Commission Study (Thum-Thysen et al., 2017) points out: “Also important is an improvement of systematic reporting of investments in all relevant intangibles and as a driver of value creation for individual firms. This may also facilitate getting access to finance (capitalised intangibles might be used as collateral), improve corporate governance and market transparency. In fact, evidence suggests that the market value of a firm tends to be increasingly driven by its productive stock of intangibles than by the firm’s tangible assets. Policy can help by suggesting new standards for accounting and corporate disclosure” (p. 35).
77
PRE-2007 KEY PAPERS ON ACCOUNTING FOR INTANGIBLES
The aim of this section is to review some research works that, despite they have been published out of the time span adopted for this review (post-2007), they have provided key insights for the evolution of this field.
Cañibano et al. (2000) find that, although most of the accounting standard setters place greater importance on intangibles, approaches still result to be quite variegated. Hence, financial statements result to be neither comparable nor including relevant information. In general terms, the authors point out that guidelines for the identification, measurement, reporting and management of value relevant intangibles are missing. In addition, they suggest that another field to be examined is the behaviour of investors vis-à-vis intangibles information.
In his seminal book Intangibles: Management, Measurement and Reporting (2001), Baruch Lev not only recognises the relevance of these type of resources, but he also proposes a model for their management, measurement and reporting, namely the “Value Chain Scoreboard”. He argues that global trends, such as globalisation and technological change, have forced companies to focus their quest for profitability on innovation, and the primary drivers for innovation are intangible in nature. He also discusses the positive and negative characteristics of these non-standard resources, that are scalability, increasing returns, network effects, costs or limitations of high risk, lack of full control over benefits and absence of a market.
All the above arguments have been taken up again and further elaborated in the 2016 book by Lev and Gu memorably titled The End of Accounting and the Path Forward for Investors and Managers. In particular, chapter 8 of their 2016 book is devoted to the discussion of the lack of recognition that intangibles still have in financial statements. This absence is one of the major causes of the loss of relevance of accounting. Indeed, they provide evidence about the fact that the more companies that enter the market are endowed with intangible capital, the less accounting information is relevant. According to the authors, the main reasons for a lack of change are related not only to accounting regulators, but also to managers and auditors.
Lev and Zambon (2003) acknowledged the relevance that managers can have in understanding and appreciating the role of these resources in organisations. They maintain that, while the value in exchange is often taken into consideration, the value in use of intangibles, that is their role within the organisation and in particular in the production-organisation nexus, is often overlooked. And this constitutes part of the problem.
UNACCOUNTED INTANGIBLES AND THEIR IMPACT ON THE RELEVANCE OF FINANCIAL REPORTING
This Section illustrates the various aspects of the impact of intangibles on the relevance of financial reporting and company value. From the analysis of the papers, three main topics of analysis have been identified:
• The role of accounting standards in the recognition and reporting of intangibles;
• The factors influencing the disclosure about intangibles;
• The association of intangibles with the firm financial performance and/or value.
This Section illustrates the various aspects of the impact of intangibles on the relevance of financial reporting and company value. From the analysis of the papers, three main topics of analysis have been identified:
1) While the majority of studies finds, in general, a significant positive association between intangibles disclosure and the financial performance or the market value of a firm, there are also more ambiguous results in regard to this set of relationships;
2) As for the inclusion of internally generated intangibles in financial statements, different theoretical positions can be noticed. From one perspective, some scholars address the fact that financial statements have lost their relevance, due also to the unaccounted intangibles, and thus they call for modifications in the accounting standards with the aim to close the gap between the book and the market value of the firm. Whereas, others maintain that the value of intangibles that are unaccounted does impact and can be detected in the income statement. Consequently, there is no compelling argument for modifying accounting standards on intangibles (see also “Concluding remarks”).

88
INFORMATION ON SPECIFIC UNACCOUNTED INTANGIBLES AND THEIR IMPACT ON COMPANY PERFORMANCE, MARKET VALUE, AND USER
This Section reviews the studies concerning the disclosure (including narrative) of the impact of specific internally generated intangibles (such as brands, patents, reputation, R&D, customer satisfaction/awareness, customer list/customer franchise, business model, organisational capital and human capital) on three fundamental elements, i.e. firm profitability and cash flows, market value and positioning, and investors and information users. Inquiries into the specific risks connected to these intangibles will also be included.
In general terms, specific unaccounted intangibles have a positive effect on the financial performance and the market value of companies. For example, greater expenditure on intangibles corresponds to an increase in the value of the company (e.g. Ehie and Olibe, 2010). However, it has also been found that the effect of intangibles on financial performance or market value is positive, but not linear. Also, this effect may not take the configuration of a direct link, because it can be moderated or influenced by other factors (e.g. Sánchez & Sotorrío, 2007). Furthermore, this positive effect is not the same for all firms and industries, and it does not necessarily happen in the short-medium term (Stam and Wennberg, 2009).
As to the disclosure about specific intangibles, it has been shown that it is negatively associated with earnings (Merkley, 2014 for R&D), but it may have a positive effect on the share price (Chen et al., 2017 for R&D). Finally, this positive effect concerns more the quantity of forward-looking information than the backwards-looking disclosure (Bayer et al., 2017 for customer satisfaction/awareness).
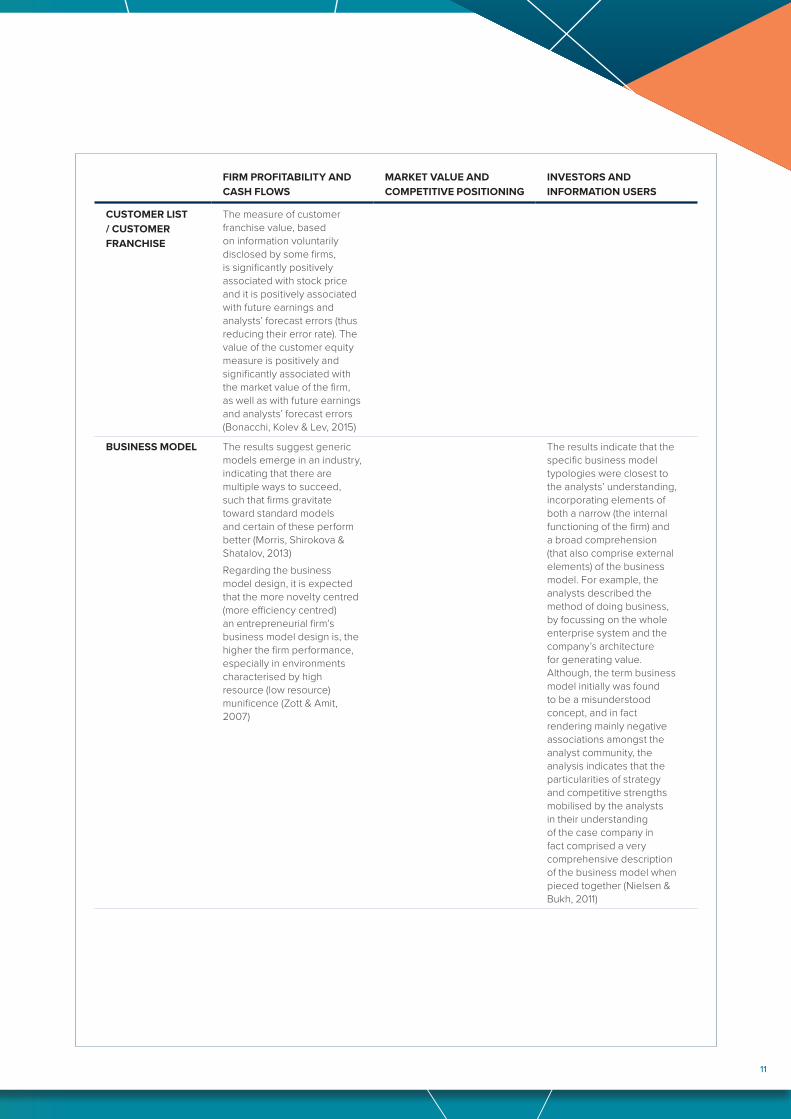
In the following, a Table summarises the main findings from the in-depth reviewed papers of this Section, which have been articulated according to the type of impact (i.e. firm profitability and cash flows, market value and positioning, and investors and information users) investigated in each of the considered works.
Table 6.1 – Synopsis of the main findings from the papers in-depth reviewed
FIRM PROFITABILITY AND CASH FLOWS
MARKET VALUE AND COMPETITIVE POSITIONING
INVESTORS AND INFORMATION USERS
BRANDS The stock of brand-association trademarks available to firms in time period t increases their cash flows (measured as cash flows from operations), Tobin’s q, return on assets, and stock returns, while reducing their cash-flow variability in period t + 1. Meanwhile, the stock of brand-identification trademarks owned by firms in period t-1 influences the effects of brand-association trademarks on these financial indexes (Krasnikov, Mishra, & Orozco, 2009)
Firms with a positive brand image are associated with a significant market-value premium, superior financial performance, and lower cost of capital (Smith et al., 2010)

99
FIRM PROFITABILITY AND CASH FLOWS
MARKET VALUE AND COMPETITIVE POSITIONING
INVESTORS AND INFORMATION USERS
PATENTS No direct relationship between patents and performance (Artz, Norman, Hatfield & Cardinal, 2010)
Patent share has a significantly negative effect on corporate market value. However, relative patents position has a significantly positive effect on corporate market value (Chen & Chang, 2010)Patent measures reflecting the volume of companies’ research activity, the impact of companies’ research on subsequent innovations, and the closeness of research and development to science are reliably associated with the future performance of R&D-intensive companies in capital markets (Deng, Lev & Narin, 1999)
REPUTATION The relationship between the firm’s reputation and financial performance is non-linear but positive, and the process of the creation of value of companies by means of their reputation is moderated or influenced – though limitedly – by a series of contingent factors (e.g. differentiation strategy, competitive intensity and power of stakeholders) (Sánchez & Sotorrío, 2007)
Superior reputations increase shareholder value in the long term. In addition, non-financial reputation and financial reputation have a differential impact on shareholder value: superior non-financial reputations produce higher abnormal returns than superior financial reputations (Raithel & Schwaiger, 2015)
Both likeability and competence are value-relevant in regard to investors’ expectations about future firm value, and the value relevance of corporate reputation is stakeholder group-specific (Raithel, Wilczynski, Schloderer, & Schwaiger, 2010)
R&D The effect of initial R&D on high-tech firm growth is through increasing levels of interfirm alliances in the first post-entry years. Initial R&D also stimulates new product development later on in the life course of high-tech firms, but this does not seem to affect firm growth. Sample from the Netherlands. (Stam & Wennberg, 2009)Earnings performance is negatively related to the quantity of narrative R&D disclosure. Sample from the USA (Merkley, 2014)Firms capitalise larger amounts of R&D as a means of facilitating access to public debt markets, and capitalised R&D investments reduce the cost of private debt. Global sample. (Kreß, Eierle, & Tsalavoutas, 2019)
R&D investments in the manufacturing sector contribute more positively to firm market value than in the service sector. Sample from the USA. (Ehie & Olibe, 2010)R&D expenditures are significantly and positively associated with average risk premiums. Capital expenditures are also significantly and positively associated with average risk premiums in the regression analysis, unlike the advertising expenses, which did not show consistently positive relationships with average risk premiums. Average risk premiums are generally and significantly related to other conventional risk factors (e.g. firm size, book-to-market ratio, etc.). Sample from the USA (Alam, Liu, & Peng, 2014)
Analysts’ incremental contribution to investors’ decisions is larger in intangibles-intensive companies than in companies with low levels of intangibles, this meaning that financial report deficiencies are partially compensated for by other information sources available to them. Sample from the USA. (Amir et al., 2003)

1010
FIRM PROFITABILITY AND CASH FLOWS
MARKET VALUE AND COMPETITIVE POSITIONING
INVESTORS AND INFORMATION USERS
R&D The mean level of realized future operating performance is positively associated with patent quality measured as the citation index of a firm’s patent portfolio; the standard deviation of realized future operating performance is negatively associated with the quality of a firm’s patents. Sample from the USA. (Pandit, Wasley, & Zach, 2011)The positive association between the level of future earnings and R&D intensity increases with firm size, and that the positive association between the volatility of future earnings and R&D intensity decreases with firm size, consistent with R&D productivity increasing with scale. Sample from the USA. (Ciftci & Cready, 2011)
The R&D-related voluntary disclosure is value relevant to investors beyond the recognised earnings, book values, and capitalised R&D, and it is associated with higher share price informativeness. Sample from Israel. (Chen, Gavious & Lev, 2017)The incremental value relevance of disclosing patent counts/ citations is greater than that of capitalising R&D expenses for the firms with high-patent level, and the value relevance of this patent disclosure is more pronounced for firms in industries with stronger protection of intellectual property. Sample from USA. (Ciftci & Zhou, 2016)
The level of R&D-related voluntary disclosure is higher when proprietary costs are lower and when the book-to-market ratio is lower, perhaps because the basic financial statements are less informative about market value. In addition, after controlling for the level of general disclosure and forward-looking disclosure, a negative relation between disclosures about development-stage R&D and both analysts’ one-year-ahead sales forecast error and dispersion is found. Sample from the USA. (Jones, 2007)
CUSTOMER SATISFACTION AND AWARENESS
Firm-level customer satisfaction measures can be economically relevant to the stock market, but they are not completely reflected in contemporaneous accounting book values (Ittner & Larcker, 1998)The CSR and firm performance relationship is a fully mediated relationship through the contribution of CSR to firm performance via better reputation and competitive advantage followed by a higher level of customer satisfaction (Parastoo, So & Saeidi, 2015)The CSR and firm performance (FP) are mediated, in that CSR is linked to both reputation and customer satisfaction, whilst reputation alone mediates the CSR–FP relationship (Galbreath & Shum, 2012)
CSR and firm value are positively related for firms with high customer awareness, as proxied by advertising expenditures. The evidence suggests that advertising expenditures enhance the impact of CSR activities on the value of the firm because advertising creates awareness about the company and its activities, which creates more “goodwill” on the part of customers (Servaes & Tamayo, 2013)Customer satisfaction is a metric that provides valuable information to financial markets. The robust impact of customer satisfaction on stock return risk indicates that it would be useful for firms to disclose their customer satisfaction scores in their annual report to shareholders (Tuli & Bharadwaj, 2009)
Positive changes in customer satisfaction not only improve analyst recommendations, but they also lower dispersions in those recommendations for the firm (Luo, Homburg, & Wieseke, 2010)The quantity of backwards-looking disclosures of customer metrics is not associated with analysts’ uncertainty, and it is weakly associated with investors’ uncertainty. Meanwhile, the quantity of forward-looking disclosures of customer metrics has a significant negative, or an insignificant, effect on analysts’ uncertainty, whilst it has a significant negative impact on investors’ uncertainty (Bayer et al., 2017)
1111
FIRM PROFITABILITY AND CASH FLOWS
MARKET VALUE AND COMPETITIVE POSITIONING
INVESTORS AND INFORMATION USERS
CUSTOMER LIST / CUSTOMER FRANCHISE
The measure of customer franchise value, based on information voluntarily disclosed by some firms, is significantly positively associated with stock price and it is positively associated with future earnings and analysts’ forecast errors (thus reducing their error rate). The value of the customer equity measure is positively and significantly associated with the market value of the firm, as well as with future earnings and analysts’ forecast errors (Bonacchi, Kolev & Lev, 2015)
BUSINESS MODEL The results suggest generic models emerge in an industry, indicating that there are multiple ways to succeed, such that firms gravitate toward standard models and certain of these perform better (Morris, Shirokova & Shatalov, 2013)Regarding the business model design, it is expected that the more novelty centred (more efficiency centred) an entrepreneurial firm’s business model design is, the higher the firm performance, especially in environments characterised by high resource (low resource) munificence (Zott & Amit, 2007)
The results indicate that the specific business model typologies were closest to the analysts’ understanding, incorporating elements of both a narrow (the internal functioning of the firm) and a broad comprehension (that also comprise external elements) of the business model. For example, the analysts described the method of doing business, by focussing on the whole enterprise system and the company’s architecture for generating value. Although, the term business model initially was found to be a misunderstood concept, and in fact rendering mainly negative associations amongst the analyst community, the analysis indicates that the particularities of strategy and competitive strengths mobilised by the analysts in their understanding of the case company in fact comprised a very comprehensive description of the business model when pieced together (Nielsen & Bukh, 2011)

1212
FIRM PROFITABILITY AND CASH FLOWS
MARKET VALUE AND COMPETITIVE POSITIONING
INVESTORS AND INFORMATION USERS
ORGANISATIONAL CAPITAL
The authors developed a firm-specific measure of organisational capital and document that it is associated with five years of future operating and stock return performance, after controlling for other factors. Thus, their organisational capital measure captures firms’ fundamental ability to generate abnormal performance. They found that executive compensation is positively associated with the measure of organisational capital. Collectively the results show that organisational capital is an important intangible asset that is related to firm value and crucial corporate decisions (Lev et al., 2009)
Sell-side analysts particularly use information on intangibles when covering companies with a relatively positive future outlook (positive recommendations). Analysts use more information on intangibles when covering less mature or smaller sized companies. The analysts generally perceived non-financial information as more important than the financial inputs (Grüber, 2015)
HUMAN CAPITAL Human capital disclosure is found to have a positive relationship with firm internal factors, such as workforce’s capabilities, motivation and commitment, or with organisational performance and innovation ability. Human capital disclosure is found to have a positive relationship also with firm external factors, such as the firm attractiveness and reputation for the external stakeholders (Gamerschlag and Moeller, 2011)
By extracting human capital information from German companies’ annual reports, it is found that this information is value relevant. Especially, information on qualification and competence issues is positively associated with firm value. Nonetheless, the disclosed information does not lead to short‐term changes in market value. Consequently, human capital information is value‐relevant but not immediately (Gamerschlag, 2013)Brand Equity and Human Capital are found to have a complementary relationship on firm value and, specifically, there is a significant and positive interaction term for Tobin’s q and cash flows, and a negative interaction term for cash flow volatility (Vomberg & Homburg, 2015)
1313
INFORMATION ON INTELLECTUAL CAPITAL AND ITS EFFECTS ON COMPANY PERFORMANCE, MARKET VALUE, AND USERS
This Section deals with the investigation of the manners in and the extent to which intellectual capital (IC) affects the firm market value and competitive positioning as well as its relationships with financial analysts. The concept of intellectual capital embodies a subset of unaccounted intangibles in that it refers, strictly speaking, only to intangibles that are effectively internalised and usefully employed in the activities of an organisation. For example, a company could have a patent that is not used in any way in its operations: this still represents an intangible, but it should not be considered part of the company’s intellectual capital.
Intellectual Capital can be defined as follows: “Intellectual Capital encompasses the internal (competencies, skills, leadership, procedures, know-how, etc.) and external (image, brands, alliances, customer satisfaction, etc.) intangibles which are dynamically inter-related and available to an organization, thereby enabling it to transform a set of tangible, financial and human resources into a system capable of pursuing sustainable value creation” (WICI Intangibles Reporting Framework, 2016).
In the academic literature of the last twenty years, it has been typically conceptualised as being composed of three main capitals, namely Organisational (or Structural) Capital, Human Capital and Relational Capital1. The first one relates to the knowledge available to, and procedures that are in place in, the organisation in order to function. The second one refers to the skills and competences of the employees of a company. The third one concerns the relationships that the organisation set up over its existence with those external actors that surround its activities, such as clients, suppliers, communities, etc.
The articles reviewed in-depth in this Section can be categorised as focusing on the following topics:
• Intellectual Capital and its effects on company performance;
• Intellectual Capital and its effects on market value;
• Intellectual Capital and its effects on financial analyst reactions.
From the papers investigated in this Section, it can be observed that in general intellectual capital has a positive effect on company performance, market value and users. In terms of theoretical frameworks adopted to examine these relationships, several studies have adopted the Resource-based View and its different formulations (e.g. dynamic capabilities impact on the relationship between IC and firm-level performance).
As for corporate governance mechanisms, Cerbioni and Parbonetti (2007) and Li et al. (2008) found that some of them can influence the disclosure in terms of quantity and/or quality of IC (e.g. proportion of independent directors & audit committee size). In the financial sector (especially in the banking one), Cabrita and Bontis (2008) in Portugal and Mention and Bontis (2013) in Luxembourg and Belgium have investigated the relationship between IC disclosure and banks’ performance, they found that the three IC components affect each other, and that human capital affects structural and relational capitals (the latter both directly and indirectly) and business performance.
With reference to innovation, Kalkana et al. (2014) find that intellectual capital, innovation and organisation strategy positively affect company performance. With regards to market value, Orens et al. (2009) examine the impact that web-based intellectual capital reporting has on firms’ value and its cost of finance. They observe that the more information on intellectual capital is disclosed, the less is the cost of capital, and this can be referred to all the three components of IC. Finally, intellectual capital information is found to positively influence analysts’ coverage and forecast.
FRAMEWORKS AND MODELS FOR MEASURING AND REPORTING ON INTANGIBLES AND THEIR CONSEQUENCES ON COMPANY PERFORMANCE, MARKET VALUE, AND USERS
The aim of this Section is to investigate the proposals of outside-traditional-accounting frameworks, models and tools that address – at least partially – the problem of the measurement and reporting of unaccounted intangibles and intellectual capital, thus representing potential solutions to that issue.
1 Although we acknowledge that different theorisations have been proposed over the years, this is the most commonly used.
1414
In addition to the academic articles, this Section also illustrates the International Integrated Reporting Framework by the International Integrated Reporting Council (IIRC), as well as the Intangibles Reporting Framework issued by the World Intellectual Capital/Assets Initiative (WICI) in September 2016.
To date the most well-known methods are probably:
• the Skandia Navigator developed by Edvinsson (1997) and Edvinsson and Malone (1997);
• the Intangible Assets Monitor proposed by Sveiby (1997);
• the Balanced Scorecard by Kaplan and Norton (1992, 1996, 2000);
• the Knowledge Capital Earnings by Lev and Mintz (1999);
• the Value Chain Scoreboard by Lev (2001);
• the Strategic Resources & Consequences Report by Lev and Gu (2016);
• the Value Added Intellectual Capital Coefficient (VAIC) by Pulic (2000, 2003 and 2005).
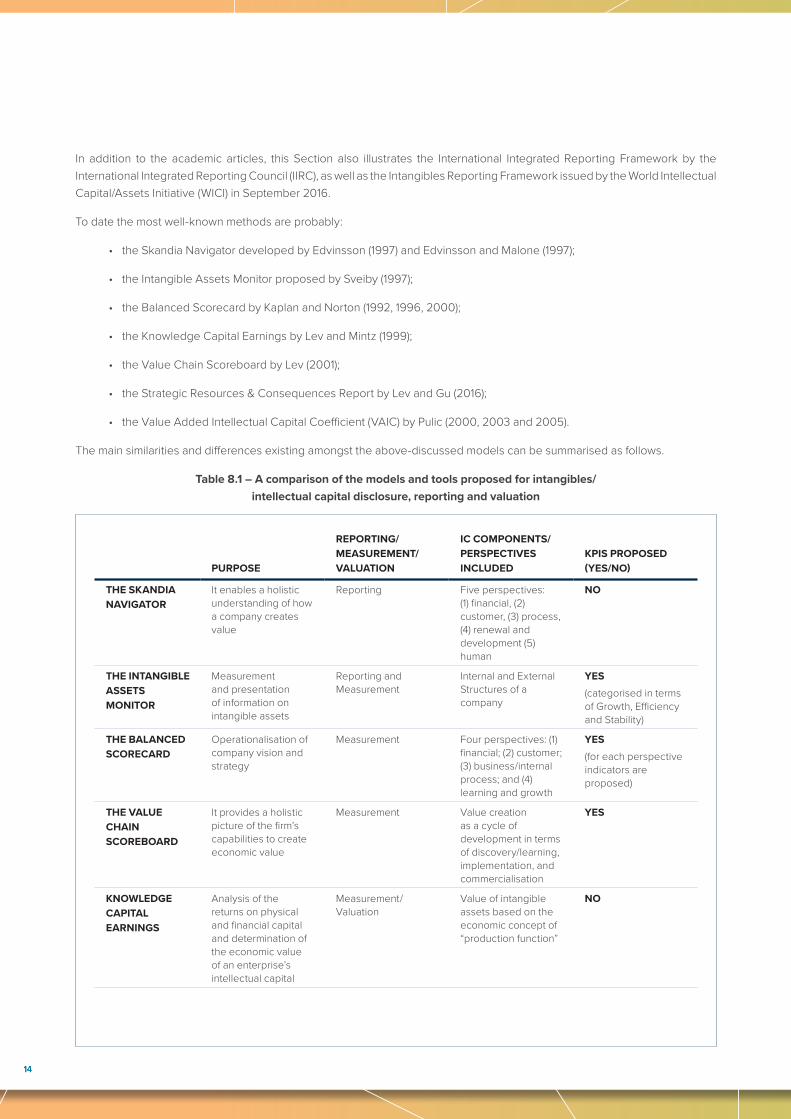
The main similarities and differences existing amongst the above-discussed models can be summarised as follows.
Table 8.1 – A comparison of the models and tools proposed for intangibles/intellectual capital disclosure, reporting and valuation
PURPOSE
REPORTING/MEASUREMENT/VALUATION
IC COMPONENTS/PERSPECTIVES INCLUDED
KPIS PROPOSED (YES/NO)
THE SKANDIA NAVIGATOR
It enables a holistic understanding of how a company creates value
Reporting Five perspectives: (1) financial, (2) customer, (3) process, (4) renewal and development (5) human
NO
THE INTANGIBLE ASSETS MONITOR
Measurement and presentation of information on intangible assets
Reporting and Measurement
Internal and External Structures of a company
YES(categorised in terms of Growth, Efficiency and Stability)
THE BALANCED SCORECARD
Operationalisation of company vision and strategy
Measurement Four perspectives: (1) financial; (2) customer; (3) business/internal process; and (4) learning and growth
YES(for each perspective indicators are proposed)
THE VALUE CHAIN SCOREBOARD
It provides a holistic picture of the firm’s capabilities to create economic value
Measurement Value creation as a cycle of development in terms of discovery/learning, implementation, and commercialisation
YES
KNOWLEDGE CAPITAL EARNINGS
Analysis of the returns on physical and financial capital and determination of the economic value of an enterprise’s intellectual capital
Measurement/Valuation
Value of intangible assets based on the economic concept of “production function”
NO
1515
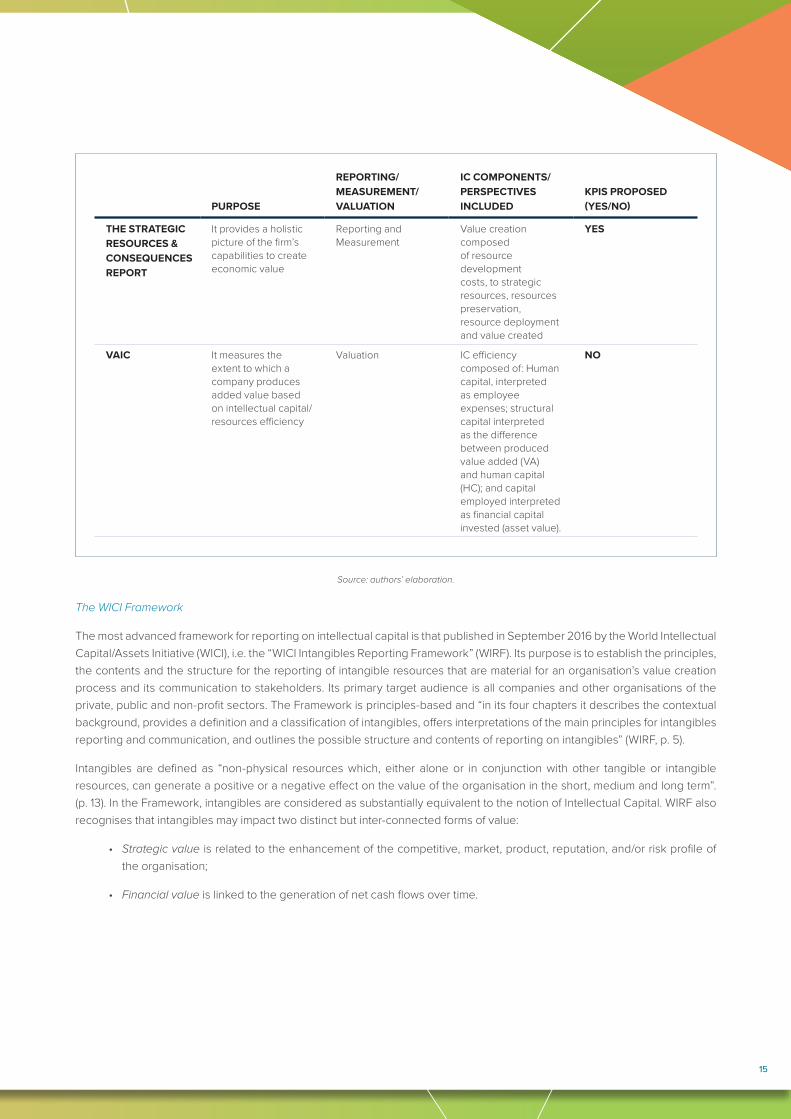
Source: authors’ elaboration.
The WICI Framework
The most advanced framework for reporting on intellectual capital is that published in September 2016 by the World Intellectual Capital/Assets Initiative (WICI), i.e. the “WICI Intangibles Reporting Framework” (WIRF). Its purpose is to establish the principles, the contents and the structure for the reporting of intangible resources that are material for an organisation’s value creation process and its communication to stakeholders. Its primary target audience is all companies and other organisations of the private, public and non-profit sectors. The Framework is principles-based and “in its four chapters it describes the contextual background, provides a definition and a classification of intangibles, offers interpretations of the main principles for intangibles reporting and communication, and outlines the possible structure and contents of reporting on intangibles” (WIRF, p. 5).
Intangibles are defined as “non-physical resources which, either alone or in conjunction with other tangible or intangible resources, can generate a positive or a negative effect on the value of the organisation in the short, medium and long term”. (p. 13). In the Framework, intangibles are considered as substantially equivalent to the notion of Intellectual Capital. WIRF also recognises that intangibles may impact two distinct but inter-connected forms of value:
• Strategic value is related to the enhancement of the competitive, market, product, reputation, and/or risk profile of the organisation;
• Financial value is linked to the generation of net cash flows over time.
PURPOSE
REPORTING/MEASUREMENT/VALUATION
IC COMPONENTS/PERSPECTIVES INCLUDED
KPIS PROPOSED (YES/NO)
THE STRATEGIC RESOURCES & CONSEQUENCES REPORT
It provides a holistic picture of the firm’s capabilities to create economic value
Reporting and Measurement
Value creation composed of resource development costs, to strategic resources, resources preservation, resource deployment and value created
YES
VAIC It measures the extent to which a company produces added value based on intellectual capital/resources efficiency
Valuation IC efficiency composed of: Human capital, interpreted as employee expenses; structural capital interpreted as the difference between produced value added (VA) and human capital (HC); and capital employed interpreted as financial capital invested (asset value).
NO

1616
Then, it identifies five ‘guiding principles’ according to which information on intangible resources can be reported and communicated, namely materiality, connectivity, conciseness, comparability and future orientation. Finally, it proposes KPIs and a structure for intangibles reporting. With reference to KPIs, the Framework posits that they can be articulated on three levels:
a) General KPIs are those that may be relevant for most organisations across industries and sectors;
b) Industry-specific KPIs are those specific to a certain industry or sector;
c) Organisation-specific KPIs are those specific to each organisation that should be reported in order to best represent its unique value creation mechanism.
As for the structure for intangibles reporting, the proposed one includes three main sections: Outline of activities and value creation model, Intangibles and value creation from past-to-present, and Intangibles and value creation from present-to-future. The order of the three sections can be flexible. WIRF is a companion Framework to the International Integrated Reporting Framework presented in the next paragraph (see Figure below).
Figure 8.7 – WICI’s Framework Focus within the corporate reporting landscape
CORPORATE REPORTING
FINANCIAL REPORTING
INTANGIBLES REPORTING
SUSTAINABILITY REPORTING
Financial Capital
Manufactured Capital
Human Capital
Intellectual Capital*
Social and Relationship
Capital
Natural Capital
Six capitals as defined by IIRC * Organisational Capital according to WICI Framework
Source: WICI Intangibles Reporting Framework, 2016, p. 9.
The International Integrated Reporting Framework by the IIRC
Integrated Reporting is also a framework that recognises the relevance of intangibles and intellectual capital. Launched through a Conceptual Framework, the International <IR> Framework, in December 2013, it aims to help companies communicate to the providers of financial capital and the other stakeholders how they are planning to continue creating value in the short, medium and long-term. The concept of integrated reporting is based on multi-capital thinking: it recognises that organisations rely on a variety of capitals to create value, namely manufactured, natural, intellectual/organisational, social and relationship, financial, and human. These capitals represent in fact the inputs to the company business model and are then transformed into outputs (products) and outcomes (impacts). It has to be noted that three of the above-mentioned capitals are of intangible nature, intellectual/organisational, social and relationship, and human. For this reason, several papers have been developed by scholars to investigate which is the role of IC in integrated reports.
The aim of this Section has been to review the proposals of frameworks, models and tools that address – at least partially – the problem of the measurement and reporting of unaccounted intangibles and intellectual capital, as well as some academic papers discussing their effectiveness. From this analysis, it has been possible to note that, whilst a variety of models to measure and value these resources still exists, in terms of reporting two are the most valuable solutions, i.e. the WICI Intangibles Reporting Framework and the International <IR> Framework. Despite quite recent, the former has already resulted to be a valuable tool to support companies in that it provides a reporting structure and KPIs articulated by industry. The latter has been – amid other things – an efficient instrument to ‘revitalise’ the attention of managers towards the relevance of intangible capitals.

1717
THE STUDIES ON INTANGIBLES REPORTING BY THE EUROPEAN COMMISSION, THE OECD AND THE EFFAS
Over the last 19 years, the European Commission (EC) has tendered studies and set up expert groups devoted to various economic, valuation and institutional issues in the area of intangibles and intellectual capital. In the 2003 EC Study devoted to the measurement of intangible assets, the Expert Group concludes that the priority of European policy should be not so much to define policies to increase individual intangible assets in the European economy, but rather to make intangibles explicit, in the sense of defining sure rules and conventions for their measurement, as well as clear administrative instruments in order to penalise those who do not follow the rules.
In the 2006 EC Study known with the acronym “RICARDIS” devoted to research-based SMEs and their accounting problems linked to the lack of information on their intellectual capital in traditional accounting, the Expert Group arrives to the conclusion that the use of IC Reporting as a management and reporting tool can help to counter these accounting failures. Then, creating more transparency, both externally and within enterprises, about the role of intellectual capital and complementary assets in successful innovation will lead to a better understanding of value creation by research-intensive SMEs and provide a better basis for decision-making to managers and investors. Accordingly, appropriate policies should be designed by the EC.
In the 2017 EC Study concerning the importance of intangibles in today’s European economy, Thum-Thysen et al. (2017) from the staff of the European Commission state that there is a need to enlarge the general understanding of knowledge creation and to further improve the measurement of intangible assets in order to allow sound and evidence-based policy support. In particular, the EC’s authors state that: “Also important is an improvement of systematic reporting of investments in all relevant intangibles and as a driver of value creation for individual firms. This may also facilitate getting access to finance (capitalised intangibles might be used as collateral), improve corporate governance and market transparency. In fact, evidence suggests that the market value of a firm tends to be increasingly driven by its productive stock of intangibles than by the firm’s tangible assets. Policy can help by suggesting new standards for accounting and corporate disclosure”.
Since 2008, the OECD (Organisation for Economic Cooperation and Development) has also published some significant studies in the field of accounting for and reporting on intangibles, providing some clear policy indications for standard setters, policymakers, audit firms and professionals, companies and investors. In particular, in the 2012 Study OECD observes that “the importance of intangible resources and the difficulty of accounting for them were raised and has grown steadily ever since. … Recent years have even seen the rise of a ‘conceptual company’, characterised by low relevance of physical assets in favour of intangible intensive activities”. Moreover, “the ability to incorporate Intellectual Assets in current accounting frameworks appears to be limited and hence, the value relevance of accounting information has deteriorated, especially in sectors characterised by high intangible capital. This observation raises serious questions about the continued relevance of financial reporting and places growing expectations on non-financial reporting to bridge the information gap.” This situation occurs notwithstanding the fact that “the methodologies for measurement and reporting on intangible assets are abundant.”
In 2013, the OECD reiterates a similar approach by stating that “while attention has focused on integrated reporting and environmental, social and governance (ESG) reporting, better reporting of corporate spending on, and benefits from, intangibles/Knowledge-Based Capital (KBC) is also important to the broader debate on improving the quality of corporate reporting…. Indeed, despite the fact that the value of many of the world’s most successful companies resides almost entirely in their intangibles, corporate reports provide only limited information on these”. However, “a significant challenge for promoting reporting of KBC is the lack of standardisation of reporting methodologies and the variety of key performance indicators reported by companies. Although full harmonisation of reporting standards is neither feasible nor necessarily beneficial (because of sectoral idiosyncrasies), policy-makers could help promote comparability and consistency.”
In 2008, the European Federation of Financial Analysts’ Societies (EFFAS) has published a short but very significant document titled “Principles for Effective Communication of Intellectual Capital”, where the European financial analysts set the ten principles that companies should follow when they disclose information on their Intellectual Capital. Many of the principles regard several reporting aspects. For example, standardisation of the methodology, reliability of the information disclosed, and consistency over time appear clearly related to reporting issues. Also, the first principle, i.e. the clear link to the company’s value creation, refers to the relevance of the delivered information on intellectual capital.
1818
CONCLUDING REMARKS
Intangibles do not represent a new issue per se, but today it has acquired a fundamental economic prominence at both macro and micro level. Companies have become more and more “conceptual”, as OECD (2012) has evidenced, i.e. they tend to have negligible physical assets (property, plant and equipment, and inventories); they are intangibles-intensive (R&D, brands, alliances, human resources, organisational capital); they utilise a strong patent/trademark protection; they operate with an extensive outsourcing of manufacturing, distribution and other low-knowledge functions; they extensively trade in intellectual property (patent sale and licensing, know-how sale); and they run flexible business models. In being “conceptual”, a company can grant significant rewards, such as the scalability of operations, that is limited only by demand (e.g. drug sales); virtually zero marginal costs (e.g. search engines); network externalities (e.g. Microsoft operating system); and the “locking-in” of customers with high switching costs (e.g. airlines’ loyalty programs). But also the risks are very high: think of the heavy, largely irreversible sunk-costs, the property rights that on most intangibles are either non-existent (human capital) or hard to enforce (know-how), or the unlicensed use of technology.
Investment in intangibles is associated with high levels of uncertainty. Further, while there is evidence that investment in intangibles leads to innovation and tangible investment, there is a time lag between intangible investments and economic benefits (intangible investment occurs early in the product life cycle).
Over the review, we have examined a large number of academic works dealing with the reporting of unaccounted intangibles, also through the lens of the intellectual capital studies. In general terms, from the academic literature review carried out, it can be synthetically concluded that:
• Information on unaccounted intangibles tends to be directly and positively correlated with company performance and cash flows;
• Information on unaccounted intangibles tends to be associated with the market value of companies, and indeed these resources are (partially) explicative of this value over time (i.e. they are value relevant);
• Information on unaccounted intangibles tends to be well received and useful to users and, in particular, to financial analysts and investors.
While the Sections from B to D of this literature review have helped us to define the contents and the contours of the problem “accounting and reporting for intangibles”, Section E has illustrated some potential solutions that have been elaborated in the academic literature and by the international specialised organisations (WICI and IIRC). However, it is fair to say that to date none of these potential solutions seems to have found a large rate of adoption by companies, investors and professionals.
As to the accounting treatment of intangibles, we have seen that the positions in the academic literature are much diversified. According to Lev (2001) and Lev and Gu (2016), there are serious economic consequences for the firm from the poor accounting treatment of intangibles. Indeed, the mismeasurement of intangibles at the company level has adverse economic effects in terms of:
• The level of information asymmetry concerning a firm (volatility of share prices and insider trading);
• The Internal/Management information systems and decision making;
• The accountability of management for actions/decisions in managing the firm’s resources;
• The lack of data for analysis and rational external resource allocation and investment decisions.
Hence, still following Lev (2001) and Lev and Gu (2016), this situation, where intangibles are unaccounted for and – in the best of cases – the related expenditures are treated as a cost rather as an investment, has negative consequences for:
• value measures (e.g. market-to-book ratio) that are biased;
• performance measures (ROE, ROA, EVA) that are deceiving; and
• the prediction of future earnings and cash flows, that is largely flawed.

1919
Also, internal corporate resource allocation may be seriously distorted by deficient information about intangibles.
On the other hand, different authors point out that the effect of intangibles on corporate value creation can be seen in the Income Statement (Penman, 2009), that investors and financial analysts are happy already with the information they have (Skinner, 2008), that this possible accounting change would provide a further occasion for managerial manipulation of earnings and information, and that such a change is very difficult and nobody really wants it.
Another possible solution refers to financial statement disclosure and/or narrative reporting (e.g. management commentary), possibly recurring to ad hoc KPIs for measuring intangibles in the different industries and contexts. However, also in this case, there are positive aspects (more extended information on these resources), but also negative ones, such as the lack of a unified and uniform methodology for the KPI calculation and the provision of information, and the difficult comparability of the resulting data and disclosure.
The review has shown that there are some promising attempts to develop intangibles reporting outside financial reporting, i.e. in integrated reports. The WICI Framework is compatible with the <IR> Framework just in order to facilitate this approach. Yet, we face serious issues of consistency in measurement and disclosure, and hence of comparability.
In closing, echoing the 2003 Study for the European Commission illustrated above, we face a major paradox: the more the economic and corporate system is based on intangible assets, which are its “glue” and “engine”, the stronger the system is, because intangibles are major determinants of growth and value creation. However, at the same time, the more the system is grounded on intangibles, the more vulnerable it becomes because intangibles are more uncertain, unstable and risky. The challenge we accountants face is to learn how to manage and report on these “invisible” resources for a better understanding of organisations’ financial performance and their resilience. After all, intangibles are an issue we have to take into account for many years ahead.

2020
The economic relevance of intangibles is nowadays universally accepted. They represent the foundations of businesses and economic systems, as it was recognised already in 1904 by Prof. Thorstein Veblen (University of Chicago), when he stated “The substantial foundation of the industrial corporation is its immaterial assets” and “All capital … is subjected to an interminable process of valuation and revaluation … on the basis of its presumptive earning-capacity, whereby it all assumes more or less of a character of intangibility”. Therefore, intangibles have been a feature of businesses for quite some time. What has changed is the relative weight that intangibles have taken on in the last twenty years or so in the economic life of companies, public sector organisations, territories, countries and regions.
However, it is also true that intangibles are elusive and multi-faceted, as well as unstable, uncertain and risky in many respects, which make them difficult to document, represent and measure. As a consequence, even though the economic relevance of intangible assets is unanimously accepted, the delicate and complex issue of the accounting for, the valuation of, and the disclosure on intangibles remains contested.
In light of the above, it does not come as a surprise that intangibles have attracted the attention of many scholars that have extensively studied and researched intangibles according to different content perspectives, approaches and methodologies. Accordingly, the scientific literature on these resources and their function is very large (more than 4,000 pieces), and it continues to expand.
It is crucial to underline that the aim of the present academic literature review is to respond to the needs of the European Financial Reporting Advisory Group (EFRAG), and more generally, to be relevant for a non-academic audience. In terms of scope, the literature review is not aimed providing recommendations on how to provide additional information on intangibles in the financial statements.
Indeed, the focus of this review will be on internally generated intangibles that are not purchased separately or in business combinations, because that subset of intangibles has already been addressed by financial reporting standards. Also not separable intangibles (e.g. reputation, business model, and human capital) will be considered in this work owing to their relevance for companies and their value creation broadly conceived.
The review will concentrate to the extent possible on quantitative – but considering also relevant qualitative – papers published from 2007 onwards. The papers selected for the review are those analysing the capability of intangible resources that are internally developed by entities to contribute to the entity’s financial performance (current profit, future earnings and cash flows) and its financial market value, as well as the view by investors and financial analysts, focusing on information outside financial statements. It is important to underline that the quality of the papers considered comes from the reliance on their publishing in double-blind refereed journals, which is deemed to assure their scientific soundness, or in international books. For this reason, working papers or papers not published in scientific journals have not been considered. In addition to this, the quality of the works reviewed is assessed by their selection methodology, which is based on the scientific impact of each paper on the literature measured with the number of citations received divided by the number of years from publication: only the research products that have received the highest score will be examined. A more detailed explanation is set out in Chapter 2. A further number of papers that have been judged of interest by EFRAG team and experts of the field enriches this first bunch of works, for a total amount of more than 100 papers scrutinised.
A general limitation is that not many companies produce information and numbers on unaccounted intangibles, and this lack of data limits the academic research in this area.
CHAPTER 1: INTRODUCTION

2121
Another general warning relates to the inconsistent and discontinuous terminology that is used in the papers analysed. A reader may find confusing the diversity of terms used to describe these resources such as “intangibles”, “intangible assets”, “intellectual capital”, “intellectual asset”, “intangible resource” and “intangible capital”. It is not an aim of this review to introduce common definitions for each of these concepts, because in the literature there is no consensus on their meaning. In very general terms, when the term “assets” is employed there may be an implicit reference to accounting-recognised resources, whilst the concept of “intellectual capital” is wider (see in Ch. 8 its definition provided by the WICI Framework) and the term “intangibles” is a generic one (it may include either positive or negative intangible resources).
A final point regarding the generalisability of the conclusions reached by the works analysed may be useful. Each of the papers examined in depth deals with one or more categories of intangibles and adopts a certain methodology. Therefore, the outcomes of each paper cannot necessarily be expanded to other categories of, or issues linked to, intangibles. A certain amount of caution is hence recommended in extending the conclusions of the papers considered in this review outside the scope that each of them sets at the beginning.
The following Chapter will present how this academic literature review is organised, its characteristics and the methodology followed to select the papers taken into consideration for this exercise.

2222
THE INVESTIGATED AREASThis literature review has analysed papers relevant to five main research areas:
A) Intangibles in a macro-perspective;
B) Unaccounted intangibles and their impact on the relevance of financial reporting;
C) Information on specific unaccounted intangibles and their impact on company performance, market value, and users;
D) Information on intellectual capital and its effects on company performance, market value, and users;
E) Frameworks and models for measuring and reporting on intangibles and their consequences on company performance, market value, and users.
Section A) includes a short examination of the research works from a macro-perspective. The following topics are covered: intangibles related to the productivity and growth of countries, innovation and intellectual property, big data and digitalisation. A clear distinction between these areas is not always possible, thus there is some overlap. This section serves as a general introduction to the systemic importance of intangibles in today’s economic systems.
Section B) illustrates the various aspects of the impact of intangibles on the relevance of financial reporting and company value. The section embraces an analysis of the papers that deal with the following topics: the role of accounting standards in the recognition and reporting of intangibles and the allegedly deteriorating information quality of financial reporting; the factors influencing the voluntary disclosure on intangibles in financial reporting; and the association of intangibles with firm financial performance and/or value.
Section C) provides a review of the papers concerning the disclosure (including narrative) of the impact of specific internally generated intangibles (such as brands, patents, goodwill, customer list, reputation, R&D, customer satisfaction, business model, and human capital) on three fundamental elements, i.e. firm profitability and cash flows, market value and positioning, and investors and information users. Inquiries into the specific risks connected to these intangibles is also included.
Section D) covers papers adopting a holistic approach to intangibles, covering also the large research literature on Intellectual Capital. The papers considered are those that investigate the effects of the disclosure (including narrative) on intellectual capital as a whole – or of significant groups of items (i.e. relational, organisational and/or human capitals) – on firm profitability and cash flows, market value and share as well as competitive positioning, and investors and information users. Works on the corporate risks linked to intellectual capital are also considered.
Section E) is devoted to the outside-traditional-accounting measurement and reporting models and frameworks for intangibles and intellectual capital (e.g. VAIC, intellectual capital statements, balanced scorecard, integrated reporting, WICI Framework) and their consequences for firm market value and positioning as well as its relationships with investors and financial analysts.
Before entering the analysis of the above five areas, the review will consider six significant scholarly works of the intangibles-related literature published in the pre-2007 period, by producing a brief outline of the main results of these older – but still relevant – studies.
In the final Chapter, a synthesis of the seven major studies published on this subject by the European Commission in the period 2000-2017 is provided, as well as a summary of the five works OECD has issued in this area and the EFFAS document on the “Principles for effective communication of intellectual capital”.
A conclusive Chapter will draw this review to an end.
In the following Chapter, the methodology used for the review is outlined.
CHAPTER 2: CONTENTS, ARCHITECTURE, METHODOLOGY AND CHARACTERISTICS OF THE LITERATURE REVIEW

2323
THE METHODOLOGY OF THE REVIEWThe methodology followed for selecting the most relevant papers on intangibles is composed of two parts:
• A 1st step devoted to a rigorous selection based on bibliographical features of the academic works, drawing on papers’ key-words and the most recognised international bibliographical databases, with the aim of detecting the papers that have received the largest annual citations in the literature, conceived as a proxy for the scientific importance of the work considered (cf. section 2.2.1 below);
• A 2nd step that is based on the EFRAG’s request and suggestions, along with expert judgements, in which some other papers on intangibles were introduced in the review, owing to their perceived relevance by the EFRAG team and a number of academics and field specialists (cf. chapter 2.2.2 below).
To start off, a search of academic journal papers listed in Scopus and ISIWeb has revealed that, as of the beginning of January 2019, only a dozen of documents that contain “endogenous intangible” OR “internally generated intangible” in the title, keywords and abstract, were published during the last ten years.
Such result appears quite surprising if we consider the relevance intangibles resources have for both academia and practice. A possible explanation of these results could be related to the use of a different language/labels and keywords by studies on internally generated intangibles. Indeed, the category of internally generated intangibles comes from that accounting stream of research that makes a distinction between intangibles that are generated by the company and that are in general out of the scope of financial accounting, and all the others, that is those that a company can acquire and control through market transactions and that are treated according to accounting standards.
A search on intangibles and resources broadly conceived yields quite different results. For instance, a search based on “intangible AND (“market value” OR “cash flow” OR “earning”) in the title, keywords and abstract, returns around 800 documents published during the last ten years. However, searching for studies on two specific intangibles, that is “brand” and “reputation” (together with “market value” OR “cash flow” OR “earning”), gives back about 900 documents. An even broader search, where “market value” OR “cash flow” OR “earning” were included together with “resource” returned more than 4,000 documents.
From the results outlined above, the following considerations emerge: a) the part of the review of the literature on “internally generated intangible” should be based on language/labels ‘outside’ the accounting area; b) the analysis should be based both on specific intangibles, such as brand, customer list and reputation, and on general categories of intangibles, as “resource”. In the latter case, however, the distinction between tangible and intangible resources must be considered; and c) we expect that the most significant part of the papers may derive from research areas different from traditional accounting, such as strategic management, intellectual capital and non-financial and integrated reporting.
In consideration of the above observations, the literature review has been carried out in two main steps, the first one aiming at identifying a consistent number of relevant articles, and the second one pointing at a careful selection of the papers found in the first step. The two steps are described below.
The first step: the identification of academically relevant articles
The first step started with the searching of relevant academic papers and articles to review. We selected articles and papers collected from three sources of documents, namely Scopus, ISIWeb and Google Scholar. The three sources have different characteristics. Scopus and ISIWeb are focused on academic journals. However, some of these journals are covered only by one of the two. Using both was a way to cover all existing academic journals. The review was restricted to articles available in English. Google Scholar, on the contrary, covers also publications different from academic ones. It can, therefore, help examine significant non-peer reviewed works published in practitioners’ magazines, newspapers and government reports (Serenko and Bontis, 2013).

2424
The five areas of the literature review overlap because they deal in general with the same broad topic (intangible assets). To minimise the overlap we performed the search of documents employing specific keywords for each of the five areas of the review (see Table 1).
Table 2.1 - Keywords for the search of articles and papers
The keywords were searched in abstracts, titles and authors’ supplied keyword of papers contained in the three sources. The outcomes of this search per each database are provided in Appendix 1.
In the searching process, preference was given to European-centred studies, but also non-European papers will be considered, especially if thought material (see below for a definition).
To ensure that the literature review reflects the most recent results in the area, we decided:
1) To restrict the analysis to papers published in the last decade or so. Therefore, we focussed the search on papers published since 2007. However, we decided to select also some relevant papers published before that date and used some relevant literature review published before 2007 to convey information on papers published before the period under investigation. A synthesis of literature reviews on intangibles published before that period (Cañibano et al., 2000; Petty and Guthrie, 2010) as well as other previous relevant research contributions (e.g. Lev, 2001) are therefore included to the extent they are consistent with the aims of the present review, in order to provide a picture as wide and long-term as possible.
2) To restrict the number of papers to select on the basis of their significance to the scientific literature. It is well-known that an objective measure of the relevance of the research is far to be reached. However, following the literature (Webster and Watson, 2002; Boote and Beile, 2005; Torraco, 2005; Cronin et al., 2008; Onwuegbuzie et al., 2012; Baker, 2016; Massaro et al., 2016), we decided to rely on the number of citations of each paper (as reported by Scopus, ISIWeb and Google Scholar) to identify the documents to select. As it is well known that articles and documents can be cited not because of their content, but for other ‘political’ reasons (MacRoberts and MacRoberts, 1989; Serenko and Dumay, 2015a, 2015b), we also perform the analysis controlling for self-citations. Due to the different dates of publications, the number of citations is usually a biased indicator of the relevance of the papers, as papers published years ago having more chance to be cited than papers published recently. To check for such bias, we normalised the citations per paper on the basis of the years since the publication. The number of citations per year we obtained is
AREAS OF ANALYSISFUNDAMENTAL KEYWORDS USED FOR SEARCHING ARTICLES AND PAPERS
NO. OF PAPERS ANALYSED IN-DEPTH/ NO. OF PAPERS SELECTED
A) Intangibles in a macro-perspective productivity and growth of countries, innovation and intellectual property, big data and digitalisation
13/54
B) Unaccounted intangibles and their impact on the value relevance of financial reporting
price-to-book value ratio, the value relevance of intangibles, unaccounted intangibles, information quality of financial reporting
17/44
C) Information on specific unaccounted intangibles and their impact on company performance, market value, and users
brands, patents, customer list, reputation, R&D, customer satisfaction, business model, human capital, firm profitability and cash flows, market value and information users
35/98
D) Information on intellectual capital and its effects on company performance, market value, and users
Disclosure, intangibles, intellectual capital; firm profitability, cash flows, market value, corporate risk, users
24/93
E) Frameworks and models for measuring and reporting on intangibles and their consequences on company performance, market value, and users.
VAIC, intellectual capital statements, balanced scorecard, integrated reporting, WICI Framework, firm value, financial performance
17/46

2525
strongly correlated with the number of total citations (i.e. the number of citations independently from the publication year). In fact, the correlation coefficient between the Total Number of Citations and the Number of Citations per Year is = 0,936 and is statistically significant (t = 46.4201, p-value = 0.0000). This statistic means that using either the Total Number of Citations or the Number of Citations per Year does not lead to an order that differs in a significant way.
We analysed in-depth 25% to 38% (in total 106 out of 335, i.e. 31.6%) of the papers belonging to the five areas and selected in the first methodological step, depending on the number of citations reached by papers and the specificities of each area (see Table 1).
All the selected documents are analysed for their content and other characteristics such as author(s), author’s nationality, journal, and year. Following the typical scheme of academic papers (de Villiers & Dumay, 2013), the analysis of the contents is classified according to the following aspects:
• aim of the paper;
• time-span of the analysis;
• number of observations;
• country/ies considered;
• industry/ies examined;
• research question(s);
• theory or theories which the author(s) refer(s) to/employ(s);
• methodology of analysis;
• dependent variable(s);
• independent variables;
• control variables;
• key findings and evidence.
On the basis of the above first step, the research team created a large and focussed database in excel, where all the above-mentioned information for each of the papers selected using the methodology described was collected in an orderly way and made available to EFRAG.
The second step: the selection of and the focus on academically relevant articles
The second step aimed at a further selection of the papers identified in the first step. In this second step, some calls with EFRAG and reflections with experts helped us to:
1) Reduce the number of papers of each area to be submitted to an in-depth analysis;
2) Delete some of the selected papers lying outside the interest of EFRAG;
3) Add some papers that were not collected/selected in the first step of the methodology, owing to their low number of citations and/or the different keywords employed by these papers, following the requests from EFRAG and the signalling of some academics and specialists.
The second step of the review has indeed aimed at supporting and improving the investigation grounded on the keyword-based search. In fact, the search through keywords, even though accompanied by the analysis of the citations (or, rectius, the citations per year), can miss some important papers, due to their falling outside the perimeter of the analysis (e.g. use of different keywords).

2626
“Expert judgment” was applied in this step consistent with the methodology, and it served to strengthen the analysis. This enabled a more comprehensive and functional identification of papers that otherwise would have remained outside the scope of the exercise. In particular, when a literature review is requested to explicitly address a specific interest of the caller, the second step of the review serves also to take into consideration some papers, before ignored, that could be of interest, or alternatively to leave out some papers appearing as promising in the course of the first step.
An ad hoc section devoted to the European Commission’s most important studies on intangibles, as well as the OECD research papers in the subject area and a relevant EFFAS publication, has also been included (Chapter 9).
REFERENCESBaker, J. D. (2016), “The purpose, process, and methods of writing a literature review”, AORN Journal, Vol. 103, No. 3, pp. 265-
269.
Boote, D. N. and Beile, P. (2005), “Scholars before researchers: On the centrality of the dissertation literature review in research preparation”, Educational researcher, Vol. 34, No. 6, pp. 3-15.
Cañibano, L., Garcia-Ayuso, M. and Sanchez, P. (2000), “Accounting for intangibles: a literature review”, Journal of Accounting Literature, Vol. 19, pp. 102-130.
Cronin, P., Ryan, F. and Coughlan, M. (2008), “Undertaking a literature review: a step-by-step approach”, British journal of nursing, Vol. 17, No. 1, pp. 38-43.
Lev, B. (2001), Intangibles: Management, measurement, and reporting, Brookings Institution Press.
MacRoberts, M. H. and MacRoberts, B. R. (1989), “Problems of citation analysis: A critical review”, Journal of the American Society for Information Science, Vol. 40, No. 5, pp. 342-349.
Massaro, M., Dumay, J. and Guthrie, J. (2016), “On the shoulders of giants: undertaking a structured literature review in accounting”, Accounting, Auditing & Accountability Journal, Vol. 29 No. 5, pp. 767-801.
Onwuegbuzie, A. J., Leech, N. L. and Collins, K. M. (2012), “Qualitative analysis techniques for the review of the literature”, The qualitative report, Vol. 17, No. 28, pp. 1-28.
Serenko, A. and Bontis, N. (2013), “The intellectual core and impact of the knowledge management academic discipline”, Journal of Knowledge Management, Vol. 17, No. 1, pp. 137-155.
Serenko, A. and Dumay, J. (2015a), “Citation classics published in knowledge management journals. Part I: articles and their characteristics”, Journal of Knowledge Management, Vol. 19, No. 2, pp. 401-431.
Serenko, A. and Dumay, J. (2015b), “Citation classics published in Knowledge Management journals. Part II: studying research trends and discovering the Google Scholar Effect”, Journal of Knowledge Management, Vol. 19, No. 6, pp. 1335-1355.
Torraco, R. J. (2005), “Writing integrative literature reviews: Guidelines and examples”, Human resource development review, Vol. 4, No. 3, pp. 356-367.
Webster, J. and Watson, R. T. (2002), “Analyzing the past to prepare for the future: writing a literature review”, MIS Q., Vol. 26, No. 2, pp. xiii-xxiii.
Zéghal, D. and Maaloul, A. (2010), “Analysing value added as an indicator of intellectual capital and its consequences on company performance”, Journal of Intellectual Capital, Vol. 11, No. 1, pp. 39-60.
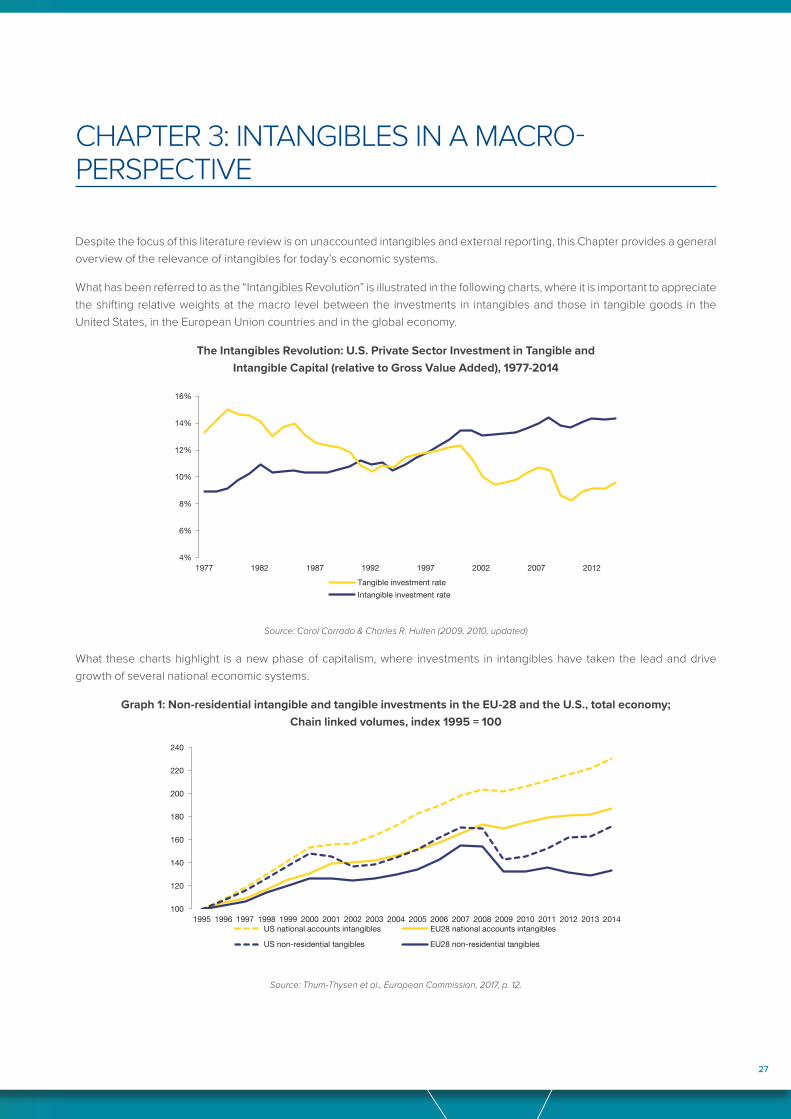
2727
Despite the focus of this literature review is on unaccounted intangibles and external reporting, this Chapter provides a general overview of the relevance of intangibles for today’s economic systems.
What has been referred to as the “Intangibles Revolution” is illustrated in the following charts, where it is important to appreciate the shifting relative weights at the macro level between the investments in intangibles and those in tangible goods in the United States, in the European Union countries and in the global economy.
The Intangibles Revolution: U.S. Private Sector Investment in Tangible and Intangible Capital (relative to Gross Value Added), 1977-2014
4%
6%
8%
10%
12%
14%
16%
1977 1982 1987 1992 1997 2002 2007 2012
Tangible investment rateIntangible investment rate
Source: Carol Corrado & Charles R. Hulten (2009, 2010, updated)
What these charts highlight is a new phase of capitalism, where investments in intangibles have taken the lead and drive growth of several national economic systems.
Graph 1: Non-residential intangible and tangible investments in the EU-28 and the U.S., total economy; Chain linked volumes, index 1995 = 100
100
120
140
160
180
200
220
240
1995 1996 1997 1998 1999 2000 2001 2002 2003 2004 2005 2006 2007 2008 2009 2010 2011 2012 2013 2014US national accounts intangibles EU28 national accounts intangibles
US non-residential tangibles EU28 non-residential tangibles
Source: Thum-Thysen et al., European Commission, 2017, p. 12.
CHAPTER 3: INTANGIBLES IN A MACRO-PERSPECTIVE

2828
Figure – Tangible and intangible investment shares of GDP (US + EU11 for the whole economy)
.1
.11
.12
.13
.14
1995 2000 2005
(Shares of GDP, US+EU11, whole-economy)
2010 2015
Tangible shareIntangible share
Shar
ess
of G
DP
Note: GDP (Gross Domestic Product) adjusted to include intangibles.Source: Haskel and Westlake, 2018.
Furthermore, investments in intangible assets are increasing more dynamically than investments in (non-residential) tangible assets. In particular, the second graph illustrates that over the past two decades, the volume of annual Gross Fixed Capital Formation (GFCF) in intellectual property products increased by 130% in the US and 87% in the EU-28. By comparison, the volume of tangible non-residential investments in the US stands at 70% above the level of 1995 and increased by only 30% in the EU. It appears remarkable that investments in intangible assets were, in general, significantly less affected by the economic crisis that started in 2008 (Thum-Thysen et al. 2017, p. 12 – see also below para. 9.2).
Indeed, this emerging trend has been more significant in some specific European nations and regions, such as the UK, Germany, France and the Scandinavian countries, as it is illustrated in the following tables.
Tangible and intangible shares of GDP
0
.05
.1
.15
.2
ES IT DE AT DK NL FR UK EI US SE
(Averages, 1999-2013)
TangibleIntangible
Shar
es o
f GDP
Note: Ranked by intangible share. GDP adjusted to include intangibles. Data for whole economy..Source: Haskel and Westlake, 2017 (GDP: Gross Domestic Product).

2929
Graph 2: Investment in business sector intangible assets in EU-15 [2013, million Euros], according to different accounting standards
0
20.000
40.000
60.000
80.000
100.000
120.000
140.000
160.000
180.000
200.000
BEAT DK FI FR DE EL IE IT LU NL PT ES SE UK
ESA 2010ESA 95 Intangible
Note: Business sector defined as NACE Rev. 2 activities A to N (excluding L) plus R and S. Investments according to ESA 95 were obtained from ESA 2010 (NA-intangibles) diminished by investment in R&D
Source: Thum-Thysen et al., 2017, p. 13 (ESA: European System of Accounts; INTAN: The INTAN-Invest.net database - www.intan-invest.net - is a harmonised database on macro-economic intangibles across a selection of countries,
which comprises also estimates of the value of intangibles not included in the NA-National Accounts).
Graph 4: Business sector non-residential GFCF by asset type, average 1995 to 2013 (% of business sector GVA)
0
5
10
15
20
25
30
USEU15 AT BE DE DK EL ES FI FR IE IT LU NL PT SE UK
Intangible assets not included in NAIntangible assets included in NANon-residential tangible assets
Note: Business sector defined as NACE Rev. 2 activities A to N (excluding L) plus R and S. US: average 1997 - 2013.Source: Thum-Thysen et al., 2017, p. 14 (NA: National Accounts; NACE: statistical classification of economic activities in the EU that is provided by Eurostat).

3030
UK country – Knowledge investment by firms for future returns: Software, Creative works, R&D, Designs, Business organisation / processes, Workplace skills, Reputation / brands
0
50
100
150
200
250
1990 1995 2000 2005 2010 2011
TangibleIntangible
UK
£ bi
llion
nom
inal
Source: Goodridge et al., 2014
The European Central Bank (ECB) has also entered this debate, and it has produced in 2018 a Special Report on “Investment in Intangible Assets in the Euro Area”, where some insightful charts are included. The ECB starts from recognising that investment in intangible assets has increased in importance in the euro area, both in absolute terms and relative to tangible assets, with several factors contributing to that development. In the euro area countries and other advanced economies, investment in intangibles has grown strongly in recent decades. In particular, from Chart A we can see that over the last 20 years, growth in intellectual property products – a group of intangible assets included in the national accounts – has outpaced growth in intangible investment in the euro area, making a significant contribution to the annual growth in its total (non-construction) investment. The fact that the growth rate of intangibles is higher than that of tangibles is being driven by factors such as the increase in global competition, the sectoral shift from industry to services, the expansion of the digital economy, changing international specialisations in the area of production, new business models (e.g. for tax optimisation purposes) and general technological advances.
Chart A - Intangible investment as a percentage of total investment (expressed in percentages)
1
2
3
4
5
6
0
5
10
15
20
25
1995 1997 1999 2001 2003 2005 2007 2009 2011 2013 2015 2017Euro areaFrance
GermanyItaly
SpainIreland (right-hand scale)
Notes: Here, “intangible investment” refers to intellectual property products included in the national accounts. Volatility in Irish and Dutch data, which is mainly due to intellectual property-related transactions conducted by large multinational companies, makes a significant contribution to fluctuations in euro area data
Sources: Eurostat and ECB calculations.
The ECB recognises that the specific nature of intangible assets poses challenges as regards the measurement of activity, profits and capital stock, as well as the distribution of productivity across firms. Measurement issues relating to activity stem from the fact that such assets are generally regarded as firm-specific intermediate consumption rather than investment in firms’

3131
balance sheets, and they remain underreported in the national accounts to some extent. For example, these accounts do not cover human capital, the knowledge contained in databases, organisational capital and brands.
Although the percentage of intangible assets that are reported in firms’ annual accounts is gradually increasing, particularly in the service sector (see Chart D), the underreporting of intangible assets could mean that real output is also being underreported. Moreover, the classification of intangibles as expenses to be deducted from earnings – as opposed to assets – is weighing on profits.
Chart D - Intensity of investments in intangibles in the euro area (median values)
0.0
0.2
0.4
0.6
0.8
1.0
2000 2001 2002 2003 2004 2005 2006 2007 2009 2011 2013 20152008 2010 2012 2014 2016 2017ServicesCommunication
ManufacturingTrade
TransportConstruction
Note: This chart shows the ratio of intangible fixed assets to tangible and intangible fixed assets at book value.Source: Worldscope (listed euro area firms).
There is plenty of evidence that this macro-economic phenomenon has nowadays become quite extensive, and it appears to characterise a new economic phase that has been incisively defined as “capitalism without capital” (Haskel and Westlake, 2017): financial and physical capitals remain important, but intangibles and intellectually-derived resources mark a new phase in the capitalism, with a new way to produce wealth and growth.
Along this line, it is interesting also to observe at the industry level that the US banking system is rapidly moving towards the use of intangibles as loan collateral, i.e. in the direction of the securitization of intangibles, especially intellectual property (IP). This is clearly shown by the following table.
Top Financing Entities - giving IP Backed Loans between 2011-2016
0
10,000
20,000
30,000
40,000
50,000
60,000
70,000
No.
of a
pplic
atio
ns
BANK
OF
AMER
ICA
JP M
ORGA
N CH
ASE
MOR
GAN
STAN
LEY
WEL
LS F
ARGO
CITI
DEUT
SCHE
BAN
K
WIL
MIN
GTON
TRU
ST
BANK
OF
NEW
YOR
K M
ELLO
N (B
NY M
ELLO
N)
SILI
CON
VALL
EY B
ANK
CRED
IT S
UISS
E
BARC
LAYS
PNC
BANK
SCOT
IABA
NK
ROYA
L BA
NK O
F CA
NADA
US B
ANK
GE C
APIT
AL
ANTA
RES
CAPI
TAL
GOLD
MAN
SAC
HS
COM
ERIC
A
HSBC
60,093Count 45,304 24,244 19,001 14,651 14,583 13,969 11,462 10,890 9,987 7,544 6,249 5,990 5,288 5,014 4,176 3,296 3,164 3,039 2,953
16.87
Total number of transactions between 2011 to 2016 are 947,907 transactions comprising of 356,287 applications
Share of transactions (%)
12.72 6.80 5.33 4.11 4.09 3.92 3.22 3.06 2.80 2.12 1.75 1.68 1.48 1.41 1.17 0.93 0.89 0.85 0.83
Source: IP CloseUp, 24 July 2017 (https://ipcloseup.com/2017/07/24/bofa-jpmchase-morgan-stanley-are-top-banks-for-patent-loans/).
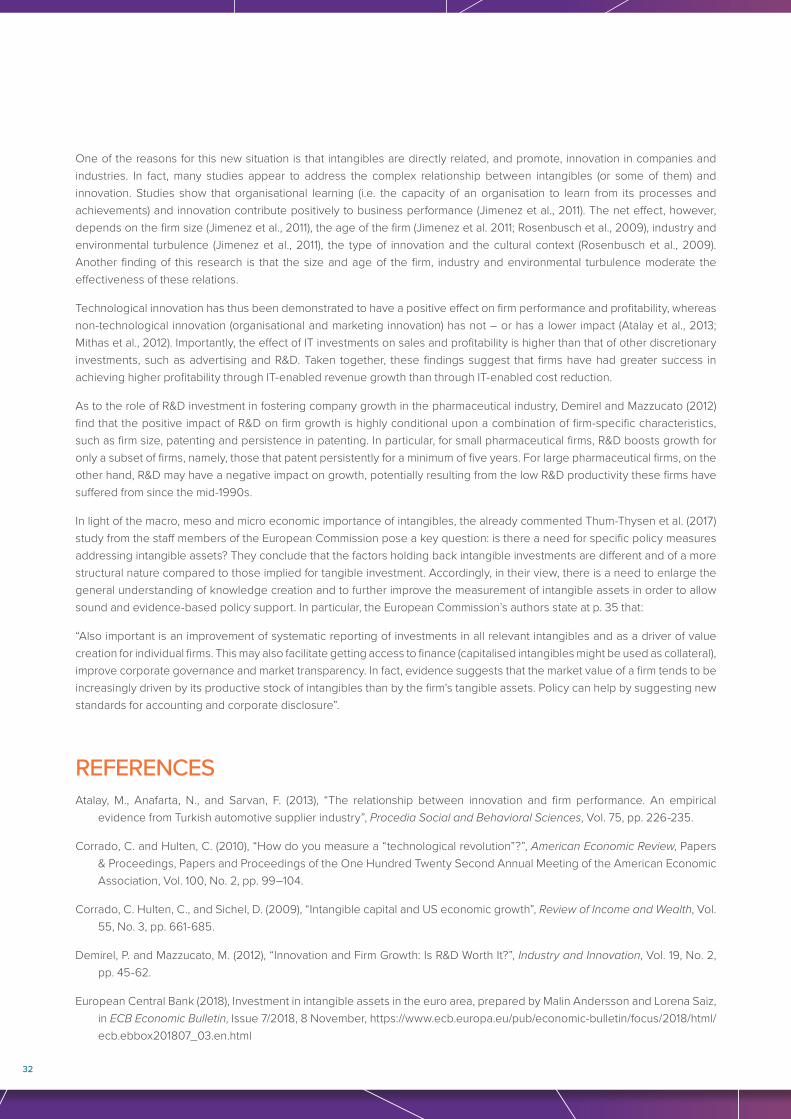
32
One of the reasons for this new situation is that intangibles are directly related, and promote, innovation in companies and industries. In fact, many studies appear to address the complex relationship between intangibles (or some of them) and innovation. Studies show that organisational learning (i.e. the capacity of an organisation to learn from its processes and achievements) and innovation contribute positively to business performance (Jimenez et al., 2011). The net effect, however, depends on the firm size (Jimenez et al., 2011), the age of the firm (Jimenez et al. 2011; Rosenbusch et al., 2009), industry and environmental turbulence (Jimenez et al., 2011), the type of innovation and the cultural context (Rosenbusch et al., 2009). Another finding of this research is that the size and age of the firm, industry and environmental turbulence moderate the effectiveness of these relations.
Technological innovation has thus been demonstrated to have a positive effect on firm performance and profitability, whereas non-technological innovation (organisational and marketing innovation) has not – or has a lower impact (Atalay et al., 2013; Mithas et al., 2012). Importantly, the effect of IT investments on sales and profitability is higher than that of other discretionary investments, such as advertising and R&D. Taken together, these findings suggest that firms have had greater success in achieving higher profitability through IT-enabled revenue growth than through IT-enabled cost reduction.
As to the role of R&D investment in fostering company growth in the pharmaceutical industry, Demirel and Mazzucato (2012) find that the positive impact of R&D on firm growth is highly conditional upon a combination of firm-specific characteristics, such as firm size, patenting and persistence in patenting. In particular, for small pharmaceutical firms, R&D boosts growth for only a subset of firms, namely, those that patent persistently for a minimum of five years. For large pharmaceutical firms, on the other hand, R&D may have a negative impact on growth, potentially resulting from the low R&D productivity these firms have suffered from since the mid-1990s.
In light of the macro, meso and micro economic importance of intangibles, the already commented Thum-Thysen et al. (2017) study from the staff members of the European Commission pose a key question: is there a need for specific policy measures addressing intangible assets? They conclude that the factors holding back intangible investments are different and of a more structural nature compared to those implied for tangible investment. Accordingly, in their view, there is a need to enlarge the general understanding of knowledge creation and to further improve the measurement of intangible assets in order to allow sound and evidence-based policy support. In particular, the European Commission’s authors state at p. 35 that:
“Also important is an improvement of systematic reporting of investments in all relevant intangibles and as a driver of value creation for individual firms. This may also facilitate getting access to finance (capitalised intangibles might be used as collateral), improve corporate governance and market transparency. In fact, evidence suggests that the market value of a firm tends to be increasingly driven by its productive stock of intangibles than by the firm’s tangible assets. Policy can help by suggesting new standards for accounting and corporate disclosure”.
REFERENCESAtalay, M., Anafarta, N., and Sarvan, F. (2013), “The relationship between innovation and firm performance. An empirical
evidence from Turkish automotive supplier industry”, Procedia Social and Behavioral Sciences, Vol. 75, pp. 226-235.
Corrado, C. and Hulten, C. (2010), “How do you measure a “technological revolution”?”, American Economic Review, Papers & Proceedings, Papers and Proceedings of the One Hundred Twenty Second Annual Meeting of the American Economic Association, Vol. 100, No. 2, pp. 99–104.
Corrado, C. Hulten, C., and Sichel, D. (2009), “Intangible capital and US economic growth”, Review of Income and Wealth, Vol. 55, No. 3, pp. 661-685.
Demirel, P. and Mazzucato, M. (2012), “Innovation and Firm Growth: Is R&D Worth It?”, Industry and Innovation, Vol. 19, No. 2, pp. 45-62.
European Central Bank (2018), Investment in intangible assets in the euro area, prepared by Malin Andersson and Lorena Saiz, in ECB Economic Bulletin, Issue 7/2018, 8 November, https://www.ecb.europa.eu/pub/economic-bulletin/focus/2018/html/ecb.ebbox201807_03.en.html

33
Goodridge, P., Haskel, J., Wallis, G. (2014), Estimating UK Investment in Intangibles and Intellectual Property Rights, The Intellectual Property Office, 30 September.
Haskel, J. and Westlake, S. (2017), Capitalism without Capital – The Rise of the Intangible Economy, Princeton University Press.
Haskel, J. and Westlake, S. (2018), “Productivity and secular stagnation in the intangible economy”, VOX (CEPR Policy Portal), 31 May, https://voxeu.org/article/productivity-and-secular-stagnation-intangible-economy.
Jimenez, D., and Sanz-Valle, R. (2011), “Innovation, organisational learning, and performance”, Journal of Business Research, Vol. 64, No. 4, pp. 408-417.
Mithas, S, Tafti, A., and Bardhan, I. (2012), “Information Technology and firm profitability. Mechanism and empirical evidence”. Mis Quarterly, Vol. 36, No.1, pp. 205-224.
Rosenbusch, N., Brinckmann, J., Bausch, A. (2011), “Is innovation always beneficial A meta-analysis of the relationship between innovation and performance in SMEs”, Journal of Business Venturing, Vol. 26, No. 4, pp. 441-457.
Thum-Thysen, A., Voigt, P., Bilbao-Osorio, B., Maier, C., and Ognyanova, D. (2017), “Unlocking Investment in Intangible Assets, European Economy Discussion Paper 047”, European Commission, Luxembourg: Publications Office of the European Union.

3434
The aim of this Chapter is to review some of the research that, despite falling outside the set timeframe (post-2007), provides key insights for the evolution of this field. Hence, these pre-2007 research pieces have been selected, because they are particularly relevant and well-known in the field as well as widely quoted. In this Chapter, we delineate the historical background of our analysis, showing how the current debate about the reporting of intangibles goes back at least to the beginning of this century.
Cañibano et al. (2000) have probably been the first researchers to conduct a literature review on intangibles. To do so, they investigate the topic taking into consideration different perspectives. Firstly, they find that, although most of the accounting standard setters place greater importance on intangibles, approaches still result to be quite variegated. Hence, financial statements result to be neither comparable nor including relevant information. As for the role of intangibles in investment and credit decision making, they observe that attention has been polarised on the analysis of the value relevance of investments in R&D and advertising, whilst other ones have been overlooked. In general terms, the authors point out that guidelines for the identification, measurement, reporting and management of value relevant intangibles are missing. In addition, they suggest that another field to be further examined is the behaviour of investors vis-à-vis intangibles information.
In the same year, also Petty and Guthrie (2000) have conducted a literature review on intellectual capital. They have articulated it into three main sections, Current major research projects, Empirical research of practice, and Intellectual capital indicators and corporate reporting. They observe that most of the published works on the topic lack of extensive research literature. In addition, they find that works can be mainly divided into two research streams, those primarily concerned with the process of creating and managing intellectual capital and those that intend to better understand its measurement. In terms of methodologies adopted, case studies and surveys represent the majority. They suggest that more studies should adopt fieldwork.
Lev has been one of the pioneer scholars on the topic. In his seminal book Intangibles: Management, Measurement and Reporting (2001) targeted to practitioners, academics and policymakers he not only recognises the relevance of these type of resources, but he also proposes a model for their management, measurement and reporting, namely the “Value Chain Scoreboard”. The book thus result to be a blend of positive and normative economics. He argues that global trends, such as globalisation and technological change, have forced companies to focus their quest for profitability on innovation, and the primary drivers for innovation are intangible in nature. He also discusses the positive and negative characteristics of these non-standard resources, that are scalability, increasing returns, network effects, costs or limitations of high risk, lack of full control over benefits and absence of a market. Some of these features are considered as the main reasons for which FASB does not permit the recognition of intangible assets. In more general terms, he points out that intangibles contribute to value creation and growth along three main steps, discovery, organisational capital and human resources. All the above observations yield to the proposed model called ‘Value Chain Scoreboard” (that will be presented in Section E-§8.2). It aims to provide standardised information to capital markets about a firms’s value chain considered as the way in which an organisation creates and converts innovation into shareholder value. However, this model is devoted to companies with an intense R&D activity. Finally, he proposes that the recognition of intangibles in financial statements should be broadened. He proposes the recognition of all intangibles investments with attributable benefits that have passed certain pre-specified technological feasibility tests and therefore, not a mechanical capitalisation of all expenditures on intangibles. This permits managers to play a fundamental role in the communication of information related to the progress of the projects.
All the above arguments have been taken up again and further elaborated in the 2016 book by Lev and Gu memorably titled The End of Accounting and the Path Forward for Investors and Managers (which will be considered also in Section E-§8.2). In particular, Chapter 8 of the 2016 book is devoted to the discussion of the lack of recognition that intangibles still have in traditional financial statements. And this absence is one of the major causes of the loss of relevance of accounting. Indeed, they provide evidence about the fact that the more companies that enter the market are endowed with intangible capital, the less accounting information is relevant. The main reasons for a lack of change in this respect are – according to the authors – related not only to accounting regulators but also to managers and auditors. The former ones are reluctant to include intangibles in the balance sheet, as being highly risky, can yield them to report value losses. The latter ones are concerned
CHAPTER 4: PRE-2007 KEY PAPERS ON ACCOUNTING FOR INTANGIBLES
3535
with shareholders lawsuits that can occur in cases where a company’s share price falls significantly. Therefore, they are both satisfied with maintaining the status quo.
Around the same turn of years of Lev’s first book on intangibles, Lev and Zambon (2003) acknowledged the relevance that managers can have in understanding and appreciating the role of these resources in organisations. They maintain that, while the value in exchange is often taken into consideration, the value in use of intangibles, that is their role within the organisation and in particular in the production-organisation nexus, is often overlooked. And this constitutes part of the problem. Indeed, by understanding their managerial and decision-making purposes, the firm could more easily and consciously define a proper strategic positioning and be able to evaluate its internal and external growth opportunities. In addition, it is also recognised that most of the ‘problems’ identified in relation to intangibles could be similar to some of those often forgotten in traditional financial accounting, such as the lack of precision or exactness that can be easily applied also to fair value and impairment test. The authors then recognise that a holistic approach, integrating intangibles with tangible and financial assets, and considering both an interpretive and a normative perspective, has the potential to move the field forward.
From a more regulatory perspective, Wyatt (2002) presents the experience of Australian managers in order to suggest a possible way forward for the capitalisation of intangible assets. Australian GAAP were, in fact, more discretional vis-à-vis its international counterparts (e.g. IASB) and left managers the decision to capitalise intangible assets (both acquired and internally generated). This attitude is deemed to be linked to the historical path of Australian accounting regulators, who are more open to deviations from the adoption of historic cost as a measurement basis.
REFERENCESCañibano, L., M. Garcia-Ayuso, and Sanchez, P. (2000), “Accounting for intangibles: A literature review”, Journal of Accounting
Literature, Vol. 19, pp. 102-130.
Lev, B. and Feng, G. (2016), The End of Accounting and the Path Forward for Investors and Managers, Wiley.
Lev, B., (2001), Intangibles: Management, Measurement and Reporting, Brookings Institution Press.
Lev, B. and Zambon, S. (2003). “Intangibles and intellectual capital: an introduction to a special issue”, European Accounting Review, Vol. 12, No. 4, pp. 597-603.
Petty, R., Guthrie, J. (2000), “Intellectual capital literature review: Measurement, reporting and management”, Journal of Intellectual Capital, Vol. 1, No. 2, pp. 155-176.
Wyatt, A. (2002), “Towards a Financial Reporting Framework for Intangibles: Insights from the Australian Experience”, Journal of Intellectual Capital, Vol. 3, No. 1, pp. 71-86.

3636
The aim of this Chapter is to illustrate the various aspects of the impact of intangibles on the relevance of financial reporting and company value. This impact can be exerted through various ways. Indeed, the papers examined in the Chapter deal with diversified kinds of intangibles. Different authors, in fact, provide alternative perspectives on the topic here analysed, which – in some cases – mix unaccounted and accounted for intangibles, and – in other cases – utilise a general approach to intangibles considered as a whole, i.e. without a clear differentiation between those that are accounted for and those that are not.
Therefore, despite the focus of the present literature review is on unaccounted intangibles, the papers here selected for an in-depth investigation do not deal with that kind of intangibles only, because the studies scrutinised tend to merge in their analyses intangibles that are both accounted and unaccounted for.
The large variety of impacts, approaches and issues investigated in the papers included in this chapter calls for a classification of them according to the main topics they analyse. Therefore, to provide a clearer understanding of the 17 papers selected and in-depth reviewed in this chapter, three main detailed topics of analysis have been identified:
• The role of accounting standards in the recognition and reporting of intangibles;
• The factors influencing voluntary disclosure on intangibles in financial reporting;
• The association of intangibles with firm financial performance and/or value.
THE MAIN TOPICS ADDRESSEDThe role of accounting standards in the recognition and reporting of intangibles
The first issue examined probably represents the most developed stream of research relating to intangibles. In fact, since the ’60s (Galbraith, 1967) to more recent times (Bontis, 1996; Edvinsson and Malone, 1997; Stewart, 1998; Andriessen, 2004) intangibles and intellectual capital have been defined as the difference between an organisation’s market value and its book value. Consequently, the Market-to-Book gap has arisen as a gross measure of intangibles and intellectual capital (IC).
Once this gap has been detected, many scholars have started to reflect on today’s relevance of accounting. Indeed, if market value and book value are widely different, as they are, financial statements risk losing – at least partially – their relevance. Even though the use of the Market-to-Book value as a measure of intangibles and IC can be questioned (Marzo, 2013), this measure has largely acted as a catalyser of the accounting research on intangibles.
Lev (2018) highlights that there is a widespread and growing dissatisfaction with the relevance and usefulness of financial report information, particularly among investors and corporate executives, as there is a growing gap between capital market indicators and financial information, and the reported earnings of most firms no longer reflect enterprise performance.
In order to restore this relevance, according to some authors, the identification and the reporting of the expenditures on intangible investments could be the logical first step towards accounting for intangible investments (Wyatt and Abernethy, 2008).
Lev (2019) proposes a research agenda about accounting for intangibles, with the aim of challenging some taken-for-granted positions on them. He suggests research on the reasons for the capitalisation or the expensing of intangibles, the economic harms deriving from the current accounting for intangibles, and the issues concerning the audit of intangibles-related information.
The role of accounting standards appears even more evident as they have a relevant role in the way firms identify and classify their expenditure on intangibles (Hunter et al., 2012). Indeed, the latter authors report that many firms use rules of thumb for deciding the amount and the type of expenditures on intangibles, and they are unaware of the relationships between those
CHAPTER 5: UNACCOUNTED INTANGIBLES AND THEIR IMPACT ON THE RELEVANCE OF FINANCIAL REPORTING

3737
expenditures and their performance. The focus that accounting standards put on tangible investments does not help managers improve this situation.
However, results are not conclusive about the role of accounting standards in the recognition, measuring and reporting of intangibles. Wyatt (2008) shows that research and development (R&D), purchased goodwill and some non-financial measures of brands and customer loyalty are generally not reliably measured and they may be more or less relevant depending on contexts.
Oliveira et al. (2010) find that the value relevance of earnings appears to have declined after the adoption of IAS/IFRS in 2005 due to the fact that some intangibles previously reported under the Portuguese GAAP were no longer recognised as assets. The value relevance, however, decreases less for goodwill. Under Portuguese GAAP, goodwill was amortised over a maximum period of five years, unless a more extensive useful life (not exceeding 20 years) could be justified. In the latter case, the reasons for such a longer time had to be disclosed. Under IAS/IFRS, instead, goodwill must be tested for impairment at least annually.
In a similar vein, Chalmers et al. (2012) show that the impairment approach to goodwill valuation required by IFRS conveys more useful information than does the former straight-line amortization approach.
Penman (2009) however points out that the omission of intangible assets from the balance sheet is not necessarily a deficiency, as the value of intangible (and other) assets can be ascertained from the income statement. Thus, calls for the recognition of ‘intangible assets’ on the balance sheet may be misconceived. Similarly, Skinner (2008) detects that financial markets appear to be well functioning, and the case for a reform of accounting for intangibles is still far from being necessary.
The factors influencing the voluntary disclosure on intangibles in financial reporting
As for the factors influencing the voluntary disclosure on intangibles, Boesso and Kumar (2007) show that the volume and the quality of voluntary disclosure are linked to the needs of both financial investors and other stakeholders.
According to Ariff et al. (2013), the value relevance of these disclosures is conditional on the level of director ownership and the strength of the institutional features of a country.
The association of intangibles with the firm financial performance or value
A large array of intangibles is investigated in the literature. The papers here selected focus on environmental and social disclosures and intellectual capital – human capital in particular – and their association with the firm’s performance or its market value.
Nearly all of these papers are based on the resource-based theory of the firm, which posits that differences in firms’ profitability derive from the diverse set of resources to which an organisation has access. In a broader view of available resources, Qiu et al. (2016) shows that past profitably enables firms to incur costs for social and environmental purposes, and in turn, the disclosure on these issues is positively associated with firm’s profitability.
Other papers place more emphasis on the role of intangibles and IC on firm performance or value. Different kinds of analyses have been carried out to study such a relationship, namely the statistical association between performance and some measure of intangibles, and the sending of questionnaires to investors, analysts and in general users of information on intangibles, including company managers. Adopting the last perspective, Beattie and Smith (2014) investigate whether the role of human capital is perceived to be important only by HR managers or also by Finance Directors. The concept of “Human Capital”, which has received many definitions over time, is identified in the paper as the knowledge, skills, experiences, and abilities of people. While one would expect HR managers to plainly recognise the role that human capital plays for the firm performance, the specific focus and competencies of Finance Directors could suggest a different position. However, the authors show that the positive role of Human Capital is perceived by both HR managers and CFOs, who also recognise the importance of the disclosure about human capital. Both functional specialists consider the annual report as the most effective written form of communication for disclosing HC externally.
Sydler et al. (2014) offer a method for measuring IC basing on accessible data and demonstrate the association of IC with firm performance.

3838
Swartz et al. (2006) find that the human capital coefficient, which is a component of the VAIC (Pulic, 1998 – see Chaper 8 below), is associated with firm performance and market value. The Human Capital Coefficient is the ratio between the Value Added generated by a company and the amount of wages and other expenses related to labour. It is a measure of the value generated by the competences of all the employees of a company.
The research on the relevance of human capital for the financial performance and the market value does, however, not show consistent results. For instance, Ferraro and Veltri (2011) show on the contrary that human capital, innovation capital and process capital do not have a meaningful relationship with the market value and that only relational capital has a positive association. Different results could be generated by the diversified proxies and variables used for measuring intangibles-related capitals, or by the different settings (e.g. countries) where the analyses have been carried out.
Moeller (2009) shows an interrelation between intangibles and tangibles/financial performance that is mainly influenced by strategic relevance and participation. In contrast to other studies (e.g. Zajac and Olsen, 1993; Dyer and Chu, 2003), trust is not found to have significant effects on tangible or intangible performance.
MAIN FINDINGSThe main findings of the papers belonging to this Chapter can be summarised by the following points:
1) While the majority of studies finds, in general, a significant positive association between intangibles disclosure and the financial performance or the market value of a firm, there are also more ambiguous results in regard to this set of relationships;
2) As for the possible inclusion of internally generated intangibles in financial statements, different theoretical positions can be noticed. From one perspective, some scholars address the fact that financial statements have lost their relevance, due also to the unaccounted intangibles, and thus they call for modifications in the accounting standards with the aim to close the gap between the book and the market value of the firm. Whereas, others maintain that the value of intangibles that are unaccounted does impact and can be detected in the income statement. Consequently, there is no compelling argument for modifying accounting standards on intangibles (see also Chapter 10).
REFERENCESAndriessen, D. (2004), Making Sense of Intellectual Capital: Designing a Method for the Valuation of Intangibles, Elsevier
Butterworth-Heinemann, Burlington, MA.
Ariff, A. M., Cahan, S. F. and Emanuel, D. M. (2013), “Institutional environment, ownership, and disclosure of intangibles: evidence from East Asia”, Journal of International Accounting Research, Vol. 13, No. 1, pp. 33-59.
Beattie, V., and Smith, S. J.(2014), “Human capital, value creation and disclosure”, Journal of Human Resource Costing & Accounting, Vol. 14, Issue 4, pp. 262-285.
Boesso, G. and Kumar, K. (2007), “Drivers of corporate voluntary disclosure: A framework and empirical evidence from Italy and the United States”, Accounting, Auditing & Accountability Journal, Vol. 20, No. 2, pp. 269-296.
Bontis, N. (1996), “There’s a price on your head: managing intellectual capital strategically”, Business Quarterly, Vol. 60, pp. 40-78.
Chalmers, K., Clinch, G., Godfrey, J. M. and Wei, Z. (2012), “Intangible assets, IFRS and analysts’ earnings forecasts”, Accounting and Finance, Vol. 52, No. 3, pp. 691-721.
Dyer, J.H. and Chu, W. (2003), The role of trustworthiness in reducing transaction costs and improving performance: empirical evidence from the United States, Japan, and Korea, Organization Science, Vol. 14, No. 1, pp. 57-68.
3939
Edvinsson, L. and Malone, M. S. (1997), Intellectual capital, HarperBusiness.
Ferraro, O. and Veltri, S. (2011), “The value relevance of intellectual capital on the firm’s market value: an empirical survey on the Italian listed firms”, International Journal of Knowledge-Based Development, Vol. 2, No. 1, pp. 66-84.
Galbraith, J. (1967), The New Industrial State, Hamish Hamilton, London.
Hunter, L., Webster, E. and Wyatt, A. (2012), “Accounting for Expenditure on Intangibles”, Abacus, Vol. 48, No. 1, pp. 104-145.
Lev, B. (2018), “The deteriorating usefulness of financial report information and how to reverse it”, Accounting and Business Research, Vol. 48, No. 5, pp. 465-493.
Lev, B. (2019), “Ending the Accounting-for-Intangibles Status Quo”, European Accounting Review, Vol. 28, No. 4, pp. 713-736.
Marzo, G. (2013), “The market-to-book value gap and the accounting fallacy”, Journal of Intellectual Capital, Vol. 14, No. 4, pp. 564-581.
Moeller, K. (2009), “Intangible and financial performance: causes and effects”, Journal of Intellectual Capital, Vol. 10, No. 2, pp. 224-245.
Oliveira, L., Lima Rodrigues, L. and Craig, R. (2010), “Intangible assets and value relevance: Evidence from the Portuguese stock exchange”, British Accounting Review, Vol. 42, No. 4, pp. 241-252.
Penman, S. H. (2009), “Accounting for intangible assets: There is also an income statement”, Abacus, Vol. 45, No. 3, pp. 358-371.
Pulic, A. (1998), “Measuring the performance of intellectual potential in the knowledge economy”, in Proceedings of the 2nd “World Congress on the Management of Intellectual Capital”, by Carver, T. and Stahlke, J. (eds.), McMaster University, Hamilton, Ontario (Canada).
Qiu, Y., Shaukat, A. and Tharyan, R. (2016), “Environmental and social disclosures: link with corporate financial performance”, The British Accounting Review, Vol. 48, No. 1, pp. 102-116.
Skinner, D. J. (2008), “Accounting for intangibles – a critical review of policy recommendations”, Accounting and Business Research, Vol 38, No. 3, pp. 191-204.
Stewart, T. A. (1998), Intellectual Capital: The New Wealth of Organizations, Nicholas Brealey Publishing, London.
Swartz, G., Swartz, N. and Firer, S. (2006), “An empirical examination of the value relevance of intellectual capital using the Ohlson (1995) valuation model”, Meditari Accountancy Research, Vol. 14, No. 2, pp. 67-81.
Sydler, R., Haefliger, S. and Pruksa, R. (2014), “Measuring intellectual capital with financial figures: can we predict firm profitability?”, European Management Journal, Vol. 32, No. 2, pp. 244-259.
Wyatt, A. (2008), “What financial and non-financial information on intangibles is value relevant? A review of the evidence”, Accounting and Business Research, Vol. 38, No. 3, pp. 217-256.
Wyatt, A. and Abernethy, M. (2008), “Accounting for intangible investments”, Australian Accounting Review, Vol. 18, No. 2, pp. 95-107.
Zajac, E.J. and Olsen, C.P. (1993), From transaction cost to transaction value analysis: implications for the study of interorganizational strategies, Journal of Management Studies, Vol. 30 No. 1, pp. 131-45.
4040
THE PAPERS OF THE CHAPTERThis Chapter reviews the studies concerning the disclosure (including narrative) of the impact of specific internally generated intangibles (such as brands, patents, reputation, R&D, customer satisfaction/awareness, customer list/customer franchise, business model, organisational capital, human capital) on three fundamental elements, i.e. firm profitability and cash flows, market value and positioning, and investors and information users. Inquiries into the specific risks connected to these intangibles will also be included. The specific unaccounted intangibles that are the most investigated by the academic literature have been selected for this in-depth review section.
To analyse the impact of the above mentioned specific unaccounted intangibles on performance, market value and users, we selected 35 papers that we considered mainly material for our study, from the original sample of 98 papers for the Section C. More specifically, we selected 2 papers about “Brands”, 3 papers about “Patents”, 3 papers about “Reputation”, 11 papers about “R&D”, 7 papers about “Customer satisfaction/awareness”, 1 paper about “Customer list/customer franchise”, 3 papers about “Business Model”, 2 papers about “Organisational Capital” and 3 papers about “Human Capital” (see below Table 6.1).
THE MAIN TOPICS ADDRESSEDIn this Chapter, before analysing the research questions that the papers of our sample address for each one of the specific unaccounted intangibles, we will explain some of the main features of the in-depth reviewed papers. First, we can observe that most of the papers in this Chapter come from the USA (58%), followed by Europe (21%).
Secondly, regarding the industries that the papers refer to, some authors refer to listed companies, regardless of the industry they come from. The most researched industries were manufacturing (25%) and services (20%), followed by hi-tech (10%) and chemical-pharmaceutical (10%).
Thirdly, the publication year of papers: almost all (93%) have appeared since 2007, and in particular, 52% of the papers have been published between 2009 and 2013.
Finally, regarding the outlet source, we found 26 different journals in which the articles are published. These journals have different impact factor: we started from a minimum of 0.48 up to a maximum of 7.33, with an average of 3.04.
Regarding the employed variables, the most used dependent variables are financial performance (40%) and market value (24%). Then, we observed that many different independent variables are used, many of which refer to the specific intangibles taken into account. In particular, the most used independent variable is R&D. Also for the control variables, different proxies are used to measure them, and the most used are size and industry, both at 17%.
Brands
Regarding the papers about “brands”, we observe that, consistently with the goals of this review, the questions researched on refer to the association between firms’ brands and their economic and financial performance.
In the Krasnikov, Mishra and Orozco (2009) paper, the aim is to explore the link between the brand-identification and brand-association trademarks and the financial value of the firm. In detail, the authors investigate the firm’s effort and the relative investments to build brand-identification and brand-association and the limited understanding of the financial returns of such investments. The authors present a framework that uses trademarks as measures of firms’ branding efforts. They classify trademarks into two categories – brand-identification trademarks and brand-association trademarks – and propose that they are indicators of firm efforts to build brand awareness and associations among consumers, respectively. Using regression models, they evaluate the chain of effects linking such assets with metrics of firms’ financial value.
CHAPTER 6: INFORMATION ON SPECIFIC UNACCOUNTED INTANGIBLES AND THEIR IMPACT ON COMPANY PERFORMANCE, MARKET VALUE, AND USERS

4141
Specifically, through a longitudinal analysis of the data collected, the authors find that the stock of brand-association trademarks available to firms in time period t increases their cash flows (measured as cash flows from operations), Tobin’s q, return on assets, and stock returns and reduces their cash-flow variability in period t + 1. Furthermore, the authors detect that the stock of brand-identification trademarks owned by firms in period t - 1 influences the effects of brand-association trademarks on these financial indexes. They also observe that increasing consumer brand awareness diminishes the positive effects of brand-association trademarks on stock returns and Tobin’s q.
Smith et al. (2010) hypothesize that firms with a positive brand image have a higher market value of equity, higher financial performance and are less risky. Hence, their study has two research objectives: to investigate whether firms with a positive brand image have higher market value, and to explore the nature of any market-value premium, that is, whether the market premiums of these firms arise from superior financial performance, or from lower cost of capital (lower risk), or both. In other words, the authors seek to empirically test the relationships amid the selected variables and, thereby to determine whether firms with a positive brand image, i.e. whether companies with a positive reputation experience an economic benefit. Consistently with their research objectives, they find that these firms are associated with a significant market-value premium, superior financial performance, and lower cost of capital.
Patents
Considering papers on patents, we can find quite different research questions that refer to dissimilar variables. In the Artz, Norman, Hatfield and Cardinal (2010) paper, the number of firm patents is associated with the R&D expenses of a firm and the patents are deemed to be positively related to a firm’s new products, but, at the same time, it is expected that patents are not directly related to a firm’s performance. More specifically, the relationship between a firm’s commitment to research and development and its innovative outcomes is examined. Hence, two innovative outcomes are analysed: invention, which is measured by the number of patents granted, and innovation, that is assessed by the number of new product announcements. Accordingly, the relationship between patents and product announcements and the ability of a firm to benefit from its inventions and innovations are also investigated. All these issues were examined using a model of simultaneous equations on a sample of 272 firms in 35 industries over 19 years. The results indicate that there is a positive curvilinear relationship between R&D spending and patents. Then, patents turn out to be positively associated with product announcements, and product announcements are positively associated with performance. Finally, the results reveal no direct relationship between patents and performance.
Chen and Chang (2010) explore instead the influences of the quantitative and qualitative patent indicators upon corporate market value in the US pharmaceutical industry. They assume that the patent share of a firm in its most important technological field, which is measured as the ratio between the number of patents owned by a firm in the industrial sector where it has most patents and the total number of patents owned by the firm, is negatively related to its corporate market value. This negative relationship means that the lower the patent share of a pharmaceutical company is in its most important technological field, the higher is its market value. This study argues that pharmaceutical companies should not concentrate too many R&D resources on one particular technological field, because if they do so, then they would face two major drawbacks: first, they would have a greater risk of missing technological opportunities because they would lack the technological capabilities of other technological fields, and second, investing most of the R&D resources in one particular technological field often generates a “lock-in effect”, such that it would be difficult to switch to other technological areas, and therefore the prospects for the business operations would be less certain. The authors also find that the relative patent position of a company in its most important technological field (which is defined as the number of patents owned by the company in that technological field divided by the number of patents owned by the leader in that field) as well as the number of patent citations are positively related to corporate market value. Thus, in order to enhance their market value, companies should invest more resources in R&D activities to increase their competitive advantage in their most important technological fields. In addition, this study shows that patent citations have an inverse U-shaped influence upon corporate market value and that an optimal value exists for patent citations.

4242
The results reveal that patent share has a significantly negative effect on corporate market value. However, relative patents position (a measure for firms’ patent quality) has a significantly positive effect on corporate market value.
Finally, Deng, Lev and Narin (1999) consider innovation and technological change as the main drivers of companies’ productivity and growth, but public information on companies’ efforts to innovate is generally scant and not timely. Using a correlation and regression analysis in relation to certain industries, such as chemicals and electronics, they examine the ability of a new set of publicly available patent-related measures to reflect science and technology-based companies’ potential and growth, testing the ability of the patent-related measures to predict stock returns and market-to-book ratios. The empirical results indicate that patent measures reflecting the volume of companies’ research activity, the impact of companies’ research on subsequent innovations, and the closeness of research and development to science are reliably associated with the future performance of R&D-intensive companies in capital markets.
Reputation
In terms of reputation, many authors have found a relationship with the economic and financial return of the company, and that this relationship is directly proportional to the future stock returns. This relationship has been empirically tested by several scholars.
Sánchez and Sotorrío (2007) propose and test empirically in Spain a theoretical model of the value creation process from the reputation associated with companies, integrating the factors that have been shown by previous research to be the most relevant in this process. This way, a set of assumptions regarding the existence of this relationship and the factors that determine it, is derived. The authors carry out the empirical tests (via OLS regression) of their assumptions using the 100 most prestigious companies operating in Spain in 2004. They find that the relationship between a firm’s reputation and financial performance is non-linear, but positive. They also verify if and to what extent the process of companies’ value creation by means of their reputation is moderated or influenced by a series of contingent factors, i.e. the differentiation strategy adopted by the firm, the competitive intensity between companies and the power of stakeholders. The positive moderating effect of these three contingent factors has been investigated statistically. Even though these positive effects all have been statistically verified, they are nonetheless very small and their power over the process of the creation of value is minimal in the short term.
Raithel and Schwaiger (2015) investigate the link between corporate reputation – intended as the people’s perceptions of a firm’s abilities (competence) and their feelings (likeability) about the firm –, non-financial reputation – intended as the people’s perceptions of product quality, workplace environment, emotional appeal, social and environmental responsibility, etc. – and the future stock return. Specifically, among the multiple reputations associated with the firm, they focus on the perceptions of the general public, which represents the most widely defined stakeholder group. Drawing on data for German firms, the authors demonstrate that superior reputation perceptions linked to the general public increase shareholder value, as measured by future stock returns and reputation perceptions, and that the reputation perceptions which are driven by non-financial aspects are more value relevant in the future rather than those that are driven by previous financial performance.
Furthermore, Raithel, Wilczynski, Schloderer and Schwaiger (2010) assume that reputation, divided into two components (cognitive and affective), is associated with the future value of a firm. In particular, the authors use two large‐scale surveys, one from before and one from after the 2008 financial crisis, to ascertain the reputation evaluations of the largest publicly listed corporations in Germany by employing a model augmented with standard accounting variables (i.e. sales, return on assets, etc.). They analyse the link between corporate reputation, as noted by different stakeholder groups, and future firm value. The authors find support for the hypothesis that suggest that both likeability and competence are value relevant for investors’ expectations about firm future value, as well as for the hypothesis indicating that the value relevance of corporate reputation is stakeholder group-specific.
R&D
Examining the papers about Research & Development (R&D) and the related research questions, we observe that most authors refer to the relation of R&D disclosure with the capitalisation of R&D expenditures, the firm market value and performance, and the firm cost of debt and risk premium. It is necessary to underline that, since development costs are under certain circumstances capitalised, the studies here reviewed often consider in their analyses R&D expenditures that are both capitalised (as some development costs) and expensed.

4343
Evidence about the role of R&D in new firms’ growth are provided by Stam and Wennberg (2009). Adopting ordinary least squares (OLS) regression on a dataset containing a sample of new Dutch firms representative of the whole population of start-ups, these authors present some empirical evidence on the effects of R&D (intended as R&D activities) on new product development, interfirm alliances and employment growth during the early life course of firms. This study shows that R&D plays several roles during the early phases of life cycle of high-tech as well as high-growth firms. The effect of initial R&D on high-tech firm growth takes place through increasing levels of interfirm alliances in the first post-entry years. R&D also stimulates new product development later on in the life course of high-tech firms, but it does not seem to affect firm growth. Moreover, only high-tech firms seem to grow due to early R&D investments, and this seems to be fruitful especially for organisations that also initiate interfirm alliances during the early phases of their life cycle.
It has been found by Merkley (2014) that narrative R&D disclosure quantity is assumed to be negatively related to current earnings performance, especially when investor information demand is higher. By applying a content analysis and a regression technique on a sample of US companies derived from the Compustat database, the author finds that earnings performance is negatively related to the quantity of narrative R&D disclosure, and he attributes this result to firms adjusting R&D disclosure to provide relevant information in response to investors’ changing information demands rather than to firms attempting to spin or obfuscate earnings information. Furthermore, the author shows that narrative R&D disclosure is positively related to analysts following (i.e. the number of analysts following the company) and the earnings forecast accuracy and negatively related to analyst forecast dispersion.
Again Ciftci and Zhou (2016), measuring R&D in terms of related disclosure and expenses, assume that the value relevance of accounting information is the same for intangible intensive firms as for non-intangible-intensive firms and that the incremental value-relevance of intangibles is the same for firms in industries with strong protection of intellectual property as for those in industries with weak protection of intellectual property. In particular, using regression analysis, the authors study how to improve the value relevance of financial information for intangible intensive firms. Hence, employing patent counts/citations to proxy for intangibles intensity, through a sample of US companies, they reveal that the incremental value relevance of disclosing patent counts/citations is greater than that of capitalising R&D expenses for the high-patent group and vice versa for the low- or medium-patent group. In addition, they find that, for the high patent group, the incremental value relevance of disclosing patent counts/citations is more pronounced for firms in industries with stronger protection of intellectual property. These results suggest that disclosing R&D outputs can improve the value relevance of financial statements for firms rich in intangibles, and the incremental benefits of such disclosure will be greater in industries with strong protection of intellectual property.
Ehie and Olibe (2010) expects that investments in R&D (measured as R&D expenditures) have a positive effect on the market value of a firm and this effect is significantly more positive in manufacturing than in service firms. Specifically, the authors examine the association between investment in research and development (R&D) and market value amongst US firms over an 18-year period covering 26,500 firm-years. They study the R&D investment-firm performance linkage in both manufacturing and service industries to evaluate differences in their relative contributions to firm value. Using regression analysis and controlling for firm size, industry concentration, and leverage, the authors find that R&D investments positively affect firm performance. More specifically, R&D investments in the manufacturing sector contribute more positively to firm market value than in the service sector. Finally, the results show that investments in R&D contribute positively to firm performance for both manufacturing and service firms.
Furthermore, as to the relationship between the development cost capitalisation and the cost of debt, Kreß, Eierle and Tsalavoutas (2019), through a sample of companies from different countries around the globe, find that there is a negative association between the amount of R&D firms capitalise during a year and the firms’ cost of public and private debt. First of all, the authors discover a positive association between capitalised R&D and a firm’s propensity to issue bonds, indicating that firms capitalise larger amounts of R&D as a means of facilitating access to public debt markets. Then, they find a positive association between capitalised R&D and a firm’s propensity to borrow funds from public debt markets as well as that capitalised R&D investments reduce the cost of private debt. Finally, the authors show that it is the amount of R&D a firm is expected to capitalise, and not the amount of R&D a firm has de facto over- or under-capitalised in a year compared with the expected amount, which facilitates a firm’s access to public debt markets, reduces bond and syndicated loan prices, and contributes to future benefits.
4444
In other words, only the expected amount of capitalised development costs should contribute significantly to future profitability, whilst the discretionary counterparts (i.e. over or under R&D yearly capitalised amounts) may not represent underlying future economic benefits.
Alam, Liu and Peng (2014) assume that R&D expenditures are positively associated with risk premiums. More in detail, this study investigates the relationship between R&D expenditures and risk premiums implied in the cost of equity capital on a sample of US companies extracted from the Compustat database. The results uncover that R&D expenditures are significantly (from a statistical perspective) and positively associated with average risk premiums. In addition, capital expenditures are also significantly and positively associated with average risk premiums in the regression analysis, unlike the advertising expenses, which did not show consistently positive relationships with average risk premiums. Finally, average risk premiums are generally and significantly related to other conventional risk factors (e.g. firm size, book-to-market ratio, leverage, etc.).
Chen, Gavious and Lev (2017) focus on voluntary disclosure about the capitalisation of development costs, using a sample of Israeli high-technology and science-based firms. They find that the R&D-related voluntary disclosure is value relevant to investors beyond the recognised earnings, book values, and capitalised R&D, and this is associated with higher share price informativeness. Their findings concerning the value relevance of the recognised capitalised (asset) R&D and the enhancement of voluntary disclosure relevance caused by the capitalised R&D contribute to the ongoing debate on the merits of capitalisation of intangibles, and these results identify an important positive externality of the IFRS development cost capitalisation rule vis-à-vis the US FASB rule of non-capitalisation of R&D expenditures.
In addition, Amir et al. (2003) investigate to what extent analysts are able to compensate for intangibles-related information deficiencies of financial reports, measuring R&D as disclosure on R&D activities. Indeed, they are presupposed to derive information from financial reports, but also from other sources beyond these reports, such as stock price changes. This hypothesis is tested with a sample of 26,521 US companies in the time period between 1982 and 2000. In this sample, a comparison is made between the incremental contribution of analysts to equity valuation in companies with a large investment in R&D, compared with their contribution in companies having low or no R&D capital. Findings demonstrate that analysts’ incremental contribution over financial reports is larger in intangibles-intensive companies than in companies with low levels of intangibles, this meaning that financial report deficiencies are partially compensated for by other information sources available to them. In addition, analysts’ incremental information contribution in the 1990s is significantly larger than that in the 1980s, indicating that analysts increasingly ‘get intangibles’. However, the level of compensation is not complete, but analysts’ forecast errors are associated with R&D intensity, indicating that they do not fully account for the impact of R&D on future profitability.
Pandit, Wasley and Zach (2011) investigate how measures of R&D activities outputs (patent counts and patent citations), which proxy for the economic value of innovation, are related to firms’ future performance. Utilising as independent variables the total number of patents granted in the previous five years and the adjusted number of citations by other patents across all patents issued to a firm in the previous five years, through a sample of US companies, they study the relationship between R&D (intended as R&D inputs, that is the expenses amount, and outputs, that is patent counts and citations) and future performance through a regression model on a sample of 20,391 observations. Then, using the level and variability of both future cash flows and future earnings as dependent variables, the authors find that the mean level of realised future operating performance is positively associated with patent quality. Also, the authors show that the standard deviation of realised future operating performance is negatively associated with the quality of a firm’s patents. For both the level and the standard deviation of future operating performance, the results are stronger for firms with larger portfolios of highly cited patents, evidence that it is the quality of patents, not just their quantity, which is an important indicator of future operating performance. Finally, the volatility of future performance is demonstrated to be lower for high R&D firms whose patents are highly cited.
Jones (2007) studies to what extent disclosures about R&D activities could help market participants understand the future prospects of R&D-intensive firms. However, at the same time these disclosures could be costly to make if they are related to proprietary information. Using a regression analysis on a sample of US firms, with 119 observations per year, with some indexes (R&D disclosure score, based primarily on the paper by Entwistle, 1999), as well as a general disclosure score and a forward-looking disclosure score, the author finds a negative relation between abnormal profits in the previous year and R&D-related disclosures, suggesting that firms disclose less when the proprietary costs of the disclosure are higher. Then, firms with a lower book-to-market ratio provide more detailed information about R&D-related activities, presumably because the basic financial statements are less informative about the market value of the firm.

4545
The study shows also mixed evidence about the ability of voluntary disclosures to reduce analysts’ forecast error and dispersion. In particular, the author discovers a negative relationship between analysts’ earnings forecast error and the level of disclosure about both R&D activities and forward-looking information, but no evidence of a relationship with forecast dispersion. In contrast, the level of disclosure about general activities is positively associated with analysts’ earnings forecast error and negatively associated with forecast dispersion. Only the R&D-related disclosures, and not also the disclosures about corporate general activities, are associated with analysts’ sales forecast error. Finally, the level of disclosure on R&D projects in progress and development-stage R&D is negatively associated with both earnings forecast error and sales forecast error, whilst the level of disclosure on development-stage R&D is negatively associated with the dispersion in one-year-ahead analysts’ sales forecasts. These findings suggest that disclosures about the early and the late stages of R&D activity reduce analyst uncertainty.
Lastly, by measuring R&D as the total expensed amount, Ciftci and Cready (2011) investigate how R&D-related earnings performance and earnings variability depend upon firm size. In their study, the authors carry out a regression analysis which utilises as dependent variable the average earnings over five subsequent years (from t+1 to t+5) divided by sales revenue in year t, and as independent variables the decile rank of market value of equity, the decile rank of R&D expense to sales revenue in year t, the decile rank of advertising expenditures to sales ratio, the decile rank of tangible assets to sales ratio, and the decile rank of book-to-market ratio. Leveraging on a sample of US companies, the analysis shows that scaled larger firms’ R&D investment is associated with substantially higher future scaled earnings realisations and substantially lower earnings variability than comparable scaled R&D investment by smaller firms. These relations are consistent with R&D returns to scale. That is, the analysis demonstrates that R&D scale effects are broadly present across a wide spectrum of firms, and that they substantially impact on the fundamental properties of bottom-line earnings. The authors identify firm size as an important driver of such variation. Furthermore, the study also relates R&D to the size effect on a cross-section of stock returns. The evidence suggests that these risk effects to a substantial degree reflect R&D working through size (i.e. scale effects) and that, consequently, R&D scale is relevant in assessing expected equity returns. Finally, the results show that the profits per dollar invested in innovative activities increase with firm size.
Customer satisfaction/awareness
The most investigated topic in this area is the relationship between customer satisfaction and a firm’s performance.
Ittner and Larcker (1998) examine three questions on the value relevance of customer satisfaction measures, that is if customer satisfaction measures are leading indicators of accounting performance, if the economic value of customer satisfaction is reflected in accounting book values, and if the release of customer satisfaction measures provide new or incremental information to the stock market. Using customer and business-unit data, the authors find a modest support for claims that customer satisfaction measures are leading indicators of customer purchase behaviour, as well as some evidence that firm-level customer satisfaction measures can be economically relevant to the stock market, even though these are not completely reflected in contemporaneous accounting book values. However, some of the tests suggest that customer behaviour and financial results are relatively constant over broad ranges of customer satisfaction, changing only after satisfaction moves through various “threshold” values, and diminishing at high satisfaction levels.
According to Parastoo, So and Saeidi (2015), Corporate Social Responsibility (CSR) is found to be positively associated with firm performance, and this is a mediated rather than a direct relationship. Specifically, this study considers sustainable competitive advantage, reputation, and customer satisfaction as three probable mediators in the relationship between CSR and firm performance. The results show that there is a positive and significant relationship between CSR and firm performance, and – after entering the mediating elements – it appears that there is a significant relationship also between CSR and these mediation variables, and between mediation variables and firm performance. Therefore, the results reveal that the CSR and firm performance relationship is a fully mediated relationship through the contribution of CSR to firm performance via better reputation and competitive advantage followed by a higher level of customer satisfaction.
Galbreath and Shum (2012) investigate the relationship between CSR and firm performance (FP) and the mediating role of customer satisfaction. The results show a significantly positive relationship between CSR and FP. Moreover, CSR is positively associated with both customer satisfaction and reputation, which intermediate the relationship with firm performance. Accordingly, as predicted by the authors, the association of customer satisfaction with FP happens through reputation rather
4646
than through a direct link. Given these findings, CSR contributes to higher firm performance via the resulting better reputation and, then, a higher customer satisfaction.
Furthermore, customer satisfaction is assumed by Tuli and Bharadwaj (2009) to have an inversely proportional relationship with systematic and idiosyncratic risk, and a directly proportional relationship with analyst stock recommendations for the firm. The authors develop tests and find empirical support for the hypotheses that positive changes (i.e. improvement) in customer satisfaction result in negative changes (i.e. reduction) in overall and downside systematic and idiosyncratic risk. Using a panel data sample of publicly traded U.S. firms and satisfaction data from the American Customer Satisfaction Index, the study demonstrates that investments in customer satisfaction insulate a firm’s stock returns from market movements and lower the volatility of its stock returns. The results indicate that customer satisfaction is a metric that provides valuable information to financial markets. The robust impact of customer satisfaction on stock returns risk indicates that it would be useful for firms to disclose their customer satisfaction scores in their annual report to shareholders.
Along a similar vein, Luo, Homburg and Wieseke (2010) explore the idea that analyst stock recommendations, at least partially, mediate the associations between changes in customer satisfaction and firm return and risk. Elaborating on a large-scale longitudinal data set, the authors find that positive changes in customer satisfaction not only improve analyst recommendations, but also lower dispersion in those recommendations for the firm. These effects are stronger when product market competition is high and financial market uncertainty is large. In addition, analysts’ recommendations at least partially mediate the effects of changes in satisfaction on firm abnormal return, systematic risk, and idiosyncratic risk. Overall, this research reveals the impact of satisfaction on analyst-based outcomes and firm value metrics, and it calls attention to the construct of customer satisfaction as a key intangible asset for the investor community.
Also, the role of customer awareness is investigated by Servaes and Tamayo (2013) in the context of the relationship between CSR and firm value. The authors show that CSR and firm value are positively related for firms with high customer awareness, as proxied by advertising expenditures. The evidence suggests that advertising expenditures enhance the impact of CSR activities on the value of the firm, because advertising creates awareness about the company and its activities, which creates more “goodwill” on the part of customers. There is no evidence to suggest that CSR is employed to signal product quality.
Finally, in the work by Bayer, Tuli and Skiera (2017), the quantity of backwards- and forward-looking disclosures of customer metrics are associated with analysts and investors’ uncertainty about the future cash-flows of the firm. This study presents an empirical examination of the prevalence and consequences of backward- and forward-looking disclosures of customer metrics by manually coding 511 annual reports of firms in telecommunications (365 reports) and airlines (146 reports) industries. The results show that the quantity of backwards-looking disclosures of customer metrics is not associated with analysts’ uncertainty, whilst this quantity is weakly associated with investors’ uncertainty in the telecommunications firms, but it does not have a significant effect in the airline industry. The quantity of forward-looking disclosures of customer metrics has a significant negative (telecommunication) or not significant (airlines) effect on analysts’ uncertainty, whilst it has a significant negative impact on investors’ uncertainty. The effect of the quantity of backwards-looking disclosures on future cash flows is positive or not significant, while the quantity of forward-looking disclosures of customer metrics does not have a significant effect on future cash flows in the telecommunications industry, but it is positively associated with future cash flows in the airline industry.
Customer list/customer franchise
In this section, we examine the impact of the measure of customer franchise on information voluntarily disclosed by some firms. According to Bonacchi, Kolev and Lev (2015), this measure is significantly positively associated with stock price and is positively associated with future earnings and the prediction of analysts’ forecast errors. In particular, the authors argue that customer equity – a metric summarising the state of the fundamental business process of subscription-based enterprises, and measured by the sum of the future profit margins generated from the customers that have already been acquired by the end of the period – embeds important information pertaining to firm value, and they introduce a model translating the main drivers of the business model typical of those companies into a unique and single measure of customer franchise value. Indeed, the results of the regression model show that the value of the customer equity measure is positively and significantly associated with the market value of the firm. Results also indicate that customer equity is an important predictor of future profitability. More specifically, the authors demonstrate that the relation is incremental to analysts’ earnings forecasts and, in fact, the customer equity metric predicts earnings forecast errors, providing evidence that the link is not mechanical. The authors also state that, despite these results should be interpreted with caution (because the analyses are based on a relatively small sample of

4747
companies voluntary disclosing the necessary customer metrics, and the measure of customer equity relies on estimates of future margin, retention, and discount rates), they believe that their findings provide important insights about a major intangible asset, i.e. the customer equity, missing today from the balance sheet.
Business model
The business model, and in particular the business model design and type, is assumed by Morris, Shirokova and Shatalov (2013) to have a relationship with firm performance. More in detail, the authors investigate the relationship between business model design and firm performance in a Russian context through an empirical research conducted on a cross‐sectional survey of firms in the food service industry. A typology of seven business models in this industry is produced, and linkages are established between model type and company performance. This study suggests that generic models emerge in an industry, indicating that there are multiple ways to succeed, such that most firms gravitate toward standard models, but certain of these perform better.
Furthermore, regarding the business model design, Zott and Amit (2007) expect that the more novelty centred (more efficiency centred) an entrepreneurial firm’s business model design is, the higher the firm performance, especially in environments characterised by high resource (low resource) munificence. To test their hypotheses, the authors develop and analyse a unique data set of 190 entrepreneurial firms that were publicly listed on U.S. and European stock exchanges. The empirical results show that novelty-centred business model design matters to the performance of entrepreneurial firms. The analysis also shows that this positive relationship is remarkably stable across time, even under varying contextual regimes. Additionally, the authors find indications of potential diseconomies of scope in design, that is, entrepreneurs’ attempts to incorporate both efficiency- and novelty-centred design elements into their business models may be counterproductive.
Another topic investigated in the area of business model information by Nielsen and Bukh (2011) is the financial analysts’ perception of a firm’s business model. In their paper, the authors distinguish between the various business model frameworks according to whether they concern generic descriptions of the business or whether they are more specific in their accounts. The empirical part of the paper is a case study of financial analysts’ perceptions of the term “business model” and how they describe a specific firm’s strategy in relation to the business model frameworks. The analysis indicates that the various details of strategy and competitive strengths, mobilised by the analysts in their understanding process of the case company, can be seen as elements of a business model. For example, the analysts depict the method of doing business by focussing on the whole enterprise system and the company’s architecture for generating value as well by emphasising roles and relationships, and by describing the uniqueness of the value-generating infrastructure, links, processes, and causal relationships. Although the term business model initially was found to be a misunderstood concept, and in fact rendering mainly negative associations amongst the analyst community, the authors’ research indicates that the particularities of strategy and competitive strengths utilised by the analysts in their comprehension of the case company in fact comprised a very complete description of the business model when those particularities are pieced together. It is concluded by examining which business model typologies are most similar to the analysts’ understanding and how these typologies incorporate elements of both a narrow (the internal functioning of the firm) and a broad comprehension (that comprise also external elements) of the concept.
Organisational capital
Focusing on organisational capital, Lev, Radhakrishnan and Zhang (2009) assume it to be related to the future operating and stock return performance of a firm, since organisational capital measure captures firms’ fundamental ability to generate abnormal performance. In particular, the authors develop a firm-specific measure of organisational capital and document that it is associated with five years of future operating and stock return performance, after controlling for other factors. The authors also examine the association of the organisational capital measure with executive compensation, an incentive mechanism as well as a measure of the executive’s ability that should manifest in business processes and systems, which is the way of doing business. They find that executive compensation is positively associated with the measure of organisational capital. Collectively the results show that organisational capital is an important intangible asset that is related to firm value and important corporate decisions.
Grüber (2015) aims to shed light on the usefulness of information on intangible values from the perspective of financial analysts. Two methodologies are employed to study a variety of aspects. First, content analysis is used to examine sell-side research reports for the occurrences of information items related to intangible values.
4848
Sell-side research reports are considered to include all of the information that is relevant to make informed investment decisions. Thus, they are a suitable tool to reveal whether information on intangibles is useful to the decisions of users and, if so, what types of intangibles are deemed to be important. Second, a web-based self-administered experimental survey is used to study the actual information use of financial analysts and their perceptions on information related to intangibles. The findings show that on average approximately 23.41% of the pre-defined intangible information items were included in the research reports, providing some initial evidence that information on intangible values is relevant for the investment decisions of capital providers. Yet, the scores related to the sub-categories differ significantly, indicating that the relevance of the intangible areas of a company varies. That is, the research reports especially include information items pertaining to Strategy as well as to Organisational Capital. The former is particularly driven by the descriptions of the business model and of the objectives of a company’s strategy. Organisational Capital mainly includes the discussion of a company’s products and services. The scores for Investor Capital and Customer Capital are also relatively high, if compared to Human Capital or Innovation Capital. Supplier Capital has received the lowest score. With respect to the hypotheses, the results confirm that sell-side analysts particularly use information on intangibles when covering companies with a relatively positive future outlook (positive recommendations). The work was grounded on the intuition that analysts employ information on intangibles in order to justify their optimistic forecasts, increasing the credibility or plausibility of their buy recommendations. Moreover, it is confirmed that analysts use more information on intangibles when covering less mature or smaller sized companies. Overall, the analysts generally perceive non-financial information as more important than the financial inputs. This finding, however, should be taken carefully, as financial information is still the major basis of the work of financial analysis.
Human capital
Relatively to Human Capital, great attention is given by Gamerschlag and Moeller (2011) to the relationship between the value of this form of capital and its disclosure and the internal and external value of the firm. More specifically, human capital disclosure is found to have a positive relationship with firms’ internal factors, such as workforce’s capabilities, motivation and commitment, or with organisational performance and innovation ability, as well as with firm’s financial performance and market value. Moreover, human capital reveals to have a positive relationship also with external factors such as firm attractiveness and reputation for the external stakeholder. These authors develop a theoretical model that illustrates the transformation of the intangible factors of Human Capital Reporting (HCR) into tangible outcomes. Consequently, the model considers the various cause-effect relationships between HCR and company financial performance.
As a follow up of the previously illustrated study, Gamerschlag (2013) investigates whether human capital information voluntarily provided by German companies is value relevant. By means of a word‐based content analysis, human capital information is extracted from German companies’ annual reports. Subsequently, the value relevance of the disclosed human capital information is analysed by applying two established valuation models. The results show that human capital information is value relevant. Consequently, while the amount of human capital disclosures is found to be increasing over time, companies can improve their valuation on the capital market by disclosing information on their human capital. Especially information on qualification and competence issues is positively associated with firm value. Nonetheless, the disclosed information does not lead to short‐term changes in market value. Consequently, human capital information is value relevant, but not in immediate terms. It is up to standard setters to define relevant information categories for human capital disclosures.
Furthermore, Vomberg and Homburg (2015) explore the relationship between brand equity and human capital on firm value, and they consider how much the effects of these two resources differ between services and manufacturing. The results show a complementary relationship between brand equity and human capital on firm value. Specifically, the authors find a significant and positive interaction term for Tobin’s q and cash flow, and a negative interaction term for cash flow volatility. Further, the results show that both brand and human capital create relatively more value in service companies than in manufacturing and retail firms.
MAIN FINDINGSIn general terms, specific unaccounted intangibles have a positive effect on the financial performance and the market value of companies. For example, greater expenditure on intangibles corresponds to an increase in the value of the company (e.g. Ehie and Olibe, 2010). However, it has also been found that the effect of intangibles on financial performance or market value

4949
is positive, but not linear. Also, this effect may not take the configuration of a direct link, because it can be moderated or influenced by other factors (e.g. Sánchez & Sotorrío, 2007). Furthermore, this positive effect is not the same for all the firms and industries, and it does not necessarily happen in the short-medium term (Stam and Wennberg, 2009).
As to the disclosure about specific intangibles, it has been shown that it is negatively associated with earnings (Merkley, 2014 for R&D), but it may have a positive effect on the share price (Chen et al., 2017 for R&D). Finally, this positive effect concerns more the quantity of forward-looking information than the backwards-looking disclosure (Bayer et al., 2017 for customer satisfaction/awareness).
In the following, two Tables summarise the bibliographic features of, and the main findings from, the in-depth reviewed papers of this Chapter, which have been articulated according to the type of impact (i.e. firm profitability and cash flows, market value and positioning, and investors and information users) investigated in each of the considered works.
Table 6.1. Synopsis of the bibliographic features of the papers considered in the Chapter
FIRM PROFITABILITY AND CASH FLOWS
MARKET VALUE AND POSITIONING
INVESTORS AND INFORMATION USERS
BRANDS Krasnikov, A.; Mishra, S.; Orozco, D., Evaluating the Financial Impact of Branding Using Trademarks: A Framework and Empirical Evidence, Journal of Marketing, 2009
Smith, K.T., Smith, M., Wang, K. 2010. Does brand management of corporate reputation translate into higher market value?. Journal of Strategic Marketing. 18(3), pp. 201-221
PATENTS Artz, K.W., Norman, P.M., Hatfield, D.E., Cardinal, L.B. 2010. A longitudinal study of the impact of R&D, patents, and product innovation on firm performance. Journal of Product Innovation Management. 27(5), pp. 725-740
Chen, Yu-Shan; Chang, Ke-Chiun. 2010. Exploring the nonlinear effects of patent citations, patent share and relative patent position on market value in the US pharmaceutical industry. Technology Analysis & Strategic Management. 22(2), pp. 153-169Deng Z., B. Lev & F. Narin (1999) Science and Technology as Predictors of Stock Performance, Financial Analysts Journal, 55:3, 20-32
REPUTATION Sánchez, J L F, Sotorrío, L L. 2007. The creation of value through corporate reputation. Journal of Business Ethics. 76(3), pp. 335-346
Raithel S. and Schwaiger M., The effects of corporate reputation perceptions of the general public on shareholder value, Strategic Management Journal, June 2015, Vol 36, Iss. 6, pp. 945-956
Raithel S., P. Wilczynski, M.P. Schloderer and Schwaiger M., The value-relevance of corporate reputation during the financial crisis, Journal of Product & Brand Management, Vol. 19 Issue: 6, 2010, pp. 389-400
R&D Stam, E., Wennberg, K. 2009. The roles of R&D in new firm growth. Small Business Economics. 33(1), pp. 77-89Merkley K.J., 2014, Narrative disclosure and earnings performance: Evidence from R&D disclosures, Accounting Review, 89(2), pp. 725-757
Ehie, Ike C., Olibe, Kingsley. 2010. The effect of R&D investment on firm value: An examination of US manufacturing and service industries. International Journal of Production Economics. 128(1), pp. 127-135
Ciftci, Mustafa, Zhou, Nan, Capitalising R&D expenses versus disclosing intangible information, Review of Quantitative Finance & Accounting. Apr 2016, Vol. 46, Issue 3, pp. 661-689

5050
FIRM PROFITABILITY AND CASH FLOWS
MARKET VALUE AND POSITIONING
INVESTORS AND INFORMATION USERS
R&D Kreß A., B. Eierle, I. Tsalavoutas, Development costs capitalisation and debt financing. Journal of business finance and accounting. May/Jun 2019, Vol. 46, Issue 5/6, pp. 636-685Pandit, S., Wasley, C. E., & Zach, T. (2011). The effect of research and development (R&D) inputs and outputs on the relation between the uncertainty of future operating performance and R&D expenditures. Journal of Accounting, Auditing and Finance, 26(1), 121–144Ciftci, M., & Cready, W. M. (2011). Scale effects of R&D as reflected in earnings and returns. Journal of Accounting and Economics, 52(1), 62–80
Alam, Pervaiz, Liu, Min, Peng, Xiaofeng, R&D expenditures and implied equity risk premiums, Review of Quantitative Finance & Accounting. Oct 2014, Vol. 43, Issue 3, pp. 441-462Chen, E., I. Gavious, B. Lev, The positive externalities of IFRS R&D capitalisation: enhanced voluntary disclosure. Review of Accounting Studies. Jun 2017. Vol. 22, Issue 2, No. 6, pp. 677–714
Amir, E., Lev, B. and Sougiannis, Th. (2003), Do financial analysts get intangibles?, European Accounting Review, Vol.12, No. 4, pp. 635-659Jones, D. A. (2007). Voluntary disclosure in R&D-intensive industries. Contemporary Accounting Research, 24(2), pp. 489-522
CUSTOMER SATISFACTION AND AWARENESS
Ittner C.D., and Larcher, D.F., Are Nonfinancial Measures Leading Indicators of Financial Performance? An Analysis of Customer Satisfaction, Journal of Accounting Research, Vol. 36, 1998, pp. 1-35Parastoo, S., So, S., & Saeidi, P. (2015), How does corporate social responsibility contribute to firm financial performance ? The mediating role of competitive advantage, reputation, and customer satisfaction, Journal of Business Research, Vol. 68, No. 2, pp. 341–350Galbreath, J., P. Shum, 2012, Do customer satisfaction and reputation mediate the CSR–FP link? Evidence from Australia. Australian Journal of Management. 37(2), pp. 211-229
Tuli, K.R., Bharadwaj, S.G. 2009. Customer satisfaction and stock returns risk. Journal of Marketing. 73(6), pp. 184-197Servaes, Henri; Tamayo, Ane. 2013. The Impact of Corporate Social Responsibility on Firm Value The Role of Customer Awareness, Management Science. 59(5), pp. 1045-1061
Xueming Luo, Christian Homburg, Jan Wieseke, Customer Satisfaction, Analyst Stock Recommendations, and Firm Value, Journal of Marketing Research, Volume: 47, issue: 6, 2010, pp. 1041-1058Bayer, E., Tuli, K.R., Skiera, B., Do Disclosures of Customer Metrics Lower Investors’ and Analysts’ Uncertainty but Hurt Firm Performance?, Journal of Marketing Research. April 2017, Vol. 54, Issue 2, pp. 239-259
CUSTOMER LIST / CUSTOMER FRANCHISE
Bonacchi M., K. Kolev, Lev B., Customer Franchise—A Hidden, Yet Crucial, Asset, Contemporary Accounting Research, Vol 32, Iss. 3, Fall 2015, pp. 1024-1049
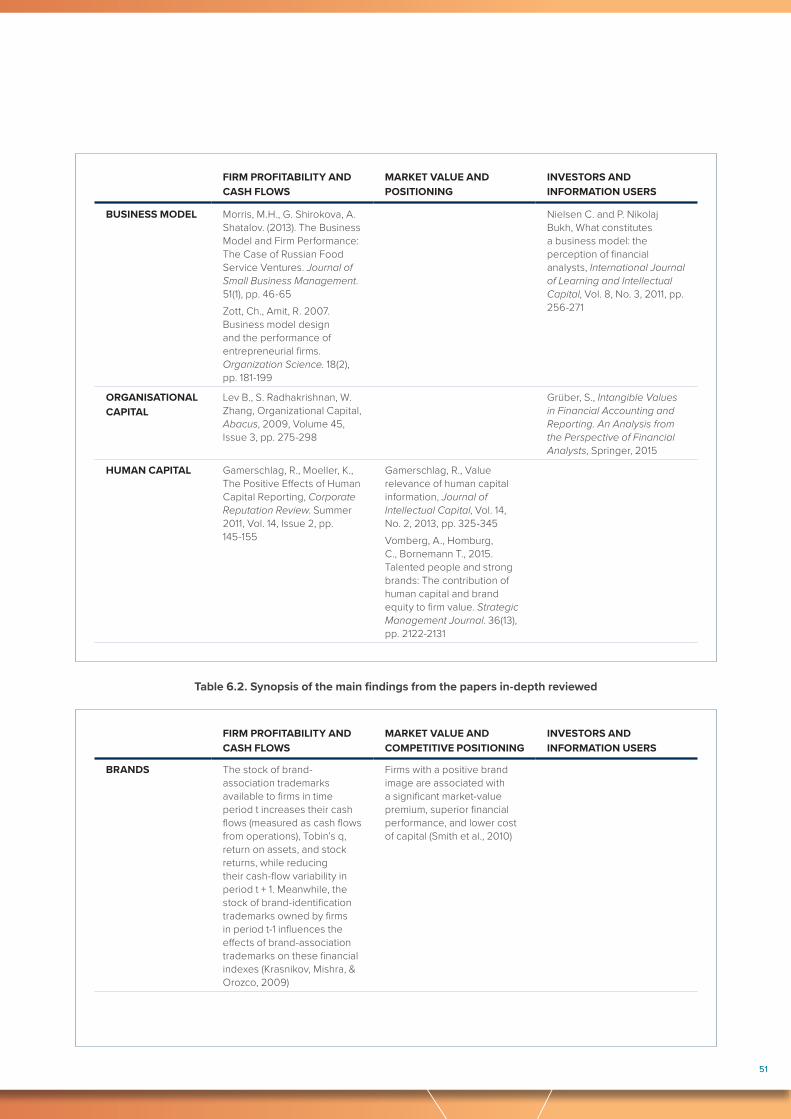
5151
FIRM PROFITABILITY AND CASH FLOWS
MARKET VALUE AND POSITIONING
INVESTORS AND INFORMATION USERS
BUSINESS MODEL Morris, M.H., G. Shirokova, A. Shatalov. (2013). The Business Model and Firm Performance: The Case of Russian Food Service Ventures. Journal of Small Business Management. 51(1), pp. 46-65Zott, Ch., Amit, R. 2007. Business model design and the performance of entrepreneurial firms. Organization Science. 18(2), pp. 181-199
Nielsen C. and P. Nikolaj Bukh, What constitutes a business model: the perception of financial analysts, International Journal of Learning and Intellectual Capital, Vol. 8, No. 3, 2011, pp. 256-271
ORGANISATIONAL CAPITAL
Lev B., S. Radhakrishnan, W. Zhang, Organizational Capital, Abacus, 2009, Volume 45, Issue 3, pp. 275-298
Grüber, S., Intangible Values in Financial Accounting and Reporting. An Analysis from the Perspective of Financial Analysts, Springer, 2015
HUMAN CAPITAL Gamerschlag, R., Moeller, K., The Positive Effects of Human Capital Reporting, Corporate Reputation Review. Summer 2011, Vol. 14, Issue 2, pp. 145-155
Gamerschlag, R., Value relevance of human capital information, Journal of Intellectual Capital, Vol. 14, No. 2, 2013, pp. 325-345 Vomberg, A., Homburg, C., Bornemann T., 2015. Talented people and strong brands: The contribution of human capital and brand equity to firm value. Strategic Management Journal. 36(13), pp. 2122-2131
FIRM PROFITABILITY AND CASH FLOWS
MARKET VALUE AND COMPETITIVE POSITIONING
INVESTORS AND INFORMATION USERS
BRANDS The stock of brand-association trademarks available to firms in time period t increases their cash flows (measured as cash flows from operations), Tobin’s q, return on assets, and stock returns, while reducing their cash-flow variability in period t + 1. Meanwhile, the stock of brand-identification trademarks owned by firms in period t-1 influences the effects of brand-association trademarks on these financial indexes (Krasnikov, Mishra, & Orozco, 2009)
Firms with a positive brand image are associated with a significant market-value premium, superior financial performance, and lower cost of capital (Smith et al., 2010)
Table 6.2. Synopsis of the main findings from the papers in-depth reviewed

52
FIRM PROFITABILITY AND CASH FLOWS
MARKET VALUE AND COMPETITIVE POSITIONING
INVESTORS AND INFORMATION USERS
PATENTS No direct relationship between patents and performance (Artz, Norman, Hatfield & Cardinal, 2010)
Patent share has a significantly negative effect on corporate market value. However, relative patents position has a significantly positive effect on corporate market value (Chen & Chang, 2010)Patent measures reflecting the volume of companies’ research activity, the impact of companies’ research on subsequent innovations, and the closeness of research and development to science are reliably associated with the future performance of R&D-intensive companies in capital markets (Deng, Lev & Narin, 1999)
REPUTATION The relationship between the firm’s reputation and financial performance is non-linear but positive, and the process of the creation of value of companies by means of their reputation is moderated or influenced – though limitedly – by a series of contingent factors (e.g. differentiation strategy, competitive intensity and power of stakeholders) (Sánchez & Sotorrío, 2007)
Superior reputations increase shareholder value in the long term. In addition, non-financial reputation and financial reputation have a differential impact on shareholder value: superior non-financial reputations produce higher abnormal returns than superior financial reputations (Raithel & Schwaiger, 2015)
Both likeability and competence are value-relevant in regard to investors’ expectations about future firm value, and the value relevance of corporate reputation is stakeholder group-specific (Raithel, Wilczynski, Schloderer, & Schwaiger, 2010)
R&D The effect of initial R&D on high-tech firm growth is through increasing levels of interfirm alliances in the first post-entry years. Initial R&D also stimulates new product development later on in the life course of high-tech firms, but this does not seem to affect firm growth. Sample from the Netherlands. (Stam & Wennberg, 2009)Earnings performance is negatively related to the quantity of narrative R&D disclosure. Sample from the USA (Merkley, 2014)Firms capitalise larger amounts of R&D as a means of facilitating access to public debt markets, and capitalised R&D investments reduce the cost of private debt. Global sample. (Kreß, Eierle, & Tsalavoutas, 2019)
R&D investments in the manufacturing sector contribute more positively to firm market value than in the service sector. Sample from the USA. (Ehie & Olibe, 2010)R&D expenditures are significantly and positively associated with average risk premiums. Capital expenditures are also significantly and positively associated with average risk premiums in the regression analysis, unlike the advertising expenses, which did not show consistently positive relationships with average risk premiums. Average risk premiums are generally and significantly related to other conventional risk factors (e.g. firm size, book-to-market ratio, etc.). Sample from the USA (Alam, Liu, & Peng, 2014)
Analysts’ incremental contribution to investors’ decisions is larger in intangibles-intensive companies than in companies with low levels of intangibles, this meaning that financial report deficiencies are partially compensated for by other information sources available to them. Sample from the USA. (Amir et al., 2003)

53
FIRM PROFITABILITY AND CASH FLOWS
MARKET VALUE AND COMPETITIVE POSITIONING
INVESTORS AND INFORMATION USERS
R&D The mean level of realized future operating performance is positively associated with patent quality measured as the citation index of a firm’s patent portfolio; the standard deviation of realized future operating performance is negatively associated with the quality of a firm’s patents. Sample from the USA. (Pandit, Wasley, & Zach, 2011)The positive association between the level of future earnings and R&D intensity increases with firm size, and that the positive association between the volatility of future earnings and R&D intensity decreases with firm size, consistent with R&D productivity increasing with scale. Sample from the USA. (Ciftci & Cready, 2011)
The R&D-related voluntary disclosure is value relevant to investors beyond the recognised earnings, book values, and capitalised R&D, and it is associated with higher share price informativeness. Sample from Israel. (Chen, Gavious & Lev, 2017)The incremental value relevance of disclosing patent counts/ citations is greater than that of capitalising R&D expenses for the firms with high-patent level, and the value relevance of this patent disclosure is more pronounced for firms in industries with stronger protection of intellectual property. Sample from USA. (Ciftci & Zhou, 2016)
The level of R&D-related voluntary disclosure is higher when proprietary costs are lower and when the book-to-market ratio is lower, perhaps because the basic financial statements are less informative about market value. In addition, after controlling for the level of general disclosure and forward-looking disclosure, a negative relation between disclosures about development-stage R&D and both analysts’ one-year-ahead sales forecast error and dispersion is found. Sample from the USA. (Jones, 2007)
CUSTOMER SATISFACTION AND AWARENESS
Firm-level customer satisfaction measures can be economically relevant to the stock market, but they are not completely reflected in contemporaneous accounting book values (Ittner & Larcker, 1998)The CSR and firm performance relationship is a fully mediated relationship through the contribution of CSR to firm performance via better reputation and competitive advantage followed by a higher level of customer satisfaction (Parastoo, So & Saeidi, 2015)The CSR and firm performance (FP) are mediated, in that CSR is linked to both reputation and customer satisfaction, whilst reputation alone mediates the CSR–FP relationship (Galbreath & Shum, 2012)
CSR and firm value are positively related for firms with high customer awareness, as proxied by advertising expenditures. The evidence suggests that advertising expenditures enhance the impact of CSR activities on the value of the firm because advertising creates awareness about the company and its activities, which creates more “goodwill” on the part of customers (Servaes & Tamayo, 2013)Customer satisfaction is a metric that provides valuable information to financial markets. The robust impact of customer satisfaction on stock return risk indicates that it would be useful for firms to disclose their customer satisfaction scores in their annual report to shareholders (Tuli & Bharadwaj, 2009)
Positive changes in customer satisfaction not only improve analyst recommendations, but they also lower dispersions in those recommendations for the firm (Luo, Homburg, & Wieseke, 2010)The quantity of backwards-looking disclosures of customer metrics is not associated with analysts’ uncertainty, and it is weakly associated with investors’ uncertainty. Meanwhile, the quantity of forward-looking disclosures of customer metrics has a significant negative, or an insignificant, effect on analysts’ uncertainty, whilst it has a significant negative impact on investors’ uncertainty (Bayer et al., 2017)

5454
FIRM PROFITABILITY AND CASH FLOWS
MARKET VALUE AND COMPETITIVE POSITIONING
INVESTORS AND INFORMATION USERS
CUSTOMER LIST / CUSTOMER FRANCHISE
The measure of customer franchise value, based on information voluntarily disclosed by some firms, is significantly positively associated with stock price and it is positively associated with future earnings and analysts’ forecast errors (thus reducing their error rate). The value of the customer equity measure is positively and significantly associated with the market value of the firm, as well as with future earnings and analysts’ forecast errors (Bonacchi, Kolev & Lev, 2015)
BUSINESS MODEL The results suggest generic models emerge in an industry, indicating that there are multiple ways to succeed, such that firms gravitate toward standard models and certain of these perform better (Morris, Shirokova & Shatalov, 2013)Regarding the business model design, it is expected that the more novelty centred (more efficiency centred) an entrepreneurial firm’s business model design is, the higher the firm performance, especially in environments characterised by high resource (low resource) munificence (Zott & Amit, 2007)
The results indicate that the specific business model typologies were closest to the analysts’ understanding, incorporating elements of both a narrow (the internal functioning of the firm) and a broad comprehension (that also comprise external elements) of the business model. For example, the analysts described the method of doing business, by focussing on the whole enterprise system and the company’s architecture for generating value. Although, the term business model initially was found to be a misunderstood concept, and in fact rendering mainly negative associations amongst the analyst community, the analysis indicates that the particularities of strategy and competitive strengths mobilised by the analysts in their understanding of the case company in fact comprised a very comprehensive description of the business model when pieced together (Nielsen & Bukh, 2011)

5555
FIRM PROFITABILITY AND CASH FLOWS
MARKET VALUE AND COMPETITIVE POSITIONING
INVESTORS AND INFORMATION USERS
ORGANISATIONAL CAPITAL
The authors developed a firm-specific measure of organisational capital and document that it is associated with five years of future operating and stock return performance, after controlling for other factors. Thus, their organisational capital measure captures firms’ fundamental ability to generate abnormal performance. They found that executive compensation is positively associated with the measure of organisational capital. Collectively the results show that organisational capital is an important intangible asset that is related to firm value and crucial corporate decisions (Lev et al., 2009)
Sell-side analysts particularly use information on intangibles when covering companies with a relatively positive future outlook (positive recommendations). Analysts use more information on intangibles when covering less mature or smaller sized companies. The analysts generally perceived non-financial information as more important than the financial inputs (Grüber, 2015)
HUMAN CAPITAL Human capital disclosure is found to have a positive relationship with firm internal factors, such as workforce’s capabilities, motivation and commitment, or with organisational performance and innovation ability. Human capital disclosure is found to have a positive relationship also with firm external factors, such as the firm attractiveness and reputation for the external stakeholders (Gamerschlag and Moeller, 2011)
By extracting human capital information from German companies’ annual reports, it is found that this information is value relevant. Especially, information on qualification and competence issues is positively associated with firm value. Nonetheless, the disclosed information does not lead to short‐term changes in market value. Consequently, human capital information is value‐relevant but not immediately (Gamerschlag, 2013)Brand Equity and Human Capital are found to have a complementary relationship on firm value and, specifically, there is a significant and positive interaction term for Tobin’s q and cash flows, and a negative interaction term for cash flow volatility (Vomberg & Homburg, 2015)
5656
REFERENCESAlam, P., Liu, M., & Peng, X. (2014). “R&D expenditures and implied equity risk premiums”, Review of Quantitative Finance &
Accounting, Vol. 43, No. 3, pp. 441–462.
Amir, E., Lev, B. and Sougiannis, Th. (2003), “Do financial analysts get intangibles?”, European Accounting Review, Vol.12, No. 4, pp. 635-659.
Artz, K. W., Norman, P. M., Hatfield, D. E., & Cardinal, L. B. (2010), “A Longitudinal Study of the Impact of R&D, Patents, and Product Innovation on Firm Performance”, Journal of Product Innovation Management, Vol. 27, No. 5, pp. 725–740.
Bayer, E., Tuli, K. R., & Skiera, B. (2017). “Do Disclosures of Customer Metrics Lower Investors ’ and Analysts ’ Uncertainty, But Hurt Firm Performance ?”, Journal of Marketing Research, April, Vol. 54, No. 2, pp. 239-259.
Bonacchi, M., Kolev, K., & Lev, B. (2015), “Customer Franchise-A Hidden, Yet Crucial, Asset”, Contemporary Accounting Research, Vol. 32, No. 3, pp. 1024–1049.
Chen, E., Gavious, I., & Lev, B. (2017), “The positive externalities of IFRS R&D capitalisation: enhanced voluntary disclosure”, Review of Accounting Studies, Vol. 22, No. 2, pp. 677–714.
Chen, Y., & Chang, K. (2010), “Exploring the nonlinear effects of patent citations, patent share and relative patent position on market value in the US pharmaceutical industry”, Technology Analysis and Strategic Management, Vol. 22, No. 2, pp. 153–169.
Ciftci, M., & Cready, W. M. (2011), “Scale effects of R&D as reflected in earnings and returns”, Journal of Accounting and Economics, Vol. 52, No. 1, pp. 62–80.
Ciftci, M., & Zhou, N. (2016), “Capitalising R&D expenses versus disclosing intangible information”, Review of Quantitative Finance and Accounting, Vol. 46, No. 3, pp. 661–689.
Deng, Z, Lev, B., & Narin, F. (1999), “Science and Technology as Predictors of Stock Performance”, Financial Analysts Journal, Vol. 55, No. 3, pp. 20–32.
Ehie, I. C., & Olibe, K. (2010), “The effect of R&D investment on firm value : An examination of US manufacturing and service industries”, International Journal of Production Economics, Vol. 128, No. 1, pp. 127–135.
Entwistle G. M. (1999), “Exploring the R&D Disclosure Environment”, Accounting Horizons, Vol. 13, No. 4, pp. 323-341.
Galbreath, J., & Shum, P. (2012), “Do customer satisfaction and reputation mediate the CSR–FP link? Evidence from Australia”, Australian Journal of Management, Vol. 37, No. 2, pp. 211-229.
Gamerschlag, R. (2013), “Value relevance of human capital information”, Journal of Intellectual Capital, Vol. 14, No. 2, pp. 325–345.
Gamerschlag, R., Moeller, K. (2011), “The Positive Effects of Human Capital Reporting”, Corporate Reputation Review, Summer, Vol. 14, Issue 2, pp. 145-155.
Grüber, S. (2015), “Intangible Values in Financial Accounting and Reporting. An Analysis from the Perspective of Financial Analysts”, Springer.
Ittner, C. D., & Larcker, D. F. (1998), “Are nonfinancial measures leading indicators of financial performance? An analysis of customer satisfaction”, Journal of Accounting Research, Vol. 36, No. 1, pp. 1–35.
Jones, D. A. (2007), “Voluntary disclosure in R&D-intensive industries”, Contemporary Accounting Research, Vol. 24, No. 2, pp. 487-522.
5757
Krasnikov, A., Mishra, S., & Orozco, D. (2009), “Evaluating the financial impact of branding using trademarks: A framework and empirical evidence”, Journal of Marketing, Vol. 73, No. 6, pp. 154–166.
Kreß, A., Eierle, B., & Tsalavoutas, I. (2019), “Development costs capitalisation and debt financing”, Journal of Business Finance and Accounting, Vol. 46, No. 5–6, pp. 636–685.
Lev, B., Radhakrishnan, S., & Zhang, W. (2009), “Organization capital”, Abacus, Vol. 45, No. 3, pp. 275–298.
Luo, X., Homburg, C., & Wieseke, J. A. N. (2010), “Customer Satisfaction, Analyst Stock Recommendations, and Firm Value”, Journal of Marketing Research, Vol. 47, No. 6, pp. 1041–1058.
Merkley, K. J. (2014), “Narrative disclosure and earnings performance: Evidence from R&D disclosures”, Accounting Review, Vol. 89, No. 2, pp. 725–757.
Morris, M. H., Shirokova, G., & Shatalov, A. (2013), “The Business Model and Firm Performance The Case of Russian Food Service Ventures”, Journal of Small Business Management, Vol. 51, No. 1, pp. 46–65.
Nielsen, C., & Bukh, P. N. (2011), “What constitutes a business model: The perception of financial analysts”, International Journal of Learning and Intellectual Capital, Vol. 8, No. 3, pp. 256–271.
Pandit, S., Wasley, C. E., & Zach, T. (2011), “The effect of research and development (R&D) inputs and outputs on the relation between the uncertainty of future operating performance and R&D expenditures”, Journal of Accounting, Auditing and Finance, Vol. 26, No. 1, pp. 121–144.
Parastoo, S., So, S., & Saeidi, P. (2015), “How does corporate social responsibility contribute to firm financial performance ? The mediating role of competitive advantage, reputation, and customer satisfaction”, Journal of Business Research, Vol. 68, No. 2, pp. 341–350.
Raithel, S., Schwaiger, M. (2015), “The Effects of Corporate Reputation Perceptions of the General Public on Shareholder Value”, Strategic Management Journal, Vol. 36, No. 6, pp. 945–956.
Raithel, S., Wilczynski, P., Schloderer, M. P., & Schwaiger, M. (2010), “The value/relevance of corporate reputation during the financial crisis”, Journal of Product & Brand Management, Vol. 19, No. 6, pp. 389–400.
Sánchez, J. L. F., & Sotorrío, L. L. (2007), “The creation of value through corporate reputation”, Journal of Business Ethics, Vol. 76, No. 3, pp. 335–346.
Servaes, H., Tamayo, A. (2013), “The Impact of Corporate Social Responsibility on Firm Value : The Role of Customer Awareness”, Management Science, Vol. 59, No. 5, pp. 1045-1061.
Smith, K. T., Smith, M., Wang, K., (2010), “Does brand management of corporate reputation translate into higher market value?”, Journal of Strategic Marketing, Vol. 18, No. 3, pp. 201-221.
Stam, E., & Wennberg, Æ. K. (2009), “The roles of R&D in new firm growth”, Small Business Economics, Vol. 33, No. 1, pp. 77–89.
Tuli, K. R., & Bharadwaj, S. G. (2009), “Customer Satisfaction and Stock Return Risk, Journal of Marketing, Vol. 73, No. 6, pp. 184–197.
Vomberg, A., & Homburg, C. (2015), “Talented People and Strong Brands : The Contribution of Human Capital and Brand Equity to Firm Value”, Strategic Management Journal, Vol. 36, No. 13, pp. 2122–2131.
Zott, Ch., & Amit, R. (2007), “Business model design and the performance of entrepreneurial firms”, Organization Science, Vol. 18, No. 2, pp. 181–199.
5858
INTRODUCTIONThis Chapter deals with the investigation of the manners in and the extent to which intellectual capital (IC) affects the firm market value and competitive positioning as well as its relationships with financial analysts. The concept of intellectual capital embodies a subset of unaccounted intangibles in that it refers, strictly speaking, only to intangibles that are effectively internalised and usefully employed in the activities of an organisation. For example, a company could have a patent that is not used in any way in its operations: this still represents an intangible, but it should not be considered part of the company’s intellectual capital.
Intellectual Capital can be defined as follows:
“Intellectual Capital encompasses the internal (competencies, skills, leadership, procedures, know-how, etc.) and external (image, brands, alliances, customer satisfaction, etc.) intangibles which are dynamically inter-related and available to an organization, thereby enabling it to transform a set of tangible, financial and human resources into a system capable of pursuing sustainable value creation” (WICI Intangibles Reporting Framework, 2016, p. 14).
However, it should be noted that in the academic literature other definitions can be found. In many works, no definition at all is provided by the author(s).
In the academic literature of the last twenty years, it has been typically conceptualised as being composed of three main capitals, namely Organisational (or Structural) Capital, Human Capital and Relational Capital2. The first one relates to the knowledge available to, and procedures that are in place in, the organisation in order to function. The second one refers to the skills and competences of the employees of a company. The third one concerns the relationships that the organisation set up over its existence with those external actors that surround its activities, such as clients, suppliers, communities, etc. As will be pointed out in the following Chapters, these three categories have not to be perceived as rigid, but interconnections exist amongst them.
MAIN TOPICS ADDRESSEDThere are 24 articles reviewed in-depth in this Chapter, which can be categorised as focusing on the following topics:
• Intellectual Capital and its effects on company performance;
• Intellectual Capital and its effects on market value;
• Intellectual Capital and its effects on financial analyst reactions.
INTELLECTUAL CAPITAL AND ITS EFFECTS ON COMPANY PERFORMANCEIf and to what extent intellectual capital affects the performance of companies is probably one of the most debated topics in the examined stream of literature. Since the concept of intellectual capital has emerged and has been popularised, researchers and practitioners have been interested in understanding whether its presence, measurement and reporting can influence firm
2 Although we acknowledge that different theorisations have been proposed over the years, this is the most commonly used.
CHAPTER 7: INFORMATION ON INTELLECTUAL CAPITAL AND ITS EFFECTS ON COMPANY PERFORMANCE, MARKET VALUE, AND USERS

5959
competitive positioning. It has therefore been investigated in organisations belonging to several countries and sectors. De Silvia et al. (2014) have investigated the possible patterns that can be found with reference to intellectual capital reporting in New Zealand. In particular, by means of a longitudinal study conducted between 2004 and 2010, they compare the intellectual capital reports of five knowledge-intensive companies with those of five product-based organisations listed on the New Zealand Stock Exchange. Through a content analysis, they find that it is not possible to identify a specific pattern. Firstly, no significant increase in the number of reports released in the period observed was found, except for two companies. Secondly, it is observed that no specific association between the business model of the company and the level of intellectual capital disclosure exists. In other words, the knowledge-intensive or the product-based activities do not represent a determinant for assessing the quantity of information on intellectual capital disclosed. As for the form of intellectual capital reporting adopted, findings show that the majority of documents are in discursive forms, whilst only a minority in numerical and monetary forms. This is the case especially of the reporting of information related to internal/organisational capital, which is most difficult to quantify. External/relational capital is reported in discursive, monetary and numerical forms, whilst human capital is mainly expressed in a monetary form. Finally, the results obtained demonstrate that when intellectual capital disclosure is voluntary, there is a tendency not to disclose negative information.
Surroca et al. (2010) examine the influence that intangible resources can have in explaining the relationship between corporate (social) responsibility (CRP) and financial performance (CFP). By relying on the natural-resource-based view of the company they investigate 599 industrial firms located in 28 countries. Results demonstrate that there is no linear correlation between CRP and CFP, but a circular, virtuous, one exists. Indeed, on the one hand, CRP enhances the development of intangibles such as innovation, human capital, reputation and culture, which in turn improves the financial performance. On the other hand, the better CFP is, the more intangible resources are developed, and thus, CRP improved. In addition, this is found to be especially the case for growth industries, rather than mature ones where only human capital positively influences the relationship between CRP and CFP. Always through the adoption of a Resource-based-View (RBV) formulation in a context of for-growth industry, Gruber et al. (2010) have investigated how resources and capabilities contribute to the performance of the sales and distribution functional areas both as a whole and also as configurations. Through the use of online surveys conducted amongst 230 young technology firms based in Germany, evidence is found about the emergence of 4 configurations (or clusters) of resources and capabilities. In particular, it is found that firms tend to group together resources and capabilities that are relatively poor, good (2 clusters) and mediocre. In terms of impacts on the performance, whilst it is not surprising that relatively poor and mediocre configurations of resources yield to a low-medium performance, when ‘good configurations’ are considered, the situation changes. Indeed, ‘good configurations’ of resources result in high performance. Hsu and Ziedonis (2013) have moved the focus from the traditional RBV perspective, according to which resources can themselves result in a competitive advantage, to the Penrosian view that posits that relevance should be placed on the services provided by the resources, not on the resources themselves. In other words, there is a decoupling between resources and services. The research is located in the context of patents and it investigates if a single resource, entrepreneurial-firm patents, can play different roles in different competitive arenas. The financing activities of US 370 venture-backed semiconductor start-ups represent the unit of analysis. Results confirm that patents not only isolate firms from product-market rivals, but they are more influential for founders lacking prior entrepreneurial success in securing initial funds from prominent venture capitalists, induce steeper valuation adjustments in earlier rounds of venture capital financing and (conditioned on an IPO exit), play a more influential role in bridging information gaps with public investors when start-ups lack prominent venture capital investors.
Taking a further step in terms of advancement of the RBV, few years after Hsu and Wang (2012) have examined how dynamic capabilities – “organisational routines that can accumulate knowledge via learning processes” (p. 180) - influence the relationship between intellectual capital and firm-level performance. The dynamic-capabilities view posits that resources, in this case intellectual capital, do not create value by themselves, but they have to be leveraged through capabilities. This way, they are transformed into outputs. Furthermore, thanks to their dynamic nature, these processes allow an organisation to continuously be able to face external challenges and opportunities. The authors hypothesise that all the three components of IC, namely human, relational and structural capitals are positively related to performance and test these in a sample of 242 high-tech Taiwanese companies in the time period from 2001 to 2008.

6060
By means of a statistical regression method, the authors find that dynamic capabilities completely mediate only the effect that structural capital has on performance. The effects of human and relational capitals on performance are only partially influenced by dynamic capabilities.
Andreeva and Kianto (2012) examine how knowledge management practices, considered as “the set of management activities that enable the firm to deliver value from its knowledge assets” (p. 618) impact on the competitiveness and financial performance of companies. In order to do so, human resource management (HRM) and information and communication technology (ICT) are taken into consideration and investigated in a sample of 234 companies belonging to different sectors and industries with differently growth rates located in Russia, China and Sweden. Results show that both HRM and ICT positively influence the competitiveness of companies and their financial performance. However, with reference to the latter, two different results are found. Whilst HRM impacts positively on financial performance, for ICT this is the case only when the relationship is affected by HRM. In other words, investments in ICT are fruitful for the organisation only when employees actually use and benefit from them.
With reference to corporate governance mechanisms, Cerbioni and Parbonetti first (2007) and Li et al. (2008) after, found that some of them can influence the disclosure (in terms of quantity and/or quality) of intellectual capital. Identifying a sample of 54 European biotechnology firms listed on the stock market of a European country, Cerbioni and Parbonetti first (2007) have analysed the impact of a company’s board size, composition (in terms of proportion of independent outside directors), CEO duality and board structure on the type and amount of intellectual capital an organisation discloses. The examination is conducted on their Operating Financial Reviews in the period from 2002 and 2014 (included). Evidence demonstrates that Board structure, CEO duality and size are negatively correlated to disclosure, while the proportion of independent directors is positively associated. However, in terms of quality of the disclosure, it is found that the presence of independent directors affects only information on internal capital. This is not the case for the disclosure of forward-looking information and bad news. Li et al. (2008) have examined if and how the corporate governance characteristics of 100 UK firms listed on the London Stock Exchange and belonging to seven intellectual capital-intensive industries can influence intellectual capital disclosure in annual reports. The time period is for financial year-ends between March 2004 and February 2005. Taking into consideration five characteristics (board composition in terms of proportion of independent non-executive directors, role duality – where the same person undertakes both the role of chief executive and chairman –, ownership structure/share concentration, audit committee size and frequency of meetings, they observe that role duality is not found to influence intellectual capital disclosure and that share ownership concentration is negatively associated to it, this meaning that in the presence of dominant shareholders there is less pressure for the reporting of this type of information. The other three variables are found to be significantly and positively associated. As for the influence that corporate governance mechanisms have on the disclosure on the three sub-categories of intellectual capital, human, structural/organisational, and relational, it results that the presence of independent non-executive directors results in the disclosure of more information related to human, structural and relational capitals, while the presence of block shareholders appears to lead to more disclosure on relational capital.
As for the financial sector, and in particular the banking one, Cabrita and Bontis (2008) and Mention and Bontis (2013) have located their investigations in three different European countries, Portugal, Luxembourg and Belgium. With reference to the banking sector in Portugal, Cabrita and Bontis have examined the interrelationships and the interaction effects among intellectual capital components and business performance in 53 banks. To do so, a survey has been submitted to 430 executives of these banks, as they were considered the “appropriate employees who possessed the special qualifications” (p. 221). Hypotheses have then been tested by adopting Partial Least Square (PLS), a structural equation modelling technique. Results indicate that the three components of intellectual capital affect each other. Human capital affects structural and relational capitals (the latter both directly and indirectly) and business performance. These findings evidence that by recognising the value of intellectual capital for itself, the banking sector in Portugal should be able to recognise their value also in other knowledge-intensive industries. Mention and Bontis (2013) have replicated the above study in Luxembourg and Belgium. By adopting a slightly amended version in terms of items included in the questionnaire, they have administered it to a sample containing the whole population of banks registered in the countries. Similar to Cabrita and Bontis (2008), human capital was confirmed to have an influence on both relational and structural capitals and performance. In addition, it is observed that relational capital moderates the effect of structural capital on performance and negatively moderate the effect of human capital on performance. These results could, however, be explained by the items taken into consideration to investigate the structural capital (that are mainly associated with innovation). Despite these differences, results evidence the important role that intellectual capital has on the performance of industries, also in terms of interrelationships between its components.

6161
In terms of innovation, Soto-Acosta et al. (2016) have examined the factors that influence the use of e-business and its effect on organisational innovation in a sample of 175 Spanish manufacturing SMEs. Data were collected through a pilot study and questionnaires administered to CEOs. The hypotheses were tested through structural equation modelling and in particular, Partial Least Square. Results obtained reveal that technology integration is positively related to the extent of e-business use and value and that commitment-based HR practices is fundamental for the promotion of an organisational context that adopts e-business. As for the external environment, it is found that competition intensity does not influence the adoption of e-businesses. On the contrary, its uptake is related to internal organisational and technological resources. Regarding the association between e-business and organisational innovation, a positive association was found, this confirming that e-business is a significant element for driving organisational innovation. In turn, organisational innovation mediates the relationship between the extent of e-business use and firm performance. Always in terms of impacts that intellectual capital, innovation and organisation strategy have on company performance, Kalkana et al. (2014) have investigated these relationships in Antalya, Turkey. Questionnaires were administered to a sample of 186 insurance companies. Findings support the view that intellectual capital, innovation and organisational strategy positively affects firm performance.
INTELLECTUAL CAPITAL AND ITS EFFECTS ON MARKET VALUEAnother topic that has been widely investigated in the literature on intellectual capital, and that often goes hand-in-hand with company performance, is the relationship between the disclosure of information associated with these types of resources and firm market value. Vergauwen et al. (2007) demonstrated that it was not possible to relate the level of IC disclosure with the market to book value of companies from the top end of the market capitalisation scale and located in countries with the highest intellectual capital (IC) performance index, that are those considered as highly relying on this type of resources, Denmark, UK and Sweden. However, amongst the three components of IC, structural/organisational capital was the one most reported and that had a significant impact on performance. Orens et al. (2009) examine the impact that web-based intellectual capital reporting has on firms’ value and its cost of finance in a sample of 267 non-financial listed companies from four continental European countries, namely Belgium, Netherlands, France and Germany, belonging to eight industries in 2002. It is found that French and German companies tend to disclose more information related to intellectual capital. These results can be related to the major presence of the organisations located in the above countries in a larger number of foreign stock exchanges and in the media. The data shows that cross-sectional differences in the extent of IC disclosure are positively associated with firm value and negatively with the cost of finance. It is also confirmed that the more information on intellectual capital is disclosed, the lower is the information asymmetry, the lower the implied cost of capital and the lower the rate of interest paid, and this can be referred to all the three components of IC. Moving the examination to the Greek context (Maditinos et al., 2011), particularly in a sample of 96 companies listed on the Athens Stock Exchange (ASE), from four different economic sectors and observed over a three-year period from 2006 to 2008, the above findings were not confirmed. Indeed, only human capital efficiency was found to have a statistically significant relationship with financial performance. These results could be deemed to the use of Value-Added Intellectual Capital Coefficient (VAIC) methodology. As stated in the paper, “[i]n general, the empirical studies that have used the VAIC approach in order to investigate the impact of IC on various business variables have concluded on contradictory results.” (p. 144) (see Section E for a more detailed presentation of VAIC). In a similar vein, also Berzkalne and Zelgalve (2014) find mixed results when adopting VAIC to investigate the relationship between intellectual capital and company value. In a sample of 65 Baltic listed companies over the period from 2005 to 2011. While a statistically significant and positive relationship between intellectual capital and company value for enterprises in Latvia and Lithuania was observed, it was not the same for companies located in Estonia. In the UK context (Zeghal and Maaloul, 2010), the use of VAIC has demonstrated to be a useful tool. Applied to 300 companies divided into three groups of industries (high-tech, traditional and services), this methodology has demonstrated that IC has a positive impact on economic and financial performance, even though the association between IC and stock market performance is only significant for high‐tech industries.
With reference to a knowledge-intensive sector, i.e. the information and communication technology (ICT) sector, and through a longitudinal study, Dženopoljac et al. (2016) demonstrated that, despite the expectations, the ICT sector in Serbia was not IC-intensive. Indeed, in analysing a sample of 2,137 companies operating in this sector between 2009 and 2013, they found that out of the three components of IC (human capital, relational capital and organisational capital), only capital-employed efficiency

6262
positively influences the financial performance of these organisations. In addition, no significant differences were observed in the financial performance of ICT subsectors as a result of the presence of IC assets. These results were mainly affected by both a methodological and a ‘contextual’ aspect. Also in this case the use of value added intellectual capital (VAIC), did not allow the researchers to appreciate the interrelationships between the IC components. The (in)validity of VAIC as an appropriate measure of intellectual capital was also proved by Ståhle et al. (2011) some years before. They conceptually and empirically – through a test on 125 Finnish companies – pointed out that VAIC is far from being an appropriate indicator for intellectual capital for three main reasons. Firstly, it refers to the efficiency of the investments on labour and capital. Secondly, the variables used in the formula are overlapping, this leading to validity problems. Thirdly, it does not relate to the economic performance of companies. In view of these criticisms, Nimtrakoon (2015) has adopted a Modified Value Added Intellectual Coefficient (MVAIC) to examine the association between firms’ IC, market value, and financial performance in ASEAN countries. By adding an extra component, namely, relational capital efficiency, a sample of 213 technology firms listed on five ASEAN stock exchanges was observed. Results supports the view that there is a positive association between IC and market value and IC and financial performance. A fundamental role in this association is played by capital employed and human efficiency, whilst this is not the case for structural capital and relational capital efficiency. In addition, also Singh and Kansal (2011) find that in the top 20 listed pharmaceutical companies in India in 2009 there is a negative and weak association between IC valuation and disclosure. Kang and Gray (2011) observed that companies of emerging markets tend to voluntary disclose a lot of information, especially in quantitative form, related to intellectual assets. These results can be related to the use of a different methodological tool, the Value Chain Scoreboard developed by Professor Baruch Lev in 2001 and the context, which is represented by emerging markets.
INTELLECTUAL CAPITAL AND ITS EFFECTS ON FINANCIAL ANALYSTSThe effects that intangibles and intellectual capital have on users, namely investors and financial analysts are also a fundamental aspect to be taken into consideration when discussing the relevance of these resources. Barth et al. (2001) have examined the relationship between analysts’ coverage, which is the number of analysts covering a firm, and intangible assets. In other words, they have investigated whether the presence of intangibles assets in a firm can influence the willingness of analysts to follow it. This is because not being recognised in financial statements, in the absence of analyst coverage firms with more intangible assets likely would have less informative prices. Results obtained indicate that firms and industries with higher research and development expense and firms with higher advertising expense have greater analyst coverage. In addition, analyst coverage is greater for firms requiring less effort to follow and with greater analyst-perceived residual mispricing. Hsu and Chang (2011) have focussed their analysis on intellectual capital disclosure and analysts’ forecast. In a sample of 99 Taiwanese high-tech industries their analysis evidences that voluntary disclosure of intellectual capital can facilitate analysts forecasting process, especially if the value of the intellectual capital is not easily verifiable.
MAIN FINDINGSFrom the papers investigated in this Chapter, it can be observed that in general intellectual capital has a positive effect on company performance, market value and users. In terms of theoretical frameworks adopted to examine these relationships, several studies have adopted the Resource-based View and its different formulations (e.g. dynamic capabilities impact on the relationship between IC and firm-level performance).
As for corporate governance mechanisms, Cerbioni and Parbonetti (2007) and Li et al. (2008) found that some of them can influence the disclosure in terms of quantity and/or quality of IC (e.g. proportion of independent directors & audit committee size). In the financial sector (especially in the banking one), Cabrita and Bontis (2008) in Portugal and Mention and Bontis (2013) in Luxembourg and Belgium have investigated the relationship between IC disclosure and banks’ performance, they found that the three IC components affect each other, and that human capital affects structural and relational capitals (the latter both directly and indirectly) and business performance.

6363
With reference to innovation, Kalkana et al. (2014) find that intellectual capital, innovation and organisation strategy positively affect company performance. With regards to market value, Orens et al. (2009) examine the impact that web-based intellectual capital reporting has on firms’ value and its cost of finance. They observe that the more information on intellectual capital is disclosed, the less is the cost of capital, and this can be referred to all the three components of IC. Finally, intellectual capital information is found to positively influence analysts’ coverage and forecast.
REFERENCESAdnan Kalkana, Ö., Çetinkaya B., and Mutlu A. (2014), “The Impacts of Intellectual Capital, Innovation and Organizational
Strategy on Firm Performance”, Procedia - Social and Behavioral Sciences, Vol. 150, No. 15, pp. 700-707.
Andreeva, T., Kianto, A. (2012), “Does knowledge management really matter? Linking knowledge management practices, competitiveness and economic performance”, Journal of Knowledge Management, Vol. 16, No. 4, pp. 617-636.
Barth, M.E., Kasznik, R., and McNichols, M.F. (2001), “Analyst coverage and intangible assets”, Journal of Accounting Research, Vol. 39, No. 1, pp. 1-34.
Berzkalne, I., and Zelgalve, E. (2014), “Intellectual capital and company value”, Procedia-Social and Behavioral Sciences, Vol. 110, pp. 887-896.
Cerbioni, F., Parbonetti, A. (2007), “Exploring the effects of corporate governance on intellectual capital disclosure: An analysis of European biotechnology companies”, European Accounting Review, Vol. 16, No. 4, pp. 781-826.
de Silva, T.-A., Stratford, M., and Clark, M. (2014), “Intellectual capital reporting: A longitudinal study of New Zealand companies”, Journal of Intellectual Capital, Vol. 15, No. 1, pp. 157-172.
Do Rosário Cabrita, M., and Bontis, N. (2008), “Intellectual capital and business performance in the Portuguese banking industry”, International Journal of Technology Management, Vol. 43, No. 1-3, pp. 212-237.
Dženopoljac V., Janoševic S., and Bontis N. (2016), “Intellectual capital and financial performance in the Serbian ICT industry”, Journal of Intellectual Capital, Vol 17, No.2, pp. 373-396.
Gruber, M., Heinemann, F., and Brettel, M. (2010), “Configurations of resources and capabilities and their performance implications an exploratory study on technology ventures”, Strategic Management Journal, Vol. 31, No. 12, pp. 1337-1356.
Hsu, D.H., Ziedonis, R.H. (2013), “Resources as dual sources of advantage: Implications for valuing entrepreneurial-firm patents”, Strategic Management Journal, Vol. 34, No. 7, pp. 761-781.
Hsu, L.-C., Wang, C.-H. (2012), “Clarifying the Effect of Intellectual Capital on Performance: The Mediating Role of Dynamic Capability”, British Journal of Management, Vol. 23, No. 2, pp. 179-205.
Hsu, Wen-Hsin, Chang, Yao-Ling, (2011), “Intellectual capital and analyst forecast: evidence from the high-tech industry in Taiwan”, Applied Financial Economics, Vol. 21, Issue 15, pp. 1135-1143.
Kang, H.H., Gray, S.J. (2011), “Reporting intangible assets: Voluntary disclosure practices of top emerging market companies”, International Journal of Accounting, Vol. 46, No. 4, pp. 402-423.
Li, J., Pike, R., and Haniffa, R. (2008), “Intellectual capital disclosure and corporate governance structure in UK firms”, Accounting and Business Research, Vol. 38, No. 2, pp. 137-159.
Maditinos, D., Chatzoudes, D., Tsairidis, C. and Theriou, G. (2011), “The impact of intellectual capital on firms’ market value and financial performance”, Journal of Intellectual Capital, Vol. 12, No. 1, pp. 132-151.
Mention, A.-L., Bontis, N. (2013), “Intellectual capital and performance within the banking sector of Luxembourg and Belgium, Journal of Intellectual Capital, Vol. 14, No. 2, pp. 286-309.
6464
Nimtrakoon, S. (2015), “The relationship between intellectual capital, firms’ market value and financial performance: Empirical evidence from the ASEAN”, Journal of Intellectual Capital, Vol. 16, No.3, pp. 587-618.
Orens, R., Aerts, W. and Lybaert, N. (2009), “Intellectual capital disclosure, cost of finance and firm value”, Management Decision, Vol. 47, No. 10, pp. 1536-1554.
Singh, S., Kansal, M. (2011), “Voluntary disclosures of intellectual capital: An empirical analysis”, Journal of Intellectual Capital, Vol.12, No. 2, pp. 301-318.
Soto-Acosta, P., Popa, S. and Palacios-Marques, D. (2016), “E-business, organizational innovation and firm performance in manufacturing SMEs. An empirical study in Spain”, Technological and Economic Development of Economy, Vol. 22, No.6, pp. 885-904.
Ståhle P., Ståhle S., and Aho S. (2011), “Value added intellectual coefficient (VAIC): A critical analysis”, Journal of Intellectual Capital, Vol 12, No. 4, pp.531-551.
Surroca, J., Tribo, J.A., and Waddock, S. (2010), “Corporate Responsibility and financial performance. The role of intangible resources”, Strategic Management Journal, Vol. 31, No. 5, pp. 463-490.
Vergauwen, P., Bollen, L. and Oirbans, E. (2007), “Intellectual capital disclosure and intangible value drivers: An empirical study”, Management Decision, Vol. 45, No. 7, pp. 1163-1180.
Zéghal, D., Maaloul, A. (2010), “Analysing value added as an indicator of intellectual capital and its consequences on company performance”, Journal of Intellectual Capital, Vol. 11, No. 1, pp. 39-60.

6565
THE WORKS OF THIS CHAPTERThe aim of this Chapter is to investigate the proposals of outside-traditional-accounting frameworks, models and tools that address – at least partially – the problem of the measurement and reporting of unaccounted intangibles and intellectual capital, thus representing potential solutions to that issue.
There are in total 17 works reviewed in-depth in this Chapter. In addition to the 15 academic articles, this chapter also illustrates the International Integrated Reporting Framework by the International Integrated Reporting Council (IIRC), as well as the Intangibles Reporting Framework issued by the World Intellectual Capital/Assets Initiative (WICI) in September 2016, which is the only extant Framework that has been developed for the reporting on this class of resources. Although we acknowledge that there are different Frameworks that deal with the measurement and reporting of intangibles, we here focus on those that are internationally recognised and that deal with unaccounted intangibles and intellectual capital.
THE MODELS AND TOOLS PROPOSED FOR INTANGIBLES/INTELLECTUAL CAPITAL DISCLOSURE, REPORTING AND VALUATIONIn terms of development and proposal of models and tools related to intangibles and intellectual capital disclosure, reporting and valuation, scholars from different disciplines have been quite productive over the years. Intellectual capital is, in fact, a ‘fuzzy’ concept with blurred boundaries. This connotation has left space for a variety of proposals on how to depict its measurement, management and disclosure. To date the most well-known methods are probably:
• the Skandia Navigator developed by Edvinsson (1997) and Edvinsson and Malone (1997);
• the Intangible Assets Monitor proposed by Sveiby (1997);
• the Balanced Scorecard by Kaplan and Norton (1992, 1996, 2000);
• the Knowledge Capital Earnings by Lev and Mintz (1999);
• the Value Chain Scoreboard by Lev (2001);
• the Strategic Resources & Consequences Report by Lev and Gu (2016);
• the Value Added Intellectual Capital Coefficient (VAIC) by Pulic (2000, 2003 and 2005).
The Skandia Navigator
The Skandia Navigator (SN) has been developed by Edvinsson (1997) and Edvinsson and Malone (1997) who have been the pioneers of this area by recognising the ‘hidden’ value of the company. The SN aims to enable a holistic understanding of how a company creates value. In order to do so, it proposes a conceptualisation of IC as composed of five categories of assets, namely 1) financial; (2) customer; (3) process; (4) renewal and development; and (5) human. The financial focus, which represents the past performance of the company, captures the financial outcome of the organisation’s activity. The Customer, Human and Process focuses embody the actual performance. The first one provides an indication of the ability of the company to fulfil the needs of customers via services and products. The second one represents the core area as it relates to the skills and competences of employees. The third one captures the processes of creating products and services. The Renewal and Development focus represents the performance of tomorrow. In other words, what are the actions that an organisation is
CHAPTER 8: FRAMEWORKS AND MODELS FOR MEASURING AND REPORTING ON INTANGIBLES AND THEIR CONSEQUENCES ON COMPANY PERFORMANCE, MARKET VALUE, AND USERS

6666
undertaking to ensure its long-term growth and profitability? All the above-mentioned focuses are not to be conceived as stemming from the vacuum, but they are imbued in an operational environment.
Leve
l 3Le
vel 2
Leve
l 1
OPERATING ENVIRONMENT
IC
HISTORYFINANCIAL FOCUS
RENEWAL & DEVELOPMENT FOCUS
CUSTOMERFOCUS
PROCESSFOCUS
HUMANFOCUS TODAY
TOMORROW
Source: Edvinsson, 1997, p. 371.
The Intangible Assets Monitor
Proposed by Sveiby (1997), the Intangible Assets Monitor is a method for measuring and presenting information on intangible assets. The rationale behind the Monitor is that individuals in organisations create external and internal structures to express themselves. Indicators can be created that monitor External Structure (Customers and Suppliers), Internal Structure (Organisation) and People’s Competence. For each of the three structures, the indicators monitor growth/renewal, efficiency and stability. A number of generic indicators are defined under each heading.
Figure 8.2 – The Intangible Assets Monitor
EXTERNAL STRUCTURE
INTERNAL STRUCTURE COMPETENCE
Indicators of Growth/Renewal
Indicators of Growth/Renewal
Indicators of Growth/Renewal
Indicators of Efficiency
Indicators of Efficiency
Indicators of Efficiency
Indicators of Stability
Indicators of Stability
Indicators of Stability
Source: Sveiby, 1997, p. 78.
The Balanced Scorecard
Similar to the Skandia Navigator, the Balanced Scorecard (Kaplan and Norton, 1992, 1996, 2000) recognises that the company’s vision and strategy can be operationalised through four perspectives: (1) financial; (2) customer; (3) business/internal process, and (4) learning and growth. The financial perspective focuses on the need for financial data, such as funding ones. The Customer perspective focuses on metrics able to capture their satisfaction. The Business/internal process perspective refers to the internal processes. Metrics based on this perspective allow managers to understand how their business is run and whether the products and services conform to customer needs. The Learning and Growth perspective includes employee training and corporate cultural attitudes related to both individual and corporate self-improvement. The focus on the above-mentioned perspectives support companies in connecting the strategic/high-level objectives with measures, targets and initiatives.
Brea
dth
of c
omm
unic
atio
n
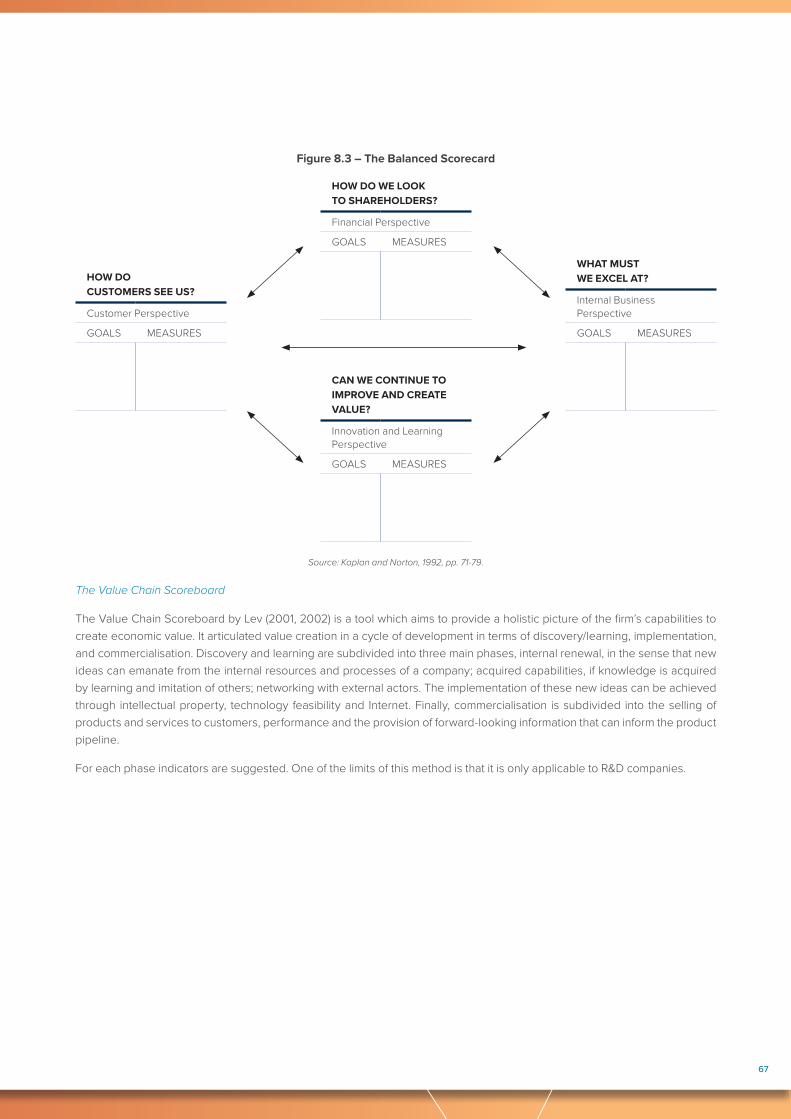
6767
Figure 8.3 – The Balanced Scorecard
HOW DO WE LOOK TO SHAREHOLDERS?
Financial Perspective
GOALS MEASURES
HOW DO CUSTOMERS SEE US?
Customer Perspective
GOALS MEASURES WHAT MUST WE EXCEL AT?
Internal Business Perspective
GOALS MEASURES
CAN WE CONTINUE TO IMPROVE AND CREATE VALUE?
Innovation and Learning Perspective
GOALS MEASURES
Source: Kaplan and Norton, 1992, pp. 71-79.
The Value Chain Scoreboard
The Value Chain Scoreboard by Lev (2001, 2002) is a tool which aims to provide a holistic picture of the firm’s capabilities to create economic value. It articulated value creation in a cycle of development in terms of discovery/learning, implementation, and commercialisation. Discovery and learning are subdivided into three main phases, internal renewal, in the sense that new ideas can emanate from the internal resources and processes of a company; acquired capabilities, if knowledge is acquired by learning and imitation of others; networking with external actors. The implementation of these new ideas can be achieved through intellectual property, technology feasibility and Internet. Finally, commercialisation is subdivided into the selling of products and services to customers, performance and the provision of forward-looking information that can inform the product pipeline.
For each phase indicators are suggested. One of the limits of this method is that it is only applicable to R&D companies.

68
Figure 8.4 – The Value Chain Scoreboard
DISCOVERY AND LEARNING IMPLEMENTATION COMMERCIALIZATION
1. Internal renewal• Research and development• Work force training and
development• Networking
4. Intellectual property• Patents, trademarks and
copyrights• Licensing agreements• Coded know-how
7. Customers• Marketing alliances• Brand values• Customer churn and value• Online sales
2. Acquired capabilities• Technology purchase• Spillovers utilization• Capital expenditures
5. Technological feasibility• Clinical tests, Food and Drug
Administration approvals• Beta tests, working pilots• First mover
8. Performance• Revenues, earnings and market
share• Innovation revenues• Patent and know-how royalties• Knowledge earnings and assets
3. Networking• R&D alliances and joint ventures• Supplier and customer integration• Communities of practice
6. Internet• Threshold trafic• Online purchase• Major internet alliances
9. Growth prospects• Product pipeline and launch
dates• Expected efficiencies and
savings• Planned initiatives• Expected break even and cash
burn rate
Source: Lev, 2000, p. 111.
Knowledge Capital Earnings
This methodology (Lev and Mintz, 1999) analyses the returns on physical and financial capital and determine the economic value of an enterprise’s intellectual capital. It measures the value of intangible assets based on the economic concept of “production function”, where the firm’s economic performance is stipulated to be generated by the three major classes of inputs - physical, financial, and knowledge assets. Thus, Economic Performance = α (Physical Assets) + β (Financial Assets) + δ (Intangible Assets). α, β and δ represent the contributions of a unit of asset to the enterprise performance. However, this methodology presents limitations. The present accounting system does not differentiate between income generated from Intangible, Tangible and Financial Assets. Income is generated by the exploitation of all the resources available to the organisation. In addition, the process of calculation of Knowledge Capital Earnings implies a high degree of subjectivity since the discounting rate used for the DCF is based on assumptions and observations.
Figure 8.5 – Knowledge Capital Earning
COMPANY PERFORMANCE –INCOME FROM
TANGIBLE ASSETS AND FINANCIAL ASSETS
7% rate on Tangible Fixed Assets4.5% rate on Financial Assets
=INCOME FROM INTANGIBLE RESOURCES
(KCE)
Discounted Cash Flow DCF
INTANGIBLE ASSETS OR KNOWLEDGE CAPITAL
Source: elaboration from Lev and Mintz, 1999.

69
The Strategic Resources & Consequences Report
Lev and Gu (2017) have recently proposed an evolution of the Value Chain Scoreboard, namely the Strategic Resources and Consequences Report. As compared to the previous tool, this is more generic and is applicable to a wide range of sectors. It also better highlights the steps to create value from the identification of resource development costs to strategic resources, resources preservation, resource deployment and value created.
Figure 8.6 – SIRIUS XM Inc.: Resources & Consequences Report – Second Quarter 2013 (Numbers in the boxes are, from left: for the current, previous, and year-earlier quarters)
Note: boxes provide quantitative data, while circles provide qualitative information.Source: Lev and Gu, 2016, p. 136.
In addition to these efforts, scholars have proposed other conceptualisations by combining the above-mentioned extant models. Choong (2008) has proposed a reporting system that is based on a classification system and a value chain reporting system that has to be used in the initiation, development, implementation, and commercialisation of a firm’s products and services. It theorises IC as composed of Human Capital, Structural Capital, Customer Capital and Intellectual Property Capital. All the information related to these capitals, together with those associated with tangible assets is tracked in the whole value chain of the organisation. It then provides inputs to the processes of initiation, development, implementation, and commercialisation of a firm’s products and services and thus explains how profits or value added and shareholder value are created.
Some years after, An, Davey and Eggleton (2011) have also proposed a comprehensive theoretical framework for understanding the IC voluntary practice by companies. As compared to the framework proposed by Choong, it did not take into consideration the already extant models related to IC, but it integrated the most four commonly-used theories, namely agency theory, stakeholder theory, signalling theory, and legitimacy theory.

7070
The Value Added Intellectual Capital Coefficient (VAIC) model
The VAIC (Value Added Intellectual Capital Coefficient) method was developed by a Croatian professor, Ante Pulic (2000), who was one of the first scholars in the field of IC research to focus explicitly on the connection between IC and economic performance, and the first to base his analyses solely on company accounting and financial figures. Another factor that sets Pulic apart from the rest of the field is that he straightforwardly applies established IC concepts in the realm of company economic productivity.
The VAIC model is intended to measure the extent to which a company produces added value based on intellectual capital/resources efficiency. VAIC calculations are based on:
A) human capital (HC), which is basically interpreted as employee expenses,
B) structural capital (SC), which is interpreted as the difference between produced value added (VA) and human capital (HC), i.e. SC = VA – HC; and
C) capital employed (CE), which is interpreted as financial capital invested (asset value).
Based on these definitions and assumptions VAIC is calculated as the direct sum of key efficiency figures, which in turn are calculated as ratios:
A) capital employed efficiency (CEE) = VA/CE;
B) human capital efficiency (HCE) = VA/HC; and
C) structural capital efficiency (SCE) = SC/VA.
As an intermediate result, intellectual capital efficiency (ICE) is defined as
ICE = HCE + SCE,
and, finally,
VAIC = ICE + CEE
VAIC is thus a relational index, in which produced value added is compared to capital employed and both human capital (i.e. employee expenses) and structural capital. The VAIC index normally ranges between 1 and 3, and it is calculated as the sum of the three ratios of value added to capital employed (CEE), value added to human capital (HCE) and structural capital (whose value is very close to the EBIT) to value added (SCE).
VAIC is a model very often employed and studied, but not always understood. Furthermore, its variables are unstable and do not seem to provide a rigorous model for measuring the contribution of Intellectual Capital resources to the financial and market performance of an organisation.
Some criticisms raised in the literature follow (Ståhle et al., 2011; Marzo, 2018).
- IC or IC efficiency? There are some ambiguities in the way some authors refer to VAIC, which is actually a measure of the Intellectual Capital efficiency and not of Intellectual Capital. In Pulic’s papers, indeed, Intellectual Capital is identified – and therefore measured – as the Value Added. This is not fully understood, as many scholars still refer to VAIC as the measure of Intellectual Capital.
- Dependent Variables. VAIC has been analysed in regard to the financial performance of the firm and/or its market value. Some papers generally refer to the organisation’s success, the business performance or, in some case, the productivity of the firm. Anyway, whilst the market value is generally measured by the share value of the firm or by the market-to-book value, all the other papers are measured by using financial ratios. The most commonly used financial ratios are ROE and ROA. However, different authors use diverse formulae for the calculation of those ratios. For instance, ROA is calculated using the Operating Profit before or after taxes, and both are calculated using the at-the-end of the period value or the average value

7171
of two consecutive periods as the denominator. Other frequently employed financial measures are ATO, the asset turnover ratio, EP, the Employees efficiency, and the Revenue Growth (RevGrw).
- Independent Variables. Almost all articles that have analysed the association of VAIC with either the financial performance or the market value of the firm, have also explored the relationship of the dependent variable with the three components of VAIC.
- Control Variables. The most used control variables are ‘leverage’ and ‘firm size’. However, as in the case of dependent variables, the two variables are calculated in different ways. For instance, they are sometimes based on either book value or market value.
- Methodology of analysis. Almost all the articles have implemented statistical analyses based on linear models, either in the form of OLS for the most considerable part of the papers, or panel data. The investigated papers, therefore, do not take into account that the SCE is a transformation of the HCE, which results in the generation of non-linear regression between HCE and the dependent variable.
- Results of analysis. In general, results are ambiguous. Some papers have found a positive and significant relationship between the dependent variable and both VAIC and its components. In the majority of cases, however, CEE and HCE show the highest regression coefficients. Often, the coefficient of CEE is higher than that of other variables, thus witnessing the higher importance of physical capital over the intellectual capital. Other studies have found results statistically non-significant, with the only exception of CEE that is usually positively and significantly associated with the dependent variables.
The main similarities and differences existing amongst the above-discussed models can be summarised as follows (Table 8.1).
Table 8.1 – A comparison of the models and tools proposed for intangibles/intellectual capital disclosure, reporting and valuation
PURPOSE
REPORTING/MEASUREMENT/VALUATION
IC COMPONENTS/PERSPECTIVES INCLUDED
KPIS PROPOSED (YES/NO)
THE SKANDIA NAVIGATOR
It enables a holistic understanding of how a company creates value
Reporting Five perspectives: (1) financial, (2) customer, (3) process, (4) renewal and development (5) human
NO
THE INTANGIBLE ASSETS MONITOR
Measurement and presentation of information on intangible assets
Reporting and Measurement
Internal and External Structures of a company
YES(categorised in terms of Growth, Efficiency and Stability)
THE BALANCED SCORECARD
Operationalisation of company vision and strategy
Measurement Four perspectives: (1) financial; (2) customer; (3) business/internal process; and (4) learning and growth
YES(for each perspective indicators are proposed)
THE VALUE CHAIN SCOREBOARD
It provides a holistic picture of the firm’s capabilities to create economic value
Measurement Value creation as a cycle of development in terms of discovery/learning, implementation, and commercialisation
YES

7272
Source: authors’ elaboration.
THE FRAMEWORKS RELATED TO INTELLECTUAL CAPITAL/INTANGIBLES DISCLOSURE AND REPORTINGThe WICI Framework
The most advanced framework for reporting on intellectual capital is that published in September 2016 by the World Intellectual Capital/Assets Initiative (WICI), i.e. the “WICI Intangibles Reporting Framework” (WIRF). Although it is not a ‘fully academic’ effort as it has seen the participation of institutions and company representatives, it can be adopted by companies to report information on these “special” resources. Indeed, its purpose is to establish the principles, the contents and the structure for the reporting of intangible resources that are material for an organisation’s value creation process and its communication to stakeholders. Its primary target audience is all companies and other organisations of the private, public and non-profit sectors.
The Framework is principles-based and “in its four Chapters it describes the contextual background, provides a definition and a classification of intangibles, offers interpretations of the main principles for intangibles reporting and communication, and outlines the possible structure and contents of reporting on intangibles” (WIRF, p. 5). As compared to the previous models, it outlines a definition of intangibles and it highlights the interrelationships that exist between human, organisational and relational capital. Intangibles are defined as “non-physical resources which, either alone or in conjunction with other tangible or intangible resources, can generate a positive or a negative effect on the value of the organisation in the short, medium and long term” (p. 13). WIRF also recognises that intangibles may impact two distinct but inter-connected forms of value:
PURPOSE
REPORTING/MEASUREMENT/VALUATION
IC COMPONENTS/PERSPECTIVES INCLUDED
KPIS PROPOSED (YES/NO)
KNOWLEDGE CAPITAL EARNINGS
Analysis of the returns on physical and financial capital and determination of the economic value of an enterprise’s intellectual capital
Measurement/Valuation
Value of intangible assets based on the economic concept of “production function”
NO
THE STRATEGIC RESOURCES & CONSEQUENCES REPORT
It provides a holistic picture of the firm’s capabilities to create economic value
Reporting and Measurement
Value creation composed of resource development costs, to strategic resources, resources preservation, resource deployment and value created
YES
VAIC It measures the extent to which a company produces added value based on intellectual capital/resources efficiency
Valuation IC efficiency composed of: Human capital, interpreted as employee expenses; structural capital interpreted as the difference between produced value added (VA) and human capital (HC); and capital employed interpreted as financial capital invested (asset value)
NO

7373
• Strategic value is related to the enhancement of the competitive, market, product, reputation, and/or risk profile of the organisation;
• Financial value is linked to the generation of net cash flows over time.
In the Framework, intangibles are considered as substantially equivalent to the notion of Intellectual Capital, that is defined as “the internal (competencies, skills, leadership, procedures, know-how, etc.) and external (image, brands, alliances, customer satisfaction, etc.) intangibles which are dynamically inter-related and available to an organisation, thereby enabling it to transform a set of tangible, financial and human resources into a system capable of pursuing sustainable value creation” (p. 14).
Then, it identifies five ‘guiding principles’ according to which information on intangible resources can be reported and communicated, namely materiality, connectivity, conciseness, comparability and future orientation. Finally, it proposes KPIs and a structure for intangibles reporting. With reference to KPIs, the Framework posits that they can be articulated on three levels: a) General KPIs are those that may be relevant for most organisations across industries and sectors; b) Industry-specific KPIs are those specific to a certain industry or sector; c) Organisation-specific KPIs are those specific to each organisation that should be reported in order to best represent its unique value creation mechanism. As for the structure for intangibles reporting, the proposed one includes three main sections, Outline of activities and value creation model, Intangibles and value creation from past-to-present, and Intangibles and value creation from present-to-future. The order of the three sections can be flexible. WIRF is a companion Framework to the International Integrated Reporting Framework presented in the next paragraph (see Figure 8.1).
Figure 8.7 – WICI’s Framework Focus within the corporate reporting landscape
CORPORATE REPORTING
FINANCIAL REPORTING
INTANGIBLES REPORTING
SUSTAINABILITY REPORTING
Financial Capital
Manufactured Capital
Human Capital
Intellectual Capital*
Social and Relationship
Capital
Natural Capital
Six capitals as defined by IIRC * Organisational Capital according to WICI Framework
Source: WICI Intangibles Reporting Framework, 2016, p. 9.
To date, the WICI Framework is explicitly adopted by some companies in Japan and Italy, especially in the drafting of their integrated reports. In fact, being a companion framework to the International <IR> Framework they are used in combination, especially because the former proposes KPIs to measure and report information on intangibles, whilst the latter not. An example of how these Frameworks are used by companies is provided below.
“With the 2016 Report, the company continued its dissemination of information referring to the reporting aspects of the ESG, within the ‘International <IR> Framework. This had already been carried out with the previous annual reports, through the use of the international standard GRI, version 4.0 (2013). Furthermore, in order to better represent Human, Intellectual and Relational Capital, the Company has further investigated some aspects suggested by the WICI intangibles Reporting Framework (3), as recently published. This document represents an important international initiative in the light of the growing importance of intangibles for the processes of corporate value creation.” (Dellas Integrated Report, 2017, p. 57, emphasis added, www.dellasdiamondtools.com/media/download/Dellas_Integrated_Annual_Report_2017_en.pdf).
7474
“The Intangibles Reporting Framework that the Global Network World Intellectual Capital Initiative (WICI) (www.wiciglobal.com) is a further reference for the elaboration of this document and, particularly, for the metrics concerning the intangibles.” (Stafer Integrated Report, 2016, p. 70).
In terms of research contributions that have analysed the implementation of the WICI Framework, so far there are none.
The International Integrated Reporting Framework by the IIRC
Integrated Reporting is also a framework that recognises the relevance of intangibles and intellectual capital. Launched in December 2013, the International <IR> Framework aims to help companies communicate – to the providers of financial capital and the other stakeholders – how they intend to continue creating value in the short, medium and long-term. The concept of integrated reporting is based on multi-capital thinking: it recognises that organisations rely on a variety of capitals to create value, namely manufactured, natural, intellectual/organisational, social and relationship, financial and human. These capitals represent in fact the inputs to the company business model and are then transformed into outputs (products) and outcomes (impacts). It has to be noted that three of the above-mentioned capitals are of an intangible nature, i.e. intellectual/organisational, social and relationship and human. For this reason, several papers have been developed by scholars to investigate which is the role of intangibles in integrated reports.
Melloni (2015) analyses the integrated reports available in the International Integrated Reporting Council web site to understand how information related to Intellectual Capital (IC) is reported in this new type of documents. Findings evidence that a major effort is done by companies to disclose information on relational capital, with a limited number of quantitative and forward-looking information. Furthermore, companies tend to report more positive than negative information, especially when they experience a declining performance, a bigger size and a higher level of intangibles, this supporting the view that intellectual capital disclosure in integrated reports can be used for an impression management strategy.
More recently, Stacchezzini et al. (2019) and Terblanche and De Villiers (2019) have highlighted quite an opposite ‘use’ of IC in integrated reports. The former authors demonstrate how IC can be adopted as an ontology in the preparation of the integrated report in an energy company. Through in-depth interviews with the corporate team involved in the preparation of this report, they find that integrated reporting is able to revitalise the function of IC and its understanding throughout the organisation. Similarly, the latter authors reveal that the adoption of integrated reporting ‘pushes’ companies to disclose more information on IC, although this is not the case of cross-listed companies.
Although explicit measures for IC and intangibles were not used, the paper by Barth et al. (2017) highlights the relevance of information on intangible resources by companies that use integrated reports. In examining a sample of listed companies on the Johannesburg Stock Exchange, they observe that integrated reporting quality is positively associated with liquidity and expected future cash flows, while no association is found for cost of capital.
Girella et al. (2019) investigate the firm and country determinants of the voluntary adoption of integrated reporting by an international sample of companies and by using market-to-book ratio as a proxy for intellectual capital, they evidence a positive association between the presence of information on these resources and the willingness to adopt integrated reports. To put it differently, the more information a company has on IC, the more it is inclined to report them through an integrated report.
In 2016-17, the IIRC’s Framework appears to be adopted in some form and to different extents by ca. 1,900 companies around the world (Gibassier, Adams and Jérôme, 2019, p. 18).
MAIN FINDINGSThe aim of this Chapter has been to review the proposals of frameworks, models and tools that address – at least partially – the problem of the measurement and reporting of unaccounted intangibles and intellectual capital, as well as some academic papers discussing their effectiveness. From this analysis, it has been possible to note that, whilst a variety of models to measure and value these resources still exist, in terms of reporting two are the most valuable solutions, i.e. the WICI Intangibles Reporting Framework and the International <IR> Framework. Despite quite recent, the former has already resulted to be a valuable tool to

7575
support companies in that it provides a reporting structure and KPIs articulated by industry. The latter has been – amid other things – an efficient instrument to ‘revitalise’ the attention of managers towards the relevance of intangible capitals.
REFERENCESAn, Y., Davey, H., Eggleton, I.R.C. (2011), “Towards a comprehensive theoretical framework for voluntary IC disclosure”, Journal
of Intellectual Capital, Vol. 12, No. 4, pp. 571-585.
Barth, M.E., Cahan, S.F., Chen, L., Venter, E.R. (2017), “The economic consequences associated with integrated report quality: capital market and real effects”, Accounting, Organizations and Society, Vol. 62, pp. 43-64.
Choong, K.K. (2008), “Intellectual capital: definitions, categorization and reporting models”, Journal of Intellectual Capital, Vol. 9, No. 4, pp. 609-638.
Gibassier, D., Adams, C., and Jérôme, T. (2019), “Integrated Reporting and the Capitals’ Diffusion”, Project financed in 2017 by the Autorité des Normes Comptables - 2017/2018, (http://www.anc.gouv.fr/files/live/sites/anc/files/contributed/ANC/3.%20Recherche/B_Appels%20%c3%a0%20projets/2017/First_report_ANC_final_version_GIBASSIER_ADAMS_JEROME_2019-07-24.pdf).
Girella, L., Rossi, P. and Zambon S., (2019), “Exploring the firm and country determinants of the voluntary adoption of integrated reporting”, Business Strategy and the Environment, Vol. 28, Issue 7, November, pp. 1323-1340.
International Integrated Reporting Council (IIRC) (2013), International <IR> Framework.
Edvinsson, L. (1997), “Developing intellectual capital at Skandia”, Long Range Planning, Vol. 30, No. 3, p. 366-373.
Edvinsson, L. and Malone, M. S. (1997), Intellectual capital, HarperBusiness.
Lev, B., and Mintz, S.L. (1999), “Seeing is Believing: A Better Approach to Estimating Knowledge Capital”, CFO Magazine, Vol. 15, February, pp. 29-37.
Lev, B. (2000), Intangibles: Management, measurement, and reporting, Brookings Institution Press.
Lev, B., and Gu, F. (2016), The end of accounting and the path forward for investors and managers, John Wiley & Sons.
Kaplan, R. S., and Norton, D. P. (1992), “The balanced scorecard: measures that drive performance”, Harvard Business Review, January-February, pp. 71-79.
Kaplan, R. S., and Norton, D. P. (1996), The Balanced Scorecard: Translating Strategy into Action, Harvard Business School Press, Boston, MA.
Kaplan, R. S., and Norton, D. P. (2000), The Strategy-Focused Organization: How Balanced Scorecard Companies Thrive in the New Business Environment, Harvard Business School Press, Boston, MA.
Marzo, G. (2018), “VAIC: Metonymies, Ambiguities and Inconsistencies”, Paper presented at the 14th EIASM Interdisciplinary Conference on “Intangibles and Intellectual Capital”, Munich, September 20-21, 2018.
Melloni, G. (2015), “Intellectual capital disclosure in integrated reporting: an impression management analysis”, Journal of Intellectual Capital, Vol. 16, No. 3, pp. 661-680.
Pulic, A. (2000), “VAIC™ – An accounting tool for IC management”, International Journal of Technology Management, Vol. 20, No. 5-8, pp. 702-714.
Stacchezzini, R., Florio, C., Sproviero, A. F. and Corbella, S. (2019). “An intellectual capital ontology in an integrated reporting context”, Journal of Intellectual Capital, Vol. 20, No. 1, pp. 83-99.

7676
Sveiby, E. K. (1997), “The intangible assets monitor”, Journal of Human Resource Costing & Accounting, Vol. 2, No. 1, pp. 73-97.
Ståhle P., Ståhle S., and Aho S. (2011), “Value added intellectual coefficient (VAIC): A critical analysis”, Journal of Intellectual Capital, Vol 12, No. 4, pp.531-551.
Terblanche, W. and De Villiers, Ch. (2019), “The influence of integrated reporting and internationalisation on intellectual capital disclosures”, Journal of Intellectual Capital, Vol. 20, No. 1, pp. 40-59.
World Intellectual Capital/Assets Initiative (WICI) (2016), Intangibles Reporting Framework, September (http://www.wici-global.com/framework).

7777
CHAPTER 9: THE STUDIES ON INTANGIBLES REPORTING BY THE EUROPEAN COMMISSION, THE OECD AND THE EFFAS: A SYNTHESIS
THE EUROPEAN COMMISSION STUDIES ON INTANGIBLES (2000-2017): A SYNTHESIS IN A REPORTING PERSPECTIVEOver the last 19 years, the European Commission has tendered studies and set up expert groups devoted to various economic, valuation and institutional issues in the area of intangibles and intellectual capital.
The most relevant of these studies and reports are the following:
1) The Intangible Economy – Impact and Policy Issues, Report of the European High Level Expert Group (HLEG) on the Intangible Economy, prepared for the Commission of the European Communities, Enterprise Directorate General, November 2000 (https://web.archive.org/web/20030423161427/http://europa.eu.int:80/comm/enterprise/services/business_services/documents/studies/intangible_economy_hleg_report.pdf);
2) Study on the Measurement of Intangible Assets and the Associated Reporting Practices, prepared by the University of Ferrara (lead partner), the Stern School of Business (NYU), and the University of Melbourne for the Commission of the European Communities, Enterprise Directorate General, April 2003 (https://ec.europa.eu/growth/content/study-measurement-intangible-assets-and-associated-accounting-practices_nn);
3) Report on the Feasibility of a Pan-European Enterprise Data Repository on Intangible Assets, Study by Mantos Associates in association with IASCF and Athena Alliance, prepared for the Commission of the European Communities, Enterprise Directorate General, 2004;
4) Reporting Intellectual Capital to Augment Research, Development and Innovation in SMEs (RICARDIS), by the ad hoc High Level Expert Group (HLEG), prepared for the Commission of the European Communities, Directorate-General for Research and Innovation, June 2006 (https://op.europa.eu/en/publication-detail/-/publication/60cbf27c-5552-429f-a077-44135a97cc27/language-en);
5) Creating a Financial Market for IPR, Study by the University of St. Gallen and Fraunhofer Institute, prepared for the Commission of the European Communities, Enterprise Directorate General, December 2011 (https://publications.europa.eu/en/publication-detail/-/publication/afdc8beb-866f-400e-913b-23f4c018e58b);
6) Intellectual Property Valuation, Final Report from the Expert Group on Intellectual Property Valuation, prepared for the Directorate-General for Research and Innovation, May 2014 (https://publications.europa.eu/en/publication-detail/-/publication/797124c6-08cb-4ffb-a867-13dd8a129282/language-en);
7) Unlocking Investment in Intangible Assets, Discussion paper no. 47 by Anna Thum-Thysen, Peter Voigt, Benat Bilbao-Osorio, Christoph Maier and Diana Ognyanova, European Commission, Directorate-General for Economic and Financial Affairs, May 2017 (https://ec.europa.eu/info/publications/economy-finance/unlocking-investment-intangible-assets_en).
In the following, a synthesis of the above studies will be provided focussing specifically on the issues linked to the measurement and reporting of intangibles.
THE INTANGIBLE ECONOMY – IMPACT AND POLICY ISSUES – OCTOBER 2000According to the special High Level Expert Group set up by the European Commission (Directorate General “Enterprise and Industry”) on the above topic, one of the conclusions of the Study is that “the present statistical and accounting frameworks are in urgent need of updating. New explanatory models and metrics are needed to enable us to understand the workings
7878
of the modern economy, especially the intangible goods and ‘content’ sectors that are currently hidden from public view. At the firm level, a new generation of analytical tools is needed to enable company boards, shareholders and investors to judge management performance and differentiate good, bad and delinquent corporate stewardship.” (p. 7).
STUDY ON THE MEASUREMENT OF INTANGIBLE ASSETS AND THE ASSOCIATED REPORTING PRACTICES – APRIL 2003Upon the publication in 2002 of an ad hoc tender, the European Commission (Directorate General “Enterprise and Industry”) appoints a research team composed of academics from the University of Ferrara (lead partner), the University of Melbourne and the New York University for preparing a Study on the issues linked to the measurement of intangible assets and the related reporting practices. In the following, a synthesis drawn from the Executive Summary of the Study (pp. 1-13) will be provided.
One of the pillars of the new agenda for intangibles and their profound implications for the economic system, companies, and financial and management reporting, includes new information structures required to satisfy the needs of corporate executives, capital market investors, and public policymakers in intangibles-intensive economies.
Overall, the rising importance of intangible assets in the economy raises a major problem. Intangible assets are not well measured. The complex and uncertain nature of intangible assets leads to their being either imperfectly measured (for instance, innovation is usually measured by the amount of R&D expenditure, although not all R&D activity leads to innovation and not all innovation is created in R&D activities; innovation is also measured by the number of patents, although a large proportion of innovation is not patented, other forms of protection of the innovation being used) or not measured at all (the creativity or innate abilities of a person). As shown in the Study, such measurement problems results in the vulnerability of firms or countries which base most of their performance on intangible assets. Regarding this aspect, service sector firms are particularly vulnerable, given that most of their activity and value creation is related to intangibles.
An important priority of policy-making emerges. The growing importance of intangibles reflects the fact that added value is determined by the additional knowledge (of technologies, of the market, etc.) that is introduced. The imperfect assessment of such knowledge implies that a firm’s value is not well assessed by the market and hence the growing divergence between market value and true value. This results in uncertainty and speculation on firms’ value, with sometimes dramatic consequences, as shown by the case of the dot-com companies. Firms in the service sector are particularly exposed to such problems because their activity is almost entirely based on knowledge (i.e. intangible) assets.
The most important policy implication is that it is necessary and urgent to define sure rules and conventions in order to measure the intangible content of value. For this purpose, firms must adopt a transparent behaviour. As shown by the Study, the studies on how to best measure firms’ intangible assets conclude that the most relevant information comes from who knows the firm best, namely the managers. However, managers often have incentives not to reveal the true information, for various reasons, including ensuring a good valuation of the firm’s value or avoiding that some strategic information reaches competitors. Therefore, only objective measurement methods could avoid such data manipulation.
At this stage, the priority of European policy (but also policy in other countries like the US or Australia in particular) should be not so much to define policies to increase individual intangible assets in the European economy, but rather to make intangible explicit, in the sense of providing sure rules and conventions for their measurement, as well as clear administrative instruments in order to penalise those who do not follow the rules.
Further research on intangibles is needed, in particular regarding the second problem outlined above, that of a conceptual framework. For this purpose, the issue of the forms, determinants and effects of the new organisational infrastructures, of which networks, should be further examined. Another key issue is that of understanding the interactions between assets, the source of their complementarities, which in turn determine the MFP and hence a country’s growth.
From the Study and the above considerations a major paradox emerges. The more the system is founded on intangible assets, the stronger it is, because these assets allow creating more value than tangible ones. However, measurement problems imply at the same time that the more the system is based on intangible assets, the more vulnerable it is because its value is
7979
uncertain. In other words, an economic system based increasingly on intangibles may be more robust in the long term, since the exploitation of intangible assets permits more sustainable value creation than a system based on tangible assets. Yet, the issues associated with the measurement and valuation of intangible assets entail that the system becomes more unstable, volatile, and ultimately vulnerable.
At this stage, it seems that the priority of European policymakers should be not so much to define policies to promote the growth of individual intangible assets in the economy, but rather to make intangibles more explicit at enterprise and macroeconomic level, in the sense of providing clear rules and conventions for their measurement, as well as transparent administrative instruments in order to more easily penalise those who do not follow the new rules. In short, policies should be primarily directed to make intangibles more visible, more measurable, and, as a result, better manageable.
The main general goal of this approach is then to improve the effectiveness of resource allocation, both at the enterprise level and in government policy development, in order to foster economic growth.
This implies two orders of specific policy actions. First, improving current measurement rules (of intangibles and tangibles that are currently imperfectly measured) and developing new measurement systems for the intangible assets that are not measured as yet (e.g. social capital), both at a company and macroeconomic level.
Second, facilitating the development of intangibles and, in particular, the creation of more developed and easily accessible private markets for intangible assets: in particular, an effective European patent system for some intangibles might constitute a first important step in this direction.
Amid the proposed specific policy actions emerging from the Study, one deals with reporting regulation and practices. In particular, it is recommended that a public authority or an authoritative body (e.g. a Task Force) charged with the analysis of how to develop a new measurement system and regulation dealing with intangible assets.
REPORT ON THE FEASIBILITY OF A PAN-EUROPEAN ENTERPRISE DATA REPOSITORY ON INTANGIBLE ASSETS – NOVEMBER 2004In 2003, the European Commission (Directorate General “Enterprise”) commissions a research to Mantos Associates, a consultancy firm, to explore the issues relating to the possibility of establishing a repository of corporate data and information on intangibles assets. In the following, a synthesis of the Final Report of the Study is provided.
To be competitive in today’s world requires a company to develop the capacity to manage, measure and control the flow of knowledge and intangible assets. Understanding of these processes, however, is inhibited by the paucity of good data sources on intangible assets – the nature of the different asset classes, their values, which companies and industries hold them, and how all these factors are changing over time. Such data could only assist Europe and its constituent countries and companies take positive steps towards the realisation of the Lisbon agenda.
The overriding conclusion of the Study is that the potential for closing this information gap over the coming years is considerable. Although IFRS 3 identifies five major categories of intangible assets there is no prescription on companies to present their data in this manner. The asset classes are illustrative only: they are there to exemplify the scope of intangible assets that are regarded as separately identifiable for accounting purposes, and not to prescribe how they might be delineated or presented. The study’s analysis of recent reporting practice in both Europe and the US strongly suggests that, absent the prescription of clearly identifiable and defined categories, coherent data on the intangible assets of corporate Europe will not emerge. Companies will adopt their own idiosyncratic approach to the breakdown of the aggregated intangible asset figure on their balance sheet. To illustrate the point, of the 102 US corporate acquisitions of 2002 analysed by the study, 22 different categories were used to break out the intangible assets on the balance sheet, with a considerable degree of overlap between them.
Another problem is that these data sets are to be found only in the notes to the accounts, not on the face of the financial statements themselves. Therefore, if U.S. practice is anything to go by, their extraction and collation will fundamentally be a

8080
manual process. Otherwise, the only level at which IFRS will ‘automatically’ throw off data will be at the aggregated level of total intangible assets. Whilst this would represent a step forward, it would constitute a very small step.
The obstacles at the ‘source’ level of company accounts are compounded by the challenges of how and where to capture such data. The study’s review of the EU’s existing corporate data repositories reveals a bewildering, heterogeneous array of legacy systems for data gathering, filing and distribution. These repositories, of which there are hundreds of data collection nodes in certain countries, pertain to corporate registries, central banks, securities regulators, tax authorities and national statistical offices. They are primarily underpinned and governed by national law. Whilst some efforts are made at co-ordination within these communities, national laws and regulations are a major barrier to effective harmonisation.
Coherence and quality of data is one obstacle; the efficient, paperless capture and distribution of data is another. The status of digitisation varies widely across the EU Member States. Whilst initiatives exist to drive this process, what is missing is any direction in terms of converging on digitisation standards.
The central issue is less a question of cherry-picking a ‘perfect’ solution now than how to tackle the present miasma of confusion and lay the foundations of a world-class information system. The recommended strategy would be for the Commission to concentrate on the regulatory space, while at the same time stimulating the private sector to fill the market space thus created. The practical feasibility of such a strategy is contingent upon obtaining consensus on a unified XBRL IFRS 3 taxonomy and getting a grip on the detail of the accounting and electronic conventions, rules and codes, which need to be monitored and revisited periodically.
This would require the appointment or creation of a lead institution to provide political leadership and coordinate the various legal, accounting, technological aspects of a pilot project. The first practical steps on this journey might revolve around setting up an operational pilot to create a working database. Given that the extraction and collation of the necessary data will, in the short term at least, be essentially a manual process, an appropriate technology institution should be appointed to develop a pilot database, initially for those intangible assets covered by IFRS 3 and perhaps later expanding to include intangible assets which currently fall outside the accounting net and which are not accessible to capture today.
“In summary, the report calls for a sustained policy initiative aimed at a wide range of interrelated measures. The challenges are significant, and the Commission and its institutions are uniquely well placed to take a lead role in championing and supporting it at the highest political levels.” (p. 15).
REPORTING INTELLECTUAL CAPITAL TO AUGMENT RESEARCH, DEVELOPMENT & INNOVATION IN SMES (RICARDIS) – 2006 (JUNE)In 2005, the European Commission (Directorate General “Research”) establishes a High-Level Expert Group with the aim of addressing the problem of the development of European research-based SMEs for which the traditional financial reporting is not able to fully represent their assets and performance. In this respect, the Study states that “[t]he traditional accounting model is based on the principle of historic cost and for this reason, only a very narrow range of intangibles is included within financial statements. In providing a record of what has happened in the past, historic cost accounts provide a useful starting point in assessing the performance of a business. However, without forward-looking information, the picture that they provide is incomplete. Intellectual Capital (IC) Statements take a different and complementary stance by considering those things which are valuable in evaluating the future (rather than only the past) and this means that a much wider range of intangibles needs to be included. The methodology of considering historical financial statements and forward-looking IC Statements together is aimed at improving the transparency of the way in which an organisation is seeking to create value.” (p. 9).
“A good IC Report will improve an organisation’s internal processes for managing its overall resources, both tangible and intangible. Even more importantly, it will provide a sound basis for improving the quality of the dialogue with financiers by explaining why the organisation does what it does and how it is building the resources and capabilities necessary to succeed in the future. IC Statements help to clarify the way in which competitive advantage is being built by providing a narrative which explains both value chain positioning and the business model for value creation.” (p. 9).

8181
“For research-intensive SMEs, with a focus on R&D, innovation and future prospects, the ability to provide a credible picture of what is being done and why this will result in future success, is particularly important. In the Communications on Investing in Research: an Action Plan for Europe COM[2003]226 and the Communication on business-related services COM[2003]747, the European Commission intends to address this issue of improved identification, measuring and reporting; in order to overcome the present lack of reliable information about an enterprise’s Intellectual Capital. This is especially relevant for research-intensive SMEs which, although IC intensive, have less means to convince investors about the value of their Intellectual Capital than larger enterprises.” (pp. 9-10).
“Intellectual Capital is defined as the combination of an organisation’s Human, Organisational and Relational resources and activities. It includes the knowledge, skills, experiences and abilities of the employees, its R&D activities, organisational routines, procedures, systems, databases and its Intellectual Property rights, as well as all of the resources linked to its external relationships; such as with its customers, suppliers, R&D partners, etc. (MERITUM, 2002). Intellectual Capital can be both the product of R&D activities and the enabler for creating greater value from R&D. This combination of intangible resources and activities allows an organisation to transform a bundle of material, financial and human resources into a system capable of creating stakeholder value. For intangibles to become part of the intellectual capital of an organisation, these have to be durably and effectively internalised and/or appropriated by it.” (p. 10).
Intellectual Capital is the result of, and the prerequisite for, successful R&D
“Intellectual Capital is a key element in an organisation’s future earning potential. Theoretical and empirical studies show that it is the unique combination of the different elements of Intellectual Capital and tangible investments that determines an enterprise’s competitive advantage. R&D and innovation can be regarded as one element of Intellectual Capital. However, research-intensive enterprises invest not only in R&D and innovation, but also in other forms of Intellectual Capital. Empirical studies provide evidence for the tight link and contingency between investments in R&D, Innovation, Human Resources and Relational Capital.” (p. 10).
“Reporting on R&D and innovation resources by SMEs is not sufficient in itself, but needs to be supplemented by reporting on crucial complementary assets, developing the ability to sense and seize new opportunities, as well as learning to protect its Intellectual Capital.” (p. 10).
Policy options to stimulate IC Reporting
“Adoption of IC Reporting will help to mitigate the difficulties encountered by research-intensive SMEs to find financing for their research and innovation projects and thereby contribute significantly to increasing research investments in Europe. Part of the well-identified market failures in the financing of research and innovation by research-intensive SMEs is due to a lack of transparency into their intellectual capital and complementary assets. The use of IC Reporting as a management and reporting tool can help to counter these failures. Creating more transparency, both externally and within enterprises, about the role of intellectual capital and complementary assets in successful innovation will lead to a better understanding of value creation by research-intensive SMEs and provide a better basis for decision-making to managers and investors.” (p. 13).
“Stimulating IC Reporting requires an approach from the European Commission aimed at a process of coordination and convergence of guidelines that will empower national policies and will allow translation and adoption in the various member states at different speeds and levels.” (p. 13). “Common in all national approaches must be the sequence starting from the internal implementation of IC awareness, followed by improving IC Reporting competencies and IC management routines that provide the basis for the use of IC Reporting. As SMEs learn how to make the best use of their intangibles and prepare relevant IC Statements, an important step towards more effective management behaviour will have been achieved. As IC Reporting is spread among research-intensive SMEs, the standardisation of IC Reporting can be facilitated.” (pp. 13-14).
The Expert Group considers governmental policy initiatives to be necessary for each of the interconnected four areas pointed out above (see italic).
The Expert Group formulates also “seven policy recommendations that can be seen as a set of options for the Commission to practically address improved identification, measuring and reporting of Intellectual Capital.” (p. 14). Amid these policy recommendations, the following seems of most significance in terms of reporting.

8282
WHAT SHOULD BE DONE? WHO ACTS? WHY SHOULD THEY ACT?
Establish an European Adoption Task Force that oversees and catalyses the development of IC Reporting and management in research-intensive SMEs and acts as a learning platform. The Adoption Task Force should work on three work packages:
1. Raise IC awareness among research-intensive SMEs
2. Improve IC reporting competencies by research-intensive SMEs
3. Promote the use of IC reporting by research-intensive SMEs
European Commission • To maximise the speed by which practices spread across European settings
• To facilitate mutual learning between member States on prototyping experiments
• To maintain momentum in developing IC in research-intensive SMEs
• To help sharing practices between member states
• To show good practices and develop ambitions for IC Reporting towards convergence of methods
CREATING A FINANCIAL MARKET FOR IPR - DECEMBER 2011This Study aims to assess the challenges and different opportunities arising from a possible creation of a financial market for Intellectual Property Rights (IPR) in Europe.
“Access to IPR is a serious issue for research organisations and firms wishing to further develop their products, to complement the technological state of the art, or to place new products on technology markets – marketplaces where IP can be sold and bought, which follow clear and transparent rules and open ways for innovators to access IPR.” (p. 5).
The IPR Market comprises the IPR Asset Market and the IPR Financial Market. In order to be both successful and sustainable, an IPR Financial Market requires a properly functioning IPR Asset Market. Financial markets benefit from more developed markets for the underlying assets since this increases transparency. “Financial products or vehicles connect the IPR Financial Market with the IPR Asset Market. The characteristics of these products or vehicles influence the trade in assets, i.e. patents. There are private vehicles, public-private vehicles and commoditisation vehicles.” (p. 5).
Policy recommendations address the IPR Market, the IPR Asset Market, as well as the IPR Financial Market and are grouped accordingly.
INTELLECTUAL PROPERTY VALUATION – MAY 2014In 2013, the European Commission (Directorate General “Research”) appointed an Expert Group on Intellectual Property (IP) Valuation with this aim: “as IP and Intellectual Property Rights (IPR) play an increasingly important role in corporate strategy, the accurate valuation of IP remains a major obstacle to their emergence as a tradable asset class. Though there are several generally accepted ways to measure the value of IP, the introduction of more transparency in IP valuation procedures may render the trading of IPR significantly more efficient and profitable.” (p. 5).
“The intangible assets created through the processes of innovation represent a major share of the value of today’s businesses. The IP rights associated with those assets are the legal underpinning for potential returns on investment in that innovation. Despite their fundamental importance, the understanding of IP and IP rights does however differ widely amongst businesses large and small.” (p. 5).
The above Expert Group “has demonstrated that it is not the lack of valuation methods per se, nor even the standards for valuing IP, which are not missing, but rather other barriers that are having a greater influence on business and lenders.” (p. 5).
8383
“Numerous valuation standards have been issued during the last years concerning different IP rights with a different geographical scope and a dissimilar regulation approach. They have different binding power for professionals, organisations or for certain applications. It is important to note that these standards and guidelines have no contradictory content. Also, from a content perspective, they are quite homogeneous.” (p. 6).
In the Accounting and Reporting section, the Expert Group reports that “there are limitations on when and how it is possible to place the value of IP assets on the balance sheet of the company. The complexity of IP from an accounting perspective leads to problems in its reporting, which may result in the vulnerability of firms which base most of their performance on IP” (p. 6).
“The existing regulatory situation implies that IP can only be recognised in rare cases, and mostly at historical cost based on a previous acquisition of such IP. It is difficult to recognise internally generated IP because, when the expenditure to develop the IP is incurred, it is usually unclear whether it will generate benefits in the future. As a consequence, an important part of internally generated IP is not recognised in the balance sheet of an enterprise, meaning that potential investors are not receiving some relevant information about the company.” (p. 6).
“The filing of a ‘management report’ together with the annual report, giving detailed information about IP value, seems to be a useful vehicle to improve publicly available information on intangibles.” (p. 7).
“The Expert Group recommends a number of policy actions that could have a significant impact on reducing the identified barriers (including an insufficient reporting regime) in order to increase the efficient use of IP valuation and to make such valuation flexible, transparent and reliable to respond to market requirements. In particular, it is recommended to introduce “an additional reporting section for intangible assets and IP that would increase the transparency of IP value within company accounts, providing important information to lenders, investors and stakeholders” (p. 7).
UNLOCKING INVESTMENT IN INTANGIBLE ASSETS – MAY 2017This European Commission paper is aimed to study the specificities of intangible assets (see also Ch. 3 above), i.e. “what makes them a special type of asset; present a set of facts in order to understand their order of magnitude and trend patterns; discuss existing and provide new empirical evidence on their contribution to economic growth and productivity; and finally [to] assess potential drivers of and barriers to investment in intangible assets.” (p. 34).
Several conclusions can be drawn from the conceptual and empirical findings. In particular, “the results show …. that trends of investments in intangibles have been rather stable even during the recent crisis, which may imply that the emerging knowledge economy is a strong driver for investment in intangibles.” (p. 34).
Further, the Thum-Thysen et al. analysis provides evidence that “investments in intangible assets tend to be underestimated. The System of National Accounts captures only about half of the total investment in intangible assets and also corporate financial reports provide only limited information on companies’ investments in intangibles.” (p. 34).
“These conclusions raise several policy implications for public authorities which go well beyond the intangible sector, i.e. facilitating the emergence of the knowledge economy. More specifically, the following of interest in corporate reporting terms can be identified. Both policy and statistical offices should adopt an enlarged understanding and corresponding measurement of knowledge creation and the notion of intangible capital, including R&D, but also taking into account the relevance and complementarity/synergies of other intangibles such as computerised information and economic competences. A comprehensive understanding of intangibles as a source of growth at a macro-economic level is needed. Policy can help by developing common measurement guidelines (to be applied by statistical offices).” (pp. 34-35).
“Also important is an improvement of systematic reporting of investments in all relevant intangibles and as a driver of value creation for individual firms. This may also facilitate getting access to finance (capitalised intangibles might be used as collateral), improve corporate governance and market transparency. In fact, evidence suggests that the market value of a firm tends to be increasingly driven by its productive stock of intangibles than by the firm’s tangible assets. Policy can help by suggesting new standards for accounting and corporate disclosure” (p. 35) [emphasis added].
84
Finally, it is noteworthy that, between the end of the ‘90s and the beginning of the 2000’s, the European Commission has also funded two large research projects in the area of intangibles management, reporting and valuation, which are known under the acronyms of “MERITUM” (that proposed a Guideline for Intellectual Capital Reporting) and “PRISM” (https://www.valuebasedmanagement.net/organizations_prism.html), which have been later followed by a research project called “E*Know-Net”.
As a general observation, it can be noted that between 2000 and 2006 the European Commission has produced four studies dealing with the reporting on intangibles, whereas from 2006 to 2017 the studies published on this subject area have been three. In particular, with the 2017 study, the European Commission seems to have taken up again the issue of measurement of intangibles at least in a macro-economic perspective.
THE OECD STUDIES ON ACCOUNTING AND REPORTING FOR INTANGIBLES (2006-2017): A SYNTHESISSince 2008, the OECD (Organisation for Economic Cooperation and Development) has also published some significant studies in the field of accounting for and reporting on intangibles, providing some clear policy indications for standard setters, policymakers, audit firms and professionals, companies and investors. Indeed, the commitment of OECD to these issues goes back to the half of the ‘90s. In particular, the first large international event on intangibles and intellectual capital reporting has been organised by the OECD in 1999 (OECD International Symposium on “Measuring and Reporting Intellectual Capital: Experience, Issues, and Prospects”, Amsterdam, 9-11 June 1999).
The most relevant OECD studies for the present review appear to be:
1) Intellectual Assets and Value Creation: Implications for Corporate Reporting, by Mrs Annabel Bismuth in cooperation with Mr Grant Kirkpatrick, 10 December 2006;
2) Intellectual Assets and Value Creation - Synthesis Report, 2008;
3) Corporate Reporting of Intangible Assets: A Progress Report, April 2012;
4) New Sources of Growth: Knowledge-Based Capital (KBC) – Key Analyses and Policy Conclusions – Synthesis Report, 2013;
5) Fostering the Use of Intangibles to Strengthen SME Access to Finance, Centre for Entrepreneurship, SMEs and Local Development (CFE) and Working Party on SMEs and Entrepreneurship (WPSMEE) – Meeting of the WPSMEE Informal Steering Group on SME and Entrepreneurship Financing and Country Experts, 7-8 September 2017.
In the following, some of the most important statements and conclusions of the above Studies will be extracted and reported.
INTELLECTUAL ASSETS AND VALUE CREATION: IMPLICATIONS FOR CORPORATE REPORTING – OECD, 2006The relevant OECD Study clearly points out that, “even though much time and effort has been extended over the past decade in debating reforms to accounting standards so as to incorporate a wider range of assets on the balance sheet, the conclusion from interviews with a number of participants is that this has ultimately proved to be a dead end. Financial accounts cannot and should not be used to reflect the market value of a company.
Competition is already encouraging companies to improve their reporting and managerial practices with respect to intellectual assets and strategies for value creation. This is usually done through narrative reporting. Where firms disclose more about their assets and value drivers (i.e. how they make assets productive and valuable) they are rewarded by improved market valuations.

85
Nevertheless, there is evidence that in some sectors and jurisdictions, and for some types of firms, market solutions are associated with delays and frictions, including the slow diffusion of best practices, which suggests a potential role for policy measures and/or private initiatives. Particularly important is the support by the relevant authorities for narrative reporting” (p. 37).
The OECD specifies that “although there is an information externality argument for some harmonisation, research suggests that any guidance about improved disclosure on intellectual assets [i.e. intangibles] should remain principles-based and voluntary. Given the wide range of intellectual assets held by firms in different industries, the principle-based approach allows companies flexibility in applying the guidance and addressing their own circumstances and risks as companies have unique stories with respect to their value creation process. A more prescriptive approach could engender a box-ticking, mechanistic approach to ensure compliance rather than allowing companies to produce meaningful reports tailored to their own circumstances. As experience develops, more harmonisation can be encouraged” (pp. 37-38).
In particular, “intellectual assets [intellectual capital] reports offer an alternative for non-listed companies that do not face the reporting requirements of listed companies and provide flexibility to discuss how they create value” (p. 38).
Furthermore, “the development of intellectual assets reports and increased attention to narrative reporting has also focused attention on key performance indicators (KPI) and management, boards and investors have all been pressing for such information. The development of industry-specific indicators by the private sector would seem to offer the best way forward since they can accommodate the very different role the various intellectual assets play from sector to sector” (p. 38)
INTELLECTUAL ASSETS AND VALUE CREATION: SYNTHESIS REPORT – OECD, 2008The Study criticises current corporate reporting practices, which “often focus on backwards-looking information, providing little systematic information about the capacity of the company to generate future revenues with respect to intellectual assets. Through guidelines and reporting frameworks, some governments and industry bodies are aiming to enhance narrative reporting and to promote the disclosure by companies of, inter alia, material, qualitative and forward-looking information about value drivers, trends, risks and uncertainties. Still, specific reporting on intangibles remains relatively limited in practice, albeit with some variation by region and sector” (p. 6)
In extreme synthesis, the policy proposals put forward for Intellectual Assets (IA – i.e. intangibles) reporting by this 2008 OECD Study can be summarised as follows:
1) The necessity to provide taxonomies value-relevant for investors and managers;
2) The necessity to develop global business reporting frameworks that are sector-specific, supported by KPIs and related XBRL taxonomies;
3) The necessity to improve incentives for financial analysts to follow small IA-based companies;
4) The necessity to consider the risks of managing IA and to systematically and specifically disclose risk issues (no more “boilerplate disclosures”).
CORPORATE REPORTING OF INTANGIBLE ASSETS: A PROGRESS REPORT – OECD, 2012This is by far the most important, mature and systematic study published by the OECD on the subject area of intangibles reporting and the possible associated policies by international bodies.
It starts by observing that “already in the early 1990s, the importance of intangible resources and the difficulty of accounting for them were raised and has grown steadily ever since. … Recent years have even seen the rise of a ‘conceptual company’, characterised by low relevance of physical assets in favour of intangible intensive activities” (p. 4).
8686
The Study goes on by significantly noting that “the ability to incorporate IA [Intangible Assets] in current accounting frameworks appears to be limited and hence, the value relevance of accounting information has deteriorated, especially in sectors characterised by high intangible capital. This observation raises serious questions about the continued relevance of financial reporting and places growing expectations on non-financial reporting to bridge the information gap” (p. 4).
Indeed, “there is a growing consensus among practitioners and policymakers that better reflection of intangibles is required in non-financial reporting in order to improve its relevance to users. Much academic research has focused on exploring this question, and in so doing, trying to establish the value of improved IA reporting for company valuations or access to credit, which has proven difficult given concerns about causality” (p. 4).
However, – the Study points out – “despite this active interest in promoting IA reporting, progress appears weak. Information about the adoption of IA disclosure frameworks by companies is not readily available. However, there are indications that adoption has not been widespread” (p. 4).
This situation occurs notwithstanding the fact that “the methodologies for measurement and reporting on intangible assets are abundant. The evolution of reporting frameworks to accommodate IA disclosure began in the 1990s and was primarily driven by private sector interest and academic research. Most frameworks developed to date favour a qualitative approach where IA is reported in a narrative format – either in the form of an intellectual capital statement or interspersed in extra-financial reporting – to complement financial reporting. Few OECD member countries have introduced recommendations to guide reporting on intangibles (e.g. Japan, Germany, and Denmark). In addition, guidelines of a more international nature have been developed by the World Intellectual Capital Initiative (WICI), the European Commission and the European Federation of the European Analysts Societies, providing companies with alternative reporting frameworks” (p. 22).
The OECD detects that “investors appear to be sensitive to the possibility of external verification of IA [Intangible Assets] reporting, considering that information is provided by companies voluntarily. However, most jurisdictions do not have guidelines for auditors on how to verify the reported information and auditors may perceive a high risk in doing so” (p. 23).
However, “the adoption of IA reporting globally has been fraught with obstacles. These include a lack of harmonisation of reporting standards, legal and regulatory risks associated with increased disclosure to companies and auditors, the cost of disclosure to companies, as well as a growing interest in other types of reporting in the investor community” (p. 23).
The Study also observes that “discussions on the inclusion of IA disclosure in the integrated reporting generally and in the International Integrated Reporting Committee’s (IIRC) framework specifically have not advanced far. The IA disclosure debate has focused on the development of models that can capture how intangible assets contribute to the value creation process, whereas the integrated reporting agenda has focused primarily on linking the various components of financial and non-financial reporting. Linking ESG and sustainability reporting with financial reporting is proving to be challenging enough; adding IA disclosure creates an additional level of complexity” (p. 23).
Therefore, “governments could support IA disclosure by establishing voluntary disclosure recommendations to guide companies towards a single national standard. … Governments can also put in place supporting mechanisms to facilitate reporting on intangibles. Such measures could include, but are not limited to, support to young companies by coaching them on implementation of data management and reporting frameworks” (p. 24).
Finally, the Study points out that “policymakers can have an impact by engaging in global coordination to address this complex policy issue. While complete harmonisation of disclosure standards is neither feasible nor desirable, promotion of sectoral indicators to enhance the comparability of reporting might be useful” (p. 24).
It is noteworthy that this 2012 OECD Progress Report has been later included in the more comprehensive 2013 OECD Study titled “Supporting Investment in Knowledge Capital, Growth and Innovation” as its Chapter 7.
8787
NEW SOURCES OF GROWTH: KNOWLEDGE-BASED CAPITAL (KBC) – KEY ANALYSES AND POLICY CONCLUSIONS: SYNTHESIS REPORT – OECD, 2013In another important Study, the OECD reinforces its analysis on the issues linked to the lack of reporting on intangibles and its consequences in a knowledge-based economy. The Study starts by noting that “the value of many of the world’s most successful companies resides almost entirely in their KBC [Knowledge-Based Capital]. In 2011, for example, physical assets accounted for only about 13% of the value of Nestlé, the world’s largest food company. Across countries, there is a positive correlation between the market value of firms and investment in KBC. Nevertheless, corporate financial reports provide limited information on companies’ investments in KBC. This may hinder corporate finance and governance” (p. 9).
It continues by observing that “corporate reporting has been a subject of vigorous debate in recent years, and views diverge on how to enhance its quality and usefulness to investors, analysts and financial institutions. While attention has focused on integrated reporting and environmental, social and governance (ESG) reporting, better reporting of corporate spending on, and benefits from, intangibles/KBC is also important to the broader debate on improving the quality of corporate reporting. Nevertheless, in terms of practice, corporate reporting of intangibles appears not to have changed significantly in recent years. Indeed, despite the fact that the value of many of the world’s most successful companies resides almost entirely in their intangibles, corporate reports provide only limited information on these” (p. 51).
The Study states that “given that the prevailing accounting standards do not generally require recognising intangibles (except in specific cases), reporting depends almost entirely on management’s interest to disclose this information, most often through narrative reporting. As a result, intangibles are often described qualitatively and generally not assigned any financial value. Reporting on intangibles is motivated by the same considerations as any other type of voluntary disclosure: the desire to increase market valuation and enhance access to finance. However, the motivation for companies to collect information on their intangibles varies considerably, depending on company size, industry and the availability of resources to implement the necessary processes” (p. 52).
The Study recognises that unfortunately “a significant challenge for promoting reporting of KBC is the lack of standardisation of reporting methodologies and the variety of key performance indicators reported by companies. Although full harmonisation of reporting standards is neither feasible nor necessarily beneficial (because of sectoral idiosyncrasies), policy-makers could help promote comparability and consistency.” (p. 54). Importantly, it is noted that “companies do not collect information on intangibles exclusively for external reporting. They also generate such information to improve internal management of intangibles, for example, to support risk management processes and meet specific objectives such as due diligence in the context of a merger or an acquisition. Some research indicates that these internal considerations are the primary motivation for companies to collect data and information on KBC” (p. 52).
The consequences of this situation are serious, as the Study points out. “Wealth creation depends on achieving an efficient allocation of capital on a risk-adjusted basis. Risk assessment requires high-quality information on firms’ value creation strategies and tools. A lack of reliable and relevant information on its intangibles may mean that companies have to bear a higher than necessary cost of capital or have difficulties for accessing finance. Industrial sectors more dependent on external finance grow faster in countries with higher-quality corporate disclosure regimes. In sectors more reliant on external finance, R&D expenditure as a share of value added grows faster in countries with higher-quality corporate disclosure. In addition, enhanced disclosure of intangibles, in a manner that is consistent across companies and countries, could have a positive impact on corporate performance by improving internal controls and risk management, raising the quality of strategic decision making and increasing overall transparency for shareholders and other stakeholders” (p. 52).
“Currently, relatively few policy-makers and academics advocate better recognition of KBC in national or international accounting frameworks. Better assessment of KBC using non-financial metrics, primarily through narrative reporting, is considered a priority, along with steps to promote meaningful classification and reporting of assets. A variety of approaches to the collection and disclosure of intangibles/KBC data exist. Some have been developed by governments but most by the private sector (e.g. the Intangible Assets Monitor and the World Intellectual Capital Initiative-WICI). However, implementation is voluntary and has not been widely taken up” (p. 52).
8888
In terms of policymaking, “governments might: i) support better corporate disclosure by establishing voluntary recommendations and guidelines or by backing private-sector reporting initiatives; ii) create mechanisms to facilitate companies’ reporting of investments in KBC; iii) introduce frameworks for auditors; iv) engage in international co-ordination to improve international comparability of data and information supplied by companies; and v) promote the establishment of asset classifications that would increase consistency in data collection and reporting” (p. 10).
More specifically, “another example of a policy that could potentially stimulate reporting on intangibles is the introduction of frameworks for auditors that would provide more assurance about disclosure of KBC. Currently, auditors lack a framework to provide an opinion on intangibles that cannot be recognised in financial statements (a few forms of KBC can currently be recognised). Policy-makers can also engage in international co-ordination with a view to cross-country comparisons of companies. Better coordination has been achieved in the area of integrated reporting, where the International Integrated Reporting Council (IIRC) has been instrumental. Initiatives such as the World Intellectual Capital Initiative (WICI) or other platforms that promote global dialogue on this issue might facilitate future global co-ordination” (p. 54).
The OECD Study concludes that “the outcomes of many policies addressing KBC would certainly be greater if governments took action together. Areas in which collaboration would be valuable include … cross-country promotion of increased comparability and consistency in corporate reporting of investments in KBC” (p. 70).
FOSTERING THE USE OF INTANGIBLES TO STRENGTHEN SME ACCESS TO FINANCE – OECD - CENTRE FOR ENTREPRENEURSHIP, SMES AND LOCAL DEVELOPMENT (CFE) AND WORKING PARTY ON SMES AND ENTREPRENEURSHIP (WPSMEE) – MEETING OF THE WPSMEE INFORMAL STEERING GROUP ON SME AND ENTREPRENEURSHIP FINANCING AND COUNTRY EXPERTS, 7-8 SEPTEMBER 2017In this paper, spreading from an ad hoc meeting within the OECD, the issue of the use of information on intangibles to facilitate access to finance is examined.
The document starts by observing that “costs of innovation are more likely to be expensed through a company’s profit and loss account than to be recognised on the balance sheet as an asset. … The lack of readily identifiable and realisable value in the assets created via expenditure on innovation increases the risk that such investments could become ‘short-termist’ and cyclical, especially among resource-constrained SMEs, which are likely to be juggling many conflicting priorities” (p. 7).
The Study keeps on by stating that “intangible assets only appear on a company’s balance sheet under certain defined circumstances. This perceived under-reporting means that stakeholders may have very limited visibility of important assets that are driving (or failing to drive) company performance. One of the motivations for the introduction of initiatives …, such as intellectual capital statements and integrated reporting, is to provide a means to address this information gap” (p. 40).
In conclusion, the OECD paper concludes in a very strong way that “the intangible asset information provided by financial accounting is so imperfect that no-one interested in IP and intangibles-backed financing is likely to will rely on it. If there were an agreed, more accurate way of representing value-producing assets in SME accounts, it would doubtless be helpful; however, in order for such a change to occur, it would first be necessary to persuade accounting regulators that transparent and active markets exist to recover value from this asset class” (p. 40).
The position taken by the OECD as to the subject area of accounting and reporting for intangibles appears quite clear and consistent over the years in the direction of an improvement in, and a fast development of, this area with an active contribution by policymakers, who can adopt several differentiated strategies to foster this evolution.

8989
THE 2008 EFFAS “PRINCIPLES FOR EFFECTIVE COMMUNICATION OF INTELLECTUAL CAPITAL”In 2008, the Commission on Intellectual Capital (CIC) of the European Federation of Financial Analysts’ Societies (EFFAS) has published a short but very significant document titled “Principles for Effective Communication of Intellectual Capital” (https://effas.net/papers/effas-standard-setter.html). “Intellectual capital” is here an expression used to collectively refer to the whole intangibles of a company.
In this paper, the European financial analysts set the ten principles that companies should follow when they disclose information on their Intellectual Capital. In particular, the aims of the paper are described as follows: “In order to provide a guide for the development of sector-specific sets of indicators of intellectual capital, we developed ten principles. For indicators to be useful for the financial community they should comply as closely as possible with these principles. They condense the needs that analysts and investors should have if they are to integrate information on intangibles into their company ratings” (p. 4).
These ten principles are:
1) Clear link to future value creation;
2) Transparency of methodology;
3) Standardisation;
4) Consistency over time;
5) Balanced trade-off between disclosure & privacy;
6) Alignment of interests between company & investors;
7) Prevention of information overflow;
8) Reliability and responsibility;
9) Risk assessment;
10) Effective disclosure placement and timing.
As it can be easily detected, many of the principles regard several reporting aspects. For example, standardisation of the methodology, reliability of the information disclosed, and consistency over time appear clearly related to reporting issues. Also the first principle, i.e. the clear link to the company’s value creation, refers to the relevance of the delivered information on intellectual capital.
Despite the reference to these principles by a few companies in some countries, it is hard to say that they have been largely adopted and spread universally.

9090
As it has been pointed out in the review, intangibles do not represent a new issue per se, but today it has acquired a fundamental economic prominence at both macro and micro level. Companies have become more and more “conceptual”, as OECD (2012) has evidenced, i.e. they tend to have negligible physical assets (property, plant and equipment, and inventories); they are intangibles-intensive (R&D, brands, alliances, human resources, organisational capital); they utilise a strong patent/trademark protection; they operate with an extensive outsourcing of manufacturing, distribution and other low-knowledge functions; they extensively trade in intellectual property (patent sale and licensing, know-how sale); and they run flexible business models. In being “conceptual”, a company can grant significant rewards, such as the scalability of operations, that is limited only by demand (e.g. drug sales); virtually zero marginal costs (e.g. search engines); network externalities (e.g. Microsoft operating system); and the “locking-in” of customers with high switching costs (e.g. airlines’ loyalty programs). But also the risks are very high: think of the heavy, largely irreversible sunk-costs, the property rights that on most intangibles are either non-existent (human capital) or hard to enforce (know-how), or the unlicensed use of technology.
Furthermore, it is also quite clear that some of the economic attributes of intangible assets make it:
• difficult to exclude them from other users (public good problem), thus firms may not appropriate the full benefits from their investment in intangibles (Geroski, 1995);
• difficult to estimate ex ante the precise use of intangible inputs, the potential products, and the timing and magnitude of the intangibles-derived benefits;
• difficult to write contracts for the transfer or exchange of intangibles un-embodied in a physical asset.
Therefore, investment in intangibles is associated with high levels of uncertainty. In addition, while there is evidence that investment in intangibles leads to innovation and tangible investment, there is a time lag between intangible investments and economic benefits (intangible investment occurs early in the product life cycle).
This crucial and profound shift towards a knowledge-based economy poses a number of questions to managers, governments, standard setters, professionals, and academics. In particular, for accountants, the rise of intangibles in the contemporary capitalist economy is a complex phenomenon to cope with. Internally generated intangibles are unaccounted, if not during M&A situations. However, there is a wide recognition that these resources contribute to a very large extent to the value creation processes of organisations and their resilience over time. Most of the intangibles do not have an active market and then a reliable price/value. Hence, they are a challenge for traditional accounting. It could be said that facing intangibles represents a sort of “stress test” to the conceptual foundations and objectives of accounting and, more in detail, to the meaning of “value” for accountants and its recognition and calculation.
The literature review has examined a large number of academic works dealing with the reporting of unaccounted intangibles, also through the lens of intellectual capital studies. In general terms, from the academic literature review carried out, it can be synthetically concluded that:
• Information on unaccounted intangibles tends to be directly and positively correlated with company performance and cash flows;
• Information on unaccounted intangibles tends to be associated with the market value of companies, and indeed these resources are (partially) explicative of this value over time (i.e. they are value relevant);
• Information on unaccounted intangibles tends to be well received and useful to users and, in particular, to financial analysts and investors.
While Chapters from 4 to 7 have helped us define the contents and the contours of the problem “accounting and reporting for intangibles”, Chapter 8 has illustrated some potential solutions that have been elaborated in the academic literature and by the international specialised organisations (WICI and IIRC). However, it is fair to say that to date none of these potential solutions
CHAPTER 10: CONCLUDING REMARKS
9191
seems to have found a large rate of adoption by companies, investors and professionals. Only integrated reporting appears to be quite widespread at an international level, even though the principles-based <IR> Framework does not indicate in a concrete way how to measure and disclose the intangible-type of capitals (intellectual/organisational; social and relational; and human), leaving this issue to its company adopters. In such a sense, one could say that integrated reporting operates more as a sort of “trigger” for intangibles measurement and disclosure.
As to the treatment of intangibles in traditional accounting, we have seen that the positions in the academic literature are much diversified. According to Lev (2001) and Lev and Gu (2016), there are serious economic consequences for the firm from the poor accounting treatment of intangibles. Indeed, the mismeasurement of intangibles at the company level has adverse economic effects in terms of:
• The level of information asymmetry concerning a firm (volatility of share prices and insider trading);
• The internal/management information systems and decision making;
• The accountability of management for actions/decisions in managing the firm’s resources;
• The lack of data for analysis and rational external resource allocation and investment decisions.
Hence, still following Lev (2001) and Lev and Gu (2016), this situation, where intangibles are unaccounted for and – in the best of cases – the related expenditures are treated as a cost rather as an investment, has negative consequences for
• value measures (e.g. market-to-book ratio) that are biased;
• performance measures (ROE, ROA, EVA) that are deceiving; and
• the prediction of future earnings and cash flows, that is largely flawed.
Also, internal corporate resource allocation may be seriously distorted by deficient information about intangibles.
In this situation of information and valuation deficit on intangibles, there is also a severe risk that an “information cascade” phenomenon could take place (Zambon, 2007). In behavioural finance, this effect occurs when one agent looks at the behaviour of other agents for making a decision, with a spreading of partial “ignorances” amid the concerned population. This phenomenon is also known as “the blind that leads the blind” effect, which may bring about – ceteris paribus – to an increase in the price volatility in financial markets and company cost of capital.
On the other hand, different authors point out that the effect of intangibles on corporate value creation can be seen in the Income Statement (Penman, 2009), that investors and financial analysts are happy already with the information they have (Skinner, 2008), that this possible accounting change would provide a further occasion for managerial manipulation of earnings and information, and that such a change is very difficult and nobody really wants it.
Another possible solution refers to financial statement disclosure and/or narrative reporting (e.g. management commentary), possibly recurring to ad hoc KPIs for measuring intangibles in the different industries and contexts. However, also in this case, there are positive aspects (more extended information on these resources), but also negative ones, such as the lack of a unified and uniform methodology for the KPI calculation and the provision of information, and the difficult comparability of the resulting data and disclosure.
The review has shown that there are some promising attempts to develop intangibles reporting outside financial reporting, i.e. in integrated reports. The WICI Framework is compatible with the <IR> Framework just in order to facilitate this approach. Yet, we face serious issues of consistency in measurement and disclosure, and hence of comparability.

9292
In closing, echoing the 2003 Study for the European Commission illustrated above, we face a major paradox: the more the economic and corporate system is based on intangible assets, which are its “glue” and “engine”, the stronger the system is, because intangibles are major determinants of growth and value creation. However, at the same time, the more the system is grounded on intangibles, the more vulnerable it becomes because intangibles are more uncertain, unstable and risky. The challenge we accountants face is to learn how to manage and report on these “invisible” resources for a better understanding of organisations’ financial performance and their resilience. After all, intangibles are an issue we have to take into account for many years ahead.
REFERENCESGeroski, P.A. (1995), “What do we know about entry?”, International Journal of Industrial Organization, Vol. 13, No. 4, December,
pp. 421-440.
Lev, B., (2001), Intangibles: Management, Measurement and Reporting, Brookings Institution Press.
Lev, B., and Gu, F. (2016), The End of Accounting and the Path Forward for Investors and Managers, John Wiley & Sons.
OECD (2012), Corporate Reporting of Intangible Assets: A Progress Report, April 2012.
Penman, S.H. (2009), Accounting for Intangible Assets: There is Also an Income Statement, Abacus, Volume 45, Issue 3, September, pp. 358-371.
Skinner, D.J., (2008), Accounting for intangibles – a critical review of policy recommendations, Accounting and Business Research, Vol. 38, No. 3, pp. 215-216.
Zambon, S. (2007), “Accounting and Reporting for Intangibles and IC: An Introduction to New Developments”, Presentation at the WIPO European Conference on IC Readiness, WIPO, Geneva, 19 November.

9393

9494
Keywords used and the related number of results per search engine employed
APPENDIX 1
KEYWORDS SCOPUS ISIWEBGOOGLE
SCHOLAR
intangibles and productivity 436 469 21900
intangibles and growth 770 828 74200
intellectual property and innovation 3696 3345 578000
big data and digitalisation 357 33 14200
intangibles and value relevance 190 232 17900
intangibles and financial reporting quality 22 36 18500
price to book value ratio 228 213 290000
brand and firm performance 562 1078 297000
brand and market value 3537 5258 1300000
brand and information users 1342 1108 888000
brand and investors 333 269 63000
patent and firm performance 671 1409 136000
patent and market value 878 958 86500
patent and information users 573 270 1030000
patent and investors 312 230 42600
customer list and firm performance 32 130 35600
customer list and market value 90 184 144000
customer list and information users 192 136 184000
customer list and investors 9 28 65500
reputation and firm performance 683 1640 179000
reputation and market value 1054 1341 583000
reputation and information users 1663 1026 326000
reputation and investors 619 776 73300
R&D and firm performance 1966 2921 239000
R&D and market value 1354 1200 591000
R&D and information users 617 226 208000
R&D and investors 464 379 55700
customer satisfaction and firm performance 779 1424 137000
customer satisfaction and market value 1425 2617 686000
customer satisfaction and information users 1445 1196 401000
customer satisfaction and investors 113 109 27800
business model and firm performance 3569 7074 260000
business model and market value 5905 6266 981000
business model and information users 7487 3555 918000
business model and investors 2049 1420 395000
human capital and firm performance 1108 1763 159000
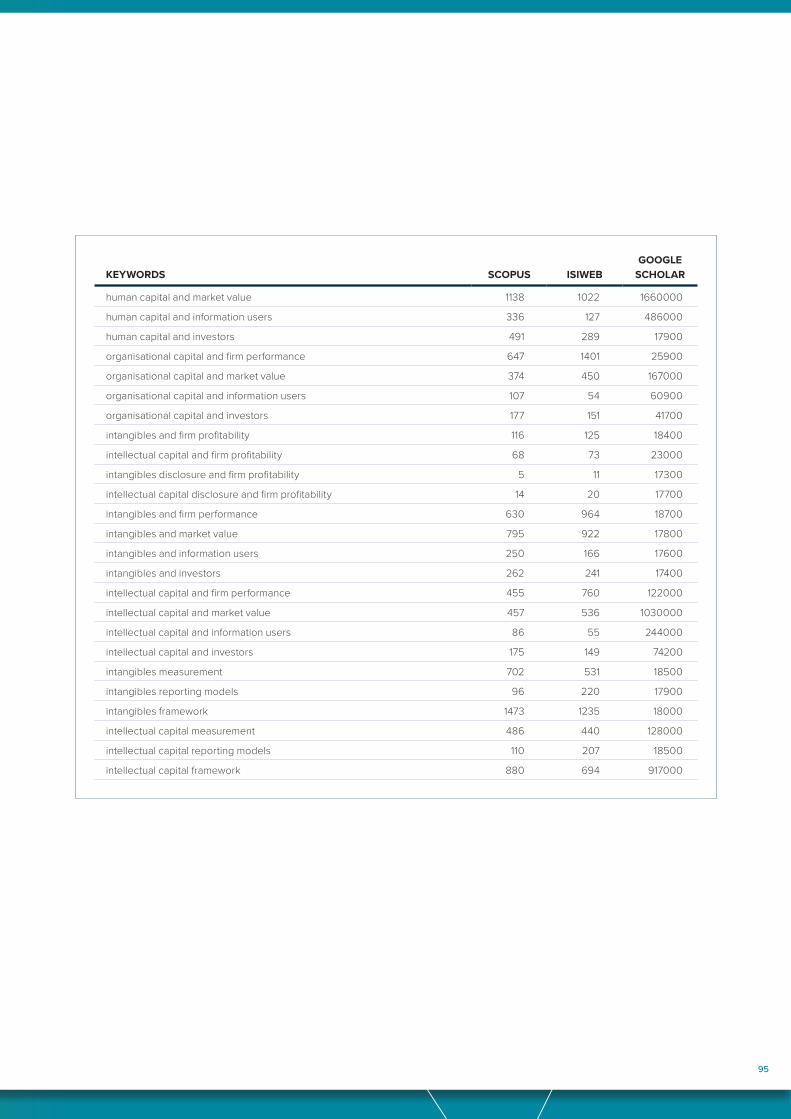
9595
KEYWORDS SCOPUS ISIWEBGOOGLE
SCHOLAR
human capital and market value 1138 1022 1660000
human capital and information users 336 127 486000
human capital and investors 491 289 17900
organisational capital and firm performance 647 1401 25900
organisational capital and market value 374 450 167000
organisational capital and information users 107 54 60900
organisational capital and investors 177 151 41700
intangibles and firm profitability 116 125 18400
intellectual capital and firm profitability 68 73 23000
intangibles disclosure and firm profitability 5 11 17300
intellectual capital disclosure and firm profitability 14 20 17700
intangibles and firm performance 630 964 18700
intangibles and market value 795 922 17800
intangibles and information users 250 166 17600
intangibles and investors 262 241 17400
intellectual capital and firm performance 455 760 122000
intellectual capital and market value 457 536 1030000
intellectual capital and information users 86 55 244000
intellectual capital and investors 175 149 74200
intangibles measurement 702 531 18500
intangibles reporting models 96 220 17900
intangibles framework 1473 1235 18000
intellectual capital measurement 486 440 128000
intellectual capital reporting models 110 207 18500
intellectual capital framework 880 694 917000

EFRAGaisbl - ivzw
35 Square de MeeûsB-1000 Brussels
+32 (0)2 207 93 00 [email protected]
www.efrag.org
Connect with EFRAG onLinkedIn and Twitter
EFRAG receives financial support of the European Union – DG Financial Stability, Financial Services and Capital Markets Union. The content of this document is the sole responsibility of EFRAG and can under no circumstances be
regarded as reflecting the position of the European Union. Des
ign
by ly
on.n
u