acacia senegal soil organic carbon and nitrogen contents: a
TRANSCRIPT

Lunds Universitets Institution för Naturgeografi och Ekosystemanalys
Seminarieuppsatser Nr. 91
_______________________________________________
Acacia senegal, Soil Organic Carbon and Nitrogen Contents:
A Study in North Kordofan, Sudan
Caren Jakubaschk _______________________________________________
2002 Department of Physical
Geography and Ecosystems Analysis,
Lund University Sölvegatan 13, S-221 00 Lund,
Sweden

Jakubaschk, Caren: Acacia senegal, SOC and Nitrogen Content: A Study in North Kordofan, Sudan
I
ACKNOWLEDGEMENTS This study would not have been possible without the help of many people. First of all, I want to thank Lennart Olsson who gave me the idea of conducting fieldwork in Sudan. The financial support of the Centre for Environmental Studies at Lund University (MICLU) allowed me to spend a month in North Kordofan, Sudan for which I am very grateful. Bodil Elmqvist and Jonas Ardö have been great supervisors helping during tedious preparation, during the stay in Sudan and during finishing of my thesis back in Lund. They supported my work with countless useful comments and suggestions. During fieldwork around Umm Ruwaba I enjoyed the hospitality of Gisiema Babay Ibrahim and her family. Gisiema helped wherever she could. Her sister cooked great food for the tired fieldworker and other family members showed me around and let me experience Sudanese culture and people. The translators and guides Fatima M. A. Ramli and Amani A. Abdelrhaman did a great job. Fieldwork would not have been possible without their expertise and local knowledge. The driver helped with digging holes during midday heat and had always a big smile for the restless European. Thanks to Osama Tagelsir from the Forest National Corporation (FNC) in Umm Ruwaba, who managed to organise a jeep without which fieldwork would have been impossible. Thanks to the FNC staff for organising a barbecue on my last working day. In El Obeid I want to thank the director of the Agricultural Research Station, Bashir A. ElTahir, and Abdulla Gaafar Mohmed from the FNC for valuable information on Acacia senegal. Further, I'm grateful to Amal Hamid Bisharra, Abdulrahman Kidir and their kids for many hours of fun and unforgettable memories of sheep slaughtering during Eid-holiday. Sayeda Khalil and Nagla M. Hamadain were great friends in Khartoum, showing us around the Omdurman market and introducing us to Riksha driving. Finally, I want to express my gratitude towards all Sudanese who supported my work by answering innumerable questions and by helping with fieldwork. Back in Lund, I want to thank Tommy Olsson who helped me - with lots of patience - analysing my soil samples at the Laboratory of Plant Ecology. Last but not least I want to thank Thomas, Nick and Annett who were always around and never tired (?) to listen during the last months of my thesis.

Jakubaschk, Caren: Acacia senegal, SOC and Nitrogen Content: A Study in North Kordofan, Sudan
II
ABSTRACT In 2001, the Intergovernmental Panel on Climate Change approved human impact (mainly through the emission of carbon dioxide (CO2)) on global warming. The Kyoto Protocol is a global contract that proposes the reduction of CO2 and five other greenhouse gases by 2012 to at least 5% below the level of 1990. One reduction strategy included in the Protocol is the Clean Development Mechanism (CDM). It suggests that industrialized countries invest in projects in developing countries that sequester carbon and promote sustainable development in the host country. A controversial issue within the Protocol is the acceptance of carbon sequestration in sinks (soils and vegetation) as a means to reduce atmospheric CO2. This master thesis was conducted in collaboration with the Centre for Environmental Studies at Lund University (MICLU) in the context of carbon sequestration in soils of semi-arid regions. MICLU’s research is concentrated on North Kordofan, Sudan, a region suffering from severe environmental degradation. The basic idea of the study was to investigate if soils beneath Acacia senegal have the potential to sequester soil organic carbon (SOC) on a higher level than other land use types. Acacia senegal is a leguminous tree species traditionally cultivated during fallow periods. Fieldwork was carried out during February 2002 and included interviews with farmers, soil sampling and biomass measurements. The thesis focused on the following questions: (1) Does Acacia senegal influence SOC and nitrogen content of the topsoil? (2) Does nitrogen influence the SOC content beneath Acacia Senegal stands? (3) Are SOC contents simulated by the Introductory Carbon Balance Model (ICBM) similar to my field observations? The study shows that: (1) There is a significant difference between SOC and nitrogen content in the topsoil of fallow fields with Acacia senegal and that of crop fields. (2) There is a significant positive correlation between SOC and nitrogen content under both fallow fields with Acacia senegal and under undisturbed sites without Acacia senegal. (3) The SOC content simulated by the ICBM does not coincide with the SOC content measured in 2002. The number of soil samples taken was small and further research has to be done to confirm the results of this study. The ICBM has to be calibrated to semi-arid conditions with a time series of a well-investigated area before it can be used as a meaningful tool for soil carbon simulations.

Jakubaschk, Caren: Acacia senegal, SOC and Nitrogen Content: A Study in North Kordofan, Sudan
III
SAMMANFATTNING Under året 2001 kom forskare i hela världen överens om att globala klimatförändringar existerar och att människliga aktiviteter har påverkat dem, framförallt genom utsläpp av koldioxid (CO2). Kyoto Protokollet är en global överenskommelse som kräver en minskning av CO2 utsläpp (med 1990 som basår) och fem andra växthusgaser med 5% fram till 2012. Ett sätt som nämns i Kyoto Protokollet att reducera kolutsläpp är den så kallade Clean Development Mechanism (CDM). CDM baseras på att industriländer investerar i projekt i utvecklingsländer som tar upp kol och samtidigt främja hållbar utveckling i landet. En kontroversiell idé inom Kyoto Protokollet är kolsänkor (marken och vegetationen) som en möjlighet att minska atmosfäriskt CO2. Denna magisteruppsats skrevs i samarbete med Miljövetenskapligt Centrum vid Lunds Universitet (MICLU). MICLUs projekt är koncentrerade på kol-upptagning i marker i semi-arida områden. Forskning utförs i Norra Kordofan, ett område med stora miljöproblem i Sudans Sahel region. Grundidén med min studie är att undersöka om marken under Acacia senegal kan ta upp förhållandesvis mer kol än andra markanvändningstyper. Acacia senegal är ett kvävefixerande träd som odlas traditionellt under trädesperioden. Fältarbetet utfördes i februari 2002 och bestod dels ut av intervjuer med bönder, men också av jordprover och mätningar av biomassan. Mitt arbete fokuserade på följande frågeställningar: (1) Påverkar Acacia senegal kol- och kvävehalten i det översta markskiktet? (2) Påverkar kvävehalten i det översta markskiktet kolhalten under Acacia senegal? (3) Är de kolvärden som jag simulerade med Introductory Carbon Balance Model (ICBM) lika med mina mätningar? Resultaten visar att: (1) Kol- och kvävehalten i översta markskiktet skiljer sig signifikant mellan fält i träda med Acacia senegal och odlade fält. (2) Det finns en signifikant korrelation mellan kol- och kvävehalten i både under fält i träda med Acacia senegal och under fält med ostörd vegetation. (3) De kolvärden som simulerades med ICBM stämmer inte överens med mina mätningar. Antalet jordprover var för små och mer forskning måste genomföras för att kunna konfirmera mina resultat. ICBM måste anpassas till semi-arida förhållande genom att kalibrera den med data serier tagit ur ett semi-arid område som löper över en lång tidsperiod. Sedan kunde ICBM betecknas som ett användbart redskap för simuleringar av kolhalt i mark.

Jakubaschk, Caren: Acacia senegal, SOC and Nitrogen Content: A Study in North Kordofan, Sudan
IV
LIST OF CONTENTS
1 Introduction ............................................................................................................1
2 Objective.................................................................................................................2
3 The Study Area........................................................................................................3
3.1 Sudan..............................................................................................................3
3.2 Umm Ruwaba District......................................................................................3 3.2.1 Climate ....................................................................................................4 3.2.2 Vegetation, Topography and Soils ..............................................................4 3.2.3 People .....................................................................................................5 3.2.4 Agriculture and Land Use...........................................................................6 3.2.5 Acacia senegal and Gum arabic .................................................................7
4 Theoretical Background ..........................................................................................9
4.1 The Carbon Cycle............................................................................................9
4.2 The Nitrogen Cycle........................................................................................10 4.2.1 The Nitrogen Cycle .................................................................................10 4.2.2 Acacia senegal and Nitrogen....................................................................11
4.3 Decomposition and Soil Organic Matter (SOM)..............................................12
4.4 Global Warming ............................................................................................13 4.4.1 The Kyoto Protocol..................................................................................13 4.4.2 Carbon Sinks ..........................................................................................14
4.5 Synthesis ......................................................................................................14
5 Methods ................................................................................................................16
5.1 Fieldwork ......................................................................................................16 5.1.1 GPS Recording and Processing of Data....................................................16 5.1.2 Soil Sampling .........................................................................................17 5.1.3 Biomass Measurements and Estimations ..................................................18
5.2 Analyses of Soil Samples..............................................................................20 5.2.1 Bulk Density ...........................................................................................20 5.2.2 Carbon...................................................................................................21 5.2.3 Nitrogen .................................................................................................21 5.2.4 Soil Texture ............................................................................................22
5.3 The Introductory Carbon Balance Model .......................................................22 5.3.1 Why Modelling? ......................................................................................22 5.3.2 The Model Structure and Equations ..........................................................22 5.3.3 Input Data – Estimation of Parameter Values.............................................23 5.3.4 Sensitivity Analysis..................................................................................25 5.3.5 Model Limitations ....................................................................................25

Jakubaschk, Caren: Acacia senegal, SOC and Nitrogen Content: A Study in North Kordofan, Sudan
V
6 Results..................................................................................................................26
6.1 Fieldwork ......................................................................................................26 6.1.1 Biomass Measurements and Soil Texture..................................................26
6.2 Normal Distribution of Data ...........................................................................26
6.3 Soil Sample Analyses....................................................................................27 6.3.1 Carbon...................................................................................................27 6.3.2 Nitrogen .................................................................................................29 6.3.3 C:N Ratio ...............................................................................................30 6.3.4 Relationships between Carbon and Nitrogen .............................................31
6.4 Simulations with the ICBM ............................................................................31 6.4.1 Fallow Fields with Acacia senegal (FallowA) ..............................................31 6.4.2 Fallow Fields without Acacia senegal (Fallow) ...........................................32 6.4.3 Crop Fields (Crops) .................................................................................33 6.4.4 Undisturbed Sites with Acacia senegal (VirginA) .........................................33 6.4.5 Undisturbed Sites without Acacia senegal (Virgin)......................................34 6.4.6 Results of Sensitivity Analysis ..................................................................35
7 Discussion ............................................................................................................37
7.1 Fieldwork ......................................................................................................37
7.2 Soil Sample Analysis.....................................................................................38
7.3 Simulations with the ICBM ............................................................................39
8 Summary of Results and Conclusions...................................................................42
8.1 Summary of Results ......................................................................................42
8.2 Conclusions ..................................................................................................42
9 References ............................................................................................................43
Appendix 1: Arabic Glossary and Scientific Notation ....................................................47
Appendix 2: Soil Sample and Biomass Protocol............................................................48
Appendix 3: Results for all Soil Samples .......................................................................49
Appendix 4: Biomass Calculations ................................................................................52
Appendix 5: Results of Regression Analysis for C and N ..............................................55
Jakubaschk, Caren: Acacia senegal, SOC and Nitrogen Content: A Study in North Kordofan, Sudan
1
1 INTRODUCTION Sub-Saharan Africa is the only region in the world where food production has been stagnant over the last 40 years although population has strongly increased (Sanchez, 2002). Although scientists have been working for many years on climate change related to human activities, it was only in 2001 that the Intergovernmental Panel on Climate Change (IPCC) confirmed the human impact on global climate change (IPCC, 2001). In 1997, the Kyoto Protocol was established. It is the only global contract, which aims to reduce global emissions of greenhouse gases, of which carbon dioxide (CO2) is one of the most important. The protocol proposes several methods to reduce emissions, e.g. the Clean Development Mechanism (CDM). It allows industrial countries to invest in projects in developing countries, which aim to reduce or avoid emissions and promote sustainable development [1]1. Recent research suggests carbon sequestration in soils as a method for climate change mitigation but the parties to the Kyoto Protocol have not yet decided if this possibility should be included in the global contract or not (Ardö & Olsson, 2002b). This master thesis is part of a multidisciplinary research project, initiated by the Centre for Environmental Studies at Lund University (MICLU), Sweden. A main objective of MICLU’s research activities is to investigate if carbon sequestration in soils is a means to promote sustainable development and alleviate poverty in developing countries2. This study focuses on the investigation of SOC and nitrogen content beneath Acacia senegal stands in North Kordofan, Sudan. Acacia senegal is a leguminous tree species well adapted to climate conditions and traditionally integrated into the system of shifting cultivation in Sudan. Acacia senegal stands have decreased strongly in the study area, which resulted in environmental degradation and declining incomes of the local farmers (Keddeman, 1994). The assumption behind this study is that soils beneath Acacia senegal might have a higher carbon and nitrogen content compared to other land uses. Acacia senegal is said to be a nitrogen-fixing plant while nitrogen is a limiting nutrient in savannah regions (Breman & Kessler, 1995). Additional nitrogen might lead to improved growth of Acacia senegal and other plants during the fallow period and to better growth of future crops during the cropping period. The prediction of the development of carbon pools in the soil is important when deciding upon different land use options. Therefore, the second part of the thesis focuses on a model simulating carbon stocks in the soil.
1 Note that I refer to web addresses without specific author separately from references in paper format. A number in brackets indicates a web address. All web addresses are listed in chapter 10. 2 For example, a current research project is investigating gum arabic production for environmental protection and income generation in the Sahel (ongoing, 2000 - 2003).

Jakubaschk, Caren: Acacia senegal, SOC and Nitrogen Content: A Study in North Kordofan, Sudan
2
2 OBJECTIVE The main objective is to investigate if soils under Acacia senegal have a higher content of Soil Organic Carbon (SOC) and nitrogen when compared to soils with different vegetation cover. The first part of the study focuses on the following questions: • Does Acacia senegal influence SOC and nitrogen content of the topsoil? • Does nitrogen content in the topsoil influence the SOC content of an Acacia senegal
field? The second part of the thesis focuses on the evaluation of a simple model simulating SOC contents: • Is the SOC content, simulated by the Introductory Carbon Balance Model (ICBM),
similar to my field observations?

Jakubaschk, Caren: Acacia senegal, SOC and Nitrogen Content: A Study in North Kordofan, Sudan
3
3 THE STUDY AREA
3.1 Sudan Sudan is the largest country in Africa and is situated in Northeast Africa (figure 3.1). Its capital is Khartoum. It has a population of around 36 million people of which almost 50% of the population is under 14 years old. Agriculture employs up to 80% of the workforce although it contributes to Sudan’s GDP with barely 40%. Around 5% of the land is arable land, 46% is comprised of permanent pastures and 19% is comprised of forests and woodland. Since 1989, a military dictatorship has ruled the country and the fundamentalist National Islamic Front party dominates the government. The civil war in the South (officially a religious war between Christians and animists in the South and the Arabic league in the North) has weakened the country’s economy, cost the lives of more than 1.5 million people and caused the displacement of millions of people3. Droughts and unreliable rainfalls since the 70s have exacerbated the situation. Olsson (1993) states that a collapsing food and livestock market, an unjust credit system for the farmers and a lack of an adequate transportation system are the main causes of the food shortage during drought. War, drought and an ineffective government are main reasons for the fact that the country is one of the poorest in the world today. These factors have also led to severe environmental problems such as deforestation, desertification and degradation of soils and consequently to unreliable food production (Ajoub, 1999).
3.2 Umm Ruwaba District
Figure 3.1: The black line around Umm Ruwaba encircles the study area. The rectangle shows the study area of MICLU where research has been going on for 20 years. The study area is situated in Umm Ruwaba District, Northern Kordofan Province, around 350 km SSW of Khartoum. The study area lies between latitude 12,70°N and 13°N and
3 These facts originate from the World Fact Book 2001 of the CIA (CIA, 2001).

Jakubaschk, Caren: Acacia senegal, SOC and Nitrogen Content: A Study in North Kordofan, Sudan
4
longitude 30,70°E to 31,50°E, which equals an area of approximately 70 km by 30 km (Figure 3.1). As there is a road through Umm Ruwaba, its surroundings had been chosen for fieldwork. Different land use types could be accessed comparatively easy. In some villages surrounding Umm Ruwaba, farmers were interviewed. Each of the four interviews was conducted with the village elder (sheik) and a group of on average 10 farmers. Each question provoked a lively discussion, which means that the answers reflect the opinion of many. Additionally, a research team interviewed farmers in the Bara region (Figure 3.1). The knowledge gained during interviewing allowed the researcher a better understanding of constraints and problems that farmers have to cope with. However, the interviews are not part of the method for this masters thesis as socio-economic issues are beyond the scope of this study.
3.2.1 Climate The climate is semi-arid with a short rainy season4 from June to September and a long dry season (Khogali, 1991) (Figure 3.2). Mean annual precipitation in Umm Ruwaba is around 360 mm (Save the Children, 1988). The precipitation is often of high intensity and few occasions. The dry period is around nine months long. Mean annual temperature is 26°C with January being the coldest month and May the hottest (Olsson & Rapp, 1991). The most severe droughts recorded were in 1984 and 1985.
3.2.2 Vegetation, Topography and Soils The study area is a mosaic of forest savannah and grassland (Olsson & Rapp, 1991). Savannahs include grasslands with at least 10% of canopy cover; they are the transition zone between closed forests and grasslands or deserts. The major factor determining savannah vegetation is rainfall (Breman & Kessler, 1995). Tropical savannahs cover about half the area of Africa. They are socioeconomically important areas as they contain a growing percentage of the world’s population, a majority of its rangelands and livestock (Scholes & Archer, 1997). The study area lies within the gumbelt, a broad strip of sandy soil between the 250 mm and 400 mm isohyets, where different kind of Acacia species are the dominant tree types (Figure 3.3) (Save the Children, 1988). Common trees are Acacia senegal (hashab), Balanites aegyptica (hejlij), Acacia raddiana (sayal), Acacia albida (haraz), Maerua crassifolia (sereh), Adansonia digitata (tebeldi), Leptadinia pyrotechnica (merrikh), Ziziphus mauritiana (nabag) 4 Rainy and growing season are defined as the period in which monthly precipitations in mm are equal to or greater than twice the mean temperature in °C: precipitation > 2 x temperature. The northward movement of the Intertropical Convergence Zone and the SW monsoon of the Gulf of Guinea provoke the rains during rainy season (Le Houérou, 1989).
0
20
40
60
80
100
120
140
Time
0510152025303540
precipitationtemperature
Figure 3.2: Climate data for El Obeid 1941 – 1991

Jakubaschk, Caren: Acacia senegal, SOC and Nitrogen Content: A Study in North Kordofan, Sudan
5
and broad-leafed species of the family Combretaceae. Common grasses are Aristida pallida, Eragrostis tremula (banu) and Chenchrus bifolius (haskanit) (Olsson & Rapp, 1991; Save the Children, 1988; Jakubaschk, February 2002). As a sign of severe soil exhaustion, Calotropis procera (usher) is now one of the dominant tree species in the study area (Save the Children, 1988).
The area is flat and of low elevation (200-600 m) and is covered with sandy soil (Le Hourérou, 1989). The only elevations are Inselbergs, isolated rocky outcroppings of a reddish colour. In the Southwest of Umm Ruwaba longitudinal sand dunes run in a North-South direction giving the landscape a rippled form (Save the Children, 1988). Cambic arenosols, coarse
textured soils with aeolian origin, dominate the area (Figure 6.1) (FAO Soil Database, 1995 & 1998). The soils are locally called goz and the texture is characterised by 60-70% coarse sand, 20-30% fine sand and 5-10% clay (Ardö & Olsson, 2002b). These soils are low in nutrients and organic matter and have a high sensitivity to erosion (Ayoub, 1999). Goz soils absorb almost the entire precipitation as the moisture filters through the sand and little is lost to evaporation or runoff. The sandy soils are easy to till, weed and clear by hand, but the effect of variable rainfall is more severe on sandy than on clay soil (Save the Children, 1988). Chromic vertisols, locally named gardud, are clay soils mixed with aeolian sand (Warren, 1970). The soil type occurs mainly South of Umm Ruwaba. Gardud soils require more rainfall for plant growth than goz but they are more fertile and can be cultivated for longer periods (Save the Children, 1988).
3.2.3 People Most people in Sudan are of African origin (52%) while 39% are of Arabic origin (CIA, 2001). All village people that I talked to belonged to the Gawama’a tribe, which is the dominant tribe in Umm Ruwaba District. They originate from sedentary farmers, who descended from Nubians and Arabs from the North. When they settled in Kordofan during the 16th and 17th century, they mixed with the Nuba tribe and gradually replaced them. Around 6% of the population is nomadic (Save the Children, 1988). People have lived in the Sahelian zone for thousands of years. This implies that human activity has always been a main factor influencing the savannah ecosystem (Le Houérou, 1989). According to Le Houérou (1989), the rural population density in the Sahelian zone is far beyond the estimated human supporting potential capacities. Smallholders have a three-fold strategy of survival: (1) food production on a subsistence level, mainly millet (dukm) and sorghum (dura), (2) production of cash crops for sale on the market and (3) off-farm work during the dry period (Elmekki & Barker, 1993).
Figure 3.3: Parts of the gumbelt

Jakubaschk, Caren: Acacia senegal, SOC and Nitrogen Content: A Study in North Kordofan, Sudan
6
3.2.4 Agriculture and Land Use The study area is characterised by cultivation, grazing and livestock breeding (Khogali, 1991). Since the 1960s, the economic and environmental situation in the study area has worsened dramatically. During the last three to four decades, the population has increased, resulting in increased demand for food (Figure 3.4). Cultivation has become more or less continuous, but because of exhausted soils and a decline in rainfall, yields per area have decreased (Olsson, 1993; Elmekki & Barker, 1993). Once self-sufficient, the area is now dependant on subsidies and donations (Save the children, 1988; personal communication with Osama Tagelsir, director FNC Umm Ruwaba). Farming techniques have not improved over the past 40 years and the only way to improve food production was to enlarge the cultivated area. The area under cultivation increased seven-fold from 400 000 ha in 1960 to almost 3 million ha in 1980 (Save the Children, 1988). Today, soils are exhausted after years of woodcutting, cultivation and overgrazing (Buresh & Tian, 1998).
In the late 80s only 20-25% of the population migrated during dry season (Save the Children, 1988). Interviews revealed that migration to larger towns, mainly Khartoum, during dry period is as high as 50-80% today. Mainly men of different ages and young women migrate.
The following is an example of an annual income of a farmer. Work in Khartoum yields around $80 per month over a maximum period of 9 months. This is a maximum amount of $720 for off-farm activities. Income from harvest depends very much on pests, market prices and soil fertility. During a normal year, farmers receive around $450-600 for their agricultural products. Additionally, the income through gum arabic yield might be around $400. It is
obvious that the income earned by those who have migrated is an essential part of household income5. The agricultural production in the study area focuses on cash crops. The cultivation of cash crops - such as hibiscus (karkade), sesame (simsim), groundnuts (ful sudani) and
5 Average numbers result from interviews made by Jakubaschk, C. in February 2002.
Population increase
Low producer prices
High prices for consumer items
Increase in consumption & cash needs
Increased wood cutting
Increase in cultivated area
Reduction of fallow periods
Increased livestock production
Decreasing rainfall
Decreased soil fertilityDecrease in yields Environmental degradation
Off-farm activities
Out-migration
Figure 3.4: Simplistic model of economic and environmental change in Umm Ruwaba District, adapted from Save the Children (1988)
Figure 3.5: a millet crop (left side) and a millet field during dry season
Jakubaschk, Caren: Acacia senegal, SOC and Nitrogen Content: A Study in North Kordofan, Sudan
7
watermelon (bittikh) - has increased since the 1950s at the expense of cereal crops. Today, farmers only cover part of their millet and sorghum consumption with their own harvest (figure 3.5). To a large extent farmers rely on the market to purchase food (Save the Children, 1988).
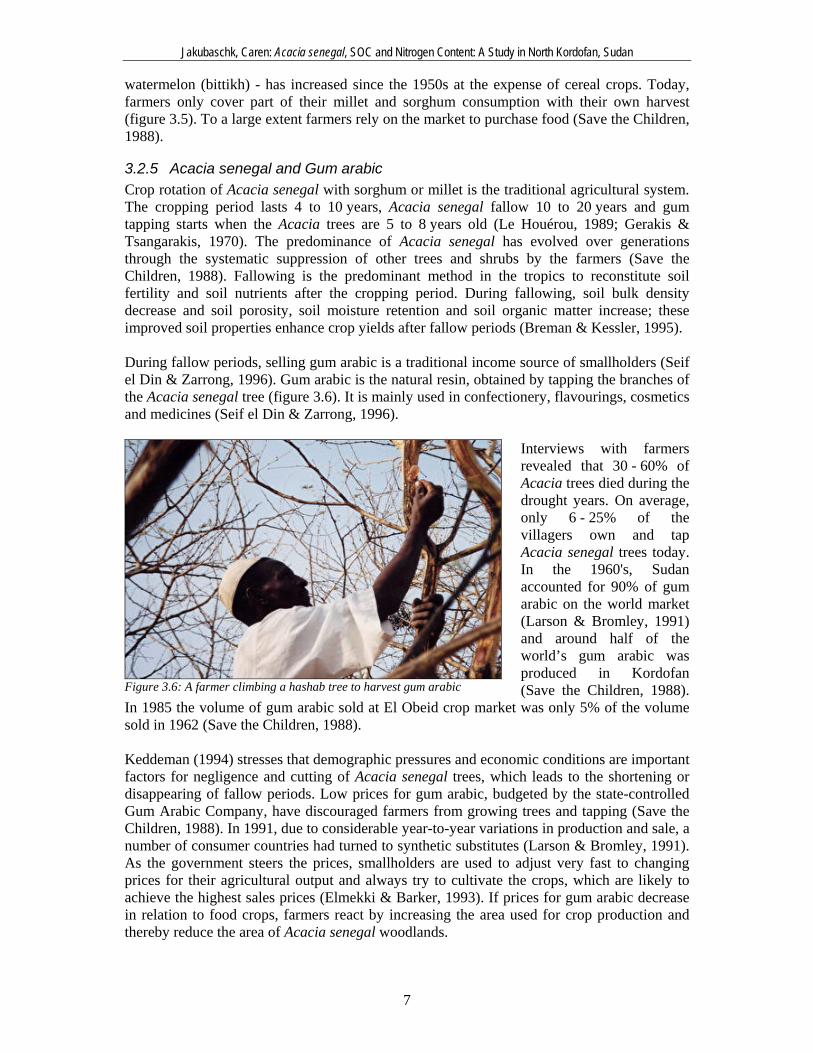
3.2.5 Acacia senegal and Gum arabic Crop rotation of Acacia senegal with sorghum or millet is the traditional agricultural system. The cropping period lasts 4 to 10 years, Acacia senegal fallow 10 to 20 years and gum tapping starts when the Acacia trees are 5 to 8 years old (Le Houérou, 1989; Gerakis & Tsangarakis, 1970). The predominance of Acacia senegal has evolved over generations through the systematic suppression of other trees and shrubs by the farmers (Save the Children, 1988). Fallowing is the predominant method in the tropics to reconstitute soil fertility and soil nutrients after the cropping period. During fallowing, soil bulk density decrease and soil porosity, soil moisture retention and soil organic matter increase; these improved soil properties enhance crop yields after fallow periods (Breman & Kessler, 1995). During fallow periods, selling gum arabic is a traditional income source of smallholders (Seif el Din & Zarrong, 1996). Gum arabic is the natural resin, obtained by tapping the branches of the Acacia senegal tree (figure 3.6). It is mainly used in confectionery, flavourings, cosmetics and medicines (Seif el Din & Zarrong, 1996).
Interviews with farmers revealed that 30 - 60% of Acacia trees died during the drought years. On average, only 6 - 25% of the villagers own and tap Acacia senegal trees today. In the 1960's, Sudan accounted for 90% of gum arabic on the world market (Larson & Bromley, 1991) and around half of the world’s gum arabic was produced in Kordofan (Save the Children, 1988).
In 1985 the volume of gum arabic sold at El Obeid crop market was only 5% of the volume sold in 1962 (Save the Children, 1988). Keddeman (1994) stresses that demographic pressures and economic conditions are important factors for negligence and cutting of Acacia senegal trees, which leads to the shortening or disappearing of fallow periods. Low prices for gum arabic, budgeted by the state-controlled Gum Arabic Company, have discouraged farmers from growing trees and tapping (Save the Children, 1988). In 1991, due to considerable year-to-year variations in production and sale, a number of consumer countries had turned to synthetic substitutes (Larson & Bromley, 1991). As the government steers the prices, smallholders are used to adjust very fast to changing prices for their agricultural output and always try to cultivate the crops, which are likely to achieve the highest sales prices (Elmekki & Barker, 1993). If prices for gum arabic decrease in relation to food crops, farmers react by increasing the area used for crop production and thereby reduce the area of Acacia senegal woodlands.
Figure 3.6: A farmer climbing a hashab tree to harvest gum arabic

Jakubaschk, Caren: Acacia senegal, SOC and Nitrogen Content: A Study in North Kordofan, Sudan
8
However, the following positive characteristics may illustrate why Acacia senegal is an important part of the Sahelian environment.
• Acacia senegal fixes nitrogen in the soil during fallow periods and improves soil fertility (Gerakis & Tsangarakis, 1970).
• It is well adapted to the harsh environment of the Sahelian zone, with sandy soils and low rainfall (Olsson & Rapp, 1991).
• After the fallow period, the trees can be cut down and sold as fuel wood with a very high-energy content (Seif el Din & Zarrong, 1996).
• The pods and leaves serve as nutritious fodder for livestock (Seif el Din & Zarrong, 1996).
• The trees protect the soil against erosion (Gerakis & Tsangarakis, 1970, Lal, 2001b).
Jakubaschk, Caren: Acacia senegal, SOC and Nitrogen Content: A Study in North Kordofan, Sudan
9
4 THEORETICAL BACKGROUND
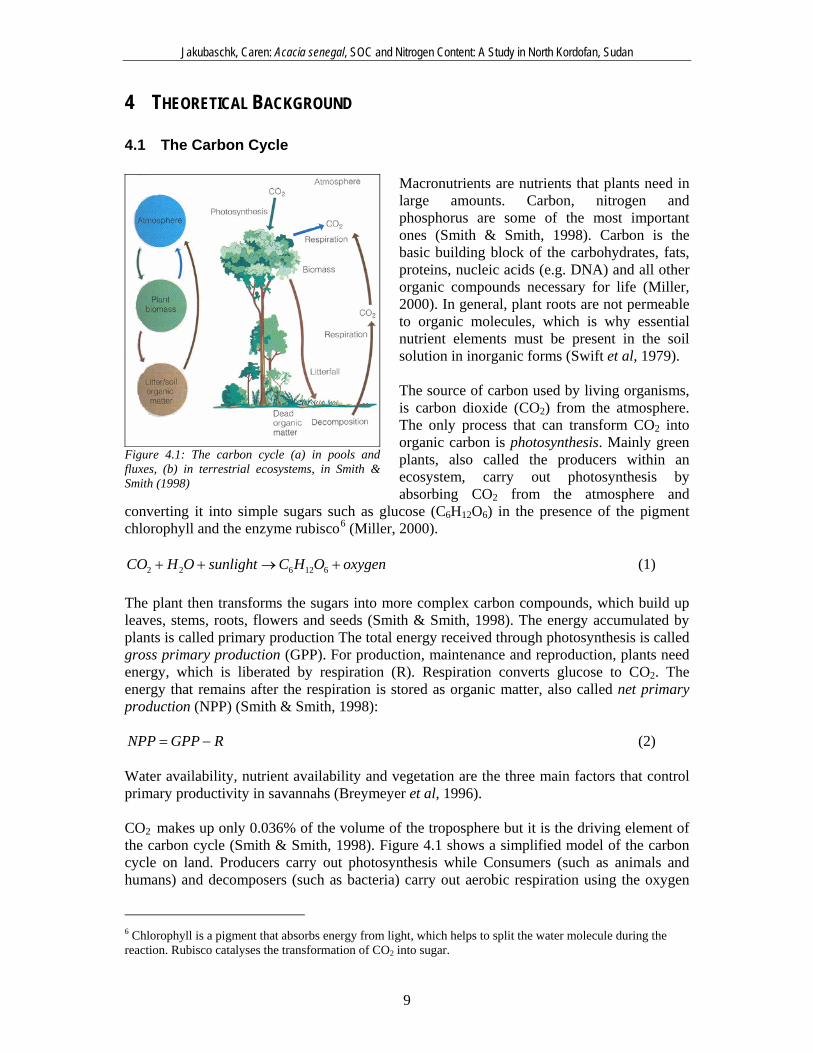
4.1 The Carbon Cycle Macronutrients are nutrients that plants need in large amounts. Carbon, nitrogen and phosphorus are some of the most important ones (Smith & Smith, 1998). Carbon is the basic building block of the carbohydrates, fats, proteins, nucleic acids (e.g. DNA) and all other organic compounds necessary for life (Miller, 2000). In general, plant roots are not permeable to organic molecules, which is why essential nutrient elements must be present in the soil solution in inorganic forms (Swift et al, 1979). The source of carbon used by living organisms, is carbon dioxide (CO2) from the atmosphere. The only process that can transform CO2 into organic carbon is photosynthesis. Mainly green plants, also called the producers within an ecosystem, carry out photosynthesis by absorbing CO2 from the atmosphere and
converting it into simple sugars such as glucose (C6H12O6) in the presence of the pigment chlorophyll and the enzyme rubisco6 (Miller, 2000).
oxygenOHCsunlightOHCO +→++ 612622 (1) The plant then transforms the sugars into more complex carbon compounds, which build up leaves, stems, roots, flowers and seeds (Smith & Smith, 1998). The energy accumulated by plants is called primary production The total energy received through photosynthesis is called gross primary production (GPP). For production, maintenance and reproduction, plants need energy, which is liberated by respiration (R). Respiration converts glucose to CO2. The energy that remains after the respiration is stored as organic matter, also called net primary production (NPP) (Smith & Smith, 1998):
RGPPNPP −= (2) Water availability, nutrient availability and vegetation are the three main factors that control primary productivity in savannahs (Breymeyer et al, 1996). CO2 makes up only 0.036% of the volume of the troposphere but it is the driving element of the carbon cycle (Smith & Smith, 1998). Figure 4.1 shows a simplified model of the carbon cycle on land. Producers carry out photosynthesis while Consumers (such as animals and humans) and decomposers (such as bacteria) carry out aerobic respiration using the oxygen
6 Chlorophyll is a pigment that absorbs energy from light, which helps to split the water molecule during the reaction. Rubisco catalyses the transformation of CO2 into sugar.
Figure 4.1: The carbon cycle (a) in pools and fluxes, (b) in terrestrial ecosystems, in Smith & Smith (1998)

Jakubaschk, Caren: Acacia senegal, SOC and Nitrogen Content: A Study in North Kordofan, Sudan
10
produced through photosynthesis. Microorganisms decompose plant and animal litter and carbon bound in organic compounds is released back into the atmosphere as CO2. The global carbon cycle depends on the movement of carbon (carbon fluxes) between global carbon pools. The largest carbon pool is the deep ocean, followed by the soil (the largest carbon pool on land), biota, the surface water and the atmosphere (Harvey, 2000).
4.2 The Nitrogen Cycle
4.2.1 The Nitrogen Cycle Most of the nitrogen available exists in the form of N2 in the atmosphere, which plants cannot take up. Plants only use inorganic nitrogen, mainly as ammonium (NH4+), and nitrate (NO3-) (Smith & Smith, 1998). The nitrogen cycle can be separated into different processes (Figure 4.3).
Nitrogen fixation is the process that converts N2 into ammonia (NH3). This is done by bacteria and blue-green algae. They exist either freely in soil or water or form symbiotic relationships with roots of higher plants (Sitte et al, 1998). When NH3 reacts with water, NH4+ is formed. The only plants that can “produce” nitrogen ready for take-up are leguminous plants. They form a symbiosis with nitrogen fixing bacteria living in their root nodules (Sitte et al,
1998). While the bacteria convert N2 into a form usable by the plants, the plants provide the bacteria with some simple carbohydrates (Miller, 2000). In addition to the biological nitrogen fixation – accounting for around 140 x 106 t year-1 - lightening fixes a small quantity of N2 (Schlesinger, 1997). Plants use NH4+ either directly or bacteria convert it into NO2 (nitrite)– which is toxic to plants - and than into NO3-; this conversion is called nitrification (Miller, 2000). According to Bernhard-Reversat & Poupon (1980), most nitrogen in semi-arid regions is produced as NO3- while the production of NH4+ is very low. Through the process of assimilation, plant roots absorb the available inorganic nitrogen and convert it to organic compounds (Sitte et al, 1998). Microorganisms and microbes decompose the plant litter. This process converts the nitrogen bounded in organic compounds back in its inorganic form. These processes make NH4+ again available for plant use and are called mineralisation or ammonification (Swift et al, 1979). During denitrification specialised bacteria turn NH3 and NH4+ back into NO3- and NO2-, which is then reverted to N2 and nitrous oxide gas (N2O) (Miller, 2000). Nitrogen affects the rate of photosynthesis because it is an essential building block of chlorophyll and the enzyme rubisco (Smith & Smith, 1998). In semi-arid areas, the available nitrogen is a factor limiting NPP (Schlesinger, 1997). This is why leguminous plants are important and recurrent in these regions (Sitte et al, 1998). Rainfall controls the nitrogen cycle in semi-arid regions as it limits vegetation growth and thus nitrogen utilization and
Figure 4.3: The nitrogen cycle, in Harvey (2000)

Jakubaschk, Caren: Acacia senegal, SOC and Nitrogen Content: A Study in North Kordofan, Sudan
11
return and controls nitrogen production by decomposition (Bernhard-Reversat & Poupon, 1980). The C:N ratio takes into account the total (inorganic and organic) amount of carbon and nitrogen that is available in the soil. At any time, the pool of inorganic nitrogen (NH4+ and NO3-) in the soil is very small because plants take it up so rapidly that little nitrogen remains in inorganic form although the annual flux through the soil pool is large (Schlesinger, 1997). The C:N ratio has a strong influence on the decomposition of organic material. If the nitrogen content in the soil increases, e.g. through litterfall of plants with high nitrogen content, decomposition of SOC decreases. A reason for this is that microorganisms decompose as they are in need of nitrogen (Ågren & Bosatta, 1996). If a lot of nitrogen is available, they have to decompose less organic matter in order to satisfy their needs. If decomposition and therefore respiration decreases, the amount of CO2 released to the atmosphere decreases and the SOC content increases. The C:N ratio varies with regard to different soil types and different types of organic material. In forests, for example, the ratio is around 20, but varying up to 100 for ecosystems with low decomposition and down to 10 for well decomposed organic material [2]. Nitrogen and carbon are interdependent. Leguminous plants need energy to fix nitrogen and they receive this energy by respiring organic carbon (Schlesinger, 1997). This means that there is a dependence of nitrogen fixation on organic carbon availability in plants. On the other hand – as mentioned before - the SOC content cannot be increased without simultaneously increasing the nitrogen content (Brady, 1990).
4.2.2 Acacia senegal and Nitrogen Throughout the study, I assume that Acacia senegal fixes nitrogen. Several studies have revealed higher nitrogen contents under Acacia senegal compared to open ground or other tree species (Gerakis & Tsangarakis, 1970; Bernhard-Reversat & Poupon, 1980; El Tahir et al, 2002). For example, El Tahir et al (2002) investigated the soils under Acacia senegal, Acacia seyal and Acacia tortillis where Acacia senegal showed the highest nitrogen content. However, this fact is not generally accepted. Bosch (1991) compared N, C and P contents under Acacia senegal fields and other land uses and did not find increased nitrogen contents under Acacia senegal. Research in the nursery at the Agricultural Research Station (ARC) in El Obeid showed that Acacia senegal trees only had nodules during the first four months, after that there is no evidence that Acacia senegal is fixing nitrogen (personal communication B. A. El Tahir, director of ARC El Obeid). Breman & Kessler (1995) state that nodulation on roots of Acacia senegal is limited in Sudan. Bernhard-Reversat & Poupon (1980) studied the nitrogen cycle of Acacia senegal in semi-arid Senegal. They state that investigated adult trees did not have nodules and assume that symbiotic fixation occurs only during the first years of tree life. According to Breman & Kessler (1995) and Buresh & Tian (1998) it is very difficult to estimate N2 fixation and to find out if trees continue to fix N2 during their growth. This is a reason why estimations vary strongly. Even if Acacia senegal does not fix nitrogen from the atmosphere it is acknowledged that the nitrogen content under Acacia senegal is 2.5 to 3 times higher than under open ground (Bernhard-Reversat & Poupon, 1980). Nitrogen is returned to the soil by tree litter, leaching of leaves and branches by throughfall, herbaceous litter and roots. The plant nitrogen is mineralised and made available for plant uptake again. According to Bernhard-Reversat (1982), nitrogen mineralisation beneath Acacia senegal in semi-arid regions, peaks in June

Jakubaschk, Caren: Acacia senegal, SOC and Nitrogen Content: A Study in North Kordofan, Sudan
12
and August and decreases sharply in September before the end of the rainy season. During the rest of the year, nitrogen production is almost zero. According to Bernhard-Reversat (1993), Acacia senegal litter contains more nitrogen than other tree species and the litter is decomposed very fast compared with litter of other tree species. As mentioned earlier, nitrogen is a limiting factor in the study area and if plant litter with high nitrogen content becomes available, it is decomposed extremely fast until the saturation level. The above-mentioned statements of Ågren & Bosatta (1996) explain the processes in areas where nitrogen is not limiting plant growth.
4.3 Decomposition and Soil Organic Matter (SOM) According to Brady (1990), SOM “is the organic fraction of the soil that includes plant and animal residues at various stages of decomposition, cells and tissues of soil organisms, and substances synthesized by the soil population”. SOM is transformed continually and it lasts in the soil from a couple of hours to hundreds of years. SOM content of soils is low, although its influence on soil properties is strong. SOM increases water-holding capacity and is the major source of nutrients, such as nitrogen, phosphorus and sulphur. Further, it is the main source of energy for soil organisms, which means that soil fauna activity almost ceases if no SOM is available. SOM improves soil cation exchange capacity7 (CEC) and soil aggregate stability which effects soil aeration, resistance to erosion, infiltration capacity and soil moisture retention (Breman & Kessler, 1995). An increase in SOM adds to soil fertility and crop production (Schlesinger, 1999). Around 58% of SOM is carbon (Post et al, 1999). Decomposition occurs when chemicals in plant residues are broken down or drastically modified by soil organisms (Brady, 1990). The three main factors influencing decomposition are environmental conditions (moisture, temperature, oxygen, soil texture, soil nutrients), litter quality and the soil fauna (Breman & Kessler, 1995). In savannahs, litter accumulates on the soil surface during the dry season. During the rainy season, decomposition is rapid and the decomposition rate is much higher than the litter fall rate (Breman & Kessler, 1995). Nitrogen and lignin contents, precipitation and temperature are mainly controlling litter decomposition (Bernhard-Reversat, 1993). Litter and root production provide the main input of SOM. In savannahs the major litter input site is below-ground (Schlesinger, 1997). Fine roots often contribute the majority of below-ground production (Jackson et al, 1996). Within ecosystems, decomposition performs two major functions: (1) the mineralisation of essential elements and (2) the formation of SOM (Swift et al, 1979). However, these two functions are conflicting. A high nutrient input to the soil requires a high decomposition rate while maintenance of SOM content requires a low decomposition rate (Breman & Kessler, 1995). In regions with dry periods the decomposition rate varies strongly during the year. During the rainy period, mainly in August and September, most of the litter material is decomposed while from November to May almost no decomposition occurs.
7 CEC is defined as the sum total of the exchangeable cations that a soil can absorb. It quantifies the ability of a soil to provide a nutrient reserve for plant uptake (Brady, 1990).

Jakubaschk, Caren: Acacia senegal, SOC and Nitrogen Content: A Study in North Kordofan, Sudan
13
4.4 Global Warming
4.4.1 The Kyoto Protocol Over the 20th century, global average surface temperature has increased by 0.6 ± 0.2°C 8 and the globally averaged surface temperature is projected to increase by 1.4 to 5.8°C over the period 1990 to 2100 (IPCC, 2001). Human activities have increased the content of the key greenhouse gases CO2, methane (CH4) and nitrous oxide (N2H) [2]. The concentration of CO2 in the atmosphere has increased by 31% since 1750. About three-quarters of the anthropogenic emissions of CO2 to the atmosphere during the past 20 years was due to fossil fuel burning while the remaining part is mainly due to land use change, especially deforestation (IPCC, 2001). It is very difficult to predict CO2 concentration as it responds to changing climate on time scales ranging from a couple of months to thousands of years (Harvey, 2000). For example, several centuries after CO2 emissions have occurred, about a quarter of the increase in CO2 concentration caused by these emissions is still present in the atmosphere (IPCC, 2001). In 1994, the United Nations Framework Convention on Climate Change (UNFCCC) entered into force. Its goal is to stabilize global greenhouse gases in the atmosphere at a level that prevents further anthropogenic interference with the climate system [4]. An important principle is that the industrialized countries, which are mainly responsible for emissions and thus for climate change, have the main financial burden to bear. As they are listed in Annex I of the Convention, they are also called Annex I countries while developing countries are called Annex II countries. In 1997, at the third session of the conference of the parties (COP 3) in Kyoto, the Kyoto Protocol was adopted. As of September 2002, 74 countries had ratified [5] the Kyoto Protocol accounting for around 40% of world’s emissions. As soon as 55 countries, accounting for 55% of the world’s emissions in 1990, have ratified the document, it will come into force 90 days after the last ratification. Some of the countries responsible for most of the emissions today, e.g. the USA, Australia, China, the Russian Federation and the Newly Industrialized Countries such as Brazil, Malaysia and Thailand, have not yet signed [6]. The United States accounted for 36% of total emissions by industrialized countries in 1990, which is why it is very unlikely that the Kyoto Protocol will come into force if the US does not ratify (Holtsmark & Alfsen, 1998). The Kyoto Protocol is the first document containing concrete and binding commitments for the Annex I countries to reduce greenhouse gas emissions. From 2008 to 2012 (the first commitment period), the industrialized countries must reduce their emissions of the six main greenhouse gases9 by at least five percent compared to 1990. Burdens are distributed differently from country to country. Annex II countries don’t have any commitments while Annex I parties have different possibilities to meet their emission reduction targets [7]. At the domestic level, countries are free to choose the policies that are best suited. At the international level, the Protocol allows the implementation of so-called “flexible mechanisms”: (1) International Emission Trading, (2) Joint Implementation and (3) the Clean Development Mechanism (CDM). 8 IPCC publications refer to the term climate change as any change in climate over time, whether due to natural variability or as a result of human activity (IPCC, 2001).
9 Carbon dioxide (CO2), methane (CH4), nitrous oxide (N2O), Hydrofluorocarbons (HFCs), Perfluorocarbons (PFCs), Sulphur hexafluoride (SF6) (IPCC, 2001).

Jakubaschk, Caren: Acacia senegal, SOC and Nitrogen Content: A Study in North Kordofan, Sudan
14
These instruments allow the trading of carbon quotas between countries. For this study, only the CDM, stated in Article 12 of the Protocol, is of importance. Its objective is to assist developing countries in achieving sustainable development with respect to greenhouse gas emissions and to assist industrialized countries in achieving their commitments under the Kyoto Protocol. It allows industrialized countries to move some of their emission reduction efforts into the developing world. Developing countries will benefit from reduction projects taking part in their countries, as they will receive certified emission quotas corresponding to the achieved emission reductions while industrialized countries can buy these quotas and cover in this way some of their reduction commitments (Holtsmark & Alfsen, 1998). In the future, it might be difficult to determine the net emission reduction effects of CDM projects, especially as both - Annex I and Annex II countries - might be interested in exaggerating amounts of emission reductions (Holtsmark & Alfsen, 1998). Reasons why Africa could be set back in the run for CDM project money are low emission reduction potential, deficient institutional capacity and a weak private sector (Brooke & Turkson, 1999).
4.4.2 Carbon Sinks The sequestration of atmospheric carbon in terrestrial sinks such as biomass and soils might be a possible way to reduce CO2 contents in the atmosphere. This idea is one of the most controversial issues discussed within the Kyoto Protocol. Critics state that the accounting of soil carbon sinks might delay real emission reductions and the monitoring and verification of carbon sinks is difficult and expensive (Olsson & Ardö, 2002). When comparing the benefits of carbon sinks in biomass or soils, there are clear advantages of the latter: carbon stored in agricultural soils is less likely to be released than that in forests, as it contributes to soil fertility, soil carbon has a longer residence time compared with above-ground vegetation and there are clear social and economic benefits for people that own the agricultural land (Olsson & Ardö, 2002). Often the option of carbon sinks is stated as a possibility to buy time until better technologies and possibilities have been found to reduce fossil fuel emissions (Ringius, 1999).
4.5 Synthesis Schlesinger (1999, 2000) states that agricultural practices such as nitrogen fertilisation, manure or irrigation contain “hidden carbon costs” in terms of emissions of CO2 to the atmosphere. For irrigation, energy is needed to pump the water on the fields. Industrial production of nitrogen fertiliser is highly dependent on fossil fuels and the demand for fertilisers for food production is increasing worldwide. For this reason, there is renewed interest in biological nitrogen fixation as an alternative or supplement of chemical nitrogen fertiliser (Marschner, 1995). Andrén & Kätterer (2001a) modelled the SOC content for different carbon inputs. They state that the increase of SOC is low for a doubling of carbon input, as around 50% of the crop residues are lost in respiration, which means increased CO2 emissions to the atmosphere. Therefore, low input agricultural systems, e.g. in semi-arid areas, might have a higher potential for net carbon sequestration than intensive agricultural systems. Schlesinger (2000) advocates the regrowth of natural vegetation on abandoned agricultural land in order to receive a small sink for carbon in soils instead of the intensification of existing agricultural activities. The management practice is one of the most important features of how to keep carbon in the soil. Due to inappropriate land use and management practices, many soils in Africa are degraded and are therefore below their potential organic carbon levels (Batjes, 2001).

Jakubaschk, Caren: Acacia senegal, SOC and Nitrogen Content: A Study in North Kordofan, Sudan
15
Problems in North Kordofan•variable climate - droughts•shifting cultivation & Acacia senegaldisappearing•environmental degradation•low yieldsBUT: dependence on agriculture
Global Conventions•Climate Change (UNFCC)•Desertification (UNCCD)•Biodiversity (UNCBD)
The Kyoto Protocol (Article 3.4)
CDM
Carbon Sequestration + Development Projects
social and economic benefits for farmers•higher soil fertility•increased soil productivity & yields•increased food security & income•reduced animal pressure•enhanced water storage
Benefits for the environment•climate change mitigation•rehabilitation of degraded lands•erosion and desertification control
Regeneration of Acacia senegal?
Figure 5.1: The framework of this study, partly adapted and modified after Tschakert (2001) The regeneration of Acacia senegal might be a concept that combines climate change mitigation through carbon sequestration with socioeconomic benefits for the local population and environmental benefits (figure 5.1). The idea of regenerating Acacia senegal stands is not new. At least 10 internationally financed projects had been undertaken during the 80s and 90s in North Kordofan focusing on desertification control by reforestation of Acacia senegal; the largest one (“Restocking of the Gumbelt for Desertification Control”) – under the direction of UNSO and the Dutch government - ceased in 1994 (Keddeman, 1994). Carbon sequestration could be a new dimension in these kinds of projects following careful investigation of Acacia senegal’s potential to sequester carbon.

Jakubaschk, Caren: Acacia senegal, SOC and Nitrogen Content: A Study in North Kordofan, Sudan
16
5 METHODS
5.1 Fieldwork The fieldwork was carried out in the surroundings of Umm Ruwaba. It was divided into three parts: Interviewing smallholders10, soil sampling and measuring biomass. The following five land uses were investigated in this study: • Fallow fields with Acacia senegal (FallowA) • Fallow fields without Acacia senegal (Fallow) • Crop fields (Crops) • Virgin sites with Acacia senegal (VirginA) • Virgin sites without Acacia senegal (Virgin) As mentioned above, FallowA is a component of the traditional system of shifting cultivation. The density of the stands in the study area varied strongly. Most of the Acacia senegal stands were tapped. Collection of soil samples focused on old stands of around 15 to 20 years. This is the age at which the trees stop producing gum. They are cut down to ankle or knee height and the land is cleared for cultivation. For comparison, patches of Fallow sampled should have approximately the same age as those of FallowA. The patches of Crops used for sampling should be cultivated for at least one to two decades. During the dry season, animals graze on the fields. A Virgin site is an area with as small human impact (grazing, cultivation etc.) as possible. Soils of Virgin sites reflect a steady state condition for the soil in terms of organic matter content; therefore the carbon content of a soil in its native state usually is a good indicator of the sequestration potential of the soil (Cheng & Kimble, 2001). As all sites were not fenced or guarded the fields where samples were collected were grazed. An attempt was made to cover all directions starting in Umm Ruwaba. As there is only one road in East-West direction passing through Umm Ruwaba, it was difficult to reach villages situated far to the North or South of Umm Ruwaba. Gardud soils dominate South of Umm Ruwaba. Hence, samples from sites far south were not collected. The selected villages are situated close to the road. Through a group interview with the head of the village (“sheik”) and as many farmers as possible, fields that could be classified as one of the five land uses selected for the study were identified. The farmer himself or any person that knew land use and land use history of the fields guided the research team to the site. On the field, an area of 20 m by 20 m that corresponded to the average vegetation cover was studied. In accordance with Bosch’s study, the fields chosen did not have a slope more than 3% and were not situated in an accumulation or erosion position (Bosch, 1991).
5.1.1 GPS Recording and Processing of Data The position in the centre of each field was measured with a GPS, using the WGS84 map datum and the UTM projection. The GPS measures with an accuracy of ± 10 m (Ardö & Olsson, 2002b), which was accurate enough for the purpose of this study. The GPS data was used to visualise the soil sample sites in the study area.
10 The results of the qualitative interviews described in chapter 3.2 are not mentioned here. The interviews conducted for fieldwork were restricted to information needed for soil sampling and biomass measurements.

Jakubaschk, Caren: Acacia senegal, SOC and Nitrogen Content: A Study in North Kordofan, Sudan
17
5.1.2 Soil Sampling
Figure 5.1: The study area, each point indicates the centre of a field (20 m times 20 m).
Figure 5.1 shows the soil sample sites. Each point indicates a field of 20 m by 20 m. The field was staked with four sticks. On each field, four sites were selected (Figure 5.2). At each site, samples were taken at 0-20 cm depth and at most sites at 20-50 cm depth. As short-term effects - e.g. grazing, fire or accumulation through wind - influence the topsoil, samples were taken at different depths. As a general rule of thumb, the amount of soil should be at least 100 times as large as the sample to be collected (Kimble et al, 2001). The samples of each field, which were taken at the same depth, were thoroughly mixed in a big bowl and around 50 g were taken out of the mixed sample (Figure 5.3) (Deans et al, 1999).
On each field, the following information was gathered: land use and land use history, vegetation type and the soil type. On crop fields, information about cultivation methods and crop rotation was also gathered. Table 5.1 illustrates how the information needed was compiled. Appendix 2 includes the soil sample and biomass protocol as well as the soil sample questionnaire. Table 5.1: Collected information on soil sample sites (for each field) Information Gathering Geographical position Determination with a GPS receiver, chapter 6.1.1 Vegetation type Biomass protocol, see appendix 3 Recent land use, land use history Soil sample protocol, see appendix 3 Cultivation methods on the crop field Soil sample protocol, see appendix 3 Soil type FAO soil database 1995 & 1998 Amount of biomass production/ year Combination of estimation and measurement, chapter 6.1.3 Climate data Climate station in El Obeid Soil texture Soil sampling Carbon and nitrogen content of the soil Soil sampling
20 m
20 m
Figure 5.2: Draft of how the soil samples should be scattered in the field

Jakubaschk, Caren: Acacia senegal, SOC and Nitrogen Content: A Study in North Kordofan, Sudan
18
On fields with Acacia senegal or other trees, attention was paid to the fact that soil fertility beneath tree crowns often is higher than in areas distant to trees (Deans et al, 1999; Gerakis & Tsangarakis, 1970). Thus, soil samples were taken as far away from trees as possible. This implies that the real soil sample sites on fields with trees differ from the draft in Figure 5.2. Additionally, I took three soil samples to define the soil texture (around 300 g per sample). The soil type in the
study area – according to the FAO soil map and my own observations – was consistent and therefore only a small amount of soil texture samples were taken.
5.1.3 Biomass Measurements and Estimations The annual amount of carbon is an input to the ICBM model. As the available biomass is a crucial factor for how much carbon is available, it is necessary to estimate the amount of biomass produced per year on each site. Only a fraction of the produced biomass per year becomes litter while organic matter is only a fraction of this litter input. The biomass production can be divided into three different parts, 1) Acacia senegal, 2) all other tree species 3) grass and 4) crop fields. Each part is discussed separately, listing the measurements made, calculation of biomass, amount of litter year-1 and amount of organic matter year-1. Acacia senegal Each field was studied visually and species composition and number of trees were noted. If there were trees on the field, one average tree of each species was chosen as a representative for the whole group. Trees and shrubs less than 50 cm large were not counted as trees. The method of measuring and estimating the dry biomass of Acacia senegal follows Deans et al (1999), who studied the biomass in five Acacia senegal plantations of different ages in North Senegal. They found out that the tree biomass increased linearly from age 3 to 18 and that the biomass was linearly related to the measured stem cross-sectional area (CSA) at 30 cm height. Therefore, I measured the CSA at 30 cm height. If trees were multi-stemmed, all stems were measured and the diameters summed up (Rosenschein et al, 1999). The total aboveground biomass (in g) for Acacia senegal trees can be calculated as
CSAy ×+= 12.471.3 with r2 = 0.97 (3) The fine-root biomass can be calculated as
512.04.23 CSAy ×= with r2 = 0.8 (4)
Figure 5.3: The interpreter and the driver during soil sampling: with the stick (in the sample hole) we measured the depth and with the spade I scratched along the side of the hole to receive the soil. Then we mixed the sample in the bowl and put around 50 g into a plastic bag.

Jakubaschk, Caren: Acacia senegal, SOC and Nitrogen Content: A Study in North Kordofan, Sudan
19
and the coarse-root biomass as
737.10004.0 CSAy ×= with r2 = 0.89 (5) Deans et al (1999) estimated the belowground biomass to be 20%, aboveground biomass around 80% of total biomass of a tree at age 18. Other tree species Measurements for all other types of trees included CSA at breast height, canopy diameter, height and total number of stems. There were no equations available that allowed the biomass estimation of the specific tree species in this study. Olsson (1985) developed an equation for tree biomass estimation through destructive measurements of 39 trees in North Kordofan region11:
XY ∗+= 28.119.0 with r2 = 0.94 (6) where Y = log10 wet weight in kg and X = log10 squared crown diameter. Olsson's method only describes above-ground biomass. As the data had to be comparable to the estimations for Acacia senegal trees, an equal root:shoot ratio of 0.2 was estimated. Additionally, wet weight was transformed into dry weight and water content was assumed to be 75% (Brady, 1990). Consequently, the equation became
25.0*2.1)28.119.0( ∗∗+= XY (7) Annual tree litter was assumed to be 16 % of total tree biomass (Tiessen et al, 1998). Grass As fieldwork was conducted during the dry season, the seasonal grass vegetation could not be measured. Instead, the annual biomass production was estimated from literature. Grass height, percentage of cover and local name were noted. Jackson et al (1996) describe the root biomass (dry weight) and root:shoot ratio for tropical grassland savannah, which allows calculating the total biomass (Table 5.2). Grass growth occurs only during the wet season while Jackson’s value stands for tropical grasslands having water almost all year round. Therefore, Jackson’s value was divided by three, accounting for the growing season of around four months in the study area. Further, the assumption was made that grazing diminishes the annual grass biomass by 50% (Tiessen et al, 1998). Total biomassSA is the grass dry weight in kg for 1 m2 in the study area. Most of the time, the study sites had a mixed vegetation of scattered trees and grassland which means that Total biomassSA had to be multiplied by the fraction of grass cover that had been estimated. Table 5.2: Biomass estimations for tropical grassland savannah in kg m-2, source: A and B: Jackson et al (1996); C, D and E: calculations based on A and B. Total biomassSA is the grass dry weight in the study area in kg for 1 m2. A Root biomass
B Root/shoot ratio
C Biomass above-ground
D Total biomass
E Total biomassSA
1.4 0.7 2 3.4 0.565
11 The tree species included in the destructive measurements of Olsson (1985) were Acacia albida, Acacia mellifera, Acacia senegal, Acacia seyal, Acacia tortillas, Andansonia digitata, Albizzia amara, Balanites aegyptiaca, Boscia senegalensis, Commiphora africana, Guiera senegalensis and Leptadenia pyrotechnica.

Jakubaschk, Caren: Acacia senegal, SOC and Nitrogen Content: A Study in North Kordofan, Sudan
20
Crop fields Almost no above-ground crop biomass is left on the fields (Interviews, February, 2002). Hay and straw is used as building material. After the harvest and during the dry season, camels, goats and sheep graze the fields. In May, the crop remnants are piled up and burnt before the next sowing. This means that the crop remnants are only left on the field during dry season, when almost no decomposition occurs and the litter that is left in the beginning of May is burnt before the rainy season starts. This implies that only the root biomass of the crops of the year before which are still in the ground can be decomposed during rainy season (Tiessen et al, 1998). An additional input is manure from grazing animals, but this factor is very difficult to specify and is therefore left aside. The biomass estimation of the crop fields is based on calculations using the estimations of the field owners concerning their last yield and the biomass measurements of Elhag (1992) and Osman (2001) (table 5.3). Table 5.3: Biomass of different crops (dry weight) in kg ha-1 Crop Hay/straw yield Grain yield (G) Total biomass Grain yield in % of total biomass
(Gp) Millet 517 119 636 18.7 Sorghum 800 131 931 14.1 Sesame 239 136 375 36.3 Groundnut 714 343 1057 32.5 Source: Elhag, F.M.A. (1992) and Osman, A.K. (2001) Using the data in table 5.3, the percentage of the grain yield of the total biomass (Gp) was calculated. The total biomass (Y) transformed to kg m-2 is calculated as
100∗=
pGGY (8)
According to Jackson et al (1996), the root:shoot ratio for crops is 0.1. Therefore, the root biomass (Yr) is
1.0∗= YYr (9)
5.2 Analyses of Soil Samples
5.2.1 Bulk Density Ardö & Olsson (2002b) measured a bulk density of 1.711 in the study area, using 10 samples collected in February 2001. The bulk density is the density of the undisturbed soil, which takes into account the density of the soil materials themselves, and their arrangement and structure. Bulk density is calculated using following equation:
)()(
3cmsampledwhenblockofVolumegsoilofblockdryaofWeightdensityBulk = (10)
A loose porous soil will have a smaller bulk density as a compact soil although the density of the soil material itself is the same. For example, the bulk density for cultivated soil may vary between 0.55 and 2.0 (Fitzpatrick, 1991).

Jakubaschk, Caren: Acacia senegal, SOC and Nitrogen Content: A Study in North Kordofan, Sudan
21
5.2.2 Carbon Soil samples were analysed for carbon and nitrogen at the laboratory of Plant Ecology, Lund University. As the results of the analyses will be used within other research projects at MICLU, it was necessary to conduct the analyses at the same laboratory. All samples were dried at 85°C for about 24 hours. Soil carbon was analysed using the Carbon Determinator LECO CR-12, which analyses organic and inorganic carbon. A sample of 4.5 g was put into a combustion boat and pushed into the oven. It was burnt at 1300°C and the carbon oxidized to CO2. An infrared detector sensed the CO2. A built-in microcomputer calculated the carbon concentration in percent of the weighed quantity of the sample. LECO CR-12 calculates carbon contents down to 0.01% of the weighed sample and its precision lies around ± 1% of the carbon content of the sample. In the beginning and after each 20th sample processed, the device had to be calibrated using CaCO3 which contains precisely 12% carbon. During calibration, the machine analyses three samples with 100-150g of CaCO3 and calculates the mean of the results in percent. The mean is then equated with 12%. The Carbon Determinator calculates carbon in percent, but most authors refer to carbon contents in g m-2. The use of the same unit simplifies to compare the results. The carbon content was calculated for 1 m2 with a depth of 20 cm for soil samples taken at 0-20 cm depth and 30 cm for soil samples taken at 20-50 cm depth. The bulk density (in g cm-3) was multiplied with 10 00012 to receive the weight of 1 cm covering 1 m2. The result was multiplied with 20 and 30 respectively, which stand for the depth of the soil sample taken. This number was then multiplied with the percentage rate of carbon (Young, 1976).
( )100
2010000 01
CdensityBulkC ×××= (11)
C1 is the output carbon content in g m-2 and C0 is the carbon content in percent. As the carbon content of the soil samples is low, the precision of measurement results might be low. Therefore 25 soil samples were analysed twice in order to see if there was a high difference between the results. This was not the case. The average deviation was 0.0096%. This is a negligible quantity.
5.2.3 Nitrogen Nitrogen content was calculated using the Kjeldahl method, which analyses organic nitrogen and ammonium (NH4+). This is almost the total nitrogen content in plants, animals and soil matter. Nitrate (NO3-) is not quantified (Ekologisk Metodik, 1981). First, 1.5 g of the soil sample was weighed and placed into a test tube to which metallic sulphate (100g K2SO4 and 10g CuSO4 * 5H20), a catalyst, and sulphuric acid (H2SO4) were added. The samples were heated to 360°C. During this process all proteins are split up and the organic nitrogen is converted into ammonia. The sample was diluted with deionised water to 100 ml. Then it was analysed for Total Kjeldahl Nitrogen using a Flow Injection Analyser (FIA). The instrument used was built by Foss Tecator (model 5012, detector model 5042). The instrument detects within the area of 10–1000 μg/l. The aqueous sample was injected into a carrier stream and mixed with sodium hydroxide. The joint stream passes along a PTFE membrane in a gas diffusion cell. The ammonia gas formed diffuses through the membrane 12 1m2 = (100 x 100) cm2

Jakubaschk, Caren: Acacia senegal, SOC and Nitrogen Content: A Study in North Kordofan, Sudan
22
into an indicator stream. The resulting colour change of the indicator, which is proportional to the amount of ammonia in the sample, is measured at 590 nm. The resulting amount of nitrogen is given in μmol l-1. A more common unit for nitrogen is μg g-1, which can be calculated using the following equation13:
WkWVNgginN NO ∗∗∗
=−1μ (12)
N0 is the nitrogen content in μmol l-1, V is the total volume, WN is the weight of nitrogen in g mol-1 and W is the weight quantity of the sample (1.5 g). In some cases, the sample was diluted twice or three times because the nitrogen concentration was too high to be detected by the FIA. The constant k indicates if the sample was diluted, e.g. if the sample was diluted to its double quantity, k equals 2.
5.2.4 Soil Texture Soil texture is the proportion of different sized soil particles. The particles are separated into the diameter sizes clay (< 0.002), silt (0.002–0.06) and sand (0.06–2.0) measured in mm. (Fitzpatrick, 1991). The samples were analysed at the laboratory of Quaternary Geology, Lund University. The samples were sieved to wash away particles less than 0.06 mm. As the samples consisted mainly of sand, sieving was sufficient to detect the distribution of particle size.
5.3 The Introductory Carbon Balance Model The third objective of this research study is to determine if the SOC content simulated with the ICBM are similar to my field observations. For better understanding, the hypothesis is as follows: H0: There is no difference between the modelled carbon values and the observed carbon values of the five different land uses.
5.3.1 Why Modelling? A mathematical model tries to explain reality by interconnecting mathematical equations, which show and calculate processes within an ecosystem. Conducting experiments with the model develops a deeper understanding of the modelled ecosystem. Modelling can be used to elaborate appropriate regional strategies and to forecast future scenarios of ecosystem dynamics. By simulating the SOC content of different land uses and management practices over a defined time period, the dynamics can be evaluated and it can be estimated which strategy is most appropriate in the context of carbon sequestration. Most models, e.g. the CENTURY model are very complicated and it takes a lot of effort to understand the structure and assumptions behind. The ICBM focuses on the main processes and might thus be an easy tool to make first assessments of carbon sequestration suitability of different areas.
5.3.2 The Model Structure and Equations The Introductory Carbon Balance Model (ICBM) is a simple model that is usually applied for a 30-years period with a 1-year time step. It can be used to predict the effects of changed inputs, climate, initial pools, litter quality etc. on soil carbon pools. It only includes processes that are comparatively well known and models the topsoil in 0-25 cm depth. Structure and equations are explained in Andrén & Kätterer (1997). The model can be applied using spreadsheets, e.g. in Excel. The files can be easily downloaded from the Internet [8]. Until 13 Personal communication with Tommy Olsson, March 2002

Jakubaschk, Caren: Acacia senegal, SOC and Nitrogen Content: A Study in North Kordofan, Sudan
23
today the model has been applied in Northern Europe and no study has been made that shows if and how the ICBM can be applied to semi-arid conditions.
The model has two pools - young (Y) and old soil carbon (O). It includes five parameters: The decay constants ky and ko, the mean annual carbon input i, the humification coefficient h and factor re (figure 5.4 and table 5.5). Yss and Oss stand for the two pools in steady-state conditions. All external factors (climate and land management practices) and edaphic factors (soil type) are condensed in re. There is no precise definition of what should be included in re, it is up to the modeller to decide which factors are considered to be most important for the area simulated (personal communication Thomas Kätterer). The parameter re influences the decomposition rates of Y and O equally and does not affect the humification coefficient h. As this is not realistic, one might decide to adjust h to different external conditions.
Table 5.5: The parameters and variables of the ICBM, their dimensions and the effect of a parameter increase on SOC contents, source: Andrén & Kätterer (2001a) Parameter Abbreviation Dimension Effect of parameter increase on soil C mass Carbon input i g m-2 year-1 positive Decay constant for Y ky year-1 negative Decay constant for O ko year-1 negative Humification constant: h dimensionless positive External influences re dimensionless negative According to the model equations, an increase of re positively influences the decomposition constants ky and ko. An increase of either one of these three parameters causes a decrease of the SOC content. An increase of either annual carbon input i or the humification constant h adds to the SOC content.
5.3.3 Input Data – Estimation of Parameter Values Carbon pools: Y and O Ardö & Olsson (2002a) refer to SOC values of 851 and 227 g m-2 measured in Umm Higlig in 1963 and 2000, respectively. Umm Higlig lies within the goz soil area and is situated around 18 km north west of El Obeid. The mean SOC contents were obtained through 16 and 4 soil samples, respectively. In 1963, Acacia senegal dominated the area while grass cover was around 60%. The site has been fallow for 17 years. In 2000, the land had been fallow for at least five years and the area was covered with scattered Acacia senegal and Calotropis procera. Interpolation yielded a SOC content of 700 g m-2 in 1972. As no values for other land use types were available, it was used as an initial value for all land use types. Referring to data of Andrén & Kätterer (1997), only 0.02% of SOC is stored in the young carbon pool Y. Consequently, 0.035 kg C m-2 for Y and 0.665 kg C m-2 for O were used.
i
Y
eySS rk
iY =
O
eoSS rk
ihO =
Yrkh ey)1( −
Ork eo
Yrhk ey
Figure 5.4: The structure of the ICBM [8]
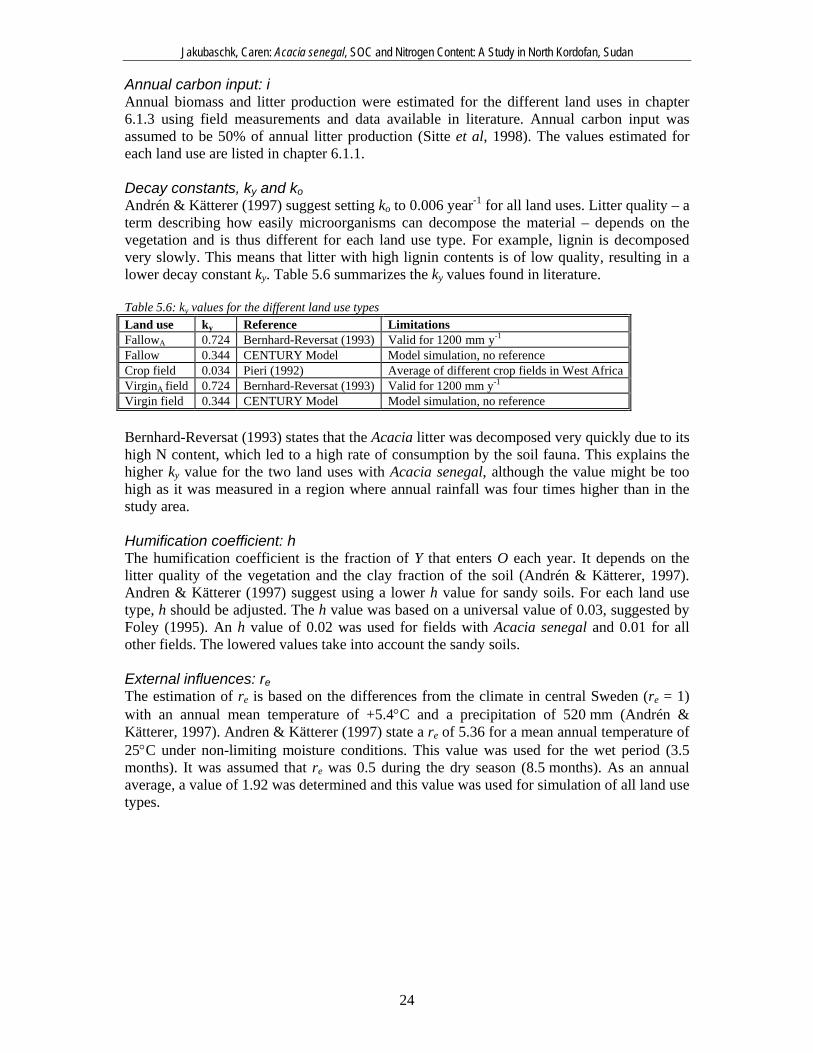
Jakubaschk, Caren: Acacia senegal, SOC and Nitrogen Content: A Study in North Kordofan, Sudan
24
Annual carbon input: i Annual biomass and litter production were estimated for the different land uses in chapter 6.1.3 using field measurements and data available in literature. Annual carbon input was assumed to be 50% of annual litter production (Sitte et al, 1998). The values estimated for each land use are listed in chapter 6.1.1. Decay constants, ky and ko Andrén & Kätterer (1997) suggest setting ko to 0.006 year-1 for all land uses. Litter quality – a term describing how easily microorganisms can decompose the material – depends on the vegetation and is thus different for each land use type. For example, lignin is decomposed very slowly. This means that litter with high lignin contents is of low quality, resulting in a lower decay constant ky. Table 5.6 summarizes the ky values found in literature. Table 5.6: ky values for the different land use types Land use ky Reference Limitations FallowA 0.724 Bernhard-Reversat (1993) Valid for 1200 mm y-1 Fallow 0.344 CENTURY Model Model simulation, no reference Crop field 0.034 Pieri (1992) Average of different crop fields in West Africa VirginA field 0.724 Bernhard-Reversat (1993) Valid for 1200 mm y-1 Virgin field 0.344 CENTURY Model Model simulation, no reference Bernhard-Reversat (1993) states that the Acacia litter was decomposed very quickly due to its high N content, which led to a high rate of consumption by the soil fauna. This explains the higher ky value for the two land uses with Acacia senegal, although the value might be too high as it was measured in a region where annual rainfall was four times higher than in the study area. Humification coefficient: h The humification coefficient is the fraction of Y that enters O each year. It depends on the litter quality of the vegetation and the clay fraction of the soil (Andrén & Kätterer, 1997). Andren & Kätterer (1997) suggest using a lower h value for sandy soils. For each land use type, h should be adjusted. The h value was based on a universal value of 0.03, suggested by Foley (1995). An h value of 0.02 was used for fields with Acacia senegal and 0.01 for all other fields. The lowered values take into account the sandy soils. External influences: re The estimation of re is based on the differences from the climate in central Sweden (re = 1) with an annual mean temperature of +5.4°C and a precipitation of 520 mm (Andrén & Kätterer, 1997). Andren & Kätterer (1997) state a re of 5.36 for a mean annual temperature of 25°C under non-limiting moisture conditions. This value was used for the wet period (3.5 months). It was assumed that re was 0.5 during the dry season (8.5 months). As an annual average, a value of 1.92 was determined and this value was used for simulation of all land use types.

Jakubaschk, Caren: Acacia senegal, SOC and Nitrogen Content: A Study in North Kordofan, Sudan
25
Measured SOC contents
Table 5.7: Mean values of SOC in % at 0-20 cm depth in g m-2
Depth 0-20cm SOC in % FallowA Fallow Crops VirginA Virgin Mean 383 335 290 416 756 For comparison of the simulated data with my results, the mean values of carbon content in g m-2 at 0-20 cm depth (Table 5.7) were used. This study does not investigate the spatial distribution of the data.
5.3.4 Sensitivity Analysis The values for the parameters are estimations. This is why, a sensitivity analysis for the parameters i, ky, re and Oo was conducted. The parameter values of h, ko and Yo are very low and are therefore expected to exercise comparatively small influence on the model output as a whole. The model output for FallowA for a 25%, 50% and 100% increase and decrease of the four parameters, respectively were compared.
5.3.5 Model Limitations The model simulates in a yearly time step up to 30 years. This means that model estimations will be quite rough, working with mean annual carbon input and mean values of annual temperature and precipitation. When comparing the soil samples with model simulations it has to be taken into account that soil sampling occurred in February although soil samples were used as an estimate of the whole year. This means that monthly data will be compared with annual data. According to Breman & Kessler (1995), researchers are uncertain which influence seasonal rainfall and temperature patterns have on SOC contents. This is why this study relies on simulations with the CENTURY model conducted by Poussart (2002). They are valid for the study area and indicate that SOC content in the topsoil (0-20 cm) varies around 1 g m-2 within a year. There are no parameters for different soil managements such as irrigation or harvest method and no parameter for fire. Everything is included in external factors, which are condensed in re. In none of the articles (Andrén & Kätterer, 2001; Andrén et al, 2001; Andrén & Kätterer, 1997; Kätterer & Andrén, 2000; Kätterer & Andrén, 1998) it is exactly defined which factors have been included in re and it is not well explained how external factors can be condensed in one parameter.

Jakubaschk, Caren: Acacia senegal, SOC and Nitrogen Content: A Study in North Kordofan, Sudan
26
6 RESULTS
6.1 Fieldwork
6.1.1 Biomass Measurements and Soil Texture
Figure 6.1 presents the results of the biomass calculations based on measurements and literature research. Appendix 4 comprises the biomass calculations. The results were used as carbon input in the ICBM. Land use Virgin has the highest amount of biomass per year, followed by FallowA, VirginA, Fallow and Crops. The carbon input i varies between 3 and 283 g m-2 year-1. The soil in the study area consists on average of 93.6% sand and 6.4% silt.
6.2 Normal Distribution of Data Statistics were performed with MINITAB Version 13 and Excel. As the sample sizes of the groups are very low, it was necessary to conduct a normality test. I used the Anderson-Darling test14 and chose a confidence level of 95%.
Within the carbon data, all groups have a normal distribution except Fallow at 20-50 cm depth. For nitrogen, FallowA and Virgin (both at 0-20 cm depth) show a non-normal distribution. In these cases, the data is highly positively skewed which means that mean values are strongly influenced by a low number of high values. The data was transformed by taking the 10th logarithm (Shaw & Wheeler,
1996) but this did not give a satisfying result either. Therefore, the Mann-Whitney test was used if a non-normal distributed data set was involved and the t-test if only normally distributed data was compared. For comparison, both tests for both groups were processed. 14 If the p-value is above 0.05 the sample is normally distributed. If the p-value is below 0.05, the distribution is not normally distributed (see help manual MINITAB).
89114
3
63
283
0
50
100
150
200
250
300
Fallow A Fallow Crops Virgin A Virgin
Figure 6.1: The annual mean carbon input
Table 6.1: Results Anderson-Darling normal distribution test
Groups Sample size P-value, C C P-value, N N Depth 0-20cm FallowA 15 0.440 yes 0.000 no Fallow 8 0.311 yes 0.403 yesCrops 16 0.824 yes 0.472 yesVirginA 6 0.873 yes 0.318 yesVirgin 6 0.165 yes 0.026 no Depth 20-50cm FallowA 9 0.434 yes 0.590 yesFallow 7 0.016 no 0.736 yesCrops 13 0.432 yes 0.699 yesVirginA 5 0.059 yes 0.585 yesVirgin 3 0.588 yes 0.199 yes

Jakubaschk, Caren: Acacia senegal, SOC and Nitrogen Content: A Study in North Kordofan, Sudan
27
The Mann-Whitney test is a non-parametric test. Non-parametric implies that no assumption is made upon the distribution of the population investigated, which is why these kinds of tests can be used for non-normal data (Shaw & Wheeler, 1996). The disadvantage of a non-parametric test is that it is less powerful than a parametric test with equal sample size. Less powerful means that the probability of rejecting the null hypothesis although it is right is higher for a non-parametric test than for a parametric test. The centre value is the mean for parametric tests and the median for non-parametric tests.
6.3 Soil Sample Analyses The results of soil sample analysis are listed in Appendix 3. The first objective of the thesis is to find out if Acacia senegal influences carbon and nitrogen contents. Sections 6.3.1 and 6.3.2, present the results of the laboratory work for SOC and nitrogen content. In addition, the results of t-test and Mann-Whitney test15 were also presented. The data set of FallowA was compared with the data sets of all other land uses. The confidence level is 95%. The sample number for each group varies between 3 and 18. For better understanding, H0 is stated here: H0: There is no significant difference between the SOC (N) contents of FallowA compared with Fallow, Crops, VirginA and Virgin respectively.
6.3.1 Carbon At 0-20 cm depth, Virgin has the highest SOC content, followed by VirginA, FallowA, Fallow and Crops respectively (table 6.2). At depth 20-50 cm, the order is exactly the same. The carbon content of the samples taken in the topsoil is much higher in comparison with the samples of depth 20-50 cm. Sometimes the SOC content is twice as high in the topsoil than beneath it. Only Virgin shows a different pattern: the C content is higher in depth 20-50 cm. The ranges of the samples at 20-50 cm depth are much smaller than those between 0-20 cm depth. Table 6.2: Mean value and standard error for carbon, all groups
Depth 0-20 cm (Topsoil) Depth 20-50 cm FallowA Fallow Crops VirginA Virgin FallowA Fallow Crops VirginA Virgin Carbon in % Mean value 0.112 0.098 0.084 0.122 0.221 0.076 0.066 0.063 0.095 0.500 Standard Error 0.006 0.008 0.005 0.008 0.075 0.005 0.004 0.003 0.007 0.259 Sample size 15 8 18 6 6 10 7 12 5 3 The standard error is low for all land uses except for Virgin. The carbon content ranges between 0.04 to 0.97%, which equals a range between 200 to 5000 g m-2 (figure 6.2).
15 In the case of Mann-Whitney and t-test, MINITAB rejects H0 if the p-value is lower than 0.05 (see help manual MINITAB).

Jakubaschk, Caren: Acacia senegal, SOC and Nitrogen Content: A Study in North Kordofan, Sudan
28
The boxplot in figure 6.3 shows the spread of the data. The line drawn across each box indicates the median of the data. The bottom and top edges of the box mark the first and third quartiles, respectively. The vertical line marks the whole range of data. Extreme values are indicated as a star. Figure 6.3 illustrates that all land uses in both depths have relatively small ranges compared with Virgin. The SOC content of VirginA and Virgin is higher than
for the first three groups. Extreme values are only found within Fallow at both depths.
Figure 6.3: Boxplot of C content in % for each land use group There is a significant difference between FallowA and Crops at 0-20 cm depth while the SOC content of FallowA is higher (Tables 6.2 and 6.3). The difference between FallowA and Fallow at 20-50 cm depth is significant. The SOC content of FallowA is higher. Table 6.3: Results of t-test and Mann-Whitney test for carbon content in %. If H1 is marked, H1 had been accepted
Groups DF P-value H0 H1 Test used Depth 0-20cm FallowA - Fallow 14 0.258 X T-test FallowA - Crops 28 0.004 X T-test FallowA - VirginA 10 0.257 X T-test FallowA - Virgin 5 0.200 X T-test Depth 20-50cm FallowA - Fallow 13 0.0499 X Mann-Whitney FallowA - Crops 13 0.073 X T-test FallowA - VirginA 9 0.052 X T-test FallowA - Virgin 2 0.243 X T-test
0
500
1000
1500
0 0.1 0.2 0.3 0.4 0.5
SOC in %
SOC
in g
m-2
Figure 6.2: SOC in g m-2 as a function of SOC in %, valid the topsoil, 0-20 cm

Jakubaschk, Caren: Acacia senegal, SOC and Nitrogen Content: A Study in North Kordofan, Sudan
29
6.3.2 Nitrogen In the topsoil, the highest mean N content was found for Virgin, followed by FallowA, VirginA, Fallow and Crops, respectively (table 6.4). At depth 20-50 cm, the highest mean N content was found in Virgin, followed by VirginA, Crops, FallowA and Fallow. Table 6.4: Mean value and standard error for nitrogen, all groups
Depth 0-20 cm (Topsoil) Depth 20-50 cm FallowA Fallow Crops VirginA Virgin FallowA Fallow Crops VirginA Virgin Nitrogen in μg/g Mean 132.30 107.966 105.00 127.351 208.094 97.28 94.630 99.153 112.214 272.026Standard Error 15.8 3.618 5.00 9.105 82.066 5.38 2.716 3.217 2.582 136.187Sample size 15 8 18 6 6 10 7 12 5 3 Figure 6.4 shows that the ranges for nitrogen contents of the topsoil for all land uses (except Virgin) are wider than those for SOC contents. Again, Virgin shows the widest ranges. N contents vary between 60 and 570 μg g-1. The extreme N content for FallowA at 0-20 cm depth belongs to field in fallow since 20 years, covered with 2 trees while around 70% is bare land.
Figure 6.4: Boxplot of N content in μg g-1 for all groups Table 6.5: Results of t-test and Mann-Whitney test for nitrogen contents in % Groups
DF P-value Ho H1 Test used
Depth 0-20cm FallowA - Fallow 14 0.1293 X Mann-Whitney FallowA - Crops 28 0.0312 X Mann-Whitney FallowA - VirginA 10 0.5593 X Mann-Whitney FallowA - Virgin 5 0.5081 X Mann-Whitney Depth 20-50cm
FallowA - Fallow 13 0.848 X T-test FallowA - Crops 13 0.326 X T-test FallowA - VirginA 9 0.004 X T-test FallowA - Virgin 2 0.321 X T-test

Jakubaschk, Caren: Acacia senegal, SOC and Nitrogen Content: A Study in North Kordofan, Sudan
30
The nitrogen content of FallowA and Crops differ significantly at 0-20 cm depth (table 6.5). FallowA has a higher mean N content than Crops. At 20-50 cm depth, comparison of FallowA with VirginA shows a significant difference. VirginA has a higher mean N content.
6.3.3 C:N Ratio Overall, the C:N ratio varies between 23 and 180 while mean values are around 100. At 0-20 cm, Virgin has the highest C:N ratio, followed by VirginA, Crops, Fallow and FallowA (table 6.6). At 20-50 cm, the mean C:N ratio of Virgin is highest, followed by VirginA, FallowA, Fallow and Crops. A high C:N ratio implies a high C value and low N value. It implies that the concurrence for nitrogen is very high, limiting plant growth. The extremely low C:N ratio for FallowA at 0-20 cm depth belongs to the sample with very high nitrogen contents (figure 6.5). At the same depth, within Fallow, the sample with the high SOC content has a high C:N ratio. In the same group, the sample with the lowest C:N ratio is a field with three trees and around 50% grass cover. The extremely low C:N ratio in Crops at 0-20 cm depth belongs to a field that has been continuously cultivated since 30 years. It has a very low carbon content while the nitrogen content is comparatively high. Table 6.6: Mean and standard error for C:N ratio, all groups
Depth 0-20 cm Depth 20-50 cm FallowA Fallow Crops VirginA Virgin FallowA Fallow Crops VirginA Virgin C:N ratio Mean 92.53 90.59 81.77 96.42 111.9 78.01 70.14 63.54 84.97 172.0 Standard Error 5.62 6.37 4.36 5.26 13.5 4.12 4.26 2.22 5.49 53.3 Sample size 15 8 18 6 6 10 7 12 5 3
Figure 6.5: Boxplot of C:N ratio

Jakubaschk, Caren: Acacia senegal, SOC and Nitrogen Content: A Study in North Kordofan, Sudan
31
6.3.4 Relationships between Carbon and Nitrogen The second objective of the thesis was to find out if nitrogen content influences the carbon content in the soil beneath a special land use. I used a regression analysis and compared the carbon and nitrogen content within each land use class. Nitrogen was assumed to be the controlling variable and carbon to be the dependant variable. The resulting regression plots are listed in Appendix 5. For better understanding, the hypothesis is as follows: H0: There is no significant correlation between carbon and nitrogen contents within one land use class.
The coefficient of determination (r2) defines the proportion of the variance of one variable “explained” by variation of the other (Shaw & Wheeler, 1996). For FallowA two different r2 values were calculated because the low correlation between C and N values was due to one extreme
soil sample. A regression analysis without this sample results in a significant positive correlation (r = 0.92). In the case of FallowA, r2 equals 84.5, which means that 84.5% of the variance of C is accounted for the variance of N. Fallow and Crops show a low correlation while VirginA and Virgin indicate quite high correlations. For VirginA there is a trend towards a positive correlation and for Virgin the correlation is significant.
6.4 Simulations with the ICBM
6.4.1 Fallow Fields with Acacia senegal (FallowA)
The model was run from 1972 to 2002 in order to see if the modelled values in 2002 were com-
parable with the measurements taken for this study in 2002. Figure 6.6 shows a continuous decrease of total SOC contents from 1972 until today. The modelled SOC content is around one third higher than the measured SOC. The SOC content of the old carbon pool follows the dynamic of modelled total SOC while the young carbon pool contents remain at an equal low level during the 30-year period.
16 The Pearson’s correlation coefficient r is a measure to determine the strength of a relationship between two variables; r varies between –1 and +1 indicating negative or positive correlations (Shaw & Wheeler, 1996).
Table 6.7: Relationships between C and N, the shaded values are significant
Land use No. of samples r 16 r2 (in %) FallowA 15 or 14 -0.24 or 0.92 5.7 or 84.5Fallow 8 0.444 19.7 Crops 16 0.425 18.1 VirginA 6 0.786 61.8 Virgin 6 0.962 92.6
Table 6.8: The input data, the modelled SOC content (SOCM), the measured mean SOC content in 2002 (SOCME) and the difference between SOCM and SOCME
i ky ko h re Y0 O0 SOCM SOCME Difference89 0.724 0.006 0.02 1.920 35 665 557 384 196

Jakubaschk, Caren: Acacia senegal, SOC and Nitrogen Content: A Study in North Kordofan, Sudan
32
0
100
200
300
400
500
600
700
800
1970 1975 1980 1985 1990 1995 2000 2005
Total SOCOld Carbon PoolYoung Carbon Pool
Figure 6.6: The model output for land use FallowA, the triangle indicates SOCME
6.4.2 Fallow Fields without Acacia senegal (Fallow)
SOCM is twice as high as SOCME. The curves representing total carbon and young
carbon pool increase during the 70s. Later, total carbon and the old carbon pool decrease while the young carbon pool continues at a low level.
0
100
200
300
400
500
600
700
800
900
1970 1975 1980 1985 1990 1995 2000 2005
Total SOCOld Carbon PoolYoung Carbon Pool
Figure 6.7: The model output for land use Fallow, the triangle indicates SOCME
Table 6.9: The input data, the modelled SOC content (SOCM), the measured mean SOC content in 2002 (SOCME) and the difference between SOCM and SOCME
i ky ko h re Y0 O0 SOCM SOCME Difference114 0.344 0.006 0.010 1.920 35 665 670 335 335

Jakubaschk, Caren: Acacia senegal, SOC and Nitrogen Content: A Study in North Kordofan, Sudan
33
6.4.3 Crop Fields (Crops)
The measured SOC content is only 60% of the modelled SOC content. The curve of total carbon falls a bit sharper compared
with the other land use types. The young carbon pool stays at a very low level while the old carbon pool follows total carbon contents.
0
100
200
300
400
500
600
700
800
1970 1975 1980 1985 1990 1995 2000 2005
Total SOCOld Carbon PoolYoung Carbon Pool
Figure 6.8: The model output for land use Crops, and the triangle indicates SOCME
6.4.4 Undisturbed Sites with Acacia senegal (VirginA)
The measured SOC content is around 75% as high as the model output. Again, the young pool is
low during the whole time period and total and old carbon contents are decreasing slowly.
Table 6.10: The input data, the modelled SOC content (SOCM), the measured mean SOC content in 2002 (SOCME) and the difference between SOCM and SOCME
i ky ko h re Y0 O0 SOCM SOCME Difference3 0.034 0.006 0.030 1.920 35 665 517 290 230
Table 6.11: The input data, the modelled SOC content (SOCM), the measured mean SOC content in 2002 (SOCME) and the difference between SOCM and SOCME
i ky ko h re Y0 O0 SOCM SOCME Difference63 0.724 0.006 0.010 1.920 35 665 532 416 134

Jakubaschk, Caren: Acacia senegal, SOC and Nitrogen Content: A Study in North Kordofan, Sudan
34
0
100
200
300
400
500
600
700
800
1970 1975 1980 1985 1990 1995 2000 2005
Total SOCOld Carbon PoolYoung Carbon Pool
Figure 6.9: The model output for land use VirginA, the triangle indicates SOCME
6.4.5 Undisturbed Sites without Acacia senegal (Virgin)
SOCME is 20% lower than the modelled SOC content. Total carbon and the
young carbon pool increase strongly in the beginning of the reference period, levelling out during time. In this case, the old carbon pool remains on a medium level of around 600 g C m-2.
0
200
400
600
800
1000
1200
1970 1975 1980 1985 1990 1995 2000 2005
Total SOCOld Carbon PoolYoung Carbon Pool
Figure 6.10: The model output for land use Virgin, the triangle indicates SOCME
Table 6.12: The input data, the modelled SOC content (SOCM), the measured mean SOC content in 2002 (SOCME) and the difference between SOCM and SOCME
i ky ko h re Y0 O0 SOCM SOCME Difference283 0.344 0.006 0.010 1.920 35 665 968 756 214

Jakubaschk, Caren: Acacia senegal, SOC and Nitrogen Content: A Study in North Kordofan, Sudan
35
6.4.6 Results of Sensitivity Analysis The sensitivity of the ICBM was evaluated for the parameters i, ky, re and Oo. The results of changes in different carbon inputs were then compared with the measured SOC content of FallowA in 2002 (383 g m-2). The changes in modelled SOC content for a variable carbon input i are within a range of 200 g m-2 (figure 6.11). Even a carbon input of 0 does not decrease the modelled SOC content to the point that it reaches the measured SOC content.
350
450
550
650
750
1970 1980 1990 2000
C in
g m
-2
i = 0.089
i + 50%
i - 50%
i + 100%
i = 0
measured value in 2002
Figure 6.11: Results of sensitivity analysis for parameter i A ± 100% change of the decay constant ky shows a range of 100 g m-2 of modelled SOC contents in 2002 (figure 6.12). Thus, the range is much smaller than for parameter i. The model equation cannot be solved if ky equals 0. The modelled SOC content in 2002 for a twice as high value of ky is still 150 g m-2 higher than the measured SOC content. A decrease of ky leads to a much stronger change in model output than an equal increase of ky.
350
450
550
650
750
1970 1980 1990 2000
C in
g m
-2
ky = 0.724
ky - 25%
ky - 50%
ky + 50%
ky + 100%
measured value in 2002
Figure 6.12: Results of sensitivity analysis for parameter ky Changes in re result in a wide range of model outputs (Figure 6.13). If the parameter is set to 0, the model equation cannot be solved. The modelled SOC content for re + 100% is similar to the measured SOC content in 2002.

Jakubaschk, Caren: Acacia senegal, SOC and Nitrogen Content: A Study in North Kordofan, Sudan
36
300
400
500
600
700
800
1970 1980 1990 2000
C in
g m
-2 re = 1.92
re - 25%
re - 50%
re + 25%
re + 50%
re + 100%
measured value in 2002
Figure 6.13: Results of sensitivity analysis for parameter re The model output for a ± 50% change of the initial value of the old carbon pool Oo ranges from 260 g m-2 to 820 g m-2 (Figure 6.14). It shows the biggest changes in modelled SOC contents. The measured SOC content in 2002 could be reached with a decrease of Oo between 25 and 50%.
200
400
600
800
1000
1200
1970 1980 1990 2000
C in
g m
-2
Oo = 665
Oo + 25%
Oo + 50%
Oo - 25%
Oo - 50%
measured value in 2002
Figure 6.14: Results of sensitivity analysis for parameter Oo

Jakubaschk, Caren: Acacia senegal, SOC and Nitrogen Content: A Study in North Kordofan, Sudan
37
7 DISCUSSION
7.1 Fieldwork One might object that the sites of the soil samples were chosen subjectively as the study did not actually sample four symmetrically scattered samples in each plot (see figure 5.2). Former studies (Deans et al, 1999; Kessler & Breman, 1991, Scholes & Archer, 1997) state that the organic matter content beneath and near by trees is higher than in the surrounding area. According to Buresh & Tian (1998) the lateral roots of woody plants lead to a nutrient uptake within the root zone and thus to a redistribution of nutrients within the soil. Breman & Kessler (1995) states that on fallow fields soil fertility under woody plants improves, but if woody plants occur isolated on a large area, soil fertility on the area as a whole does not regenerate during the fallow period. Assuming the latter and being aware of the small area of my plot, samples were taken as far away from tree crowns as possible. If stands were dense, a soil sample was taken halfway between two trees. If the plot was covered with scattered trees, the sample was taken around 2 m from the tree crown. In this way, the study avoided the possibility of measuring high SOC values although the average SOC content for the plot might be much lower. One can say, that the researcher chose the worst scenario in order to avoid any misjudgment. A further source of error is the number of soil samples taken. Conducting tests – both parametric and non-parametric tests - with an amount of 3 to 18 soil samples per group involves highly uncertain results. During interviewing farmers, it became apparent that it was extremely difficult to make farmers understand the importance of providing an accurate land use history. This resulted in difficulty distinguishing between fallow fields and undisturbed sites. As a result, the study may have included fallow fields instead of undisturbed sites and vice versa. It was difficult to find appropriate plots for VirginA and Virgin. In the case of Virgin, two of the five samples were taken from a 50-year-old plantation of Azadirachta indica trees. Both, carbon and nitrogen contents are extremely high, obviously because the trees were around twice as high and wide as all other trees I measured. Additionally, the stands were so dense that tree crowns almost reached each other. This meant that samples had to be taken near tree stems. The standard error of Virgin is very high and the ranges very wide. The mean carbon content of Virgin at 20-50 cm depth was higher than for the topsoil. This is explained by the fact that only three samples were taken within this group at this depth of which two were on the plots with Azadirachta indica trees. The equation to calculate the biomass of Acacia senegal proposed by Deans et al (1999) poses some limitations. They state themselves that natural stands, which are browsed and tapped, might not grow as fast as trees in plantations. This implies that the equations might not be a useful estimate for this study. Second, the root:shoot ratio proposed by Deans et al (1999) is not generally acknowledged. For example, Breman & Kessler (1995) state that the root:shoot ratio for Acacia trees is usually closer to 0.4 than to 0.2. Only one tree of each species was measured and scaled up to the total amount of trees. This might be a coarse estimate but often the number of trees was too high to measure all of them. In order to treat all plots in the same way, only one tree per species was measured.
Jakubaschk, Caren: Acacia senegal, SOC and Nitrogen Content: A Study in North Kordofan, Sudan
38
There are great differences in land use history within land use groups. The crop fields on which samples were taken have been cultivated for between 5 to 30 years, the fallow fields between 9 and 25 years and the undisturbed sites between 23 and 50 years (Appendix 4). This large variability of land use "ages" makes the measurement results less comparable. The calculation of biomass and carbon input gave very different results for the different land uses. In all cases, the tree biomass was negligible compared to grass biomass. As the global value suggested by Jackson et al (1996) was too high for grass vegetation in a semi-arid region, it was divided by three to take into account the growing season. The annual grass vegetation – if not eaten by animals – is transformed to litter and decomposed during one year, but only a small percentage of the tree biomass becomes litter per year. This is why the biomass of the different land uses varies strongly, dependant on the percentage of grass cover.
7.2 Soil Sample Analysis On average, 450 g C m-2 was recovered in the topsoil, which equals a quantity of around 1.3 g C kg-1. Lal (2001b) discusses a study made in Nigeria in the middle nineties with similar soil conditions where 1–2 g kg-1 had been found. This shows that this study’s results are similar to other research results. The significant difference between mean carbon content in the topsoil of FallowA and Crops is in line with former studies (Breman & Kessler, 1995; Ardö & Olsson, 2002b). In this study there is a significant difference between carbon and nitrogen contents of soils beneath Acacia senegal and other land uses. Although this might indicate that Acacia senegal is a preferable tree species in the case of carbon sequestration, one might take into account studies on other indigenous tree species. El Tahir et al (2002) studied chemical soil properties under Acacia seyal, Acacia tortillis and Acacia senegal. The results revealed higher nitrogen contents but lower carbon contents under Acacia senegal compared to the two other tree species. This means that other tree species might be more valuable for carbon sequestration. The sites of Virgin have highest SOC contents. As mentioned above, soil samples were mainly taken within a 50-year-old Azadirachta indica tree plantation. Breman & Kessler (1995) refer to a study, which states that the highest SOC contents occurred under this tree species. They state that this is due to high C:N and C:P ratios of plant litter, which induces a low decomposition rate. This might be an additional reason for the large difference between Virgin and all other land uses. The C:N ratio differs strongly among the different land uses. One might suppose that the C:N ratio for FallowA is lower than e.g. for Crops as Acacia senegal is expected to fix additional nitrogen, which would lead to higher nitrogen content and thus to a lower C:N ratio. Although Crops overall has lower nitrogen and SOC contents, it has the lowest C:N ratio. Undisturbed sites have the highest C:N ratio, which implies that nitrogen is much more limiting in those areas than on cultivated fields. Nevertheless, it has to be taken into account, that the C:N ratios overall are very high. There is a significant correlation between carbon and nitrogen contents within FallowA and Virgin. Although, a regression analyses requires normally distributed data, which is not the case when comparing C and N contents within FallowA, Fallow and Virgin.

Jakubaschk, Caren: Acacia senegal, SOC and Nitrogen Content: A Study in North Kordofan, Sudan
39
The regression analyses cannot elucidate the interweaved processes that steer C and N contents. Summarizing the information given in the former chapters, the assumption that Acacia senegal stands increase the soil N content (either through plant and root litter or through litter and nitrogen fixation) might result in two possible processes (figure 7.1). On the one hand, this could lead to more overall litter as additional nitrogen leads to better vegetation growth in the long run. The measured average C:N ratio of 90 indicates a low decomposition rate, which is
typical for semi-arid regions. Overall, a low decomposition rate results in an increasing SOC content. On the other hand, the high nitrogen content of Acacia senegal litter might lead to a fast decomposition of the Acacia litter which would result in a decrease of SOC. Further explanation of these issues is far beyond the scope of this study. Researchers agree that SOC is mainly concentrated in the upper 20 cm of the soil (Bernhard-Reversat, 1982). Disturbances (such as fire, animals, tillage etc) mainly influence SOC contents in the topsoil. This implies that there is great variance in SOC content of the topsoil. For example, in this study, the ranges for mean nitrogen and carbon values at 20-50 cm depth are much smaller than those between 0-20 cm depth. It is recognized that the variability of soil carbon content in the topsoil within a distance of a few meters poses a big problem for assessing mean soil carbon values (Lal, 2001a). These facts make it very difficult to estimate a mean amount of carbon in the topsoil. In a further study, it would be interesting to investigate the spatial distribution of SOC content in North Kordofan, in respect to vegetation types, land use patterns and geographical location.
7.3 Simulations with the ICBM The ranking of highest to lowest mean carbon content is different for modelled and measured data (figure 7.2). For measured data, the undisturbed sites have stored more carbon than the fallow sites and the crop fields range last. For modelled data, Fallow and VirginA are swapped. This fact can be explained by higher model input rates (i) for Fallow, which depend on the biomass estimations. Thus, the grass fraction was much higher for Fallow than for VirginA. SOCME: Virgin > VirginA > FallowA > Fallow > Crop fields SOCM: Virgin > Fallow > FallowA > VirginA > Crop fields Figure 7.2: Measured (SOCME) and modelled (SOCM) SOC contents, the order of the different land uses The measured data shows that the grassland plots of Virgin have lower SOC content than the plots with Azadirachta indica trees. Thus, this study’s biomass calculations – due to unreliable grass biomass data – resulted in much higher biomass inputs for grasslands, which imply higher SOC contents when modelling. This skews the model result, although the fit between modelled and measured SOC for Virgin is better than for the other land uses.
Acacia senegal Litter
Fast decompositionof A.s. litter
SOC
Plant growth
Litter
Low decomposition
SOC
?
Figure 7.1: Decomposition processes

Jakubaschk, Caren: Acacia senegal, SOC and Nitrogen Content: A Study in North Kordofan, Sudan
40
The modelled SOC contents are much higher than the measured SOC contents. There are several possible reasons for this fact. First, the decay constants may have been underestimated. Second, the external influences may have been underestimated. Third, the initial values for Y and O might be too high. The strong increase in modelled SOC contents in the beginning of the 70s of Fallow and Virgin (figure 6.7 and 6.10) is due to the comparatively high carbon input i and a low value for ky. The high carbon input is due to the large grass fraction of these two land use types. Even if the grass biomass is a coarse estimate, there is evidence that grasslands have high SOM contents. For example, Breman & Kessler (1995) refer to studies made on grasslands in temperate climates, suggesting that grasslands have a comparatively higher SOM content than woodlands. They state that this might be due to a higher turnover of soil nutrients in grasslands, which leads to a higher annual litter fall, in spite of a lower standing biomass. The calculated model parameters do not mirror reality, as they should be more appropriate to the different land uses. The initial values for Y and O are estimated using data from 1963 and 2000 (Ardö & Olsson, 2002a). In 1963, a different method for SOC analysis had been used, which means that the value is more imprecise than the one from 2000 and consequently, the difference between the two values might be skewed. It would be more appropriate to use different values for the different land uses and the different land use histories. For example, in the case of a crop field that had been cultivated for 30 years the initial values should be lower as for a crop field cultivated for 5 years after a 25 year long fallow period. For the ICBM to be used as a reliable tool for carbon assessments, one would have to develop a way to easily calculate a value that comprises land use “age” and land use history with which the parameters could be multiplied. The parameter re should be adjusted to the different land management practices not only to climate data. For example, tillage influences soil properties. In the case of conservation tillage more soil carbon is kept in the soil, which is equivalent to a decrease of re. The soil type could be excluded in this study, as it was the same for each land use. Also, in this case it would be suitable to have a parameter for different land management practices with which re could be multiplied. An improvement of the model would imply a larger set of parameters. This would make the model more difficult to understand and to run. Therefore, the model should be understood as a basic tool to assess the state of SOC and to further understanding. The sensitivity analysis revealed that changes of parameter Oo influence model output more than parameter re, followed by parameters i and ky. As the model equations are simple multiplications it is obvious that a change of the highest numbers equal the biggest change in model output. As the initial value for Oo strongly influences model outputs, it is very important to find realistic initial values. The degree by which SOC contents decrease is different depending on initial Oo values. Low initial values lead to a smaller decrease of SOC contents than high values. The model equations reveal that an increase of the initial value Oo is directly related to a higher soil respiration, which reduces SOC contents. Breymeyer et al (1996) suggest that SOC is controlled more by decomposition than by primary production and they state that rainfall is the main environmental factor affecting

Jakubaschk, Caren: Acacia senegal, SOC and Nitrogen Content: A Study in North Kordofan, Sudan
41
decomposition. Parameter re influences directly the decay rates ky and ko and includes all external influences. It is realistic that a strong change of re strongly influences SOC outputs. One has to be aware that a decrease of re affects SOC content more than an increase of re. This might lead to the choice of a lower re value as a model input as the model output is less influenced by a higher re value than a lower re value. A decrease of parameter ky affects model outputs much more than an increase of ky. This is explained by the exponential decay curve. As the differences in output for de- and increased ky values is high, it is essential to find realistic ky values. However, an underestimation of ky would have stronger effects on model outputs than an overestimation.

Jakubaschk, Caren: Acacia senegal, SOC and Nitrogen Content: A Study in North Kordofan, Sudan
42
8 SUMMARY OF RESULTS AND CONCLUSIONS
8.1 Summary of Results The most important results of this study can be summarized as follows:
• There is a significant difference between the carbon and nitrogen content of fallow fields with Acacia senegal (FallowA) and that of crop fields (Crops) at 0-20 cm depth. The difference between FallowA and the three other land uses is insignificant.
• There is a significant correlation between carbon and nitrogen content under both land use FallowA and land use Virgin.
• The SOC contents simulated with the ICBM do not coincide with the SOC content measured in 2002.
• On average, the SOC content under the different land use types accounts for 450 g m-2 or 1.3 g kg-1 in the topsoil.
• The average C:N ratio of all land use types is around 90.
8.2 Conclusions The study shows that there is slight evidence that Acacia senegal stands have a potential to sequester carbon when compared to cultivated fields. Olsson & Ardö (2001) acknowledge these findings. According to this study, there is no evidence that Acacia senegal stands have a larger potential of sequestering carbon in the soil when compared to the other land use types included in the study (fallow fields without Acacia senegal, undisturbed sites with and without Acacia senegal). More research has to be done in order to assure the results of this study as the amount of samples used was small. It was not possible to demonstrate a clear relationship between soil carbon and nitrogen contents. The processes that control C and N are too complex to be elucidated with a simple regression analysis. As both elements affect each other in both the plant and soil environment, it is much beyond the scope of this study to deal with these issues. The ICBM did not show satisfactory results when simulating SOC in the study area. The model does not include parameters simulating land use history, grazing, erosion and occasional impacts such as droughts and fire. The authors used data series over long time periods to calibrate the ICBM to conditions in Northern Europe. In the case of Sudan, time series are not available. In this study, adjustment of parameters to the specific environmental conditions included many assumptions and estimations. If the ICBM is used in the future to assess soil carbon fluxes and pools in semi-arid areas, it should first be calibrated to these conditions using data series of a well-investigated area.

Jakubaschk, Caren: Acacia senegal, SOC and Nitrogen Content: A Study in North Kordofan, Sudan
43
9 REFERENCES Ågren, G. I.; Bosatta, E. (1996), Theoretical Ecosystem Ecology, Understanding Element Cycles, Cambridge University Press, Cambridge. Andrén, O.; Kätterer, T. (1997), ICBM - the Introductory Carbon Balance Model for exploration of soil carbon balances, Ecological Applications 7(4), p. 1226-1236. Andrén, O.; Kätterer, T. (2001), Basic Principles for Soil Carbon Sequestration and Calculating Dynamic Country-level Balances Including Future Scenarios, In: Lal et al, Assessment Methods for Soil Carbon, Lewis Publishers, p. 495-511. Andrén, O.; Kätterer, T.; Hyvönen, R. (2001), Projecting soil fauna influence on long-term soil carbon balances from faunal exclusion experiments, Applied Soil Ecology 18, p.177-186. Ardö, J.; Olsson, L. (2002a), working title: Do fallow periods sequester soil C?, in preparation Ardö, J.; Olsson, L. (2002b), Assessment of soil organic carbon in semi-arid Sudan using GIS and the CENTURY model, Journal of Arid Environments, in press. Ayoub, A. T. (1999), Extent, Severity and Causative Factors of Land Degradation in the Sudan, Desertification Control Bulletin 34, p. 52-60. Batjes, N. H. (2001), Options for increasing carbon sequestration in West African soils: An exploratory study with special focus on Senegal, Land Degradation & Development 12 (2), p. 131–142. Bernhard-Reversat, F.; Poupon, H. (1980), Nitrogen Cycling in a Soil-Tree System in a Sahelian Savanna. Example of Acacia senegal, In: Rosswall, T. (Ed.), Nitrogen Cycling in West African Ecosystems, Proceedings of a workshop arranged by the SCOPE/UNEP International Nitrogen Unit in collaboration with MAB (Unesco) and IITA in Ibadan, Nigeria, 11-15 December, 1978. Bernhard-Reversat, F. (1982), Biogeochemical cycle of nitrogen in a semi-arid savanna, Oikos 38, p. 321-32. Bernhard-Reversat, F. (1993), Dynamics of litter and organic matter at the soil-litter interface in fast-growing tree plantations on sandy ferrallitic soils (Congo), Acta Oecologica 14 (2), p. 179-195. Bosch, C. (1991), Aufforstung und Agroforstwirtschaft mit Acacia senegal: Auswirkungen auf den Humushaushalt von Arenosols in Nordsenegal, Bosch Beratungsgesellschaft fuer Boden und Pflanze, Königsdorf? Brady, N. C. (1990), The Nature and Properties of Soils, Macmillan Publishing Company, New York. Breman, H.; Kessler, J.-J. (1995), Woody Plants in Agro-Ecosystems of Semi-Arid Regions with an Emphasis on the Sahelian Countries, Advanced Series in Agricultural Sciences 23, Springer-Verlag, Berlin. Breymeyer, A. I.; Hall, D. O.; Melillo, J. M.; Ågren, G. I. (Eds.), Global Change: Effects on Coniferous Forests and Grasslands, SCOPE 56, Wiley, 1996. Brooke, C; Turkson, J. (Eds.) [online], African Perspectives on the Clean Development Mechanism, papers presented at the Regional Workshop New Partnerships for Sustainable Development: The CDM under the Kyoto Protocol, Accra, Ghana, 21-24 September 1998, UNEP Collaborating Centre on Energy and Environment, Roskilde, 1999, available at http://www.uccee.org/CDM/Accra/AccraPapers.pdf [cited June 2002]. Buresh, R. J.; Tian, G. (1998), Soil improvement by trees in sub-Saharan Africa, Agroforestry Systems 38, p 51-76. Cheng, H. H.; Kimble, J. M. (2001), Characterization of Soil Organic Carbon Pools, In: Lal, R.; Kimble, J.M.; Follett, R.F.; B.A. Stewart (Eds.), Assessment Methods for Soil Carbon, Boca Raton.

Jakubaschk, Caren: Acacia senegal, SOC and Nitrogen Content: A Study in North Kordofan, Sudan
44
CIA (2001) [online], The World Factbook 2001, available at http://www.cia.gov/cia/publications/factbook [cited June 2002]. Deans, J. D., Diagne, O., Lindley, D. K., Dione, M., Parkinson, J.A., (1999), Nutrient and organic-matter accumulation in Acacia senegal fallows over 18 years, Forestry and Management 124, p 153-167. Ekologisk Metodik (1981), Enkla metoder för ekologisk beskrivning insamling och analys, a cooperation between Department of Ecological Botany, Department of Ecological Zoology, Institution of Limnology, Lund University, Lund. Elhag, F.M.A. (1992), Potential of crop residues as animal feed resources in North Kordofan, Annual Research Report 1991/92. Elmekki, A.; Barker, J. (1993), Marketing, Politics and Agrarian Crisis in Sudan, IDS Bulletin 24 (3), p. 68-74. El Tahir, B. A.; Madibo, G. M.; El Wakeel, A. S. (2002), Potential of indigenous tree species in improving properties of sandy soils in North Kordofan, Sudan, Working Paper, Agricultural Research Station, El Obeid. Fitzpatrick, E. A. (1991), An Introduction to Soil Science, Longman Scientific & Technical, New York. Gerakis, P. A.; Tsangarakis, C. Z. (1970), The influence of Acacia senegal on the fertility of a sand sheet ("goz") soil in the central Sudan, Plant and Soil 33, p. 81-86. Harvey, L. D. D. (2000), Climate and Global Environmental Change, Series: Understanding Global Climate Change, Pearson Education Ltd, Harlow. Holtsmark, B. J.; Alfsen, K. H. (1998), Coordination of flexible instruments in climate policy, CICERO Report 1998:4, Oslo. IPCC (2001) [online], Third Assessment Report - Climate Change 2001 - The Scientific Base, Summary for Policymakers, IPCC, Geneva, available at http://www.ipcc.ch/pub/reports.htm [cited June 2002]. Jackson, R. B.; Canadell, J.; Ehleringer, J. R.; Mooney, H. A.; Sala, O. E.; Schulze, E. D. (1996), A global analysis of root distributions for terrestrial biomes, Oecologia 108, p. 389–411. Kätterer, T.; Andrén, O. (1999), Long-term agricultural field experiments in Northern Europe: Analysis of the influence of management on soil carbon stocks using the ICBM model, Agriculture, Ecosystems and Environment 72, p. 165-179. Kätterer, T.; Andrén, O. (2001), The ICBM family of analytically solved models of soil carbon, nitrogen and microbial biomass dynamics - descriptions and application examples, Ecological Modelling 136, p. 191-207. Kessler, J. J; Breman, H. (1991), The potential of Agroforestry to increase primary production in the Sahelian and Sudanian zones of West Africa, Agroforestry Systems 13, p. 41-62. Keddeman, W. (1994), UNSO/SUD/89/X05, Restocking of the Gumbelt for Desertification Control Northern Kordofan, Phase III, Report of the evaluation mission, Netherlands Economic Institute, Agriculture and Rural Development Department, Rotterdam. Khogali, M. M. (1991), Famine, Desertification and Vulnerable Populations: the Case of Umm Ruwaba District, Kordofan Region, Sudan, Ambio 20 (5), p. 204-206. Kimble, J. M.; Grossman, R. B.; Samson-Liebig, S. E. (2001), Methodology for Sampling and Preparation for Soil Carbon Determination, In: Lal, R.; Kimble, J.M.; Follett, R.F.; B.A. Stewart (Eds.), Assessment Methods for Soil Carbon, Boca Raton. Lal, R. (Ed.) (2001a), Assessment methods for soil carbon, Series: Advances in Soil Sciences, CRC, Lewis Publishers, Boca Raton.

Jakubaschk, Caren: Acacia senegal, SOC and Nitrogen Content: A Study in North Kordofan, Sudan
45
Lal, R. (2001b), Potential of Desertification Control to Sequester Carbon and mitigate the Greenhouse Effect, Climatic Change 51, p. 35-72. Larson, B. A.; Bromley, D. W. (1991), Natural Resource Prices, Export Policies and Deforestation: The case of Sudan, World Development 19 (10), p. 1289-1297. Le Houérou, H. N. (1989): The Grazing Land Ecosystems of the African Sahel, Ecological Studies 75, Berlin. Marschner, H. (1995), Mineral Nutrition of Higher Plants, Academic Press, London. Miller, G. T., Jr. (2000), Living in the environment: principles, connections, and solutions, Brooks/ Cole, Pacific Grove. Olsson, K. (1985), Remote Sensing for Fuelwood Resources and Land Degradation Studies in Kordofan, the Sudan, Meddelanden från Lunds Universitets Geografiska Institution, Avhandlingar C. Olsson K., Rapp A., (1991), Dryland degradation in central Sudan and conservation for survival. Ambio 20 (5), p 192-195. Olsson, L. (1993), On the Causes of Famine – Drought, Desertification and Market Failure in the Sudan, Ambio 22 (6), p. 395-403. Olsson, L.; Warren, A. and Ardö, J. (2001) [online], The potential benefit of carbon sinks in dryland agricultural soils. Arid Lands Newsletter 49, available at http://ag.arizona.edu/OALS/ALN/aln49/olsson.html [cited June 2002]. Olsson, L.; Ardö, J. (2002), Soil carbon sequestration in degraded semiarid agro-ecosystems – perils and potentials, Ambio, in press. Osman, A. K. (2001), The role of agricultural research in improving food security in the traditional rainfed sector, WFP review workshop, 28-29 November 2001. Pieri, C. J. M. G. (1992), Fertility of Soils, A Future for Farming in the West African Savannah, Springer, Heidelberg. Post, W. M.; Izaurralde, R. C.; Mann, L. K.; Bliss, N. (1999), Monitoring and Verifying Soil Organic Carbon Sequestration, In: Rosenberg, N. J.; Izaurralde, R. C.; Malone, E. L. (Eds.), Carbon Sequestration in Soils: Science, Monitoring, and Beyond, Proceedings of the St. Michaels Workshop, December 1998, Batelle Press, Columbus. Poussart, J.-N. (2002), Verification of Soil Carbon Sequestration - Uncertainties of Assessment Methods, Seminarieuppsats Nr. 90, Department of Physical Geography and Ecosystems Analysis, Lund University. Ringius, L. (1999), Soil Carbon Sequestration and the CDM, Opportunities and Challenges for Africa, CICERO Report 1999:7, Oslo. Rosenschein, A.; Tietema, T.; Hall, D. O. (1999), Biomass measurement and monitoring of trees and shrubs in a semi-arid region of central Kenya, Journal of Arid Environments 42, p. 97-116. Sanchez, P. A. (2002), Soil Fertility and Hunger in Africa, Science 295, p. 2019-2020. Save the Children Federation U.S. (1988), Baseline Report, Um Ruwaba District, North Kordofan Province, Sudan Field Office. Schlesinger, W. H. (1997), Biogeochemistry – An Analysis of Global Change, Academic Press, San Diego. Schlesinger, W. H. (1999), Carbon Sequestration in Soils, Science 284, p. 2095. Schlesinger, W. H. (2000), Carbon Sequestration in Soils: Some Cautions Amidst Optimism, Agriculture, Ecosystems and Environment 82, p. 121-127.

Jakubaschk, Caren: Acacia senegal, SOC and Nitrogen Content: A Study in North Kordofan, Sudan
46
Scholes, R. J.; Archer, S. R. (1997), Tree-Grass Interactions in Savannahs, Annual Reviews Ecology and Systematics 28, p. 517-44. Seif el Din, A. G.; Zarrong, M. (1996), Production and Commercialisation of gum arabic in Sudan, In: Leakey, R. R. B.; Temu, A. b.; Melnyk, M.; Vantomme, P. (Eds.), Non-Wood Forest Products 9, FAO Forestry Department, 1996, p. 176-182. Shaw, G.; Wheeler, D. (1996), Statistical Techniques in Geographical Analysis, David Fulton Publishers, London. Sitte, P.; Ziegler, H.; Ehrendorfer, F.; Bresinsky, A. (1998), Strasburger Lehrbuch der Botanik fuer Hochschulen, Stuttgart, Gustav Fischer Verlag. Smith, R. L.; Smith, T. M. (1998), Elements of Ecology, Benjamin Cummings Science Publishing, San Francisco. Swift, M. J.; Heal, O. W.; Anderson, J. M. (1979), Decomposition in Terrestrial Ecosystems, Studies in Ecology Vol. 5, Blackwell Scientific Publications, Oxford. Tiessen, H.; Feller, C.; Sampaio, E. V. S. B.; Garin, P. (1998), Carbon Sequestration and Turnover in Semiarid Savannahs and Dry Forest, Climatic Change 40, p. 105-117. Tschakert, P. (2001) [online], Human dimensions of carbon sequestration: A political ecology approach to soil fertility management and desertification control in the Old Peanut Basin of Senegal, Arid Lands Newsletter 49, available at http://ag.arizona.edu/OALS/ALN/aln49/tschakert.html [cited June 2002]. Van Wesemael, B.; Lambin, E. F. (2001), Carbon Sinks and Conserving Biodiversity, Science 294, p. 2094-2095. Warren, A. (1970), Dune trends and their implications in the central Sudan. Zeitschrift fuer Geomorphologie, Supplement band No.10, p. 154-180. Young, A. (1976), Tropical soil and soil survey, Cambridge University Press, Cambridge. CD-Rom FAO, The Digital Soil Map of the World and Derived Soil Properties, Version 3.5, November 1995, scale 1: 5 000 000, CD-Rom. FAO, The Soil and Terrain Database for Northeastern Africa, Crop Production System Zones of the IGAD subregion, Land and Water Digital Media Series 2, 1998, CD-Rom. Internet (cited June 2002) [1] http://www.grida.no/climate/ipcc, Kyoto Protocol: http://www.unfccc.de/resource/docs/convkp/kpeng.html [2] http://www-markinfo.slu.se/sve/kem/markkem.html [3] http://unfccc.int/resource/beginner.pdf [4] http://www.gtz.de/climate/english [5] For explanation of legal terms see http://untreaty.un.org/English/guide.asp#glossary [6] http://unfccc.int/resource [7] http://www.gtz.de/climate/english/ph2_cop234.htm#kyoto [8] http://www.mv.slu.se/vaxtnaring/olle/ICBM.html Photographs by Caren Jakubaschk

Jakubaschk, Caren: Acacia senegal, SOC and Nitrogen Content: A Study in North Kordofan, Sudan
47
APPENDIX 1: ARABIC GLOSSARY AND SCIENTIFIC NOTATION Arabic English/ Latin bittikh Watermelon dukm millet dura Sorghum vulgare ful masri Beans ful sudani Groundnuts gardud Various types of clay soil gobbesh Guiera senegalensis goz Sandy soil habil Combretum hartmannianum hashab Acacia senegal haskanit Cenchrus biflorus hejlij Balanites aegyptiaca karkade Hibiscus kitir Acacia mellifera merrikh Leptadenia pyrotechnica nabag Ziziphus mauritiana nim Azadirachta indica samugh Gum arabic sayal Acacia tortillis sereh Maerua crassifolia sidir Ziziphus spina Christi simsim Sesame sunud Acacia nilotica talih Acacia seyal tebeldi Adansonia digitata usher Calotropis procera Units of weight and area 1 feddan 4200 m2, 0.42 ha 1 kuntar 45 kg 1 mukhammas 7400 m2, 0.74 ha 1 ratul 449.28 g 1 sack groundnuts 45 kg 1 sack millet/ sorghum 90 kg 1 sack sesame 73 kg Exchange rate 1 US $ accounts for around 250 Sudanese Dinar or 2500 Sudanese Pounds Scientific notations Power Prefix Abbreviation 10-6 (e.g. 0.000001)) micro μ 10-3 Milli m 106 (e.g. 1 000 000) Mega M 109 Giga G 1015 Peta P

Jakubaschk, Caren: Acacia senegal, SOC and Nitrogen Content: A Study in North Kordofan, Sudan
48
APPENDIX 2: SOIL SAMPLE AND BIOMASS PROTOCOL Soil sample protocol Number of sample Date Depth GPS position Soil type Vegetation Land use Land use history On crop fields: Main crops Crop:fallow cycle? Last fallow period Planting, harvest month Fertilisation, irrigation C content N content Soil texture Bulk density Biomass protocol Number of field Species composition (percentage of each species)
Number of trees Measurements on average tree
Height Canopy diameter Stem circumference at breast height Stem circumference at 30cm (only Acacia senegal)
Number of stems Grass Height Density Local name

Jakubaschk, Caren: Acacia senegal, SOC and Nitrogen Content: A Study in North Kordofan, Sudan
49
APPENDIX 3: RESULTS FOR ALL SOIL SAMPLES Fallow fields with Acacia senegal (FallowA)
No. Latitude Longitude C in % C in g m-2 N in mg g-1 N in % C:N ratio0-20cm depth
7 N 12 52.0210 E 030 57.9450 0.11 390.11 118.77 0.0012 969 N 12 50.9440 E 030 55.0870 0.137 468.81 134.62 0.0013 102
11 N 12 51.8610 E 030 55.0290 0.129 441.44 126.96 0.0013 10213 N 12 53.0840 E 030 53.2560 0.100 342.20 95.27 0.0010 10516 N 12 55.4600 E 031 05.3700 0.074 253.23 130.27 0.0013 5717 N 12 55.4600 E 031 05.3700 0.107 366.15 102.99 0.0010 10422 N 12 56.8540 E 031 06.4750 0.093 318.25 110.76 0.0011 8449 N 12 46.1880 E 030 46.9150 0.108 369.58 119.37 0.0012 9055 N 12 55.8790 E 031 00.0390 0.111 379.84 108.50 0.0011 10259 N 12 58.0980 E 031 01.0830 0.131 448.28 127.31 0.0013 10365 N 12 54.8070 E 031 19.8600 0.079 270.34 331.98 0.0033 2475 N 12 48.5000 E 031 01.4230 0.105 359.31 111.16 0.0011 9486 N 12 50.0990 E 031 00.4190 0.108 369.58 111.55 0.0011 9788 N 12 52.6550 E 031 01.6780 0.160 547.52 149.37 0.0015 10794 N 12 51.8570 E 031 08.2170 0.088 301.14 103.05 0.0010 85
20-50cm depth 23 N 12 56.8540 E 031 06.4750 0.067 343.91 96.13 0.0010 7050 N 12 46.1880 E 030 46.9150 0.089 456.84 108.25 0.0011 8256 N 12 55.8790 E 031 00.0390 0.069 354.18 88.66 0.0009 7860 N 12 58.0980 E 031 01.0830 0.071 364.44 84.89 0.0008 8466 N 12 54.8070 E 031 19.8600 0.075 384.98 90.65 0.0009 8376 N 12 48.5000 E 031 01.4230 0.099 508.17 95.53 0.0010 10487 N 12 50.0990 E 031 00.4190 0.079 405.51 105.77 0.0011 7589 N 12 52.6550 E 031 01.6780 0.091 467.10 106.45 0.0011 8595 N 12 51.8570 E 031 08.2170 0.042 215.59 66.26 0.0007 63
Undisturbed sites with Acacia senegal (VirginA)
No. Latitude Longitude C in % C in g m-2 N in mg g-1 N in % C:N ratio0-20cm depth
29 N 12 54.7800 E 031 26.6320 0.112 383.26 93.47 0.0009 12037 N 12 43.5810 E 030 49.2550 0.129 441.44 147.23 0.0015 8839 N 12 43.5430 E 030 49.1740 0.092 314.82 107.63 0.0011 8541 N 12 43.4640 E 030 49.1320 0.114 390.11 128.94 0.0013 8843 N 12 43.7780 E 030 49.2110 0.134 458.55 139.15 0.0014 9645 N 12 43.8790 E 030 49.1960 0.149 509.88 147.68 0.0015 101
20-50cm depth 38 N 12 43.5810 E 030 49.2550 0.088 451.70 111.94 0.0011 7940 N 12 43.5430 E 030 49.1740 0.085 436.31 104.61 0.0010 8142 N 12 43.4640 E 030 49.1320 0.097 497.90 120.67 0.0012 8044 N 12 43.7780 E 030 49.2110 0.086 441.44 110.54 0.0011 7846 N 12 43.8790 E 030 49.1960 0.121 621.09 113.31 0.0011 107

Jakubaschk, Caren: Acacia senegal, SOC and Nitrogen Content: A Study in North Kordofan, Sudan
50
Fallow fields without Acacia senegal (Fallow)
No. Latitude Longitude C in % C in g m-2 N in mg g-1 N in % C:N ratio0-20cm depth
8 N 12 51.8280 E 030 58.4900 0.105 359.31 112.29 0.0011 9426 N 12 56.3330 E 031 06.9480 0.087 297.71 95.44 0.0010 9147 N 12 46.5880 E 030 47.1590 0.101 345.62 122.74 0.0012 8257 N 12 55.4920 E 031 00.1600 0.086 294.29 93.94 0.0009 9261 N 12 58.5150 E 031 02.0950 0.143 489.35 115.13 0.0012 12469 N 12 56.5800 E 031 19.7650 0.064 219.01 110.20 0.0011 5879 N 12 49.5040 E 031 02.0130 0.106 362.73 113.48 0.0011 9384 N 12 48.6670 E 030 58.6980 0.091 311.40 100.50 0.0010 91
20-50cm depth 27 N 12 56.3330 E 031 06.9480 0.062 318.25 88.27 0.0009 7048 N 12 46.5880 E 030 47.1590 0.062 318.25 100.60 0.0010 6258 N 12 55.4920 E 031 00.1600 0.061 313.11 85.41 0.0009 7162 N 12 58.5150 E 031 02.0950 0.088 451.70 94.36 0.0009 9370 N 12 56.5800 E 031 19.7650 0.057 292.58 94.56 0.0009 6080 N 12 49.5040 E 031 02.0130 0.067 343.91 106.64 0.0011 6385 N 12 48.6670 E 030 58.6980 0.066 338.78 92.56 0.0009 71
Undisturbed site without Acacia senegal (Virgin)
No. Latitude Longitude C in % C in g m-2 N in mg g-1 N in % C:N ratio0-20cm depth
4 N 12 53.0370 E 030 59.3850 0.061 208.74 72.72 0.0007 8412 N 12 51.6820 E 030 54.9490 0.201 687.82 115.79 0.0012 17415 N 12 49.4350 E 030 54.6140 0.083 284.03 78.92 0.0008 10520 N 12 55.3600 E 031 06.4440 0.091 311.40 91.50 0.0009 9935 N 12 53.4390 E 031 13.1990 0.506 1731.53 572.96 0.0057 8873 0.384 1314.05 316.67 0.0032 121
20-50cm depth 21 N 12 55.3600 E 031 06.4440 0.077 395.24 100.99 0.0010 7636 N 12 53.4390 E 031 13.1990 0.453 2325.25 173.96 0.0017 26074 0.970 4979.01 541.12 0.0054 179

Jakubaschk, Caren: Acacia senegal, SOC and Nitrogen Content: A Study in North Kordofan, Sudan
51
Crop fields (Crops)
No. Latitude Longitude C in % C in g m-2 N in mg g-1 N in % C:N ratio0-20cm depth
3 N 12 53.8000 E 031 00.1660 0.102 349.04 120.34 0.0012 8510 N 12 52.1270 E 030 54.8170 0.112 383.26 102.29 0.0010 10914 N 12 53.2060 E 030 53.2580 0.089 304.56 102.33 0.0010 8718 N 12 55.4830 E 031 05.3840 0.107 366.15 97.85 0.0010 10924 N 12 56.7350 E 031 06.5240 0.074 253.23 93.91 0.0009 7931 N 12 54.9920 E 031 29.5350 0.070 239.54 93.05 0.0009 7551 N 12 46.9720 E 030 47.7560 0.071 242.96 74.81 0.0007 9553 N 12 55.8600 E 031 00.7020 0.094 321.67 112.64 0.0011 8363 N 12 56.4690 E 031 02.7960 0.093 318.25 101.33 0.0010 9267 N 12 55.0410 E 031 19.9210 0.053 181.37 132.47 0.0013 4071 N 12 53.2780 E 031 19.3480 0.090 307.98 116.96 0.0012 7777 N 12 49.5590 E 031 01.3640 0.056 191.63 78.01 0.0008 7281 N 12 49.0750 E 031 00.3810 0.065 222.43 83.29 0.0008 7890 N 12 52.4380 E 031 02.1010 0.131 448.28 137.79 0.0014 9592 N 12 54.2800 E 031 02.4210 0.069 236.12 94.02 0.0009 7396 N 12 51.1590 E 031 09.4350 0.081 277.18 138.85 0.0014 5832 N 12 53.4200 E 031 29.3010 0.42 1440.66 229.12 0.0023 18434 N 12 53.5050 E 031 29.2340 0.34 1166.90 172.25 0.0017 198
20-50cm depth 19 N 12 55.4830 E 031 05.3840 0.078 400.37 102.59 0.0010 7625 N 12 56.7350 E 031 06.5240 0.050 256.65 103.33 0.0010 4830 N 12 54.9920 E 031 29.5350 0.049 251.52 97.81 0.0010 5052 N 12 46.9720 E 030 47.7560 0.049 251.52 86.84 0.0009 5654 N 12 55.8600 E 031 00.7020 0.059 302.85 90.00 0.0009 6668 N 12 55.0410 E 031 19.9210 0.048 246.38 79.81 0.0008 6072 N 12 53.2780 E 031 19.3480 0.084 431.17 122.60 0.0012 6978 N 12 49.5590 E 031 01.3640 0.060 307.98 93.58 0.0009 6483 N 12 49.0750 E 031 00.3810 0.067 343.91 96.18 0.0010 7091 N 12 52.4380 E 031 02.1010 0.068 349.04 96.48 0.0010 7093 N 12 54.2800 E 031 02.4210 0.065 333.65 94.91 0.0009 6897 N 12 51.1590 E 031 09.4350 0.072 369.58 114.27 0.0011 6364 N 12 56.4690 E 031 02.7960 0.072 369.58 110.58 0.0011 65
Clay soil samples 32 N 12 53.4200 E 031 29.3010 0.42 1440.66 229.12 0.0023 18434 N 12 53.5050 E 031 29.2340 0.34 1166.90 172.25 0.0017 198

Jakubaschk, Caren: Acacia senegal, SOC and Nitrogen Content: A Study in North Kordofan, Sudan
52
APPENDIX 4: BIOMASS CALCULATIONS Fallow fields with Acacia senegal (FallowA) Age = period during which current land use occurs on this field d = diameter at 30 cm height, r = radius at 30 cm height CSA = stem cross sectional area at 30cm height, T no. = No. of trees BT = tree biomass, BG = grass biomass, BTot = total biomass Above ground biomass = CSAy ×+= 12.471.3 Fine roots = 512.04.23 CSAy ×= Coarse roots = 737.10004.0 CSAy ×= No. Age d r CSA Above Fine roots Coarse roots T no. BT in kg m-2 BT litter in kg m-2 % grass BG in kg m-2 BG - grazing BTot in kg m-2 BTot in g m-2
7 17 22 11 380.13 1569.86 489.94 12.12 3 0.0155 0.0025 0 0.002 2.49
9 25 20 10 314.16 1298.05 444.38 8.70 11.5 0.0503 0.0081 0.6 0.6798 0.3399 0.348 347.96
11 25 11.5 5.75 103.87 431.65 252.15 1.27 13 0.0223 0.0036 0 0 0.004 3.56
13 17 19.5 9.75 298.65 1234.14 433.01 7.97 15 0.0628 0.0101 0.5 0.5665 0.28325 0.293 293.30
17 18 22.5 11.25 397.61 1641.85 501.35 13.10 4 0.0216 0.0035 0.4 0.4532 0.2266 0.230 230.0522 20 21.5 10.75 363.05 1499.48 478.54 11.19 1 0.0050 0.0008 0.2 0.2266 0.1133 0.114 114.1049 18 12.5 6.25 122.72 509.31 274.62 1.70 2 0.0039 0.0006 0.2 0.2266 0.1133 0.114 113.9355 30 31.5 15.75 779.31 3214.47 707.57 42.17 2 0.0198 0.0032 0.4 0.4532 0.2266 0.230 229.7759 20 11 5.5 95.03 395.25 240.93 1.09 8 0.0127 0.0020 0.7 0.7931 0.39655 0.399 398.59
65 20 15.5 7.75 188.69 781.12 342.30 3.59 2 0.0056 0.0009 0.1 0.1133 0.05665 0.058 57.55
75 26 21.5 10.75 363.05 1499.48 478.54 11.19 8 0.0398 0.0064 0.4 0.4532 0.2266 0.233 232.97
86 24 20.2 10.1 320.47 1324.06 448.93 9.01 6 0.0267 0.0043 0.5 0.5665 0.28325 0.288 287.5388 30 14.5 7.25 165.13 684.05 319.70 2.85 12 0.0302 0.0048 0.5 0.5665 0.28325 0.288 288.08
94 17 16 8 201.06 832.09 353.61 4.01 3.5 0.0104 0.0017 0.1 0.1133 0.05665 0.058 58.32

Jakubaschk, Caren: Acacia senegal, SOC and Nitrogen Content: A Study in North Kordofan, Sudan
53
Fallow fields without Acacia senegal (Fallow) No. Age d r CSA Above Fine roots Coarse roots T no. BT in kg m-2 BT litter in kg m-2 % grass BG in kg m-2 BG - grazing BTot in kg m-2 BTot in g m-2
29 22 12 6 113.10 469.67 263.38 1.48 13 0.0239 0.0038 0 0.004 3.82
37 42 13 6.5 132.73 550.57 285.88 1.95 9 0.0189 0.0030 0.3 0.3399 0.16995 0.173 172.97
39 42 12.5 6.25 122.72 509.31 274.62 1.70 10 0.0196 0.0031 0.3 0.3399 0.16995 0.173 173.09
41 42 10.2 5.1 81.71 340.37 223.00 0.84 8 0.0113 0.0018 0.3 0.3399 0.16995 0.172 171.76
43 42 13 6.5 132.73 550.57 285.88 1.95 9 0.0189 0.0030 0.2 0.2266 0.1133 0.116 116.32
45 42 10 5 78.54 327.29 218.53 0.78 13.5 0.0184 0.0030 0.2 0.2266 0.1133 0.116 116.25
Crop fields (Crops)
No. Age Crop Y in unitSud Y in kg ha-1 Btot in kg ha-1 BR in kg ha-1 BR in g m-2
3 7 M 1.5 s moh-1 182.43 975.02 97.50 9.75
10 7 So 2 s 6 moh-1 40.54 288.12 28.81 2.88
92 35 So 20 s 6 moh-1 405.41 2881.16 288.12 28.81
71 22 So 0.5 s 4 moh-1 15.20 108.04 10.80 1.08
53 10 So 5 s 3.5 moh-1 173.75 1234.78 123.48 12.35
14 7 K 4 k moh-1 243.24 670.71 67.07 6.71
18 20 K 5 k 0.5 moh-1 608.11 1676.77 167.68 16.77
31 5 K 4 k 5 moh-1 48.65 134.14 13.41 1.34
51 10 K 12 k 4 moh-1 182.43 503.03 50.30 5.03
96 30 K 6 k 2 moh-1 182.43 503.03 50.30 5.03
24 10 S 25 k 10 moh-1 152.03 419.19 41.92 4.19
90 30 S 2 s 9.5 moh-1 25.60 70.60 7.06 0.71
81 30 K, B 1 k K, 2 s B moh-1 304.05 838.38 83.84 8.38
77 27 K, G 5 k K, 4 s G 7 moh-1 112.93 311.40 31.14 3.11
67 30 K, S 3 k K, 2 k S 6 moh-1 50.68 139.73 13.97 1.40
63 12 S, K 2 k K, 1 s S moh-1 40.54 111.78 11.18 1.12
32 18 S 1 k 0.25 moh-1 243.24 670.71 67.07 6.71
34 18 So 3 s moh-1 364.86 2593.05 259.30 25.93
Crops: M = millet, S = sesame, K = karkade, So = sorghum, B = beans, G = groundnuts Y in unitSud = Yield in Sudanese units, Btot = total biomass, BR = root biomass

Jakubaschk, Caren: Acacia senegal, SOC and Nitrogen Content: A Study in North Kordofan, Sudan
54
Undisturbed site with Acacia senegal (VirginA) No. Age d1 d2 T no. NameT Cd1 log Cd1 Cd2 log Cd2 log BT1 BT1 in kg log BT2 BT2 in kg BTdry in kg 400m-2 BTdry in kg m-2 L BTdry in kg m-2 % grass BG in kg m-2 BG grazing Btot in g m-2
8 10 8.5 20 2 habil, usher 13.69 1.14 29.16 1.46 1.64 44.12 2.06 116.13 48.07 0.12 0.02 0.00 0.00 19.23
26 10 10 2 sereh 10.89 1.04 1.52 32.92 19.75 0.05 0.01 0.3 0.34 0.17 177.40
47 9 29.5 1 usher 18.49 1.27 1.81 64.82 19.44 0.05 0.01 0.2 0.23 0.11 120.78
57 25 26.5 1 usher 14.82 1.17 1.69 48.84 14.65 0.04 0.01 0.4 0.45 0.23 231.86
61 14 2 11.5 9 (1 U) sereh, usher 6.76 0.83 11.56 1.06 1.25 17.88 1.55 35.53 53.57 0.13 0.02 0.00 0.00 21.43
69 13 6 3 robesh 26.52 1.42 2.01 102.86 92.57 0.23 0.04 0.15 0.17 0.08 121.78
79 18 1 1.13 0.57 565.00
84 18 1 1.13 0.57 565.00
Undisturbed site without Acacia senegal (Virgin) No. Age d1 T no. NameT Cd1 log Cd1 log BT1 BT1 in kg BTdry in kg 400m-2 BTdry in kg m-2 L BTdry in kg m-2 % grass BG in kg m-2 BG grazing Btot in g m-2
4 30 1 1.13 0.57 565.00
12 50 1 1.13 0.57 565.00
15 31 1 1.13 0.57 565.00
20 30 8 1 robesh 12.25 1.09 1.58 38.27 11.48 0.03 0.00 0.6 0.68 0.34 343.59
35 50 24.5 7 Nim 21.16 1.33 1.89 77.03 161.76 0.40 0.06 0 0.00 0.00 64.71
73 50 38 4 Nim 57.76 1.76 2.44 278.54 334.24 0.84 0.13 0 0.00 0.00 133.70
d1 = diameter of tree 1 at 1.3 m height Cd1 = crown diameter of tree 1

Jakubaschk, Caren: Acacia senegal, SOC and Nitrogen Content: A Study in North Kordofan, Sudan
55
APPENDIX 5: RESULTS OF REGRESSION ANALYSIS FOR C AND N FallowA
FallowA without soil sample No. 65

Jakubaschk, Caren: Acacia senegal, SOC and Nitrogen Content: A Study in North Kordofan, Sudan
56
Fallow
Crops

Jakubaschk, Caren: Acacia senegal, SOC and Nitrogen Content: A Study in North Kordofan, Sudan
57
VirginA
Virgin
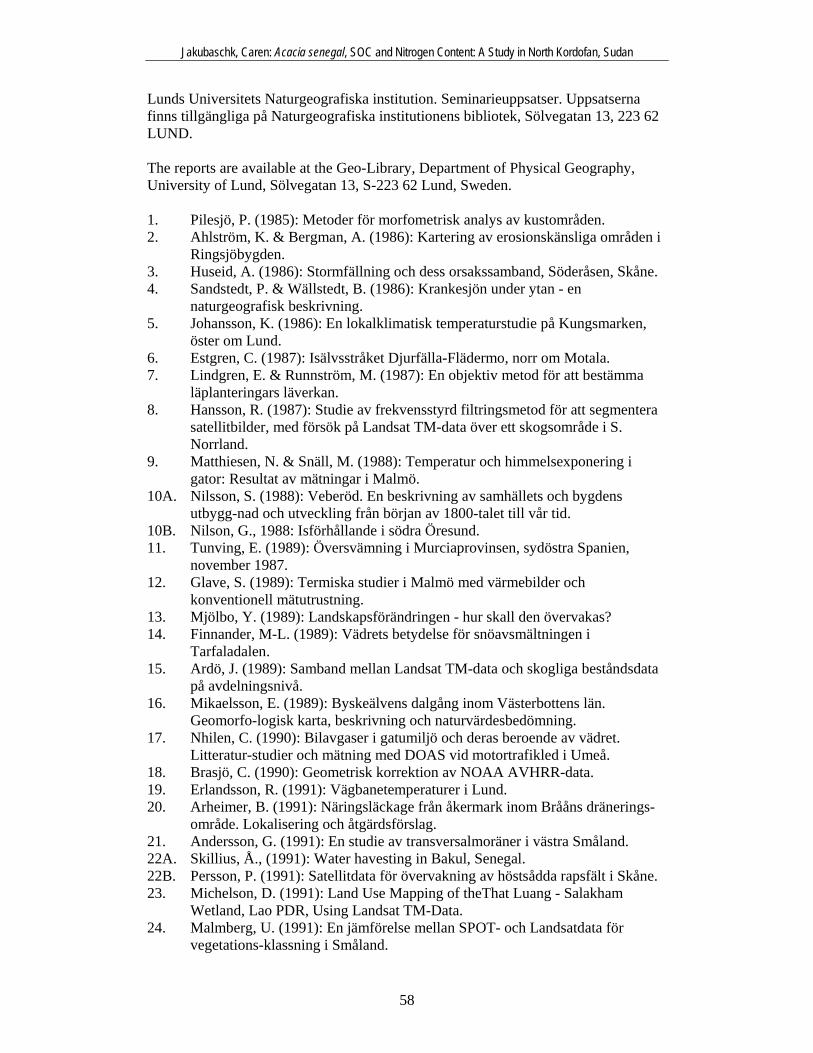
Jakubaschk, Caren: Acacia senegal, SOC and Nitrogen Content: A Study in North Kordofan, Sudan
58
Lunds Universitets Naturgeografiska institution. Seminarieuppsatser. Uppsatserna finns tillgängliga på Naturgeografiska institutionens bibliotek, Sölvegatan 13, 223 62 LUND. The reports are available at the Geo-Library, Department of Physical Geography, University of Lund, Sölvegatan 13, S-223 62 Lund, Sweden. 1. Pilesjö, P. (1985): Metoder för morfometrisk analys av kustområden. 2. Ahlström, K. & Bergman, A. (1986): Kartering av erosionskänsliga områden i
Ringsjöbygden. 3. Huseid, A. (1986): Stormfällning och dess orsakssamband, Söderåsen, Skåne. 4. Sandstedt, P. & Wällstedt, B. (1986): Krankesjön under ytan - en
naturgeografisk beskrivning. 5. Johansson, K. (1986): En lokalklimatisk temperaturstudie på Kungsmarken,
öster om Lund. 6. Estgren, C. (1987): Isälvsstråket Djurfälla-Flädermo, norr om Motala. 7. Lindgren, E. & Runnström, M. (1987): En objektiv metod för att bestämma
läplanteringars läverkan. 8. Hansson, R. (1987): Studie av frekvensstyrd filtringsmetod för att segmentera
satellitbilder, med försök på Landsat TM-data över ett skogsområde i S. Norrland.
9. Matthiesen, N. & Snäll, M. (1988): Temperatur och himmelsexponering i gator: Resultat av mätningar i Malmö.
10A. Nilsson, S. (1988): Veberöd. En beskrivning av samhällets och bygdens utbygg-nad och utveckling från början av 1800-talet till vår tid.
10B. Nilson, G., 1988: Isförhållande i södra Öresund. 11. Tunving, E. (1989): Översvämning i Murciaprovinsen, sydöstra Spanien,
november 1987. 12. Glave, S. (1989): Termiska studier i Malmö med värmebilder och
konventionell mätutrustning. 13. Mjölbo, Y. (1989): Landskapsförändringen - hur skall den övervakas? 14. Finnander, M-L. (1989): Vädrets betydelse för snöavsmältningen i
Tarfaladalen. 15. Ardö, J. (1989): Samband mellan Landsat TM-data och skogliga beståndsdata
på avdelningsnivå. 16. Mikaelsson, E. (1989): Byskeälvens dalgång inom Västerbottens län.
Geomorfo-logisk karta, beskrivning och naturvärdesbedömning. 17. Nhilen, C. (1990): Bilavgaser i gatumiljö och deras beroende av vädret.
Litteratur-studier och mätning med DOAS vid motortrafikled i Umeå. 18. Brasjö, C. (1990): Geometrisk korrektion av NOAA AVHRR-data. 19. Erlandsson, R. (1991): Vägbanetemperaturer i Lund. 20. Arheimer, B. (1991): Näringsläckage från åkermark inom Brååns dränerings-
område. Lokalisering och åtgärdsförslag. 21. Andersson, G. (1991): En studie av transversalmoräner i västra Småland. 22A. Skillius, Å., (1991): Water havesting in Bakul, Senegal. 22B. Persson, P. (1991): Satellitdata för övervakning av höstsådda rapsfält i Skåne. 23. Michelson, D. (1991): Land Use Mapping of theThat Luang - Salakham
Wetland, Lao PDR, Using Landsat TM-Data. 24. Malmberg, U. (1991): En jämförelse mellan SPOT- och Landsatdata för
vegetations-klassning i Småland.
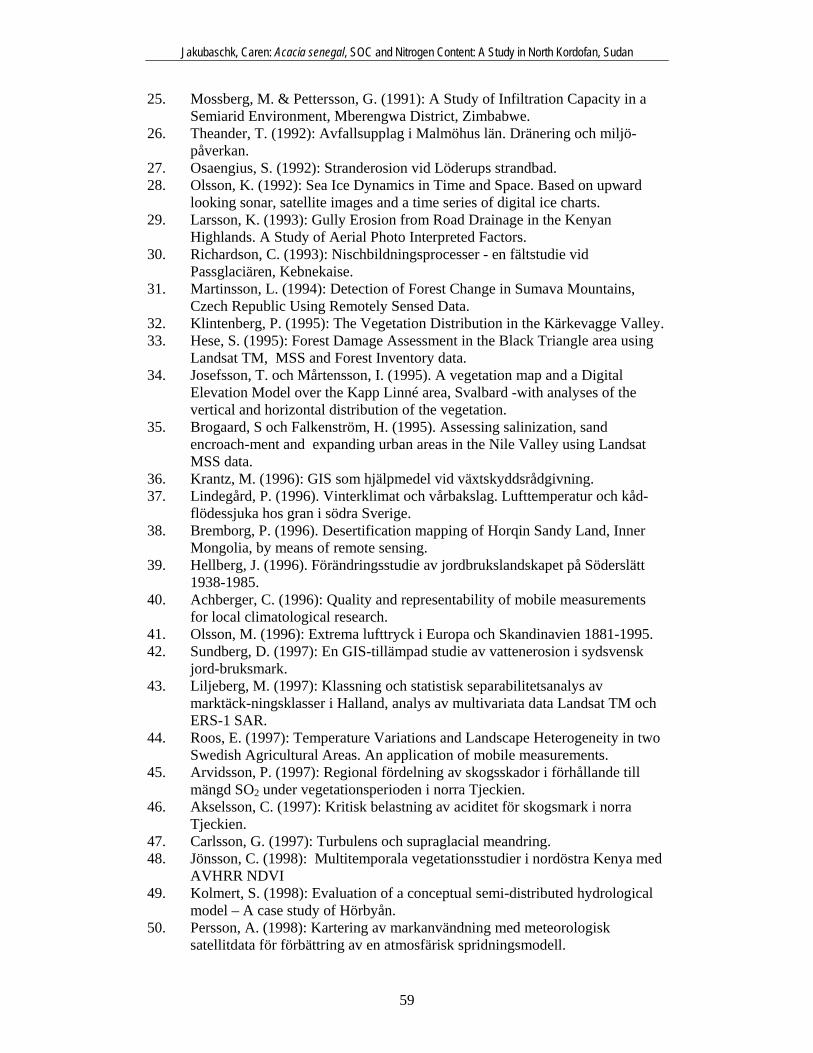
Jakubaschk, Caren: Acacia senegal, SOC and Nitrogen Content: A Study in North Kordofan, Sudan
59
25. Mossberg, M. & Pettersson, G. (1991): A Study of Infiltration Capacity in a Semiarid Environment, Mberengwa District, Zimbabwe.
26. Theander, T. (1992): Avfallsupplag i Malmöhus län. Dränering och miljö-påverkan.
27. Osaengius, S. (1992): Stranderosion vid Löderups strandbad. 28. Olsson, K. (1992): Sea Ice Dynamics in Time and Space. Based on upward
looking sonar, satellite images and a time series of digital ice charts. 29. Larsson, K. (1993): Gully Erosion from Road Drainage in the Kenyan
Highlands. A Study of Aerial Photo Interpreted Factors. 30. Richardson, C. (1993): Nischbildningsprocesser - en fältstudie vid
Passglaciären, Kebnekaise. 31. Martinsson, L. (1994): Detection of Forest Change in Sumava Mountains,
Czech Republic Using Remotely Sensed Data. 32. Klintenberg, P. (1995): The Vegetation Distribution in the Kärkevagge Valley. 33. Hese, S. (1995): Forest Damage Assessment in the Black Triangle area using
Landsat TM, MSS and Forest Inventory data. 34. Josefsson, T. och Mårtensson, I. (1995). A vegetation map and a Digital
Elevation Model over the Kapp Linné area, Svalbard -with analyses of the vertical and horizontal distribution of the vegetation.
35. Brogaard, S och Falkenström, H. (1995). Assessing salinization, sand encroach-ment and expanding urban areas in the Nile Valley using Landsat MSS data.
36. Krantz, M. (1996): GIS som hjälpmedel vid växtskyddsrådgivning. 37. Lindegård, P. (1996). Vinterklimat och vårbakslag. Lufttemperatur och kåd-
flödessjuka hos gran i södra Sverige. 38. Bremborg, P. (1996). Desertification mapping of Horqin Sandy Land, Inner
Mongolia, by means of remote sensing. 39. Hellberg, J. (1996). Förändringsstudie av jordbrukslandskapet på Söderslätt
1938-1985. 40. Achberger, C. (1996): Quality and representability of mobile measurements
for local climatological research. 41. Olsson, M. (1996): Extrema lufttryck i Europa och Skandinavien 1881-1995. 42. Sundberg, D. (1997): En GIS-tillämpad studie av vattenerosion i sydsvensk
jord-bruksmark. 43. Liljeberg, M. (1997): Klassning och statistisk separabilitetsanalys av
marktäck-ningsklasser i Halland, analys av multivariata data Landsat TM och ERS-1 SAR.
44. Roos, E. (1997): Temperature Variations and Landscape Heterogeneity in two Swedish Agricultural Areas. An application of mobile measurements.
45. Arvidsson, P. (1997): Regional fördelning av skogsskador i förhållande till mängd SO2 under vegetationsperioden i norra Tjeckien.
46. Akselsson, C. (1997): Kritisk belastning av aciditet för skogsmark i norra Tjeckien.
47. Carlsson, G. (1997): Turbulens och supraglacial meandring. 48. Jönsson, C. (1998): Multitemporala vegetationsstudier i nordöstra Kenya med
AVHRR NDVI 49. Kolmert, S. (1998): Evaluation of a conceptual semi-distributed hydrological
model – A case study of Hörbyån. 50. Persson, A. (1998): Kartering av markanvändning med meteorologisk
satellitdata för förbättring av en atmosfärisk spridningsmodell.

Jakubaschk, Caren: Acacia senegal, SOC and Nitrogen Content: A Study in North Kordofan, Sudan
60
51. Andersson, U. och Nilsson, D. (1998): Distributed hydrological modelling in a GIS perspective – an evaluation of the MIKE SHE model.
52. Andersson, K. och Carlstedt, J. (1998): Different GIS and remote sensing techniques for detection of changes in vegetation cover - A study in the Nam Ngum and Nam Lik catchment areas in the Lao PDR.
53. Andersson, J., (1999): Användning av global satllitdata för uppskattning av spannmålsproduktion i västafrikanska Sahel.
54. Flodmark, A.E., (1999): Urban Geographic Information Systems, The City of Berkeley Pilot GIS
55A. Lyborg, Jessic & Thurfell, Lilian (1999): Forest damage, water flow and digital elevation models: a case study of the Krkonose National Park, Czech Republic.
55B. Tagesson, I., och Wramneby, A., (1999): Kväveläckage inom Tolångaåns dräneringsområde – modellering och åtgärdssimulering.
56. Almkvist, E., (1999): Högfrekventa tryckvariationer under de senaste århundra- dena.
57. Alstorp, P., och Johansson, T., (1999): Översiktlig buller- och luftförorenings- inventering i Burlövs Kommun år 1994 med hjälp av geografiska informations-system – möjligheter och begränsningar.
58. Mattsson, F., (1999): Analys av molnklotter med IRST-data inom det termala infraröda våglängdsområdet
59. Hallgren, L., och Johansson, A., (1999): Analysing land cover changes in the Caprivi Strip, Namibia, using Landsat TM and Spot XS imagery.
60. Granhäll, T., (1999): Aerosolers dygnsvariationer och långväga transporter. 61. Kjellander, C., (1999): Variations in the energy budget above growing wheat
and barley, Ilstorp 1998 - a gradient-profile approach 62. Moskvitina, M., (1999): GIS as a Tool for Environmental Impact Assessment -
A case study of EIA implementation for the road building project in Strömstad, Sweden
63. Eriksson, H., (1999): Undersökning av sambandet mellan strålningstemperatur och NDVI i Sahel.
64. Elmqvist, B., Lundström, J., (2000): The utility of NOAA AVHRR data for vegetation studies in semi-arid regions.
65. Wickberg, J., (2000): GIS och statistik vid dräneringsområdesvis kväveläckage-beskrivning i Halland.
66. Johansson, M., (2000): Climate conditions required for re-glaciation of cirques in Rassepautasjtjåkka massif, northern Sweden.
67. Asserup, P., Eklöf, M., (2000): Estimation of the soil moisture distribution in the Tamne River Basin, Upper East Region, Ghana.
68. Thern, J., (2000): Markvattenhalt och temperatur i sandig jordbruksmark vid Ilstorp, centrala Skåne: en mätnings- och modelleringsstudie.
69. Andersson, C., Lagerström, M., (2000): Nitrogen leakage from different land use types - a comparison between the watersheds of Graisupis and Vardas, Lithuania.
70. Svensson, M., (2000): Miljökonsekvensbeskrivning med stöd av Geografiska Informationssystem (GIS) – Bullerstudie kring Malmö-Sturup Flygplats.
71. Hyltén, H.A., Uggla, E., (2000): Rule.Based Land Cover Classification and Erosion Risk Assessment of the Krkonoše National Park, Czech Republic.

Jakubaschk, Caren: Acacia senegal, SOC and Nitrogen Content: A Study in North Kordofan, Sudan
61
72. Cronquist, L., Elg, S., (2000): The usefulness of coarse resolution satellite sensor data for identification of biomes in Kenya.
73. Rasmusson, A-K., (2000): En studie av landskapsindex för kvantifiering av rumsliga landskapsmönster.
74. Olofsson, P., Stenström, R., (2000): Estimation of leaf area index in southern Sweden with optimal modelling and Landsat 7 ETM+Scene.
75. Uggla, H., (2000): En analys av nattliga koldioxidflöden i en boreal barrskog avseende spatial och temporal variation.
76. Andersson, E., Andersson, S., (2000): Modellering och uppmätta kväveflöden i energiskog som bevattnas med avloppsvatten.
77. Dawidson, E., Nilsson, C., (2000): Soil Organic Carbon in Upper East Region, Ghana - Measurements and Modelling.
78. Bengtsson, M., (2000): Vattensänkningar - en analys av orsaker och effekter. 79. Ullman, M., (2001): El Niño Southern Oscillation och dess atmosfäriska
fjärrpåverkan. 80. Andersson, A., (2001): The wind climate of northwestern Europe in
SWECLIM regional climate scenarios. 81. Lalloo, D., (2001): Geografiska informationssystem för studier av
polyaromatiska kolväten (PAH) – Undersökning av djupvariation i BO01-området, Västra hamnen, Malmö, samt utveckling av en matematisk formel för beräkning av PAH-koncentrationer från ett kontinuerligt utsläpp.
82. Almqvist, J., Fergéus, J., (2001): GIS-implementation in Sri Lanka. Part 1: GIS-applications in Hambantota district Sri Lanka : a case study. Part 2: GIS in socio-economic planning : a case study.
83. Berntsson, A., (2001): Modellering av reflektans från ett sockerbetsbestånd med hjälp av en strålningsmodell.
84. Umegård, J., (2001): Arctic aerosol and long-range transport. 85. Rosenberg, R., (2002): Tetratermmodellering och regressionsanalyser mellan
topografi, tetraterm och tillväxt hos sitkagran och lärk – en studie i norra Island.
86. Håkansson, J., Kjörling, A., (2002): Uppskattning av mängden kol i trädform: en metodstudie.
87. Arvidsson, H., (2002): Coastal parallel sediment transport on the SE Australian inner shelf – A study of barrier morphodynamics.
88. Bemark, M., (2002): Köphultssjöns tillstånd och omgivningens påverkan. 89. Dahlberg, I., (2002): Rödlistade kärlväxter i Göteborgs innerstad – temporal
och rumslig analys av rödlistade kärlväxter i Göteborgs artdataarkiv, ADA. 90. Poussart, J.-N., (2002): Verification of Soil Carbon Sequestration -
Uncertainties of Assessment Methods 91. Jakubaschk, C., (2002): Acacia senegal, Soil Organic Carbon and Nitrogen
Contents in North Kordofan, Sudan.