abstracts of the scientific posters, 2013 aacc annual meeting
TRANSCRIPT

www.clinchem.org Volume 59 Number S10 Pages A1-A295 OCTOBER 2013
ClinicalChemistryClinicalChemistry
Abstracts of the Scientific Posters, 2013 AACC Annual Meeting
Supplement to Clinical Chemistry

SCIENTIFIC POSTER SESSION SCHEDULE Posters of the accepted abstracts can be viewed in the Exhibit Hall of the George R. Brown Convention Center, on Tuesday, July 30 and Wednesday, July 31. All posters will be posted for two and one half hours. The presenting author will be in attendance during the f nal hour. Please refer to the onsite Program Guide for a complete listing of the posters. Poster presenters are underlined in abstract listing.
Below are the topics and their scheduled times.
TUESDAY, JULY 30, POSTER SESSIONS9:30am – 5:00pm Cancer/Tumor Markers . . . . . . . . . . . . . . . . . A02 – A74 . . . . . . . . . . . . . . . . . . . . . . . . A2 Automation/Computer Applications . . . . . . . A75 – A92 . . . . . . . . . . . . . . . . . . . . . . . A20 Molecular Pathology/Probes . . . . . . . . . . . . . A93 – A131 . . . . . . . . . . . . . . . . . . . . . . A27 Nutrition/Trace Metals/Vitamins . . . . . . . . . . A132 – A154 . . . . . . . . . . . . . . . . . . . . . A37 Mass Spectrometry Applications . . . . . . . . . . A155 – A222 . . . . . . . . . . . . . . . . . . . . . A44 Immunology . . . . . . . . . . . . . . . . . . . . . . . . . A223 – A278 . . . . . . . . . . . . . . . . . . . . . A67 Endocrinology/Hormones . . . . . . . . . . . . . . . A279 – A363 . . . . . . . . . . . . . . . . . . . . . A84 Clinical Studies/Outcomes . . . . . . . . . . . . . . A364 – A424 . . . . . . . . . . . . . . . . . . . . A112 TDM/Toxicology/DAU . . . . . . . . . . . . . . . . . A425 – A476 . . . . . . . . . . . . . . . . . . . . A127 Hematology/Coagulation . . . . . . . . . . . . . . . A477 – A525 . . . . . . . . . . . . . . . . . . . . A144 Factors Affecting Test Results . . . . . . . . . . . . A527 – A561 . . . . . . . . . . . . . . . . . . . . A158
WEDNESDAY, JULY 31, POSTER SESSIONS9:30am – 5:00pm Animal Clinical Chemistry . . . . . . . . . . . . . . B01 – B09 . . . . . . . . . . . . . . . . . . . . . . A170 Management . . . . . . . . . . . . . . . . . . . . . . . . . B10 – B41 . . . . . . . . . . . . . . . . . . . . . . A173 Point-of-Care Testing . . . . . . . . . . . . . . . . . . B42 – B88 . . . . . . . . . . . . . . . . . . . . . . A181 Infectious Disease . . . . . . . . . . . . . . . . . . . . . B89 – B150 . . . . . . . . . . . . . . . . . . . . . A197 Proteins/Enzymes . . . . . . . . . . . . . . . . . . . . . B151 – B174 . . . . . . . . . . . . . . . . . . . . A215 Cardiac Markers . . . . . . . . . . . . . . . . . . . . . . B175 – B239 . . . . . . . . . . . . . . . . . . . . A223 Technology/Design Development . . . . . . . . . B240 – B267 . . . . . . . . . . . . . . . . . . . . A242 Electrolytes/Blood Gas/Metabolites . . . . . . . B268 – B283 . . . . . . . . . . . . . . . . . . . . A252 Pediatric/Fetal Clinical Chemistry . . . . . . . . B284 – B313 . . . . . . . . . . . . . . . . . . . . A257 Lipids/Lipoproteins . . . . . . . . . . . . . . . . . . . . B316 – B345 . . . . . . . . . . . . . . . . . . . . A266
Author Index . . . . . . . . . . . . . . . . . . . . . . . . . . . . . . . . . . . . . . . . . . . . . . . . . . . . . . . . . . . . . . . A276Keyword Index . . . . . . . . . . . . . . . . . . . . . . . . . . . . . . . . . . . . . . . . . . . . . . . . . . . . . . . . . . . . . A288
Ed. Note: These abstracts have been reproduced without editorial alteration from the materials supplied by the authors. Infelicities of preparation, grammar, spelling, style, syntax and usage are the authors’. The abstracts of those posters that were presented at the meeting can be found in the October issue of Clinical Chemistry.

Tuesday, July 30, 9:30 am – 5:00 pm Cancer/Tumor Markers
A2 CLINICAL CHEMISTRY, Vol. 59, No. 10, Supplement, 2013
Tuesday, July 30, 2013
Poster Session: 9:30 AM - 5:00 PM
Cancer/Tumor Markers
A-02Smoking History Impacts Gene Expression Levels of Human Breast Carcinoma
J. L. Wittliff, S. A. Andres, M. A. Alatoum, T. S. Kalbfl eisch. University of Louisville, Louisville, KY
In contrast to studies of other investigators that focused on cigarette smoking and risk of breast cancer occurrence, our emphasis is to explore the infl uence of tobacco smoking on breast cancer risk of recurrence and progression. Our goal is to combine knowledge of lifestyle behavior (smoking history) and molecular phenotypes of the breast lesion to improve assessment of risk of recurrence. We utilized microarray data obtained from laser capture microdissected carcinoma cells from 247 de-identifi ed patient tissue biopsies to select candidate genes to analyze the effects of tobacco smoking on gene expression in breast cancer. The study population consisted of 66 cigarette smokers and 99 non-smokers. Each of these groups was stratifi ed further into patients that remained disease-free vs. those that had a recurrence. Using non-parametric methods (e.g., t-test) the distribution of each of the ~22,000 genes represented in the microarray were analyzed by three comparisons: 1) all smokers vs. all non-smokers; 2) smokers with a recurrence vs. those that remained disease-free; and 3) non-smokers with a recurrence vs. those that remained disease-free. These analyses identifi ed 15 genes (APOC1, ARID1B, CTNNBL1, MSX1, UBE2F, IRF2, NCOA1, LECT2, THAP4, RIPK1, AGPAT1, C7orf23, CENPN, CETN1 and YTHDC2) for further investigation. Using the entire patient population, a correlation of increased disease-free survival (DFS) and overall survival (OS) was observed with increased gene expression of IRF2, NCOA1, THAP4, RIPK1, C7orf23 and YTHDC2 (p<0.05). Interestingly, decreased DFS and OS of breast cancer patients was related to increased gene expression of LECT2, AGPAT1, CENPN and CETN1 (p<0.05) in their cancer biopsies, while no statistically signifi cant correlation was observed with APOC1, ARID1B, CTNNBL1, MSX1 and UBE2F expression levels. In the non-smoking patient population, a correlation was observed between increased DFS and/or OS and increased gene expression of C7orf23, YTHDC2 and IRF2 (p<0.05) in the patient’s biopsies. In the same population decreased DFS and/or OS was associated with increased expression levels of AGPTA1, CENPN, CETN1 and MSX1 (p<0.05), while no correlation was observed in DFS and OS in APOC1, ARIDIP, CTNNBL1, UBE2F, NCOA1, LECT2, THAP4 and RIPK1.In the population of breast cancer patients with a smoking history, their breast carcinomas exhibited a correlation between increased DFS and OS and increased gene expression levels of IRF2, NCOA1, THAP4 and RIPK1 (p<0.05). Furthermore, decreased DFS and OS of breast cancer patients was correlated with increased LECT2 gene expression (p<0.01). No correlation was observed between the expression of APOC1, ARID1P, CTNNBL1, MSX1, UBE2F, AGPTA1, C7orf23, CENPN, CETN1 or YTHDC2 and DFS or OS. Collectively, our results illustrate that although smoking history may not be an independent factor determining breast cancer progression, exposure of a patient to tobacco smoke combined with certain molecular phenotypes of breast carcinoma may alter clinical behavior of this disease. Supported in part by a grant from the Phi Beta Psi Charity Trust (TSK & JLW) and a Research of Women (ROW) grant to JLW from the EVP for Research and Innovation, University of Louisville.
A-03
Comparison of responses assigned using immunoglobulin heavy/light chain (IgG-kappa / IgG-lambda) ratios to international myeloma working group response criteria
P. Young, H. Sharrod, R. Hughes, H. Carr-Smith, S. J. Harding. The Binding Site Group Ltd, Birmingham, United Kingdom
Background: Quantifi cation of monoclonal immunoglobulins (M-Ig) by serum protein electrophoresis (SPEP) is required to assign responses, with immunofi xation (IFE) being required to type and assign complete response. Whilst these measurements are suitable for gross M-Ig production they are limited, for instance, at low M-Ig concentrations. Furthermore, the concentration dependent variable catabolism of IgG can make SPEP an inaccurate refl ection of response. Novel nephelometric assays that
quantify IgGκ and IgGλ (heavy/light chain; HLC) have been developed. Here, we compare IgG HLC and SPEP measurements and assess changes in HLC ratio (IgGκ/IgGλ; HLCr) as a method of monitoring IgG MM patients.Methods: IgGκ HLC (normal range: 4.03-9.78) IgGλ HLC (1.97-5.71) and HLCr (0.98-2.75) were measured in 85 serial samples from 25 (18 IgGκ; 7 IgGλ) IgG MM patients to identify HLCr cut-offs that could be used to defi ne responses; these cut-offs were then validated in 437 serial samples from 131 (90 IgGκ; 41 IgGλ) MM patients. HLCr responses were compared with SPEP and IFE assigned responses in two ways: 1) responses were dichotomized into response (CR, VGPR and PR) v no response (SD and PD) and sensitivity, specifi city, PPV and NPV were calculated for HLCr; and 2) individual assigned responses were compared using a Weighted Kappa analysis with a quadratic weighting. Results: The following response criteria were identifi ed for changes in HLCr: 1) PD: ≥32% increase in HLCr (absolute increase in involved IgG≥5g/); 2) SD: <32% increase to <47% reduction; 3) PR: 47-91% reduction; 4) VGPR: >91% reduction; and 5) CR: normalisation of HLCr. In the validation cohort there was good agreement between involved IgG and SPEP/densitometry (n=132; Passing-Bablok:1.53+0.86x). HLCr changesassigned: 60 CRs; 82 VGPRs (median % change: -92%, range: -92 to -99%); 198 PRs (median % change: -76%, range: -47 to -91%); 96 SDs (median % change: -21%, range: -46 to 31%), additionally SD was assigned to a further 9 patients where there was >32% increase in HLCr without an accompanying 5g/L increase in involved IgG and 1 PD (% change: 257%).There was good agreement between dichotomized HLCr-responses and IMWG-responses (sensitivity: 92.8% (95% CI: 89.4-95.3%); specifi city: 68.9% (59.1-77.5%); PPV: 90.2% (95% CI: 86.6-93.2%); NPV: 75.2% (65.5-83.5%) and between individual assigned responses (Weighted Kappa: 0.72 (95% CI: 0.65-0.82); >0.61 represents substantial agreement). In 11 samples from 7 IgGκ MM patients, HLCr normalised (CR) while SPEP indicated a PR. All patients had low serum concentrations of IgG <6.2g/L, and the discordance could be due to increased serum half-life due to the role of the FcRn recycling receptor; it is noteworthy that in all patients there was recovery of the uninvolved IgG indicating a reduction of tumour burden.Conclusion: There is good agreement between HLC and SPEP measurements in samples from IgG MM patients, and changes in HLCr can be used to monitor IgG MM patients. Further clinical studies are needed to validate optimal HLCr cut-offs and confi rm the clinical benefi t of HLCr monitoring.
A-04
BCMA is a novel serum biomarker for diagnosis and prognosis of multiple myeloma
E. Sanchez, M. Li, A. Kitto, J. Li, C. S. Wang, M. Ferros, S. Vardanyan, D. Rauch, K. Delijani, K. DeCorso, A. Prajogi, H. Chen, J. R. Berenson. Institute for myeloma and bone cancer research, West Hollywood, CA
Multiple myeloma (MM) is a malignant plasma cell dyscrasia localized in the bone marrow. Although certain clinical biomarkers of MM have been identifi ed, it currently is not possible to accurately determine individual risk of progression. B cell maturation antigen (BCMA) is a receptor whose expression increases during B-cell development and is found on malignant cells from MM patients; however, it has not been identifi ed in human serum.Following informed consent (Western IRB BIO 001), serum was isolated from MM patients and analyzed with a BCMA enzyme-linked immunosorbent assay. Values represent the mean of triplicate experiments. The testing results showed the serum BCMA levels from newly diagnosed MM patients (n = 58) was much higher (13.26 ng/ml) than among age-matched healthy subjects (n = 45; median 2.57 ng/ml; P < 0.0001) and monoclonal gammopathy of undetermined signifi cance (MGUS) subjects (n = 25; median 4.43 ng/ml; P = 0.002). Notably, protein levels were much higher among patients with relapsed or refractory disease (n = 88; median 18.99 ng/ml) compared to those with responsive (> partial response) disease (n = 95; median 3.48 ng/ml; P = 0.0016). Following treatment, patients with responsive disease showed decreases in BCMA levels whereas those with progressive disease showed increases. Additionally, with a median follow-up of 8 months (range, 0 - 83 months), MM patients (n = 193) with BCMA levels above the median (8.43 ng/ml) showed a shortened survival compared to those with amounts below the median concentration (P < 0.0001). Our human MM xenograft (LAGκ-2) was grown in SCID mice, and animals were treated with bortezomib (BORT) and cyclophosphamide (CY); tumor volume and BCMA levels were determined. Following treatment with BORT and CY, we also showed a marked decrease in tumor volume and serum human BCMA levels in mice bearing the MM LAGκ-2 xenograft whereas untreated animals showed marked increases in tumor size and serum BCMA. Statistical signifi cance of differences observed was

Cancer/Tumor Markers Tuesday, July 30, 9:30 am – 5:00 pm
CLINICAL CHEMISTRY, Vol. 59, No. 10, Supplement, 2013 A3
and be capable of distinguishing heterogeneous subtypes independent of EMT status.Materials: We have established a breast cancer cell line panel including all 4 of the breast cancer molecular subtypes including luminal, HER2, basal-like, and claudin-low. This model of 4 breast cancer cell lines was used to represent the heterogeneity in CTCs from a breast cancer patient and the plasticity in the EMT process. We have chosen to include 1 breast cancer cell line that does not express EpCAM (MDA-MB-231). The cell lines and their molecular subtypes include MCF-7 (luminal A), SK-Br-3 (HER2), MDA-MB-231 (claudin-low) and HCC1954 (basal-like) and each represents an identifi able subtype. 25,000 or 2,500 cells of each cell line were combined and then identifi ed using a combination of antibodies including HER2, EpCAM, and CD44. Experiments to determine separation effi ciency and percent recovery were performed on the BD Accuri C6 fl ow cytometer. Results: The specifi city (separation effi ciency) for each subtype was determined to be 67.3% ± 7.1 (±SE) (HCC1954), 91.7% ± 9.7 (MCF-7), 57.3% ± 8.7 (MDA-MB-231), and 100% ± 19.0 (MCF-7). The overall separation effi ciency was determined to be 79.4 ± 5.9% (± SE). Spiking experiments of a single mesenchymal cell line that does not express EpCAM were conducted in whole human blood, and a sensitivity (percent recovery) of 84.9 ± 14.6% (±SE) was achieved.Conclusion: High percent recovery of a spiked mesenchymal breast cancer cell line into whole blood was achieved. This method isn’t limited to cells that express EpCAM so CTCs that have undergone EMT are able to be detected. The combination of antibodies has high separation effi ciency with 2 of the 4 cell lines. Enrichment processes and antibody selection are being optimized to improve specifi city of all 4 subtypes. This data indicates that phenotypically diverse CTCs are capable of being subtyped and characterized. Subtype characterization will allow therapies to be individually tailored to address each patient’s own CTCs. Support: P30ES014443 and T32ES011564
A-09
SAP155-mediated c-myc suppressor FBP-interacting repressor splicing variants as colon cancer screening biomarkers
K. Matsushita, S. Itoga, F. Nomura. Chiba University Graduate School of Medicine, Chiba, Japan
Background: The c-myc transcriptional suppressor, FUSE-binding protein (FBP)-interacting repressor (FIR), is alternatively spliced in colorectal cancer tissue. Recently, the knockdown of SAP155 pre-mRNA-splicing factor, a subunit of SF3b, was reported to disturb FIR pre-mRNA splicing and yielded FIRΔexon2, an exon2-spliced variant of FIR, which lacks c-myc repression activity. Methods: The expression levels of FIR variant mRNAs were examined in the peripheral blood of colorectal cancer patients and healthy volunteers to assess its potency for tumor detection. As expected, circulating FIR variant mRNAs in the PB of cancer patients were signifi cantly overexpressed compared to that in healthy volunteers. Results: In this study, novel splicing variants of FIRs, Δ3 and Δ4, were also generated by SAP155 siRNA and those variants were also found to be activated in human colorectal cancer tissue. In particular, the area under the receiving operating characteristic curve of FIRs FIRΔexon2 or FIRΔexon2/FIR was greater than those of conventional carcinoembryonic antigen (CEA) or carbohydrate antigen 19-9 (CA19-9). In addition, FIRΔexon2 or FIR mRNA expression in the peripheral blood was signifi cantly reduced after operative removal of colorectal tumors.Conclusion: Circulating FIR and FIRΔexon2 mRNAs are potential novel screening markers for colorectal cancer testing with conventional CEA and CA19-9. Our results indicate that overexpression of FIR and its splicing variants in colorectal cancer directs feed-forward or addicted circuit c-myc transcriptional activation. Clinical implications for colorectal cancers of novel FIR splicing variants are also discussed.
determined using a Student’s t test and analysis was determined using GraphPad prism software. In conclusion, this is the fi rst study to show the elevation of serum BCMA in patients with MM and levels correlated with the change in tumor volume in response to treatment with cyclophosphamide and bortezomib. We propose that BCMA may be a new serum biomarker for patients with MM, and is useful to determine prognosis and monitor the course of their disease.
A-05
PSA Enzymatic Activity: A New Biomarker for Assessing Prostate Cancer Aggressiveness
D. Georganopoulou1, M. Ahrens1, P. Bertin1, E. Vonesh2, T. J. Meade3, W. J. Catalona3. 1Ohmx Corporation, Evanston, IL, 2Vonesh Statistical Consulting, Libertyville, IL, 3Northwestern University, Chicago, IL
Background and objectives: The recent increase in prostate-specifi c antigen (psa) screening rates coupled with improved detection methods have caused a controversial upsurge in the number of men undergoing prostate biopsy and subsequent treatment. However, current diagnostic techniques generally suffer from limited ability to identify which seemingly indolent prostate cancers (pca) are biologically aggressive. We set out to determine if pca aggressiveness is associated with psa enzymatic activity in ex vivo prostatic fl uid.Methods: We collected prostatic fl uid from 778 post-radical prostatectomy specimens and randomly selected samples from both the clinically confi rmed aggressive (n = 50) and non-aggressive (n =50) prostate cancer populations for our initial pilot study. In a blind study, we measured the level of proteolytic enzyme activity of psa (apsa) in each sample using a fl uorogenic peptide probe and used receiver operating characteristic (roc) analysis to correlate apsa levels with prostate cancer aggressiveness.Results: We observed that the clinically non-aggressive population had a signifi cantly higher apsa value (mean = 865μg/ml; median = 654μg/ml) than the clinically aggressive population (mean = 518μg/ml; median = 449μg/ml), meaning there is a negative association of apsa with cancer aggressiveness. We performed a roc analysis appropriate for an unmatched case control study to assess the highest diagnostic effect for predicting aggressive pca. Among factors considered, apsa and the normalized ratio of apsa/serum tpsa (rpsa) had the highest discriminatory power for predicting the presence of aggressive pca. We calculated an area under the curve (auc) of 0.7008 [95% ci: (0.5986, 0.8030)] for apsa and 0.7784 [95% ci: (0.6880, 0.8688)] for rpsa with the latter being signifi cantly higher (p-value = 0.0300 based on a chi-square test).Conclusions: Our results show a signifi cant correlation between pca progression and apsa in prostatic fl uid. We found the range of measured apsa for aggressive cases was 94 - 1220 μg/ml while non-aggressive cases ranged from 207 - 2626 μg/ml within our pilot study. Within the non-aggressive group, there were 11 samples whose apsa values (1238 - 2626 μg/ml) were greater than the highest apsa value measured within the aggressive cohort (1220 μg/ml). Using apsa as an aggressiveness biomarker could result in many (22% in our study population) of the patients diagnosed with non-aggressive pca being able to avoid or delay radical prostatectomy.Source of funding: national institutes of health (grant #1r43ca156786-01).
A-06
A Highly Sensitive and Specifi c Method for Characterization of Circulating Tumor Cell Subtypes in Breast Cancer Patients
L. Millner, K. Goudy, T. Kampfrath, M. Linder, R. Valdes. University of Louisville, Louisville, KY,
Introduction: Circulating tumor cells (CTCs) are cells that detach from the primary tumor, intravasate into the bloodstream, invade distant tissues and produce metastatic lesions. In breast cancer patients, enumeration of CTCs in blood is used as an adjunct to assist in predicting overall survival and in clinical management. However, CTCs are phenotypically heterogeneous and the methods now available for counting these cells are based on detection of the epithelial marker, Epithelial Cell Adhesion Molecule (EpCAM). Present methods do not distinguish subtypes and only detect epithelial-type CTCs. This is signifi cant because CTCs are known to experience epithelial to mesenchymal transition (EMT), a process that results in increased motility and is associated with diease progression. Following EMT, a CTC may no longer express epithelial markers such as EpCAM and evade detection by current methods.Objective: To establish a model using heterogeneous breast cancer cell lines and a method for capturing and characterizing distinct CTC subsets. This method should have high separation effi ciency of subtypes, high recovery in spiked blood samples,
Tuesday, July 30, 9:30 am – 5:00 pm Cancer/Tumor Markers
A4 CLINICAL CHEMISTRY, Vol. 59, No. 10, Supplement, 2013
Results: The calibration range of the Lumipulse HE4 was 0 - 2,000 pmol/L and showed a linear dose-response relationship (y = 332.1x + 7366.8; R2 = 0.9993) within the calibration range. An imprecision study (16 days) showed a total imprecision of ≤ 10.5% with 7 human sera and plasma, 2 controls and 3 panels. The Lumipulse HE4 correlated linearly with HE4 EIA (Slope = 0.96; r = 0.99) within the range of 30.4 and 794 pmol/L via testing 61 samples (serum, K2 EDTA plasma, Li Heparin plasma, Na Heparin plasma and Na EDTA plasma). The high hook effect study showed that the signals of sera and plasma (N = 2) spiked with > 300,000 pmol/L of HE4 antigen were all greater than that for the Cal F. The spike recovery study generated an acceptable mean difference of ≤ 10% for the sera and plasma (N = 3) spiked with > 120 - 1500 pmol/L, versus unspiked samples. In the interference studies, seven (7) endogenous substances spiked individually into sera and plasma (N = 2) were tested at the following levels (≥): 1,000 IU/mL HAMA (human anti-mouse antibody), 750 IU/mL RF (rheumatoid factor), 20 mg/dL conjugated bilirubin, 20 mg/dL unconjugated bilirubin, 3 g/dL triglyceride, 500 mg/dL hemoglobin and two levels of human serum albumin (3 and 12 g/dL). The average percent difference of HE4 concentrations between the individually spiked samples and the unspiked samples were all within the acceptable range of ≤ 10% of the unspiked samples.Conclusion: The Lumipulse HE4 assay under development appears to be an accurate and precise assay for the automated measurement of HE4 in human serum and plasma.
A-12
Metabolomic Investigation of Urinary Biomarkers for Hepatocellular Carcinoma in a Hepatitis C Positive Population
W. Baker1, J. Petersen2, H. Spratt3. 1Department of Preventive Medicine and Community Health, UTMB, Galveston, TX, 2Department of Pathology, UTMB, Galveston, TX, 3Department of Preventive Medicine and Community Health, Institute for Translational Sciences, and Department of Biochemistry and Molecular Biology, UTMB, Galveston, TX
Hepatocellular carcinoma (HCC), the third most common cause of cancer mortality worldwide, has a fi ve year survival rate of less than 5% partly due to the lack of an effective biomarker screening panel. Diagnosis is established by contrast agent-assisted MRI or CT imaging which can detect tumors approaching 2-cm in diameter and by monitoring of serum alpha-fetoprotein levels. In the USA, hepatitis C viral (HCV) infection and associated advanced liver fi brosis are the predominant risk factors for the onset of HCC, with cancer occurring at a rate of 2-8% per year in HCV-positive cirrhotic patients. The high rate of neoplastic conversion in cirrhotic patients, combined with the diffi culty of diagnostic imaging of the cirrhotic liver, underscores the need for new clinical strategies for early HCC detection.The objective of this investigation is the discovery of urinary metabolic biomarkers characteristic for hepatocellular carcinoma in HCV-positive individuals. Urine samples were obtained from 36 HCC/HCV patients all sharing a Batts-Ludwig fi brosis stage of 4 (cirrhosis) and 63 HCV-positive individuals having the following distribution of fi brosis staging: stage 0 (no fi brosis) - 6 patients, stage 1 (portal fi brosis without septa) - 30 patients, stage 2 (portal fi brosis with septa) - 17 patients, stage 3 (septal fi brosis without cirrhosis) - 4 patients, stage 4 (cirrhosis) - 6 patients. The samples were prepared in phosphate buffer, referenced to trimethylsilyl propanoic acid, and examined by 1H NOESY (with water signal pre-saturation) NMR spectroscopy. The spectra were processed and analyzed for neoplasia-indicative metabolites using Chenomx NMR Suite. Boxplot analysis of the profi led targeted analyte data showed that a log2 data transformation provided a normalized data distribution and minimized the statistical impact of metabolic outliers. Student’s t-test analysis of the log2 transformed targeted data revealed eighteen signifi cant HCC-associated metabolites (p-value < 0.05) when compared to the heterogeneous fi brosis stage HCV sample pool. Multivariate Adaptive Regression Splines (MARS) analysis on the signifi cant metabolites yielded an 11 member panel having a predictive accuracy for the HCC patients of 94%. The MARS analysis revealed that glycerol, dimethylamine, quinolinate, methylnicotinamide, ferulate, ethanolamine, tyrosine, and cis-aconitate were the most discriminating HCC-associated metabolites, in order of decreasing contribution, and that all of these metabolites were elevated in concentration relative to the HCV-only pool. To determine whether fi brosis stage differences between the HCV and HCC sample pools was responsible for the MARS HCC metabolite panel, a comparison was done between the early fi brosis stage HCV samples (stages 0 and 1 - 36 patients) and late fi brosis stage HCV samples (stages 2, 3, and 4 - 27 patients). Student’s t-test analysis detected no signifi cant (p-value < 0.05) metabolite variation between the two sample groups. Further comparison of the late stage fi brosis HCV samples (FS 2, 3, and 4) against the HCC group (FS 4) showed minimal deviation from the combined early and late fi brosis stage HCV-based HCC biomarker panel
A-10
CA19.9 profi le in samples predating pancreatic cancer diagnosis - nested case control study in the UK Collaborative Trial of Ovarian Cancer Screening (UKCTOCS).
W. Alderton1, S. Apostolidou2, M. Fisher1, A. Flynn3, A. Gentry- Maharaj2, C. Hodkinson1, I. Jacobs4, U. Menon2, A. Ryan2, N. Sandanayake2, J. Timms2, J. Barnes1. 1Abcodia Ltd, London, United Kingdom, 2University College London, London, United Kingdom, 3Exploristics Ltd, London, United Kingdom, 4University of Manchester, Manchester, United Kingdom
Background: Pancreatic cancer is the fi fth most common cause of cancer death and has a 5-year survival rate of only 3%. It often has a very poor prognosis since it is commonly not diagnosed until it is at an advanced stage and the cancer has metastasized. CA19.9 is the most widely used biomarker as an aid to the clinical diagnosis of pancreatic cancer. There are currently no screening methods for the early detection of pancreatic cancer. We explore CA19.9 levels prior to diagnosis of pancreatic ductal adenocarcinoma in a nested case control study set within UKCTOCS (1). The trial cohort of >202,000 apparently healthy postmenopausal women donated a single serum at recruitment. 50,000 women continued to donate serum samples annually. Samples were stored at -180oC. Cancer registry and postal follow up ensured that all women diagnosed with cancer following trial recruitment were identifi ed.Methods: UKCTOCS volunteers provided detailed lifestyle and health data on entry and mid-way through the trial and further data on their cancer diagnosis was obtained from their treating clinician. Cancer registration data was provided by the UK NHS Information Centre. Serum CA19.9 concentrations were determined in duplicate by electrochemiluminescence immunoassay on a Roche Elecsys 2010 system. A Student’s t-test was used to assess the signifi cance of assay results comparing cases and controls (p<0.05), whilst Receiver Operating Characteristic (ROC) curves were constructed to determine performance of CA19.9 at pre-diagnosis timepoints.Results: 56 women with primary pancreatic ductal adenocarcinoma (cases) with a total of 270 samples annual samples up to 8 years pre-diagnosis were identifi ed and matched 5:1 (controls:cases) with controls who had no history of cancer. The mean CA19.9 value in controls was 11.1 U/ml. The longitudinal values of CA19.9 levels across cases included levels below the clinically accepted cut-off (37 U/ml).The CA19.9 values were signifi cantly different between cases and controls at 0-1 years (p<0.0001) and 1-2 years (p<0.043) pre-diagnosis, but not at earlier pre-diagnosis timepoints. The ROC AUC at 0-1 years pre-diagnosis was 0.81 (60% sensitivity; 90% specifi city) and 1-2 years pre-diagnosis was 0.71 (43% sensitivity; 90% specifi city).Conclusion: The prospective biobank derived from UKCTOCS represents a valuable collection of pre-diagnosis pancreatic cancer serum samples. The availability of samples in the years leading up to diagnosis, offers a unique opportunity for discovery and validation of novel, screening serum biomarkers for the early detection of pancreatic cancer. The longitudinal increase in CA19.9 up to 2 years preceding diagnosis highlights the value of such assessments. While CA19.9 used alone may be limited as a screening marker, its combination with other biomarkers may afford some utility for the early diagnosis of pancreatic cancer.(1) Menon et al BMJ 2008, 337:a2079
A-11
Feasibility of an Assay for HE4 on Lumipulse System
J. Young, K. Konko, M. Fujiki, E. Riedel, K. He, Z. Li, T. Kettlety, G. Barnes. Fujirebio Diagnostics Inc., Malvern, PA
Background: HE4 (human epididymis protein 4) is a secreted glycoprotein belonging to the family of whey acidic four-disulfi de core (WFDC) proteins. HE4 has been widely reported as a biomarker for ovarian cancer. An assay for HE4 is being developed on the Lumipulse platforms (Lumipulse HE4). Analytical and patient sample testing of this assay is presented.Methods: Lumipulse HE4 is a chemiluminescent enzyme immunoassay (CLEIA) that uses a two-step method for analysis. In the fi rst step, anti-HE4 monoclonal antibody 2H5-coated magnetic particles are incubated with a patient sample. Following a wash, the alkaline phosphatase-conjugated anti-HE4 mAb 12A2 are added to the mixture and incubated in the second step. Following another wash, the instrument adds substrate solution to initiate chemiluminescence reactions. The resulting reaction signals are proportional to the amount of HE4 in the sample and allow a quantitative determination of HE4 in serum and plasma.
Cancer/Tumor Markers Tuesday, July 30, 9:30 am – 5:00 pm
CLINICAL CHEMISTRY, Vol. 59, No. 10, Supplement, 2013 A5
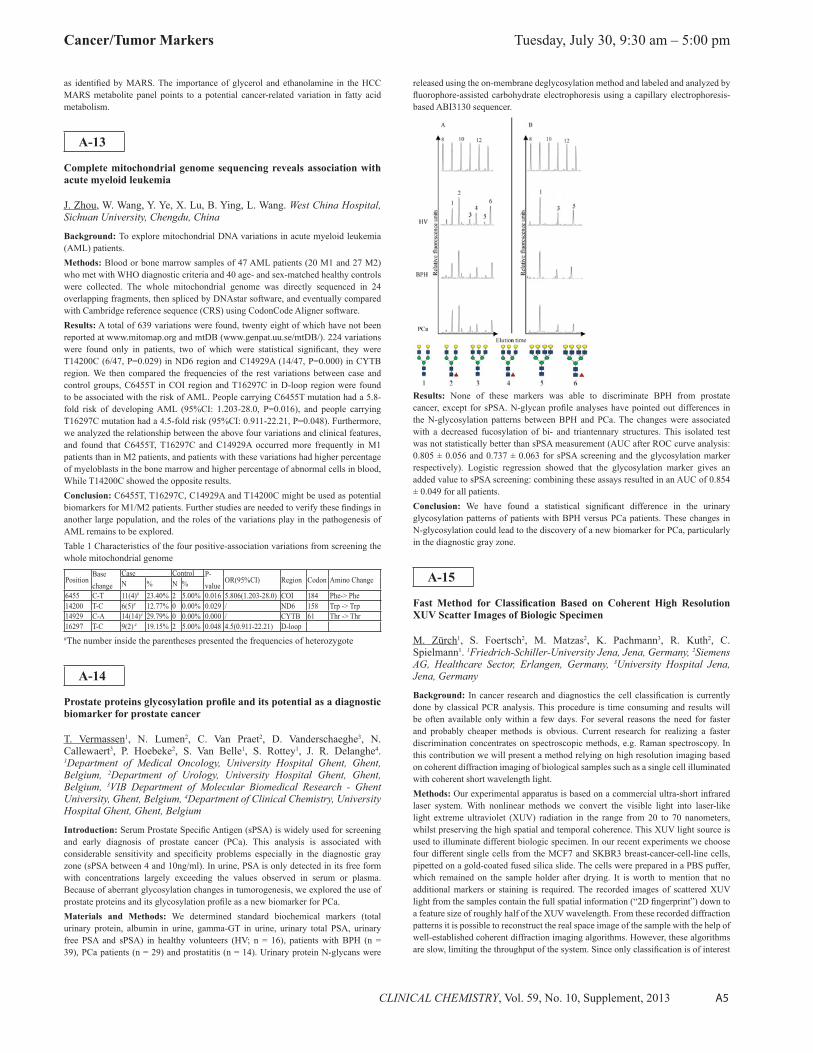
released using the on-membrane deglycosylation method and labeled and analyzed by fl uorophore-assisted carbohydrate electrophoresis using a capillary electrophoresis-based ABI3130 sequencer.
Results: None of these markers was able to discriminate BPH from prostate cancer, except for sPSA. N-glycan profi le analyses have pointed out differences in the N-glycosylation patterns between BPH and PCa. The changes were associated with a decreased fucosylation of bi- and triantennary structures. This isolated test was not statistically better than sPSA measurement (AUC after ROC curve analysis: 0.805 ± 0.056 and 0.737 ± 0.063 for sPSA screening and the glycosylation marker respectively). Logistic regression showed that the glycosylation marker gives an added value to sPSA screening: combining these assays resulted in an AUC of 0.854 ± 0.049 for all patients.Conclusion: We have found a statistical signifi cant difference in the urinary glycosylation patterns of patients with BPH versus PCa patients. These changes in N-glycosylation could lead to the discovery of a new biomarker for PCa, particularly in the diagnostic gray zone.
A-15
Fast Method for Classifi cation Based on Coherent High Resolution XUV Scatter Images of Biologic Specimen
M. Zürch1, S. Foertsch2, M. Matzas2, K. Pachmann3, R. Kuth2, C. Spielmann1. 1Friedrich-Schiller-University Jena, Jena, Germany, 2Siemens AG, Healthcare Sector, Erlangen, Germany, 3University Hospital Jena, Jena, Germany
Background: In cancer research and diagnostics the cell classifi cation is currently done by classical PCR analysis. This procedure is time consuming and results will be often available only within a few days. For several reasons the need for faster and probably cheaper methods is obvious. Current research for realizing a faster discrimination concentrates on spectroscopic methods, e.g. Raman spectroscopy. In this contribution we will present a method relying on high resolution imaging based on coherent diffraction imaging of biological samples such as a single cell illuminated with coherent short wavelength light.Methods: Our experimental apparatus is based on a commercial ultra-short infrared laser system. With nonlinear methods we convert the visible light into laser-like light extreme ultraviolet (XUV) radiation in the range from 20 to 70 nanometers, whilst preserving the high spatial and temporal coherence. This XUV light source is used to illuminate different biologic specimen. In our recent experiments we choose four different single cells from the MCF7 and SKBR3 breast-cancer-cell-line cells, pipetted on a gold-coated fused silica slide. The cells were prepared in a PBS puffer, which remained on the sample holder after drying. It is worth to mention that no additional markers or staining is required. The recorded images of scattered XUV light from the samples contain the full spatial information (“2D fi ngerprint”) down to a feature size of roughly half of the XUV wavelength. From these recorded diffraction patterns it is possible to reconstruct the real space image of the sample with the help of well-established coherent diffraction imaging algorithms. However, these algorithms are slow, limiting the throughput of the system. Since only classifi cation is of interest
as identifi ed by MARS. The importance of glycerol and ethanolamine in the HCC MARS metabolite panel points to a potential cancer-related variation in fatty acid metabolism.
A-13
Complete mitochondrial genome sequencing reveals association with acute myeloid leukemia
J. Zhou, W. Wang, Y. Ye, X. Lu, B. Ying, L. Wang. West China Hospital, Sichuan University, Chengdu, China
Background: To explore mitochondrial DNA variations in acute myeloid leukemia (AML) patients.Methods: Blood or bone marrow samples of 47 AML patients (20 M1 and 27 M2) who met with WHO diagnostic criteria and 40 age- and sex-matched healthy controls were collected. The whole mitochondrial genome was directly sequenced in 24 overlapping fragments, then spliced by DNAstar software, and eventually compared with Cambridge reference sequence (CRS) using CodonCode Aligner software.Results: A total of 639 variations were found, twenty eight of which have not been reported at www.mitomap.org and mtDB (www.genpat.uu.se/mtDB/). 224 variations were found only in patients, two of which were statistical signifi cant, they were T14200C (6/47, P=0.029) in ND6 region and C14929A (14/47, P=0.000) in CYTB region. We then compared the frequencies of the rest variations between case and control groups, C6455T in COI region and T16297C in D-loop region were found to be associated with the risk of AML. People carrying C6455T mutation had a 5.8-fold risk of developing AML (95%CI: 1.203-28.0, P=0.016), and people carrying T16297C mutation had a 4.5-fold risk (95%CI: 0.911-22.21, P=0.048). Furthermore, we analyzed the relationship between the above four variations and clinical features, and found that C6455T, T16297C and C14929A occurred more frequently in M1 patients than in M2 patients, and patients with these variations had higher percentage of myeloblasts in the bone marrow and higher percentage of abnormal cells in blood, While T14200C showed the opposite results.Conclusion: C6455T, T16297C, C14929A and T14200C might be used as potential biomarkers for M1/M2 patients. Further studies are needed to verify these fi ndings in another large population, and the roles of the variations play in the pathogenesis of AML remains to be explored.Table 1 Characteristics of the four positive-association variations from screening the whole mitochondrial genome
PositionBase change
Case Control P-value
OR(95%CI) Region Codon Amino ChangeN % N %6455 C-T 11(4)# 23.40% 2 5.00% 0.016 5.806(1.203-28.0) COI 184 Phe-> Phe14200 T-C 6(5)# 12.77% 0 0.00% 0.029 / ND6 158 Trp -> Trp14929 C-A 14(14)# 29.79% 0 0.00% 0.000 / CYTB 61 Thr -> Thr16297 T-C 9(2) # 19.15% 2 5.00% 0.048 4.5(0.911-22.21) D-loop#The number inside the parentheses presented the frequencies of heterozygote
A-14
Prostate proteins glycosylation profi le and its potential as a diagnostic biomarker for prostate cancer
T. Vermassen1, N. Lumen2, C. Van Praet2, D. Vanderschaeghe3, N. Callewaert3, P. Hoebeke2, S. Van Belle1, S. Rottey1, J. R. Delanghe4. 1Department of Medical Oncology, University Hospital Ghent, Ghent, Belgium, 2Department of Urology, University Hospital Ghent, Ghent, Belgium, 3VIB Department of Molecular Biomedical Research - Ghent University, Ghent, Belgium, 4Department of Clinical Chemistry, University Hospital Ghent, Ghent, Belgium
Introduction: Serum Prostate Specifi c Antigen (sPSA) is widely used for screening and early diagnosis of prostate cancer (PCa). This analysis is associated with considerable sensitivity and specifi city problems especially in the diagnostic gray zone (sPSA between 4 and 10ng/ml). In urine, PSA is only detected in its free form with concentrations largely exceeding the values observed in serum or plasma. Because of aberrant glycosylation changes in tumorogenesis, we explored the use of prostate proteins and its glycosylation profi le as a new biomarker for PCa.Materials and Methods: We determined standard biochemical markers (total urinary protein, albumin in urine, gamma-GT in urine, urinary total PSA, urinary free PSA and sPSA) in healthy volunteers (HV; n = 16), patients with BPH (n = 39), PCa patients (n = 29) and prostatitis (n = 14). Urinary protein N-glycans were

Tuesday, July 30, 9:30 am – 5:00 pm Cancer/Tumor Markers
A6 CLINICAL CHEMISTRY, Vol. 59, No. 10, Supplement, 2013
A-17
Optimization of Cancer Cell Photothermal Therapy via Nuclear Delivery of Surface Modifi ed Au Nanoparticles
T. Curry1, W. Qian2, Y. Che2, R. Kopelman1. 1University of Michigan, Ann Arbor, MI, 2IMRA America, Inc., Ann Arbor, MI
Background: Gold nanoparticle-mediated photothermal therapy (PTT) is advantageous over other forms of NP mediated PTT, primarily due to its ability to take advantage of the so called “therapeutic window” in which one utilizes near-infrared (NIR) radiation to excite the gold nanoparticles (Au NPs) and induce thermolysis in cells, as well as due to their non-toxicity. At these wavelengths, approximately between 600-1000nm, tissues exhibit low absorption and scattering of the incident radiation, leading to the majority of the incident radiation being converted into heat energy within the cells. Femtosecond laser ablation generated Au NPs, with no inherent toxicity (due to their virgin surfaces), biocompatibly surface modifi ed for optimal delivery to the cancer cell nuclei, were tailor made for PTT. The objective of the study was to investigate the numerous, probable advantages of directly heating the nuclei of the cancer cells, due to (1) the smaller target volume, (2) lower heat capacity and (3) direct damage to the cell’s DNA (located in nucleus).Methods: Targeted delivery of gold nanoparticles into the cancer cell nucleus was achieved through the use of three peptides as targeting molecules. The gold nanoparticles were conjugated with poly(ethylene glycol) (PEG 5K), (RGD)4 peptides and nuclear localization signal (NLS) peptides, respectively for (1) colloidal stability, (2) cancer-cell selective delivery and (3) nucleus-specifi c delivery. Nuclear delivery was confi rmed using both light and transmission electron microscopies. Cells incubated with the targeted Au NPs were treated with varying NP concentrations and monitored using a Leica confocal microscope (fl uence of 1.64 J/cm2 during treatment) so as to characterize the effectiveness of the PTT.Results: A stark difference in treatment effi cacy was observed when the PTT was mediated by gold nanoparticles within the nucleus compared to when the nanoparticles remained in the cytosol. When the gold nanoparticles were modifi ed to include NLS, a peptide that facilitates nuclear uptake, irreparable damage was caused and effi cient cell death was observed for various concentrations (100pM, 500pM, & 1nM) after 40 minutes of light irradiation. Nearly complete cell death was observed within 3 hours for cells incubated with 500pM. In contrast, the maximum treatment effi cacy, achieved for cancer cells that were treated with Au NPs that could not enter the nucleus, was much lower: 12 hours post-treatment, cells incubated with 500pM showed 40-50% of them remaining alive. Studies to explore the concentration dependent uptake and compartmentalization of the Au NPs and of the resulting effect on the PTT effi cacy were also conducted.Conclusions: This systematic study demonstrated the increase in PTT effi cacy (i.e. lower required dosage) when the Au NPs are targeted and effi ciently delivered to the cancer cell nucleus. These fi ndings are expected to contribute to current clinical applicationsinvolving gold nanoparticle-mediated PTT by improving on current limitations (e.g. dose, treatable tumor size, light penetration) and informing new approaches to clinical methodology.
A-19
Comparison of the performance of Freelite® and N Latex in screening for hematological disorders in hospital referral patients
D. Sutton1, L. Adie2, H. Sharrod2, S. J. Harding2, A. Seetharam1, A. Macwhannell1, A. Jacob1, S. Handa1, S. Basu1. 1The Royal Wolverhampton Hospitals NHS Trust, Wolverhampton, United Kingdom, 2The Binding Site Group Ltd, Birmingham, United Kingdom
Introduction: Serum free light chain (FLC) testing, utilizing the polyclonal mutli-epitope antibody based Freelite® assay is a valuable aid in the diagnosis of hematological disorders, and can improve light chain and oligosecretory myeloma detection and confi rm equivocal SPEP results. This is highlighted by the assays recent inclusion in the international myeloma working group guidelines. Recently a monoclonal single epitope antibody based N Latex assay has been developed for measuring serum FLC levels. Here we compare the performance of the two assays for screening hospital referral patients.Methods: Results for both assays were available for 390/1468 hospital referral patients (median age 65 years (range 19-100), male/female 168/222). The patients were screened for hematological disorders using SPEP and FLC. The levels of FLC
and not the actual image of the object, we studied and compared the scattering images of the mentioned cells directly and developed mathematical methods to identify the specimen. As a powerful and rather fast method, we opted for calculating the 2D cross-correlation of the scattering images.Results: As not entirely expected, the calculated peak values of the 2D cross-correlations of the four recorded scatter images already allow the identifi cation of the different cell types. This is even more surprising, because the method is insensitive to the actual orientation of the cells on the substrate. 2D cross-correlation is only able to distinguish between shifts of the same image and not for rotation. Nevertheless we will work on the implementation of more sophisticated image comparison techniques, known from fi ngerprint or face detection, allowing a more reliable identifi cation of different cells.Conclusion: We have demonstrated a fast method for comparing scatter images from biologic specimens. We have been able to identify the cell types without extensive preparation methods such as staining. For further exploration of this method, we will implement more sophisticated image comparison techniques for classifying a wider variety of cells. It is also worth to mention the method is not limited to cells, but could also be applied to e.g. bacteria or viruses.
A-16
Correlation between circulating tumor cells (CTC) counts and serum breast cancer tumor markers CA 27.29 and CEA levels and their value in time to progression (TTP) prediction in the metastatic breast cancer (MBC) patients under therapy.
D. M. Iancu, J. Becker, A. Hutson, C. Stone, B. Lynch, J. Citron, N. Watroba. Roswell Park Cancer Institute, Buffalo, NY
Metastatic breast cancer (MBC) is the main cause of death from breast cancer. Treatment is palliative, but newer therapies have improved survival. Current evaluation methods remain inadequate for assessment of prognosis.CTC detection in blood by CellSearch® technology (Veridex, Raritan NJ, USA) is reported to be a prognostic and predictive marker in MBC. The presence of ≥ 5 CTCs in 7.5mL of blood in women with MBC is associated with shorter progression free survival (PFS). Serum tumor markers CA 27.29 and CEA are used for monitoring therapy in MBC. Few studies have looked at the correlation of CTC and tumor markers in MBC. This study is an IRB approved existing data review evaluating the correlation between CTC, CA 27.29 and CEA and how they predict time to progression when used separately or together. Additionally, it was asked whether values higher than 5 CTC would increase risk of progression of MBC. Data from Jan.2011 to Nov 31, 2012 was collected for patients with MBC when CTC, CA 27.29 and CEA were performed. 84 CTC events were identifi ed (N=17 range 1-13, median 5). The estimated median time to progression was 84 days. Time to progression was assessed based on imaging progression indicated in clinical notes. Serum levels of CA 27.29 and CEA are measures using automated chemiluminescent immunoassays on the Advia Centaur instrument (Bayer Diagnostics, East Walpole, MA). The Spearman rank correlation between baseline CTC and CA 27.29 was r = 0.30 (low). The rank correlation between baseline CTC and CEA was 0.23 (weak) and the rank correlation between baseline CA 27.29 and CEA was 0.53 (moderate).The association between CTC, CA 27.29, CEA values and change in the risk of disease progression was evaluated over time via a Cox regression model allowing for time-varying covariates in both univariate and multivariate models. For CTC the cut-off of 5 (<5 or ≥5) and 25 (<25 vs. ≥25) were used. For CA 27.29 and CEA the upper quartile values were used as cut-offs to distribute the number of events. Due to the small number of events the CTC cut-off of 5 was not able to be modeled. The hazard ratios (HR) in the univariate models for CTC (<25, ≥25), CA 27.29 (<273, ≥ 273) and CEA (<13, ≥ 13) were HR=11.2, p=0.002, HR=2.3, p=0.26, HR=2.3, p=0.17 interpreted that once CTC counts elevates over a 25 value, one’s relative risk of progression is 11.2 times higher than for lower CTC counts. Both CA 27.29 and CEA have a HR of 2.3 but p>0.05, so they would not increase the risk of disease progression. In the multivariate Cox model for CTC (<25, ≥25) and CA 27.29 (<273, ≥ 273) both were signifi cant (HR=14.2, p=0.001 and HR=4.5, p=0.046) with a substantially elevated risk of progression (HR=63.8, p=0.0005)CTC counts >25 are associated with an increased risk of progression. CTC and CA 27.29 provide co-information for elevated risk of progression. CA 27.29 and CEA levels behave similarly. All three markers are worth pursing in a prospective study.

Cancer/Tumor Markers Tuesday, July 30, 9:30 am – 5:00 pm
CLINICAL CHEMISTRY, Vol. 59, No. 10, Supplement, 2013 A7
A-21
Validation of an automated immunoassay for the quantitative measurement of hemoglobin in stool
J. Lu1, S. Clinton2, D. G. Grenache2. 1ARUP Laboratories, Salt Lake City, UT, 2University of Utah, Salt Lake City, UT
Background: Fecal occult blood (FOB) has clinical utility as a colorectal cancer (CRC) screening test and has been shown to signifi cantly reduce CRC mortality. Immunochemical detection of FOB (iFOB) is considered to be superior to guaiac tests, the latter of which are prone to false-positive results. iFOB requires no patient preparation or dietary restrictions before collection and is specifi c for human hemoglobin A (HbA).Objective: To validate the OC-Auto Micro 80 (Polymedco Inc. Cortlandt Manor, NY) immunoassay for the detection and measurement of HbA in stool.Methods: In accordance with manufacturer instructions, residual patient stool samples were extracted with a stabilizing buffer and the sample added to latex particles coated with anti-human HbA antibodies. Any HbA present in the sample binds to the beads resulting in an agglutination reaction and the change in optical density is directly proportional the HbA concentration. Analytical characteristics including linearity, precision, analytical sensitivity, analyte stability, and accuracy were determined.Results: Linearity was determined by adding diluted, lysed whole blood (HbA 16-909 ng/mL) to a set of fi ve HbA-negative stool samples and testing each sample in 3 replicates. Linear regression analysis produced a slope of 0.911 and a y-intercept of -3.84. Precision was assessed by adding diluted, lysed whole blood to HbA-negative stool samples to prepare a set of 3 samples with different HbA concentrations. Each sample was tested in 3 replicates once per day for 10 days. Within-laboratory CVs were 14.1, 13.5 and 25.4% at HbA concentrations of 549.1, 93.9 and 33.6 ng/mL, respectively. The limit of blank was determined to be 1.0 ng/mL by measuring sample buffer in 10 replicates. Stability of stool samples in stabilizing buffer was evaluated by determining HbA in two sample pools with mean HbA concentrations of 559 and 98 ng/ml at time 0, stored at ambient temperature and at 4 °C for 14 and 29 days, respectively, and then tested in two replicates. In both pools, the change in HbA concentration was within 15% compared to time 0. 20 samples were tested for iFOB and by guaiac testing. 90% (9/10) of guaiac-negative samples had no detectable HbA by iFOB and 10% (1/10) had an HbA concentration of 517 ng/mL. 100% (10/10) of guaiac-positive samples had HbA detected by iFOB (range, 420-2,078 ng/mL). Recovery was evaluated by adding diluted, lysed whole blood to HbA-negative stool samples and the recoveries were 93 and 94% at the mean HbA concentrations of 465 (n=4) and 94 (n=4) ng/mL.Conclusion: We have validated an automated immunoassay for the measurement of fecal occult blood that provides high accuracy and specifi city for HbA and does not require special dietary restrictions prior to sample collection.
A-22
Comparison of the analytical performance of polyclonal and monoclonal antibody based FLC assays in refractory multiple myeloma patients
S. J. Harding1, R. Popat2, O. Berlanga1, H. Sharrod1, J. Cavenagh2, H. Oakervee2. 1The Binding Site Ltd, Birmingham, United Kingdom, 2St Bartholomew’s Hospital, London, United Kingdom
Background: Current international guidelines for the identifi cation of B cell disorders recommend a screening algorithm of serum protein electrophoresis and serum free light chain (FLC) testing based upon the polyclonal, multi-epitope Freelite® assay. A new monoclonal antibody (single epitope) based assay, N Latex FLC (Siemens, Germany) has been developed for measuring serum FLC levels. Here, we compare the analytical performance of the two assays in a population of MM patients.Methods: Baseline sera from 91 refractory MM patients (26 IgGκ, 14 IgGλ, 5 IgAκ, 4 IgAλ, 3 biclonal, 2 LC only; 13 IFE negative; 24 IFE not available; 52 males; median age 62 years (30-85)) were analysed for FLC levels by Freelite and N Latex FLC on the BNTMII nephelometer (Siemens, Germany). Reported values were compared using Passing-Bablok (PB) and linear regression (R2) using Analyze-It software; an R2≥0.95 was considered to be identical analyte measurement in keeping with CLSI guidelines. FLC ratio normal range by Freelite: 0.26-1.65; by N Latex FLC: 0.31-1.56.Results: In 21 patients with normal kappa/lambda FLC ratios by both assays showed moderate correlation for kappa FLC (PB: 3.18+0.65x; R2=0.92), with poor correlation for lambda FLC (PB: 0.20+1.04x; R2=0.47). Similarly, in 47 patients with an abnormal
were analysed by Freelite assay (The Binding Site Group Ltd, UK; FLC ratio normal range 0.26-1.65) and N Latex assay (Siemens, Germany; FLC ratio normal range 0.31-1.56). The sensitivity and specifi city of both assays were compared.Results: Freelite and N Latex provided concordant information in 344/390 (88%) patients. 308/344 (89%) patients had normal FLC ratios by both assays (Freelite: median 0.7, range 0.26-1.57; N Latex: median 0.58, range 0.33-1.49). The remaining 36/344 (10%) patients had abnormal FLC ratios by both assays (Freelite: κFLC median 8.23, range 1.7-1531; λFLC median 0.01, range 0.0001-0.24; N Latex: κFLC median 3.88, range 1.84-191; λFLC median 0.01, range 0.0002-0.20). The clinical diagnoses of the 36 patients with abnormal FLC ratio by both assays were: 6 MM, 5 LCMM, 1 cryoglobulinemia, 4 lymphoma, 1 plasmacytoma and 19 MGUS patients.Freelite was abnormal and N Latex was normal in 19 patients with haematological disorders (Freelite: κFLC median ratio 2.31, range 1.66-4.82; λFLC median 0.17, range 0.03-0.25; N Latex: median 1.09, range 0.35-1.55). 14/19 of these patients were positive by SPEP (3 MM, 1 WM, 2 lymphoma, and 8 MGUS) and the remaining 5/19 patients were negative by both SPEP and N Latex (1 patient subsequently diagnosed with WM, 4 MGUS). In contrast, N Latex identifi ed 4 MGUS patients with positive SPEP and normal Freelite ratio (Freelite: median 0.75, range 0.65-0.95; N Latex: κFLC 1.88, λFLC median 0.15, range 0.12-0.28). Freelite was more sensitive and specifi c in identifying patients with hematological disorders and had a better positive (PPV) and negative (NPV) predictive value compared to N Latex (sensitivity 54% (95% CI 44-64%) v. 39% (CI 30-49%), specifi city 98% (CI 95-99%) v. 94% (CI 91-96%), PPV 89% (CI 78-95%) v. 70% (CI 56-81%), NPV 86% (CI 81-89%) v 81% (CI 77-85%); respectively).Discussion: In this study the Freelite assays had a greater sensitivity and specifi city to identify patients with hematological disorders. Furthermore, this data continues to support the requirement for further clinical evaluation of the N Latex test before it is used in routine practice and current guidelines for serum FLC measurement using N latex are not applicable at this time.
A-20
Development of automatic antigen excess detection parameters for immunoglobulin free light chain (Freelite®) assays on the Roche cobas® c501
M. D. Coley, H. D. Carr-Smith, D. J. Matters, S. J. Harding, P. J. Showell. The Binding Site Ltd, Birmingham, United Kingdom
International guidelines, based upon the Freelite® serum free light chain (FLC) assay recommends its use to aid in the diagnosis of patients with B cell disorders and to monitor patients with AL amyloidosis, non-secretory and light chain multiple myeloma. Immunoglobulin light chains are highly variable with over 480 different genetic combinations for lambda possible prior to antigen exposure. This inherent variability means there is possibility of antigen excess even in multi-epitope recognising polyclonal antibody based assays. Here we describe the development of automatic antigen excess protection for the Freelite assay (The Binding Site group Ltd) on the Roche cobas® c501. Reaction kinetics of monoclonal patient sera prone to antigen excess (5 kappa, mean c501 result 5,345.12mg/L, range 502.62-12,672.00mg/L, and 4 lambda, mean c501 result 4,046.5mg/L, range 1,590.00-6,213.00mg/L) and 4 normal blood donor sera (mean kappa 10.51mg/L, range 9.14-13.18mg/L; mean lambda 11.41mg/L, range 10.90-12.14; mean ratio 0.93, range 0.79-1.21) were analysed to set threshold limits. Samples in antigen excess were typifi ed by a high initial rate of reaction, which rapidly slowed as the detecting antibody became saturated (early delta OD 125.5, late delta OD 14.0). This is compared to non-antigen excess samples which showed a slower, more sustained rate of reaction throughout the assay time (early delta OD 28.0, late delta OD 38.7). Antigen excess capacity was validated using 67 normal blood donor serum, 68 kappa monoclonal and 33 lambda monoclonal patient sera which had been collected over a number of years and had previously been reported as having antigen excess on other analysers or assays. All samples tested (68/68 kappa, median 265.03mg/L, range 20.06-40,930.00mg/L, and 33/33 lambda, median 762.00mg/L, range 7.68-56,949.00mg/L) were correctly measured using these parameters. We conclude that implementation of these parameters will improve assay throughput and will prevent monoclonal patient samples from being mis-reported.

Tuesday, July 30, 9:30 am – 5:00 pm Cancer/Tumor Markers
A8 CLINICAL CHEMISTRY, Vol. 59, No. 10, Supplement, 2013
OVA1 scores ≥5.0 (premenopausal) and ≥4.4 (postmenopausal) are associated with an increased risk of malignancy. The IL6 reference range is 0.31-5.00 pg/mL. Abnormally high results are indicated by an arrow. a Indicates discordance between OVA1 and/or IL6 results and the fi nal diagnosis.
A-27
A New Biomarker Panel To Predict Hepatocellular Carcinoma In Chronic Hepatitis C infected (HCV) Patients
G. M. Mustafa1, j. R. petersen1, H. Ju1, L. Cicalese1, N. Synder2, S. J. Haidacher1, L. Denner1, C. Elferink1. 1University of Texas Medical Branch ,Galveston, Galveston, TX, 2Kelsey Seybold clinic, Houston, TX
Background: hepatocellular carcinoma (HCC) is the most common primary liver cancer, ranking 6th among cancers as a cause of death. The projected rise in HCC cases in the US is mainly due to HCV infections with onset of HCC coming several decades after initial infection. The poor prognosis is due late stage diagnosis making successful intervention diffi cult. Although AFP is used for screening, it is often normal or indeterminate in early cancer cases. The goal of clinical proteomics has been to fi nd an indicator (biomarker) to allow detection at an early stage when therapeutic intervention may be possible. Thus, our aim is to identify serum based biomarkers suitable for early HCC detection that will provide a sensitive yet specifi c screen.Methods: Serum was obtained from individuals positive for HCV who were clinically diagnosed with liver disease (pre-HCC) or HCC. All patients were free of co-infection with HIV/HBV and had a history of low alcohol consumption negating potential confounding risk factors. For serum fractionation we used aptamer based technology (Bio-Rad) which reduces the dynamic range while retaining the complexity of the serum peptidome without losing any important information. The fractionated serum was resolved using 2D-DIGE (12 HCV and 12 HCC) and the fl uorescent signatures captured using GE Typhoon Trio Imager. HCV and HCC profi les were compared using DeCyder and statistically signifi cant signature peptides selected for further analysis. O18/O16 labeling was used to verify the identity of proteins co-migrating on 2D-DIGE and to help in development of Selected Reaction Monitoring assays (SRM). 50 human serum samples (24HCV and 26 HCC) were used to quantify the candidate biomarker using labeled internal standards (AQUA peptides).Results: HCV and HCC samples labeled with cy3 and cy5 were combined with a cy2 labeled internal standard and separated on 2D-gels revealing 24 differentially expressed protein spots that were statistically different (p<0.05) at a threshold of ≥1.5X change. LC-MS/MS was used to identify these proteins which included ApoA1. Since ApoA1 was one among the list and was thus selected to develop an SRM as proof of concept in this biomarker discovery protocol. Using a Triple Quad MS (Agilent), Optimizer (Agilent) and skyline (MacCoss) to assist in the design we developed SRMs to quantify these biomarkers using isotope labeled internal standards (AQUA peptides) which can be multiplexed and translate directly to clinical settings. The 1st SRM we developed uses three peptides specifi c to ApoA1 (DLATVYVDVLK, WQEEMELYR, VSFLSALEEYTK) and showed an average decrease in concentration between HCV and HCC patients of >30%. This was further verifi ed and validated on 24 HCV and 26 HCC samples by western blotting. Conclusion: Using SRM assays we are in the process of verifying the other biomarkers in our list. Once verifi ed we plan to perform a larger validation study using samples archived with NCI early detection research network (EDRN) specifi cally designed for such validation studies.
A-28
High-Risk Human Papillomavirus 18 in Two Nasopharyngeal Carcinoma Cell Lines
S. B. Zhang1, T. Hollen1, W. Lv2, J. Hong2, K. Raisch1, Y. Li1, A. Zhang3, M. Zhang1, L. Huang1, A. Zhang1, S. Yang1, Z. Zhang1, L. Zhang1, P. Okunieff1. 1University of Florida, Gainesville, FL, 2Fujian Medical University, Fuzhou, China, 3DiaCarta, Inc., Hayward, CA
Background: Nasopharyngeal carcinoma (NPC), a head and neck cancer that is most prevalent in Southeast Asia, the Middle East, and North Africa, is associated with Epstein-Barr viral infections (Xia, 2009). However, human papillomavirus (HPV), which is a major cause of oropharyngeal carcinoma, has also been implicated as an NPC etiologic agent. Two Epstein-Barr virus-negative NPC cell lines (CNE-1 and
kappa ratio by at least one assay showed moderate correlation (PB: -5.09+0.38x; R2=0.79), and in 23 patients with an abnormal lambda ratio by at least one assay there was poor correlation (PB: 30.23+0.16x; R2=0.20). There were discordant FLC ratio results in 8(9%) patients. In 7/8 patients (4 FLC kappa patients identifi ed by Freelite and 3 lambda patients identifi ed by N Latex FLC) with discordant results the kappa/lambda ratios were borderline, with slight monoclonal production and therefore of little concern. However, 1 IFE positive patient had 578mg/L kappa FLC and an abnormal kappa / lambda ratio (38.8) by Freelite and only 18mg/L with a normal kappa / lambda ratio (1.39) by N Latex FLC. Antigen excess (AgXS) was observed in 3(3%) kappa samples by Freelite and 7(4 kappa, 3 lambda; 8%) samples by N Latex FLC. The median FLC values of the 3 samples in AgXS by Freelite at standard and 1/2000 dilutions were 36.9(25.7-73.7) and 412.5(191-761.1) mg/L, respectively. The median FLC values of the 4 kappa samples in AgXS by N Latex FLC at standard and 1/2000 dilutions were 19.1(12.2-40.5) and 143.2(83.6-184.4) mg/L, respectively. The median FLC values of the 3 lambda samples in AgXS by N Latex FLC at standard and 1/2000 dilutions were 108.6(58.4-113.3) and 541.1(538.1-841.1) mg/L, respectively. Conclusion: Freelite and N Latex FLC assays do not report similar quantitative results and did not meet CLSI guidelines for the same analyte recognition. In addition, the N Latex FLC assay did not identify an IgGκ patient who was detected by the Freelite assay. Both assays exhibit non-linearity and antigen excess, highlighting the need for multiple dilutions when analysing a new patient.
A-26
OVA1® Specifi city in Assessing Risk for Ovarian Malignancy Improved with IL-6
K. Sisco, P. P. Chou. Quest Diagnostics Nichols Institute, Chantilly, VA
Background: OAV1 (a trademark of Vermillion) is an FDA cleared IVDMIA used in the preoperative assessment for potential malignancy of patients presenting with an ovarian mass. It consists of fi ve different analytes (beta-2 microglobulin, CA-125 II, apolipoprotein A1, transthyretin and transferrin) which are combined to provide a score. This score has high sensitivity but low specifi city for predicting the presence of malignancy. Adding Interleukin-6 (IL-6) to this score is shown to preserve the high sensitivity and increase the specifi city.Methods: Thirteen patients who had undergone OVA1 assessment were also evaluated for IL6. Retrospective follow-up inquiries were made several months later to ascertain the fi nal diagnoses. Furthermore, fi ve pooled specimens from 126 patients with benign disease or malignancy were analyzed using OVA1 and IL6.Results: In this combined population, the sensitivity of OVA1 alone was 100%, with a specifi city of 93%. IL6 alone had a sensitivity of 97% and a specifi city of 99%. We propose an algorithm whereby an OVA1 score of 8.1 or more is assigned a “high risk of malignancy” without further testing. OVA1 scores above the respective cutoffs for premenopausal (5.0) and postmenopausal women (4.4) will refl ex to IL6; those with elevated IL6 levels are then regarded as having a “high risk of malignancy.” Applied to this study, this new algorithm yields a sensitivity of 100% and a specifi city of 98%.Conclusion: Combining OVA1 with IL6 improves specifi city without compromising sensitivity. A high risk assessment would then result in the patient being referred to a gynecologic oncologist for further evaluation. Table 1. OVA1 and IL6 Results for Pooled Specimens and Individual Patients
Patients Age OVA1 IL6 DiagnosisPooled #1 2.3 2.7 Benign (19 patients)Pooled #2 1.9 3.4 Benign (25 patients)Pooled #3 2.1 3.7 Benign (32 patients)Pooled #4 1.7 4.7 Benign (20 patients)Pooled #5 5.3↑ 9.9↑ Malignant (30 patients)PatientA 46 9.7↑ 1,042.0↑ Malignant (Ovarian Malignancy, positive nodes)PatientB 26 8.0↑a 1.8 Benign (Endometrioma of the ovary)PatientC 58 6.9↑ 40.7↑ Malignant (Ovarian cancer and renal cancer)PatientD 57 6.3↑a 5.0 Benign (Hydrosalpinx)PatientE 90 8.2↑ 3.4a Malignant (Metastatic esophageal adenocarcinoma)PatientF 75 8.2↑a 5.0 Benign (Cystadenoma of the ovary)PatientG 46 3.5 2.0 Benign (Benign hemorrhagic ovarian cyst)PatientH 82 7.4↑ 8.7↑ Malignant (Anaplastic carcinoma)PatientI 67 9.1↑ 31.4↑ Malignant (Carcinomatosis)PatientJ 76 6.6↑a 2.8 Benign (No adnexal mass; benign endometrial
biopsy)PatientK 46 5.1↑a 0.9 Benign (Benign ovarian cyst)PatientL 56 7.9↑ 7.9↑ Benign (No ovarian mass; adenomyosis)PatientM 56 6.3↑a 2.3 Benign (Clinically benign; lost to followup)
Sensitivity 100% 97%Specifi city 93% 99%

Cancer/Tumor Markers Tuesday, July 30, 9:30 am – 5:00 pm
CLINICAL CHEMISTRY, Vol. 59, No. 10, Supplement, 2013 A9
Methods: Affymetrix GeneChip® miRNA 2.0 Array was performed to acquire dynamic miRNA expression profi le of SPC-A1 after treatment with NJ001. Quantitative real-time-PCR was carried out to validate the results of microarray approach. After that, we used Cluster Analysis of up-regulated expression in SPC-A1 incubated with NJ001 to focus interesting miRNA. In the gain of function study, Images of CY-3 labeled miRNA mimics and qRT-PCR was used to confi rm augmented expression. After successfully over-expression of miRNA, double staining with FITC-Annexin V and PI was carried out to evaluate the apoptosis rate. Members in apoptosis pathway were detected by western blot. We used fi ve programs_miRanda, miRDB, miRWalk, RNA22 and Targetscan_to predicte targets of miR-638. The wild-type and mutation-type 3’-UTRs of these potential targets were cloned into the PGL4 plasmid and dual-luciferase assays was carried out after co-transfection miRNAs and reporter plasmids into SPC-A1 cells to evaluate the changes of luciferase activity. Changes of mRNA levels and protein levels of target genes were confi rmed by qRT-PCR and western blot respectively.Results: After treatment with NJ001, The high percentage of Annexin V+ cells in NJ001 groups was observed at 24 h, 48 h and 72h compared to cells in the control groups (44.3%, 74.0% and 81.4% vs. control respectively, P < 0.05 for all time points). The expression of miR-638 was the fi rst to show a signifi cant change and found to be dynamically increased accompanied with the climbing apoptosis rate according to the result of Cluster Analysis of microarray approach. In addition, we observed that miR-638 is signifi cantly suppressed in SPC-A1 when compared with human embryonic lung fi broblast (HFL-1) and functional studies indicated over-expression of miR-638 positively regulated the apoptosis of SPC-A1 through both extrinsic and intrinsic pathway via activating caspase 8, caspase 9, caspase 3 and shifting the bax/bcl-2 ratio. By transcriptomic analysis and computational algorithms, we identifi ed the anti-apoptotic protein hepatocyte growth factor (HGF) as a target gene of miR-638. Dual-luciferase reporter assay confi rmed that miR-638 negatively regulated HGF by interaction between miR-638 and complementary sequences in the 3’ UTR of HGF. MiR-638 repressed HGF at post-transcriptional levels as revealed by quantitative RT-PCR and Western blot analysis.Conclusion: In summary, our fi ndings demonstrate that miR-638 has a critical role in regulating apoptosis of SPC-A1 cells, implying the function of miR-638 as a putative tumor suppressors miRNA and provide a basic rationale for the use of miR-638 in the treatment of NSCLC.
A-31
NJ001 antibody specifi c antigen is the key molecule for outcome evaluation of lung adenocarcinoma patients
P. Huang, Y. Han, F. Wang, R. Yang, L. Zhang, T. Xu, Q. Li, H. Wang, S. Pan. The fi rst clinical medical college, Nanjing, China
Objective: To evaluate the relationship between NJ001 specifi c antigen and clinicopathological features, so as to further explore its role in the prognosis of lung adenocarcinoma. Methods: The expression of NJ001 specifi c antigen was examined by means of the envision system immunohistochemical staining with monoclonal antibody NJ001 in 110 lung adenocarcinoma and 46 benign lung disease, as well as a tissue microarray (TMA) containing 75 lung adenocarcinoma and the adjacent normal tissue. Immunohistochemistry results were reckoned by multiplication of the percentage and staining intensity of positive tumor cells. Then we evaluated the associations of the antigen expression with several clinicopathologic parameters. Overall survival rates were determined by using the Kaplan-Meier method with log-rank test for comparison among groups with different expression of the specifi c antigen. Results: We observed that NJ001 specifi c antigen was predominantly located on the cell membrane and in the cytoplasm of tumor cells. The positive rate was respectively 84.70% in lung adenocarcinoma, 8.22% in the adjacent normal tissue and 8.70% in benign lung disease. The specifi c antigen expression in lung adenocarcinoma was signifi cantly associated with the poor and moderate differentiation grade of the tumor (P= 0.017) and lymph node metastasis (P<0.001). In lung adenocarcinoma group, the lower level of the specifi c antigen patients expressed, the longer post-operation survival time they acquired. Cox proportional hazards model showed that high expression of NJ001 specifi c antigen (3+) was discovered to be an independent factor for poor overall survival of lung adenocarcinoma at early stage(I/II).Conclusions: NJ001 specifi c antigen is over-expressed in lung adenocarcinoma, and closely correlated with tumor differentiation and lymph node metastasis. It may play an important role in carcinogenesis and development of lung adenocarcinoma, and promise to be a valuable prognosis factor for lung adenocarcinoma patients.
CNE-2) have been widely studied over the past decade due to their different levels of radiosensitivity. CNE-1 cells have high differentiation with a radiosensitive phenotype, whereas CNE-2 cells have low differentiation with a radioresistant phenotype.Methods/Results: We found that CNE-1 and CNE-2 cells were infected with high-risk HPV 18. To our knowledge, no other report links CNE-1 and CNE-2 to HPV infection. Our studies showed that relative copy number in CNE-1 is lower than in CNE-2 (0.448 vs. 0.831, respectively). Their copy numbers were higher than those found in cervical cancer C-4 II cells infected with HPV 18 (0.199). Our studies detected 2 HPV oncogenes, E6 and E7 mRNA, in the CNE-1 and CNE-2 cell lines. Independent of cell lines, the E6 mRNA level was signifi cantly higher than the E7 mRNA level. The relative E6/E7 mRNA in CNE-1 was signifi cantly higher than in CNE-2. Although no signifi cant differences between E6 and E7 mRNA levels in CNE-1 and C-4 II were found, the E6 and E7 mRNA levels in CNE-2 were signifi cantly lower than in C-4 II. Mitochondrial DNA plays a key role in intrinsic sensitivity to radiation. We found that the relative mtDNA copy number (mtDNA/nDNA ratio) in CNE-1 was signifi cantly lower than in CNE-2 (1 vs. 2.92, respectively). A similar trend in mtDNA mutation (4,977-bp common deletion) was also found; the relative mitochondrial common deletion in CNE-1 was signifi cantly lower than in CNE-2 (1 vs. 4.25, respectively). These results were confi rmed by real-time polymerase chain reaction (RT-PCR) and branched DNA methods (QuantiVirus® HPV Detection Kit, DiaCarta, Hayward, CA).Conclusion: HPV may be the etiologic factor in some Epstein-Barr virus-negative NPC cases. Further studies are warranted. Moreover, our studies also showed that mitochondrial DNA may be responsible for the difference in radiosensitivity between CNE-1 and CNE-2.
A-29
Molecular characterization of FLT3 mutations in Acute Myeloid Leukemia from Pakistan with different FAB subtypes
M. Faiz, M. Ishfaq, T. Bashir, A. Shahid. Institute of Nuclear Medicine and Oncology, Lahore, Pakistan
Introduction: FLT3 mutations are common genetic changes reported to have prognostic signifi cance in acute myeloid leukemia (AML). Methods: Peripheral blood samples of 94 AML Pakistani patients were collected to determine FLT3 internal tandem duplication (ITD) incidence by PCR in exons 14 and 15 of FLT3 gene and D835 activating mutation in the tyrosine kinase domain (TKD) on isolated DNA stored at -20oC. Results: Among 94 AML patients, 60 were males and 34 were females with male to female ratio 2:1. The age ranged between 15 to 78 years with a median age of 32 years. Among 81 patients whose FAB subtype was known, AML-M2 was the predominant subtype (37%) followed by M4 (23.5%), M3(15%), M1 (11%), M5 (11%), M6 (2.5%) . The incidence of FLT3/ITD and TKD was 22% and 6.3% respectively. Majority of the FLT3/ITD mutation was most common in AML-M4 (63%) patients while D835 mutation was found in FAB M1, M2. Presence of mutation was not related to gender or age. However, presence of FLT3/ITD was clearly associated with hyperleukocytosis. No signifi cant relationship was found between clinical features and FLT3/ITD positivity. Conclusion: FLT3/ITD mutation was common genetic abnormality found in Pakistani AML patients and unfavorable prognostic marker that should be included in molecular diagnostic testing of AML. Moreover, effective therapy with FLT3 targeting agents may be considered to improve the prognosis in patients.
A-30
Restoration of miR-638 induces SPC-A1 cells apoptosis via down regulation of HGF
S. Pan, Y. Cao, J. Xu, B. Zhang, J. Ma, E. Xie, D. Chen, L. Gao, Y. Zhang. The fi rst clinical medical college, Nanjing, China
Background: Aberrant expression of miRNAs has been correlated with various human diseases including cancers, and this small non-coding RNA has been identifi ed which have oncogenic or tumor suppressor properties Emerging evidence showed that miRNAs are important regulators in cancer cell proliferation, apoptosis, metastasis, chemosensitivity and so on. In the previous study, we produced a monoclonal antibody designed NJ001, which exhibited its anti-tumor activity both in vitro and in vivo by inducing apoptosis. This study was aimed to investigate the role of miRNAs in SPC-A1 cells undergoing apoptosis following treatment with NJ001 and fi nd the pro-apoptosis miRNA in tumor cells for further study on cancer therapy.

Tuesday, July 30, 9:30 am – 5:00 pm Cancer/Tumor Markers
A10 CLINICAL CHEMISTRY, Vol. 59, No. 10, Supplement, 2013
Results: We analyzed 152 pairs of conventional biopsy materials and uMS by HRMA. A total of 24 EGFR mutations were identifi ed, including deletions in exon 19 (N = 8), missense mutations L858R in exon 21 (N = 16). There were two samples in which the missense mutation was detected either by HRMA alone or by F-PHFA alone: F-PHFA could successfully detect these two mutations. Furthermore, by using F-PHFA for HRMA negative 65 specimens, a L858R mutation was identifi ed. On the other hand, a deletion in exon 19 detectable by HRMA was not detected by F-PHFA (E746_A750delinsIP).Conclusion: Bronchoscopic ultra-micro samples (biopsy needle rinse fl uids) can be used for high resolution melting analysis (HRMA) and fl uorescence resonance energy transfer-based preferential homoduplex formation assay (F-PHFA) for detection of EGFR mutation prior to gefi tinib therapy. Although not ultra-sensitive, HRMA is easy to perform and can cover a wide range of mutations. F-PHFA is more sensitive than HRMA and could be promising tool complementary to HRMA for molecular profi ling of patients with NSCLC.
A-35
Anti-cancer drug screening of tubulin inhibitors using 2D and 3D lung cancer assays
R. Lama, B. Su. Cleveland State University, Cleveland, OH
Background: Cancer is a leading cause of death worldwide. Two-dimensional (2D) monolayer cellular assays have been widely used as an in vitro model for anti-cancer drug screening purposes. However, the conventional monolayer cell culture screening assays fall short in predicting clinical response because they lack in vivo tumor characteristics. In contrast, three-dimensional (3D) multicellular spheroid models are symmetrical cellular aggregates that mimic the physiological environment of tumors in vivo. Studies have demonstrated that in vitro spheroids and in vivo tumors have morphological similarities and exhibit resemblance in the penetration, binding and bioactivities of drugs. Despite numerous recognized advantages of 3D cell culture models as drug screening tools, the complexity and lack of standardized protocols for 3D assays has hindered their use in the mainstream pre-clinical drug screening processes. An easy-handling and cost-effective lung cancer 3D spheroid model suitable for small molecule anti-cancer compounds screening was developed, standardized and validated with Nimesulide [N- (4-nitro-2-phenoxyphenyl) methane sulfonamide] tubulin inhibitor library of 41 compounds. A correlational study was conducted between the activity of compounds in 2D and 3D culture models and several active tubulin inhibitors were identifi ed from the screening processes.Methods: H292 lung cancer cells grown in 96-well plate for 24h were exposed to various concentrations of tubulin inhibitors dissolved in DMSO for 72 h and the effects were assessed using MTT assay. 3D spheroids were generated using H292 cells seeded in 96-well plates pre-coated with 1.5% agarose. The cells were plated at a density of 2000-20000 cells/well followed by treatment with 2.5% matrigel. The spheroids were treated with varying concentrations of tubulin inhibitors for 7 days. Spheroid morphological images were taken manually; spheroid diameters and volumes were determined. IC50 values were calculated using GraphPad Prism software and Microsoft Excel.Results: H292 non-small cell lung cancer cells formed very well packed multicellular 3D spheroids. The spheroid volumes were proportional to the number of cells seeded. With approximately 20,000 cells the spheroid diameter reached about 200 mm with interwell variation in diameter under 5%. The spheroids formed with larger number of cells showed rapid growth pattern compared to the spheroids formed with less number of cells. The IC50 values generated for 2D and 3D models were compared and the results indicated a poor correlation, suggesting difference in the potency trends of the two models. The 3D data should be more reliable than 2D monolayer screening, however multiple factors affected the potency of compounds in 3D assay.Conclusion: Several compounds exhibited better potency in 3D spheroid model than 2D model, suggesting that these compounds have the potential to show signifi cant in vivo anti-tumor activity. Screening in 3D model eliminates the compounds that show artifi cial good potency in 2D models. Drug screening in 3D model is a novel approach for anti-cancer drug discovery research that can help identify compounds for further in vivo xenograft studies.
A-33
Signifi cance of Angiopoietin-2 as a Serum Marker for Hepatocellular Carcinoma
F. M. El Shanawani, M. M. Hasan. Theodor Bilharz Research Institute, Cairo, Egypt
Background: and study aims: Hepatocellular carcinoma (HCC) is one of the most common malignancies worldwide and one of the major causes of death. The aim of this study was to investigate the potential role of Angiopoietin-2 as a non-invasive marker for HCC. Patients and Methods: This study was conducted on 30 patients with documented HCC and 30 cirrhotic patients with no evidence of HCC; as well as 30 healthy subjects who served as control group. The levels of alfa fetoprotein (AFP) and angiopoietin-2 (Ang-2) were measured for all cases together with full clinical assessment, liver biochemical profi le, viral markers, ultrasound, abdominal triphasic computerized tomography (CT) scan and guided liver biopsy for HCC cases with atypical triphasic CT pattern. Results: There was a statistically highly signifi cant elevation (p< 0.001) in the mean serum AFP in HCC group (155.5 ± 271.5 ng/ml) when compared with the control group (6.3 ± 2.4 ng/ml) and also a highly signifi cant elevation (p<0.01) when compared to the cirrhosis group (29.3 ± 31.2 ng/ml). There was a statistically highly signifi cant elevation (p< 0.001) in the mean serum Ang-2 in HCC group (10855 ± 5321.92 pg/ml) when compared with both the control (480.67 ± 202.3 pg/ml) and cirrhosis (5578.33 ± 2928.21 pg/ml) groups. The diagnostic sensitivity of AFP at a cutoff of 200 ng/ml was 24% and the specifi city was 100%. The cutoff level of Ang-2 for diagnosis of HCC in this study was 8100 pg/ml, with a sensitivity and specifi city of 70% and 80% respectively. Serum Ang-2 was signifi cantly elevated in HCC patients with portal vein thrombosis than those without. There was a signifi cant positive correlation between the number of hepatic focal lesions and the serum level of Ang-2. The combined use of the two markers (AFP and Ang-2) led to an increase in the sensitivity of AFP from 53.3% to 83.3%. Conclusion: Serum Ang-2 is elevated in patientswith cirrhosis and further elevated in patients with HCC, so its use as an independent tumor marker in the diagnosis of HCC is to be considered. Simultaneous measurement of serum AFP and Ang-2 may enhance the sensitivity of HCC detection.
A-34
Highly sensitive detection of EGFR mutations using Bronchoscopic Ultra-Micro Sampling in patients with Non-Small Cell Lung Cancer (NSCLC)
K. Sato1, S. Itoga1, Y. Sakairi2, T. Ishige1, K. Matsushita3, I. Yoshino2, F. Nomura3. 1Chiba University Hospital, Chiba, Japan, 2Department of General Thoracic Surgery, Graduate School of Medicine, Chiba University, Chiba, Japan, 3Department of Molecular Diagnosis, Graduate School of Medicine, Chiba University, Chiba, Japan
Background and Aim: Improvements in our understanding of the molecular biology of cancer have shifted management of lung cancer toward molecular-guided, individualized treatment. Epidermal growth factor receptor (EGFR) tyrosine kinase inhibitor gefi tinib represent the best example of this approach and has been widely used for treatment of NSCLC. Because the presence of mutations of EGFR gene leads to enhanced clinical responses to gefi tinib, detection of EGFR mutation is essential for appropriate individualized therapy. Surgical and biopsy materials, bronchial lavage fl uid, pleural fl uid have been conventionally used as clinical specimens for the mutation analysis, whereas analyses using tiny samples are still challenging. In this study, we investigated the utility of bronchoscopic ultra-micro samples (biopsy needle rinse fl uids) compared with conventional histological materials for EGFR mutation analysis, using High Resolution Melting analysis (HRMA) and fl uorescence resonance energy transfer-based preferential homoduplex formation assay (F-PHFA)Methods: A total of 152 patients with NSCLC suspected by on-site cytological examinations during bronchoscopic survey were included. Following conventional needle aspiration biopsy by fl exible bronchofi berscope (from primary lesion) or convex probe endobronchial ultrasound (from lymph nodes), the used needle was rinsed with 20 ml of saline and this ultra-micro sample (uMS) was used for genetic analysis. DNA was extracted from each sample. We screened for the presence of EGFR mutations (exon 18, 19, 20, and 21) by HRMA, followed by identifi cation of the mutations by direct sequencing. HRMA negative samples were subjected to the more sensitive F-PHFA. The results of EGFR gene profi les using MS were compared to those obtained in conventional biopsy materials.

Cancer/Tumor Markers Tuesday, July 30, 9:30 am – 5:00 pm
CLINICAL CHEMISTRY, Vol. 59, No. 10, Supplement, 2013 A11
according to Gleason score and TNM classifi cation. The urine concentrations of sarcosine and creatinine were determined by using a LC-MS/MS method. Statistical analysis was performed by using SPSS16.0. Receiver operating characteristic (ROC) was performed to assess the diagnostic performance of the urine sarcosine/creatinine for PCa.Results: Hydrophilic interaction liquid chromatography (HILIC) was performed for the separation of sarcosine and creatinine in urine within a 6.5-min run time. The LC-MS/MS method showed good linearity from 0.1-5 μg/mLfor sarconsine and 100-5000 μg/mLfor creatinine. Intra-assay and inter-assay CVs were <5.19 % and <10.8% for sarcosine, and <3.42% and <3.04% for creatinine, respectively. The urine sarcosine to creatinine ratio was signifi cantly higher in PCa than in controls (0.797±0.909 mg/g creatinine vs. 0.115±0.077 mg/g creatinine, p<0.001). ROC analysis showed the area under curve (AUC) was 0.898 (95% CI 0.866-0.930, p<0.001). The urine sarcosine levels dramatically increased in the metastatic PCa compared with those in localized PCa (1.378±1.688 mg/g creatinine vs. 0.242±0.070 mg/g creatinine, p<0.001). The correlation between urine sarconsine and prostate-specifi c antigen (PSA) was very low (r=0.186, p=0.486).Conclusions: The LC-MS/MS method provided a simple and specifi c measurement of sarcosine and creatinine in urine. Urine sarcosine signifi cantly increased in the PCa, especially in the metastatic PCa, indicating an effective, non-invasive, predictive biomarker for the diagnosis and discrimination of the malignancy of PCa.
A-38
High Risk HPV Detection Rates for Surepath™ and ThinPrep® PreservCyt® for Patient Encounters with Both Cytology and Histology Diagnoses
D. A. Payne, M. E. Hull, L. A. Weldon, A. K. Stout, D. K. Nault, J. A. Mancini, L. E. Staufer, E. C. Butler, T. K. Weyand, H. Lin, B. M. McCormick, B. H. Lipke, P. Juarez-Falgoust, M. G. Venrick. American Pathology Partners-UniPath, Denver, CO
Background:The most sensitive approach for cervical screening includes both cytology and molecular screening for human papillomaviruses (HPV) cervical cancer associated types (a.k.a. High Risk (HR) types). Of the two commonly used liquid-based cytology medias (i.e., ThinPrep® PreservCyt® [TP] and Surepath™ [SP]), only TP is FDA approved for molecular screening methods. This retrospective study sought to determine whether HPV positivity rates differed between TP and SP samples for patients with cytology and histology diagnoses. Methods: A 5 year database query of patient encounters included cytology/histology/HPV results (1395 TP and 1748 SP). HPV HR positivity/negativity rates used the hybrid capture 2 method (HC2). Results: ANOVA analysis demonstrated no statistically signifi cant different HR HPV detection rates for TP or SP media types for all CIN II, CIN III and benign cases (p value=0.0541). Of these samples, sensitivity and specifi city was determined for specimens with diagnoses of CIN II (n=167[TP] and n=230[SP]) and CIN III (n=170 [TP] and n=259[SP]). Specimens with benign histology included 1058 TP and 1259 SP specimens. CIN III cases had a sensitivity of 96% and specifi city of 38% for both media types. CIN II cases had an identical specifi city of 38% for both media types but differed slightly with 94% sensitivity for TP and 92% sensitivity for SP medias. The Fisher’s Exact Test demonstrated no signifi cant difference for HPV positivity for either CIN II or CIN III cases whose cytology was collected using SP or TP (i.e., P value = 0.4393 [CIN II] and P value=1.000 [CIN III]).Conclusion: No statistically signifi cant difference was observed for HPV positivity rates in cytology specimens collected using SP versus TP liquid based media whose subsequent biopsy yielded results of CIN II, CIN III or Benign.
A-41
Promoter of Cables 1, a cyclin-dependent kinase binding protein affected by cyclic AMP pathway
H. Sakamoto1, M. P. Lynch2, B. R. Rueda2. 1Faculty of Health Sciences, Kobe Tokiwa University, Kobe, Hyogo, Japan, 2Vincent Center for Reproductive Biology, Massachusetts General Hospital, Boston, MA
Background: Cables 1 is a cyclin-dependent kinase binding protein involved in cell cycle regulation and cell proliferation. Previous studies reported that loss of nuclear Cables 1 expression was observed with high frequency in ovarian carcinomas. Evidence of hyper methylation of the Cables 1 promoter region was also observed in ovarian carcinomas. These fi ndings suggested that Cables 1 expression in ovarian carcinoma may be regulated at the level of the promoter, though few details are known
A-36
Comparison of polyclonal antibody assay for the quantifi cation of serum free light chain (Freelite™) with a new monoclonal antibody based test (N Latex FLC)
J. García de Veas Silva, C. Bermudo Guitarte, M. Perna Rodríguez, C. González Rodríguez. Department of Clinical Biochemistry, Hospital Universitario Virgen Macarena, Sevilla, Spain
Background: quantifi cation of serum free light chains (FLCs) is used in the diagnosis, monitoring and prognosis in patients with monoclonal gammopathies. FreeliteTM has become an essential assay in the diagnosis and monitoring of patients with monoclonal gammopathies and this assay has been accepted in international guidelines. Recently, immunoassays using monoclonal antibodies against FLCs have become commercially available. These new serum assays for automated measurements are commercially available but the technical performances of these assays are in discussion.Methods: the new N Latex FLC nephelometric assay (Siemens Healthcare Diagnostics) based on monoclonal antibodies was compared with the FreeliteTM
turbidimetric assay (The Binding Site) based on polyclonal antibodies in 94 patients with monoclonal gammopathies (34 intact immunoglobulin multiple myeloma, 6 light chain multiple myeloma and 54 monoclonal gammopathies of undetermined signifi cance). Spearman´s coeffi cient of correlation was used to study the correlation between the methods. The evaluation and concordance between the methods was studied using the Bland-Altman regression and the Passing & Bablok plot. A p value <0.05 was considered to be signifi cant.Results: result ranges for FLC kappa were from 1.40 to 814 mg/L by turbidimetry and 4.38 to 523 mg/L by nephelometry. Spearman´s coeffi cient of correlation was 0.938 (p<0.0001) and the Passing and Bablok regression equation was Y(NLATEX) = 3.5273 + 0.9051·X(FREELITE) with a 95% CI (1.4783 to 5.4657) for the intercept and a 95% CI (0.8234 to 0.9958) for the slope. Bland-Altman plot evidenced a negative bias (mean difference of -12.5) with higher values for FreeliteTM assay. For FLC lambda the result ranges were from 0.45 to 733.87 mg/L by turbidimetry and 1.97 to 795 mg/L by nephelometry. Spearman´s coeffi cient of correlation was 0.832 (p<0.0001) and the Passing and Bablok regression equation was Y(NLATEX) = -1.5996 + 2.0827·X(FREELITE) with a 95% CI (-6.1925 to 1.8931) for the intercept and a 95% CI (1.7429 to 2.3634) for the slope. Bland-Altman plot evidenced a positive bias (mean difference of 31.4) with higher values for N LATEX assay. Result ranges for FLCs ratio were from 0.01 to 703.30 mg/L by turbidimetry and 0.01 to 225 mg/L by nephelometry. Spearman´s coeffi cient of correlation was 0.877 (p<0.0001). The Passing and Bablok regression equation was Y(NLATEX) = 0.1751 + 0.4227·X(FREELITE) with a 95% CI (0.0498 to 0.3762) for the intercept and a 95% CI (0.3553 to 0.4972) for the slope. Bland-Altman plot evidenced a positive bias (mean difference of -15.9) with higher values for FreeliteTM assay.Conclusions: comparison between FreeliteTM and N Latex FLC showed a poor agreement between assays that refl ects the recognition of single epitope by monoclonal antibodies by the second assay. Both assays are not interchangeable because the difference between the two techniques is not homogeneous along the values obtained. When the FLCs results obtained are higher, we get a greater difference between the two methods and there are proportional errors. According to our results, we will continue using the FreeliteTM assay due to the high sensibility and specifi city that we have previously obtained in the study of monoclonal gammopathies.
A-37
Urine sarcosine signifi cantly increased in prostate cancer patients by using a liquid chromatography tandem mass spectrometry method
S. Li, J. Li, J. Sha, C. Yu, J. Zhu. Shanghai Xuhui Central Hospital, Shanghai, China
Background: Sarcosine was identifi ed as the potential biomarker as its levels highly increased during prostate cancer (PCa) progression to metastatic disease in a metabolomic profi ling study. However more comprehensive validation studies are still needed to confi rm its clinical usefulness. The objective is to determine the urine sarcosine in patients diagnosed of prostate cancer by using a liquid chromatography tandem mass spectrometry (LC-MS/MS) method.Methods: A total of 167 PCa patients (average age 79.2±7.6 years old, ranged from 62-90) were enrolled at Department of Urology in Shanghai Xuhui Central Hospital. And 175 male subjects (average age 72.3±10.2 years old, ranged from 51-86) with no evidence of malignancy were recruited as the controls. PCa was screened by digital rectal examination and confi rmed by prostate biopsy. The severity of PCa was grouped

Tuesday, July 30, 9:30 am – 5:00 pm Cancer/Tumor Markers
A12 CLINICAL CHEMISTRY, Vol. 59, No. 10, Supplement, 2013
were all above 100% (range 102-127%); while in 36 samples with positive anti-Tg antibodies concentration (>22 IU/mL), the recoveries were between 68- 126%. The B·R·A·H·M·S hTg sensitive KRYPTOR assay is a new highly sensitive automated thyroglobulin assay proven to provide reliable results for the management of thyroid cancer patients and early detection of recurrences.
A-44
Comparison of responses assigned using immunoglobulin heavy/light chain (IgA-kappa / IgA-lambda) ratios to international myeloma working group response criteria
P. Young, H. Sharrod, R. Hughes, H. Carr-Smith, S. J. Harding. The Binding Site Group Ltd, Birmingham, United Kingdom
Background: Quantifi cation of monoclonal immunoglobulins (M-Ig) by serum protein electrophoresis is required to assign responses, and as an indication of relapse in multiple myeloma (MM) patients, with imunofi xation (IFE) being required to type and assign a complete response in SPEP negative patients. Whilst these measurements are suitable for assessmentof gross M-Ig production they are limited when, for instance, the M-Ig co-migrates with other proteins when analysed by SPEP or when there is a broad migration when analysed by IFE. When SPEP is non-quantifi able total IgA (tIgA) is recommended as a quantitative alternative for M-Ig monitoring, however, as tIgA cannot distinguish between M-Ig and polyclonal background, it over-estimates M-Ig levels. Novel nephelometric assays that quantify IgAκ & IgAλ (heavy/light chain; HLC) have been developed. Here, we compare IgA HLC and SPEP/tIgA measurements and assess changes in HLC ratio (IgAκ/IgAλ; HLCr) as a method of monitoring IgA MM patients.Methods: IgAκ HLC (normal range: 0.48-2.82) IgAλ HLC (0.36-1.98) and HLCr (0.80-2.04) were measured in 60 serial samples from 21 (14 IgAκ; 7 IgAλ) IgA MM patients to identify HLCr change cut-offs that could be used to defi ne responses; these cut-offs were then validated in 272 serial samples from 65 (40 IgA κ; 25 IgA λ) MM patients. HLCr responses were compared with IMWG responses in two ways: 1) responses were dichotomized into response (CR, VGPR and PR) v no response (SD and PD) and sensitivity, specifi city, PPV and NPV were calculated for HLCr; and 2) individual assigned responses were compared using a Weighted Kappa analysis with a quadratic weighting.Results: The following response criteria were identifi ed for changes in HLCr: 1) PD: ≥24% increase in HLCr with absolute increase in involved IgA ≥5g/; 2) SD: <24% increase to <60% reduction; 3) PR: 60-94% reduction; 4) VGPR: >94% reduction; and 5) CR: normalisation of HLCr. In the validation cohortthere was good agreement between total IgA measurements and summated IgAκ + IgAλ (n=337; Passing-Bablok: 0.03+0.93x); and involved IgA (e.g. IgAκ in an IgAκ patient sample) andSPEP/densitometry (n=132; PB: -0.62+1.00x). HLCr changes assigned: 69 CRs; 65 VGPRs (median % change: 98.6%, range: -95.0 to -99.9%); 73 PRs (median % change: -83.5%, range: -61 to -94%); 24 patients were classifi ed asSDs (median % change: -21.2%, range: -58% to 21%), additionally SD was assigned to a further 11 patients where there was >24% increase in HLCr without an accompanying 5g/L increase in involved IgA and 20 PDs (median % change: 212%; range: 65% to 487%); There was good agreement between dichotomized HLCr-responses and IMWG-responses (sensitivity: 91.7% (95% CI: 87.2-95.1%); specifi city: 73.9% (61.5-83.9%); PPV: 91.7% (95% CI: 87.2-95.1%); NPV: 73.9% (61.5-83.9%) and between individual assigned responses (Weighted Kappa: 0.86 (0.78-0.97); >0.81 is considered to be identical).Conclusion: HLC measurements display good agreement with SPEP/tIgA measurements and HLCr changes can be used to monitor IgA MM patients. Further clinical studies are needed to validate optimal HLCr cut-offs and to verify the clinical benefi t of HLCr monitoring.
A-45
Withdrawn by Author
of the Cables 1 promoter. To evaluate the Cables 1 promoter regulation more closely we made fi refl y luciferase Cables 1 promoter reporter constructs and evaluated Cables 1 promoter activity in several ovarian carcinomas derived cell lines and in a cell line derived from an ovarian metastasis of colorectal cancer.Methods: Different length fragments of the 5’fl anking region of Cables 1 gene through the translation initiation ATG codon were PCR-amplifi ed from human genomic DNA. These Cables 1 promoter regions were cloned into a luciferase reporter vector. Ovarian carcinoma derived cell lines JHOS-2 and OVK18, and HSKTC, a cell line derived from ovarian metastasis of colorectal cancer, were obtained from the Riken BRC cell bank with MTA. Cells were co-transfected with fi refl y luciferase reporter and renilla luciferase control reporter vector, then stimulated by Estradiol (E2), Progesterone (P4), Phorbol12-Myristate13-acetate (PMA), cyclic AMP (cAMP) or Forskolin for 48hours. Luciferase assays were performed using the dual-luciferase reporter assay system.Results: Cables 1 promoter activity was detected in all cell lines using a construct that included 2000 bp upstream of ATG codon. There was no signifi cant promoter activity stimulation by E2, P4 and PMA in any of three cell lines. JHOS-2 and OVK18 cell lines were also not affected by cAMP and Forskolin. However in HSKTC, cAMP stimulated Cables 1 promoter activity about two fold higher than control and Forskolin stimulated Cables 1 promoter activity about fi ve fold higher than control. Forskolin is known to stimulate intracellular accumulation of cAMP and this in turn may be the cause of stimulation of Cables 1 promoter activity in response to Forskolin in the HSKTC.Conclusion: These experiments suggest that Cables 1 promoter regulation mechanism depends on the cell type and may be dictated by differences in underlying epigenetic modulation of the Cables 1 promoter. The mechanism of cAMP regulation of Cables promoter is not clear because there is no canonical CRE in this region of the promoter. Ovarian carcinoma is diffi cult to detect by clinical laboratory test and often develops chemoresistance. Future experiments will continue to defi ne the regulation of Cables 1 promoter, which may help predict better treatment or early diagnostics of ovarian carcinoma.Acknowledgement: These studies were supported in part by Grant-in-Aid for Scientifi c Research C, JSPS KAKENHI Grant Number 23590695 (HS).
A-43
Validation of a new highly sensitive thyroglobulin immunoassay (hTg sensitive) on the Thermo Scientifi c B·R·A·H·M·S KRYPTOR platform
E. Thomas1, A. Algeciras-Schimnich2, C. M. Preissner2. 1Research and Development, Thermofi sher Scientifi c, Nîmes, France, 2Department of Laboratory Medicine and Pathology, MAYO Clinic, Rochester, MN
Differentiated thyroid cancer (DTC), the most common endocrine malignancy, is a highly curable disease with 5-year survival rates in excess of 95%. Treatment for DTC typically involves thyroidectomy followed by, in certain cases, radioactive iodine ablation, as well as thyroid-stimulating hormone (TSH) suppression. Serum thyroglobulin (Tg) measurement is a cornerstone of post-operative monitoring and long-term surveillance of DTC patients. However, serum thyroglobulin measurement remains technically challenging due to various degrees of assay sensitivity, between-method variability, and Tg autoantibody (TgAb) interference, among others. Thermo Scientifi c B·R·A·H·M·S hTg sensitive KRYPTOR® is a new human Tg immunoassay available on the KRYPTOR compact PLUS with an automated recovery test. The assay is calibrated against the reference standard CRM457 and uses Time Resolved Amplifi ed Cryptate Emission (TRACE) technology, based on a non-radiative transfer between 2 fl uorophores, terbium chelate and cyanin 5.5. Sample volume and incubation time are 70 μl and 59 minutes, respectively. The direct measuring range of the assay is 0-200 ng/mL but samples up to 200,000 ng/mL can be measured without operator intervention by use of automatic out-of-range detection and dilution. Linearity was validated through the entire measuring range by diluting a sample (200,000 ng/mL) down to the LOQ; the mean bias obtained was 6.4%. Automatic dilutions performed on KRYPTOR compact PLUS have recoveries between 81 and 106%. Assay imprecision was evaluated following CLSI EP5-A2 (3 reagent lots, 2 instruments, 20 days). The intra and inter-assay coeffi cients of variation were 18.6% and 19.8% at 0.15 ng/mL; 9.7% and 10.7% at 0.29 ng/mL; 2.4% and 5.1% at 1.1 ng/mL and 1.5% and 4.6% at 129 ng/mL. The functional assay sentivity, the limits of detection (LOD) and quantitation (LOQ) were 0.15, 0.09 and 0.17 ng/mL, respectively, based on CLSI EP17-A procedures. The assay was compared to the Access Thyroglobulin assay (Beckman Coulter) (n=89, range 0.1 – 193 ng/mL). The Spearman correlation coeffi cient was 0.99 with a slope of 0.86 and intercept of 0.01 by Passing-Bablock regression fi t. There were 53 samples with negative anti-Tg antibodies concentration (< 22 IU/mL using the Roche Elecsys anti-Tg assay), the automatic recoveries

Cancer/Tumor Markers Tuesday, July 30, 9:30 am – 5:00 pm
CLINICAL CHEMISTRY, Vol. 59, No. 10, Supplement, 2013 A13
at least 6 days at a diet consisting mainly of raw bovine meat (100 g/day). Then, the subjects were controlled for a period of 6 days during normal diet. Two of these three steps (cooked meat, control after diet) were repeated using pig meat, sheep meat, horse meat, goat meat. The cut-off was fi xed at 80 ng/mL. The FOB Gold System is an immunodiagnostic system developed for providing sensitive, accurate and reproducible measurements of human hemoglobin levels in feces specimens. It consists of latex reagents, calibrator set, controls set, sample collection tubes. All tests were performed in double using Beckman Coulter AU400 and Beckman Coulter AU480 clinical chemistry analyzers.Results: Control of subjects during diet based on bovine cooked meat: all subjects result negative after 6 sampling (all results < 80 ng/mL). Control of subjects during diet based on bovine raw meat: all subjects result negative after 6 sampling (all results < 80 ng/mL). Control of subjects during diet with pig cooked meat: all subjects result negative after 6 sampling (all results < 80 ng/mL). Control of subjects during diet based on sheep cooked meat: all subjects result negative after 6 sampling (all results < 80 ng/mL). Control of subjects during diet based on horse cooked meat: all subjects result negative after 6 sampling (all results < 80 ng/mL). Control of subjects during diet based on goat cooked meat: all subjects result negative after 6 sampling (all results < 80 ng/mL).Conclusion: Based on the results summarized below, there is not cross reactivity of hemoglobins of animal origin on clinical performances of FOB Gold H System. On the basis of these results, it is possible to conclude that is not requested diet restriction before testing of these reagents.
A-48
Assessing the necessity of including a crossover period when switching total PSA assays
A. Rutledge, G. Pond, S. Hotte, P. Kavsak. McMaster University, Hamilton, ON, Canada
Background: The National Academy of Clinical Biochemistry guidelines on the Use of Tumor Markers in Clinical Practice: Quality Requirements (2008) recommended that laboratories establish a defi ned protocol when changing tumor marker methods. This may necessitate including a crossover period during which patient samples are analyzed by both thecurrent and new tumor marker assays in parallel. However, some tumor marker assays, such as total prostate-specifi c antigen (PSA), have been standardized, with traceability to the World Health Organization (WHO) standard. Thus, when switching standardized total PSA methods, it may not be necessary to provide overlapping testing if the method comparison during the validation is acceptable. The objective of this study was to assess agreement between Abbott Architect total PSA (new laboratory assay) and Roche Modular total PSA (current laboratory assay) during the method validation and subsequently in the crossover timeframe when both Abbott and Roche total PSA results were reported.Methods: In accordance with the Clinical and Laboratory Standards Institute (CLSI) Guideline EP09 (Method Comparison and Bias Estimation using Patient Samples), 40 patient samples (serum) were split and run on each platform for total PSA with Passing & Bablok regression analysis performed. After this validation, a crossover study was performed during which both the Roche and Abbott total PSA assays were reported clinically for 54 days. Passing & Bablok regression was also performed on this dataset. Agreement between results was determined according to CLSI Guideline C45-A (Verifi cation of Comparability of Patient Results within One Health Care System), with the percent difference between results (calculated as the absolute difference between Roche and Abbott results on a sample, divided by the mean of those results) deemed acceptable if ≤0.33xCVi (CVi=intraindividual biological variation; 18.1% for total PSA). Analyses were performed using Analyse-it and Statsdirect software.Results: Of 40 paired samples in the validation analysis, the median total PSA values (ranges) were 3.08 μg/L (0.03-61.49 μg/L) and 2.85 μg/L (0.03-54.73 μg/L) for the Roche and Abbott assays, respectively. Regression analysis yielded: (Abbott total PSA)=0.99(95%CI:0.95-1.03)x(Roche total PSA)-0.01(95%CI:-0.04-0.00). During the crossover, 1110 paired results were obtained. The median total PSA values (ranges) were 3.30 μg/L (0.04-2710 μg/L) and 3.45 μg/L (0.05-2666 μg/L) for the Roche and Abbott assays, respectively, on 948 paired samples with detectable concentrations by both methods. In the 162 samples with at least one assay result below the functional sensitivity (Roche <0.03 μg/L; Abbott <0.05 μg/L), 139 (86%; 95%CI:79-91%) of the samples had concentrations below the functional sensitivities of both assays. Regression analysis on samples detectable by both methods yielded: (Abbott total PSA)=1.04(95%CI:1.03-1.04)x(Roche total PSA)-0.02(95%CI:-0.03-(-0.02)).
A-46
High-throughput screening of ALK, RET, and ROS1 fusion transcripts in Non-Small Cell Lung Cancer (NSCLC) by Multiplex Real-time RT-PCR High-Resolution Melting curve analysis
S. Itoga1, K. Sato1, Y. Sakairi2, T. Ishige1, K. Matsushita3, I. Yoshino2, F. Nomura3. 1Chiba University Hospital, Chiba City, Japan, 2Department of General Thoracic Surgery, Chiba University Graduate School of Medicine, Chiba City, Japan, 3Department of Molecular Diagnosis, Graduate School of Medicine, Chiba University, Chiba City, Japan
Background: The identifi cation of tumor-driving oncogenic transcripts is advantageous for molecular targeted therapy for NSCLC. However, specifi c detection of the ALK, RET, and ROS1-translocated fusion genes transcripts, coding strong kinases, is still challenging mainly because the breakpoints of these genes are diverse or inconsistent. The purpose of this study was to develop and evaluate a novel and simple high-throughput multiplex real-time RT-PCR high-resolution melting curve analysis (RRT-PCR HRM) that can be used for the detection of various ALK, RET, and ROS1 fusion transcripts.Methods: We used 264 tissues samples obtained from 132 NSCLC patients treated in Chiba University Hospital, Japan. Primary tumor tissue samples were obtained by conventional needle aspiration biopsy with fl exible endo-bronchoscopy and lymph nodes tissues were obtained using a convex-type ultrasound probe. These biopsy tissue samples, rinsed with fl uids (ultra-micro sample; uMS), were used for further genetic analysis. Translocated fusion genes such as EML4-ALK, KIF5B-ALK, CCDC6-RET, KIF5B-RET, TPM3-ROS1, SDC4-ROS1, SLC34A2-ROS1, CD74-ROS1, EZR-ROS1, and LRIG3-ROS1 were examined using the multiplex RRT-PCR HRM system. To determine the sensitivity of the RRT-PCR HRM, we performed a plasmid synthesized DNA titration study.Results: RNA was successfully extracted from both bronchoendoscopic biopsy samples and uMSs. ABL mRNA expression was used as the RNA internal extraction control: 6.2E+05 ± 1.2E+06 (mean ± SD) copies/μg RNA from tissue samples, and 1.1E+05 ± 2.0E+05copies/μg RNA from uMSs. Fusion gene transcripts, including ALK (n =5), RET (n = 1), and ROS1 (n = 1), were identifi ed in 7 cases. Identical results were obtained for both histological samples and MS. Additionally, plasmid templates representing all the transcripts were amplifi ed, and they showed predicted PCR sizes. This method potentially enabled the detection of every fusion transcript, and 7-20 copies/reaction were obtained.Conclusion: We developed a novel and simple high-throughput multiplex RRT-PCR HRM system for detecting ALK, RET, and ROS1 fusion transcripts. This method is clinically useful for detecting kinase-fusion transcripts even in tiny lung cancer tissues obtained by bronchoscopic uMS.
A-47
Evaluation of absence of dietary interferences using FOB Gold® Screen System in the determination of occult blood in fecal samples
M. Gramegna, M. La Motta, G. Longo, M. Anelli, R. Lucini. Sentinel CH. SpA, Milan, Italy
Background:In the determination of occult blood in fecal samples is critical to avoid interferences in the analytical results caused by animal hemoglobin present in the diet of tested subjects. For this purpose, it is fundamental to dispose of a reagent able to recognize human hemoglobin molecules exclusively. The objective of this study was to evaluate cross reactivity (analytical specifi city) of hemoglobins of animal origin on clinical performances of FOB Gold® Screen System. This study was performed on hemoglobin from bovine, pig, sheep, horse and goat.Methods: Were selected 5 healthy subject, over the age of 50 years (target age in the clinical screening) and under the age of 70 years. Subjects were not subjected to dietary restrictions. Healthy subjects wereselected by subjecting the volunteers to test for occult blood (FOB). For each subject were tested 3 samples, in 3 different days, before starting to feed with dedicated diet. All subjects tested negative were involved in the study. The selected subjects will be submitted for at least 1 week at a diet consisting mainly of cooked bovine meat (100 g/day). The results must were negative throughout the period of 6 days. After the fi rst phase with cooked meat, the selected subjects will be submitted for

Tuesday, July 30, 9:30 am – 5:00 pm Cancer/Tumor Markers
A14 CLINICAL CHEMISTRY, Vol. 59, No. 10, Supplement, 2013
Samples were analyzed for TgAb using a simultaneous one-step immunoenzymatic assay (UniCel™ DxI 800 automated analyzer, Beckman Coulter, CA), a radioassay method (semiautomated; Kronus, ID) and an indirect noncompetitive enzyme immunoassay (Varelisa Thyroglobulin Antibodies EIA kit, Phadia GmbH, Germany). Tg was analyzed using a simultaneous one-step immunoenzymatic assay (UniCel™ DxI 800 automated analyzer, Beckman Coulter, CA), a solid-phase chemiluminescent immunometric assay (Immulite® 2500, Siemens, LA) and a RIA method (USC Endocrine Laboratories, CA).RESULTS: TgAb detection was examined. Concordance between the DxI 800 and Kronus was 91%. Concordance was signifi cantly lower between DxI 800 and Phadia, and Kronus and Phadia, 71% and 78% respectively. We examined the effects of TgAb interference on Tg concentrations that ranged from 0-463 ng/mL (the upper limit for the DxI 800) with the DxI 800 TgAb recommended cutoff of <4 U/L. There was high correlation between Tg concentrations obtained by DxI 800 and RIA (R2 = 0.98) as well as by DxI 800 and Immulite (R2 = 0.97). Since low Tg concentrations are important for early detection of recurrence, we examined Tg concentrations <12 ng/mL. Here, high discrepancy between methods occurred (DxI 800 vs RIA, R2 = 0.87; DxI 800 vs Immulite, R2 = 0.80). By reducing the TgAb cutoff to <0.9 U/L on the DxI 800, we demonstrated better correlation between the DxI 800 and RIA Tg concentrations (R2 = 0.96), but not the DxI 800 and Immulite (R2 = 0.78).CONCLUSIONS: TgAb detection is signifi cantly different among methodologies. A TgAb cutoff <0.9 U/L for the DxI 800 immunoassay for referral to RIA is clinically necessary.
A-53
A Novel cMET and EGFR Copy Number Variation and cMET Gene Expression Profi ling Single-Tube Assay
J. Nolling, K. Divakar, S. Shekar, A. Leblang, J. Riley, L. Kong. PrimeraDx, Mansfi eld, MA
Objective: Here, we report the development and verifi cation of the ICEPlex* cMET CNV assay, a multiplex PCR assay, which combines cMET/EGFR copy number variation (CNV) and cMET expression in a single reaction on the ICEPlex System.Clinical Relevance: cMET is a proto-oncogene encoding the Hepatocyte Growth Factor Receptor, a receptor tyrosine kinase, which plays an essential role in normal cellular function and oncogenesis. Recent studies have indicated cMET as biomarker for various cancers as well as for drug resistance in the case of anti-EGFR therapy. The protein highly overexpresses in cancer cells by several mechanisms. One of the mechanisms is increase in gene copy number of MET.Methodology: A 5-gene panel, 18-plex assay was constructed for both mRNA and gDNA target detection. For cMET/EGFR CNV and cMET expression profi ling three amplicons per target were designed to increase the precision of target quantifi cation, and two reference genes each for mRNA and gDNA target normalization. Another reference gene was included to monitor chromosome 7 polysomy. The assay design allows amplifi cation from FFPE tissue with template sizes of <100 nucleotides. Multiplexed reactions were optimized for target identifi cation and amplifi cation performance on the ICEPlex instrument using total nucleic acids from various cell lines.Results: A real-time, single reaction 18-plex assay was developed to determine cMET/EGFR CNV and cMET expression on the ICEPlex System. Performance testing using total nucleic acids from cell lines with known cMET CNV and overexpression as well as chromosome 7 polysomy matched published results, and were similar for fresh-frozen or FFPE-derived material. The assay allowed discrimination of approximately two- to four-fold changes in target copy number levels. As little as 1 ng of FFPE-extracted material was suffi cient to determine cMET/EGFR CNV and cMET expression changes.Conclusions: We have developed a novel 18-plex quantitative, multimodal assay that allows determination of both CNV and expression profi ling for multiple targets from FFPE material. This assay has the potential to provide rapid and accurate information on cMET CNV and expression status in a clinical setting with advantages over standard FISH and PCR approaches.* ICEPlex System is for Research Use Only. Not for clinical diagnostic use.
Despite the excellent linear relationship between the Roche and Abbott assays, only 490 samples (52%; 95%CI:49-55%) in the crossover period had a percent difference between the methods ≤0.33xCVi.Conclusion: This study highlights the importance of performing crossover studies when changing tumor marker platforms, even for a standardized assay such as total PSA. It is not suffi cient to run 40 patient samples on each platform and rely on linear regression if comparability of results is the optimal goal.
A-51
Validation of a rapid lateral-fl ow test for the diagnosis and monitoring of immunoglobulin free light chains: retrospective analysis of sera from patients with plasma cell dyscrasias.
J. Campbell, A. Stride, J. Heaney, M. Cobbold, Y. Wang, M. Goodall, S. Bonney, A. Chamba, T. Plant, Z. Afzal, R. Jefferies, M. Drayson. University of Birmingham, Birmingham, United Kingdom
Background: Quantitation of serum κ and λ immunoglobulin free light chains (FLC) is central to the diagnosis and monitoring of patients with plasma cell dyscrasias, including multiple myeloma. At present, laboratory FLC tests offer the only means of quantitating FLC in urine and blood and often have a slow turnaround time that prevents early myeloma diagnosis or identifi cation of relapse. We have developed a rapid lateral-fl ow test (Seralite™) that simultaneously quantitates kappa and lambda FLCs in blood or urine in 10 minutes using highly-specifi c anti-κ and anti-λ FLC monoclonal antibodies (Campbell et al., 2013 JIM). Methods: Seralite™ validation was conducted by retrospective analysis of sera from patients with plasma cell dyscrasias from MRC UK Myeloma IX and XI trials. Specifi cally, 1,975 (MIX n=1,231, MXI n=744) samples at trial entry were used to assess the utility of Seralite™ for diagnosis. Results: Seralite™ displayed excellent clinical concordance with Freelite™ and immunofi xation electrophoresis for identifi cation of abnormal FLC levels. Additionally, cohorts of samples from patients with light chain only myeloma, non-secretory myeloma, and intact immunoglobulin myeloma (IgAκ/λ, IgGκ/λ, IgMκ/λ, IgDκ/λ) were assessed through diagnosis, response to therapy, plateau and relapse. Seralite had excellent concordance with Freelite™ for the quantitation of serum FLC from diagnosis through monitoring. Conclusion: Prospective use of Seralite™ to diagnose and monitor plasma cell dyscrasias at the point-of-care should now be investigated.
A-52
Meeting the Needs of In-house Thyroid Cancer Patients: Identifying Appropriate Thyroglobulin and Thyroglobulin Antibody Testing Algorithms
S. E. Wheeler1, J. Picarsic2, H. Blair1, O. Peck Palmer1. 1University of Pittsburgh, Pittsburgh, PA, 2Children’s Hospital of Pittsburgh, University of Pittsburgh, Pittsburgh, PA,
BACKGROUND: The American Society of Cancer estimates in 2013 >60,000 individuals will be diagnosed with thyroid cancer. The demand for accurate and timely in-house laboratory testing is high. Specifi cally, in differentiated thyroid carcinoma (DTC), the most common thyroid cancer, thyroglobulin (Tg) is used to assess disease recurrence in patients who have undergone thyroidectomy. Commercially available Tg immunoassay methods are most common but are susceptible to Tg antibody (TgAb) interference. In most laboratories TgAb is quantifi ed and manufacturer cutoffs are used to categorize a specimen as TgAb negative (Tg analyzed by immunoassay) or TgAb positive (Tg measurement is referred to an alternate methodology). The Tg radioimmunoassay (RIA) method is a common alternative method as it is less susceptible to TgAb interference. Previous studies demonstrate that lower TgAb cutoffs for immunoassay testing increase the accuracy of Tg concentrations reported. However, referring samples to outside laboratories increases result turnaround time and patient costs. Identifying the limitations of in-house Tg can aid the laboratory in developing appropriate testing algorithms.OBJECTIVE: To investigate the most clinically appropriate TgAb cutoff for refl ex Tg testing by RIA method in a patient population being managed for the recurrence of DTC.MATERIALS AND METHODS: Excess samples (n=61; -80°C storage) were obtained from adults (>/= 18 years old) post total thyroidectomy. These adults were monitored as outpatients for DTC recurrence by the Diabetes and Endocrinology Center.

Cancer/Tumor Markers Tuesday, July 30, 9:30 am – 5:00 pm
CLINICAL CHEMISTRY, Vol. 59, No. 10, Supplement, 2013 A15
July, 4.27 mg/L in August, 60.23 mg/L in October and a maximum value of 135.85 mg/L in December. In these months, the IFE was normal. In January 2013, the κ/λ FLC ratio remained altered (97.41 mg/L) and the IFE was positive (IgD Kappa) for fi rst time in the relapse.Conclusions: This case is a good example of the utility k/λ FLC ratio in the monitoring of multiple myeloma. The k/λ FLC ratio can detect when the chemotherapy applied isn´t completely effective or it can predict future relapses in the patient.
A-61
Study Of Novel Genes-associated With The Risk Of Esophageal Squamous Cell Carcinoma By Whole Genome Expression Array
H. Lin1, H. Shih2, M. Wu3. 1Department of Laboratory Medicine,Teaching and Research center, Kaohsiung Municipal Hsiao-Kang Hospital and Graduate Institute of Occupational Safety, Kaohsiung, Taiwan, 2Department ofDivision of Gastroenterology, Department of Internal Medicine , Kaohsiung Municipal Hsiao-Kang Hospital, Kaohsiung, Taiwan, 3Department of Family Medicine, Kaohsiung Medical University Hospital, Department of Public Health, Kaohsiung Medical University,Center of Environmental and Occupational Medicine, Kaohsiung Municipal Hsiao-Kang Hospital, Kaohsiung, Taiwan
Background:Esophageal cancer is the 6th leading cause of cancer death worldwide in 2008. In Taiwan, most of histological type of esophageal cancer was squamous cell carcinoma; majority of them happened in men. The annual incidence rate of esophageal cancer in men increased ~100% in recent decade (from 5.7/105 in 1995 to 12.1/105 in 2007). The overall fi ve-year survival rate for esophageal cancer was less than 15%, because, once diagnosed, its ability of invasiveness and metastasis is high. Therefore, it becomes crucial to identify the potential novel genes for the prediction of esophageal cancer malignancy in the clinic. Methods:Cooperated with the scientists from the Microarray Lab. Center of Biomedical Engineering Research Laboratory in Industrial Technology Research Institute (ITRI, Hsinchu, Taiwan), we analyzed three Taiwanese ESCC cell lines (CE48T/VGH, CE81T/VGH, and CE146T/VGH) and one Caucassian ESCC cell line (OE21) as well as three normal tissues of esophagus by using the cutting-edge microarray technique (Human OneArray expression system) which probes ~30,000-transcription expression profi ling of human genes. Then, in order to investigate whether these selected candidate genes are really meaningful in vivo, we have fi nished cDNA array analyses in 17-paired ESCC tumor tissues and their normal parts. Result: Among them, we have identifi ed the most signifi cant 10 down-regulated(DCN,PRELP,HBB,C7,HBA1,DES,COX7A1,PLVAP and MYL9) and 13 up-regulated(HMGA2,ECT2,UBAP2L,ZIC2,COPA,IMP-2,HOXC13,WARS,FJX1,HOXA10,HOXD11,ADPGK and IMP-3) novel genes from cell lines. The role and mechanism of these most candidate genes were unknown in esophageal carcinogenesis. These candidate genes were compared by 17-paired ESCC tumor tissues and their normal parts using cDNA array analyses. All gene expression data were represented by T/N ratio. Because mean values can be easily infl uenced by some extreme high or low data, we use median to estimate the expression of these genes. The distributions of these 17 paired tissues among our candidate down-regulated genes show signifi cant results. DCN(T/N=0.63),PRELP(T/N=0.39),HBB(T/N=0.57),C7(T/N=0.15),HBA1(T/N=0.54),DES(T/N=0.08),COX7A1(T/N=0.28) and MYL9(T/N=0.20) show low expression median(T/N ratio <1) except PLVAP(T/N=1.52). All top 10 up-regulated genes plus 3 up-regulated secretory genes HMGA2(T/N=2.25),ECT2(T/N=5.43),UBAP2L(T/N=1.58),ZIC2(T/N=5.54),COPA(T/N=1.32),IMP-2(T/N=4.61),HOXC13(T/N=3.72),WARS(T/N=1.45),FJX1(T/N=1.71),HOXA10(T/N=2.77),HOXD11(T/N=9.05),ADPGK(T/N=2.25) and IMP-3(T/N=3.00) show high expression median. (T/N ratio >1).Conclusion: Compared to the fi ndings from cell lines, we found the high consistency in terms of RNA expressions in those candidate genes, allowing us to be more confi dence that the 23 candidate genes we selected from 3-paired tumor/normal ESCC tissues using microarray technique of Human 1A (version 2) oligo microarray (Agilent Technologies, USA) may play an important role in the occurrence of ESCC
A-62
Real Time PCR Detection of the V600E BRAF Mutation
C. G. Rasuck, F. S. V. Malta, V. C. Oliveira, F. A. Caxito. Hermes Pardini, Vespasinao, Brazil
Background:The V600E BRAF mutation is associated to many different cancer types, specially melanoma, thyroid cancer and colorectal cancer (CRC). BRAF mutations
A-58
Differentiating prostate cancer and prostatic hyperplasia by using capillary electrophoretic protein profi les
H. Kataoka1, T. Sakaki2, M. Kamada1, K. Saito3, Y. Yamamoto3, K. Yabe2, T. Hisahara1, Y. Hatakeyama1, Y. Okuhara1, T. Shuin1, T. Sugiura1. 1Kochi Medical School, Kochi, Japan, 2A&T Corporation, Yokohama, Japan, 3Kyoto University Graduate School of Medicine, Kyoto, Japan
Background: The data from protein electrophoretic profi le with capillary electrophoresis could be used for diagnosis of certain diseases including metabolic syndrome. Moreover, in certain analytical condition protein electrophoretic profi le showed specifi c points of mobility for prostate cancer. Accordingly, the aim of this study was to determine the possibility of discriminating patients with prostatic hyperplasia and prostate cancer by utilizing protein electrophoretic profi le data with ROC analysis.Methods: This study consisted of 25 men with prostate cancer and 55 men with prostatic hyperplasia. Measurement was performed by Capillary electrophoresis under the following condition: voltage; 7.8kV, temperature; 35.5°C, buffer solution; pH 9.9 alkalin buffer, and detection wavelength; 200nm and 214nm. Demarcation curve data were collected by measuring capillary electrophoresis with 10% of N-,N’-dimethyl form amide (DMF, 2μL) as internal standard in diluent. Standardization of the mobility was performed by peak position of both DMF and albumin as standards, and that of peak strength was performed by total protein concentration. All the other demarcation curves were standardized by the same method. Each point of the standardized curve and the confi rmed diagnosis were used in the bootstrap ROC analysis to produce a map of area under the curve (AUC) value.Results: The diagnostic feature of PSA and its calculated F/T value obtained by the conventional method were AUC=0.69 and 0.79. By using the detection wave length of 214nm, prostate cancer had high point located between albumin tail and globulin (AUC=0.708), and between alpha-1 tail and albumin (AUC=0.714) of the standardized curve. Furthermore, when multiple logistic regression analysis were performed using 7 variables (5 excellent mobility areas, age and total protein), protein electrophoretic profi le had good diagnostic ability to differentiate prostate cancer and prostatic hyperplasia (AUC=0.78).Conclusion: The differential diagnosis of prostate cancer and prostatic hyperplasia was possible by changing the detection wave length of the protein electrophoretic profi le.
A-60
Value of serum free light chains in the monitoring of the treatment and relapse of a patient with IgD Kappa multiple myeloma associated with primary amyloidosis.
J. García de Veas Silva, C. Bermudo Guitarte, M. Perna Rodríguez, C. González Rodríguez. Hospital Universitario Virgen Macarena, Sevilla, Spain
Background: Multiple Myeloma (MM) is a malignancy of B cells characterized by an atypical proliferation of plasm cells. IgD MM has a very low incidence (2% of MM cases) and it´s characterized by an aggressive course and a worse prognosis than other subtypes. The free light chains in serum (FLC) are very important markers for monitoring patients with multiple myeloma (MM) and other monoclonal gammopathies. When the serum FLCs are present in low concentrations, they are diffi cult for the detection by conventional methods as serum protein electrophoresis (SPE) and immunofi xation (IFE). We report the case of a patient where FLCs are either undetectable or barely detectable using the conventional qualitative assays.Case report: a 50 years old man was diagnosed in June 2011 of IgD Kappa multiple myeloma with primary amyloidosis associated. He began treatment with VAD (vincristine, doxorubicin and dexamethasone) and hemodialysis. He received three cycles of VAD from July 2011 to August 2011 but the κ/λ FLC ratio was altered during this treatment (from an initial value of 1570 mg/L in July to a value of 1633 mg/L in August). The IFE was positive (IgD Kappa) during the treatment. Due to the minimum response of the disease and the development of demyelinating neuropathy, the treatment was changed to bortezomib and dexamethasone. Then, the patient received eight cycles from September 2011 to April 2012 with a normalization of the κ/λ FLC ratio from an initial value of 1579 mg/L in September to a value of 1.62 mg/L at the end of March 2012 with negative IFE. The patient´s condition improved with this treatment and achieved the complete remission (CR). Three months later, the κ/λ FLC ratio began to increase predicting a relapse with a value of 2.52 mg/L in

Tuesday, July 30, 9:30 am – 5:00 pm Cancer/Tumor Markers
A16 CLINICAL CHEMISTRY, Vol. 59, No. 10, Supplement, 2013
A-64
Synergetic effects of Agomelatine and Cisplatin on proliferation and antioxidants of neuroblastoma cells
S. Ozkanlar1, A. Kara2, N. Kurt3, F. B. Ozgeris3, N. Erturk4. 1Ataturk University Faculty of Veterinary Medicine Department of Biochemistry, Erzurum, Turkey, 2Ataturk University Faculty of Veterinary Medicine Department of Histology, Erzurum, Turkey, 3Ataturk University Faculty of Medicine Department of Biochemistry, Erzurum, Turkey, 4Ataturk University Faculty of Veterinary Medicine Department of Internal Medicine, Erzurum, Turkey
Background: Agomelatine is one of the antidepressant agent used for psychiatric disorders and cis-diamminedichloroplatinum (CDDP) is an antineoplastic agent used for cancer treatments. In this study, we aimed to investigate synergetic effect of agomelatine with or without CDDP on cultured neuroblastoma cell line.Methods: Neuroblastoma cells were cultured in DMEM at 37°C with 5% CO2 ambient to examine the cytotoxic effect of agomelatine with or without CDDP. To examine the effect of agomelatine (30 and 60 μM) and/or CDDP (50 and 100 μM), cells were divided into ten groups depending on different time and doses. Afterwards cell viability was determined in a 96-well microplate using MTT assay. In different series, cells were cultured and treated with agomelatine, CDDP, and combination of agomelatine and CDDP. After harvesting, TAS and TOS were measured via ELISA assay kits.Results: Agomelatine and/or CDDP treatments decreased the cell viability in neuroblastoma cells at the 24th and 48th hours. Furthermore CDDP treatment signifi cantly decreased the cell viability at the same times compared to untreated controls. Treatment with agomelatine and CDDP changed the antioxidant and oxidant capacity at the end of 24 h and 48 h periods.Conclusion: It can be concluded from the results that treatment with agomelatine and CDDP can decrease the cell viability. Thus, these results suggest that the antioxidant and oxidant capacity may be changed by agomelatine and/or CDDP treatment depending on cell proliferation activity.Keywords: Agomelatine, cisplatin, neuroblastoma cell, cytotoxicity, antioxidant
A-66
Analysis of miRNA-125b levels in serum exosomes in advanced melanoma
A. Gonzalez, E. Alegre, M. F. Sanmamed, C. Rodríguez, S. Martín-Algarra. Clinica Universitaria de Navarra, Pamplona, Spain
Background: Malignant melanoma is an aggressive tumor that produces exosomes, which have been implicated in metastasis. Released exosomes from melanoma cells contain microRNAs that could be of utility in the understanding of tumor biology. miR-125b is a microRNA whose downregulation seems to be implicated in melanoma progression and can be released in exosomes.Objective: To analyze miR-125b levels in srm-exosomes from patients with advanced melanoma compared to controls.Methods: Serum and exosomes were obtained from 21 advanced melanoma and 16 disease free patients, and from 19 healthy volunteers. Exosomes were isolated from serum (srm-exosomes) by precipitation with ExoQuick reagent. Equal quantities of miR-54 of C.elegans (cel-miR-54) were spiked to the serum or srm-exosomes. Total RNA was extracted using Trizol reagent. miR-125b was retrotranscribed from total RNA, preamplifi cated and then, quantifi cated by RT-PCR using Taqman technology and specifi c primers. Statistical analysis of Cts was performed using non-parametric tests. Protocol was approved by the EC.Results: Amplifi cation of the spiked cel-miR-54 added to the serum or the isolated srm-exosomes did not show signifi cant differences, which indicated that exosome isolation did not affect miRNA quantifi cation (median Ct-cel-miR-54 in serum: 25.5, IQR:23.2-28.6; median Ct-cel-miR-54 in srm-exosomes 24.3: 25.5, IQR:23.2-28; p<0.05). miR-125b levels in srm-exosomes were signifi cantly lower in melanoma patients compared to disease free patients and healthy controls (table). However, there was no statistical difference in the miR-125b levels in serum between patient groups and controls.
are present in approximately 50% of all melanoma, and 8% of all solid tumors. Heterozygous patients for the V600E mutation do not have a positive response for monoclonal EGFR-antibodies, and are indicated for monotherapy with Vemurafenib (ZELBORAF). This is the fi rst time FDA (Food and Drug Administration) approves a medication based on the patient´s genetic profi le. The quicker the tumor is genetically classifi ed, the more effective can be the approach made by the physicians. The goal of this study is to detect the V600E BRAF mutation using a fast and not expensive method.Methods:Amplifi cation was performed on StepOne Plus Real Time PCR (Applied Biosystems). A set of primers-probes with Primer Express Software (Applied Biosystems, CA) were designed. The fl uorescent reporter for Taqman® MGB probes were FAM (Applied Biosystems). For this study, 70 patients with clinical and laboratorial diagnosis of CRC were tested for the mutation. Real time PCR was performed by a wild-type and a mutant mix, being 8 patients also sequenced for results confi rmation (3 positives and 5 negatives for V600E BRAF mutation).Results:The wild-type mix had an amplifi cation ranging from 52,000 to 87,000 UF (Fluorescence Units), with a plateau formation and Ct (Cycle threshold) between 25 and 39. The mutante mix, in the positive patients, had a signal detection ranging from 32,000 to 60,000 UF, didn’t show plateau formation and Ct ranging from 26 to 39. The DNA concentration should be between 0.1 and 90.0 ng/uL.Conclusion:The performed assay was a rapid, not expensive, and an effi cient method to detect V600E BRAF mutation.
A-63
Prognostic value of serum free light chains ratio at diagnosis in Spanish population with multiple myeloma
J. García de Veas Silva, C. Bermudo Guitarte, M. Perna Rodríguez, C. González Rodríguez. Department of Clinical Biochemistry, Hospital Universitario Virgen Macarena, Sevilla, Spain
Background: monoclonal gammopathies are a group of disorders characterized by clonal expansion of B cells that usually secrete intact monoclonal immunoglobulin, monoclonal free light chains or both. The quantifi cation of serum free light chains (FLCs) is used in the diagnosis, monitoring and prognosis of monoclonal gammopathies. The aim of this study is to evaluate the prognostic value of serum FLCs ratio at baseline in newly diagnosed multiple myeloma (MM) in a Spanish population.Methods: we studied 73 patients with newly diagnosed multiple myeloma (56 intact immunoglobulin MM (IIMM) and 17 light chains MM (LCMM)) during a period of fi ve years (2008-2012). Serum free light chains were measured by turbidimetry (FreeliteTM, The Binding Site, Birmingham, UK). Survival was defi ned as the time from initial diagnosis to death or the last follow-up and was calculated by the method of Kaplan and Meier. The survival curves were compared using the log-rank test. A p value <0.05 was considered to be signifi cant. Statistical analysis was performed using IBM SPSS Statistics 20.Results: FLCs ratio was calculated as κ/λ ratio and we used the median FLCs ratio like cut-off with a FLCs ratio of >26 and <0.24 for kappa and lambda MM respectively for assessing survival. The FLCs ratio was categorized in two groups: “low” (sFLC ratio <26 and >0.24) or “high” (sFLC ratio ≥ 26 and ≤ 0.04). There were 37 patients in group “low” and 36 patients in group “high”. Of the 73 patients studied, 17 died and 56 survived during fi ve year follow-up. In group “low” died 4 patients (10.81%) whereas in group “high” died 13 patients (36.11%). The percentage of deceases in each isotype of MM was the following: 50% (IgD IIMM), 33% (IgA IIMM), 29% (Lambda LCMM), 22% (Kappa LCMM), 14% (IgG IIMM), 0% (IgM IIMM). The fi ve years survival was 59% and 88% in patients in groups “high” (with an abnormal FLCs ratio ≥ 26 and ≤ 0.04) and “low” (with a FLCs ratio between <26 and >0.24) respectively (p=0.007). The estimated relative risk of the event (death of the patient) occurring in group “high” was 4.11 (1.57 – 10.71 95% IC) higher than in group “low”.Conclusions: an altered baseline serum FLCs ratio at diagnosis is an important predictor of poor prognosis in patients with multiple myeloma in our population. So, serum FLCs ratio can be used as survival predictor. The patients with IgA and IgD isotypes have a poor prognostic.

Cancer/Tumor Markers Tuesday, July 30, 9:30 am – 5:00 pm
CLINICAL CHEMISTRY, Vol. 59, No. 10, Supplement, 2013 A17
A-69
Highly Sensitive and Specifi c Single-Tube SNP Assay for Simultaneous Detection of NRAS and BRAF Mutations
K. Madanahally Divakar1, S. Li1, S. Voronov1, V. Scialabba1, M. Schwab2, G. Tsongalis2, J. Riley1, L. Kong1. 1PrimeraDx, Mansfi eld, MA, 2Dartmouth Medical School, Hanover, NH
Objective: Here, we report the development and verifi cation of the ICEPlex NRAS/BRAF SNP Panel, a multiplex PCR assay, which can detect 13 most clinically important NRAS mutations along with 4 other BRAF mutations using nucleic acids extracted from FFPE samples, in a single reaction on the ICEPlex* System.Clinical Relevance: The RAS genes are proto-oncogenes that are frequently mutated in human cancers and are encoded by three ubiquitously expressed genes: HRAS, KRAS and NRAS. These RAS genes have GTP/GDP binding and GTPase activity, and their proteins may be involved in the control of cell growth. RAS proteins exhibit isoform-specifi c functions and in NRAS, gene mutations which change amino acid residues 12, 13 or 61 activate the potential of the encoded protein to transform cultured cells with implications in a variety of human tumors, particularly cancers of the skin, blood and lymphoid tissue.Methodology: NRAS/BRAF SNP detection primers were designed using proprietary technology from PrimeraDx. All primers were analyzed in silico for primer-primer interaction. Cross-reactivity was determined using the ThermoBlast program and wild type cell line gDNA and DNA extracted from FFPE samples. Reaction conditions were optimized using proprietary PCR chemistry on the ICEPlex* System.Results: The single-reaction ICEPlex NRAS/BRAF SNP Panel targets 17 most clinically important mutations in the NRAS and BRAF genes. The kit includes a control assay, which serves as the DNA fragmentation control and for calculated a delta Ct to determine mutation status; and calibration controls to determine the size of amplicons. Analytical studies demonstrate the assay is sensitive (number of copies detected in one reaction), selective (mutant to wild type ratio), and specifi c (relative to wild type genomic DNA background). The assay requires just 5 μL of clinical sample extract for detection of NRAS and BRAF mutations.Conclusions: The ICEPlex NRAS/BRAF assay provides an accurate and sensitive detection of mutation status in a single tube reaction using low DNA input. Compatibility of this automated multiplexed assay may provide a valid tool for future applications in the clinic for diagnostic detection of genomic mutations in cancer, and thus may help initiate appropriate treatment regimen.*ICEPlex is for Research Use Only. Not for clinical diagnostic use.
A-70
Development and Verifi cation of a Multiplex SNP Assay for Detection of 13 cMET Mutations on the ICEPlex System in a Single Reaction
K. Madanahally Divakar, S. Gupta, J. Nolling, J. Riley, L. Kong. PrimeraDx, Mansfi eld, MA
Objective: Here, we report the development and verifi cation of the ICEPlex cMET SNP panel, a multiplex PCR assay, which can detect 13 most important cMET mutations using nucleic acid extracted from FFPE samples, in a single reaction on the ICEPlex* System.Clinical Relevance: cMET is a proto-oncogene that encodes the Hepatocyte Growth Factor Receptor, a receptor tyrosine kinase, which plays an essential role in normal cellular function and oncogenesis. In cancer cells, MET has been implicated in cellular proliferation, cell survival, invasion, cell motility, metastasis and angiogenesis. Recent studies have indicated cMET as a biomarker for various cancers as well as for drug resistance in the case of anti-EGFR therapies. The cMET protein highly overexpresses in cancer cells by several mechanisms. One of the mechanisms is via acquired point mutations in the tyrosine kinase domain.Methodology: cMET SNP detection primers were designed using proprietary technology from PrimeraDx. All primers were analyzed in silico for primer-primer interaction. Cross-reactivity was determined using the ThermoBlast program and wild type cell line gDNA and DNA extracted from FFPE samples. Reaction conditions were optimized using proprietary PCR chemistry on the ICEPlex System.Results: The single-reaction ICEPlex cMET SNP Panel targets thirteen most important mutations in cMET gene. The kit includes a control assay, which is used as DNA fragmentation control and for calculated a delta Ct to determine mutation status; and calibration controls to determine the size of amplicons. Analytical studies
Conclusions: Srm-exosomes can provide a suitable material to measure circulating miRNA in melanoma and lower levels of miR-125b in srm-exosomes are associated with advanced melanoma disease, probably refl ecting the tumor cell disregulation.
Levels (median Ct and interquartile range) of miR-125b in serum and srm-exosomes in control, diseasePatients Serum Srm-exosomesControls 32.8(28.7-35.7) 30.2 (29.0-31.6)Disease free 33.3(29.3-36.8) 32.1 (31.0-35.7)Advanced melanoma 35.2 (32.8-37.2) 37.6 (31.3-39.1)*
A-67
Case report: Detection of c.180_181 TC>AA mutation in codon 61 of the KRAS gene by Pyrosequencing technique.
P. Nishimura1, F. Gandufe1, V. Niewiadonski1, F. Abreu1, M. Freire2, N. Gaburo1. 1DASA, Sao Paulo, Brazil, 2DASA, Rio de Janeiro, Brazil
The detection of KRAS gene mutations has been used to predict response to therapy with EGFR- inhibiting drugs like cetuximab and panitumumab in patients with metastatic colorectal cancer. Certain mutations can activate EGFR- independent signaling pathways, conferring resistance to these drugs. Other tumors can also present KRAS mutations, as lung, pancreas and thyroid.Our objective is to report a case where we detected a rare mutation in codon 61 of the KRAS gene using the Pyrosequencing technique.A 72 years old patient diagnosed with metastatic colorectal cancer was treated with surgery and chemotherapy (FOLFOX associated to Avastin). The test was performed on formalin-fi xed, paraffi n-embedded tumor specimen, after the selection of the specimen region to be analyzed by a pathologist. The DNA was extracted using the Qiaamp FFPE Tissue kit (Qiagen, Hiden, Germany). The codon regions 12, 13 and 61 were amplifi ed by PCR using the KRAS Pyro kit (Qiagen, Hiden, Germany). Successful and specifi c amplifi cation of the region of interest was verifi ed by visualizing the PCR product on capillary eleforesis (Qiaxcel,Qiagen). Preparation of single-stranded DNA was done using PyroMark Q24 vacuum workstation (Qiagen) according to the manufacturer instructions. The pyrosequencing reaction was done on the Pyro Mark Q24 (Qiagen).The pyrogram trace revealed no mutations in the codons 12 and 13 (wild-type) and the mutation c.180_181 TC>AA in codon 61 with a frequency of 30%Mutations in codon 61 of the KRAS gene are rare and there is little data in literature about its frequency and clinical signifi cance.
A-68
Study of the reference interval for the Chromogranin A test
D. Panisa, V. Alastico, I. Almeida, S. Mendonça, O. Denardin, N. Gaburo. DASA, Sao Paulo Brasil, Brazil
Background: Chromogranin A (CgA) is a protein of 49 kDa composed by 439 coded amino acids in the chromosome 14 which is related to the presence of neuroendocrine tumors. Some drugs that are used to treat gastrointestinal dysfunctions may increase some serum levels of CgA, and may compromise the accuracy of the test.Objective: To conduct a study to defi ne a reference range for chromogranin A in a clinical laboratory.Methods: CgA was determined through ELISA (Enzyme-Linked Immunosorbent Assay) method using Chromogranin A (IBL Internacional, Hamburg Germany) kit, in 200 laboratorial samples. Gender distribution was 50% (100 samples) male and 50% (100 samples) female. The results were stratifi ed in three classes: inferior to 20 ng/mL, 21 to 100 ng/mL and superior to 100ng/mL. For the statistics analysis were calculated: standard deviation and variation coeffi cient.Results: Distribution of results between classes were 35% inferior to 20 ng/mL (mean:1,91; SD:5,63) 25% between 21 a 100 ng/mL (mean: 50,13; SD: 16,7) and 40% superior to 100ng/mL (mean: 336,7; SD: 131,5).Conclusion: The database revealed that the interval superior to 100 ng/m is more reliable, representing a more accurate results. This value also represents a safe threshold of reactivity where we can exclude those patients whose CgA levels are high due to the use of drugs.

Tuesday, July 30, 9:30 am – 5:00 pm Cancer/Tumor Markers
A18 CLINICAL CHEMISTRY, Vol. 59, No. 10, Supplement, 2013
Results and Conclusion: The reference range was 2.0 to 36.52 U/mL with the Architect assay and 0.8 to 27.05 U/mL with Beckman. Our upper reference limit for the Architect assay was higher than that described by Roberts and La’Ulu Hotakainen et al (26.4 U/mL) and is according to manufacturers range and several reports in literature to discriminate benign diseases and cancer. The correlation between evaluated methods was poor r = 0.7192 and bias of 19.18%. The performance characteristics of Architect assay, such as conjugated Fab 2’ without Fc portion could justify a higher “signal”. However, the similar reference ranges are not suffi cient to explain discrepancies. The differences between manufacturers require basal realignment in face of changing the method for patients follow-up.
A-73
The evaluation of thyroglobulin measurement for clinical decision in patients with differentiated thyroid cancer
S. Kittanakom, T. Feduszczak, J. Turner, A. Don-Wauchope. Hamilton Regional Laboratory Medicine Program, Department of Pathology and Molecular Medicine, McMaster University, Hamilton, ON, Canada
Background and objective The follow-up and monitoring of serum thyroglobulin (Tg) is an important biomarker after thyroidectomy for differentiated thyroid cancer (DTC). Thyroglobulin (Tg) is a heterogenous 660-kDa glycoprotein and acts as pro-hormone in the intra-thyroid synthesis of thyroid hormones. Serum thyroglobulin (Tg) is usually undetectable after treatment for DTC, and thus it is crucial for the analytical assay to detect very low Tg levels. The aim of this study is to evaluate a possible change in method from radioimmunoassay (RIA) to an automated solid-phase chemiluminescent immunoassay (ICMA) method. Method Method validation and comparision: In the new method, ICMA (Siemens Immulite), serum Tg is captured by ligand-labeled anti-Tg murine mAb and the alkaline phosphatase conjugated sheep polyclonal anti-Tg antibody. The method was calibrated against the standard material (CRM457) and its analytical performance was evaluated for both precision and linearity. The current method is radioimmunoassay, RIA, (Schering S.A., France) based on a mixture of 4 monoclonal anti-Tg antibodies and also calibrated against the standard material (CRM457). Clinical requirements: A meeting with key users from surgery and endocrinology was held. The physicians were provided with the opportunity to describe their requirements. We provided information on the current assay, the proposed assay and the recommendations from NACB Laboratory Medicine Practice Guidelines (LMPG). Results Method validation and comparision: Immulite 2000 ICMA Tg assay claims an assay range of 0.73-84 ug/L with functional sensitivity of 0.9 ug/L. The imprecision
demonstrates the assay is sensitivity (number of copies detected in one reaction), selective (mutant to wild type ratio), and specifi c (relative to wild type genomic DNA background).Conclusions: We have developed a novel multiplex assay, the ICEPlex cMET SNP panel, capable of detection of 13 cMET SNP mutations on the automated ICEPlex System in one single reaction. The ICEPlex cMET SNP panel will be a useful molecular tool for accurate diagnosis of cMET SNP mutations in clinical specimens, which will help in personalized patient management.*ICEPlex is for Research Use Only. Not for clinical diagnostic use.
A-71
Diagnostic and prognostic association of epigenetic inactivation of DAPK1 and P16 genes in epithelial ovarian carcinoma patients
M. Zuberi1, A. MIR2, I. Ahmad1, J. Javid1, P. Yadav1, M. Masroor1, S. Guru1, S. dholariya1, P. Ray1, G. Gandhi3, A. saxena1. 1Maulana Azad Medical college, NEW DELHI, India, 2University of Delhi, NEW DELHI, India, 3LNJP Deptt of Gyaecology Maulana Azad Medical college, NEW DELHI, India
BACKGROUND: Anomalous DNA methylation is the most common molecular detriment leading to the development of a tumour. The potential contribution of DNA methylation to oncogenesis is mediated by one or more of mechanisms that include DNA hypermethylation of tumour suppressor gene and chromosomal instability in cancers. The aim of this study was to investigate the promoter hypermethylation of DAPK1 and p16 gene during the progression of epithelial ovarian carcinoma.METHODS: A series of 50 ovarian carcinoma samples were evaluated. The promoter methylation status of p16 and DAPK1 was assessed by methylation-specifi c polymerase chain reaction. 50 ng of genomic DNA extracted from fresh peripheral blood was methylated in all CpG sites by DNA methylases and treated with the BisulFlash DNA Modifi cation Kit. Converted DNA was amplifi ed by using primers for promoters containing numerous CpG sites and then visualized on a 3.5% agarose gel under UV transillumination. The DAPK1 and p16 gene methylation status was correlated with age, menopause status, chemotherapy, stage and histopathology of the tumour.RESULTS: The frequencies of DAPK1 and p16 gene methylation in EOC patients was found to be 84% (p=0.0001) and 68%(p=0.0006) respectively . However no signifi cant association was seen with age at diagnosis, menopause status, chemotherapy, stage and histopathology.CONCLUSIONS: These results imply that promoter hypermethylation of DAPK1 and p16 may be employed as clinically useful biomarkers for prognosis and diagnosis of EOC noninvasively using genomic DNA. We suggest that aberrant promoter methylation of DAPK1/p16 may serve as a useful biomarker during the follow-up of EOC.
A-72
Comparison of two different methods for CA19-9 antigen
L. G. S. Assunção, B. S. Moura, L. Moutinho, M. D. Farace, H. Garcia. LABREDE, BELO HORIZONTE, Brazil
Background: The CA19-9 is a silalylated form of the Lewis blood group antigen and is a marker for pancreatic cancer. The agreement of CA19-9 results between manufacturers is variable due to characteristics of the tests, standardization and do not achieve the performance for early detection but monitoring disease progression. This study intended to evaluate discrepancies between CA-19-9 immunoassay Abbott-Architect® method in profi ciency and patient samples with similar upper reference limit. Methods: The assay CA19-9XR (Abbott Architect i2000) was compared with GI Access Monitor - Beckman Coulter®. The methods correlation and reference value were studied by analyzing 419 samples, obtained from a population of presumably healthy voluntary blood donors, sent to Labrede (Reference Laboratory in Specialized Diagnostics, MG, Brazil). The tests were performed according to the manufacturers’ recommendations. Methods were compared using linear regression and the reference range was defi ned as the central 95% interval. Statistical analysis were performed by EP Evaluator® and applied CLSI nonparametric and parametric transformed protocols.

Cancer/Tumor Markers Tuesday, July 30, 9:30 am – 5:00 pm
CLINICAL CHEMISTRY, Vol. 59, No. 10, Supplement, 2013 A19
profi les (CV) are 8.4% repeatability (within-run), 17.8% within-lab (total) precision at level 5.43 ug/L. The linearity fi t represented a correlation slope of 0.9795 (y= 0.2876+0.9795x). Overall the results met the claims of the manufacturer for both within run and between run precision and for linearity. Comparative results from 47 patient samples were evaluated by Passing-Bablok regression and Altman Bland plots. The results spanning 0.32 to 99.76 ug/L had a proportional bias of 1.45, and constant bias of 0.06. Similarly, the Altman Bland plot exhibited positive bias (5.318).Clinical requirements: The physicians are very satisfi ed with the RIA assay and the provision of both Tg and anti-Tg Ab result. They would like a faster turnaround time (TAT) as this would facilitate better patient care. They expressed concerns about antibody interference, differences between the two assays for individual patient results and the limit of detection. We recommended dual reporting for 12 months. Investigation of functional sensitivity for both assays, antibody interference will be performed and between run variability over 6 months as recommended in the LMPG.Conclusion: In management of DTC patients, very good analytical and functional sensitivity of the methods are critical to detect small amounts and/or to observe minimal changes in Tg concentration. The ICMA could be a suitable alternative as it provides a faster TAT and claims equal functional sensitivity to RIA. However, the different detection antibody may impact on individual patient results and the interpretation thereof. The involvement of physicians in the planning process allowed us the opportunity to make additional recommendations for the implementation of the proposed new assay.
A-74
WHAT ARE THE SERUM TUMOR MARKERS THAT BEST IDENTIFY OVARIAN MUCINOUS CANCER?
C. CAÑAVATE SOLANO, A. GARCIA DE LA TORRE, J. D. SANTOTORIBIO, M. I. MORENO GARCIA, F. ARCE MATUTE, S. PEREZ RAMOS. Puerto Real University Hospital, Puerto Real (Cadiz), Spain,
Background: Ovarian cancer is the second most common gynecologic malignancy and the most common cause of gynecologic cancer death in the United States. Mucinous tumors often contain cysts and glands lined by mucin-rich cells and constitute 5-20% of ovarian carcinomas. Measurement of the serum concentration of the cancer antigen 125 (CA 125) is the most widely studied biochemical method of screening for ovarian cancer. Cancer antigen 19.9 (CA 19.9) is a mucin protein that may be elevated in ovarian cancer. The aim of this study was to determine the accuracy of serum tumor markers for the diagnosis of ovarian mucinous cancer.Methods: Samples were collected preoperatively from patients for ovarian mucinous tumors. Two categories of patients were included in the analysis: Not ovarian cancer (ovarian mucinous cystadenomas and ovarian mucinous borderline tumors) and ovarian mucinous cancer. The following serum tumor markers were analysed: alpha fetoprotein (AFP), carcinoembryonic antigen (CEA), cancer antigen 15.3 (CA 15.3), CA 19.9 and CA 125. All serum tumor markers levels were determined by electrochemiluminescence immunoassay (ECLIA) in MODULAR E-170 (ROCHE DIAGNOSTIC®). Statistical analysis was performed using the software MEDCALC®.Results: We studied 102 patients with ages between 15 and 80 years (average = 44 years). Ninety of 102 patients were not cancer (76 ovarian mucinous cystadenomas and 14 ovarian mucinous borderline tumors) and 12 were ovarian mucinous cancer. AFP, CEA and CA 15.3 were not statistically signifi cantly different. AUC, cutoff value, sensitivity and specifi city are shown in the following table:(CI: confi dence interval)
AUC (95 % CI) Cutoff Sensitivity(95 % CI)
Specifi city(95 % CI)
CA 125 0.83(0.70-0.92) (p=0.0016) 59.08 U/ml 66.7 %
(22.7- 94.7)88,9 %(75.9- 96.3)
CA 19.9 0.82(0.69-0.91) (p=0.0024) 37.21 U/ml 83.3 %
(36.1- 97.2)79.5 %(64.7- 90.2)
Conclusion: CA 125 and CA 19.9 were the serum tumor markers that showed a higher accuracy for the diagnosis of ovarian mucinous cancer. Preoperative CA19.9 and CA 125 levels can be used to predict whether a suspected ovarian mucinous tumor is benign or malignant.

Tuesday, July 30, 9:30 am – 5:00 pm Automation/Computer Applications
A20 CLINICAL CHEMISTRY, Vol. 59, No. 10, Supplement, 2013
and an increased variety of preanalytical errors. There is an increasing pressure on laboratories to automate processes due to intense workload and to reduce manual processes and errors. Very few studies to date have focused on the outcomes of implementation of automatic tube registration and sorting systems. In the present study, we aimed to evaluate the effects of an automatic tube registration and sorting system on the improvement of the specimen processing (specimen rejection and/or loss, tubes fl ow, laboratory productivity, turnaround time (TAT) of test results, decreasing human errors).Methods: We evaluated an automatic tube registration and sorting system (HCTS2000 MK2, m-u-t AG, Wedel, Germany) which was designed for clinical laboratories to sort closed primary sample tubes in accordance with the barcode information or through queries to the LIS. Each tube was separated from the others and uniquely identifi ed and sorted into one of the target brings (It sorts up to 2000 tubes per hour). All of the estimated data, before (25 Feb 2010-24 Feb 2011) and after (25 Feb 2011-25 Feb 2012) the implementation of the system were analyzed. TAT, the rate of the number of rejected samples and the unrealized samples (samples which had reached to the laboratory but were not realized for requested tests due to variable causes such as sample sorting errors and mislabeling errors) were compared. The number of tests performed in our laboratory in the year prior to the establishment of the system was 3.286.346, the number of the patients 457.143, the number of the sample tubes 820.081, the number of unrealized tests 148.886 (4.5%) and the number of rejected samples was 3351 (0.40%) respectively. For 12-months post-implementation of the system, the number of tests performed in our laboratory was 4.874.670, the number of the patients 459.476, the number of sample tubes 920.152, the number of unrealized tests 68.874 (1.4%) and the number of rejected samples was 1661 (0.18%) respectively. Approximately 33% decrease was found in TAT after the establishment of tube registration and sorting system. The number of rejected samples and unrealized tests were signifi cantly decreased.Conclusions: By reducing delays and errors in preanalytical processing and sorting of samples, signifi cant improvements in TAT and unrealized number of laboratory tests were observed after the establishment of the system. Implementation of the system also decreased specimen rejection rates. Technological advances in laboratory systems have made important differences on laboratory workload and effi ciency reducing manual processes and errors as well as increasing data reliability. An automatic tube registration and sorting system may also be suggested on the improvement of the specimen processing in a higher-volume core laboratory.
A-77
Detection of tumor cells in body fl uids using the automated morphological analysis system CellaVision DM96 following the automated cell counting by the Sysmex XE5000.
H. Takemura1, Y. Tabe2, K. Ishii1, K. Kasuga3, T. Horii1, T. Miida2, A. Ohsaka1. 1Juntendo University Hospital, Tokyo, Japan, 2Juntendo University School of Medicine, Tokyo, Japan, 3Cella Vision AB, Lund, Sweden
Background: Cell enumeration and differential analysis of nucleated cells in body fl uid is important diagnostic tool for several diseases including cancer. In recent years, automated hematology analyzers have been valued as an acceptable alternative to the microscopic cell counts of body fl uid material. However, the detection of tumor cells in body fl uids still requires the microscopy-based manual analysis, which is time-consuming and labor-intensive. In this study, we investigated the capability of the automated morphological analysis system CellaVision DM96 (DM96; Cellavision, Lund, Sweden) to detect tumor cells in body fl uids, and further evaluated the effi cacy of systemic processing of the DM96 following an automated cell counting by the Sysmex XE-5000 (XE-5000; Sysmex, Kobe, Japan) for screening of cancer cells in body fl uids.Methods: A total of 61 body fl uid samples (pleural fl uids 45 and ascitic fl uids 16) obtained from patients with various cancers were analyzed. For cell enumeration, the manual cell counting with hemocytometer was performed. The hematology analyzer XE-5000 determined the number of cells with differential counts, including polymorphonuclear cells (PMNs), mononuclear cells (MNs), and high fl uorescence cells (HF-BF) that are corresponding with macrophages, mesothelial cells, and tumor cells. For morphological analysis, cytospin slides were prepared with the May-Grunwald Giemsa staining method. Manual differential counts (100 cells) were performed by two experienced technologists. Subsequently, all slides were analyzed by the DM96 with verifi cation by two laboratory technologists (post-classifi cation). To detect tumor cells, we reviewed the DM96 overview scanning images of each sample. Cytological examination (Papanicolaou stain) was performed for the clinical diagnosis of invasion of tumor cells. Pearson’s product-moment correlation coeffi cient
Tuesday, July 30, 2013
Poster Session: 9:30 AM - 5:00 PM
Automation/Computer Applications
A-75CUSUM-Logistic Regression Analysis of Patient Laboratory Test Results for Monitoring Quality Controlr
V. Gounden1, M. L. Sampson1, H. E. van Deventer2, A. T. Remaley1. 1Department of Laboratory Medicine, Clinical Center, National Institutes of Health, Bethesda, MD, 2Lancet Laboratories, Johannesburg, South Africa
Background: The periodic analysis of quality control (QC) material is the primary method for monitoring the analytical performance of most laboratory tests. The main drawback of this approach is that test performance is not monitored in the period between QC material, which can result in the reporting of a large number of inaccurate results until a problem is discovered. The use of QC procedures based on patient test results, such as Average of Normals and Bulls algorithm, can help limit this problem, but these approaches are relatively insensitive and often require a large number of inaccurate test results before a problem can be detected. The objective of this study was to develop a new patient based QC procedure for as close as possible the “real time” detection of test errors.Method: Chem-14 panel results (Na, K, CL, urea, creatinine,HCO3, ALP, ALT, AST, glucose, albumin, Ca, total protein, total bilirubin) from a LX20 analyzer were collected over a fi ve year period. Non-normally distributed data were log transformed. Each test result was predicted from the other 13 members of the panel by multiple regression, which resulted in correlation coeffi cients between the predicted and measured result of >0.7 for 8 of the 14 tests. A logistic regression model was developed for predicting a systematic proportional bias that utilized the measured test result, the predicted result, the day of the week and time of day. Reported test results and mathematically transformed values to simulate laboratory errors were used to train the logistic regression model. The output of the logistic regression model, which varied from 0 to 1, was tallied using a daily CUSUM approach. The desired level of error detection was based on CLIA guidelines for total allowable error and was set to limit false positives to only once every 10 days. Validation of the model was performed using a second independent set of patient data.Results: The following are the average run lengths (ARL) before error detection by CUSUM-Logistic regression for each analyte: Na 9.5(SD ± 3); K 15.5(SD ±5.5); CL 7.6(SD± 1.7); urea 40.3(SD± 23.6); creatinine 18.0(SD± 6.7); HCO3 64.3(SD± 56.6); ALP 5.9(SD± 1.1); ALT 9.3(SD± 2.8), AST 10.1(SD± 1.8); glucose 5.5 (SD± 1.4); albumin 27.2(SD± 13.2); Ca 3.9 (SD± 1.0); total protein 18.5(SD± 6.1) and total bilirubin 27.1(SD ± 21.6).In general, tests that showed a close correlation with another test in the panel had the smallest ARL. A few tests,such as albumin which varied greatly depending on the patient population (for example critically ill patients), also benefi ted from inclusion of the time of day and day of week into the model. For even those tests with relatively long ARL, such as HCO3, the time for error detection would still be typically less than the time period between the analyses of QC material for most clinical laboratories.Conclusion: A CUSUM-Logistic Regression analysis of patient laboratory data can be effectively used for the rapid detection of analytical laboratory errors.
A-76
Effi ciencies realized 12-months post-implementation of an automatic tube sorting and registration system in a core laboratory
F. Ucar1, M. Y. Taslıpınar1, G. Ozturk1, Z. Ginis1, G. Erden1, E. Bulut1, N. Delibas2. 1Diskapi Yildirim Beyazit Training and Research Hospital, Department of Clinical Biochemistry, Ankara, Turkey, 2Hacettepe University Medical School, Department of Biochemistry, Ankara, Turkey
Backgrounds: Laboratories are centers that have different and hard workload throughout the working day to achieve reliable laboratory data. Sample classifi cation and registration have been recognized as an important and time-consuming process. When considering these processes, particularly higher-volume core laboratories have the potential to face with more problems such as need for more staff, delays

Automation/Computer Applications Tuesday, July 30, 9:30 am – 5:00 pm
CLINICAL CHEMISTRY, Vol. 59, No. 10, Supplement, 2013 A21
A-80
Integration of an Automated Sample Preparation Workstation for the Analysis of Immunosuppressant Drugs by LC-MS/MS
R. Zhang1, M. Jarvis2, A. Taylor2. 1Beckman Coulter, Indianapolis, IN, 2AB SCIEX, Concord, ON, Canada
Background:For Research Use Only. Not For Use In Diagnostic Procedures. Liquid chromatography-tandem mass spectrometry technology provides laboratories with a powerful tool for robust, accurate, sensitive detection of a wide variety of analytes. Method automation reduces the possibility of human error at many different stages, including preparation of calibration standards, sample preparation, and data processing. The objective of this work was the automation of an LC-MS/MS method for the analysis of the immunosuppressant drugs Tacrolimus, Cyclosporine A, Sirolimus, and Everolimus, to eliminate human error, increase reproducibility, eliminate subjectivity during data processing, and save time.Methods:An LC-MS/MS method for the analysis of immunosuppressant drugs was developed, making use of commercially available whole blood calibrators and controls. In addition to manual preparation, all steps of sample processing could be automated using a BioMek NXP platform. The sample preparation consisted of a simple protein precipitation using ZnSO4 solution. After centrifugation, the clear supernatant was injected directly onto the LC-MS/MS system. Samples were loaded in test tube format and the fi nal samples were prepared in a 96-well plate format. The LC-MS/MS data acquisition, processing, and reporting were automatically performed using the Cliquid® software.Results:The reproducibility of the automated protocol versus manual protocol was assessed by preparing and analyzing replicates of each calibration standard. The measured CVs were at least equivalent between protocols over the entire concentration range covered by the assay. The method displayed good linearity for all four immunosuppressant drugs, with R>0.999.Conclusion: The automation of an LC-MS/MS method for the analysis of the immunosuppressant drugs Tacrolimus, Cyclosporine A, Sirolimus, and Everolimus was achieved. The automation eliminates human error, increases reproducibility, eliminates subjectivity during data processing and saves time.
A-81
A Novel Personalized Delta Check Approach
T. Kampfrath, J. Miller. University of Louisville, Louisville, KY
Introduction: Inaccuracies in specimens of patients may lead to misdiagnosis and inappropriate therapy. The primary purpose of a delta check is to detect misidentifi ed specimens. The delta check procedure compares the change in concentration of an analyte with a delta check limit (DCL) for that analyte. A change greater than the DCL sets a delta check fl ag for that analyte and will be further investigated by the technologist. This procedure is called univariate (multianalyte) delta check (UDC) and generates many false positive fl ags. DCL’s are typically taken from the literature independent from the patient population served by the laboratory. Here, we describe a novel software tool that customizes the DCL for historical patient data of that particular laboratory.Methods: The software accepts BMP or other laboratory results from an output fi le from the LIS, or from manual input. These results are assumed to be correctly identifi ed and free of interferences and contamination. Next, it generates a set of misidentifi ed samples by intentionally pairing results from two different patients. Additionally, for each analyte individually, the program determines which delta check type (absolute change, percent change, rate of absolute change, or rate of percent change) best differentiates correctly identifi ed and misidentifi ed samples for that analyte. The software uses the optimum delta check type for each analyte and calculates the sensitivity, specifi city and effi ciency for each analyte alone and in all 255 possible combinations.Results: The output of the software is a table of the most effi cient delta check combinations along with a comparison to the laboratory’s current delta-check system. Furthermore the software possesses a unique feature that allows the user to determine the maximum number of fl ags the laboratory can handle per day or per shift and adjusts the DCL accordingly.
test and Spearman’s rank correlation coeffi cient test were used for statistical analysis. This study was approved by the Juntendo University Institutional Review Board and performed in accordance with institutional guidelines.Results: In the test for accuracy, correlation coeffi cients between the manual cell counting and the XE-5000 showed good results for total cell number (r=0.990), for PMNs (r=0.989) and for MNs (r=0.994). For cell differentiation, the DM96 (post-classifi cation) resulted in a good correlation to the manual observation (r=0.953). We also found a high correlation coeffi cient between the HF-BF cells % (XE-5000) and the non-hematopoietic cells % (DM96) (r=0.975). Cytological examination detected tumor cells in 25/61 cases, and tumor cells positive samples showed signifi cantly higher HF-BF cells % than negative samples (p=0.01). With regard to sensitivity for detecting tumor cells, the manual microscopic observation had a sensitivity of 76%, the DM96 automated analysis (post-classifi cation) had a sensitivity of 52%, and the review of the DM96 overview scanning images showed the highest sensitivity of 80%. Conclusion: The automated image-recognition technology of the DM96 may provide satisfactory detection of tumor cells in body fl uids. A combination of enrichment with the XE-5000 hematology analyzers followed by the DM96 morphologic analysis may be an attractive alternative to the manual methods for primary cancer screening in body fl uids.
A-78
Regression, difference graph and mountain plots
A. Kallner. Karolinska University hospital, Stockholm, Sweden
Background: Develop additional calculations and visual tools to enhance the evaluation of method comparison data. Introduce the concept of an A-zone and B+C zones, and the “empirical cumulative frequency” or “mountain plot” (CLSI EP 21) in a multifunctional and interactive spreadsheet.Methods: Results from a comparison of T4 concentration measurements by two methods were displayed in a scatterplot. Data, single or duplicate measurements were partitioned in three intervals and the regression estimated in each using ordinary linear regression (OLR). This allows the the dataset and/or the differences to be suitably truncated. The entire dataset was evaluated by OLR and/or Deming regression. The necessary λ-value should be defi ned according to known or measured (duplicates) measurement uncertainty. The distribution of the differences between the methods was evaluated as skewness and a statistical signifi cance calculated by Student’s t-test and Wilcoxon signed rank test. The absolute and relative differences were shown in Bland-Altman-type graphs and with a “tilted mountain plot” superimposed. The A-zone could be set to any predefi ned value for the entire dataset or chosen partitions.Results: Comparison of results is often limited to regression analyses, difference graphs and a signifi cance test. In this report we introduce a considerable fl exibility in managing the data, a new use of the mountain plot and interpretation of the difference plot and defi ning acceptable zones as a complement to correlation estimates and risk analysesConclusion: A simple and straight forward spreadsheet programming can add much to the evaluation and understanding of method comparisons.Figure. Difference graph with partitions and limits of differences and the “tilted” mountain plot

Tuesday, July 30, 9:30 am – 5:00 pm Automation/Computer Applications
A22 CLINICAL CHEMISTRY, Vol. 59, No. 10, Supplement, 2013
A-83
A Design-of-Experiment Approach to the Optimization of Automated Sample Preparation of Clinical Samples
R. H. Wohleb, R. Geyer, M. Svoboda, K. Adelberger, G. Burssens. Tecan Schweiz AG, Männedorf, Switzerland
Background: Clinical analytes from biological fl uids must be separated from the sample matrix prior to a multi-parameter LC-MS/MS analysis in order to minimize the deterioration of chromatographic separation or ionization of the analytes. As a simple and easy-to-use tool for sample preparation, the AC Extraction Plate was developed which separates Immunosuppressants and/or other analytes from the sample matrix. The purifying process requires the use of three liquid mixtures for extraction, wash and elution. A 5 to 10 min plate shaking process replaces cumbersome centrifugation/evacuation steps. The “pipette-and-shake” workfl ow allows for the effi cient optimization of the parameters involved in the sample preparation procedure with a liquid-handling workstation using a Design-of-Experiment (DoE) approach.Objective: It is imperative that a proper pH be combined with solvents, modifying salts and other reagents that enable cell lysis and minimize analyte protein binding while preventing protein precipitation. The object of this study was to develop an automated approach to the optimization of these process parameters and workfl ow using Design-of-Experiment (DoE). Materials and instrumentation:1. Absorption Chemistry coated 96 well plate _ Tecan AC Extraction plate®2. Freedom EVO® Liquid Handling workstation (TECAN, Switzerland) equipped with a plate shaker (Te-Shake™)3. Shimadzu Prominence HPLC connected to an AB SCIEX 4000 QTRAP®.Methodology: The four Immunosuppressants, Cyclosporine D, Everolimus, Sirolimus and Tacrolimus were determined quantitatively from whole blood extracts by LC-MS/MS. The extraction step is strongly dependent on the pH and the organic content of the extraction solvent. The ratio of aqueous modifi er to organic solvent(s)was optimized. The workfl ow using the extraction plate was performed in the following way:1) A modifi er was mixed with an organic solvent.2) This mixture was combined with serum containing the analyte of interest in the well of the Extraction Plate.3) After extraction by orbital shaking of the plate, the solution was removed completely and a wash solution was added to each well.4) After the wash, the analytes were eluted with an elution solvent and analyzed quantitatively by LC-MS/MS.
Conclusion: Here, for the fi rst time we are able to allow the laboratory director to set the DCL according to the laboratory’s patient population and staffi ng constraints. This novel software tool objectively optimizes the Delta Check procedure for a laboratory and can save time and money by reducing the number of false positive delta check fl ags without sacrifi cing sensitivity.
A-82
Workfl ow Process Improvement and Quality in Biochemistry Lab: DSM Westman Labs’ Journey
B. Olyarnyk1, C. Brown1, C. Bauman1, P. Payette2, J. Korbo2, A. Sokoro1. 1Diagnostic Services of Manitoba - Westman Laboratory, Brandon, MB, Canada, 2Roche Diagnostics, Laval, QC, Canada
Introduction: The Institute of Medicine’s (IOM) healthcare domains for assessment of laboratory quality provides attributes of a laboratory test: safe, effective, patient-centered, timely, effi cient and, equitable. Laboratories must aim to meet these criteria. Automation, particularly, preanalytical automation provides the opportunity to meet these criteria. At Diagnostic Services of Manitoba (DSM) we have engaged ourselves to meet this obligation in our service. Westman lab is one of DSM’s tertiary care labs that also act as a reference lab. The Biochemistry section processes approximately 752,000 samples annually (~2.5 million tests). About 20% of the samples are from the 150-bed attached hospital: the rest are referral work. Most of the specimens arrive throughout the end of the dayshift and throughout the evening shift. Approximately 50% of these samples are destined for the automated analyzers, which includes two cobas 6000 lines served by a Modular Pre-Analytics (MPA) preanalytical system and one Integra 800. Objective: To redesign and implement the biochemistry lab workfl ow processes utilizing LEAN concepts. Methods: Workfl ow mapping of the biochemistry lab and specimen management area was done leading to analysis of ineffi ciencies in the outpatient testing process. All of the processes were then streamlined to conform to LEAN concepts. This included protocols for telephone handling, sample registration and triaging, insuffi cient volumes, acceptable container types, and staffi ng. Outcome measures that were used included turnaround time (TAT), sample rejection rates, testing volumes, and staff workload/satisfaction. Results: TAT improved fi ve-fold and NSQ by over nine-fold; all this despite a challenging service demand of 30,000 samples per month on the MPA. Employee satisfaction improved among the second shift as the workload evened out. Conclusion: Preanalytical automation and streamlining of workfl ow processes utilizing LEAN concepts improves laboratory effi ciency and quality. Those improvements facilitate the provision of services with attributes that meet the Institute of Medicine’s (IOM) healthcare domains for laboratory quality.
Automation/Computer Applications Tuesday, July 30, 9:30 am – 5:00 pm
CLINICAL CHEMISTRY, Vol. 59, No. 10, Supplement, 2013 A23
A-85
Validation of DRG:Hybrid XL, a Fully Automated Random Access Analyzer for Immunoassays and Clinical Chemistry, for 17-OH Progesterone
M. Herkert1, S. Passig1, B. Uelker1, T. Dudek1, C. Lauf1, H. Vaupel1, F. Becker1, R. Hellmich1, C. E. Geacintov2. 1DRG Instruments GmbH, Marburg, Germany, 2DRG International Inc., Springfi eld, NJ
The DRG:HYBRID-XL® Analyzer is an innovative and unique instrument that allows the simultaneous measurement of up to 20 samples, with up to 40 different immunoassays and clinical chemistry parameters including turbidimetric tests. After loading of ready-to-use reagent cartridges, typical assay times range from 10-90 minutes. The barcoded master curve can be adjusted by 2-point recalibration.Objective: To validate the Hybrid XL, the steroid hormone 17-α-Hydroxyprogesterone (17-OHP) was analyzed in human serum. 17-OHP is produced by both the adrenal cortex and gonads. In adult non-pregnant women, 17-OHP concentrations vary over the menstrual cycle with concentrations being higher in the luteal phase than in the follicular phase. The hormone is of clinical interest because it is released in excess in congenital adrenal hyperplasia, and is moderately elevated in 11-β-hydroxylase defi ciency.Methodology: The 17-OHP assay is a solid phase enzyme-linked immunosorbent assay, based on competitive binding. 25 μl of serum are incubated for 1 hour at 37°C in a coated well together with 200 μl of enzyme conjugate. Thereby, endogenous 17-OHP of a patient sample competes with a 17-OHP-horseradish peroxidase conjugate for binding to the coated antibody. Unbound components are washed off, and 200 μl of TMB substrate is added to the well to start the color reaction. After 30 min, 150 μl TMB are transferred from the well to a cuvette, and the optical density is measured at 645 nm (450 nm reference wave length). Quantifi cation is done based on a master standard curve that is barcoded on the kit box.Validation: 17-OHP can be quantifi ed from serum and plasma (EDTA, heparin, citrate) on the DRG:Hybrid XL. The dynamic range of the assay is between 0.11-20 ng/mL. The sensitivity was determined according to EP-17A. The limit of detection is 0.11 ng/mL and the limit of quantifi cation is 0.18 ng/mL. The mean within-run precision (determined with 6 samples covering the measuring range of the assay) is 3.98% (n=16; range from 2.65-6.23%). The mean between-run precision is 9.16% (16 different runs; n=32; range from 7.05-14.98%). The mean recovery is 101.1% (n=5; range from 88.4-114.9%). The mean linearity is 100.9% (n=5; range from 76.7-111.2%). Cross-reactivity was evaluated by determining the effective concentration at 50% displacement of various compounds that are structurally related to 17-α-Hydroxyprogesterone. Cross-reactivity is below 0.01% for Estriol, Aldosterone, Androstenedione, Testosterone, DHEA, DHEA-S, Prednisone, Cortisol, and Estradiol. Cross-reactivity for Progesterone was 1.2%. Bilirubin and Hemoglobin (up to 0.5 mg/mL) and Triglycerides (up to 30 mg/mL) have no infl uence on the assay results. The accuracy of the 17-OHP assay on the DRG:Hybrid XL instrument was determined by comparison with 17-OHP manual Elisa (EIA-1292) from DRG Instruments. The correlation coeffi cient is 0.998 (n=118; y=1.053x; sample concentration, range 0.11-19.86 ng/mL). Normal values range between 0.12-2.49 ng/mL (males) and 0.06-3.93 ng/mL (females).Conclusion: The performance of new DRG Hybrid XL analyzer to reproducibly quantify 17-OHP is in good agreement with the manual ELISA from DRG Instruments.
A-86
Automation in the pre analytical phase and sample fl ow: Gains in productivity and safety in a Brazilian clinical laboratory
F. C. S. Roseiro, A. R. Bertini, C. Pereira, C. A. O. Galoro, J. Y. Ferraro, C. C. T. Silva. DASA, São Paulo, Brazil
Introduction: The workfl ow of samples within the pre-analytical laboratory stage is already well defi ned. However, laboratory workloads are constantly growing at the same time that laboratories are under pressure to contain or lower costs. The sample reception department of Científi caLab Laboratory (DASA), business unit that provides laboratory services to the Brazilian Public Market, received in March 2010 almost 25,000 tubes per day, with about 2 million tests to be processed in the lab. This department had at that time 34 FTEs, with a productivity indicator of 56,923 tests / FTE / month. All activities were processed manually, including bar code reading, sorting and aliquoting. A decision to improve and automatize most of these tasks was made.
Results:16 Variations of 5 parameters (3 salts and 2 solvents) were used to determine their infl uence on the MS/MS peak areas of the four Immunosuppressants when from spiked whole blood. Enhancement of the signal intensity and/or signal_to-noise values (S/N) for the Immunosuppressant extraction was determined for the chemical parameters Acetonitrile, LiCI, Ascorbic acid, NH4OH, Carbonate, Isopropanol. A negative infl uence was found for Methanol, Ethanol, Formic acid, NaCholate and Citrate. Ammonium acetate and GDTA were rather neutral. Conclusions: The automated “pipette-and-shake” workfl ow allowed for the effi cient DoE optimization of the parameters involved in the sample preparation procedure. Using this approach with the extraction plate, a set of 15 parameters (e.g., pH, salt, solvent) could be screened with only 4 experiments without changing the protocol for the liquid handling workstation. An optimized mixture for the extraction of Immunosuppressants Cyclosporine D, Everolimus, Sirolimus and Tacrolimus from whole blood was selected. An improved sensitivity for all four analytes of approximately 3-4 fold was achieved by using the Design-of-Experiment (DoE) approach.
A-84
Direct Sampling From Pediatric Collection Tubes on the Abbott Architect Clinical Chemistry Instruments
M. S. Warner1, C. Wilson2. 1Winston-Salem State University, Winston-Salem, NC, 2UNT, Denton, TX
Background The ability to sample directly from pediatric collection tubes eliminates the need to transfer small volume samples to sample cups for testing and maintaining sample identity integrity. A feasibility study was performed to fi nd an acceptable dead volume for several peditube types investigated.Method Testing was performed using fi ve typical, readily available pediatric collection tubes, (four contained Lithium Heparin), and three sample tubes with false bottoms. Architect sample cups were tested as controls. Assays were AlbG, CaC, GluC, Na-C, K-C, Cl-C and TP with 2.0uL to 15.0uL sample volumes. The initial sample volume was based on each assay’s insert, with an 8uL sample overaspiration volume (23uL for ISE assays), plus a 50uL dead volume. Assays were ordered with 5 reps per assay. BioRad LiquiChek Level 2 was used for sample and was pipetted directly into the tubes. The weight of each tube was recorded before and after sample was added. Architect sample cup and false bottom tubes were placed directly into sample carriers. The remaining fi ve pediatric tubes were placed in Becton-Dickinson tube extenders in sample carriers. After testing, tubes were weighed again and the weight recorded. Volume remaining in tubes was calculated from the density of the sample. Tubes with aspiration errors before 5 reps completed were re-tested with increased 10uL dead volume. Process continued until 5 reps for each assay completed with acceptable results. Study was repeated with a new sample volume based on increased dead volume. After the run with fi ve replicates completed successfully, the process was repeated in single replicates for all tubes without aspiration errors. The tubes were re-weighed and weights recorded. Process was repeated until an aspiration error was obtained for each tube. The volume remaining in the last tube with acceptable results was calculated from the density of the sample and the dead volume for each tube determined. Pediatric collection tubes used were Becton Dickson BD 365958, Becton Dickson BD 365987, Greiner 450479, Sarstedt 16.443.100 and Terumo T-MLHG. False bottom tubes were Sarstedt 60.613.010, Sarstedt 60.614.010 and Sarstedt 60.617.010.Results This study was successful if all fi ve replicates initially run completed without any aspiration errors and with acceptable results. Six replicates for each assay, a total of 42 tests, completed without any aspiration errors and with acceptable results. Suggested dead volumes for the tubes were determined to be 85uL for BD-365958, 93uL for BD-365987, 75uL for Greiner 450479, 77uL for Sarstedt 16.443.100, 78uL for Terumo T-MLHG and 74uL for Sarstedt 60.613.010, Sarstedt 60.614.010 and Sarstedt 60.617.010. The gel layer in the pediatric collection tubes and the shape of the false bottom tubes contributed to the dead volume required to get acceptable results.Conclusion An acceptable dead volume can be assigned for each of the specifi c tube types that were investigated. The use of validated peditubes allows direct sampling of critical volume samples, eliminating the manual transfer step and the possibility of patient misidentifi cation and potential labeling errors when the sample is transferred from a peditube to a sample cup.

Tuesday, July 30, 9:30 am – 5:00 pm Automation/Computer Applications
A24 CLINICAL CHEMISTRY, Vol. 59, No. 10, Supplement, 2013
A-88
Performance Evaluation of a New Albumin BCP Assay on the High-Throughput ADVIA Chemistry Systems
R. Jacobson, S. Cherian, J. Dai. Siemens healthcare Diagnostics, Tarrytown, NY
Background: Albumin is the major serum protein in normal individuals. It is synthesized in the liver and has a half-life of 2 to 3 weeks. The main biological functions of albumin are to maintain the water balance in serum and plasma and to transport and store a wide variety of ligands, e.g. fatty acids, calcium, bilirubin and hormones such as thyroxine. Serum albumin measurements are used in the diagnosis and treatment of numerous diseases primarily involving the liver and kidneys.The Albumin BCP procedure is based on the binding of bromocresol purple specifi cally with human albumin to produce a colored complex (1). Due to an enhanced specifi city of BCP to albumin this method is not subject to globulin interference (2). A new assay* for albumin BCP on the automated ADVIA® Clinical Chemistry Systems is under development. The objective of this study was to evaluate the performance of this new Albumin BCP (ALBP) assay on the ADVIA Chemistry Systems.Materials and Methods: In the ADVIA Chemistry ALBP assay, diluted sample is reacted with bromocresol purple (BCP) dye to form an albumin-BCP complex that is measured as an endpoint reaction at 596/694 nm. This assay uses an ADVIA Chemistry albumin calibrator. The performance evaluation in this study included precision, interference, linearity, and correlation with the Siemens ADVIA Dimension Albumin BCP assay. Data were collected for all ADVIA Chemistry Systems (ADVIA 1200, ADVIA 1650, ADVIA 1800, and ADVIA 2400), which use the same ADVIA Chemistry ALBP reagents, ADVIA Chemistry albumin calibrator, and commercial controls.Results: The imprecision (%CV) of the ADVIA Chemistry ALBP assay with two-level commercial controls ranging from 2.6 to 4.0 g/dL (n = 80), each measured over 20 days on all systems, was less than 1.2% (within-run) and 2.5% (total). The analytical range of the new assay was from 0.6 to 8.0 g/dL. The assay correlated well with the Siemens Dimension albumin assay: Y (ADVIA Chemistry) = 0.99x (Dimension albumin) + 0.05 (r = 0.99; n = 69; sample range: 0.9 -7.8 g/dL). The new assay also showed no interference at an albumin level of ~3.3 g/dL with unconjugated or conjugated bilirubin (up to 60 mg/dL), hemoglobin (up to 500 mg/dL), and lipids (Intralipid, Fresenius Kabi AB) up to 525 mg/dL. Minimum reagent on-system stability and calibration frequency were 50 days with a reagent blank measurement of every 30 days.Conclusion: The data demonstrate good performance of the Albumin BCP assay on the high-throughput ADVIA Chemistry Systems from Siemens Healthcare Diagnostics.* Under development. Not available for sale.Reference:Louderback A, Measley AH, Taylor NA. A new dye-binder technique using bromocresol purple for determination of albumin in serum. Clin Chem 1968; 14: 793-4. Brackeen GL, Dover JS, Long CL: Serum albumin. Differences in assay specifi city. Nutr Clin Pract 4:203-205, 1989
A-89
Evaluation of 34 parameters on the multiparameter analyzer AU5811®
m. fonfrede, S. Abdou, D. Bonnefont-Rousselot. pitie salpetriere hospital, paris, France
Background: As a result of major reorganisation of the practice of Medical Biology in France, Clinical Chemistry laboratories have to manage a high number of patient samples while maintaining the analytical quality of results. High throughput analyzers are thus required for new installations. The Clinical Chemistry laboratory of GH Pitié Salpêtrière Charles Foix is facing such a challenge, which is why we evaluated the overall analytical performance and practicality of the Beckman Coulter AU5811 analyzer with special attention to throughput and turn-around time. Methods: Between the beginning of December 2012 and the end of January2013 we evaluated 34 parameters: 26 serum tests, including 9 specifi c proteins, and 8 urine tests including microalbuminuria. Quality controls (2 to 3 levels) were used to estimate within-run and total precision. Patient samples obtained after routine analysis were used for studies on linearity, cross-contamination (tested on potassium and CK) and the usual interferences associated with haemolysis, icterus and turbidity. Correlation on patient samples from the routine laboratory practice was performed in comparison with the Roche Modular P for serum chemistry and urine tests, Roche
Objective: To present the productivity and quality gains in the sample reception department after the introduction of automation systemsMethods: The methodology used in March 2010 was 100% manual. The bar code of the fi rst patient sample was read and all secondary labels were printed, with the frequency of two or more tubes from the same patient. A high number of aliquots (approx. 98,000 per month) was necessary due to the lack of an integrated and smart sample fl ow inside the lab.The introductions of two automated technologies in 2011 and 2012 increased the productivity and effi ciency of the lab:Implementation of Siemens LabCell in September 2011 and of the Sorter MUT HCTS 2000 in January 2012.Results: The introduction of the new productivity tools resulted in the improvement of many performance indicators. We could also observe a much greater satisfaction of the staff with the current process design. The main results were:1) Decrease in the number of daily stored tubes by 400-500 units because of a better sample fl ow and integration of the analytical instruments;2) Reduction in the numbers of pre analytical errors by 60%;3) Decrease in absenteeism of the staff and increase in productivity by 26%;4) Improvements in the sample traceability between departments;5) Drop in the number of aliquots by 52%;6) Safety in the process of receiving and handling the samples.Conclusion: Productivity measured in August 2012 increased by 26%, and the number of tests / FTE / month reached 77,090 in the sample reception department. It was possible to decrease the number of repetitive tasks, reducing the number of human errors and increasing the staff satisfaction and safety.
A-87
VALIDATION OF URINE PARAMETERS IN THE SYSMEX UF1000 IN A BRAZILIAN LABORATORY
E. M. Oliveira, R. A. Cavalcanti, L. L. Jaques, S. B. Ferreira, R. Balherini, M. d. Menezes, S. D. S. Vieira, D. R. B. Mansur, M. Molina, N. Z. Maluf, C. F. D. Pereira. DASA, Barueri, Brazil
Background: The urinalysis department of DASA SP core lab implemented in 2012 the Sysmex UF1000 analyzers for its routine urine tests. The new fl ow was designed to sequentially process biochemical analysis in the Roche Urisys 2400 equipment and urine sediment analysis in the UF1000. The methodology of the last instrument is to count the urinary cells and elements by fl ow cytometry. It performs the analysis and counting of erythrocytes, leukocytes, epithelial cells, cylinders, crystal, mucus, sperm, bacteria and yeasts. We performed the validation of this equipment using the following protocol: linearity study of the erythrocytes, leukocytes and bacteria measurements; evaluation of the reliability index for positive samples; carry-over; repeatability and reproducibility.Objective: Validation of parameters analyzed in the equipment Sysmex UF 1000.Methods:To assess linearity, we used three samples with different results to study the linearity of erythrocytes, leukocytes and bacteria. For the evaluation of the reliability index, 40 samples were studied and compared with the Neubauer chamber microscope analysis, which was the methodology previously used by the laboratory. To assess the Carry-over, high and low samples were used as recommended by the quality commission of our laboratory and to review repeatability, we used two samples, one with normal result and another with altered result, each one analyzed 20 times in a single instrument. The evaluation of reproducibility was done with two levels of controls, processed 20 times each one in 5 consecutive days, four times a day.Results and Conclusion: The verifi cation of linearity showed coeffi cient of 1.0 for erythrocytes, 1,0 to leukocytes and 1,0 for bacteria; we concluded that the linearity obtained a good performance. In the assessment of the reliability index of positive samples, we observed a concordance of 88.7% for the erythrocyte; a concordance of 95.2% for leukocytes; a concordance of 88.5% for the presence of epithelial cells, 88,6% for cylinders; 88,6% for crystals, 99.3% for yeast, 99.3% for presence of spermatozoa and 56.4% for bacteria. We concluded that we obtained an excellent agreement according to Kappa analysis. In the evaluation of carry-over, all analyzes of leukocytes, erythrocytes and bacteria had obtained results within acceptable limits. For the repeatability we observed CV values between 1.64 and 8.20. We noted that the highest CVs were related to red blood cell count. Evaluating the reproducibility we observed the CV values between 1.54 and 8.41, very similar to the repeatability results. However, the larger CVs for reproducibility were related to bacteria count. The equipment UF1000 has been validated according to our procedures.

Automation/Computer Applications Tuesday, July 30, 9:30 am – 5:00 pm
CLINICAL CHEMISTRY, Vol. 59, No. 10, Supplement, 2013 A25
A-91
Optimization of sample workfl ow with focus in the pre-analytical phase in a reference laboratory in Brazil
L. G. S. Carvalho1, C. Pereira2, A. Bertini2, F. E. Pereira1, G. Ludovico1, J. A. D. Maciel3, T. P. Souza3. 1DASA, Cascavel, Brazil, 2DASA, São Paulo, Brazil, 3DASA, Rio de Janeiro, Brazil
Background: The workfl ow of samples within the pre-analytical laboratory stage is already well defi ned. However, laboratory workloads are constantly growing at the same time that laboratories are under pressure to contain or lower costs. In addition to that, it is not always available sorting automation instruments to meet adequately and timely the distribution process and all the variety of sample recipients demanded for sorting. The causes can vary from tubes standardization (diffi cult to obtain in reference labs) to demand fl uctuation (due to commercial or seasonal reasons), common in reference labs routine. When these variables are present, sample fl ow is less effi cient, increasing materials and employees cost, as well as arising potential human errors. Alvaro laboratory receives around 50.000 tubes a day only for the serum work area tests and provides a very important attribute to its customer: single tube submission of the tests, what makes the sorting process a challenge for the lab. The aim of this study is to present the tools and processes developed to achieve excellence and effi ciency in the pre analytical phase of a large and differentiated reference lab.Methods: New setting rules for sample distribution (sorting) and RSD samples fl ow (RSD work cycle tray creation) were proposed within the pre analytical system and was implemented via IT solution, allowing the integration between three lab sectors of higher sample volume (Biochemistry, Immunology and Immunochemistry). This integration was established based in the criteria of speed, capacity and throughput, together with the institution of a tube “transfer” fl ow between these areas. This new procedure simplifi ed the analytical fl ow and enabled the generation of fewer aliquots, giving preference to route the single tube. The labor-intensive sorting and aliquoting practice was dedicated only to manual tests or specifi c routines, which lead to standardization of manual distribution, compared to those used in automated distribution (RSD). These rules were customized according to the lay out and instrument design of Alvaro Laboratory.Results: With the implementation of the optimized manual and RSDs sorting process, we obtained in the period of June 2011 to June 2012, a saving of 112,000 aliquoting tubes, decreasing the overall aliquoting percentage rate from 16.7% to 5.5% and improving the patient / Aliquot rate from 5.96 to 18.34.Conclusion: This project allowed quantitative and qualitative gains that conducted the lab to improvements in productivity, cost and turnaround time for the sorting process, with positive impact on key performance indicators.
A-92
Overutilization of Hemoglobin A1c and Serum protein Electrophoresis Tests in a Large Tertiary Hospital
M. Fenelus, T. C. Brandler, L. Bilello, L. K. Bjornson. North Shore University Hospital Laboratory, Manhasset, NY
Introduction: Under the new Healthcare Reform Act, laboratory professionals are expected to review ordering patterns for clinical laboratory tests to ensure appropriate and effi cient use of laboratory resources. Inappropriate ordering practices contribute to the high cost of healthcare. It is incumbent upon members of the laboratory to work with their clinical colleagues to achieve appropriate utilization of laboratory tests.Objective: To review utilization of two laboratory tests, Hemoglobin A1c (HbA1c) and Serum Protein Electrophoresis (SPEP) over a 6 month period. Methods: A retrospective computerized query of our clinical data repository was performed to document all HbA1c and SPEP tests performed from January to June 2012 for a large tertiary care hospital in central Long Island, NY (North Shore University Hospital). HbA1c test results totaling 4,736 from 3,940 patients and SPEP test results totaling 272 from 256 patients were examined. This study examines utilization of HbA1c and SPEP tests, which are usually ordered once per admission. A second order for the SPEP test within 7 days and HbA1c within 30 days is considered overuse in our study. Results: Review of the HbA1c data showed 415 out of a total of 3,940 patients had two or more HbA1c ordered within one month which confers a 10.5% overutilization for this test. Review of SPEP data showed more than one SPEP ordered within the same week for 9 out of 256 patients, which confers a 3.5% overutilization for this test.
Integra 400 for serum proteins, and Thermo Scientifi c Konelab with DiagAm reagent for microalbuminuria. Valtec protocol designed by the French Society of Clinical Biology was used for comparison analysis. Results: For within-run precision using QC materials (n=30) all 93 coeffi cients of variation were below 2 %, 68 % being lower than 1 %. For total precision (n=30), CVs for serum chemistry parameters were below 2.5 % except for CO2 and creatinine. Urine chemistry parameters showed CVs below 2.5 %, and urine microalbuminuria CV was below 3.7 %. There was no signifi cant cross-contamination between samples, and the method linearities were consistent with the manufacturer’s claims. Interferences were mainly associated with icterus: above a bilirubin concentration of 400 μmol/L a decrease of recovery was observed for creatinine (Jaffe), total protein and cholesterol. Grossly haemolysed samples showed decreased bilirubin recovery. Correlation studies were very satisfactory; some differences were observed with urine protein results, but this is due to the well-known interference of some polypeptide-based plasma expanders. Time for obtaining the results of 900 tests (9 parameters on 100 samples) was 36 min. 06 sec., starting from stand-by. Turnaround time (TAT) for an emergency sample with 7 tests was 11 min. when the analyser was in routine operation. Conclusion: The analytical features and the throughput of the AU5811analyser make it suitable for a laboratory dealing with a large number of samples and looking for fast TAT for emergency analysis.
A-90
Throughput Evaluation of ACCELERATOR p540 Perianalytical Sample Processor using Primary and Secondary Aliquot Samples
A. DeFrance1, J. Lucio1, K. Reed1, Y. Smith1, D. Overcash2. 1Abbott Laboratories, Irving, TX, 2Abbott Laboratories, Abbott Park, IL
Introduction: The ACCELERATOR p540 is a fully automated perianalytical sample processor that performs sample loading and identifi cation, decapping, aliquoting, and sorting operations. The p540 consists of two managed integrated modules. The aliquoter module has aliquoting and sorting capabilities and the sorter module has the capability of sorting into preconfi gured instrument specifi c racks. Primary tubes are pre-loaded into fi ve position racks and introduced to the aliquoter. The primary sample tubes and aliquot samples are sorted to the Aliquoter and /or connected Sorter module. The objective of this study was to measure the p540’s throughput per hour of primary collection tubes and of various aliquot sampling profi les.Methodology: The p540 was programmed using an LIS to process an assortment of capped primary collection tubes and aliquots. The throughput in terms of number of tubes processed per hour was measured. Variations were ordered calling for one, two, or three aliquots from the primary tube. In one experiment, sample tubes were sorted to the Sorter Module connected to the Aliquoter Module via a bridge connection. In a second experiment, all tubes were sorted to the Aliquoter Module secondary sorting garage. The p540 can be confi gured for either path or a combination of both for maximum tube throughput.Results: The table summarizes the throughput results for the various combinations of primary tubes, aliquots, and processor paths.
Tube Throughput Under Various Workload Conditions1 Primary tube + 1 Aliquot
1 Primary tube +2 Aliquots
1 Primary tube + 3 Aliquots
% Aliquots
All Tubes Sent to Sorter:Total No.of tubes/hr
All Tubes Sent to Secondary Garage:Total No. of tubes/hr
All Tubes Sent to Sorter:Total No.of tubes/hr
All Tubes Sent to Secondary Garage:Total No. of tubes/hr
All Tubes Sent to Sorter:Total No.of tubes/hr
All Tubes Sent to Secondary Garage:Total No. of tubes/hr
0 483 490 483 490 483 49010 529 534 517 558 538 58920 572 562 543 603 565 69130 575 565 551 658 536 71350 592 637 566 756 580 70870 614 722 578 775 592 694100 642 862 597 779 611 697Conclusion: The p540 signifi cantly increases workfl ow effi ciency as a stand-alone sample processor as demonstrated by this throughput study. Utilizing a LIS, approximately 500 primary tubes can be processed with increasing effi ciency as the number of aliquots increase. This study demonstrates the benefi t of sorting tubes directly to analyzer specifi c racks while maintaining satisfactory throughput. The p540 Aliquoter and Sorter Modules provide sorting capabilities as desired for optimum effi ciency.

Tuesday, July 30, 9:30 am – 5:00 pm Automation/Computer Applications
A26 CLINICAL CHEMISTRY, Vol. 59, No. 10, Supplement, 2013
Conclusion: Review of the utilization of HbA1c and SPEP in our institution demonstrated overutilization of 10.5% and 3.5% occurred for HbA1c and SPEP, respectively. For HbA1c most of the duplicate orders occurred on the same day or within two consecutive days. The probable explanation for this is that two different physicians independently ordered the test unaware that it had already been ordered. An alternate explanation, that the physician was suspicious of the result and reordered the test for confi rmation, is much less likely considering the time span of one to two days. These percentages represent overutilization of these tests that could be prevented most directly by adding software or intelligent rules to the laboratory or hospital information systems alerting physicians to previous orders in order to avoid duplication.

Molecular Pathology/Probes Tuesday, July 30, 9:30 am – 5:00 pm
CLINICAL CHEMISTRY, Vol. 59, No. 10, Supplement, 2013 A27
A-94
Cell free-DNA as potential biomarker of age deterioration. The Toledo Study for Healthy Aging
A. I. Alvarez-Rios1, P. Molinero2, H. C. Macher1, J. M. Guerrero1, A. Carrillo-Vico2, F. J. Garcia-Garcia3, L. Rodriguez-Mañas4, P. Medrano-Campillo1, A. Rubio2. 1H.U. Virgen del Rocio, Sevilla, Spain, 2Instituto de Biomedicina de Sevilla, Hospital Universitario Virgen del Rocio/CSIC/Universidad de Sevilla, Department of Medical Biochemistry and Molecular Biology, University of Seville School of Medicine, Sevilla, Spain, 3Division of Geriatric Medicine, Hospital Virgen del Valle, Complejo Hospitalario de Toledo, Toledo, Spain, 4Fundación para la Investigación Biomédica, Hospital Universitario de Getafe, Madrid, Spain
Background: Cell-free DNA (cf-DNA) might be a useful biomarker for adverse health effects in old individuals. However, at present, few data regarding to age-associated variations of cf-DNAhas been reported. It would be interesting to narrow the age range in which cf-DNA increase as a potential aging biomarker.Methods: In this work we evaluated serum cf-DNA levels in a large elderly population consisted of 943 subjects between 65 and 95 years old from the prospective Toledo Study for Healthy Aging (TSHA). The subjects were classifi ed according to age into 5 groups: group 1 (65-69 years); group 2 (70-74 years); group 3 (75-79 years); group 4 (80-84 years); group 5 (≥85 years). DNA from 400μL of serum samples was extracted with MagNa Pure Compact Instrument and was measured using a real-time quantitative PCR (q-PCR) assay for the β-globin gene (amplicon length 99 bp), in standard q-PCR cycling conditions, using SYBR Green I dye to detect PCR product. Two microlitters of DNA were amplifi ed in a fi nal volume of 20 μL by using LC480 Master Kit. Statistical signifi cance between the cf-DNA levels of aging group was assessed with the Kruskal-Wallisand Mann-Whitney test. Spearman correlation coeffi cient analysis was used to assess bivariate correlations between all the variables. All statistical analyses were carried out with SPSS Statistics version 19.0 (SPSS Inc., Chicago, IL, USA), p-values < 0.05 were considered statistically signifi cant.Results: The participants were 425 men and 518 women (45.1% and 54.9%, respectively). The median cf-DNA level for the entire cohort was 223.00 ng/mL (minimum 0.020 ng/mL, maximum 7430.00 ng/mL) and interquartile range [IQR] 86.20-414.00 ng/mL. Men had a slightly but signifi cantly higher median cf-DNA level than women (median [IQR]; men 227.50 ng/mL [105.50-456.75] vs. women 220.00 ng/mL [71.03-384.25]; Mann-Whitney test p=0.029). Patients classifi ed according groups of age did not showed differences among sex. Individuals from group 1 (range 65-69 years) show signifi cance lower values (83.60 [4.24-319.00] median [IQR]) compared with the other group of patients (Mann-Whitney test p <0.001 vs. group 1). Median group 2: 290.00 [121.75-521.62]; median group 3: 236.00 [123.00-431.00]; median group 4: 268.00 [154.25-396.25]; and median group 5: 251.00 [141.25-374.75]. When patients were stratifi ed by gender, male individuals behave in a similar way that total populations. The youngest female group also showed lower values compared with the other ones but highest values were found for group 2 that also were signifi cantly higher than the most elderly females at group 5. The cf-DNA levels positively correlated with the patient age (0.194; p<0.001) and negatively with Katz index (-0.007; p=0.018) and Lawton index (-0.010; p=0.003), activities of daily living.Conclusion: Cf-DNA levels may be a potential biomarker of age deterioration in elderly individuals. We have showed a signifi cantly positive correlation of the cf-DNA levels with the patient age. After stratifi cation of the individuals by age group, we demonstrated that cf- DNA levels were signifi cantly lower in group 1 compared with others age groups. We showed an infl exion point of cf-DNA levels on people over 70 years old.
A-96
Apoptotic Markers of Podocyte Injury in Diabetic Nephropathy
R. Popescu1, D. Vlad1, D. Verdes1, N. Filimon2, L. Petrica1, V. Dumitrascu1. 1University of Medicine and Pharmacy, Timisoara, Romania, 2West University, Timisoara, Romania
Background. Diabetic nephropathy (DN) is a common complication of diabetes. In early stages, glomerular damage is not detected, normoalbuminuria being
Tuesday, July 30, 2013
Poster Session: 9:30 AM - 5:00 PM
Molecular Pathology/Probes
A-93Rapid and Cost Effective Measurement of Circulating Cell Free Graft DNA for the Early Detection of Liver Transplant Rejection
J. Beck1, S. Bierau1, S. Balzer1, R. Andag2, P. Kanzow2, S. Hennecke1, J. Schmitz1, J. Gaedcke3, O. Mörer4, J. Slotta3, P. D. Walson2, O. Kollmar3, M. Oellerich2, E. Schütz1. 1Chronix Biomedical, Göttingen, Germany, 2Dept. Clinical Chemistry, University Medicine, Göttingen, Germany, 3Transplantation Surgery, University Medicine, Göttingen, Germany, 4Dept. Anesthesiology, University Medicine, Göttingen, Germany
Background: Cell free DNA (cfDNA) from grafts in the circulation of transplant recipients is a potential rejection biomarker. Its usefulness was shown in heart transplantation during the maintenance phase, using chip and massive parallel sequencing of donor and recipient DNA. Major drawbacks of such methods are high costs, long turnaround and need for donor DNA. We aimed to develop a method that overcomes these obstacles.Methods: Plasma samples from four patients soon after liver transplantation (LTx) and from 11 stable LTx patients were used. Single Nucleotide Polymorphisms (SNPs) were selected for high minor allelic frequencies. Useful SNPs are homozygous in recipient and in graft but with different alleles. Assuming Hardy-Weinberg-equilibrium, this should be ~12.5% of such SNPs; therefore, 37 Taqman assays were established. cfDNA was extracted from ≥1mL EDTA-plasma and subjected to a library preparation, followed by PCRs on a LightCycler480 to defi ne useful heterologous SNPs. These were then used for graft DNA quantifi cation using digital droplet PCRs (BioRad QX100) expressed as fractional percent abundance.Results: At 2% fractional abundance the recovery was 100% (SD:3%) with a total imprecision of 6-16%. The amount of graft DNA in stable LTx patients was 5% (SD:4.7%). The one patient with biopsy proven rejection at day 43 showed a steep increase in graft cfDNA to 50% on day 32, several days before aspartate aminotransferase (AST) and bilirubin increased signifi cantly (Figure). In contrast, the patients with complication free courses had <15% graft cfDNA from day 10 onwards. Conclusion: Signifi cant increase of graft cfDNA preceded AST and bilirubin in LTx rejection. This cost effective technique can determine relative amounts of graft DNA in cfDNA of LTx patients in one working day, which makes this a promising biomarker for early detection of rejection, potentially enabling more timely therapeutic intervention.

Tuesday, July 30, 9:30 am – 5:00 pm Molecular Pathology/Probes
A28 CLINICAL CHEMISTRY, Vol. 59, No. 10, Supplement, 2013
A-98
The CYP1A2*1D Polymorphism Has A Signifi cant Impact On Olanzapine Serum Concentrations
F. Czerwensky, S. Leucht, W. Steimer. Klinikum rechts der Isar, TU München, Munich, Germany
Background: Olanzapine is one of the most widely prescribed second-generation antipsychotic (SGA) drugs. CYP1A2 is believed to be the most relevant metabolizing enzyme. Therefore, polymorphisms affecting CYP1A2 activity may have an important impact on olanzapine serum concentrations and clinical outcome. The CYP1A2*1D polymorphism is a very interesting SNP, since a recently published report shows a signifi cant impact on CYP1A2 activity in smokers [1]. We, therefore, tried to detect the CYP1A2*1D polymorphism by using the LightCycler™ (Roche, Mannheim, Germany) and investigated its infl uence on pharmacokinetics and clinical outcome.Methods: We developed a new rapid-cycle polymerase chain reaction on a LightCycler 2.0, which was cross-validated with RFLP analyses using primers described by Chida et al [2]. The best results were achieved with the following setup: forward-primer:5´GCCCACTCCAGTCTAAATCAAA3´, reverse-primer:5´AGGACAAGCCTTAAATTGGATG3´, sensor-probe:5´LC705-TGATTGTGGCACATGAACCCC-phosphate3´, anchor-probe:5´GAGGTCGAGGCTGCAGTGAGC-fl uorescein3´, 35x (95°C-10sec, 59°C-20sec, 72°C-30sec), 500nM CYP1A2*1D forward and 625nM reverse primers, 60nM hybridization probes, 100ng DNA, 3.125mM MgCl2 and 2μl master hybridization mixture (Roche Diagnostics, Mannheim, Germany), total volume 20μl.Ninety-eight Caucasian inpatients who received olanzapine as part of their treatment for at least 4 weeks were included in our retrospective investigation. Steady-state serum concentrations were measured 12-14h post-dose by a method modifi ed from Kirchherr et al [3]. Baseline demographics, psychopathological state, response and side effects were assessed at admission to hospital and after 4 weeks by means of the PDS rating scale, the clinical global impression (CGI) rating and the dosage record and treatment emergent symptom scale (DOTES). Dose and body weight corrected serum concentrations and PDS- and CGI-improvement were compared for genotype by analysis of variance. Analysis of covariance was used to exclude confounding factors and Pearson correlation to investigate the relationship between olanzapine serum concentrations, PDS- and CGI-improvement and side effect scores.Results: All 98 patients were genotyped successfully on the LightCycler and 56 samples were cross-checked with RFLP. The results were in complete concordance.Carriers of the delT-alleles showed 2.3 or 1.5 (homozygous: n=3, heterozygous: n=6) times higher dose corrected serum concentrations (ANOVA, p=0.003) and 1.9 (n=3) or 1.8 (n=5) times higher dose and body weight corrected serum concentrations (ANOVA, p=0.009) than wildtype-allele carriers (n=89/85;1.60 ng/mL per mg;116.23 ng/mL per mg/kg). In a model adjusted for age, sex, baseline weight (available for n=93) and CYP1A2 inducers (carbamazepin, smoking) the CYP1A2*1D genotype still revealed a signifi cant impact on dose corrected serum concentrations (ANCOVA, p=0.004, estimated marginal means for delT/delT,T/delT,T/T [ng/mL per mg]: 3.49, 2.67, 1.62 (n=3/5/85)). No signifi cant relationship between serum concentrations or CYP1A2*1D genotype and side effects or response was detected. For side effects this is not surprising since the majority (98%) of patients displayed concentrations in or below the therapeutic range (20-80 ng/mL) probably due to dose optimization, e.g. following TDM.Conclusion: We developed a fast and reliable method for detecting CYP1A2*1D. Our results indicate for the fi rst time that carriers of the delT-allele develop signifi cantly higher dose corrected olanzapine serum concentrations, independent of the confounding factors age, sex, baseline weight and concomitant CYP1A2 inducers. Before genotype-based dosage recommendations can help olanzapine treated patients further studies are needed.1.Dobrinas,M:ClinPharmacolTher:2011Jul:90(1):117-252.Chida,M;JpnJCancerRes:1999Sep:90(9):899-9023.Kirchherr,H.;JChromatogrBAnalytTechnolBiomedLifeSci:2006:843:100-113.
A-99
Outcome Of Acute Myeloid Leukemia Patients According To Cytogenetic And Molecular Characteristics
P. Akl, M. Cherry, R. Allen, A. Kanaly, W. Moore, S. Pant, S. Dunn. University of Oklahoma Health Sciences Center, Oklahoma city, OK
Background: Acute myeloid leukemia (AML) is a heterogeneous group of neoplastic disorders with great variability in clinical course, response to therapy, and molecular
characteristic for this stage of disease. Detection of renal dysfunction, before apparition of albuminuria remains a goal for both, clinician and laboratory physician. The exact mechanisms underlying hyperglycemia dependent renal injury are unknown. The aim of our study was to evaluate the relationship between podocyte apoptosis markers and hyperglycemia in patients with diabetic nephropathy.Methods. We examined the urines of a group of 23 patients with DN histopathologically diagnosed (11 with normoalbuminuria and 12 with microalbuminuria) and 5 healthy subjects. Patients with DN were divided in two categories: blood glucose levels < 200 mg/dl and ≥ 200 mg/dl. Midstream urine was collected in sterile containers and centrifuged. The podocytes were isolated and cultivated. The immunofl uorescent method was applied to observe and identify the urinary cell morphology. We used podocalyxin and nephrin antibodies to identify podocyte cells. Cell viability and proliferation was detected using MTT test. Apoptosis was evaluated by RT-PCR analysis of caspase 3 and 9, immunohistochemical detections of Bax and western blot for survivin.Results. After cell culture, the number of podocytes was signifi cantly increased in patients with diabetic nephropathy compared with control group. Immunohistochemical expression of proapoptotic protein Bax was positive in 86,95% of cases (20 patients) and was correlated with high level of glucose. Compared with normal controls, in patients with DN we noticed the up - regulation of caspase - 3 (91,3% of cases) and caspase - 9 (100% of cases) versus lower expression of anti - apoptotic protein survivin (96.65% of cases).Conclusions. We conclude that apoptosis of podocytes have a role in the onset and progression of diabetic nephropathy and it is correlated with hyperglycemia levels.
A-97
Directly detect high risk HPV oncogenes E6/E7 mRNAs from Pap smear without RNA purifi cation, reverse transcription or PCR
L. Zhang1, T. Liu2, R. Chuang1, X. Li2, X. Li2, R. Diaz1, L. Chen1, J. Erickson1, P. Okunieff3, A. Zhang1. 1DiaCarta Inc, Hayward, CA, 2Kodia Biotechnology, CO., Ltd., National Univ. Science Park, Zhengzhou, China, 3Shands Cancer Center, University of Florida, Gainesville, FL
Human Papillomavirus (HPV) infection causes nearly all cervical cancers and it is one of the most prevalent cancers in women. Most cancers of the vulva and vagina are induced by oncogenic HPV types. In precancerous lesions, most HPV genomes persist in an episomal state whereas in many high-grade lesions and carcinomas, genomes are found integrated into the host chromosome. Two viral genes, E6 and E7, are invariably expressed in HPV-positive cancer cells. Their gene products are known to inactivate the major tumor suppressors, p53 and retinoblastoma protein (pRB), respectively. E6 oncoprotein has the capability to up regulate the expression of apoptotic inhibitors; In addition,the E6 and E7 oncogenes cooperate to effectively immortalise primary epithelial cells. It has been demonstrated that HPV E6/E7 expression level plays a key role in the progression of invasive carcinoma of the uterine cervix via the deregulation of cellular genes controlling tumor cell proliferation. HPV E6/E7 oncogenes have been proven to be robust biological markers for prognosis assessment and specifi c therapy of the disease.We have developed a highly sensitive and specifi c nucleic acid hybridization assay using branched DNA (bDNA) to amplify the signals. Specifi c probe sets were designed that bind to the E6/E7 oncogene of each HPV subtype. The assay can simultaneously detect E6/E7 mRNAs for all 14 high-risk HPV subtypes directly from Pap smear samples without RNA purifi cation, reverse transcription or PCR. All HPV mRNA targets are captured through cooperative hybridization of multiple probes, and probe set design determines the specifi city of each HPV subtype of E6/E7 mRNA. Probe set oligonucleotides bind a contiguous region of the target E6/E7 mRNAs and selectively capture target RNAs to a solid surface during hybridization. Signal amplifi cation is performed via sequential hybridization of Pre-Amplifi er, Amplifi er and label probe. The assay is highly specifi c and sensitive, and can detect as low as 50 transcript molecules per mL. Using same patient samples, we demonstrated that the test is more sensitive and specifi c than HC2 assay.

Molecular Pathology/Probes Tuesday, July 30, 9:30 am – 5:00 pm
CLINICAL CHEMISTRY, Vol. 59, No. 10, Supplement, 2013 A29
the Genetic Disease Laboratory Branch for positive specimens previously tested using newborn whole blood. Newborn specimen identifi ed as negative for the nine mutations/variants showed expected normal peaks. We also saw the effect of homozigosity for mutations/variants S135L, Q188R, and N314D expressed by the absence of the characteristic peak and by the bigger mutated peak. For missing specimens, T138M mutation and L218L variant were provided by Department of Genetics, Emory University, to cover the nine common mutations. We evaluated our method by spotting whole blood confi rmed for 2 mutations Q188R and K285N and testing the dried blood spots for expected results. Due to the high percentage of the Hispanic population in California, we had an interest in detecting the IVS2-2 mutation which has been reported as being more prevalent in the Hispanic population. To the best of our knowledge no previous studies had used IVS2-2 samples from actual patients.Conclusion: With our method of extracting DNA from dried blood spots, the GALT confi rmatory assay can be started using the newborn’s original specimen which exempts the newborn from the need for a blood redraw. Furthermore the process for receiving the specimens and reporting of results can be performed faster which helps with the detection of true and false positives sooner and thus reduces emotional stress for families. Providing early results is benefi cial for false positive cases by avoiding unnecessary diet restrictions and medical procedures. In addition early detection of mutations will help the physicians to make the correct diagnosis and counseling to parents of newborn in true positive cases. If we add travel costs for the parents and the cost of testing by an outside laboratory for the State, the monetary savings are considerable.
A-101
EDTA-mediated inhibition of nuclease protects cell-free DNA from ex-vivo degradation in blood samples.
J. Vasques1, T. Santa Rita2, C. Chianca2, L. Velasco1, L. Abdalla1, S. Costa1, G. Barra1. 1Laboratorio Sabin, Brasília, Brazil, 2Universidade de Brasília, Brasília, Brazil
Background: The cell-free DNA (cfDNA) in bloodstream is becoming an important analyte. Several studies have shown that its measurement is useful for monitoring patients with cancer and other health conditions. Moreover, the fetal cfDNA in the maternal circulation is currently the method of choice for non-invasive determination of fetal genetic traits. However, cfDNA is unprotected and it may be susceptible to known blood high nuclease activity. In this study, we use Y chromosome-specifi c sequence (DYS-14) levels in maternal serum and EDTA-plasma to investigate the ex-vivo impact of this nuclease activity on cfDNA quantity.Methods: This study used banked (-20°C) EDTA-plasma and serum paired samples (n=34) from women with a male fetus (gestational age, 12 ± 4 weeks). Informed consent was obtained from all participants and institutional review board approved the study. Experiments were done with sets of 9-10 paired samples, except the -20°C/4°C/24°C assay (EDTA-plasma and serum sample were not paired). Nucleic acid extraction was performed by using Nuclisens easyMAG (bioMerieux). DYS-14 assays were performed on a StepOne Real-time PCR Systems (Applied Biosystems) by using of hydrolysis probe chemistry and absolute quantifi cation. The results were shown as median (Genomic Equivalents/mL). Statistical analyses were Wilcoxon’s test or Friedman’s test. For exogenous nuclease assay samples were treated or not with 25U of DNase I (Fermentas) for 1 hour at 37°C before DYS-14 assay. For endogenous nuclease assay a hydrolysis probe and a passive reference (ROX) were added to the crude serum or EDTA-plasma, fl uorescence increase were measured for 10 hours at 37°C in the Real-time PCR System. For serum nuclease inhibition assay a serial dilution of EDTA from 0.000005 to 50 mM was used.Results DYS-14 quantity was higher in EDTA-plasma than in serum (24.77 versus 18.13 GE/ml, P=0.0137). This difference increased after specimen exposure to 37°C for 24 hours, 22.22 GE/ml for EDTA-plasma versus 5.18 GE/ml for serum, P=0.002. Next, the samples were subject to -20°C, 4°C or 24°C for 24 hours and no difference was observed on DYS-14 concentration in EDTA-plasma, 36.24, 38.02 and 37.31 GE/ml (p=0.328), respectively. In serum, DYS-14 concentration was reduced at 24°C (11.60 GE/ml) compared to -20°C (18.65 GE/ml) and 4°C (17.90 GE/ml), p = 0.0002. Furthermore, DNAse-I treatment did not alter the DYS-14 amount in EDTA-plasma (untreated 16.07 versus treated 17.57 GE/ml, p=0.42) but completely eliminates it in serum, (untreated 9.21 versus treated 0.0003 GE/ml, p=0.0039). Additionally, hydrolysis probe degradation could be detected in serum (12.7-fold) but not in EDTA-plasma (0.28-fold). Finally, hydrolysis probe and DYS-14 degradation in serum was inhibited from 0.5 mM of EDTA.
mechanism to disease. Karyotyping provides the most important prognostic information in adult AML, but 50-60% of patients are cytogenetically normal or have non-informative cytogenetic aberrations and are thus categorized as intermediate-risk. However, this group is highly heterogeneous with a broad spectrum of responses to therapy. Recently, several recurrent molecular markers have proven valuable in further risk-stratifying these intermediate-risk AML cases. Among adverse prognostic markers, FLT3 mutations are particularly unfavorable and most FLT3(+) patients are destined for bone marrow transplantation. In addition, DNMT3A, IDH1 and IDH2 mutations have been independently associated with particularly adverse outcomes in intermediate-risk adult AML. By contrast, mutations in CEBPA and NPM1 have been associated with favorable prognosis. The purpose of this study is to assess frequencies and interactions of these molecular markers compared to laboratory and clinical data for a cohort of AML patients at the University of Oklahoma Health Sciences Center. Patients and methods: A retrospective chart review of all AML patients evaluated between January 2000 and February 2011 was performed. Demographics, laboratory testing, bone marrow biopsy diagnosis, cytogenetics, chemotherapy and stem cell transplantation were collected on all patients. There were 113 adults and 16 children. Available archived DNA was subjected to PCR followed by fragment analysis by capillary electrophoresis to test for FLT3, NPM1, CEBPA mutations or by pyrosequencing to test for DNMT3A (codon 882), IDH1 (codon 132) and IDH2 (codons 140 and 172) mutations. For survival analyses, Kaplan-Meier method was used. Analyses were restricted to intermediate-risk adults due to the limited pediatric cases. Results: Among the 113 adult patients, 61 (56%) were categorized as intermediate-risk; 16/61 (26%) were FLT3(+), 17/61 (28%) were NPM1(+), 6/61 (10%) were CEBPA(+), 10/61 (16%) were DNMT3A(+), 4/61 (7%) were IDH1(+) and 6/61 (10%) were IDH2(+). Univariate survival analyses of the intermediate-risk group indicated inferior overall survival (OS) with FLT3 and combination of FLT3 and DNMT3A mutations (p<0.05). Interestingly, the presence of NPM1 mutations was associated with poor prognosis, while absence of NPM1 carried a better prognosis (p<0.05). To minimize confounding effects of adverse prognostic markers on the survival of patients with NPM1 mutations, we analyzed NPM1(+) patients lacking mutations in FLT3, DNMT3A, IDH1 or IDH2. In these comparisons, the presence of NPM1 mutations in FLT3 negative patients was the only group that did not show inferior OS compared to NPM1 negative patients, indicating that the presence of FLT3 infl uenced the prognosis of patients with mutated NPM1. Conclusion: Our study highlights the importance of performing combinations of mutation analyses in evaluation of overall prognosis in AML patients. Patients with NPM1 mutations were associated with poor prognosis, contrary to previous studies, which showed that mutated NPM1 confer a favorable prognosis. This unfavorable prognosis effect of NPM1 mutations may be related to our small study, in addition to the confounding effect of FLT3 marker infl uencing prognosis.
A-100
Identifi cation Of Galactose-1-Phosphate Uridyl Transferase Gene Common Mutations In Dried Blood Spots.
M. R. Sartippour1, R. Doroudian1, G. Frampton1, F. Lorey2, G. Helmer1, A. Bhandal1. 1Genetic Disease Laboratory Branch, Richmond, CA, 2Genetic Disease Screening Program, Richmond, CA
Background: The defi ciency of galactose-1-phosphate uridyl transferase which converts galactose-1-phosphate to uridine diphosphate galactose results in an inherited metabolic disorder: classic galactosemia (GALT). Common mutations of this enzyme are well-identifi ed using patient whole blood. To avoid the stress of blood redraw for newborns identifi ed as presumptive positive for galactosemia during screening tests, we developed a method to identify galactose-1-phosphate uridyl transferase’s common mutations in dried blood spots.Methods: DNA was extracted from dried blood spots using Qiagen purifi cation and elution solutions. Polymerase Chain Reaction amplifi cation was performed using EmeraldAmp Master Mix and the purifi ed products were subject to single nucleotide extensions using SNaPshot followed by capillary electrophoresis with a 3100 Genetic Analyzer to detect GALT common mutations/variants: IVS2-2, S135L, T138M, Q188R, L195P, Y209C, L218L, K285N, and N314D.Results: Currently for GALT presumptive positive specimens, blood is redrawn from newborn and delivered to the contractor confi rmatory laboratory to be tested. In our study, dried blood spots from newborns identifi ed either as negative or positive for galactosemia in the California Newborn Screening program were tested. Twenty fi ve positive specimens with known mutations were checked for parental consent before use in research. In the blind test, negative or positive specimens were assigned to one analyst. Our results show 100% concordance with genotypes documented in

Tuesday, July 30, 9:30 am – 5:00 pm Molecular Pathology/Probes
A30 CLINICAL CHEMISTRY, Vol. 59, No. 10, Supplement, 2013
followed by direct sequencing or cloning sequencing are common methods used for haplotyping. However, these common methods require labor-intensive procedures. Allele-specifi c sequencing was designed for haplotyping of the NAT2 gene.METHODS: Using rapid DNA polymerase with high-fi delity, we amplifi ed the NAT2 coding region for direct sequencing, allele-specifi c sequencing, and cloning of genomic DNA from 207 healthy Korean subjects. Analysis of the 873-bp coding region of NAT2 was performed in order to search 11 of the most common single nucleotide polymorphisms (SNPs). For cases that were heterozygous for 282C>T, 803A>G and 857G>A, we performed sequencing analysis using the allele-specifi c sequencing primer for one specifi ed allele at one locus. We performed cloning-sequencing analysis for confi rmation of the haplotyping results of allele-specifi c sequencing.RESULTS: Allele-specifi c sequencing determined actual haplotypes for cases that were heterozygous for two or more SNPs. For cases that were homozygous for SNPs, the haplotypes of NAT2 were possibly determined.CONCLUSION: We have developed a simple method for NAT2 haplotyping using allele-specifi c sequencing; this could be an innovative method that reduces labor-intensive procedures and complex inferring algorithms.
A-105
Detection of the single nucleotide polymorphism (rs1468384) in niemann-pick c1-like 1 gene using a PCR-RFLP assay in Nepalese healthy cohort
K. P. Singh1, U. Timilsina2, H. K. Tamang3. 1Maharajgunj Medical Campus (IOM), Kathmandu, Nepal, 2College for Professional Studies, Kathmandu, Nepal, 3Kantipur Dental College Teaching Hospital, Kathmandu, Nepal
Background: Niemann-Pick C1-Like 1 (NPC1L1) protein is a newly identifi ed sterol infl ux transporter actively involved in the cholesterol homeostasis pathway. NPC1L1 proteins are highly expressed in the apical membrane of enterocytes and the canalicular membrane of hepatocytes. Single Nucleotide Polymorphism (SNP) rs1468384 of Niemann-Pick C1-Like 1 Gene is the result of a nucleotide change G to A at position 2993 of the cDNA sequence in exon 2, and it results in the substitution of isoleucine for methionine at amino acid 510 of the NPC1L1 protein. This polymorphism shows decrease in the stability of the protein as analysed in silico by MuPro and StructureSNP softwares. Related data on allelic frequency of this polymorphism in Nepalese population are not available. In this study we have identifi ed the SNP rs1468384 by Polymerase Chain Reaction - Restriction Fragment Length Polymorphism (PCR-RFLP) technique and determined the allelic frequency of this polymorphism in Nepalese subjects by genotype counting.Methods: A total number of 74 healthy subjects were randomly selected within Kathmandu valley. DNA from blood cells was isolated with the DNAsure® blood mini-kit from Genetix, India. The PCR reaction was optimized for 200 ng of DNA. The primer pair selected was according to Praveen P. Balgir et al. 2009 precisely amplifying the SNP specifi c Exon2 fragment of NPC1L1 gene. PCR products showing a single prominent band of 437bp were processed for restriction digestion with BccI (New England Biolabs).Genotype distribution and Allelic frequency were calculated using PopGene.S⋀2(version 1.00) software. All the statistical analysis were done using IBM SPSS Statistics (version 19) software. All tests of statistical signifi cance were two sided with 95% confi dence intervals (CI).Results: Among the total 74 subjects under study, 30 subjects were males while 44 subjects were females. Their mean age was 34.93 ± 10.11 years (males : 34.93 ± 10.57 and females: 34.93 ± 9.93 years). After digestion of the 437 bp fragment obtained by PCR amplifi cation, the three possible genotypes were distinguishable: homozygous AA (437 bp), heterozygous GA (437, 278 and 159 bp), and homozygous GG (278 and 159 bp). Genotype count for homozygous GG allotype was the highest while a complete absence of homozygous AA allotype was found. Genotype distribution was in accordance with Hardy-Weinberg Equilibrium (X2=2.02, DF=1). Genotype frequency distribution among Gender was not statistically signifi cant as analysed by Chi-square test (X2= 0.62, DF=1, p value =0.427). ‘G’ allele frequency (p=0.8581) was found to be high in Nepalese population compared to that of ‘A’ allele (q=0.1419).Conclusions: The study of genotype frequency distribution for SNP rs1468384 in Nepalese population for the fi rst time will defi nitely serve as a major achievement in understanding some complex disease states as atherosclerosis resulting due to any interruption in the cholesterol pathway. Relatively higher prevalence of rs1468384 polymorphism among Nepalese population was found in this study.
Conclusions We found that cfDNA is subject to a temperature-triggered degradation in serum but not in EDTA-plasma. Moreover, exogenous and endogenous nucleases were active only in serum. EDTA probably by chelation of divalent ions inhibits blood nucleases conferring an ex-vivo protection to cfDNA. Ultimately, we developed a real-time fl uorescence method to detect nuclease activity in clinical samples.
A-102
Development of a rapid, novel assay for CYP2C19*17 variants.
S. Lewis1, H. Han1, S. Banerjee2, B. Little3. 1Tarleton State University, Fort Worth, TX, 2Veterans Affairs Medical Center, Dallas, TX, 3Tarleton State University, Stephenville, TX
Clopidogrel bisulfate is a thienopyridine inhibitor of the platelet P2Y12 adenosine diphosphate receptor. Most patients undergoing the insertion of a drug eluting stent after myocardial infarction are prescribed clopidogrel bisulfate (Plavix ®) and aspirin as anti-platelet therapy. Numerous investigations of patients prescribed the anti-platelet drug clopidogrel bisulfate (Plavix®) have demonstrated relationships between patient’s CYP2C19 genotype and their response to clopidogrel as related to clinical outcomes such as blood clots, stent thrombosis, bleeding, myocardial infarctions and major cardiovascular events (MACE). Loss of function CYP2C19*2 and *3 variants have been associated with higher levels of ADP-induced platelet aggregation in patients receiving clopidogrel therapy, and therefore have a greater risk of major cardiovascular events, including stent thrombosis (ST). The CYP2C19*17 allelic variant was shown to signifi cantly reduced ADP-induced platelet aggregation in clopidogrel treated patients and conferred an increased risk of bleeding, In order to undertake large studies to clarify the relationship of CYP2C19 variants on clopidogrel metabolism, additional laboratory tests need to be developed that are more rapid, less expensive and cover the spectrum of clinically signifi cant variants. Of signifi cant interest to investigators of the pharmacogenetic relationship of clopidogrel bisulfate (Plavix ®) and CYP2C19 variant alleles, is the ability to detect the clinically signifi cant CYP2C19 allelic variants. The CYP2C19*17 allelic variant may not be detected by all commercially available genotyping platforms. The objective of this study was to develop a novel qualitative CYP2C*17 qualitative genotyping assay using real-time PCR on DNA samples using primers and fl uorescently labeled probes. Blood samples were collected in EDTA tubes and DNA extracted using the Roche MagNa Pure. DNA concentration of samples was determined to obtain the desired optimum fi nal concentration 25g/mL for controls. PCR primer and probe pair design were prepared by Fluorestric Inc. (Park City, Utah) with known CYP2C19*17 SNP ID= rs 12248560. http://www.ncbi.nlm.nih.gov/SNP/snp_ref.cgi?rs=12(248560) The Roche HybProbe Assay (Real-Time PCR) was used to genotype all patients for CYP2C19*17 allele. PCR was performed in 20-μl volumes in the presence of 1x Roche Genotyping Master mix, 4.0 mmol/L magnesium chloride (MgCl2), 0.2 μmol/L of each probes, and 0.5 μmol/L of each primers. Genotyping and melting curves were evaluated for each sample. The genotyping assay for CYP2C19*17 was optimized with the control samples (wild-type samples lacking CYP2C19*17, heterozygous, and homozygous variants). This novel, rapid, real-time PCR assay to detect both heterozygous and homozygous CYP2C19*17 variants, demonstrates a 100% sensitivity and 100% specifi city when validated with ten positive and ten negative samples previously confi rmed by another method. This assay is reproducible (inter-assay CV=0.22; Intra assay CV=0.16-0.22) and requires only a real-time PCR system with allele-calling software. By combining this novel assay with other author developed assays novel assays to detect CYP2C19* 2 and *3 alleles or commercially available assays, investigators may detect clinically signifi cant CYP2C19 allelic variants. Future clinical studies are needed to corroborate published results demonstrating an increased risk of bleeding in CYP2C19*17 individuals. The use of CYP2C19 genotyping prior to the selection of anti-platelet therapy shows promise to reduce mortality and morbidity in patients with coronary artery stents.
A-103
Simple NAT2 haplotyping using allele-specifi c sequencing
S. Kang, G. Park, S. Jang, D. Moon. Chosun university hospital, Gwangju, Korea, Republic of
BACKGROUND: N-Acetyltransferase 2 (NAT2) is a common metabolizer of many clinical drugs. NAT2 haplotyping requires a complex procedure. Allele-specifi c PCR

Molecular Pathology/Probes Tuesday, July 30, 9:30 am – 5:00 pm
CLINICAL CHEMISTRY, Vol. 59, No. 10, Supplement, 2013 A31
these 96 specimens, 15 cases were positive only by HC-II but the 9 cases were low risk HPV genotypes or other types, and 81 cases were positive only by Anyplex II HPV28 but the 67 cases were high risk HPV genotypes including 13 cases of 16 and/or 18 HPV genotypes and 54 cases of non-16/18 high risk genotypes, respectively.Conclusion: When comparing the HC2 and Anyplex II HPV28 assay for the detection of high risk HPV genotypes, the Anyplex II HPV28 assay exhibited higher concordance with comprehensive genotyping. The Anyplex II HPV28 assay could be used as a single test for identifying HPV types form clinical specimens.
A-108
A case of de novo non-mosaic isodicentric X chromosome: 46,X,idic(X)(q24)
D. Jeon1, W. Lee1, S. Park1, J. Lee1, J. Ha1, N. Ryoo1, J. Kim1, H. Kim2. 1Department of Laboratory Medicine, Keimyung University School of Medicine, Daegu, Korea, Republic of, 2Department of Pediatrics, Keimyung University School of Medicine, Daegu, Korea, Republic of
Isodicentric X chromosomes with an Xq deletion are uncommon. Most of previous cases were mosaic 45,X/46,X,idic(Xq), which showed mainly Turner stigma, then caused confusion in analysis of phenotype-karyotype correlation. Non-mosaic 46,X,idic(X) with Xq deletion are very rare and their phenotypes typically include irregular menstruation, primary or secondary amenorrhea, and possibly gonadal dysgenesis. Therefore, most of patients were diagnosed at later age due to reproductive problem or atypical sexual development. Short stature is a very rare fi nding in non-mosaic 46,X,idic(Xq) patients, to the best of our knowledge, there have been no case who was diagnosed due to short stature as main abnormality. We describe a 8-year-old patient with a de novo non-mosaic isodicentric X chromosome. She visited our hospital due to short stature (119cm, 5-10 percentile). The patient was generally healthy and had no dysmorphic features, including Turner stigmata, psychologic problem or medical concerns. Tests for follicle stimulating hormone, luteinizing hormone, growth hormone, and thyroid profi le were within normal. Karyotyping showed non-mosaic 46,X,idic(X)(q24), and FISH using CEP X probes showed isodicentric X chromosomes in 300/300 metaphase cells. The karyotypes of both parents were normal indicating that this is a de novo changes. Now, the patient is being treated with growth hormone, getting regular follow-up. Although this patient has only short stature without other abnormalities now, further hormonal changes must be checked until she reaches the age of puberty for checking abnormal reproductive problems.
A-109
The fi rst report of 47,XXX/47,XX,+8 mosaicism
D. Jeon1, W. Lee1, S. Park1, J. Lee1, J. Ha1, N. Ryoo1, J. Kim1, H. Kim2. 1Department of Laboratory Medicine, Keimyung University School of Medicine, Daegu, Korea, Republic of, 2Department of Pediatrics, Keimyung University School of Medicine, Daegu, Korea, Republic of
Trisomy 8 mosaicism (T8M), also known as Warkany syndrome, is found about 1/25,000 to 50,000 live borns. The phenotype is variable from normal to severe malformation, and includes an abnormal faces, reduced joint mobility, various vertebral and costal anomalies, eye anomalies, camptodactyly and deep plantar and palmar creases. Mental retardation is frequent and varies from mild to severe although some have normal intelligence. Because of extremely variable phenotype and disappearance of abnormal cell line from peripheral blood by aging, trisomy 8 is often goes undiagnosed. Most, perhaps all, cases are mosaic with a normal cell line, 46,XY or 46,XX, because complete trisomy 8 is lethal. However, to the best of our knowledge, mosaicism of triosmy 8 with trisomy X has not been reported, yet.We report a 10-year-old girl with 47,XXX/47,XX,+8 mosaicism. She visited our hospital for evaluation of tall stature and frequent infections. Her weight was 50 Kg (95-97 percentile) and height was 160 cm (>97 percentile). She had deformity of toes and camptoctyly of left middle fi nger. But other skeletal abnormalities or face abnormalities were not noticed. She had severe frequent upper respiratory infection, oral ulcer and vaginal discharge for 6 years. In conventional karyotyping of peripheral blood, 47,XXX[35]/47,XX,+8[15] mosaicism was found in 50 metaphase cells. In FISH analysis, whereas peripheral blood cells showed trisomy 8 in 40%, buccal cells showed in 12.5%. Karyotype of both parents showed normal. Although the phenotype of trisomy 8 is highly variable, tall stature is very rare. Our patient has tall stature and this is likely to be related to 47,XXX cell line rather than trisomy 8. However, skeletal abnormalities found in toes or fi ngers are similar with those found
A-106
Evaluation of six SNPs of microRNA machinery genes and risk of tuberculosis in Chinese Tibetan population
X. Song, S. Li, Y. Zhou, J. Zhou, X. Lu, J. Wang, Y. Zhou, Y. Ye, L. Wang, B. Ying. West China Hospital of Sichuan University, Chengdu, China
Background: MicroRNAs (miRNAs) act as posttranscriptional regulators of gene expression by targeting mRNA transcripts for either mRNA degradation or translational repression. Recent studies suggest that miRNAs might involve in the immunological mechanism for anti-tuberculosis(TB) protection. Whether the polymorphisms in genes involved in the processing of miRNAs into maturity infl uence the susceptibility of a person to TB has not yet been elucidated. In this study, we investigated the association between TB risk and single nucleotide polymorphisms (SNPs) in microRNA machinery genes in Chinese Tibetan population, which live in the high altitude environment, leading to a series of physiological characteristics differentiate from plainsmen.Methods: We assessed the associations between TB as a risk and six potentially functional SNPs from fi ve miRNA processing genes (DROSHA, DGCR8, DICER, AGO1, and GEMIN4) in a case-control study of 294 tuberculosis patients and 287 frequency-matched (age, gender, and ethnicity) controls from Tibetan/a native of Tibet. All the SNPs (rs10719, rs3757, rs3742330, rs636832, rs7813, and rs3744741) were genotyped by high resolution melting method.Results: The genotype distributions of the six SNPs in patients and controls were all within Hardy-Weinberg equilibrium (HWE) except rs3744741 and rs3757 whose genotype distributions in controls were not in accordance with HWE. The allele and genotype frequencies of rs3742330 were quite different in patients and controls. Genotype frequencies of these three SNPs (rs10719, rs636832, rs7813) didn’t show great vibration between tuberculosis patients and normal subjects. Meanwhile, allele frequencies of these three SNPs analogously distributed between case and control group. The genotype frequency of rs3744741 was obviously different in patients and controls, and as for rs3757, neither genotype nor allele distribution was found to be associated with tuberculosis, however, we could not draw conclusions as their genotype distributions were deviated from HWE. All the cases were divided into two groups based on infection sites: the pulmonary tuberculosis group and the co-infected with both pulmonary and extra-pulmonary tuberculosis group. Between two groups, it did not really make any big difference of genotype distributions and allele frequencies of the six SNPs.Conclusion: Our results suggested that the specifi c genetic variants in microRNA machinery genes may affect TB susceptibility. In this study, rs3742330 of the DICER gene was found to be associated with altered TB risk in Tibetan. This fi nding suggests that rs3742330 might be a useful marker for determining the susceptibility to TB in Tibetan and that the DICER gene might be involved in the development of this disorder. Further epidemiological and functional studies in a larger population are warranted to validate these results.
A-107
Comparison of Hybrid Capture II and a New Multiplex Real-Time PCR assay for the Detection of Human Papillomavirus (HPV) Infections
C. Yi, M. Kwon, S. Yu, K. Ko, H. Woo, H. Park. Kangbuk Samsung Hospital, Seoul, Korea, Republic of
Background: Human Papillomavirus (HPV) testing is an important part of cervical cancer screening and management of women with atypical screening results. The aim of the present study was to evaluate performance of a new multiplex real-time PCR assay (Anyplex II HPV28 Detection, Seegene, Korea) for detecting high risk HPVs compared to the Hybrid Capture 2 (HC2) assay.Methods: A total of 1,114 cervical swab specimens were consecutively obtained in healthy women who visited a healthcare center. All specimens underwent testing for HPV detection using the HC2 assay. If any discrepant results of HPV assays were detected using the two methods, these samples were additionally tested with multiplex PCR and direct sequencing using common and type specifi c primers.Results: Among the 1,114 specimens, the HC2 assay detected 6.5% (72/1,114) cases of HPV with high risk screening, while the Anyplex II HPV28 assay identifi ed 12.4% (138/1,114) cases with high risk genotypes. The overall percent agreement between the HC2 and Anyplex II HPV28 tests was 91.4% (1,018 out of 1,114 specimens). Discrepant results between these assays were presented in 96 cases and these specimens underwent further analysis by multiplex PCR and direct sequencing. Of

Tuesday, July 30, 9:30 am – 5:00 pm Molecular Pathology/Probes
A32 CLINICAL CHEMISTRY, Vol. 59, No. 10, Supplement, 2013
endoxifen levels as well as log-transformed ratios of endoxifen/NDtam and ratios of 4OHtam/tamoxifen (p<0.001).4. In EM groups, it was found that tamoxifen and metabolites levels varied signifi cantly between individuals (>10-fold). These could not be explained by genotype alone.Conclusions: 1. Our CYP2D6 genotyping method is an accurate and reproducible means of detecting an allelic panel selected for our local patient population.2. CYP2D6 genotyping predicts plasma levels of tamoxifen and its metabolites.3. Both approaches of genotyping and TDM may be used for future studies to evaluate the impact of genetic variations, metabolite levels and adherence to individualized tamoxifen therapy.
A-111
Genotyping in the Chemistry Laboratory: Workfl ow for CYP2C9 Single Nucleotide Polymorphism (SNP) Identifi cation
A. Kantartzis, W. Clarke, M. A. Marzinke. The Johns Hopkins University School of Medicine, Baltimore, MD
Background: Genetic variability in drug metabolizing enzymes, including members of the hepatic cytochrome P450 (CYP450) superfamily, may have signifi cant pharmacokinetic and pharmacodynamic consequences in an individual. For example, CYP2C9 genetic variability can infl uence the metabolism of anti-coagulants, anti-epileptics and analgesics. Therefore, knowledge of an individual’s genotype, specifi cally of single nucleotide polymorphisms (SNPs), could drastically improve drug dosing as well as reduce the frequency of adverse events. Current pharmacogenetic testing methods, such as pyrosequencing and GeneChip arrays, are costly and laborious. In this study, we present the development of a novel, streamlined approach for SNP identifi cation, using CYP2C9 as a model. The method includes an initial screen for aberrant genetic sequences via high resolution melting curve (HRM) analysis. This is followed by refl exed testing of non-wild type variants using probe-based quantitative PCR (qPCR) to detect whether variants contain the specifi c SNP of interest.Method: Sequence-specifi c primers were designed to amplify regions fl anking the CYP2C9 SNPs, within wild type (WT) and variant CYP2C9*2 (430C>T) and CYP2C9*3 (1075A>C) control DNA samples. PCR reactions for both HRM and qPCR were prepared using the QIAgility liquid-handling system and DNA amplifi cation occurred on the Rotor-Gene Q thermocycler (QIAGEN). All qPCR reactions contained either a WT or variant probe and amplifi cations were normalized to a housekeeping gene (albumin). HRM analysis as well as qPCR quantitation was performed by the Rotor-Gene Q software. Within-run and between-run precision (% CVs) for both HRM and qPCR approaches were calculated from the melting temperatures for HRM (n=5) and from cycle thresholds (CT) for probe-based qPCR (n=3).Results: HRM screening was able to differentiate wild-type CYP2C9 amplicons from both CYP2C9*2 and CYP2C9*3 variants, by producing distinct melting curve patterns for all three controls. HRM analysis showed within-run and between-run precision of 0.02% and 0.13% for CYP2C9 WT, 0.02% and 0.16% for CYP2C9*2 and 0.11% and 0.16% for CYP2C9*3, respectively. Refl exed probe-based qPCR analysis was then carried out on wild type and variant controls. Quantitation of reactions containing the WT probe resulted in the detection of the amplifi ed WT control but not of the mutant control. Subsequently, analysis of reactions containing the mutant probe resulted only in the detection of the amplifi ed mutant sample. Within and between-run precision for the probe based qPCR assays were calculated as 0.62% and 1.11% for CYP2C9 WT, 3.53% and 1.23% for CYP2C9*2 and 4.49% and 3.59% for CYP2C9*3, respectively. All PCR amplicons were confi rmed for primer specifi city by electrophoresis and for genotyping accuracy by single nucleotide extension Sanger-sequencing.Conclusion: HRM analysis is a precise and robust screening tool for discriminating CYP2C9 WT from non-WT variant genotypes. Since variants are seen at a <15% prevalence, HRM analysis is a cost-effective method for genotyping ~85% of the population. In our model, the remaining ~15% would be refl exed to a probe-based qPCR method, which can determine SNP identity. Using CYP2C9 as a model, this platform may be expanded to several other key drug-metabolizing enzymes to assist in directing therapeutic regimens in clinical settings.
in T8M. Although little correlation between the level of mosaicism and the extent of the clinical phenotype has been reported, relatively low percentage of trisomy 8 cell compared to trisomy X cell might result in relative mild phenotypes. Moreover, trisomy 8 cells of this case are guessed to originate from 47,XXX cell through mitotic dysjunction, because trisomy 8 cells are less frequent than trisomy X cells in not only peripheral blood but also buccal tissues, and most of trisomy 8 is thought to be due to mitotic dysjunction during early zygotic development. Here, we report the fi rst case of 47,XXX/47,XX,+8 mosaicism who showed tall stature and mild skeletal abnormalities.
A-110
Establishing Analytical Methods for CYP2D6 Genotyping and Measurement of Tamoxifen and its Metabolites for the Assessment of Tamoxifen Therapy
B. Y. L. Wong1, L. Fu2, A. Romaschin3, E. Warner4, H. Vandenberghe3, D. E. C. Cole5. 1Sunnybrook Health Sciences Centre, Toronto, ON, Canada, 2Department of Clinical Pathology, Sunnybrook Health Sciences Centre; Department of Laboratory Medicine and Pathobiology, University of Toronto, Toronto, ON, Canada, 3Department of Biochemistry and Li Ka Shing Research Institute, St. Michaels Hospital; Department of Laboratory Medicine and Pathobiology, University of Toronto, Toronto, ON, Canada, 4Department of Medical Oncology, Odette Cancer Centre, Sunnybrook Health Sciences Centre, Toronto, ON, Canada, 5Department of Clinical Pathology, Sunnybrook Health Sciences Centre; Department of Laboratory Medicine and Pathobiology, Pediatrics (Genetics), and Medicine, University of Toronto, Toronto, ON, Canada
Background and objectives: Some studies have demonstrated a clinically relevant impact of CYP2D6 genotype on outcome of tamoxifen therapy. However, recent data suggests that less than 40% of interindividual variability in plasma levels of active metabolite endoxifen can be explained by CYP2D6 genotype. Our study aimed to (1) establish analytical methods for CYP2D6 genotyping and measurement of tamoxifen and metabolites; (2) evaluate the genotype-phenotype relationships; (3) explore the potential roles of genotyping and therapeutic-drug-monitoring (TDM) in individualizing tamoxifen therapy.Methodology: Subjects: 100 consecutive breast cancer patients were recruited from the Medical Oncology Clinics at Sunnybrook Odette Cancer Centre over 6 months. To be included in the study, patients needed to be receiving tamoxifen 20 mg/day for at least 6 weeks, for chemoprevention, adjuvant therapy or metastatic disease.CYP2D6 Genotyping: Extracted DNA was genotyped using long-range PCR and multiplexed primer extension reactions. Long-range PCR products for duplication or deletion were detected by 1% agarose gel electrophoresis. SNaPshot reaction products were detected by ABI PRISM 3100-Avant Genetic Analyzer (Applied Biosystems, USA). Measurement of tamoxifen and metabolites: Tamoxifen and metabolites were quantitated by liquid chromatography tandem mass spectrometry (LC-MS/MS), with an LC-20AD Prominence binary solvent delivery system with a column oven, DGU-20A3 online degasser and SIL-HTc controller (Shimadzu, Kyoto, Japan) and 3200 QTrap triple quadrupole mass spectrometer equipped with heated electrospray ionization source (ABSciex).Statistic analysis: SPSS v20.0 (SPSS Inc., Chicago IL) software package was used for data analysis.Results and validation:1. Our genotyping method determined 13 polymorphic CYP2D6 variants and the major rearrangements of the entire CYP2D6 gene. The alleles detected included: *2A, *2, *3, *4, *6, *8, *9, *10, *14, *17, *29, *35, *41, gene deletion *5, and gene duplication. Our method was validated by testing control samples from ParagonDx (n=9) as well as parallel comparisons with other laboratories using different methods (n=50).2. Our LC-MS/MS method was able to quantify the plasma concentrations of tamoxifen, endoxifen, 4-hydroxytamoxifen (4OHtam), N-desmethyltamoxifen (NDtam) simultaneously. In our cohort, the median plasma concentrations (and range) of these compounds were: 253 (75-734), 16 (2.3-64), 2.3 (0.5-6.2) and 468 (73-1120) ng/mL (n=98), respectively.3. Based on genotyping results, our patients were classifi ed into 6 subgroups: ultra metabolizers (UM, increased, n=4); extensive metabolizers 1 (EM1, normal, n=39); EM2 (slightly reduced, n=18); EM3 (modestly reduced, n=22); intermediate metabolizers (IM, moderately reduced, n=12); and poor metabolizers (PM, signifi cantly reduced, n=4). This metabolic profi ling signifi cantly correlated with
Molecular Pathology/Probes Tuesday, July 30, 9:30 am – 5:00 pm
CLINICAL CHEMISTRY, Vol. 59, No. 10, Supplement, 2013 A33
on the surface of bare carbon fi ber microelectrode as a platform for catalytic NO detection. Ruthenium has high affi nity for NO and readily forms nitrosyls that can be oxidized electrochemically. This property is one among other reasons that led us to select ruthenium as an electrocatalyst of choice for NO detection.The electrodeposition of ruthenium oxide nanoparticles is performed in perchloric acid solution containing RuCl3 precursor with constant cycling of the potential at 100 V/s scan rate for 20 minutes. Under optimum conditions, the nucleation of ruthenium oxide occurs on the surface of the carbon fi ber, with somewhat aligned growth of the nuclei that are in the 100-nm range in diameter as characterized by fi eld emission scanning electron microscopy (FESEM).Electrocatalytic oxidation of the NO is assessed by cyclic voltammetry and amperometry in standing solutions. The ruthenium-modifi ed microelectrodes exhibit rapid and reproducible response to NO at low applied potential (+0.5V vs. Ag/AgCl). Close analysis of the voltammograms shows that the addition of NO causes the anodic current of the Ru4+/6+ couple to increase with concomitant loss of reversibility. This behavior is a typical signature of an electrocatalytic process triggered by the oxidation of NO. The modifi ed carbon microelectrodes typically show a fi ve-fold increase in sensitivity compared to bare carbon microfi bers. Our ruthenium-based NO sensor shows a detection limit in the vicinity of 500 pM, which is orders of magnitude lower than bare carbon fi bers. We also show that this modifi ed NO sensor has excellent linearity in relatively a wide range, including very low concentrations of NO. Application of this sensor in analytical measurement of NO in biological samples and at the level of live single cells will be presented and discussed.
A-117
Polymorphisms Of Renin Angiotensin System Genes In Uterine Leiomyomas Among Egyptian Females
S. H. Gomaa1, A. M. Zaki1, M. M. Mokhtar1, M. S. Swelem2. 1Medical Researh Institute, Alexandria University, Alex, Egypt, 2Faculty of Medicine, Alexandria University, Alex, Egypt
Background: Uterine leiomyomas are the most common gynecological benign myometrial neoplasms. They are benign tumours that arise from a single uterine smooth muscle cell. They commonly cause severe symptoms that can seriously impact women’s health. They have been associated with infertility and recurrent abortion as well as obstructed labour and post-partum haemorrhage. They are the most important indication for hysterectomy however; the exact etiology is not clearly understood. Several genetic, environmental and ethnic factors have been proposed.The renin angiotensin system (RAS), in particular Angiotensin Receptor Type 1 (AT1R) and to a lesser extent angiotensin II, angiotensin converting enzyme (ACE) and Angiotensin Receptor Type 2 (AT2R), are often up-regulated during the progression from normal to malignant phenotypes indicating a possible correlation between RAS and tumour progression. There is emerging evidence that the incidence of cancer is reduced in patients undergoing long-term treatment with drugs that inhibit RAS. Other evidence suggests that angiotensin II directly stimulates cell growth via the AT1R and that its blockade inhibits tumour growth thus, genetic polymorphisms of RAS could be involved in development of uterine leiomyomas. The present study investigated the association of A1166C single nucleotide polymorphism (SNP) of AT1R gene and insertion deletion (I/D) polymorphism of ACE gene with uterine leiomyomas in Egyptian females.Subjects: 70 females diagnosed as having uterine leiomyomas (preoperative pelvic ultrasonography and postoperative histopathological examination of the tumourtissue) were enrolled in the study(patient group) as well as 54 matched healthy females who never suffered from nor having family history of leiomyomas (control group). Intake of ACE inhibitors, angiotensin II receptor blockers or any drugs that affect ACE or angiotensin II levels or hormonal replacement therapy were excluded.Methods::Ethylene Diamine Tetraacetic Acid (EDTA)-anticoagulated venous blood specimens were collected from the patients and controls. Deoxyribonucleic acids (DNA) was extracted from peripheral blood leucocytes using Genomic DNA Purifi cation Kit, Fermentas and genotypes of A1166C polymorphism of AT1 receptor gene were detected by means of a polymerase chain reaction (PCR) amplifi cation using specifi c primers followed by restriction digestion of PCR products using Dde-I enzyme, while PCR was used for the detection of I/D polymorphism of ACE gene using specifi c primers.Results: The genotype distribution patterns of A1166C polymorphism of AT1R gene among controls and leiomyoma patients were both in agreement with Hardy-Weinberg equilibrium (p=0.273 and p=0.494 respectively).Genotype frequencies in both groups revealed a statistically signifi cant difference (p = 0.028) using Fisher-Freeman-Halton’s test, where patients had a higher frequency of CC genotype than controls (8.6% versus 0%), a higher frequency of AC than controls (35.7% versus 25.9%)
A-112
Preparation from stabilized blood samples for quantitative RT-PCR without conventional RNA purifi cation using the Life Technologies Stabilized Blood-to-CT Nucleic Acid Preparation Kit for qPCR
W. Nie, T. Barta, D. Gutierrez, A. Shi, J. Wang. Life Technologies, Foster City, CA
Background: Traditionally, RNA purifi cation is the fi rst step for gene expression analysis, but even the fastest and simplest RNA purifi cation methods take about 1 hour total time for only twelve blood samples collected in either PreAnalytiX PAXgene or Life Technologies (LT) Tempus blood RNA tubes. To expedite and simplify the gene expression analysis workfl ow, Life Technologies (LT) has developed an innovative Stabilized Blood-to-Ct kit that creates a lysate from 500 uL of stabilized blood (either PAXgene or Tempus Blood RNA tubes) in three straightforward steps: pellet, wash and digestion. The procedure can be performed at room temperature within 60 minutes per 96 samples; substantially shortening the time consuming RNA preparation process. Real-time RT-PCR can be performed with the prepared lysates immediately afterwards.Methods: Blood were collected with LT Tempus blood RNA tubes. In parallel, one tube was processed using MagMAX RNA Isolation kit and pure RNA generated, the other tube was divided into 16X500ul aliquots, processed in one batch using Blood-to-Ct Nucleic Acid Preparation kit for qPCR, and lysates generated. Pure RNA and 16 prepared lysates were then reverse-transcribed to cDNA, respectively, using SuperScript VILO cDNA Synthesis kit. Since each Blood-to-Ct kit can process as low as 500ul stabilized blood (the volume ratio of blood to stabilization buffer is 1:2), the amount of RNA in the prepared lysate may not be enough for testing and/or archiving, therefore, additional pre-amplifi cation step was added in this study, starting cDNA materials were increased prior to qPCR and the resulting pre-amplifi cation products were then used for qPCR. qPCR was performed using LT ViiA7 real-time PCR system (384 well format). Data were analyzed to evaluate not only between pure RNA and lysate, but also between non-amplifi ed and pre-amplifi ed DNA samples.Results: The amount of RNA from prepared lysates were quantifi ed using LT Qubit, pure RNA was quantifi ed using NanoDrop to roughly control the range of input amount in the RT step. The quantities of generated cDNA and further pre-amplifi ed dsDNA measured by NanoDrop were very close from both RNA resources. The starting cDNA materials were increased more than 300 times through pre-amplifi cation process. The uniformity of pre-amplifi cation was checked, out of tested 7 lysates and 1 pure RNA samples across 10 TaqMan Gene Expression assays (8x10 values), only 3 values show ΔΔCt>1.5, and two of them can be explained with the relatively low yields (high Cts) of one lysate. Ubc was used as reference gene for the ΔΔCt calculation. The reproducibility of 16 manual preps using Blood-to-Ct kit was also analyzed and average CV of Cts is 0.0388.Conclusions: Our data shows comparable real-time RT-PCR performance of lysates prepared using LT Stabilized Blood-to-Ct kit with pure RNA isolated using MagMAX for Stabilized Blood Tubes RNA Isolation kit. Quantities of cDNA materials were increased more than 300 times through pre-amplifi cation, providing unbiased amplifi cation of targeted amplicons for analysis with TaqMan Gene Expression Assays.
A-116
Modifi ed carbon fi ber microelectodes with ruthenium oxide nanoparticles for sensitive detection of nitric oxide in biological samples.
T. Bose, T. Bomberger, M. Bayachou. Cleveland State University, Cleveland, OH
Nitric oxide is an important biological molecule that has diverse functions in human physiology. The concentration of NO in tissues and cells are of vital importance and the presence of too high or too low concentration of this reactive metabolite is the source of a variety of disease states. The major challenges with NO measurement are its low nano-molar concentrations in tissues and short half-life. This calls for the development of a method that is both sensitive and selective for the accurate detection of NO in biological systems. Out of the available analytical methods, electrochemical tools are most promising because they allow for miniaturization of probes as well as direct and accurate detection.We fabricated the microelectrodes in house using single carbon fi bers of 7μm diameter mounted on copper wires, sealed in glass capillaries with 2-mm of the tip exposed. We have developed a method based on electrodeposited ruthenium oxide nanoparticles
Tuesday, July 30, 9:30 am – 5:00 pm Molecular Pathology/Probes
A34 CLINICAL CHEMISTRY, Vol. 59, No. 10, Supplement, 2013
Brazil’s Federal District. The type of case, the conclusion and their distribution over the months were recorded and presented as absolute and/or relative frequency and mean ± standard deviation, when appropriate. The chi-square test was used to compare the obtained ratios. University of Brasília ethical committee approved this study.Results: Out of a total of 914 paternity cases, the trios occurred in a higher prevalence compared to duos, 596 (65.2%) versus 318 (34.8%). Moreover, the inclusions were more prevalent than exclusions, 610 (66.7%) versus 304 (33.3%). Besides that, the proportion of inclusion/exclusion were similar between trios and duos, 201 (33.72%) exclusions for trios and 103 (32.39%) exclusions for duos (p=0.68). Furthermore, the inclusion/exclusion and trio/duo proportions remained homogeneous in the eighteen-month studied period, 34.78 ± 6.78% for exclusions (p = 0.45) and 34.72 ± 5.26% for duos (p = 0.97).Conclusion: In paternity testing, the trios were more frequent than duo. This result can be explained by the fact that trio has lower complexity analysis than duo, because the alleles not transmited from mother are determined with precision, making it a test cheaper than duo. Furthermore, the paternity inclusion is the most prevalent result type and the inclusion/exclusion proportion observed in this study is similar to that reported by forensic laboratories (32%). Moreover, the homogenity in inclusion/exclusion and trio/duo proportions suggest that these parameters associated with paternity testing remain similar over time.
A-123
HCV genotype distribution and determination of other variables related to the virus by assessing a clinical laboratory results database
C. Chianca1, T. Santa Rita1, W. Vivas2, L. Velasco3, L. Abdalla3, S. Costa3, G. Barra3. 1Universidade de Brasília, BRASILIA, Brazil, 2Universidade Tiradentes, ARACAJU-SE, Brazil, 3Laboratorio Sabin, BRASILIA, Brazil
Background: In 2011, FDA announced a recall of an in vitro nucleic acid amplifi cation test for the quantifi cation of HCV RNA that has been shown to under-quantify a subset of genotype 4 in patient specimens by approximately 1.0-1.5 log 10 in the absence of any sequence mismatches. The distribution of these tests also applies to this country. As the HCV genotype has signifi cant geographic variation, this recall encouraged us to determine the prevalence of HCV genotypes and others variables related to the virus by assessing our clinical laboratory results database, and evaluating the possible impact of this under-quantifi cation in our region.Methods: Through retrospective analysis of our HCV genotyping database, we assessed the sample results between January 2005 and September 2011. 480 samples were analyzed, 394 (82%) genotypes were determined and 86 (17.9%) had negative results (no genotypes detected). Of these, 280 (58,2%) underwent quantifi cation of HCV RNA in the same day. The genotype prevalences and RNA quantifi cation were identifi ed and presented by gender and age group <50 years (n=162) and ≥50 years (n=118). HCV genotyping was performed by three different techniques in the analyzed period, PCR-RFLP, reverse hybridization, and RT-qPCR, they were also compared.Results: The observed genotype distribution was HCV-1 288 (73%), HCV-3 91 (23%), HCV-2 13 (3.2%), and HCV-4 2 (0.5%). The genotypes HCV-6 and HCV-5 were not found. The three techniques show related capabilities, since they resulted in similar genotypic distributions frequency (p=0.98). The average viral load was 6.11 log 10 copies/ml and did not differ with genotype (p=0.48), or gender of the patient (p=0.54). By separating the sample into age groups <50 and ≥ 50 years the average viral load was 6.13 and 6.41 log10 copies/ml (P=0.032) respectively.Conclusion: In this study we noted that the distribution of HCV in our samples is HCV-1, HCV-3, HCV-2 and HCV-4. The genotype 4 is rare in our region, as was found in only two individuals, or 0.5% of samples in six and half years. Thus, the impact of under-quantifi cation in our region would be minimal. When comparing the different techniques used for molecular genotyping showed that all three techniques (RT-qPCR real-time Reverse Hybridization and PCR-RFLP) have similar capabilities to determine the genotypes. With respect to viral load, no differences were observed between genotypes, or in genotypes according to gender, nor in the genotypes according to age. However, the group aged ≥ 50 had a mean viral load signifi cantly greater than <50.
and a lower frequency of AA than controls (55.7% versus 74.1%). The distribution of different alleles in both groups was statistically signifi cant (p=0.037704) using the Fisher’s exact test. However, ACE I/D polymorphism was not found to be associated with uterine leiomyoma. Statistical analysis done using SPSS program version 20.Conclusions: We found a signifi cant association of A1166C polymorphism in AT1R gene with uterine leiomyoma among Egyptian females suggesting that its potential regulatory function warrants further investigation.
A-118
Detection of Microsatellite Instability in Colorectal Cancers
F. B. De Abreu, M. C. Schwab, L. J. Tafe, G. J. Tsongalis. Dartmouth-Hitchcock Medical Center, Lebanon, NH
Background: Microsatellites are repetitive sequences distributed throughout the genome which are frequently copied incorrectly during DNA replication. The DNA mismatch repair (MMR) system, which consists of several proteins including MLH1, MSH2, MSH6 and PMS2, is responsible for the control and correction of these errors. Microsatellite markers are used to detect a form of genomic instability, known as microsatellite instability (MSI), which results from failure of the MMR system. MSI can be detected in approximately 15% of all colorectal cancers (CRCs). Approximately 3% of MSI CRCs cases are due to an inherited germline mutation in one of the DNA MMR genes, the other 12% are associated with a non-inherited form of DNA MMR inactivation caused by promotor methylation of the MLH1 gene. Here we provide validation data for microsatellite instability detection in patients with colorectal cancer.Methods: In this blinded study, DNA was isolated from 27 paired formalin-fi xed paraffi n-embedded colon tissues (normal and tumor) using Gentra PureGene Blood Kit Plus (Qiagen). We used the MSI Analysis System, version 1.2 (Promega) that includes fl uorescently labeled primers for co-amplifi cation of seven markers including fi ve mononucleotide repeat markers (BAT-25, BAT-26, NR-21, NR24 and MONO-27) and two pentanucleotide repeat markers (Penta C and Penta D). The mononucleotide markers are used for MSI determination, and the pentanucleotide markers are used to confi rm that the paired sample (normal and tumor) are from the same individual. Genomic DNA was amplifi ed according to manufacturer’s instructions and PCR products were analyzed using ABI 3500 Genetic Analyzer with POP-7TM polymer and 50 cm capillary. The results were analyzed using Applied Biosystems GeneMapper® 4.1 software. Tumors showing instability at two or more markers were defi ned as MSI-H, and those with instability at one repeat or showing no instability were defi ned as MSI-L and MSS tumors, respectively. Results were compared to MSI results from previous testing.Results: Of the 27 paired DNA samples, our assay was able to identify, with 100% accuracy, tumors with high or low instability and microsatellite stable tumors (8 MSI-H, 1 MSI-L, 18 MSS). There was 100% reproducibility of detection between independent runs.Conclusions: Our data supports the use of the MSI Analysis System to provide highly sensitivity and reliable detection of microsatellite instability in a clinical laboratory.
A-122
Paternity inclusion and exclusion in different types of genetic kinship investigations conducted in a clinical laboratory of the Federal District (Brazil).
C. Chianca1, T. Santa Rita1, J. Vasques2, L. Abdalla2, S. Costa2, C. Sousa2, G. Barra2. 1Universidade de Brasília, BRASILIA, Brazil, 2Laboratório Sabin de Análises Clínicas, BRASILIA, Brazil
Background: The paternity test is progressively becoming a clinical laboratory test. This analysis is based on comparing at least fi fteen short tandem repeat (STR) DNA markers between the child and alleged father, in the presence or absence of the biological mother, which classifi es the exam in trio or duo, respectively. The incompatibility in three or more STRs characterizes a paternity exclusion. The compatibility between all regions characterizes a paternity inclusion. The description of the types of cases (duo/trio) and results (inclusion/exclusion) in clinical laboratories are scarce. In this work, these parameters were evaluated retrospectively after eighteen months of implementation of this test in our laboratory.Methods: Through the retrospective analysis of our database, we assessed the genetic kinship investigations performed between May 2011 and October 2012. Nine hundred and fourteen investigations were conducted, all involving individuals residing in

Molecular Pathology/Probes Tuesday, July 30, 9:30 am – 5:00 pm
CLINICAL CHEMISTRY, Vol. 59, No. 10, Supplement, 2013 A35
and probes are added to the reagent prior to use. Two combinations were tested with CSF (HCV/KPC/SPC; n=11 and GBS/SPC; n=5) and one with stool (GBS/SPC; n=6). For both specimens types, TNA testing was performed with BD MAX ExK TNA-2. For CSF only, BD MAX ExK DNase reagent was used to enrich the RNA portion of the target by degrading the DNA portion.Results: When the BD MAX System was used with the BD MAX ExK TNA-2, a positive signal was obtained for KPC, HCV and SPC from CSF specimens (n=11) and for GBS and SPC from CSF (n=5) and stool specimens (n=6).With the BD MAX ExK TNA-2 and the BD MAX Exk DNase, a positive signal was obtained for HCV and SPC from CSF specimens (n=11). No signal was obtained for KPC.Conclusion: The BD MAX ExK TNA-2 used with BD MAX TNA MMK(SPC) can co-amplify DNA, RNA and SPC in CSF; and DNA and SPC in stool.The BD MAX ExK DNase can enrich RNA by degrading DNA in CSF processed with BD MAX ExK TNA-2.*The BD MAX ExK TNA-2, Exk DNase and TNA MMK(SPC) are not available for sale or use.
A-126
Validation of a diagnostic test for respiratory virus (CLART Pneumovir array) for clinical use in a private hospital in São Paulo - Brazil
N. H. Muto, J. N. M. Rodrigues, V. M. Oliveira, C. L. P. Mangueira, J. R. R. Pinho, R. Sitnik. Hospital Albert Einstein, São Paulo, Brazil
Background: Acute respiratory infections represent the most common causes of medical consultation and hospitalization worldwide during the winter season. Due to the variety of possible pathogenic agents and the high frequency of coinfections, it is necessary to use diagnostic methods that allow multiple, sensitive, effi cacious and rapid identifi cation of all possible viruses present in the clinical sample to apply the appropriate treatment for the patient. Methods: In order to provide this type of diagnostic test in patients of a private hospital in São Paulo - Brazil, we performed validation of the CLART Pneumovir array kit in our clinical laboratory. The kit is able to simultaneously detect 19 most common respiratory virus. The test was evaluated according to CAP guideline for qualitative assay.Methods: In order to provide this type of diagnostic test in patients of a private hospital in São Paulo - Brazil, we performed validation of the CLART Pneumovir array kit in our clinical laboratory. The kit is able to simultaneously detect 19 most common respiratory virus. The test was evaluated according to CAP guideline for qualitative assay.Results: For accuracy, we tested 29 samples with previous immunofl uorescence result. We had a 90% correlation; however 34% of concordant samples also presented a co-infection with another virus, possible due to a higher comprehensiveness and sensitivity of the array test. For reproducibility, 09 samples were assayed 3, 4 or 5 times each one, and results were concordant with exception of contamination in 13% of replicates. That contamination led us to make adjustments to minimize environmental and operator contamination. During this process, we performed negative reproducibility using 28 samples of DEPC-treated water to ensure that the adjustments were effective. For sensitivity, considering the high cost of the test, we established the limit of detection of one virus. Using a quantifi ed H1N1 control we established the LOD of 150 copies/test and performed 20 replicates which resulted in 80% confi dence.Conclusion: CLART Pneumovir array test has been validated and included in the clinical laboratory of the Hospital. The availability of the test represents an additional tool for clinical management, providing valuable information to the diagnostic process.
A-129
Detection of mutations in the genes NPM1 and FLT3 in Acute Myeloid Leukemia in patients with normal primary karyotype
L. Caputo, F. Gandufe, A. Cobacho, O. Denardin, L. Scarpelli, N. Gaburo. DASA, Sao Paulo Brasil, Brazil
Background: The acute myeloid leukemia (AML) affects individuals of all races and ages, predominantly in Caucasians. The AML is characterized as a malignant neoplasm of hematopoietic progenitor cells. About 50% of this type of leukemia has chromosomal abnormalities. The other 50% of karyotypes lacking cytogenetic
A-124
A CASE REPORT OF HEREDITARY HYPERFERRITINEMIA-CATARACT SYNDROME
J. D. SANTOTORIBIO1, C. CAÑAVATE SOLANO1, A. GARCIA DE LA TORRE1, A. TORAL PEÑA2, F. ARCE MATUTE1, S. PEREZ RAMOS1. 1Puerto Real University Hospital, Puerto Real (Cadiz), Spain, 2Santa Isabel Hospital, Sevilla, Spain
Background: Hereditary Hyperferritinemia-Cataract Syndrome (HHCS) is an autosomal dominant disorder characterized by elevated serum ferritin levels, without iron overload, and early-onset bilateral cataract. Its prevalence is at least 1/200,000 and is caused by mutations within the iron responsive element (IRE) located in the in the 5’ untranslated region (UTR) of L-Ferritin gene (FTL). We report a new case of family affected with HHCS.Methods: We studied father and daughter (54 and 26 years old respectively) with hyperferritinemia and clinically silent bilateral cataract. No other clinical manifestations were noted and main causes of elevated ferritin levels had been previously excluded. Both patients underwent sequencing of the IRE region using the following methodology:- Extraction and purifi cation of genomic DNA from EDTA whole-blood samples.- DNA amplifi cation by polymerase chain reaction (PCR).- Direct sequencing of the double stranded purifi ed PCR product.- Bioinformatics analysis of the DNA sequence obtained by comparison with the reference nucleotide sequence of the gene FTL.Results: Serum iron profi le of the father was: serum iron = 94 μg/dl, ferritin = 1215 ng/ml and transferrin saturation of 27.2%. The daughter´s profi le was: serum iron = 86 μg/dl, ferritin = 700 ng/ml and transferrin saturation of 22%. Both patients showed the heterozygous IRE mutation c.-171C>G. This change has been described once as disease-causing mutation (BioBase).Conclusion: Sequencing of the IRE region may be included in the study of patients with hyperferritinemia and cataract. This case provides further evidence that the nucleotide change 171C>G in the IRE region of the FTL gene is causing HHCS.
A-125
Extraction and Amplifi cation of Total Nucleic Acid (TNA) using BD MAX™ ExK™ TNA-2 and Ribonucleic Acid (RNA) Enrichment using BD MAX™ ExK™ DNase with Cerebrospinal Fluid (CSF) or Fresh Stool (Liquid or Soft) Specimens*
R. Labourdette, V. Blanchette, I. Bourque, V. Brochu, H. Galarneau, J. Grondin, S. Lapointe, S. Létourneau, S. Roy, S. Simard, C. Roger-Dalbert. BD Diagnostics, Quebec, QC, Canada
Background: The BD MAX™ System is a next generation sample-to-answer molecular testing platform. The new BD MAX™ TNA (for Total Nucleic Acid) suite, part of the Open System Reagent (OSR) series, combines specimen-specifi c extraction reagents (ExK™) with universal PCR reagents (MMK) allowing users to extract, purify and amplify multiple RNA and DNA targets from a single biological specimen with their own user defi ned protocols. Users can select specimen volume, and individually program thermocycling and analysis parameters. A Specimen Processing Control (SPC), consisting of an armored RNA incorporated into the extraction reagents controls for extraction effi ciency, reagent integrity and PCR inhibition by the sample. The objectives of this study were to demonstrate the capacity of the BD MAX ExK TNA-2 to extract, amplify and detect TNA and the capacity of the BD MAX ExK DNase to enrich the RNA fraction of the extracted nucleic acids by degrading the DNA fraction.Methods: Sample preparation and amplifi cation were performed from CSF and fresh stool specimens using the BD MAX System. For CSF, a volume of 200 μL was added to the Sample Buffer Tube (SBT) and for stool, a 10 μL loop was dipped into the stool and then released in SBT. The RNA target was an inactivated Hepatitis C virus (HCV) at 1000 IU/mL in SBT while DNA targets were Klebsiella pneumoniae carbapenemase (KPC) genomic DNA at 2000 copies/mL and a Group B streptococcus (GBS) strain at 1000 CFU/mL. A Specimen Processing Control (SPC) consisting of an armored RNA was co-extracted and co-amplifi ed with the targets to control extraction effi ciency, reagent integrity and PCR inhibition by the sample. The SPC is formulated with the BD MAX ExK TNA-2 extraction reagent, and the corresponding primers and probe are dried within the BD MAX™ TNA MMK(SPC) reagent. Target-specifi c primers
Tuesday, July 30, 9:30 am – 5:00 pm Molecular Pathology/Probes
A36 CLINICAL CHEMISTRY, Vol. 59, No. 10, Supplement, 2013
A-131
Rapid and Simultaneous Genotyping of HPV During Routine Screening of Liquid Cytology Specimens Using the Roche cobas® 4800
H. B. Steinmetz, B. J. Dokus, A. B. Hawk, D. M. Green, V. Vijayalakshmi Padmanabhan, E. J. Gutmann, J. D. Marotti, X. Liu, J. A. Lefferts, L. J. Tafe, G. J. Tsongalis. Geisel School of Medicine at Dartmouth and Dartmouth-Hitchcock Medical Center, Lebanon, NH
Background: Persistent infection with human papillomavirus (HPV) is implicated in the pathogenesis of cervical cancer and the presence of HPV can be detected in almost all of these cases. There are approximately 40 different types of HPV that can infect humans and 14 of these are considered high-risk for the development of cervical cancer and its precursor lesions. Routine testing for high risk HPV DNA is now the standard of care in the United States. The Roche cobas® 4800 HPV test is an automated platform that has been cleared by the FDA for the detection of high risk HPV infection in PreservCyt® cytology specimens. This test screens for high risk HPV and simultaneously provides genotyping data for HPV 16, HPV 18 or “other” high risk HPV types. As genotyping results may impact clinical care, we describe the frequency of high risk HPV detected by this new assay in a routine screening environment. Methods: We screened 834 cytology ThinPrep Preservcyt samples from January to February 2012 for the presence of HPV DNA and simultaneously genotyped for HPV16, HPV18, and “other” high risk HPV. Acrometrix HPV High Risk Positive Controls were used to verify the detection of these genotypes. Cytology samples were processed on the ThinPrep3000 processor using standard protocols. All samples were then tested with the Roche cobas® HPV assay.Results: Of the 834 samples screened, 113 (13.5%) were positive for the presence of HPV DNA. Of these positive samples, seventeen were genotyped as HPV 16, twelve as HPV18 and eighty four as “other” high risk types. The results of ten samples suggested co-infection with multiple HPV types (four had other High Risk HPV + HPV18 , fi ve had other High Risk HPV + HPV16, and one sample had HPV16 + HPV 18). Appropriate assay controls, which included both positive and negative controls, were included in each run and gave the expected results. None of the samples required repeat testing. Conclusions: High risk HPV testing by molecular techniques is an important tool in the diagnostic algorithm of cervical epithelial lesions. Our data confi rm the presence of high risk HPV types including the signifi cant presence of high risk HPV types other than types 16 and 18, in our patient population.
alterations have been stratifi ed according to molecular fi ndings that distinguish predictions.Objective: In this work we studied the frequency of these mutations in normal karyotype patients with newly diagnosed AML and in patients with AML undergoing study for minimal residual disease (MRD).Methods: A total of 10 bone marrow samples in heparinized syringe or tube were studied (5 patients with “de novo” AML and 5 AML undergoing treatment. Karyotype analyses was performed on all samples using short duration cell culture without mitogens agents, followed by the standard protocol for cell harvest and banding G. In each patient at least 20 metaphases were karyotyped and the fi nal report described according to the norms of the International System for Cytogenetic Nomenclature (ISCN, 2009). Concurrently studies were performed to NPM1 and FLT3 mutations by multiplex PCR followed by capillary electrophoresis, in which patterns have been checked for specifi c peaks in the electropherogram of each gene.Results: Among patients with AML “de novo” and with normal karyotype (3/5), considered intermediate risk group, only 1 patient showed NPM1+ and FLT3-, the others showed NPM1- and FLT3-. All these patients were categorized in the favorable risk group. Among patients with AML undergoing treatment and normal karyotype (4/5), there were no mutations in these genes. In the study of minimal residual disease (MRD), both as karyotype molecular methods were concordant for the evaluation of treatment effi cacy.Conclusion: Our results, despite the small sample, together with the literature data, can guide the physician to apply karyotype and mutation study of gene NPM1 and FLT3 in patients with AML “de novo” and AML undergoing treatment because the categorization risk in these patients is important for management and monitoring of therapeutic treatment.
A-130
Analysis of SNP Genotype Calls Made with Chromosomal Microarrays in Reference and Case Samples
F. B. De Abreu, G. J. Tsongalis, J. A. Lefferts. Dartmouth-Hitchcock Medical Center, Lebanon, NH
Background: Chromosomal microarray (CMA) allows genome-wide testing of copy number variations (CNVs) using copy number probes and/or single nucleotide polymorphism (SNP) probes. CMAs have become an important tool for medical and biological research and clinical diagnostic tests. At Dartmouth-Hitchcock Medical Center, clinical CMA testing is being performed in postnatal individuals for clinical presentations including intellectual disability, development delay, autism spectrum disorders and multiple congenital anomalies. Although these genotypes for individual SNPs can be obtained they are typically used more collectively to aid in evaluating copy number changes or detecting long contiguous stretches of homozygosity. Here we evaluate the individual SNP genotype calls in a SNP chromosomal microarray.Methods: We ran four cases and a normal reference sample in duplicate using the CytoScan®HD microarray (Affymetrix) with probes targeting 749,157 different SNPs loci and 1.9 million non-polymorphic loci with an average intragenic spacing of 880 base pairs and 384 base pairs for 340 genes. Microarrays were analyzed and genotypes obtained using the ChAS software (Affymetrix). All samples passed standard quality control measures.Results: Of the 749,157 SNPs included on each microarray an average of 741,624 (98.99%) calls were made per array (range of 734,360-744,941). When comparing duplicate runs of the same sample, the percentage of concordant SNP genotype calls was 99.92% for the reference DNA sample and 98.84%, 99.67 %, 99.89%, and 99.93% for the patient samples.Conclusions: Although chromosomal microarrays including SNP probes are not generally used for genotyping purposes, we evaluated the SNP genotype calls in several samples to determine the reproducibility of the SNP calls as a measure of the overall reproducibility of the microarray. The reproducibility between samples and their duplicates was on average 99.65% with respect to SNP genotype calls that were made. The variability in call rates and concordance rates might be attributed to minor differences sample processing.

Nutrition/Trace Metals/Vitamins Tuesday, July 30, 9:30 am – 5:00 pm
CLINICAL CHEMISTRY, Vol. 59, No. 10, Supplement, 2013 A37
to the likelihood of higher or lower needs regarding vitamin replacement creates a scenario of evidence-based medicine, which becomes an extra tool for the medicals decisions. Material and methods: Genotype frequencies and the markers implicated with vitamins B6, B12 and folate were studied within a group of 26 individuals from Sao Paulo, Brazil who were studied in 2012 (data from the ALTA Excelência Diagnóstica laboratory). Their ages ranged between 12 and 68 years old. Large-scale genotyping was carried out and multiple molecular probes were used. Results: In regards to vitamin B6, the C/T genotype in the NBPF3-rs4654748 was the most frequent for both male and female individuals (73% and 55% respectively). This indicates a higher frequency of a marker in the NBPF3 gene (next to the ALPL gene), which is associated with lower serum vitamin B6 levels. The genotypes involved with vitamin B12 (in the FUT2-rs602662 gene) were more homogenous in the male population and more heterogeneous in the female population. The A/G; G/G and A/A genotypes were equally distributed in male individuals (33%). In female subjects, the frequencies were 45%; 36% e 18%, respectively. The presence of an A/G or G/G marker in the FUT2 gene is linked to low serum vitamin B12 levels. As for vitamin B9 (folate), the C/C genotype in the MTHFR-rs18001133 gene was the most frequent one (73%) in male individuals. Conversely, it was not detected in female individuals. The latter group had a higher frequency of the C/T genotype (45%). A relatively common variant of the MTHFR gene, known as C677T (rs1801133), is linked to low serum folate levels and high homocysteine levels. Conclusion: in a sample of 26 Brazilian subjects whose ages ranged from 12 to 68 years old, the most frequent genotype related to vitamin B6 levels was C/T, and it is associated with lower serum vitamin B6 levels. With regards to vitamin B12, the A/G; G/G and A/A genotypes were equally distributed in the male subgroup (33% each). The A/G genotype was the most frequent in the female subgroup (45%) and it is also associated with low serum vitamin B12 levels. As for vitamin B9 (folate) the C/C genotype in the MTHFR-rs18001133 gene was the most frequent one in the male subgroup (73%), which is linked to stable serum folate levels. The C/T genotype was the most frequent in the female subgroup (45%), which is related to low serum folate levels. This sample showed a global predominance of genotypes associated with low serum levels of the three vitamins evaluated, except for the male genotype for folate.
A-136
Standardization of the ADVIA Centaur Vitamin D Total Assay
J. Freeman1, P. Sibley2, K. Wilson3, R. Spears1. 1Siemens Healthcare Diagnostics, Tarrytown, NY, 2Siemens Healthcare Diagnostics, Lianberis, United Kingdom, 3Siemens Healthcare Diagnostics, Los Angeles, CA
Background: Vitamin D is a steroid hormone involved in the intestinal absorption of calcium and the regulation of calcium homeostasis. Aiding renal absorption of calcium, vitamin D is essential for the formation and maintenance of strong, healthy bones. In recent years, the number of commercially available vitamin D assays has increased, and due to the lack of a universal standard, different manufacturers’ vitamin D assays and protocols on different LC/MS/MS instruments yield varying results. The Vitamin D Standardization Program (VDSP) is an initiative of the NIH Offi ce of Dietary Supplements and a collaboration with the National Institute of Standards and Technology (NIST), the Centers for Disease Control (CDC), and Ghent University to standardize 25(OH)vitamin D measurement across methods and manufacturers.Method: Dr. Linda Thienpont from Ghent University developed an ID-LC/MS/MS method for vitamin D in human serum that is traceable to NIST Standard SRM2972. The VDSP samples consist of 50 unique patient specimens ranging in vitamin D concentration from 5.04-60 ng/mL. The ADVIA Centaur® Vitamin D Total assay will be standardized to the VDSP by directly value-assigning 10 serum pools with increasing concentrations of 25(OH)vitamin D3 directly from the VDSP sample concentration using multiple lots of ADVIA Centaur Vitamin D Total reagents and calibrators on multiple ADVIA Centaur systems.Results: The data obtained with the ADVIA Centaur Vitamin D Total assay standardized to the VDSP* demonstrated equimolar detection of 25(OH)vitamin D2 (104.5%) and 25(OH)vitamin D3 (100.7%). The assay demonstrated a limit of blank (LoB) of less than 1.1 ng/mL, a limit of detection (LoD) of less than 2.6 ng/mL, and a limit of quantitation (LoQ) of less than 4.7 ng/mL. The upper limit of the assay is 150 ng/mL. Total assay CVs were 6.2%, 5.3%, 8.2%, 7.3%, and 2.8% for samples at 15.6, 18.3, 28.0, 48.6, and 113 ng/mL, respectively. Linearity up to 150 ng/mL was demonstrated. A correlation comparing VDSP-traceable LC/MS/MS to the ADVIA Centaur Vitamin D Total assay was performed with 120 serum samples, yielding a Deming slope of 1.04, intercept of -0.94, and regression coeffi cient of 0.93.
Tuesday, July 30, 2013
Poster Session: 9:30 AM - 5:00 PM
Nutrition/Trace Metals/Vitamins
A-132Vitamin D Status in Bulgarian Patients with Chronic Hepatitis C Virus Infection
D. Gerova1, B. Galunska1, I. Ivanova1, I. Kotzev1, T. Tchervenkov1, S. Balev1, D. Svinarov2. 1Medical University, Varna, Bulgaria, 2Medical University, Sofi a, Bulgaria
Background: Vitamin D status is of signifi cant importance for improving human health, and for prevention of many diseases. Hepatitis C virus (HCV) infection is a major global health challenge affecting over 3 million people worldwide. Epidemiological studies provided evidence that vitamin D defi ciency may confer increased risk of viral infections, including HCV infection. The main objective of this retrospective study was to determine the prevalence of vitamin D defi ciency and insuffi ciency in Bulgarian patients with HCV infection, and to assess its relationship to the severity of liver disease and response to interferon-based therapy. Methods: Study encompassed 296 patients with proven HCV infection who consented to participate: 161 males (54.4%) aged 42.08±14.87 (range 18-82) years, and 135 females (45.6%) aged 45.72±14.34 (range 18-72) years; frequency of the different HCV genotypes was 87.3% for GT1, 0.5% for GT2, 11.7% for GT3 and 0.5% for GT4. Determination of 25-hydroxyvitamin-D (25OHD, sum of 25OHD3 and 25OHD2) was performed by a validated ID-LC-MS/MS method (d325D3 utilized as internal standard), with accuracy and precision within 7.5%; extraction recoveries averaging 57-73%; linearity range 3.0-300.0 nmol/L, (R2>0.99). Patient demographics, HCV-genotype, viral load (quantitative real-time reverse-transcription PCR), histological grade and stage (according the METAVIR classifi cation), AST levels, treatment, and treatment outcomes, were assessed with respect to vitamin D status. For statistical analysis, means±SD were determined, and an unpaired t-test with Welch’s correction for comparison of means of different parameters was used, with level of signifi cance set at p<0.05. Results: Total 25OHD for all patients was 54.63±30.4 nmol/L (range 5.6–171.6); 16% of patients had 25OHD below 25 nmol/L (defi ciency); profound insuffi ciency (25–50nmol/L) was found in 33% of patients; another 33 % were in the range 50–80nmol/L (mild insuffi ciency) and the rest 18% of patients were in suffi ciency (25OHD >80nmol/L). Seasonal difference in vitamin D status was signifi cant: 37.60±1.7 (from November to April) vs 70.55±2.4 (from May to October), p<0.0001. A signifi cantly lower 25OHD levels were registered in HCV patients with advanced fi brosis (F3/4) vs those without fi brosis or with mild fi brosis (F0/1/2): 42.01±2.7 vs 57.52±3.2, p<0,001. An inverse relationship was found between 25OHD and viral RNA load: 56.64±2.1nmol/L for RNA<5.6 log10IU/ml and 47.94±2.2 nmol/L for RNA>5.6 log10IU/ml, p<0.01. Patients with sustained viral response to therapy had signifi cantly higher 25OHD levels compared to non-responders and patients with relapses: 58.31±3.2 vs 46.76±3.2, p<0.02. Conclusion: More than four-fi fths of our HCV-patients were with vitamin D defi ciency and insuffi ciency and there was an inverse relationship between 25OHD levels and viral load, liver fi brosis and treatment outcomes. These results support the understanding that improvement of vitamin D status via supplementation may have a considerable potential to improve host response against HCV infection, as well as patient response to therapy.
A-135
GENOTYPES ASSOCIATED WITH VITAMIN B6, VITAMIN B12 AND FOLATE: IN THE ERA OF CUSTOMIZED MEDICINE IT IS POSSIBLE TO HAVE A BETTER VISIBILITY OF REPLACEMENT NEEDS.
R. B. KIYOTA. ALTA Excelência Diagnóstica, SAO PAULO, Brazil
In the age of customized medicine, several studies have shown associations between the levels of vitamins in the body and some genotypes. This study aimed at mapping the most prevalent genotypes regarding vitamin B6, B12 and B9 (folate) levels among 26 Brazilian subjects. The understanding of the existing genotypes and their links

Tuesday, July 30, 9:30 am – 5:00 pm Nutrition/Trace Metals/Vitamins
A38 CLINICAL CHEMISTRY, Vol. 59, No. 10, Supplement, 2013
Conclusion: The Siemens ADVIA Centaur Vitamin D Total assay standardized to the VDSP should be a valuable tool in clinical laboratories for the accurate measurement of vitamin D suffi ciency in human sera.* The ADVIA Centaur Vitamin D Total assay standardized to the VDSP is in development and is not available for sale.
A-137
Comparison of a novel microbiological assay with standard HPLC determination of vitamin B6 in plasma
S. M. Loitsch1, K. Reuter1, G. Oremek2, J. Stein3, T. Dschietzig4. 1Institute of Pharmaceutical Chemistry, University of Frankfurt, Frankfurt, Germany, 2University Hospital Frankfurt, Central Laboratory, Frankfurt, Germany, 3Crohn-Colitis Centre Rhein-Main, Frankfurt, Germany, 4Immundiagnostik AG, Berlin, Germany
Background: Higher plasma homocysteine is associated with a higher cardio-vascular risk. Apart from renal insuffi ciency, defi ciencies of vitamins B6, B12, and folic acid pose the most common causes of moderately elevated homocysteine. We have developed novel, micro-titre plate-based turbidimetric kits (ID-VitR) to determine biologically active B6, B12 and folic acid by measuring bacterial growth in factor-defi cient media.Methods: The novel ID-VitR microbiological assay for determination of vitamin B6 in human plasma uses micro-titre plates pre-coated with lyophilized Saccharomyces cerevisiae thus avoiding numerous problems associated with the maintenance and use of stock cultures. It was compared here with a high-performance liquid chromatographic (HPLC) assay. In 170 healthy individuals and in 68 patients with coronary artery disease (CAD, 37 patients with acute coronary syndrome [ACS], 31 with stable CAD), data obtained using the HPLC gold standard method were compared with the ID-VitR results. Intra-assay and inter-assay coeffi cients of variation were evaluated; regression and Bland-Altman analyses were performed. Homocysteine in CAD patients was measured by HPLC.Results: The new microbiological assay correlates well with the HPLC assay (r = 0.89; p<0.0001). A Bland-Altman analysis revealed good agreement between the results of both methods, with a bias of -0.9 ng/ml (HPLC- ID-VitR ) and 95% of all values grouping within the lines of agreement (mean ± 2SD of differences HPLC- ID-VitR). In CAD patients, homocysteine values did not differ between stable CAD and ACS (14.4 ± 3.4 vs. 14.0 ± 2.7 μmol/l) and were not elevated. Thirty four % of CAD patients had serum creatinine values >1.5 mg/dl. Neither HPLC nor ID-VitR values for B6 correlated with homocysteine levels.Conclusion: The microbiological assay with pre-coated plates and the HPLC standard assay are in good agreement. The new assay can easily be automated and is less laborious than common microbiological assays. The lack of correlation between B6 vitamin and homocysteine can be accounted for by the fact that homocysteine in our CAD patients was in the high-normal range and that a relevant percentage of patients had impaired renal function.
A-138
Absence of association between serum folate and the development of preeclampsia in women exposed to folic acid supplementation and food fortifi cation
S. Thériault1, Y. Giguère1, J. Massé2, S. B. Lavoie3, J. Girouard2, E. Bujold2, J. Forest1. 1CHU de Québec Research Center, Québec, QC, Canada, 2CHU de Québec, Québec, QC, Canada, 3CHU Sainte-Justine, Montréal, QC, Canada
Background: Folic acid supplementation was recently proposed as a possible means to reduce the risk of preeclampsia (PE). This study aims to determine if serum folate concentration early in pregnancy is associated with hypertensive disorders of pregnancy (HDP) in a population exposed to folic acid supplementation and food
fortifi cation.Methods: This is a nested case-control study, based on a prospective cohort of 7,929 pregnant women recruited between 2005 and 2010 in the Quebec City metropolitan area, including 214 participants who developed HDP and 428 controls matched for parity, multiple pregnancy, smoking status, gestational and maternal age at inclusion and duration of blood samples storage. Diagnosis of HDP was made according to the Society of Obstetricians and Gynaecologists of Canada classifi cation. Serum folate levels were measured before 20 weeks of gestation with an electrochemiluminescence assay on an Elecsys 2010 system (Roche Diagnostics).
Results: More than 98% of the participants took folic acid supplements in a timeframe ranging from before pregnancy to the end of the fi rst trimester. Mean serum folate levels were accordingly high and there were no differences between women who further developed HDP compared to their controls (60.1 nmol/L vs 57.9 nmol/L; p=0.51). No differences were observed in any of the subgroups (Table 1). The proportions of participants with serum folate below the 10th percentile (< 21.1 nmol/L) of our local nonpregnant population were similar between groups and no participant had levels generally defi ned as folate defi ciency (< 10 nmol/L).Conclusion: In an unbiased cohort of pregnant women benefi ting from a national policy of folic acid food fortifi cation combined with a high adherence to folic acid supplementation, serum folate levels are high and do not differ between women who develop HDP and women who remain normotensive. Further supplementation with higher doses is unlikely to be benefi cial in such populations.Table 1: Serum folate levels in women with hypertensive disorders of pregnancy and their controls
GH Ctl GH mPE Ctl mPE sPE Ctl sPE HDP Ctln 77 154 69 138 68 136 214 428Mean (nmol/L) 60.7 55.5 63.8 62.7 55.7 55.9 60.1 57.9SD (nmol/L) 42.5 37.2 44.3 40.3 43.2 36.9 43.2 38.2Median (nmol/L) 44.7 43.9 47.8 45.6 42.4 42.4 44.6 44.2IQ (nmol/L) 32.9 33.5 25.6 36.8 17.4 23.7 26.5 29.7Folate ≤ 10th percentile (21.1 nmol/L)(%) 1.3 4.5 1.4 1.4 5.9 3.7 2.8 3.3Ctl: Control group; GH: gestational hypertension; mPE: mild preeclampsia; sPE: severe preeclampsia; HDP: hypertensive disorder of pregnancy; SD: standard deviation; IQ: interquartile range.No signifi cant differences between the means (p > 0.05)
A-139
Intrinsic Factor Blocking Antibody Interference Is Not Detected In Five Automated Cobalamin Immunoassays
S. Merrigan1, D. Yang2, J. A. Straseski1. 1ARUP Laboratories, Salt Lake City, UT, 2University of Wisconsin School of Medicine, Madison, WI
Background: Several authors have recently reported falsely normal cobalamin (vitamin B12) results in patients diagnosed with pernicious anemia. Interference of native intrinsic factor blocking antibody (IFBA) with automated immunoassays has been proposed as a cause of these falsely elevated results. Interference with cobalamin results is a concern, since almost 70% of pernicious anemia patients test positive for IFBA.Objective: In light of a recent voluntary vendor recall of cobalamin reagent due to IFBA interference, our objective was to investigate fi ve additional automated cobalamin immunoassays to determine if they were similarly affected.Methods: We created six human serum pools with high (>911 pg/mL [>672 pmol/L]), normal (210-911 pg/mL [155-672 pmol/L]), or low (<210 pg/mL [<155 pmol/L]) total cobalamin (determined by Centaur XP, Siemens Healthcare Diagnostics), with or without IFBA (determined by ELISA, INOVA Diagnostics). Cobalamin was tested before and after precipitation of serum immunoglobulins by 1:1 dilution with 25% polyethylene glycol (PEG). PEG-treated serum pools were tested for IFBA to confi rm immunoglobulin precipitation. Pools were tested in triplicate on the same day with the following analyzers: Centaur XP and IMMULITE 2000 (Siemens Healthcare Diagnostics), ARCHITECT i2000SR (Abbott Diagnostics), UniCel DxI 800 (Beckman Coulter Inc.), and Modular E170 (Roche Diagnostics). All assays use competitive binding luminescence to determine total cobalamin. Total allowable error (TAE) of 30% was used to evaluate changes in cobalamin concentrations. Untreated and PEG-treated serum from a patient with IFBA and untreated pernicious anemia which had previously generated falsely normal results with the Siemens Dimension Vista was tested with a representative assay.Results: The average reduction in IFBA results in PEG-treated pools was 99%, which confi rmed immunoglobulin precipitation. The average difference in measureable cobalamin concentration between the six PEG-treated and six untreated pools using the fi ve immunoassays was 16.9% (range 4.0 to 38.6%). All PEG-treated results were within the TAE of the untreated pools, with one exception (low cobalamin/IFBA positive pool with the Centaur XP; 38.6%), however both pools would have qualitatively been classifi ed as cobalamin defi cient (<120 pg/mL [<88.5 pmol/L]). A sample from a patient with pernicious anemia and IFBA previously gave falsely elevated cobalamin results using the Dimension Vista assay. PEG-treatment of this sample decreased the result from 1735 pg/mL (1280 pmol/L) to <50 pg/mL (<37 pmol/L). This same sample did not show elevated cobalamin results when tested using a representative assay from our study (Centaur XP); PEG-treated and untreated aliquots both had cobalamin concentrations <210 pg/mL (<155 pmol/L).

Nutrition/Trace Metals/Vitamins Tuesday, July 30, 9:30 am – 5:00 pm
CLINICAL CHEMISTRY, Vol. 59, No. 10, Supplement, 2013 A39
Conclusions: In summary, of fi ve automated cobalamin assays evaluated, none showed a signifi cant decrease in cobalamin concentration after immunoglobulin precipitation by PEG. This was illustrated in serum pools, regardless of cobalamin concentration, and in a previously spurious patient sample. These results suggest that these fi ve automated cobalamin assays do not cross-react with IFBA. While all results should be corroborated with clinical signs and symptoms, laboratories may use this information to monitor clinical assay performance.
A-140
Simple and Rapid assay for Simultaneous determination of serum chromium and cobalt by inductively coupled plasma-mass spectrometry
H. Choi1, S. Lim2, Y. Park2, S. Lee3. 1Departments of Laboratory Medicine & Genetics, Samsung Medical Center, Sungkyunkwan University School of Medicine, Seoul; Chonnam National University Hospital, Gwangju, Korea, Republic of, 2Department of Orthopedic Surgery, Samsung Medical Center, Sungkyunkwan University School of Medicine, Seoul, Korea, Republic of, 3Departments of Laboratory Medicine & Genetics, Samsung Medical Center, Sungkyunkwan University School of Medicine, Seoul, Korea, Republic of
Background: Trace element analysis has been used for evaluation of toxicity in environmental contamination and occupational exposure, and defi ciency of essential elements in nutritional status. Recently, Cr and Co metal ions are known to be associated with surface corrosion and wear particles of implants in patients with hip resurfacing prosthesis. These metal ions may serve as an indicator of the in vivo performance of MoM bearing surfaces. However, there are few reports about validation of the assay for simultaneous measurement of serum Cr and Co levels for Asian population. The aim of this study was to develop rapid and sensitive assay for simultaneous measurement of serum Cr and Co using inductively coupled plasma-mass spectrometry (ICP-MS) in clinical laboratory practice, and to evaluate the analytical performance and clinical usefulness of this assay.Methods: We evaluated the linearity, accuracy, precision and lower limit of quantifi cation (LLOQ) of an ICP-MS method (Agilent 7500CE ICP-MS, Agilent Technologies, Japan) to determine serum Cr and Co concentration in accordance with the FDA guidelines for bioanalytical method validation. This method was used to determine serum Cr and Co levels of 185samples from 74 patients after hip resurfacing arthroplasty (HRA) and compare that of 51 healthy controls. Results: This ICP-MS method for serum Cr and Co levels showed good linearity (linearity range, 0-20 μg/L, 0-20 μg/L; linear regression coeffi cient, r2 > 0.999, r2
> 0.999, respectively). Accuracy was satisfactory for all tested concentrations of Cr and Co (%bias, -1.5 ~ 2.5%, -3.3 ~ 1.6%, respectively). The intra- and inter-assay coeffi cient of variations (CV) for both metal ions did not exceed the limit of 10% for LLOQ (0.02 μg/L of Cr, 0.01 μg/L of Co, respectively) and were within 5% for the other concentrations (intra- and inter-assay CV, 1.2 ~ 2.6 and 1.9 ~ 4.4% of Cr; 1.4 ~ 2.7 and 1.9 ~ 4.7% of Co). The serum Cr and Co concentrations (mean±SD) were 0.60±0.12 μg/L and 0.29±0.15 μg/L in 51 healthy subjects. In 185 serum samples from 74 orthopedic patients (median duration implanted, 36 months; range, 1-140 months), the median concentration of serum Cr and Co were 2.6μg/L (0.3 ~ 116.8) and 1.4μg/L (0.1 ~ 127.8), respectively. The levels of Cr and Co in patient group was signifi cantly higher than the levels in healthy controls (Mann-Whitney test, p<0.05).Conclusion: The present assay using ICP-MS can rapidly and simultaneously quantify the serum Cr and Co levels with good analytical performance including wide analytical range and low LOQ. This assay will be very useful to evaluate the nutritional status of Cr and Co in healthy human body as well as to monitor the performance of orthopedic prosthesis after HRA.
A-141
Fast, Accurate and Reproducible Method for Simultaneous Quantitation of Pyridoxal 5’-phosphate and Pyridoxic acid in Human Plasma by HPLC with Fluorescent Detection
S. LI, S. Sadjadi, K. Lin, S. Countryman, E. Pike, J. Layne. Phenomenex, Torrance, CA
Background: Pyridoxal 5’-phosphate (PLP) is the primary biologically active form of vitamin B6. Low levels of vitamin B6, based on plasma concentrations of PLP, have been identifi ed in infl ammatory diseases, including cardiovascular disease,
rheumatoid arthritis, infl ammatory bowel disease, and diabetes. Plasma PLP levels were also inversely related to the risk of breast carcinoma, colon cancer, etc. Using tandem LC-MS to quantitate both PLP and pyridoxic acid (PA), hypophosphatasia can be evaluated using the vitamin B6 profi le. Fluorescence detection has been used nearly exclusively by a majority of reference laboratories in HPLC determinations of vitamin B6 due to its selectivity and high sensitivity. Since the natural fl orescence of the vitamin B6 compounds is low, chemical derivatization methods are necessary to improve the fl uorescence signals. However, the published derivatization procedures suffered from tedious sample preparation, and short HPLC column lifetimes. Our goals were to simplify the derivatization and sample preparation steps as well as to select the most effi cient and durable HPLC column when analyzing PLP and PA by HPLC-FLD.Methods: Add 30μL of 100mg/mL semicarbazide/glycine derivatization solution to 200μL of plasma. Cap the tube, vortex for 15 sec and incubate in the dark at room temperature for 30 minutes. Add 25μL of 20% meta-Phosphoric acid. Recap the tube and vortex mix for 30 seconds. Centrifuge for 5 min at 14,000 RPM. Transfer 150μL of supernatant to an amber autosampler vial and place in the autosampler. Inject 30μL onto the HPLC system. A Gemini-NX 3 μm C18, 100x4.6mm column was used with a 4x3.0mm SecurityGuard C18 cartridge. HPLC mobile phase A was 20mM sodium phosphate with 1mL acetic acid in DI water; B was acetonitrile/methanol (70:30). Flow rate was 1mL/minute with a 7-minute gradient program. The signals were detected with a fl uorescence detector.Results: Because fl uorescence signals are very sensitive and compound dependent, accurate tuning of fl uorescence wavelengths is critical. The optimal wavelengths for detecting PLP, PA and pyridoxal (PL) were the combination of Ex 360nm and Em 450nm. PLP, PA and PL were baseline-to-baseline separated with great resolutions using the Gemini-NX C18 HPLC column. Three levels of plasma quality control (QC) samples were prepared at 8, 80 and 160nmol/L.The percentage of coeffi cients of variation (CV%) for the intra-assay precision were 0.9% to 2.5% for PLP, and 2.15% to 4.33% for PA. The mean recoveries were 86.9% to 97.8% for PLP, and 95.0% to 95.1% for PA. The linear regression analysis data for a six point calibration plot showed a good linear relationship over the concentration range of 6.25-200nmoL/L for both PLP (R2=0.9999) and PA (R2=0.9993). The limit of detection (LOD) and limit of quantitation (LOQ) was 2nmoL/L and 4nmoL/L for both PLP and PA, respectively. PL showed the similar results; however, it was used as a marker for monitoring potential peak shifting. The Gemini-NX C18 HPLC column was durable and the column life was extended signifi cantly by changing guard cartridges after every 200 injections.Conclusions: A simple HPLC-FLD method is established for accurate and simultaneous quantitation of pyridoxal 5’-phosphate and pyridoxic in human plasma.
A-143
A Simple, Fast and Effi cient HPLC Method for Accurate, Sensitive and Reproducible Quantitating Vitamin C in Human Plasma by Applying Impact Protein Precipitation Plate Technology with Kinetex 5μm Core-Shell XB-C18 HPLC Columns
S. LI, S. Countryman, E. Pike. Phenomenex, Torrance, CA
Background: Vitamin C (ascorbic acid) is essential for the enzymatic amidation of neuropeptides, production of adrenal cortical steroid hormones, and metabolism of tyrosine and folate. It is a cofactor for protocollagen hydroxylase, and promotes the conversion of tropocollagen to collagen. It also plays a role in lipid and vitamin metabolism and is a powerful reducing agent or antioxidant. Plasma or serum levels of vitamin C are an adequate measurement of clinical status. Low values occur in scurvy, malabsorption, alcoholism, pregnancy, hyperthyroidism, and renal failure. Smokers have lower levels than nonsmokers. Patients with scurvy have values <2μg/mL, which results in the formation of swollen, ulcerative lesions in the gums, mouth, and other tissues that are structurally weakened. Vitamin C is a very polar compound and is diffi cult to retain on reversed phase HPLC columns. The instability of vitamin C at room temperature and failures of many sample preparation methods makes analysis of human plasma a big challenge. Our goal was to generate a stable HPLC method for accurate analysis of human plasma vitamin C with an easy and fast sample preparation method and effi cient HPLC columns.Methods: This method uses an Impact protein precipitation plate which allows for rapid protein precipitation of 96 samples at once. 300μL of cold 5% meta-phosphoric acid (4ºC) was loaded to a well of Impact plate. 100μL of plasma sample was added and mixed 5 times by aspiration with the same pipette tip. The plate was centrifuged at 500g for 5-minute at 4ºC to fi lter the sample. Purifi ed fi ltrate was then transfered to an amber autosampler vial and place on a cooled autosampler (4ºC). 30μL was injected onto the HPLC system. A Kinetex 5μm Core-Shell XB-C18, 150x4.6mm column was

Tuesday, July 30, 9:30 am – 5:00 pm Nutrition/Trace Metals/Vitamins
A40 CLINICAL CHEMISTRY, Vol. 59, No. 10, Supplement, 2013
used with a 4x3.0mm SecurityGuard ULTRA C18 cartridge. HPLC mobile phase A was 0.1% formic acid in DI water; B was acetonitrile. Flow rate was 0.8mL/minute with a 7-minute step program. The signal was detected with a UV detector.Results: Optimal response of vitamin C was observed when UV wavelength was set at 245nm. Using an easy LC/MS/MS compatible mobile phase, vitamin C was well retained at ±2.7-minute and baseline-to-baseline separated with great resolutions using the Kinetex 5μm XB-C18 column. Meta-phosphoric acid was the most effective protein precipitant. Vitamin C samples extracted with 5% meta-phosphoric acid were stable on a cooled autosampler for at least 48-hour. Protein precipitation with the Impact plate is simple and can be easily automated. Three levels of plasma quality control samples were prepared at 1, 10 and 35μg/mL. The percentage of coeffi cients of variation for the intra-assay precision were 1.74% to 3.16% (n=12) and for the inter-assay precision were 1.80% to 4.82% (n=6). The mean recovery was 98.2% with CV=4.8% (n=7). The calibration curve was linear in the whole range tested of 0-100μg/mL (R2=0.9999). LOD was 0.78μg/mL and LOQ was 1.56μg/mL There were no inferences with uric acid which has a similar structure to vitamin C.Conclusion: A simple HPLC-UV method with high-throughput protein precipitation is established for accurate and reproducible quantitation of human plasma vitamin C.
A-144
Evaluation of Frequency of Vitamin D Defi ciency in a cohort of 9058 women aged more than 60 years
L. F. A. Nery1, G. R. Martins1, C. M. Araújo1, S. S. S. Costa1, L. A. Naves2. 1Laboratório Sabin, BRASILIA, Brazil, 2Endocrine Unit, University of Brasilia; Laboratório Sabin, BRASILIA, Brazil
BACKGROUND: Falls and high risk of bone fractures are important health problems in elderly people. The frequency and impact of 25-OH-vitamin D defi ciency in these patients is unknown in tropical and sunny countries. OBJECTIVE: The objective is to determine the frequency of vitamin D insuffi ciency and defi ciency in elderly women over 60 years living in the central region of Brazil. SUBJECTS AND METHODS: This is a retrospective study. A total of 9058 patients were selected from a clinical laboratory cohort, referred by clinicians to the laboratory to measure 25 OH vitamin D (chemiluminescence- Diasorin) in a period comprised between January 2012 and January 2013. All patients that received calcium or vitamin D supplementation in the last 3 months were excluded. Comparion between frequencies was analyzed by Fisher Test. RESULTS: The patients were divided in three groups, according to age, in group 1 61-70 years old, Group B 71-80 years old, group 3 > 81 years old... Patients with 25 OH Vitamin D < 20 ng/ml were considered defi cient, and patients with 25 OH Vitamin D < 30 ng/ml were considered insuffi cient, and levels> 30 ng/ml were considered normal. Vitamin D defi ciency was observed in 31%, 42% and 50%of groups 1, 2, 3 respectively. Patients presented vitamin D 21-30 ng/ml respectively in 46%, 37%, and 31% of patients from groups 1, 2, 3. The difference was not statistically signifi cant in the subgroup analysis concerning vitamin D insuffi ciency (p=0.19) CONCLUSIONS: The results suggest that defi ciency and insuffi ciency of vitamin D is very frequent in elderly women in our region, although the recommendation to provide supplements, and increase the sun exposure consists in a strategy to be considered with other factors by the clinicians.
A-145
Determination of Frequency of Vitamine D defi ciency in Acromegalic patients compared to control healthy subjects
P. S. Barbosa1, L. F. A. Nery2, D. H. Barros1, C. M. Araújo2, G. S. Mota1, S. S. S. Costa2, L. A. Naves3. 1Endocrine Unit, University of Brasilia, BRASILIA, Brazil, 2Laboratório Sabin, BRASILIA, Brazil, 3Endocrine Unit, University of Brasilia; Laboratório Sabin, BRASILIA, Brazil
Acromegaly is a rare endocrine disorder, related to hypersecretion of growth hormone (GH) and insulin like growth fator-1 (IGF-1), with important effects on bone and articular diseases. These tissues are very sensitive to calcium metabolism, and the role of PTH, and vitamin D on osteoarthicular disorders is not clear. Recent studies suggested that rises on IGF-1 can infl uence 25 (OH) vitamine D plasma levels. Objective: Evaluate the relation between activity of Acromegaly and calcium metabolism. Subjects and Methods: We recruited 35 patients with active acromegaly, recruited from neuroendocrine outpatient clinics of Hospital of University of Brasilia. They were submitted to venopunction, and blood samples were collected to evaluate
25OHD (chemiluminescence, Diasorin), Calcium, PTH 1,25 (OH) vitamine D GH and IGF-1 (chemiluminescence, Immulite). The data was compared to a control group of 200 healthy subjects paired for age and gender. Results: The mean age was 49 + 12 years, 48.5% were men. Most of patients presented elevated IGF-1 levels, and upper limit normal variation was 143.0±86.5 % (36.4-450.5). PTH was 52.5±27.1 (19.2-137), Calcium 9.2±0.46 (7.7-10.2), 25(OH) vitamine D 22.9±11.7 (8.8-34.6). Vitamine D< 30 ng/ml was observed in 82,8% of Acromegalic patients, and 76% of healthy subjects. 25(OH) vitamine D < 20ng/ml, was observed in 54.2% of Acromegalic patients, compared to 32.1% of control patients (p<0,02). Only 28.6% of patients presented levels 20-30 ng/ml and 17,6% of patients were considered suffi cient, with 25 (OH) vitamine D> 30 ng/ml. Discussion and Conclusion: The frequency of vitamine D defi ciency in Acromegalic patients was high, but no association was found with IGF-1 levels and type of treatment. Other studies have to be done to determinate the impact of vitamine D defi ciency on acromegalic ostheoarthicular disease.
A-146
Frequent Vitamin D Test Ordering is Associated with Improvement of Vitamin D Status in Defi cient Patients Only
H. Signorelli (Mack)1, J. Reedy2, T. Urenda2, K. Nakatsu2, G. S. Bodor2. 1University of Colorado, Denver, CO, 2VA Medical Center, Denver, CO
Objective: Vitamin D testing volume has increased worldwide but it is unknown if frequent 25-hydroxy vitamin D (OHD) testing improves patients’ vitamin status, therefore we investigated the relationship of patients’ OHD status and the number of OHD test orders over a long period of time. Methods: 32 months’ worth of OHD test results, collection date and patients’ demographics were obtained from the LIS. Serum 25(OH) vitamin-D2 and -D3 (OHD2, OHD3, respectively) were measured by an in-house LC-MS/MS assay, calibrated to the NIST SRM 2972 standard. Total OHD was reported as the sum of OHD2 and OHD3. Assay AMR were 6-200 and 4-200 ng/mL for OHD2 and OHD3, respectively. Assay CVs were <10% throughout the AMR. Vitamin D status was defi ned as “defi cient” (<16 ng/mL), “insuffi cient (16-31 ng/mL), “normal” (32-100 ng/mL) and “toxic” (>100 ng/mL). Results: 46,660 results from 25,305 patients, mean age=60 years, were collected. 10,411 patients (41%) had multiple OHD tests over the study period. The average number of OHD orders per patient with multiple tests were 3.05. Mean OHD concentration for all patients was 32 ng/mL (SD=13.4) and 6,212 results (13%) had detectable OHD2. Overall, 8% of the results were defi cient, 45.6% were insuffi cient and 0.1 % were in the toxic range. Mean OHD concentrations varied with seasons between 28.2 and 34.4 ng/mL, (lowest and highest values in January and August, respectively). Seventy percent of the multiple OHD tests were done between 90-365 days after the initial order. No statistically signifi cant improvement of average OHD concentration was seen by trend analysis of follow up tests, even when investigating the change according to the patients’ vitamin D status as defi ned by their initial OHD result. No improvement could be demonstrated during the follow up period when results from the same months of consecutive years were compared except during the summer months, but increase in average OHD concentration during the summer months of the second and third years of observation was also seen in patients who did not have repeat OHD tests done. Initially OHD defi cient patients had received 7.9 follow of orders (average) and 56% and 29% of them became suffi cient and insuffi cient, respectively, 31 days or more after their initial testing. Over 40% of these patients remained OHD suffi cient even >1 year later. Slight improvement was seen in the OHD status of the patient group initially categorized as insuffi cient. They received 2.7 follow up tests (average) during the study period and ~50% of them became OHD suffi cient 31 days or more after the initial assessment. Initially suffi cient patients received an average of 3.5 tests following the initial measurement but 39% and 5% of them became insuffi cient and defi cient, respectively, regardless. Conclusion: Repeat OHD testing does not appear to signifi cantly improve vitamin D status in a large population, except, possibly, in those patients who had been found insuffi cient at initial observation. Our data does not support frequently repeated OHD testing in the general population.
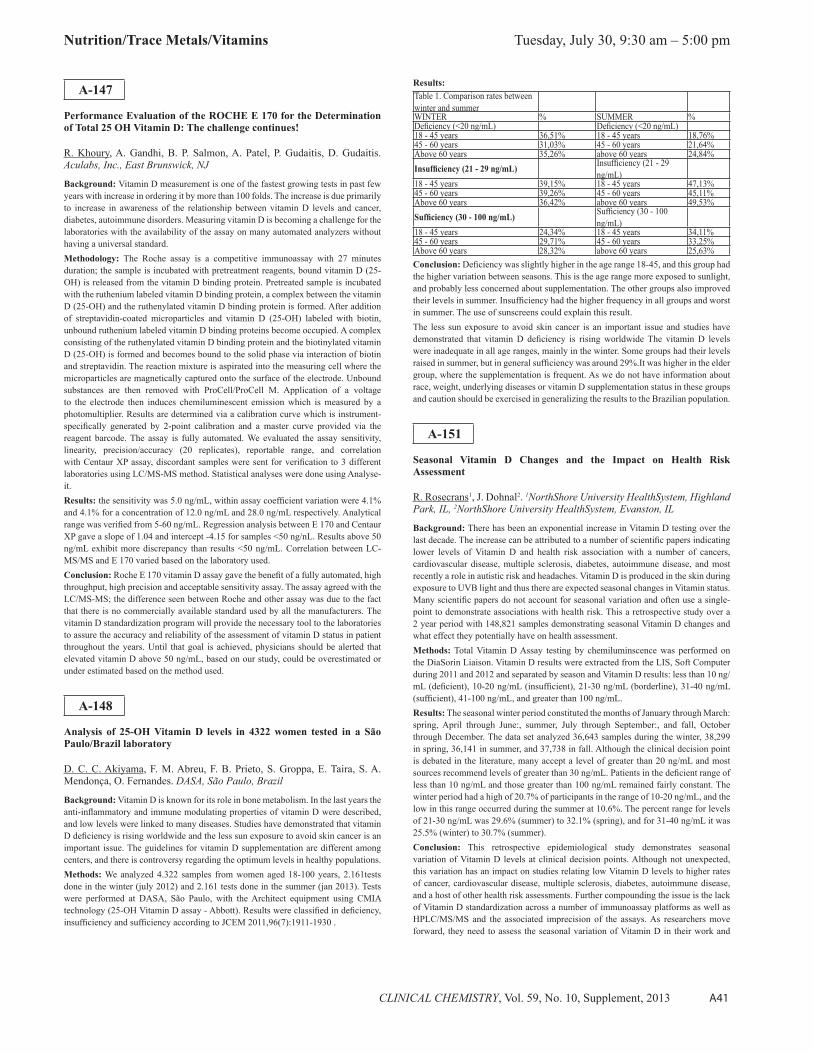
Nutrition/Trace Metals/Vitamins Tuesday, July 30, 9:30 am – 5:00 pm
CLINICAL CHEMISTRY, Vol. 59, No. 10, Supplement, 2013 A41
A-147
Performance Evaluation of the ROCHE E 170 for the Determination of Total 25 OH Vitamin D: The challenge continues!
R. Khoury, A. Gandhi, B. P. Salmon, A. Patel, P. Gudaitis, D. Gudaitis. Aculabs, Inc., East Brunswick, NJ
Background: Vitamin D measurement is one of the fastest growing tests in past few years with increase in ordering it by more than 100 folds. The increase is due primarily to increase in awareness of the relationship between vitamin D levels and cancer, diabetes, autoimmune disorders. Measuring vitamin D is becoming a challenge for the laboratories with the availability of the assay on many automated analyzers without having a universal standard.Methodology: The Roche assay is a competitive immunoassay with 27 minutes duration; the sample is incubated with pretreatment reagents, bound vitamin D (25-OH) is released from the vitamin D binding protein. Pretreated sample is incubated with the ruthenium labeled vitamin D binding protein, a complex between the vitamin D (25-OH) and the ruthenylated vitamin D binding protein is formed. After addition of streptavidin-coated microparticles and vitamin D (25-OH) labeled with biotin, unbound ruthenium labeled vitamin D binding proteins become occupied. A complex consisting of the ruthenylated vitamin D binding protein and the biotinylated vitamin D (25-OH) is formed and becomes bound to the solid phase via interaction of biotin and streptavidin. The reaction mixture is aspirated into the measuring cell where the microparticles are magnetically captured onto the surface of the electrode. Unbound substances are then removed with ProCell/ProCell M. Application of a voltage to the electrode then induces chemiluminescent emission which is measured by a photomultiplier. Results are determined via a calibration curve which is instrument-specifi cally generated by 2-point calibration and a master curve provided via the reagent barcode. The assay is fully automated. We evaluated the assay sensitivity, linearity, precision/accuracy (20 replicates), reportable range, and correlation with Centaur XP assay, discordant samples were sent for verifi cation to 3 different laboratories using LC/MS-MS method. Statistical analyses were done using Analyse-it.Results: the sensitivity was 5.0 ng/mL, within assay coeffi cient variation were 4.1% and 4.1% for a concentration of 12.0 ng/mL and 28.0 ng/mL respectively. Analytical range was verifi ed from 5-60 ng/mL. Regression analysis between E 170 and Centaur XP gave a slope of 1.04 and intercept -4.15 for samples <50 ng/nL. Results above 50 ng/mL exhibit more discrepancy than results <50 ng/mL. Correlation between LC-MS/MS and E 170 varied based on the laboratory used.Conclusion: Roche E 170 vitamin D assay gave the benefi t of a fully automated, high throughput, high precision and acceptable sensitivity assay. The assay agreed with the LC/MS-MS; the difference seen between Roche and other assay was due to the fact that there is no commercially available standard used by all the manufacturers. The vitamin D standardization program will provide the necessary tool to the laboratories to assure the accuracy and reliability of the assessment of vitamin D status in patient throughout the years. Until that goal is achieved, physicians should be alerted that elevated vitamin D above 50 ng/mL, based on our study, could be overestimated or under estimated based on the method used.
A-148
Analysis of 25-OH Vitamin D levels in 4322 women tested in a São Paulo/Brazil laboratory
D. C. C. Akiyama, F. M. Abreu, F. B. Prieto, S. Groppa, E. Taira, S. A. Mendonça, O. Fernandes. DASA, São Paulo, Brazil
Background: Vitamin D is known for its role in bone metabolism. In the last years the anti-infl ammatory and immune modulating properties of vitamin D were described, and low levels were linked to many diseases. Studies have demonstrated that vitamin D defi ciency is rising worldwide and the less sun exposure to avoid skin cancer is an important issue. The guidelines for vitamin D supplementation are different among centers, and there is controversy regarding the optimum levels in healthy populations.Methods: We analyzed 4.322 samples from women aged 18-100 years, 2.161tests done in the winter (july 2012) and 2.161 tests done in the summer (jan 2013). Tests were performed at DASA, São Paulo, with the Architect equipment using CMIA technology (25-OH Vitamin D assay - Abbott). Results were classifi ed in defi ciency, insuffi ciency and suffi ciency according to JCEM 2011,96(7):1911-1930 .
Results:Table 1. Comparison rates between winter and summerWINTER % SUMMER %Defi ciency (<20 ng/mL) Defi ciency (<20 ng/mL)18 - 45 years 36,51% 18 - 45 years 18,76%45 - 60 years 31,03% 45 - 60 years 21,64%Above 60 years 35,26% above 60 years 24,84%Insuffi ciency (21 - 29 ng/mL) Insuffi ciency (21 - 29
ng/mL)18 - 45 years 39,15% 18 - 45 years 47,13%45 - 60 years 39,26% 45 - 60 years 45,11%Above 60 years 36,42% above 60 years 49,53%Suffi ciency (30 - 100 ng/mL) Suffi ciency (30 - 100
ng/mL)18 - 45 years 24,34% 18 - 45 years 34,11%45 - 60 years 29,71% 45 - 60 years 33,25%Above 60 years 28,32% above 60 years 25,63%Conclusion: Defi ciency was slightly higher in the age range 18-45, and this group had the higher variation between seasons. This is the age range more exposed to sunlight, and probably less concerned about supplementation. The other groups also improved their levels in summer. Insuffi ciency had the higher frequency in all groups and worst in summer. The use of sunscreens could explain this result.The less sun exposure to avoid skin cancer is an important issue and studies have demonstrated that vitamin D defi ciency is rising worldwide The vitamin D levels were inadequate in all age ranges, mainly in the winter. Some groups had their levels raised in summer, but in general suffi ciency was around 29%.It was higher in the elder group, where the supplementation is frequent. As we do not have information about race, weight, underlying diseases or vitamin D supplementation status in these groups and caution should be exercised in generalizing the results to the Brazilian population.
A-151
Seasonal Vitamin D Changes and the Impact on Health Risk Assessment
R. Rosecrans1, J. Dohnal2. 1NorthShore University HealthSystem, Highland Park, IL, 2NorthShore University HealthSystem, Evanston, IL
Background: There has been an exponential increase in Vitamin D testing over the last decade. The increase can be attributed to a number of scientifi c papers indicating lower levels of Vitamin D and health risk association with a number of cancers, cardiovascular disease, multiple sclerosis, diabetes, autoimmune disease, and most recently a role in autistic risk and headaches. Vitamin D is produced in the skin during exposure to UVB light and thus there are expected seasonal changes in Vitamin status. Many scientifi c papers do not account for seasonal variation and often use a single-point to demonstrate associations with health risk. This a retrospective study over a 2 year period with 148,821 samples demonstrating seasonal Vitamin D changes and what effect they potentially have on health assessment.Methods: Total Vitamin D Assay testing by chemiluminscence was performed on the DiaSorin Liaison. Vitamin D results were extracted from the LIS, Soft Computer during 2011 and 2012 and separated by season and Vitamin D results: less than 10 ng/mL (defi cient), 10-20 ng/mL (insuffi cient), 21-30 ng/mL (borderline), 31-40 ng/mL (suffi cient), 41-100 ng/mL, and greater than 100 ng/mL.Results: The seasonal winter period constituted the months of January through March: spring, April through June:, summer, July through September:, and fall, October through December. The data set analyzed 36,643 samples during the winter, 38,299 in spring, 36,141 in summer, and 37,738 in fall. Although the clinical decision point is debated in the literature, many accept a level of greater than 20 ng/mL and most sources recommend levels of greater than 30 ng/mL. Patients in the defi cient range of less than 10 ng/mL and those greater than 100 ng/mL remained fairly constant. The winter period had a high of 20.7% of participants in the range of 10-20 ng/mL, and the low in this range occurred during the summer at 10.6%. The percent range for levels of 21-30 ng/mL was 29.6% (summer) to 32.1% (spring), and for 31-40 ng/mL it was 25.5% (winter) to 30.7% (summer).Conclusion: This retrospective epidemiological study demonstrates seasonal variation of Vitamin D levels at clinical decision points. Although not unexpected, this variation has an impact on studies relating low Vitamin D levels to higher rates of cancer, cardiovascular disease, multiple sclerosis, diabetes, autoimmune disease, and a host of other health risk assessments. Further compounding the issue is the lack of Vitamin D standardization across a number of immunoassay platforms as well as HPLC/MS/MS and the associated imprecision of the assays. As researchers move forward, they need to assess the seasonal variation of Vitamin D in their work and

Tuesday, July 30, 9:30 am – 5:00 pm Nutrition/Trace Metals/Vitamins
A42 CLINICAL CHEMISTRY, Vol. 59, No. 10, Supplement, 2013
cardiovascular or autoimmune diseases or various forms of cancer. Vitamin D is found mainly in two forms: vitamin D3 (cholecalciferol) synthesized by action of solar ultraviolet radiation on the skin and vitamin D2 (ergocalciferol) from exogenous origin only. The main storage form of Vitamin D in the body is 25(OH)D (calcidiol), found in high concentrations in serum or plasma, which makes 25(OH)D the preferred analyte for the determination of vitamin D nutritional status.Methods: the VIDAS 25-OH Vitamin D Total Assay design is based on a 2 step competitive immunoassay. In a fi rst step, serum or plasma 25(OH)D is dissociated from its protein carrier then added to alkaline-phosphatase (ALP) conjugated specifi c antibody. In a second step, unbound ALP-antibody is then exposed to vitamin D analog coated-solid phase receptor. Solid phase is then washed and substrate reagent added to initiate the fl uorescent reaction. An inverse relationship exists between the amount of 25(OH) vitamin D in the sample and the amount of relative fl uorescence units detected by the system. Precision of the VIDAS 25-OH Vitamin D Total Assay was determined across the dynamic range using assay controls and serum samples in a 5 day protocol according to CLSI EP15-A2. Linearity was performed by diluting a high sample with a low sample and a high sample according to CLSI EP6. Method comparison to LCMS/MS and other immunoassays was achieved using >100 serum specimens spanning the VIDAS calibrated range and DEQAS samples. Serums were tested on multiple batches with each method. Recovery of 25(OH)D2 on the VIDAS assay was determined using serum with endogenous 25(OH)D2 (no spiking).Results: data obtained with the VIDAS 25-OH Vitamin D Total Assay demonstrated a limit of detection <8 ng/ml and a functional sensitivity (20% dose total CV) <10 ng/ml. Linearity was achieved from LOD to an upper limit of 120 ng/ml. Total assay CVs (between run/day/lot) were <8% (at 20 ng/ml), <5% (30 ng/ml), <5% (70 ng/ml), and 1.7% (120 ng/ml). Detection of endogenous 25(OH)D2 was calculated at >75% cross-reactivity. A method comparison study showed that the VIDAS 25(OH) Vitamin D Total Assay is well correlated to a FDA-approved commercial immunoassay and to mass spectrometry measurements obtained from a NIST-calibrated LC-MS/MS.Conclusion: the VIDAS 25-OH Vitamin D Total Assay exhibits excellent analytical data (linearity, sensitivity, precision), good cross-reactivity with endogenous 25(OH)D2 samples and is traceable to LCMS/MS reference methods. The assay is a valuable tool in clinical laboratories or physician offi ce laboratories for the accurate measurement of vitamin D defi ciency in human sera.
A-154
Evaluation of vitamin D levels in patients with erectile dysfunction
A. Barassi1, E. Dozio2, G. Dogliotti2, M. Castiglioni3, F. Ciociola3, F. Pelliccione3, G. M. Colpi3, M. M. Corsi4, G. Melzi d’Eril1. 1Dipartimento di Scienze della Salute, Università degli Studi di Milano, Milan, Italy, 2Dipartimento di Scienze Biomediche per la Salute, Università degli Studi di Milano, Milan, Italy, 3Unità di Andrologia e Riproduzione Assistita, Ospedale San Paolo, Milan, Italy, 4Dipartimento di Scienze Biomediche per la Salute, Università degli Studi di Milano e IRCCS Policlinico San Donato, Milan, Italy
Background: There are numerous causes of erectile dysfunction (ED), including psychogenic, organic, and a combination of psychogenic and organic. It has been estimated that nearly one half of ED is related to vascular causes. Normally, blood vessels dilate in response to endothelial-dependent stimulation in which the endothelium releases substances (NO) that cause the surrounding smooth muscle to relax. Any disorders causing endothelial dysfunction will also interfere with vasodilation, which prevents erection. Because both cardiovascular disease (CVD) and ED are, at least in part, vascular diseases, treatments with lifestyle changes that improve CVD often also do so for ED. Vitamin D defi ciency has increased profoundly in the last two decades and it is known that its defi ciency is associated with arterial stiffness and vascular dysfunction. According to data from NHANES, a level of vitamin D > 30 ng/mL is considered adequate for health (Autoimmun Rev 2010; 9: 709-15). It has recently been hypothesized that optimizing vitamin D levels would have positive benefi ts for men suffering from ED. The aim of this study was to evaluate the vitamin D levels in a group of 100 men (median age 49 y, range 32-55 y) in good health with a history of less than one year of ED. Methods:The diagnosis of ED was based on the International Index of Erectile Function 5-questionnaire. Patients were classifi ed as arteriogenic (n. 41), when theirPSV was < 20 cm/sec and non-arteriogenic (n. 59), when their PSV was >35 cm/sec or <35 cm/sec but > 25 cm/sec and concomitant EDV < 0 cm/sec, in relation to the results of the echo-color-Doppler examination of cavernosal arteries in basal conditions and after intracavernous injection of 10 microg of prostaglandin E1. Vitamin D levels were measured by RIA assay (Diasorin, Italy). Results: Vitamin D levels (median, range in ng/mL) in arteriogenic ED patients (19.1, 5.7-43.2) were signifi cantly lower (p < 0.03) than in non-arteriogenic patients (24.9,
not use a single-point Vitamin D level. Certainly these issues have contributed to discrepancies between the Institute of Medicine’s recommendations for Vitamin D supplementation and those of health risk assessment researchers.
A-152
Measurement of vitamin K1 (phylloquinone) in human serum by liquid chromatography-tandem mass spectrometry
D. M. Garby, R. DelRosso, L. A. Cheryk. Mayo Medical Laboratories, Andover, MA
Background: Vitamin K1 or phylloquinone is part of a group of similar fat soluble vitamins in which the 2-methyl-1,4-naphthoquinone ring is common. Phylloquinone is found in high amounts in leafy green vegetables and some fruits (avocado, kiwi). It is a required cofactor involved in the gamma-carboxylation of glutamate residues of several proteins. Most notably, the inactive forms of the coagulation factors prothrombin (factor II), factors VII, IX, and X and protein S and protein C are converted to their active forms by the transformation of glutamate residues to gamma-carboxyglutamic acid (Gla). Other proteins such as those involved in bone metabolism, cell growth and apoptosis also undergo this Gla transformation. Measurement of vitamin K1 (phylloquinone) in serum is a strong indicator of dietary intake and status.Methods: Deuterated stable isotope phylloquinone-d7 (25 μL) is added to a serum sample as an internal standard. Protein is precipitated from the mixture by the addition of ethanol/0.01% butylated hydroxytoluene. The specimen is then centrifuged for 15 minutes at 1750xg. Phylloquinone and internal standard are extracted from the resulting supernatant by solid phase extraction using a Strata™-X 33μm Polymeric Reversed Phase 30 mg/3 mL column (Phenomenex, Torrance, CA). Phylloquinone and internal standard are then separated by liquid chromatography using a Kinetex™ 2.6μm C18 100x4.6mm column (Phenomenex, Torrance, CA) on a TLX4 high throughput liquid chromatography (HTLC) system (Thermo Fisher Scientifi c, Waltham, MA), followed by analysis on a tandem mass spectrometer (API 5000, AB SCIEX, Foster City, CA) equipped with an electrospray ionization source in positive mode. Ion transitions monitored in the multiple reaction monitoring (MRM) mode were m/z 451.5 → m/z 187.1 for phylloquinone and m/z 458.5 → m/z 194.2 for phylloquinone-d7. Calibrators consisted of six standard solutions ranging from 0 to 5 ng/mL.Results: Method performance was assessed using precision, linearity, recovery, accuracy and specimen stability. Pooled human serum was processed neat, diluted with phosphate buffered saline (pH=7.4) containing 50 g/L bovine serum albumin to achieve low analyte concentrations, or fortifi ed with a phylloquinone solution to achieve elevated analyte concentrations. Intra-run precision (N=20) coeffi cients of variation (CVs) ranged from 1.7% to 2.8%. Inter-run precision (N=25) CVs ranged from 5.8% to 8.9%. The method demonstrated linearity over the assay range (0.025 to 5.0 ng/mL), yielding the following equation: observed phylloquinone value = 1.0064*(expected value) + 0.0052, R2 = 0.9997. Recovery was demonstrated by mixing serum samples containing high and low analyte concentrations and averaged 99%. Correlations were run (N=60) comparing the phylloquinone HPLC method performed at an external reference laboratory (x) with the LC-MS/MS phylloquinone method performed at Mayo Medical Laboratories (y). Linear regression of the data yielded the following equation: y = 0.9701x + 0.0051 and a correlation coeffi cient, R=0.9980. A stability study demonstrated that specimens are stable at ambient (20ºC to 25ºC), refrigerated (2ºC to 8ºC), frozen (-15ºC to -30ºC) and ultra frozen (-65ºC to -90ºC) temperatures for up to 14 days.Conclusion: This method provides for the reliable analysis of vitamin K1 (phylloquinone) in human serum.
A-153
Measurement of Total 25(OH) Vitamin D using bioMérieux VIDAS : development of a new assay.
E. Moreau, J. Dupret-Carruel, M. Hausmann. Biomérieux, Marcy l’Etoile, France
Background: an assay for total 25-hydroxy vitamin D [25(OH)D] that measures both 25(OH)D2 and 25(OH)D3 is being developed by bioMérieux. Vitamin D is a fat-soluble steroid pro-hormone which defi ciency can be associated with rickets, osteoporosis, secondary hyper-parathyroidism, as well as increasing risk of diabetes,

Nutrition/Trace Metals/Vitamins Tuesday, July 30, 9:30 am – 5:00 pm
CLINICAL CHEMISTRY, Vol. 59, No. 10, Supplement, 2013 A43
6.5-52.9). Furthermore, 85% and 44% of ED arterogenic and 52% and 37% of ED non-arteriogenic have levels of vitamin D < 30 ng/mL and < 20 ng/mL, respectively, that means an insuffi ciency and defi ciency of vitamin D, respectively. Our study shows that, at least in our experimental conditions, the levels of vitamin D are not suffi ciently different to accurately discern between arteriogenic and non-arteriogenic patients and that the defi ciency of vitamin D does not characterize only arteriogenic ED but all ED patients. It is probable that in conjunction with other risk factors, the insuffi ciency/defi ciency of vitamin D may be involved in the mechanism causing ED. Conclusion: In conclusion, we hypothesize that a level of vitamin D > 30 ng/mL could prevent the effect of the most common risk factors of ED like atherosclerosis, vascular calcifi cation and endothelial dysfunction.

Tuesday, July 30, 9:30 am – 5:00 pm Mass Spectrometry Applications
A44 CLINICAL CHEMISTRY, Vol. 59, No. 10, Supplement, 2013
Tuesday, July 30, 2013
Poster Session: 9:30 AM - 5:00 PM
Mass Spectrometry Applications
A-155Absolute traceable protein quantifi cation methods using isotope dilution mass spectrometry with three different strategies
J. Jeong, Y. Yim, J. Yim, I. Yoon, H. Lee, S. Kim, S. Kim, Y. Lee, S. Park. Korea Research Institute of Standards and Science, Daejeon, Korea, Republic of
Background: Measurement traceability in protein quantifi cation is required to standardize quantifi cation results irrespective of the measurement procedure and laboratory. As no analytical method can yet directly quantify whole proteins to the desired level of accuracy, proteins are reduced to analyzable entities with certain stoichiometric values, and which are then analyzed to deduce the quantity of original protein. We described absolute traceable methods in three different strategies based on the peptides, amino acids, and specifi c element as well. All methods used isotope dilution mass spectrometry to provide traceability to the Système d’Unitè International for quantifi cation of human growth hormone as a candidate of certifi ed reference material.Methods: Purifi ed recombinant human growth hormone (hGH, 22 kDa) was used as a model protein. Sample purity was confi rmed using capillary zone electrophoresis and HPLC. First, hGH was hydrolyzed by acid hydrolysis with 8 M hydrochloric acid at 130 ℃ for 48 h for amino acid based quantifi cation. Second, two tryptic peptides from hGH were chosen to determine hGH by tryptic digestion. The target peptides and its isotope residues were synthesized and value assigned by amino acid analysis. Double exact matching ID-HPLC-tandem MS was used for amino acid analysis as well as peptide analysis. Third, hGH, which contains seven sulfur-containing amino acid residues, was reduced into element level with microwave assisted digestion. Digested hGH were determined to total amount of sulfur using ID-inductively coupled plasma/MS. The results from three different methods were evaluated by comparison with each other.Results: Each method for protein reducing and analytical conditions was optimized. The results from four different amino acids showed good agreement within 2% CV, and also showed excellent intra-day and inter-day precisions of < 1.5% CV. The results from two different peptides agreed with 5% CV with excellent reproducibility (< 2%). At last, the results by sulfur content showed excellent reproducibility within 3% CV. The hGH contents from three different methods were agreed with 5% bias. Sulfur-based result showed a little higher value with smaller uncertainty whereas amino acid-based result showed a lower value, and peptide-based result was in between but showed a little larger uncertainty (5%). Conclusion: The concentration of the hGH was therefore determined based upon the concentration of tryptic peptides, and the concentration of hydrolyzate amino acids, and the concentration of sulfur as well. Although the results were presented small bias, each method is suitable for the accurate quantifi cation of hGH, and could satisfactorily serve as a reference analytical procedure for hGH and other similar proteins. Moreover, these three different methods provide an alternative method for absolute quantifi cation of proteins, especially for pure protein standards. Further researches to resolve small discrepancy among them is in progress.
A-156
A Sensitive and Rapid Liquid Chromatography-Tandem Mass Spectrometry Method for Quantifi cation of Lacosamide and Desmethyl Lacosamide using Lacosamide-13C,d3 as Internal Standard
D. A. Payto, S. Wang. Cleveland Clinic, Cleveland, OH
Background: Lacosamide (LCM) is an antiepileptic drug (AED) approved by the FDA in October 2008 for the adjunctive treatment of partial onset seizures. The major metabolite in human is O-desmethyl lacosamide (ODL). Monitoring LCM and ODL may help physicians to optimize the therapeutic dosing. Though there are published methods for the quantifi cation of LCM by either liquid chromatography-ultraviolet (HPLC-UV) or liquid chromatography-tandem mass spectrometry (LC-MS/MS) there are few that measure both LCM and ODL simultaneously and none uses an isotope
labeled internal standard (IS) for LC-MS/MS methods. Our objective was to develop and validate a simple, sensitive, and rapid LC-MS/MS assay for the quantifi cation of LCM and ODL using lacosamide-13C,d3 as IS. Methods: Serum (25μL) and 150μL IS solution (5μg/mL of lacosamide-13C,d3 in methanol) were vortex mixed and centrifuged. Supernatant (10μL) was mixed with 1000μL of 0.1% formic acid in water and 3μL was analyzed on an Accucore C18 column in an LC-MS/MS system. Total chromatographic time was 6.5 minutes. A quantifi er and a qualifi er transition were monitored for LCM (quantifi er, 251.1→108.0 and qualifi er, 251.1→116.1) and ODL (quantifi er, 237.1→108.0 and qualifi er, 237.1→91.1). Results: LCM was linear from 0.65 to 44.56 μg/mL with analytical recoveries ranging from 89.7 to 104.8%, while ODL was linear from 0.76 to 48.84 μg/mL with analytical recoveries of 97.8-122.0%. The total coeffi cient of variation was <4.7% for LCM and <4.0% for ODL at three levels tested. Comparison with an independent LC-MS/MS method showed a mean difference of 0.01μg/mL (-2.4%) for LCM and 0.11μg/mL (-4.9%) for ODL. Deming regressions are presented in Figure 1. Conclusion: This validated LC-MS/MS method offers a rapid and sensitive quantifi cation of LCM and ODL with simple sample preparation. It has been validated for clinical use.
A-157
A simple, fast, and sensitive method for the measurement of serum nicotine, cotinine and nornicotine by liquid chromatography-tandem mass spectrometry
C. Yuan, J. Kosewick, S. Wang. Cleveland Clinic, Cleveland, OH
Background: Measurement of nicotine and its metabolites has been used to monitor tobacco use. High sensitivity method (<1 ng/mL) is necessary to differentiate non tobacco users from passive tobacco users when serum or plasma samples are used. Here, we report a novel liquid chromatography-tandem mass spectrometry (LC-MS/MS) method to quantify nicotine, cotinine and nornicotine in serum with high sensitivity.Methods: Sample preparation involved only protein precipitation. Samples were further purifi ed by online turbulent fl ow extraction and analyzed by liquid chromatography on a porous graphite column in alkaline conditions (pH>11). Two fragment ions, a quantifi er and a qualifi er, were monitored for each analyte. The chromatography time per injection was 4 minutes.
Mass Spectrometry Applications Tuesday, July 30, 9:30 am – 5:00 pm
CLINICAL CHEMISTRY, Vol. 59, No. 10, Supplement, 2013 A45
Results: Comparing to acidic mobile phase buffers, alkaline buffers resulted in higher mass spectrometry response, increased chromatographic retention, and better peak shape for all three analytes. No matrix effects were observed only after turbulent fl ow on-line extraction. The lower limit of quantifi cation was 0.36, 0.32, and 0.38 ng/mL for nicotine, cotinine, and nornicotine, respectively, while accuracy was 91.6-117.1%. No signifi cant carryover was observed up to 550 ng/ml of cotinine, 48 ng/mL of nicotine, and 48 ng/mL of nornicotine. Total coeffi cient of variation was less than 6.5% for the analytes at three concentration levels tested. Measurement of nicotine and cotinine was compared with an LC-MS/MS method offered by an independent lab using 21 leftover patient serum specimens and 20 spiked blank serum samples. For nicotine, Deming regression showed a slope of 0.914, an intercept of -0.2 ng/mL, and a correlation coeffi cient of 0.9941 with a mean difference of 8.9%. For cotinine, Deming regression rendered a slope of 1.089, an intercept of 1.8 ng/mL, and a correlation coeffi cient of 0.9964 with a mean difference of -6.8%. No comparison was performed for nornicotine due to the lack of a commercial test.Conclusion: The newly developed LC-MS/MS method was simple, fast, sensitive, and accurate. It was validated to measure nicotine, cotinine and nornicotine in serum for monitoring tobacco use.
A-158
Do Deuterium Labeled Internal Standards Correct for Matrix Effects in LC-MS/MS Assays? A Case Study Using Plasma Free Metanephrine and Normetanephrine.
D. R. Bunch1, J. Gabler2, J. M. El-Khoury1, S. Wang1. 1Cleveland Clinic, Cleveland, OH, 2ThermoFisher Scientifi c, Cleveland, OH
BACKGROUND: Matrix effect is a major issue complicating analytical methodologies for biological matrices by liquid chromatography-mass spectrometry (LC-MS). It was traditionally believed that deuterium labeled internal standards (d-IS) correct for matrix-dependent ion suppression or enhancement. However, new evidence has demonstrated that the degrees of matrix effects for the analyte and its d-IS may be different. One hypothesis is due to the slight difference in their retention times. This renders it challenging to select an appropriate alternate matrix for preparation of calibrators, which is particularly important for analyzing endogenous analytes. In this report, we studied a case of uncompensated matrix effects using d-IS and the means to test for an appropriate alternative matrix. METHODS: The matrix effects of plasma free metanephrine and normetanephrine using their respective d3-IS were evaluated by a mixing study. The mixing study was performed by separately mixing three male and three female plasma samples with an alternate matrix in a 1:1 ratio. The alternate matrix, patient samples, and 1:1 mixed samples were extracted in triplicate and run by an LC-MS method. The criterion for passing is the measured response ratio (analyte/IS) of each 1:1 mixture being within 20% of the mean response of the patient and the alternate matrix. RESULTS: There was no retention time difference between the d-IS and analytes. More than 10 total matrices were tested and the results for six representative alternate matrices are listed in the table. Most matrices failed the test indicating differential matrix effects for the analytes and their d-IS. The fi nal acceptable alternate matrix for this assay was 10 mM ammonium phosphate pH 6.5. CONCLUSION: Matrix effects are not always compensated for by using a d-IS. However, an acceptable alternate matrix can still be determined by performing mixing studies of alternative matrices with patient samples.
Alternate Matrix Tested
Sample
10mM Ammonium Phosphate pH 6.5
Water 0.1% Metabisulfi te
5% Albumin
1% Meta-bisulfi te
Drug Free Serum
Metanephrine 1 -1.5 -23.2 12.7 1.0 6.5 4.02 2.7 24.7 22.8 10.7 3.9 43.83 -5.8 -32.2 1.1 447.0 3.6 -9.24 -2.8 N/A 12.4 0.4 3.7 -5.35 2.9 N/A 59.3 -2.4 45.4 -12.86 0.75 N/A 4.6 24.9 46.3 4.7
Normetanephrine 1 -0.4 -20.7 12.1 1.9 -13.9 -11.82 3.3 23.2 5.5 6.1 -10.8 -13.63 3.1 -30.1 -4.5 6.9 -4.5 -11.04 1.2 N/A -1.5 6.9 -14.8 -12.95 -1.7 N/A -1.5 15.5 -13.2 -11.76 0.9 N/A 17.4 11.4 -10.1 -10.2
A-159
A Simple and Fast Liquid Chromatography - Tandem Mass Spectrometry Method for the Quantifi cation of Rapamune and Everolimus Without the Use of a Column Heater
D. A. Payto1, C. Yuan1, J. Gabler2, S. Wang1. 1Cleveland Clinic, Cleveland, OH, 2Thermo Fisher Scientifi c, West Palm Beach, FL
Background: Rapamune and everolimus are immunosuppressant drugs approved by Food and Drug Administration for kidney transplantation. Therapeutic drug monitoring of these drugs is recommended due to their narrow therapeutic windows and large inter-individual variations. Liquid chromatography-mass spectrometry (LC-MS) methods offer specifi c and sensitive results. In most LC-tandem mass spectrometry (LC-MS/MS) methods available in literature, only one selected reaction transition is monitored. All published LC-MS/MS methods incorporate the use of a column heater to ease the elution. The objective of this work was to develop a rapid and robust LC-MS/MS for rapamune and everolimus without the use of a column heater. Methods: Whole blood (100 μL) and an internal standard solution (300μL; rapamune-d3 at 5ng/mL and everolimus-d4 at 10ng/mL in acetonitrile/0.1 M zinc sulfate solution 70/30) were vortex mixed and centrifuged. The supernatant (75μL) was injected for on-line turbulent fl ow sample clean-up prior to LC-MS/MS analysis using a reverse phase column maintained at room temperature. Total chromatographic run time was 3.75 minutes per injection. A quantifi er (sum of 931.6→882.4 and 931.6→864.4) and qualifi er (931.6→814.4) transition were monitored for rapamune. For everolimus, the quantifi er was 975.61→908.7 and qualifi er was 975.61→926.9. Ion ratio confi rmation was used for peak identifi cation. Results: No ion suppression was observed for either analyte. No carryover was observed up to a concentration of 53.8ng/mL for rapamune and 126.0ng/mL for everolimus. Analytical measurement range (serial dilution of a spiked patient pool), analytical recovery, and CV (based on CLSI EP10-A3 guidelines) are shown in table 1. Comparison with a previously validated LC-MS/MS method yielded agreeable results with mean differences of 11% for rapamune and -3.6% for everolimus. Conclusion: This validated LC-MS/MS method offers rapid and robust quantifi cation of rapamune and everolimus without the use of a column heater. This assay has been validated for clinical use.
Table 1. Method ValidationRapamune Everolimus
Analytical Measurable Range 0.6 - 54.0 ng/mL 0.6 - 60.9 ng/mLAnalytical Recovery (%) 90.0 - 100.1 94.4 - 102.9Total CV (%) 4.4 - 7.3 2.5 - 6.6Intra-Assay CV (%) 3.3 - 7.3 2.0 - 6.6
A-160
Development of an LC-MS/MS method for the quantitation of serum Androsta-4,16,-dien-3-one
X. Yi, E. K. Leung, D. W. Kern, M. K. McClintock, C. C. Lee, K. T. J. Yeo. The University of Chicago, Chicago, IL
Background: The putative human pheromone androstadienone (androsta-4,16,-dien-3-one) has been shown to modulate psychological, physiological, and hormonal outcomes including reduced perception of pain, increased attention to emotional stimuli, and modulation of cortisol levels, but there is currently no reliable way to measure its production. The purpose of this research study is to develop a method using liquid chromatography tandem mass spectrometry (LC-MS/MS) for reliably detecting minute amounts of androstadienone in human blood, and to utilize such a method for future studies to measure individual variation in rates of production of androstadienone associated with various emotional stimuli.Methods: Androstadienone standard and androsterone-d2 internal standard (IS) were purchased from Steraloids, Inc (Newport, RI). 190 μl of androstadienone in charcoal-stripped serum was combined with 10μl of 200ng/ml IS, and extracted with methyl t-butyl ether (MTBE). The organic phase was evaporated and the dried residues were derivatized in hydroxylamine hydrochloride (0.7mol/ L, 3:7 methanol/water) at 70°C for 15min. Androstadienone and IS were detected by electrospray ionization in positive mode with the following transitions: Androstadienone 286>114 and IS 306>133. LC-MS/MS setup consisted of a Thermo Accela 600 pump interfaced to a Thermo TSQ Quantum triple quadrupole mass spectrometer. Chromatographic separation was performed using a Phenomenex luna 3μ phenyl hexyl column (2.0mm by 150 mm) and a gradient of 0.1 % formic acid and methanol. To evaluate the

Tuesday, July 30, 9:30 am – 5:00 pm Mass Spectrometry Applications
A46 CLINICAL CHEMISTRY, Vol. 59, No. 10, Supplement, 2013
performance of this method, accuracy and precision of this method were measured using 4 points (0.1ng/ml, 0.3ng/ml, 4.0 ng/ml and 8.0ng/ml) on each calibration curve and the reproducibility was measured for 4 subsequent days.Results: The method described displayed good linearity over a concentration range of 0.1-10ng/ml with r2 >0.995, and measured CVs for calibration standards were less than 15% across the entire concentration. Intra-day and inter-day precision for all QC levels showed CVs ≤10.96% and ≤10.21%, respectively; the inter-day accuracy (RE%) for QC serum samples were ≤11.0%, all within the acceptable limits of precision and accuracy ( ≤ 15%). The method was applied to determine the plasma concentration of androstadienone in a relatively healthy population (primary care outpatient population) which showed a preliminary reference range of 0.00-1.05 ng/ml (n=20).Conclusion: A sensitive LC-MS/MS method was developed for androstadienone in human serum. The validation study showed the method is accurate and reproducible and can be used for further studies of changes of this pheromone in subjects under different emotional states.
A-161
High-Throughput determination of 25-OH-Vitamin D2 and D3 in plasma in 9 seconds per sample using LDTD-MS/MS with Differential Mobility Spectrometer for Isobaric separation
P. Picard, S. Auger, G. Blachon, J. Lacoursiere, A. Birsan. Phytronix Technologies Inc, Quebec, QC, Canada
Background: The Laser Diode Thermal Desorption (LDTD) ionization source has been coupled to a mass spectrometer equipped with SelexION differential ion mobility cell, enabling a high throughput capacity for the analysis of 25-OH-vitamin D2 and D3 in biological matrix, with sample-to-sample analysis time of 9 seconds. The endogenous isobaric compounds 7α-OH-cholesten-2-one and 1-α-OH-D3 are known to interfere with similar MS/MS transition as 25-OH-D3. Thermal desorption process vaporizes all compounds simultaneously, so isobaric molecules with similar structure may potentially interfere. Improvement of the analysis specifi city is achieved by the action of the Differential Ion Mobility Spectrometry. Desorption of individual compounds at the optimized DMS parameters demonstrates specifi city equivalent to liquid chromatography but at the speed of electronic separation, in milliseconds.Methods: Preparation of sample consisted of a protein precipitation of human plasma by addition of methanol followed by a liquid-liquid extraction with hexane. 5 μL of the upper layer is deposited in proprietary 96-wells plate and allowed to dry prior to analysis. Calibration curve is prepared using multilevel calibrator set from Chromsystem. Additional curve levels are prepared by dilution of calibrator with stripped serum. The mass-spectrometer operates in MRM mode, with transitions 413/337 and 401/355 used for quantifi cation of 25-OHD2 and 25-OH-D3 respectively. Separation voltage applied to the DMS cell of the SelexION is 4400 Volts, and the compensation voltage used to isolates the two compounds from interferences is 10 VoltsResults: Quantitation curve ranges from 1-65 ng/mL and 1.5-94 ng/mL for 25-OH-VitaminD3 and D2 respectively. Blank levels are less than 20% of the LOQ for both compounds. To assess the accuracy and precision, calibration points and QC’s are analyzed in triplicate. Reproducibility for n=3 is ranging from 0.6 to 12.3%. Calculated concentrations of QC’s are within 15% of reported values. Correlation between LC-MS/MS and LDTD-MS/MS samples is expressed by R2 = 0.952. Multiple tests are conducted for validation. Matrix effect is evaluated by fi rst measuring the original level of 6 different plasma samples and spiking them with a known amount of 25-OH-D3. We observe constant difference between pre-spiked and post-spiked results. Cross validation of the method is achieved with samples measured by LC-MS/MS using an established, and validated, method at the Toronto General Hospital. The passing-Bablok regression revealed no signifi cant deviation from linearity (Cusum test, P=0.10). Bland and Altman plot shows that the mean bias of the two methods was -0.885 and all samples are within the confi dence interval of 95%. LDTD-MS/MS analysis reproducibility on those measurements is ranging from 1.3 to 13.8% (n=3).Conclusion: LDTD ion source coupled to SelexION™ DMS achieves specifi c analysis of 25-OH vitamin D2 and D3 in the appropriate concentration ranges. SelexION™ DMS increases selectivity and helps in removing isobaric interferences. LC-MS/MS and LDTD-MS/MS measured values on real samples correlate within 95% confi dence interval of statistical analysis. LDTD provides the High-Throughput analysis of 25-OH vitamin D2 and D3 in 9 seconds sample-to-sample.
A-162
Development of A High Performance Liquid Chromatography-Tandem Mass Spectrometry Method (HPLC-MS/MS) for Pain Management Testing in Urine
I. Shu, P. Wang. The Methodist Hospital, Houston, TX
Background: There is currently a growing, deadly epidemic of prescription pain killer abuse in the United States. A pain management program is necessary to monitor patient compliance. The objective of this project was development of an HPLC-MS/MS assay detecting a total of 21 drugs and metabolites in urine.Methods: The HPLC-MS/MS quantitative assay included 5 glucuronide-conjugated compounds (morphine-3-glucuronide, morphine-6-glucuronide, oxymorphone-3-glucuronide, hydromorphone-3-glucuronide [H3G], and codeine-6-glucuronide [C6G]), and 16 drugs and metabolites. Using Bio-Rad Drug Free Urine, the single-point glucuronide calibrator was prepared at 50ng/mL, and all other drugs (except fentanyl) were prepared at fi ve levels in a range of 20-1000 (fentanyl 1-50) ng/mL. The calibrators were further diluted to 1-10ng/mL to determine lower limit of quantitation (LLOQ) tested for three days. Quality controls (QC) were prepared at levels of 25% below and above cut-off values: 250ng/mL for amphetamine/methamphetamine, 50ng/mL for glucuronides/methadone/EDDP/tramadol, 5ng/mL for fentanyl, and 100ng/mL for benzoylecgonine and all other analytes. Accuracy was tested by recovering three different known levels of compounds spiked into three patient drug-free urine samples with pH range of 5.5-7.0 and presence or absence of ketones, protein, leukocyte esterase, and blood as determined by iChem® urinalysis. One hundred microliter of urine was diluted by 500 microliter of 0.2% formic acid solution containing 19 internal standards (Cerilliant) at 10ng/mL. The 21 analytes were separated by Waters XSelect HSS T3 2.1x75mm, 2.5 microm column with a binary mobile phase (A: 2 mM ammonium formate, 0.2% formic acid in water; B: 10mM ammonium acetate, 0.1% formic acid in methanol) within 13.5 minutes at a fl ow rate of 0.3 mL/min, eluting to Waters Quattro Micro mass spectrometer with electrospray ionization in a positive mode. Chromatographic peaks of each analyte were acquired with quantitating and confi rmatory ion transitions at cone voltages and collision energies unique to each compound.Results: All analytes were linear within their calibration curves (slope 0.97-1.08, intercept -1.98-1.89, r2>0.950). Coeffi cient of variations (CV) of QC within-run (n=10) and between-run over four days (n=30) were 1.6-14.5%. LLOQ (CV<20%) was 10-30ng/mL for glucuronides, 0.2 ng/mL for fentanyl, and 1-20ng/mL for all other analytes. All recoveries were determined to be 86-110%. We then tested 64 patient urine samples previously screened by Alere Triage® TOX Drug Screen assay. There were 15 samples screened negative for Triage menu, 27 positive for opiates, 10 positive for amphetamines, and 21 positive for cocaine. The HPLC-MS/MS assay was 55/58 (95%) in agreement with the positive Triage Screen results. Three Triage Screen opiate-negative urine samples were found 130ng/mL C6G and 90-164ng/mL hydrocodone/hydromorphone/glucuronide. We found 10 samples positive for methadone/tramadol and metabolites. Overall, we detected a total of 46 compounds above LLOQ in the samples with negative Triage Screen in amphetamine, cocaine, and/or opiate classes.Conclusion: We developed an HPLC-MS/MS assay that was linear, precise, and accurate for all 21 pain prescriptive drugs and their metabolites. We detected compounds that were not included or below detection cut-off levels in the Triage Screen assay. We therefore concluded that the HPLC-MS/MS assay was suitable for supporting pain management program.
A-163
Infl iximab measurement in serum using selective reaction monitoring LC-MS/MS
M. A. V. Willrich, D. R. Barnidge, R. M. Karras, P. M. Ladwig, D. L. Murray, M. R. Snyder. Mayo Clinic, Rochester, MN
Background: Monoclonal antibody therapy has revolutionized the treatment of chronic infl ammatory diseases. Infl iximab, a human-murine chimeric monoclonal IgG1k that targets tumor necrosis factor-alpha (TNF-α), is approved for rheumatoid arthritis, ankylosing spondilitis and infl ammatory bowel disease. In the absence of therapeutic drug monitoring, non-responders are generally treated with higher doses or with increased frequency. This approach is wasteful and can delay consideration of other treatments. Several studies have demonstrated that therapeutic concentrations of Infl iximab are associated with clinical response and improved prognosis. However, current clinical laboratory methods for monitoring of Infl iximab are limited.

Mass Spectrometry Applications Tuesday, July 30, 9:30 am – 5:00 pm
CLINICAL CHEMISTRY, Vol. 59, No. 10, Supplement, 2013 A47
Objective: The goal of this study was to verify that tryptic peptides could be used to quantitate Infl iximab and to differentiate the drug from other human immunoglobulins in serum.Methods: A list of tryptic peptides unique to the heavy and light chain variable regions were predicted by in silico digestion of Infl iximab variable region sequences found in the IMGT database (http://www.imgt.org/3Dstructure-DB). Infl iximab (RemicadeTM, Janssen Biotech, Inc.) was reconstituted to 10 mg/mL in 50 mM ammonium bicarbonate, reduced, alkylated and digested with trypsin (1:20 enzyme:substrate) at 37oC for 4 hours. Digests were analyzed by IDA LC-ESI-Q-TOFMS; the most abundant peptides matching the in silico list were chosen for subsequent studies. Quantitation of Infl iximab was accomplished using standard SRM analysis on an ABSciex API 5000 using pooled human serum from healthy controls or 50 mM ammonium bicarbonate, each spiked with Infl iximab. A 9-point standard curve was generated [blank, 0.25, 0.5, 1, 2, 5, 10, 20 and 50 ug/mL]. A known concentration of purifi ed horse IgG (200 ug/mL) with a unique non-human constant region peptide was added to each sample as a pre-analytical digestion control along with stable isotope-labeled peptide internal standards to monitor HPLC retention times. Samples were processed to remove non-immunoglobulin proteins using the Melon Gel purifi cation kit (Pierce, Rockford, IL), followed by trypsin digestion. Peptides were separated on reverse-phase C18 liquid chromatography (Atlantis T3 3x100 mm) and subjected to MS/MS.Results: Tryptic peptides unique to Infl iximab were identifi ed for both the heavy and light chains and blasted against a human database; no signifi cant cross-matches were identifi ed. Heavy and light chain peptides were quantitated in buffer with a coeffi cient of variation (CV) of 11% and 5%, respectively, measured by the analyte/horse IgG peak-area ratio at 20 ug/mL Infl iximab. Limit of detection was 0.25ug/mL, with a linear dilution response between 100-0.25 ug/mL (R2>0.99) for both heavy and light chain peptides. After spiking Infl iximab into the serum matrix, CVs of 20% were obtained for the heavy and light chain peptides, with the lowest detectable concentration at 5.0ug/mL. The dilution response was linear from 50-2 ug/mL (R2>0.99) for both peptides. Conclusions: While sensitivity and precision merit further development and studies with samples from patients taking Infl iximab are warranted, we have demonstrated the ability to quantitate Infl iximab using variable region peptides by LC-MS/MS in the presence of other human immunoglobulins. This analytical approach has the potential to be quickly adaptable to other drugs in this class and to signifi cantly improve patient care.
A-164
A Liquid Chromatography Tandem Mass Spectrometry Method for Measurement of Erythrocyte 6-Mercaptopurine Metabolites in Patients on Thiopurine Therapy
I. Tsilioni, T. Law, J. Dunn, R. W. A. Peake, M. D. Kellogg. Boston Children’s Hospital, Boston, MA
Background: Thiopurine drugs such as 6-mercaptopurine (6-MP) and azathioprine are used as immunosuppressive agents for the treatment of infl ammatory bowel disease (IBD). Measurement of erythrocyte 6-thioguanine (6-TG) and 6-methylmercaptopurine (6-MMP) concentrations is advocated for the purpose of obtaining baseline levels prior to commencement of therapy and for monitoring levels in patients receiving treatment. We describe a liquid chromatography tandem mass spectrometry (LC-MS/MS) method for measurement of 6-TG and 6-MMP in erythrocytes.Materials and Methods: 6-thioguanine nucleotides (6-TGNs) and 6-methylmercaptopurine nucleotides (6-MMPNs) were extracted from 100 uL of erythrocytes with perchloric acid and hydrolyzed to form 6-TG and 6-MMP respectively. Liquid chromatography was carried out using a Shimadzu SIL20AC autosampler with 20AD pumps (Shimadzu Corporation, Tokyo, Japan) utilizing an XSelect™ HSS T3 5μm (3.0 x 100 mm) analytical column (Waters Corporation, Milford, MA). Compounds were separated by gradient elution using 0.1% formic acid in water and acetonitrile as buffers A and B respectively. A fl ow rate of 0.5 mL/min was used throughout. An API-5000 triple quadropole mass spectrometer (ABSciex, Framingham, MA) utilizing atmospheric pressure chemical ionization (APCI) was used for analysis. Data was acquired in Multiple Reaction Monitoring mode (MRM) and analysis time was 5 minutes. Mass transitions for quantifi cation were monitored for 6-TG (m/z 168/107) and 6-MMP (m/z 167/152). Quantitation was carried out using the internal standard (IS) ratio method with 8-Bromoadenine. The method was evaluated in accordance with standard protocols. Method comparison was carried out by comparing analysis of 70 samples from IBD patients receiving thiopurine therapy with a reference LC/MS/MS method.
Results: Optimal assay performance was achieved using a minimum volume of 500 μL whole blood. Total assay imprecision was determined for 6-TG at 0.97 (RSD = 13.4%), 3.24 (RSD = 9.3%) and 11.9 (RSD = 9.2%) pmol/0.8 Brbc (where B = 8x10⁸). Imprecision was determined for 6-MMP at 10 (RSD = 14%), 41 (RSD = 10%) and 109 (RSD = 12%) pmol/0.8 Brbc. LOQ for 6-TG and 6-MMP were 0.05 μmol/L and 0.5 μmol/L respectively. The correlation between our method and the comparative method was favorable for 6-TG (R = 0.95; slope = 0.91; intercept = 30.2 pmol/0.8 Brbc) and 6-MMP (R = 0.92; slope = 0.91; intercept = 734 pmol/0.8 Brbc). Values produced using the reference method were moderately higher for both 6-TG (mean bias: 7 pmol/0.8 Brbc; 95% limits of agreement: -77 to 90) and 6-MMP (mean bias: 412 pmol/0.8 Brbc; 95% limits of agreement: -2031 to 2854).Conclusion: We have developed a LC/MS/MS method for measurement of 6-TG and 6-MMP using minimal sample volume for pediatric applications. Excellent chromatographic separation was achieved within a run time of 5 minutes using a modifi ed C18 column exhibiting enhanced retention for the polar thiopurines. Our MS method utilizes APCI ionization enabling the detection of the molecular ion species at high abundance. Assay performance was acceptable for imprecision and bias. Method comparison data from 70 patients undergoing thiopurine therapy showed favorable correlation with a reference method. The clinical interpretation of data was also consistent between the two methods.
A-165
Identifi cation of plasma biomarkers of chronic drug exposure in a rat model
X. Xie1, D. Lopez-Ferrer1, G. Gil1, Y. Karpievitch1, B. Nguyen1, K. Carr2, H. Schulman1, D. Chelsky3, S. Roy1. 1Caprion Proteomics US LLC, Menlo Park, CA, 2New York University, New York, NY, 3Caprion Proteome Inc., Montreal, QC, Canada
Background: Identifying patients in need of treatment for substance use disorder and monitoring their drug use is a necessary step for effective treatment. Previous proteomic studies of drug abuse or exposure focus on the analysis of cell lines or tissues as the detection of affected plasma proteins is very challenging. The goal of this study was to test the feasibility of detecting changes in plasma proteins following chronic drug exposure in a rat model. The specifi c aims were to detect and validate proteomic biosignatures that correlate with behavioral and neurochemical sequelae in animal models of cocaine, morphine, and nicotine exposure. This initial discovery strategy could then be used to identify patients predisposed to repeated drug use and thereby facilitate early intervention.Methods: Plasma was obtained from rats receiving chronic treatment with cocaine or with a methylphenidate challenge following end of cocaine administration, or morphine or nicotine. Depletion of abundant proteins was utilized to yield low-abundant proteins followed by trypsin digestion and peptide desalting. Peak alignment, extraction, and label-free quantitation of isotope group components was conducted followed by intensity normalization. Component differential expression was obtained by multivariate statistical analysis. After peptide profi ling by nano-liquid chromatography-mass spectrometry (nano-LC-MS) and sequencing by LC-MS/MS, protein differential expression and identifi cation were achieved. Mass spectrometric-based multiple reaction monitoring (MRM) assays are being performed in a second set of animals to verify these potential biomarker candidates.Results: Only 1 μL of crude rat plasma before depletion was suffi cient for downstream analysis including nano-LC-MS and LC-MS/MS and allowed us to quantify and identify differentially expressed rat plasma proteins following chronic cocaine, morphine or nicotine administration as compared to saline. In addition, expression of plasma proteins evoked by a methylphenidate challenge following end of chronic cocaine administration were measured. In total, ~500 rat plasma proteins were identifi ed by LC-MS/MS. Among them, more than 50 proteins were differentially expressed at 0, 3, 15, and 30 days after termination of 14 consecutive days of chronic cocaine administration. We found different patterns of changed proteins including consistent change, early change, or late change in the four time points monitored for the cocaine cohort compared to saline treated cohort. Some proteins were correlated with neuron or brain function in response to drug administration. We also measured the altered expression of plasma proteins following administration of morphine and nicotine, as well as changes evoked by methylphenidate challenge at 0 and 30 days following end of chronic cocaine administration. Targeted MRM assays are being conducted in an independent cohort to validate the protein changes.

Tuesday, July 30, 9:30 am – 5:00 pm Mass Spectrometry Applications
A48 CLINICAL CHEMISTRY, Vol. 59, No. 10, Supplement, 2013
Conclusion: Results imply that similar studies in humans may be feasible in the near future for monitoring the drug use of patients addicted to such substances. A biosignature that reliably reports on drug exposure up to 30 days following last drug use, when the drug and its metabolites are no longer detectable, would help to identify patients predisposed to repeated drug use and thereby facilitate early intervention.
A-166
Quantitative analysis and characterization of 25-Hydroxy-Vitamin D3 and D2 and 3-Epi-25-Hydroxy-Vitamin D3 and D2 by Liquid Chromatography Triple Quadruple Mass Spectrometry on the Agilent Triple Quad 6460 Mass Spectrometer.
R. M. Doyle. Agilent Technologies, Inc, Wilmington, DE
Background: Signifi cant levels of the C-3 epimer of 25-Hydroxy-Vitamin D2 and D3 (C3-Epi-25OHD2 and C3-Epi-25OHD3) have been found to be present in children and some adults. Therefore, the C3-Epi-25OHD analyte can be a potential interference in the assessment of vitamin D suffi ciency and may have some clinical relevance to the overall metabolism of Vitamin D which still remains unclear. Therefore, a method was developed to resolve and quantify all four of the 25-Hydroxy-Vitamin D metabolites (25OHD3, 25OHD2, C3-Epi-25OHD2 and C3-Epi-25OHD3) utilizing the same liquid chromatographic and mass spectrometer parameters as for the analysis of just 25OHD3 and 25OHD2 alone.Methods: An Agilent 6460 tandem mass spectrometer with Jet Stream technology in positive Electrospray mode and an Agilent Infi nity 1260 HPLC system were utilized for this analysis. 150 ml of human serum was used for the analysis of the 25OHD metabolites and the sample preparation involved liquid-liquid extraction (LLE). Various columns were evaluated and an Agilent Pursuit PFP 100 x 3 mm, 2.7 um with water:methanol containing 0.1% formic acid gradient achieved baseline chromatographic separation of the four epimer and non-epimer metabolites in less than 6 minute run time. Quantitative analysis was performed using multiple reaction monitoring (MRM) transition pairs for each analyte and internal standard in positive mode and accuracy of the method was verifi ed using reference materials from NIST (SRM 972) and serum adult samplesResults: Good linearity and reproducibility were obtained with the concentration range of 0.5 ng/ml to 500 ng/ml for all the 25OHD metabolites with a coeffi cient of determination >0.99. The lower limits of detection (LLOD) and lower limit of Quantitation (LLOQ) were determined to be at least 0.25 ng/ml and 0.5 ng/ml. The calculated mean of adult samples for Total 25(OH)D concentration was 27.4 ng/ml and C3-Epi-25(OH)D concentration was 0.75 ng/ml respectively. The chromatographic separation of 25(OH)D3 from C3-Epi-25(OH)D3 for NIST SRM 972 Level 4 by fi ve replicates resulted in mean 33.1 ng/ml and 37.3 ng/ml levels with %CV of 5.83 and 6.42 respectively.Conclusion: A sensitive, simple, specifi c and accurate liquid chromatography- tandem mass spectrometry method was developed and validated for the simultaneous measurement of 25OHD and C3-Epi-25OHD metabolites in human serum.
A-167
Ultra sensitive quantitative analysis of Total and Free Testosterone in serum using Liquid Chromatography Triple Quadruple Mass Spectrometry with Ion Funnel Technology in Positive Electrospray Modes.
R. M. Doyle1, A. Szczesniewski2. 1Agilent Technologies, Wilmington, DE, 2Agilent Technologies, Schaumberg, IL
Background: Testosterone is the major androgenic hormone that is responsible for the development of the male external genitalia and secondary sexual characteristics while in females, it is an estrogen precursor. It exerts anabolic effects and infl uences behavior in both genders. Circulating testosterone is bound to sex hormone-binding globulin (SHBG) and a fraction is albumin bound and a small proportion exists as free hormone. The non-SHBG-bound testosterone is the biologically active component since serum albumin bound testosterone can dissociate freely. An ultra sensitive quantitative analytical method was developed for Total and Free Testosterone to be able to measure its levels in children and women and also to determine how much is biologically active and present in males as well.Methods: An Agilent 6490 tandem mass spectrometer with Ion Funnel technology and an Agilent Infi nity 1290 HPLC system were utilized in positive Electrospray (ESI) mode. 200 μl of human serum was used for the analysis of Total Testosterone
and the sample preparation was liquid-liquid extraction. The sensitivity of the assay and the instrument was compared using derivatized and underivatized testosterone to determine which gave the best response. The derivatives that were investigated included hydroxylamine, carboxymethylpyridine, picoloinic acid, etc. 500 μl of human serum was used for the analysis of Free Testosterone and the sample preparation was dialysis using Harvard Apparatus micro dispo-dialyzers and was also compared derivatized and underivatized. A Poroshell 120 EC-C18 column (2.1 x 50 mm, 2.7 um) was used for one-dimensional separation with a run time of 5 minutes. Quantitative analysis was performed using multiple reaction monitoring (MRM) transition pairs for each analyte and internal standard in positive mode.Results: Good linearity and reproducibility were obtained with the ultra sensitive concentration range of 5 pg/ml to 5000 pg/ml for the Total Testosterone and the Free Testosterone underivatized. The lower limits of detection (LLOD) were achieved for the Total and Free Testosterone at 2.5 pg/ml. The intra- and inter-day CV’s were < 8.5% and between 3% to10% respectively for the underivatized Total and Free testosterone. For the derivatized testosterone, the initial ultra sensitive concentration range of 0.5 pg/ml to 5000 pg/ml was achieved with oxime derivatization of Total and Free Testosterone with an LLOD of 0.1 pg/ml being obtained. The methods were compared using measurements from Standard reference material (SRM 971) from NIST and submitted samples. Further analysis on the derivatives is being carried out to determine which derivative gives the best response while at the same time offering ease of use.Conclusion: A sensitive, simple, specifi c and accurate liquid chromatography- tandem mass spectrometry method was developed and validated for the simultaneous measurement of Free and Total Testosterone in human serum. The underivatized and derivatized Total and Free testosterone were evaluated and although underivatized testosterone gives sensitive results, the oxime derivatized testosterone is giving better sensitivity. Further work is being carried out using other derivatives as to which reagent gives the best results.
A-168
Quantitative analysis of Free Estrogens in serum and the evaluation of sample preparation techniques using Liquid Chromatography Triple Quadruple Mass Spectrometry with ion Funnel Technology in Negative ESI Modes
R. M. Doyle1, A. Szczesniewski2. 1Agilent Technologies, Inc, Wilmington, DE, 2Agilent Technologies, Inc, Schaumberg, IL
Background: Estrogens are involved in the development and maintenance of the female sexual characteristics, germ cell maturation, and pregnancy as well as growth, nervous system maturation, bone metabolism/remodeling, and endothelial responsiveness. The active estrogens in non-pregnant humans are estrone (E1) and estradiol (E2) while estriol (E3) is the main pregnancy estrogen only in women. Estrogens are produced primarily in ovaries, testes, the adrenal glands and some peripheral tissues. Measurement of serum estrogens are needed in the assessment of reproductive function in female and are used to monitor ovulation induction. Ultra sensitive Estrogen measurements are required for inborn errors of sex steroid metabolism, disorders of puberty, estrogen defi ciency in men, fracture risk assessment in menopausal women, and increasingly for therapeutic drug monitoring. The ultra sensitive measurement of Free Estrogens are required since they a bound to sex hormone-binding globulin and albumin with approximately 2.21% free and biologically active. In order to address these challenges, a sensitive liquid chromatography-tandem mass spectrometry method for the simultaneous analysis of Estradiol and eventually Estrone and Estriol in serum samples was developed. Sample preparation methods for the detection of Free Estrogens using derivatization were developed and evaluated for their suitability for enhanced detection and ease of utilization.Methods: An Agilent 6490 tandem mass spectrometer with Ion Funnel technology and an Agilent Infi nity 1290 HPLC system were utilized in both positive Electrospray (ESI) modes. 500 μl of human serum was used for the analysis of Free Estrogens and the sample preparation investigated and compared included ultracentrifugation using Amicon centrifugal units and equilibrium dialysis using Harvard Apparatus micro dispo-dialyzers. The sample was then derivatized with Dansyl Chloirde. A Poroshell 120 EC-C18 column (2.1 x 150 mm, 2.7 um) was used for one-dimensional separation with a run time of 6.5 minutes. Quantitative analysis was performed using multiple reaction monitoring (MRM) transition pairs for each analyte and internal standard in positive and negative mode.

Mass Spectrometry Applications Tuesday, July 30, 9:30 am – 5:00 pm
CLINICAL CHEMISTRY, Vol. 59, No. 10, Supplement, 2013 A49
Results: Good linearity and reproducibility were obtained with the concentration range of 0.25 pg/ml to 1000 pg/ml for Free Estradiol while Free Estrone and Estriol is still being evaluated. The best lower limits of detection (LLOD) of Free Estradiol were achieved at 0.1 pg/ml and comparable between the two sample preparation techniques with equilibrium dialysis showing slightly better overall background. The intra- and inter-day CV’s for Free Estradiol has been to be <10% respectively and the Free Estrone and Estriol is being evaluated. The methods were compared using measurements from Standard reference material (SRM 971) from NIST and submitted samples.Conclusion: A sensitive, simple, specifi c and accurate liquid chromatography- tandem mass spectrometry method was developed and validated for the measurement of Free Estrogens in human serum. The best sample preparation technique was equilibrium dialysis for Free Estradiol analysis since this gave the best sensitivity and ease of use but the extraction process was overnight.
A-169
The power of high resolution Orbitrap mass spectrometry in the clinical laboratory: application to comprehensive urine drug screening in the addiction and mental health setting
C. Stefan-Bodea1, E. Wong1, M. Kozak2. 1Centre for Addiction and Mental Health, Toronto, ON, Canada, 2CMD, Thermo Scientifi c, San Jose, CA
Background. The analytical requirements for comprehensive urine drug screening in the addiction and mental health setting are more subtle than in the emergency one, although there is a large overlap in the drugs of interest. Amount of drug(s) used, hence drug level in the urine, time since last ingestion, admitting to or denial of drug usage, and/or possible specimen adulteration are major differences between the two clinical settings. In the former one both drug parent and metabolites become important for result interpretation and guidance to clinicians. Lack of commercial standards can be major limitation for drug/metabolite identifi cation by classical mass spectrometry. We present a rapid, high resolution, mass accuracy spectrometry approach to comprehensive urine drug screening using the ThermoFisher Q-Exactive instrument, a hybrid quadrupole-Orbitrap instrument. Non-hydrolyzed specimens are LC separated and accurate masses of parents and metabolites are used to screen against a database of calculated monoisotopic masses. Mass spectra obtained with pure standards, if commercially available, are used for library matching, but lack of commercial standards for metabolites is not a limiting factor in a mass accuracy screening approach.Materials and Methods. Urine specimens were analyzed using the Q-Exactive LC-MS mass spectrometer. A database with monoisotopic masses for various drugs and metabolites was created. Drug standards from Cerilliant were used to validate the mass accuracy, retention times and mass fragmentation spectra. LC separation was on Phenomenex Kinetex PFP column 100 x 2.1 mm, 2.6 μm, 100Å, using gradient elution and UPLC Accela pump. The cycle time was ~15 min with positive and negative polarity switching, and fragmentation in the HCD in the same run. Precursors were scanned from m/z 100 to 800 at 70,000 resolutions and HCD fragment ions between m/z 50 to 800 at 16,000 resolutions. Data was analyzed with XCalibur software adapted for high resolution. Non-threshold approach was used for reporting positives.Results. Using mass-accuracy Orbitrap technology we show total and extracted mass chromatograms at mass accuracy < 5 ppm for several metabolites including glucuronides of morphine (3,6 or both), codeine, nor-codeine, buprenorphine, norbuprenorphine, 4-OH-alprazolam, oxazepam, lorazepam, quetiepine, citalopram, JWH-018 N-(5-OH pentanyl), JWH-073 N-butanoic acid, JWH-073 3-OH; carboxy-THC; 8-OH- and 8,11 di-OH THC metabolites were identifi ed in diluted urine specimen with 20 ng/mL THC by immunoassay (cut off 50 ng/mL). Our experience so far shows mass accuracy can be at sub-ppm level: carboxy-THC glucuronide 521.2381 vs. 521.2383 in positive mode or 519.2236 vs. 519.2233 in negative mode. Other noteworthy advantages included: easy-to-update accurate-mass database, or search for a drug or metabolite post-analysis.Conclusion. Our work illustrates the power of a high resolution Orbitrap mass spectrometry approach, combining monoisotopic mass values with a straightforward LC step, to answer relevant questions for urine drug screening in an addiction and mental health setting.Examples are given for both commonly encountered and newly emerging drug of abuse, such as JWH-018 and JWH-073.
A-170
Validation of a Bioanalytical Method for the Quantifi cation of Serum Bile Acids by LC-MS/MS
B. Holmquist, S. Pepkowitz, D. W. Chandler. Endocrine Sciences, Esoterix, Inc., a LabCorp company, Calabasas, CA
Objective: The development of a simple, fast, 1-D LC-MS/MS method to allow quantitative measurements of the most abundant species of Bile Acids in serum.Relevance: Bile Acids are formed in the liver from cholesterol, stored and concentrated in the gallbladder, and excreted into the intestines in response to food intake. The liver synthesizes two primary bile acids, cholic acid and chenodeoxycholic acid from cholesterol. The primary bile acids are converted to the secondary bile acids, deoxycholic acid and lithocholic acid by intestinal bacteria. A fraction of chenodeoxycholic acid is also transformed into the tertiary bile acid, ursodeoxycholic acid (ursodeoxycholic acid is also used as a therapy for intrahepatic cholestasis of pregnancy, ICOP). Elevated concentrations of bile acids often suggest impaired hepatic clearance due to liver disease. In this method, twelve of the most abundant bile acids (the unconjugated, glycine conjugates and taurine conjugates of ursodeoxycholic acid, cholic acid, chenodeoxycholic acid and deoxycholic acid) are independently quantifi ed.In cases of intrahepatic cholestasis of pregnancy treated with ursodiol (UDCA) measurement of bile acids by enzyme cycling methods cannot distinguish the endogenous production of bile acids from the therapeutic UDCA; therefore measuring total bile acids will not help judge the therapeutic effi cacy.Methodology: An analytical method was developed using a Thermo/Cohesive TX-4 HPLC system (Thermo-Fisher/Cohesive Technologies) with Agilent® 1200SL pumps (Agilent Technologies, Inc.) and an AB Sciex® 5000 (AB Sciex PTE. LTD.) triple quadrupole mass spectrometer. Independent calibration curves were prepared for all twelve metabolites (UDCA, CA, CDCA, DCA, GUDCA, GCA, GCDCA, GDCA, TUDCA, TCA, TCDCA and TDCA) in depleted serum (Golden West Biologicals). Sample preparation consisted of isotope dilution using a cocktail of eleven internal standards followed by protein precipitation. A Thermo Accucore® C18 analytical column (100 x 2.1mm, 2.7um, 100A) was used with an alkaline mobile phase and methanol gradient to achieve full baseline chromatographic separation of all bile acid isomers. Negative mode Electrospray Ionization (ESI) was used for detection in Multiple Reaction Monitoring (MRM) mode.Validation: Analytical sensitivity was 0.1 umol/L per analyte. Dynamic range was up to 10 umol/L for each analyte (200 umol/L with dilution). Inter-Assay precision ranged from 3.7 - 8.4%. Correlation with enzyme cycling method (total bile acids only) was good (R2 = 0.91, slope 0.74x + 1.2 umol/L, n=25). Reference intervals were developed for each bile acid class as well as total bile acids. Profi ciency materials from CAP (TBLA-01 through 03) were tested and found to be mostly unconjugated CDCA. Internal testing demonstrated the importance of fasting prior to specimen collection.Conclusions: A simple, fast, 1-D LC-MS/MS method was developed to allow quantitative measurements of the most abundant species of Bile Acids in serum. Case studies have demonstrated clinical utility for management of patients with intrahepatic cholestasis of pregnancy.
A-171
Quantifi cation of buprenorphine, norbuprenorphine and 6-monoacetylmorphine in urine by liquid chromatography-tandem mass spectrometry
C. Yuan, K. Lembright, C. Heideloff, S. Wang. Cleveland Clinic, Cleveland, OH
Background: Monitoring pain management medications and illicit drugs in urine is commonly used to assess patient compliance. Previously, we developed a liquid chromatography tandem mass spectrometry (LC-MS/MS) method to measure 19 analytes important for pain management. In the current report, we validated this method for two additional drugs, buprenorphine and heroin. Methods: For buprenorphine, we quantifi ed both the parent drug and its major metabolite, norbuprenorphine. For heroin, we monitored its unique metabolite, 6-monoacetylmorphine (6-MAM). Urine samples were subjected to enzymatic hydrolysis prior to turbulent fl ow online extraction and LC-MS/MS analysis.

Tuesday, July 30, 9:30 am – 5:00 pm Mass Spectrometry Applications
A50 CLINICAL CHEMISTRY, Vol. 59, No. 10, Supplement, 2013
Results: No matrix effect or interference was found. Lower limits of quantifi cations were 9.7, 9.6, and 4.9 ng/mL for buprenorphine, norbuprenorphine and 6-MAM, respectively. Within the linear range, analytical recovery was 80.5-113.0% for all analytes. Intra-assay and total coeffi cient of variations were between 0.2% and 10.3%. This method demonstrated consistent patient results (n=40) with the independent LC-MS/MS methods offered by two other laboratories. Percentage of glucuronide conjugation of 6-MAM varied from 0 to 45% in 8 patient urine samples positive for 6-MAM. Conclusion: We have successfully expanded current pain management panel to include buprenorphine and heroin with high sensitivity, specifi city, and precision.
A-172
Difference in 25-hydroxyvitamin D results measured by an LC-MS/MS versus an immunoassay resulted in outcome discrepancy of a clinical trial supplementing vitamin D in CKD patients
J. M. El-Khoury, J. Hyland, J. Simon, S. Wang. Cleveland Clinic, Cleveland, OH
Background: Vitamin D defi ciency is common in the chronic kidney disease (CKD) population and is treated according to the 2003 K/DOQI Clinical Practice Guidelines for Bone Metabolism and Disease in CKD. These guidelines recommend administration of variable high dose vitamin D2 regimens based on the severity of vitamin D defi ciency. Some studies have shown that these guidelines may not be adequate, and that vitamin D3 therapy may be more effi cient than vitamin D2. In this report, our objective was to compare 25-hydroxyvitamin D (25OHD) results measured by a chemiluminescent immunoassay (CLIA) to those by a liquid chromatography-tandem mass spectrometry (LC-MS/MS) assay in a randomized clinical trial with two groups of CKD patients receiving vitamin D2 and vitamin D3 treatments, respectively. Methods: This was a double blinded study with patient enrollment over the course of 10 months. All subjects (n=16) enrolled after consent were adults with stage 3 or 4 CKD and vitamin D defi ciency (25OHD < 30 ng/mL) as determined by the CLIA. Subjects were randomized to receive either vitamin D2 or vitamin D3 (50,000 IU once per week for 4 weeks then monthly thereafter for those with 25OHD between 5 and 15 ng/mL or 50,000 IU once per month for those with 25OHD between 16 and 30 ng/mL). Subjects were followed for the 6 months of treatment. The two groups were balanced (n = 8 in each treatment arm). For every patient, 25OHD was measured every 6 weeks by an FDA-approved CLIA (Diasorin Liaison) and the sample was then frozen at -80°C and measured at the conclusion of the study by an LC-MS/MS assay in two random batches. The primary endpoint was percentage of the subjects reaching vitamin D suffi ciency (25OHD > 30 ng/mL) after 6 months of treatment. Results: Deming regression demonstrated a poor correlation between the two methods (n=76, slope=0.837, intercept=1.18, r=0.5386). Furthermore, the CLIA results showed that only 50% of subjects in either treatment groups reached 25OHD level of > 30 ng/mL, while the LC-MS/MS revealed that 100% of D3 and 50% of D2 treated groups reached the suffi cient level by the end of the study. In addition, the LC-MS/MS results of the D2 treated group displayed a signifi cant trend of declining 25OHD3 levels as the treatment progressed, which explains the modest increase in total 25OHD in that group compared to the D3 treated group. Conclusion: The CLIA and LC-MS/MS assays showed poor correlation in a population of stage 3 or 4 CKD patients treated with either vitamin D2 or D3. Importantly, the CLIA underestimated the total amount of 25OHD when compared with the LC-MS/MS and may result in falsely classifying patients as vitamin D defi cient or non-responsive to treatment. Supplementation with vitamin D3 based on K/DOQI guidelines successfully addressed the vitamin D defi ciency issue in this CKD population. It is important to employ an LC-MS/MS method for monitoring vitamin D status in the patient population.
A-173
Adult African American and Caucasian Reference Intervals for 25-OH Vitamin D3.
S. J. Soldin, S. Wycoff, A. Chilingirian, M. Lee, J. Gu, V. Gounden. NATIONAL INSTITUTES OF HEALTH, BETHESDA, MD
Objective: To determine the reference intervals for 25-OH Vitamin D3 by tandem mass spectrometry in both the African American and Caucasian outpatient populations at the National Institutes of Health Clinical Center.
Method: The study group consisted of 460 healthy outpatients between the ages of 20-70 years in whom only serum 25-OH Vitamin D3 (and no D2) was found. 25-OH Vitamin D2 was present in less than 5% and they were not included in the study group. The group consisted of 175 African Americans (113 females and 62 males) and 295 Caucasians (180 females and 115 males). Samples were drawn between 6am and 2pm between April and August for the years 2011 and 2012. An API-4000 tandem mass spectrometer (Sciex, Concord, Canada) equipped with TurboIonSpray source and Agilent 1200 series HPLC system was used to perform the analysis by using isotope dilution with deuterium labeled internal standard, d6-25-OH Vitamin D3. 100 uL of human serum was deproteinized by adding 150 uL of methanol containing internal standards. After centrifugation, 150 uL of supernatant was diluted with 250 uL of distilled de-ionized water and 100 μL aliquot was injected onto Phenomenex Luna C8 (50 X 2.0mm, 5um) column. After a 2 min wash, the switching valve was activated and the analytes of interest were eluted from the column with a water/methanol gradient at a fl ow rate of 0.7 mL/min and then introduced into the MS/MS system. Quantitation by multiple reaction-monitoring (MRM) analysis was performed in the positive mode. The transitions to monitor were selected at mass-to-charge (m/z) 401.3→365.1 for 25-OH-Vitamin D3 and 407.3 →371.1 for d6-25-OH Vitamin D3.Results: The following reference intervals (ng/mL) were found employing the percentile approach. Almost identical results were obtained employing the Hoffmann approach (Hoffmann RG JAMA;1963:150-9). Percentile 2.5th-97.5th is 9.4-61.6 for Caucasians and 4.1-56.2 for African Americans.Conclusions: Our fi nding that African Americans have signifi cantly lower 25-OH Vitamin D3 reference intervals than Caucasians confi rms previously published data for a combination of D3 and D2. However, reference intervals for 25OH Vitamin D3 vary with season,Summer intervals being slightly higher than those found during the Winter months. The intervals quoted above are for the Spring and Summer months. It is also important to note that the reference intervals for 25-OH Vitamin D3 are lower than the usually recommended optimal clinical concentrations of 32-100 ng/mL. An interesting question for future studies revolves around the PTH /25-OH Vitamin D3 set-point: is it different for these 2 populations?
A-174
Non-radioactive Iothalamate Measurement by Liquid Chromatography-Tandem Mass Spectrometry for Determination of Glomerular Filtration Rate
J. M. El-Khoury, H. Rolin, D. R. Bunch, E. Poggio, S. Wang. Cleveland Clinic, Cleveland, OH
Introduction: Glomerular fi ltration rate (GFR) is commonly determined by measuring radioactivity in serum/plasma and urine after infusing radioactive iothalamate. Last year we presented a novel liquid chromatography-tandem mass spectrometry (LC-MS/MS) method for the measurement of non-radioactive iothalamate and showed preliminary comparisons with a GFR method with radioactive measurement (n=10). In this report, we present here the full comparison of the GFR results by the LC-MS/MS method with those by the radioactive method using the complete set of study subjects (n=36). Methods: After consent, the subjects (n = 36) received subcutaneous injections with radioactive 125I-sodium iothalamate in one arm and non-radioactive iothalamate meglumine in the other at the same time, followed by bracketed collection of blood and urine samples. Alternate (quantitative) method comparison was performed using EP Evaluator®. Results: Comparison of the GFR results measured by LC-MS/MS with those by the radioactive iothalamate method showed a mean difference of 4.78 mL/min/1.73m2 (7.3%) and the Deming regression showed a slope of 1.085, intercept of -0.749 and R of 0.9886 (Figure). The differences between the two methods were greater at the high end of the GFR (8% at GFR >60 mL/min/1.73m2) than those at the low end (4.1% at
<60 mL/min/1.73m2). Conclusion: The new GFR method by LC-MS/MS presented here is a reliable replacement for the radioactive method.

Mass Spectrometry Applications Tuesday, July 30, 9:30 am – 5:00 pm
CLINICAL CHEMISTRY, Vol. 59, No. 10, Supplement, 2013 A51
A-175
Comparison of Three Commercial 25-hydroxyvitamin D Immunoassays with a Liquid Chromatography-Tandem Mass Spectrometry Assay Using Samples with Elevated 25-hydroxyvitamin D2
J. M. El-Khoury, C. Gan, M. Gupta, S. Wang. Cleveland Clinic, Cleveland, OH
Background: Vitamin D, the sunshine vitamin, exists in two biologically active forms, vitamin D2 and vitamin D3. Measurement of its metabolite, 25-hydroxyvitamin D (25OHD) in serum/plasma is useful for the assessment of a patient’s vitamin D status. For accurate assessment of a patient’s vitamin D status both 25OHD3 and 25OHD2 must be measured equally. Multiple commercial immunoassays for the measurement of 25OHD are available and have been largely compared to each other and to the gold standard methods, liquid chromatography-tandem mass spectrometry (LC-MS/MS). However, these comparison studies mostly included patients with 25OHD3 and very few patients with detectable 25OHD2 (<5%). In this study, our objective was to compare the accuracy of the Diasorin Liaison, Siemens Centaur and Abbott Architect to our published LC-MS/MS assay by only using samples containing greater than 15 ng/mL of 25OHD2. Methods: A total of 158 left-over clinical specimens containing 25OHD2 concentrations >15 ng/mL, as determined by our LC-MS/MS method, were stored frozen at -70°C. These samples were later thawed once, kept refrigerated and analyzed within a week on the Liaison, Centaur and Architect. EP Evaluator® was used for the statistical analysis. Results: 25OHD2 concentrations ranged from 15.0 to 87.1 ng/mL and 25OHD total concentrations from 23.1 to125.3 ng/mL by the LC-MS/MS method. Assay comparison characteristics are summarized in the table below. The slopes and intercepts provided in the table were based on Deming regression analyses. The commercial immunoassays tested here compared poorly with our LC-MS/MS
method using samples with elevated 25OHD2 concentrations. The assays compared more favorably amongst each other, with the Liaison and Architect having the least discrepancy. Conclusions: The commercial immunoassays under this evaluation did not offer reliable quantitation for samples containing elevated levels of 25OHD2 (>15 ng/mL). We recommend that patients on vitamin D2 supplements be measured by LC-MS/MS for a more accurate assessment.
LC-MS/MS Diasorin Liaison Siemens Centaur Abbott Architect
LC-MS/MS N/A Duplicate data Duplicate data Duplicate data
Diasorin Liaison
n = 157Slope = 0.511Intercept = 2.338Bias = -27.12Corr. Coef (R): 0.39
N/A Duplicate data Duplicate data
Siemens Centaur
n = 150Slope = 7.420Intercept = -388.3Bias = -5.87Corr. Coef (R): 0.13
n = 149Slope = 2.410Intercept = -24.675Bias = 21.33Corr. Coef (R): 0.85
N/A Duplicate data
Abbott Architect
n = 148Slope = 0.384Intercept = 4.14Bias = -33.61Corr. Coef (R): 0.51
n = 148Slope = 0.736Intercept = 3.168Bias = -5.61Corr. Coef (R): 0.92
n = 140Slope = 4.184Intercept = -59.872Bias = 26.63Corr. Coef (R): 0.65
N/A
A-176
LC/MS/MS Analysis of Serum/Plasma Concentrations of Thyroid Hormones in Various Preclinical Species
L. Luo, J. Colangelo. Pfi zer Inc, Groton, CT
Background: Potential new drugs that enhance metabolism or clearance of thyroid hormones in animals often trigger a sequence of toxicity events in preclinical toxicology studies, so accurate measurements of thyroid hormones, especially total triiodothyronine (T3) and total thyroxine (T4), are important. Thyroid hormones are essential hormones for regulation of growth and development in humans and preclinical species, and the thyroid can be a major target organ of toxicity during drug development. Liquid chromatography - tandem mass spectrometry is an emerging technique for the measurement of thyroid hormones in the clinical setting and is preferred over immunoassay methods. Preclinically, total T3/T4 are typically measured by immunoassays on multiple platforms based on species. The objective of this study was to develop and validate a simple and sensitive LC/MS/MS method to simultaneously quantify T3/T4 in multiple preclinical species and to determine its application in drug development studies.Methods: Total T3/T4 were quantifi ed by LC/MS/MS on an AB Sciex 5500 QTrap interfaced to a Waters Acquity UPLC system in positive ion mode using stable labeled internal standards (T3-13C6 and T4-d5). A 100uL aliquot of serum/plasma was deproteinized on a Waters Ostra plate by adding 400μL of acidic acetonitrile, and chromatographic separations were performed by gradient elution on a Restek Ultra Biphenyl column (2.1 x 50 mm, 5 μm). Calibration standards ranging from 0.1 to 200 ng/mL and quality controls at 2, 10, and 50 ng/mL were prepared in charcoal stripped serum. Accuracy and precision were evaluated by analyzing quality controls on three different days. Application of the assay to various preclinical species was conducted by measuring serum/plasma total T3 and total T4 in rat, mouse, dog, rabbit, and monkey samples. Method comparison was performed between LC/MS/MS and the corresponding platform used for that specifi c species. For example, T4 levels in dog were compared between LC/MS/MS and the Immulite; for human samples, T3/T4 was compared between mass spectrometry and the Centaur. Biological verifi cation was evaluated by providing mice either with an iodine defi cient diet supplemented with 0.1% propylthiouracil (PTU) or a regular diet as a control for 10 days. Serum samples were analyzed for T3/T4 by LC/MS/MS and the Meso Scale Discovery (MSD) duplex assay, and the data compared.Results: The intra-day and inter-day coeffi cients of variation (CV) for the LC/MS/MS assay were between 3%-12% for both analytes for all three quality control standards, and accuracy ranged between 84% to 109%. For each species the intra- and inter-day precision were within ±15% for both analytes. The correlations between LC/MS/MS and Immulite in dog and rabbit were 0.96 and 0.88, respectively. For human serum

Tuesday, July 30, 9:30 am – 5:00 pm Mass Spectrometry Applications
A52 CLINICAL CHEMISTRY, Vol. 59, No. 10, Supplement, 2013
samples, the regression analyses of T3/T4 concentrations by LC/MS/MS and Centaur showed signifi cant correlations as well. As expected, T3 and T4 were signifi cantly decreased in the PTU treated mice group as compared to the control group.Conclusion: A single LC/MC/MS method was successfully optimized, validated, and applied to support toxicology studies for drug development in various preclinical species.
A-177
Measurement of Urine Catecholamines by AB Sciex 3200 Q-Trap Tandem Mass Spectrometer
A. Lou1, L. Coffi n1, H. Vandenberghe2, W. Carroll1, L. Brown1, B. Nassar1. 1Capital Health and Dalhousie University, Halifax, NS, Canada, 2St. Michael’s Hospital and University of Toronto, Toronto, ON, Canada
Background: Analysis of urine catecholamines is important for the clinical diagnosis of catecholamine-secreting neuroendocrine tumors: pheochromocytoma or neuroblastoma. Our High Performance Liquid Chromatography-Electrochemical Detection (HPLC-ECD) method had major disadvantages: tedious sample preparation procedures, long instrument analysis time and potential interference from foods and drugs. The current study aimed to develop and validate a fast, accurate and specifi c liquid chromatography tandem mass spectrometry (LC/MS/MS) assay for quantitation of urine catecholamines (CATs).Methods: Norepinephrine (NE), epinephrine (E) and dopamine (D) were extracted from 200 uL of urine by liquid-liquid extraction after the three isotope-labeled internal standards, namely deuterated (d)6-NE, d6-E and d4-D were added. CATs were separated on an Agilent 1200 LC system with a Kinetex 2.6 micron PFP column (100 mm x 3 mm) in a 5-minute isocratic run at a fl ow rate of 0.4 mL/min. The mobile phase consisted of 95% deionized water and 5% methanol with 0.2% formic acid. AB Sciex 3200 Q trap tandem mass spectrometer, interfaced with the turbo ion spray source, operated in positive mode and controlled by analyst 1.5.1 software, was used for characterization and quantitation of CATs by multiple reaction monitoring (MRM). The turbo ion source was optimized for CATs using pure compounds (Sigma-Aldrich). MRM transitions monitored were m/z 170.2→107.2 for NE and 176.2→112.2 for d6-NE, 184.2→107.2 for E and 190.2→112.2 for d6-E and 154.2→91.1 for D and 158.2→95.2 for d4-D. Standard materials (BioRad) were used to determine linearity. Imprecision was calculated by analyzing two levels of BioRad quality controls in duplicate for 23 days. Limit of quantitation was determined using progressively lower concentrations of diluted BioRad controls. Analysis of CATs was performed 20 times over 2 days and the limit was based on coeffi cient of variation (CV) <10% and accuracy within 85-115%. Forty patients’ samples from 24-hour urine collections with the pH adjusted to 2-4 were compared following analysis by HPLC-ECD (Agilent 1200 LC system with Bioanalytical LC4B ECD) and LC/MS/MS.Results: The assay was linear up to 2660 nmol/L, 1070 nmol/L and 4114 nmol/L for NE, E and D, respectively (R>0.9993). The intra-assay CVs were 7.3% and 5.8% for NE at target concentrations of 253 and 1257 nmol/L, 7.0% and 7.1% for E at 70 and 477 nmol/L and 3.9% and 7.9% for D at 387 and 3461 nmol/L. The limit of quantitation was lower than 53.1, 14.8, and 37.9 nmol/L for NE, E and D, respectively. Comparison of LC/MS/MS (y) to HPLC-ECD assay (x) gave the Passing-Bablok linear regression of y = 1.12x + 0.21 for NE (range of 20-870 nmol/L), y = 1.13x + 2.13 for E (range of 4.0-288 nmol/L) and y = 0.88x + 54.5 for D (range of 102-3951 nmol/L). The time for sample preparation was reduced by approximately 40%, while the elution time was decreased from 10 to 5 minutes (50%), thus signifi cantly impacting analysis time.Conclusion: The LC/MS/MS assay for determination of urine CATs is robust, rapid and offers improved analytical performance in routine laboratory practice.
A-178
Integrated Targeted Quantitation Method for Insulin and its Therapeutic Analogs
E. E. Niederkofl er1, T. Schroeder2, D. Nedelkov1, U. A. Kiernan1, D. A. Phillips1, K. A. Tubbs1, S. Peterman2, B. Krastins2, A. Prakash2, M. Lopez2. 1Thermo Fisher Scientifi c, Tempe, AZ, 2Thermo Fisher Scientifi c BRIMS, Cambridge, MA
Background: The need to detect and quantify insulin and its analogs has become paramount for both medical and sports doping applications. Insulin levels are typically present at sub ng/mL levels and are generally in the presence of low molecular weight
background material requiring extraction/enrichment to increase the concentration prior to detection/quantitation. In addition, slight sequence variations are used to change the bioavailability further complicating high-throughput quantitation. To date, researchers have utilized generic enrichment methods such as SPE to decrease background matrix effects. We have developed a pan-insulin antibody capture method coupled to LC-SRM for high-throughput quantifi cation for human insulin and variants.Methods: A series of samples were prepared neat and in serum using human insulin and fi ve additional variants. The different insulin analogs were prepared independently and mixed at different levels to test the selectivity and sensitivity of the enrichment method employed. Target enrichment was performed using custom MSIA D.A.R.T.’S derivatized with a pan-anti insulin antibody. All detection and quantitation experiments were performed using LC-SRM on a newly released triple quadrupole mass spectrometer. SRM transitions unique to each analog were optimized for the intact insulin molecules as well as for the corresponding beta chains. Both sets were tested using a 15 minute experimental methods.Results : The primary limitations to routine, high-throughput targeted quantitation of insulin and its various analogs have been limited by ineffi cient extraction/enrichment protocols. The incorporation of custom MSIA D.A.R.T.’S loaded with the pan-insulin Ab facilitated capture for all variants from the samples while signifi cantly decreasing the background matrix. The increased capture effi ciency permitted the development of an 8 minute method. The pan-Ab has been shown to recognize a common epitope region in the beta chain that is conserved across all variants. A unique set of SRM transitions were developed for each variant, intact as well as the beta chains and all transitions were included in a single, multiplexed method to identify presence/absence of each variant and relative/absolute quantitative determination. The initial results demonstrated LOQ values <200 pg/mL for the intact variants and <40 pg/mL for the beta chains in serum. In addition, the method was shown to detect the presence of multiple variants at spiked ratios in excess of 200-fold.Conclusion: Incorporation of a pan-Ab, used to capture human insulin and 5 commercially available sequence variants, into a global LC-SRM detection and quantitation assay enabled the differentiation and targeted quantifi cation of human insulin and insulin analogues in a single assay.
A-179
Impact of Incubation Time on Ionization Effi ciency for Pregnenolone using Different Derivation Reagents
D. R. Bunch, S. Wang. Cleveland Clinic, Cleveland, OH
BACKGROUND: Analyte ionization plays a crucial role when performing high sensitivity mass spectrometry. Steroids in blood are measured to work up disorders such as congenital adrenal hyperplasia. High sensitivity is required for these measurements however some of these compounds such as pregnenolone have ineffi cient ionization in liquid chromatography mass spectrometry settings. The aim of this study was to explore the impact of derivatization reaction time on ionization effi ciency using different derivatization reagents. METHODS: Pregnenolone (2 mL at 2 μg/mL in methanol) was derivatized using 50 μL of hydroxylamine (CAS 5470-11-1; derivative 332 m/z), methoxylamine (CAS 593-56-6; derivative 346 m/z), ethoxyamine (CAS 3332-29-4; derivative 306 m/z), and 2-hydrazinopyridine (CAS 4930-98-7; derivative 408 m/z) each at 100 mg/mL at room temperature. Aliquots were made at 0, 15, 30, 45, and 60 min and analyzed in real time. Each aliquot was then spiked with 10 μL of reserpine (CAS 50-55-5; 521 mg/mL; 609 m/z), which was used as an ionization internal standard. The peaks at 332, 346, 360, or 408 m/z and 609 m/z ± 5 m/z were collected for 150 scans (0.1 s each). Ionization was normalized to the reserpine peak. RESULTS: Using this mass spectrometer, the underivatized pregnenolone was not detectable. The percent change from the baseline of normalized ionization at each time point ranged from 90% to 2648% (see fi gure). CONCLUSION: Ionization was greatly increased through derivation with these reagents. Hydroxylamine derivative produced the highest response followed by 2-hydrazinopyridine derivative. However hydroxylamine derivative was susceptible to hydrolysis with prolonged incubation time.

Mass Spectrometry Applications Tuesday, July 30, 9:30 am – 5:00 pm
CLINICAL CHEMISTRY, Vol. 59, No. 10, Supplement, 2013 A53
A-180
Time of Flight (TOF) Screening: Use of Low Energy (Precursor Ion) and High Energy (Fragment Ion) Scans to Eliminate False Positive Result
N. Chindarkar1, M. Wakefi eld2, R. Fitzgerald1. 1University of California-San Diego, San Diego, CA, 2Waters Corporation, Pleasanton, CA
Background & Objectives: Drug screening by liquid chromatography-TOF relies on exact mass of protonated analyte. Screening with single high resolution mass analyzer can provide false positive result. Recent development (MSE functionality) in the TOF technology provides the ability to acquire both low energy (precursor ion) and high energy (fragment ion) data in a single rapid screening run using collision induced dissociation. We demonstrate: 1) the infl uence of confi rmation criteria including the presence of a fragment ion on number of positive hits 2) that the precursor ion and fragment ion spectra obtained in a single run can help with unambiguous identifi cation of analyte 3) that our method is accurate, precise and linear over a clinically useful range.Experimental: Waters Acquity UPLC/Xevo G2 TOF, (positive ESI), UPLC BEH C18 column. Mobile phase A and B were 5mM ammonium formate (pH 3) and 0.1% formic acid in Acetonitrile respectively (fl ow 0.4mL/min). 450μL of deionized water was added to each 2mL vial followed by addition of 50μL IS solution (prepared in synthetic urine) and 200μL sample/standard/QC. 300μL of β-Glucuronide (5000U/mL) solution was added; vials were capped and mixed by inversion followed by incubation at 50ºC for 90 minutes. The samples were centrifuged (3500rpm) for 20 min and loaded in the auto-sampler for analysis. 10μL sample was injected.Results and Conclusion: Table 1 shows that when compared to LC-MS/MS results (174 positives); TOF MS screening without fragment ion confi rmation gave false positives. Addition of fragment ion information (TOF MSE screening) eliminated 24 false positives. MSE screening failed to obtain information about fragment ion when analyte concentration was low (17 no fragment ions found, 1 negative- no precursor or fragment ions found), there was severe ion suppression or the analyte did not fragment well (e. g. Morphine, Oxymorphone, Oxycodone). Our method was linear over clinically useful range.
Table 1: Comparison of LC-MS/MS (Tandem Quadrupoles) and LC-TOF Screening Results (Positive Hits)
LC/MS/MS TOFMS screen
TOFMSE Screen
False Positives Eliminated
Cod 13 13 13 - EDDP 23 23 23 - Fen 3 3 2 (1NF$) - Norf 3 3 2 (1NF) - HC 19 19 17 (2NF) - HM 20 20 20 - Met 23 23 23 - Mor 33 32 25 (7NF) (1N*) - 6-AM 10 13 7(3NF) 3 OC 14 25 13 (1NF) 11 OM 13 23 11 (2NF) 10 Total 174 197 156 (17NF) (1N) 24
Note: MS screen involved retention time and precursor ion exact mass. MSE screen involved retention time, precursor and fragment ions exact mass. $NF - no fragment ion exact match was found, *N - negative: no precursor or fragment ion match found. Cod: Codeine, EDDP: 2-ethylidene-1,5-dimethyl-3,3-diphenylpyrrolidine, Fen: Fentanyl, Norf: Norfentanyl, HC: Hydrocodone, HM: Hydromorphone, Met: Methadone, Mor: Morphine, 6-AM: 6-Monoacetylmorphine, OC: Oxycodone, OM: Oxymorphone
A-181
Subtyping of Amyloidosis Using a High Resolution Benchtop Orbitrap Mass Spectrometer
C. Yuan, C. V. Cotta, E. D. Hsi, S. Wang. Cleveland Clinic, Cleveland, OH
Background: Amyloidosis is a rare condition characterized by deposits of insoluble proteins in the form of beta pleated sheets that interfere with the normal structure and function of varying tissues. Correct identifi cation of amyloid subtypes is critical as the treatment and prognosis can be very different. Over 28 amyloidogenic proteins have been identifi ed and subtyping using immunohistochemistry techniques can be misleading due to loss of epitopes, nonspecifi c staining, and presence of non-amyloid serum proteins. A mass spectrometry based method has been developed for accurate amyloidosis subtyping. However, the analytical method was long (> 1 hour per sample) and the MS instrument is expensive and impractical for most clinical laboratories. The goal of the current study was to develop a simplifi ed amyloidosis subtyping method using formalin-fi xed, paraffi n-embedded (FFPE) tissues and a high resolution benchtop mass spectrometer.Method: Amyloid deposits were excised from hematoxylin-eosin stained sections of FFPE tissues using a laser micro-dissection system (Leica LCM, Buffalo Grove, IL). The collected sample was subjected to protein extraction and trypsin digestion. The resulting peptides were separated by microfl ow liquid chromatography (EASY-nLC 1000, ThermoFisher Scientifi c) and analyzed by Q-Exactive, a bench top Orbitrap mass spectrometer (ThermoFisher Scientifi c). Mobile phase A was water with 0.1% formic acid, and mobile phase B was acetonitrile with 0.1% formic acid. The elution gradient was from 5% to 20% B in 20 min at a fl ow rate of 2 μL/min. The cycle time per injection was ~35 min. The mass spectrometer (MS) was operated in the positive electrospray mode, and 10 MS2 scans (resolution=17500) were performed after each full MS scan (resolution=35000). Retention time and molecular weight of known amyloidal peptides (n=118) were included for targeted analysis. The resulting MS raw data were searched against human IPI database using the Protein Discoverer software (Version 1.3, ThermoFisher Scientifi c). Tolerance window was set at 10 ppm for the precursors and 20 ppm for the fragments. Oxidation of methionine and methylation of lysine were used as variable modifi cations. All positively identifi ed proteins were sorted by the number of matched peptide spectra, and used in the fi nal reviewing process along with imaging data and clinical presentation.Results: A total o:f 12 amyloid samples and 18 non-amyloid samples were analyzed. As expected, serum amyloid P (SAP) and at least one apolipoprotein (ApoA-I, ApoA-IV, and ApoE) were found in all amyloid samples, and none was present in the non-amyloidal samples. SAP and ApoA-IV were the most common encountered proteins, followed by ApoA-I and ApoE. Based on MS data, in 7 samples the amyloidogenic protein was the lambda immunoglobulin light chain, in 3 samples the kappa light chains were identifi ed as the main component, while transthyretin was identifi ed in 2 samples. Our MS results were confi rmed by either immunohistochemistry staining, serum protein electrophoresis, molecular analysis for mutations involving transthyretin or an independed MS method.Conclusion: Rapid proteomic amyloid subtyping from FFPE is feasible on a benchtop MS in the clinical laboratory setting.
A-183
Use of Coupled Mass Spectrometric Immunoassay-Selective Reaction Monitoring (MSIA-SRM) to measure PTH and variants during Intraoperative Parathyroidectomy.
E. K. Leung1, B. Krastins2, M. F. Lopez2, X. Yi1, C. C. Lee1, R. H. Grogan1, P. Angelos1, E. L. Kaplan1, K. T. J. Yeo1. 1The University of Chicago, Chicago, IL, 2ThermoFisher Scientifi c BRIMS, Cambridge, MA
Background: Intra-operative monitoring of parathyroid hormone (IOPTH) concentrations is important because it allows surgeons to perform minimally invasive parathyroid surgery with real-time assessment. The successful removal of abnormal hyper-secreting parathyroid gland causes circulating PTH to fall rapidly from pre-excision concentrations in circumstances involving single adenomas. We have

Tuesday, July 30, 9:30 am – 5:00 pm Mass Spectrometry Applications
A54 CLINICAL CHEMISTRY, Vol. 59, No. 10, Supplement, 2013
previously observed a slower PTH decline in the Elecsys versus the Immulite assay (Lee et al. Clin Chem, 2010;56 (6):A161) and wanted to determine if this may be due to the capture and labeled antibodies used in the Elecsys PTH assay cross-reacting with the mid-molecular and/or C-terminal PTH fragment.Methods: Leftover serial EDTA plasma samples were collected from 31 patients undergoing routine single-gland parathyroidectomy procedures that were monitored using the standard-of-care Siemens Immulite Turbo® PTH assay. Aliquots were treated immediately with SigmaFAST protease inhibitor cocktail and frozen at -80°C until determination of PTH and its variants using the previously described ThermoFisher MSIA-SRM method (Lopez et al. Clin Chem. 2010 56:281-90) and the Roche Elecsys® PTH STAT assay.Results: Using MSIA-SRM we quantitated 7 tryptic PTH peptides [aa1-13, aa14-20, aa28-44, aa34-44, aa35-44, aa73-80, and aa14-20(phosphorylated aa17)] and their respective declines were compared with Immulite and Elecsys PTH methods. The mean time-to-decline to 50% below baseline PTH (T50) values were statistically different between Immulite vs Elecsys (6.3 min vs 10.2 min, p<0.05), while there was no statistical difference in T50 between Immulite vs aa1-13 (Dunnett’s Multiple comparison test). ANOVA analyses of all the tryptic fragments revealed statistical differences in T50 among the different PTH fragments (p<0.0001), with longer T50 for PTH fragments representing mid-molecular to C-terminal forms of PTH. In addition we detected a PTH form with phosphorylation of ser17 in 22 patients that is not detected with conventional immunoassay.Conclusion: These results strongly support the hypothesis that PTH variants that have a longer T50 cross-react with the Elecsys PTH assay, resulting in the observed slower decrease of PTH post-glandular excision. Thus IOPTH assays that preferentially detect N-terminal forms of PTH will alert the surgeon quicker regarding the successful removal of an adenoma than assays detecting PTH fragments with longer circulatory half-lives.
A-184
Development and Validation of a LC-MS/MS Atmospheric-Pressure Chemical Ionization (APCI) Multiple Reaction Monitoring (MRM) Method for Everolimus, Sirolimus, Tacrolimus and Cyclosporin A
E. K. Leung, J. Burrus, J. Steinmetz, N. Babic, K. T. J. Yeo. The University of Chicago, Chicago, IL
Background: Everolimus, sirolimus, tacrolimus, and cyclosporin A are immunosuppressive macrolides that interfere with the activity and growth of T cells. All four compounds bind FKBP12. Everolimus- and sirolimus-FKBP12 complexes bind mTORC1 while tacrolimus- and cyclosporin A -FKBP12 complexes bind calcineurin. All four complexes result in the inhibition T-lymphocyte signal transduction and IL-2 transcription. We developed and validated a LC-MS/MS atmospheric-pressure chemical ionization (APCI) multiple reaction monitoring (MRM) method that simultaneously detects and quantitates everolimus, sirolimus, tacrolimus, and cyclosporin A.Methods: Precision studies were conducted using ClinCal Control Levels 1 to 5 (Recipe Chemicals, Munich, Germany) quality control (QC) materials. Analyte measuring range studies were conducted by diluting a high analyte level patient whole blood samples with analyte negative, O-negative whole blood, or by spiking increasing amounts of a high concentration stock solution into pooled low analyte whole blood. LOQ studies were conducted using 5 low level specimens for each analyte analyzed over 5 days. Interferences studies were conducted using pooled whole-blood samples spiked with increasing amounts of bilirubin and intralipid. Comparison studies were conducted using de-identifi ed whole blood samples.Results: Within-run precision showed CVs ranging from 4.6-11.7% for all analytes. Between-day precision was analyzed over 20 days and showed CVs ranging from 5.5-14.5%. Measurements were linear (r2 = 0.99 for all analytes) up to 175 ng/mL for everolimus, 184 ng/mL for sirolimus, 146 ng/mL for tacrolimus, and 2587 ng/mL for cyclosporin A. LOQ was determined to be 1.0 ng/mL for everolimus (CV <18%), 1.0 ng/mL for sirolimus (CV <15%), 1.5 ng/mL (CV ~10%) for tacrolimus, and 30 ng/mL (CV ~10%) for cyclosporin A. Bilirubin (up to 67 mg/dL) and intralipid (up to 2200 mg/dL) did not show any signifi cant interferences. Comparison of everolimus samples showed good overall agreement to the LC-MS/MS APCI method at the University of Colorado (Passing-Bablok regression: y=1.03x-0.04, n=53, range = 0.5-40 ng/mL, r2 = 0.98). Comparisons of sirolimus, tacrolimus and cyclosporin A samples showed good overall agreement to our LC-MS/MS heated electrospray ionization (HESI) method (Passing-Bablok regressions; sirolimus: y=0.98x-0.05, n=51, range = 1.4-40.7 ng/mL, r2 = 0.96; tacrolimus: y = 1.06x-0.28, n = 50, range = 1.2-38.7 ng/mL, r2 = 0.98; cyclosporin A: y=0.92x+4.95, n=61, range = 27-1149 ng/mL, r2 = 0.98).
Conclusion: Overall, our LC-MS/MS APCI method for everolimus, sirolimus, tacrolimus, and cyclosporin A showed good analytical performance. Everolimus showed good agreement with the University of Colorado LC-MS/MS APCI method. Sirolimus, tacrolimus, and cyclosporin A show agreement with our LC-MS/MS HESI method. Since we have two LC-MS/MS instruments in our laboratory, this transition to LC-MS/MS APCI method enabled us to synchronize all our current LC-MS/MS methods to a single ionization source and secure a back-up LC-MS/MS instrument for immunosuppressive TDM testing.
A-186
Detection and characterization of lipid hydroperoxides in human lipoproteins by LC/MS
S. P. HUI, R. Shrestha, T. Sakurai, Y. Takahashi, N. Xiao, S. Takeda, S. Jin, H. Fuda, H. Chiba. Hokkaido University, Sapporo, Japan
Background: Products of lipid peroxidation have been pointed to play an important part in the pathophysiology of atherosclerosis, diabetes, aging and other conditions. Therefore, PC hydroperoxides (PCOOH) and CE hydroperoxides (CEOOH) have been researched by several studies.HPLC with chemiluminescence detection has been reported for the quantitative analyses of PCOOH and CEOOH (1, 2), but is unable to provide structurally characteristic data for individual components of PCOOH and CEOOH. In recent years, mass spectrometry has become a powerful tool for structural identifi cation of lipids. Several groups have studied oxidized PC using liquid chromatography mass spectrometry (LC/MS), which allowed structures to be analyzed in detail. Here we report a specifi c LC/MS method for the qualitative analysis of PCOOH andCEOOH in human lipoproteins.Methods: The standards of PCOOH and CEOOH used were synthesized chemically. Fasting EDTA plasma was collected from 10 healthy volunteer and stored at -80 °C until use. Native low-density lipoproteins and native high-densitylipoproteins were isolated using sequential ultracentrifugation from EDTA plasma, and then oxidized by CuSO4, furnishing oxidized LDL (oxLDL) and oxidized HDL (oxHDL). Total lipids were extracted from lipoproteinsamples and subjected for the LC/MS analysis. The qualitative analyses were carried out by using a hybrid linear ion trap-Orbitrap mass spectrometer (Thermo Fisher Scientifi c Inc. Waltham, MA, USA) equipped with a source of electrospray ionization mass spectrometry. The mass range of the instrument was set at m/z 180-1000 and scan duration of MS at 0.5 s in positive and negative ion mode. Reverse-phased LC separation was achieved using a column (Hypersil Gold, 2.1 × 100 mm, 5 μm, Thermo Fisher Scientifi c Inc. Waltham, MA, USA) at 60ºC. The gradient elution was performed on the mobile phase consisted of two solvents.Results: We identifi ed at least 2 molecular species of PCOOH and 6 species of CEOOH in oxLDL and oxHDL. In positive-ion mode, PCOOH was observed as [M+H]+, whereas CEOOH was detected as [M+NH4]
+ and [M+Na]+. In negative-ion mode, both PCOOH and CEOOH were detected as [M +CH3COO]−. PCOOH and CEOOH were more easily ionized in positive-ion mode than in negative-ion mode.Conclusion: We detected and characterized 2 molecular species of PCOOH and 6 species of CEOOH in oxLDL and oxHDL. This analytical method is likely to be applicable to the analysis of other unknown lipid hydroperoxides in biological samples.References(1) Hui SP, Chiba H., Sakurai T., Asakawa C., Nagasaka H., Murai T., Ide H., Kurosawa T., J. Chromatogr. B 857 (2007) 158(2) Hui SP, Murai T, Yoshimura T, Chiba H, Nagasaka H, Kurosawa T. Lipids 40 (2005) 515Keywords: Lipid hydroperoxide, lipoprotein, mass

Mass Spectrometry Applications Tuesday, July 30, 9:30 am – 5:00 pm
CLINICAL CHEMISTRY, Vol. 59, No. 10, Supplement, 2013 A55
A-187
Assessment of Hypercortisolism in Cushing’s Syndrome and Major Depressive Disorder Patients by Urinary Free Cortisol Measurement With A New LC-MS/MS Method
O. Baykan1, H. Baykan2, M. Arpa1, F. Gerin1, T. Seyrekel1, O. Sirikci1, G. Haklar1. 1Marmara University School of Medicine Department of Biochemistry, Istanbul, Turkey, 2Umraniye Research and Training Hospital, Psychiatry Clinic, Istanbul, Turkey
Background: Measurements of 24-h urinary free cortisol (UFC) concentration is one of the fi rst-line tests for the diagnosis of hypercortisolism states like Cushing’s syndrome (CS). Hypothalamus-pituitary-adrenal (HPA) axis has been also found to be effected in different psychiatric disorders. Immunoassays for UFC determination which require extraction steps are susceptible to interferences and harder to standardize. Our aim was to validate a sensitive and rapid LC-MS/MS method without extraction for measurement of UFC and test its effectiveness in CS and major depressive disorder (MDD) patients.Methods: Seven CS patients, 15 MDD patients and 13 healthy volunteers were enrolled. MDD patients were assessed using the SCID-I (a structured diagnostic interview based on DSM-VI) and the Beck Depression Inventory was used to exclude depression in healthy controls (cutoff value<17). Aliquots of 24-h urine samples were analysed by the Roche cortisol immunoassay (Roche Diagnostics, Germany) and LC–MS/MS method (Zivak Technologies, Turkey) simultaneously. Assay validation was performed according to CLSI guideline. The calibration curve covered the concentration range of 1.6 to 920 μg/L and the quality controls were at nominal concentrations of 65 μg/L and 215 μg/L. Assay linearity was assessed by injecting duplicates of the cortisol calibrators with dilutions (r=0.992).Statistical analysis were performed using MedCalc 11.6.0. The difference between methods were conducted with Kruskal Wallis test. Passing-Bablok regression analysis and correlation coeffi cents were calculated. p<0.05 was considered signifi cant.Results: For the LC-MS/MS, within-run CV for cortisol was 8.67% for 24 μg/L and 2.17% for 319 μg/L and for cortisone 4.93% for 45 μg/L and 1.85% for 231 μg/L. Between-run CVs of cortisol were 4.2% and 2.4% for 65 and 215 μg/L concentrations. Accuracy determinations showed a bias of 0.8%-2.5% for normal and pathological levels. The correlation between assays was calculated (r =0.741, p=0.003) and the Bland–Altman plot showed dispersed results which may be attributed to the interferences in immunoassay procedure. Roche immunoassay didn’t generate results over 640 μg/L. Patients with CS had signifi cantly higher 24-h UFC excretion than MDD patients and controls (p<0.001). Although median 24-h UFC concentration of MDD patients was higher than controls, it was not signifi cant (p=0.102)Conclusion: Several tests have been used in the diagnosis of CS, but none of them is adequately sensitive and specifi c. In our preliminary experiments, we have validated a new LC-MS/MS method to measure the free cortisol concentration in urine. There are a number of previously reported LC-MS/MS methods which avoid the interferences. Although Roche immunoassay method involves dichloromethane extraction, the LC-MS/MS method doesn’t need any extraction. Compared with the immunoassay method for urine cortisol, the present LC-MS/MS method effectively seperates cortisol from cortisone. According to manufacturer’s claim, Roche immunoassay reference values were 36-137 μg/24 h. However, according to literature LC-MS/MS reference intervals were 4.2-60 μg/24 h for males and 3.0-43 μg/24 h for females. Therefore, clinicians also must base decisions on method-specifi c reference intervals, which are very different for immunoassays than for chromatographic methods.
A-188
Phosphoproteome Analysis of Immune Cell Signaling Targets in Thymus Development and Function
L. Zhang, X. Zhou, A. Zhou. Cleveland State University, Cleveland, OH
Background: RNase L is one of the key enzymes involved in the function of interferons (IFNs), a family of cytokines participating in innate immunity against viruses and other microbial pathogens. RNase L is highly expressed in all kinds of immune cells. However, relatively little work has been done in studying the effect of RNase L on immune cells proliferation, differentiation, maturation, and immune response. Recently we have found that RNase L null mice show dramatically enlarged thymus glands containing signifi cantly higher numbers of thymocytes at the early stage than that from wild type mice, suggesting RNase L may play an important role in thymus development and function; analysis for tyrosine phosphorylated proteins in thymocytes from RNase L null and wild type mice has revealed that RNase L
contributed to the protein phosphorylation cascade, implicating that RNase L may impact their function through regulating phosphorylation of specifi c proteins. As an indispensable organ of the immune system, abnormality of the thymus can be associated with altered immune responses including humoral and cellular immune response, leading to immunological disease. Therefore, exploring post translational modifi cation by tyrosine phosphorylation of thymocytes triggered by RNase L at the proteomic level has great biological signifi cance. The aim of present study was to identify RNase L mediated immune cell signaling targets in regulating thymus development and function.Methods: In this work, we performed a systematic bottom-up phosphoproteomic analysis of the global tyrosine phosphorylation events in thymocytes from RNase L null and wild type mice. By employing Immobilized Metal Affi nity Chromatography (IMAC) in addition to anti-phosphotyrosine antibody as enrichment methods, the tyrosine-phosphorylated proteins were fractionated by 1-D gel electrophoresis. The differentially expressed protein bands were excised from the gel. Trypsin was used for in-gel digestion. The resulting peptide fragments were further separated by utilizing Fe-NTA phosphopeptide-enrichment columns, and then subjected to liquid chromatography-tandem mass spectrometry analysis. The identifi ed candidate targets were validated using immune-precipitation and immunoblot assay.Results: Tyrosine phosphorylation levels in the thymocytes from RNase L null and wild type mice were clearly distinct; a number of novel proteins as the immune cell signaling targets were identifi ed. Especially, a 97 kDa protein was recognized as the most signifi cant phosphorylated target molecule of RNase L in widespread impacts on thymus development and immune system. Also, several RNase L targeting tyrosine-phosphorylated protein targets were confi rmed in western blots and immunoprecipitation assay.Conclusions: In summary, our results provide direct evidence that RNase L is crucial for the immune system through mediating unique protein modifi cation on tyrosine residue. In addition, a better understanding of the molecular mechanism by which RNase L is involved in thymus development and function is achieved by identifi cation of a series of immune cell signaling targets. The future challenge will be to systematically collate these signaling targets to assemble a comprehensive view of cellular networks and events and how they contribute to immune hemeostasis by which RNase L involved.Keywords:RNase L; Phosphoproteome; Immune Cell
A-189
Rapid Measurement of Tacrolimus in Whole Blood by Paper Spray/Tandem Mass Spectrometry (PS/MSMS)
R. Z. Shi1, E. M. El Gierari2, N. E. Manicke3, J. D. Faix1. 1Stanford University School of Medicine, Palo Alto, CA, 2Stanford Hospital & Clinics, Palo Alto, CA, 3Purdue University, West Lafayette, IN
Background: Tacrolimus is the major immunosuppressive drug used to prevent rejection of solid organ transplantation. Rapid result reporting facilitates adjustment of dosing, especially in the pediatric population (Ther Drug Monit 2011;33:380-386). Automated immunoassay for therapeutic drug monitoring provides rapid turnaround time but lacks analytical sensitivity and standardization. Mass spectrometry provides these features, but it requires pre-analytical manipulation and is not amenable to random access testing. Paper spray (PS) ionization is a recently developed technique that generates gas phase ions directly from dried blood spots without the need for complex sample preparation and separation (J Am Soc Mass Spectrom 2011;22:1501-1507). We evaluated this approach for therapeutic monitoring of tacrolimus in a clinical laboratory.Methods: 200 μL of whole blood, calibration standards, or quality control material were transferred to vials with 50 μL of internal standard (IS; FK506-13C, d2 at 30 ng/mL), mixed, spotted (10 μl) onto porous triangular shaped paper contained in disposable cartridge (QuantIon Technologies; West Lafayette IN), and dried in oven at 40 °C for 20 min. Cartridges were loaded into automated sampler programmed to deliver solvent (40% Methanol and 60% Chloroform, 0.1% Sodium Acetate; 20 μL) for elution to the tip of the paper positioned in front of tandem mass spectrometer (TSQ Vantage; Thermo Scientifi c, San Jose CA) inlet. Analysis was performed in the selected reaction monitoring (SRM) mode with run time of 1.5 min. and cycle time of 5.0 min.Results: Analytical measurement range was 1.5-30 ng/mL. Assay inter-day precision was 12%, 14%, 14%, and 12% cv at tacrolimus concentrations of 4, 9, 16, and 25

Tuesday, July 30, 9:30 am – 5:00 pm Mass Spectrometry Applications
A56 CLINICAL CHEMISTRY, Vol. 59, No. 10, Supplement, 2013
ng/ml. Accuracy was slope=1.0, intercept= -0.02; n=40, r2=0.99 compared to immunoassay (Architect, Abbott Diagnostics, Abbott Park IL), and slope=0.90, intercept=0.3; n=55, r2=0.94 compared to conventional LC-MS/MS method.Conclusion: PS/MSMS provides accurate mass spectrometry results for tacrolimus with rapid turnaround time amenable to random access testing protocols.
A-190
Rapid Identifi cation of Bacteria and Yeast by MALDI TOF Mass Spectrometry Analysis with MYLA Data-base in a Brazilian Clinical Microbiology Laboratory
J. Monteiro, M. B. Amaral, A. P. T. Lobo, J. S. Werneck, F. Boaretti, S. Tufi k. Associação Fundo de Incentivo a Pesquisa (AFIP), São Paulo, Brazil
Background: Matrix assisted laser desorption/ionization time-of-fl ight (MALDI-TOF) mass spectrometry (MS) has become a powerful tool for identifi cation of pathogens in microbiology laboratories. This technology has been reported to be a simple, fast and reliable method with a low per-sample cost. The objective of this study was to compare bacteria and yeast identifi cation results obtained by the Vitek-MS System (bioMerieux) to the results obtained by the Vitek 2 System (bioMerieux). Methods: We analyzed 373 clinical isolates collected mostly from blood, respiratory tract, urine, wound, and fl uid cultures. Clinical samples were cultivated fi rst in Tryptcase Soy Agar with 5% of sheep blood, MacConckey and Chocolate Agar plates, and then incubated at 35°C overnight. All the isolates were identifi ed by MALDI-TOF mass spectrometry using the Vitek-MS System which contains the MYLA database, and by phenotypic tests using the Vitek 2 System, according to the manufacture’s recommendations. Results: A total of 373 clinical isolates, including 354 bacteria (223 Gram-negative and 131 Gram-positive) and 19 yeast (17 Candida species and two Cryptococcus neoformans) were tested. Out of these 373 isolates tested, 370 (99.1%) presented the same identifi cations when results from both systems were compared. However, 48 (21.5%) Gram-negative and 21 (16%) Gram-positive bacteria had to be re-tested by the Vitek-MS to obtain satisfactory results. In the end, only three isolates of Shigella sonnei species were misidentifi ed as Escherichia coli by the Vitek-MS. Conclusion: Our study demonstrated excellent correlations between the Vitek-MS with MYLA data-base and the Vitek 2 Systems for the identifi cation of bacteria and yeasts clinical isolates. Most likely, the need for re-test some samples was due to an inoculation failure, which was corrected in a second inoculation attempt. The misidentifi cation of S. sonnei was probably associated to the close relatedness between this specie with E.coli. Though, improvements of the MALDI-TOF MS data-base should increase the sensitivity and specifi city of the identifi cation of closely related bacteria. Based in these results and in the recently Brazilian Health Department approval, we should be able to incorporate the Vitek-MS system into Brazilian clinical laboratories routines, in a near future.
A-191
Cross validation between LDTD-MS/MS and LC-MS/MS for the determination of 4 Immunosuppressant drugs in whole blood in 9 seconds per samples
G. Blachon1, P. Picard1, S. Auger1, A. Birsan1, J. Lacoursière1, K. L. Johnson-Davis2. 1Phytronix Technologies, Quebec, QC, Canada, 2ARUP Laboratories, Salt Lake City, UT
Background: Over the last decade, immunosuppressant drugs measurement techniques in whole blood have been subject to improvement of analytical methods to optimize cost, time, and accuracy of analysis results. The transfer of immunoassays to LC-MS/MS has signifi cantly improved all these three performance criteria but has not reduced the analytical run time below a minute. The Laser Diode Thermal Desorption (LDTD) represents a technological breakthrough that removes the chromatographic step and signifi cantly increases the analytical throughput for the quantitation of Tacrolimus, Sirolimus, Everolimus and Cyclosporin A. With this technique, all these four immunosuppressants can be quantifi ed simultaneously in 9 seconds from sample to sample after an easy and quick whole blood extraction.Methods: 25 μL of whole blood samples were treated with 62,5 μL of a precipitation reagent including deuterated IS. After vortex and centrifugation, 50 μL of water and 125 μL of MTBE were added to the vial. A gentle vortex was applied for 30 seconds and phase separation occurred in 1 minute. 90 μL of the supernatant was mixed with 10 μL of EDTA solution (200 μg/mL in H2O:MeOH:NH4OH (20:75:5)). 2 μL of the mix was deposited on a Lazwell plate and allowed to dry. Immunosuppressant drugs were analyzed by thermal desorption followed by positive APCI ionization. Multiple reactions monitoring was used to quantify the analytes. The method is validated and a direct comparison with established LC-MS/MS method is demonstrated.Results: The laser power pattern was optimized to control the kinetic and the temperature of thermal desorption which provides optimal signal for analysis. The laser power is ramped from 0 to 65% in 3 seconds, and maintained for 2 seconds. The APCI parameter settings are a positive corona discharge current of 3 μA, a carrier gas temperature of 30 oC and an air fl ow rate of 3 L/min. Through the LDTD analysis, no thermal fragmentation of the parent compounds was observed, allowing us to use proper and reproducible [M + NH4]
+ precursor ions. The QTrap system was operated in MRM mode, monitoring all 4 compounds and their specifi c IS in a single experiment with a 200 ms dwell time. The analysis time was achieved in only 9 seconds from sample to sample with no traces of carry over.The extraction procedure yields high recovery (88-92%) and low RSD (8,9%, n=6). Lower Limit of quantitation (LLOQ) was fi xed at the fi rst level of calibration reagent kit from Chromsystem ranging from 2-50 ng/mL for Sirolimus, Tacrolimus and Everolimus, and from 25-1870 ng/mL for Cyclosporine A. Over these ranges, linearity coeffi cients of r= 0.994 to 0.999 were obtained. The method shows no cross-talk interference between the compounds themselves. A set of whole blood samples containing all 4 drugs was run for comparison with LC-MS/MS method. Concordance correlation coeffi cients between the two instrumental methods are between 0.966 to 0.997. The Passing-Bablok regression revealed no signifi cant deviation from linearity (Cusum test, P=0.11). Bland-Altman plot showed that the mean bias of the two methods was +0.9 (1.96 SD, -19.7 to 21.6) ng/mL.
A-192
Direct Identifi cation of Bacteria in Positive Blood Culture Bottles by MALDI-TOF/MS Using in-house Sample Preparation Method
J. Monteiro, F. Boaretti, M. B. Amaral, J. S. Werneck, A. P. T. Lobo, S. Tufi k. Associação Fundo de Incentivo a Pesquisa (AFIP), São Paulo, Brazil
Background: Blood cultures (BC) remain the gold-standard method for the microbiology diagnostic of bloodstream infections. A rapid bacterial identifi cation by matrix-assisted laser desorption/ionization time-of-fl ight mass spectrometry method (MALDI-TOF/MS) directly from positive BC bottles could be helpful to clinicians in the timely targeting of empirical antimicrobial therapy. The objective of this study was to evaluate the performance of the Vitek-MS system (bioMerieux) to identify bacteria isolates directly from BC bottles. Methods: We analyzed 100 aerobic BC reported as positive by the Bactec 9240 automated system (BD). An aliquot of each positive BC was used to prepare a Gram stain, as well as to inoculate in two culture mediums: tryptcase soy agar with 5% of sheep blood and chocolate agar. After inoculation, these agar plates were incubated in aerobic and anaerobic atmospheres for 24-48h. Sample preparation to the Vitek-

Mass Spectrometry Applications Tuesday, July 30, 9:30 am – 5:00 pm
CLINICAL CHEMISTRY, Vol. 59, No. 10, Supplement, 2013 A57
MS was performed using an in house protocol based on a centrifugation-wash (CW) method. In parallel with the Vitek-MS direct identifi cation, all the BC samples subcultured on agar plates were also identifi ed using the Vitek 2 System, according to the manufacture’s recommendations. Results: One-hundred positive BC bottles were evaluated. Out of these, 47 were identifi ed as Gram-negative and 45 as Gram-positive bacteria. Eight of them were negative by both, Gram stain and subculture. Among the 92 confi rmed-positive blood cultures, 82 (89.1%) were correctly identifi ed to the species level by the Vitek-MS, 4 (4.3%) had an incorrect ID by the Vitek-MS and 6 (6.5%) had no ID at all. Among the six not identifi ed and the four misidentifi ed samples by the Vitek-MS, six were identifi ed as coagulase-negative Staphylococci (CNS), one as S. pneumoniae, two as E. faecium and one as S. aureus by the Vitek 2 System. Conclusion: The results of this study showed that both CW method and Vitek-MS technology used together were able to accurately identify all of the Gram negative strains evaluated. However, some failures were observed on the Gram positive cocci identifi cation using these both methods together. The Vitek-MS, thus, provides a rapid result (< 30 minutes) for bacterial identifi cation directly from BC that can be useful in clinical practices. So, future studies should address the Gram-positive cocci identifi cation failures in order to improve the sensibility of this test.
A-193
A Rapid and Selective MS/MS Method for the Measurement of Testosterone in Human Serum in 10 Seconds, Using Laser Diode Thermal Desorption (LDTD) Ionization
M. J. Y. Jarvis1, P. Picard2, S. Auger2, G. Blachon2, E. McClure1. 1AB SCIEX, Concord, ON, Canada, 2Phytronix Technologies Inc., Quebec, QC, Canada
Background: For Research Use Only. Not For Use In Diagnostic Procedures. It has been well established that liquid chromatography-tandem mass spectrometry (LC-MS/MS) provides excellent accuracy, precision and sensitivity for measurements of steroids in biological matrices compared to traditional techniques such as immunoassays, which may suffer from cross-reactivity. However, a limitation of LC-MS/MS for steroid research is the comparatively low throughput of the measurements, due to the need for chromatographic separations.Methods: In this work we present a rapid method for the measurement of testosterone in human serum using a combination of Laser Diode Thermal Desorption (LDTD) ionization, differential ion mobility spectrometry, and tandem mass spectrometry. LDTD ionization enables rapid sample analysis of less than 10 seconds per sample. The use of the SelexION™ differential ion mobility spectrometry (DMS) device fi lters out potential interferences prior to detection by tandem mass spectrometry, ensuring that the presence of isobaric interferences in the sample will not result in overestimation of testosterone levels, and therefore eliminating the need for liquid chromatography separation.Sample preparation consisted of a simple liquid-liquid extraction of serum or plasma, followed by dry-down and reconstitution of the sample in a mixture of methanol and water. 5uL of the fi nal sample extract was spotted and dried in a 96-well LazWell plate prior to analysis by LDTD-DMS-MS/MS.Results: To confi rm the validity of the method, a comparison study was performed by analysing a set of 24 anonymized serum samples (i) by LC-MS/MS, and (ii) by LDTD-DMS-MS/MS. The measured concentrations varied by less than 10% (accuracies ranged from 90-110%) for the two methods across the entire sample set. The method exhibited a linear response over the concentration range from 0.1 ng/mL to 100 ng/mL of testosterone, with %CV<14% at the Lower Limit of Quantitation and %CV<6% across the remainder of the concentration range.Conclusion: The use of Laser Diode Thermal Desorption ionization combined with differential ion mobility spectrometry-tandem mass spectrometry (LDTD-DMS-MS/MS) has enabled the rapid analysis of testosterone in human serum, in less than 10 seconds per sample, with no compromise in specifi city of the method.
A-194
Recovery of various Dihydroxyvitamin D3 isomers from Immunoaffi nity cartridges and analysis by LC/MS/MS.
M. J. Shaw1, A. Latawiec2. 1ABSCIEX, Foster City, CA, 2ABSCIEX, Concord, ON, Canada,
Objective: Recent immunoaffi nity cartridges can greatly facilitate the isolation and purifi cation of Dihydroxyvitamin D (DHVD) species. The accurate and sensitive determination of various dihydroxyvitamin D species continues to be an important research fi eld in clinical research. Using a novel dieneophile Cookson type reagent to signifi cantly improve the sensitivity of MS/MS based assays, we examine the isolation and recovery of several DHVD species, namely 1,25-DHVD3, epi-1,25-DHVD3, 1,25-DHVD2, and 24,25-DHVD3.Methods: Serum samples from pooled serum (male, female, and charcoal stripped) were spiked with varying amounts of DHVD3 isomers and purifi ed using a commercial Immunoaffi nity cartridge. The target materials retained on the cartridge were eluted using ethanol, dried and then derivatized using the SCIEX Amplifex™ Diene reagent. After 1 hour, the derivatized sample was diluted with deionized water and analyzed by LC/MS/MS (AB SCIEX QTRAP® 5500 or 6500 system). Baseline resolution of the derivatized DHVD3 and DHVD2 could be obtained in less than 7 minutes using a small particle size C-18 column employing a simple Water:Acetonitrile gradient. Comparison between spiked and recovered amounts of 24,25-DHVD3, 1,25-DHVD3, epi-1,25-DHVD3, and 1,25-DHVD2 are examined and discussed.Results: Using double charcoal stripped serum as the reference matrix, we were able to routinely obtain LODs as low as 5 pg/mL. Linear calibration curves between 2-3 orders of magnitude were routinely obtained. Precision values, based on multilevel calibrators and controls, were typically less than 10%, with accuracies ranging between 94-106% . Recoveries of DHVD3 ranged from an average (N=5) of 75% for 1,25-DHVD2 and 58% for 1,25-DHVD3 to a low of 11% for epi-1,25-DHVD3.Conclusions: The use of this novel Cookson type reagent affords signifi cant gains in sensitivity compared to previously used derivatization reagents. This improvement in sensitivity allows for accurate measurement of several DHVD isomers using immunoaffi nity based extraction procedures despite lower recoveries.
A-195
Quantitative analysis and comparison of Free and Total Thyroid hormones in serum and the evaluation of sample preparation techniques using Liquid Chromatography Triple Quadruple Mass Spectrometry with ion Funnel Technology in Positive and Negative ESI Modes.
R. M. Doyle. Agilent Technologies, Inc, Wilmington, DE
Background: Thyroid hormones can be challenging compounds to analyze due to their low levels relevant to clinical research and diagnostics. Thyroid hormones, Thyroxine, Triiodothyronines and their metabolites are important in regulating a number of biological processes. In order to address these challenges, a sensitive liquid chromatography-tandem mass spectrometry method for the simultaneous analysis of Thyroxine (T4), 3,3’,5-Triiodothyronine (T3), 3,3’,5’-Triiodothyronine (rT3) and 3,3’-Diiodothyronine (T2) in serum samples were developed. Various sample preparation methods for the detection of Total and Free thyroid hormones were also developed and evaluated for their suitability for enhanced detection and ease of utilization.Methods: An Agilent 6490 tandem mass spectrometer with Ion Funnel technology and an Agilent Infi nity 1290 HPLC system were utilized in both positive and negative Electrospray (ESI) modes. 200 μl of human serum was used for the analysis of Total Thyroids and the sample preparation investigated and compared included protein precipitation, liquid-liquid extraction (LLE) and solid phase extraction (SPE). 500 μl of human serum was used for the analysis of Free Thyroids and the sample preparation investigated and compared included ultracentrifugation using Amicon centrifugal units and equilibrium dialysis using Harvard Apparatus micro dispo-dialyzers. A Poroshell 120 EC-C18 column (3.0 x 100 mm, 2.7 um) was used for one-dimensional separation with a run time of 6.5 minutes. Quantitative analysis was performed using multiple reaction monitoring (MRM) transition pairs for each analyte and internal standard in positive and negative mode.

Tuesday, July 30, 9:30 am – 5:00 pm Mass Spectrometry Applications
A58 CLINICAL CHEMISTRY, Vol. 59, No. 10, Supplement, 2013
Results: Good linearity and reproducibility were obtained with the concentration range of 1 pg/ml to 1000 ng/ml for the Total Thyroids and 1 pg/ml to 2000 pg/ml for the Free Thyroids. The best lower limits of detection (LLOD) were achieved in positive mode for LLE and SPE extraction for the total thyroids at 1pg/ml for T4, 0.5 pg/ml for T3 and 2.5 pg/ml for rT3 and T2 respectively while the LLOD for the free thyroids were comparable at 2.5 pg/ml for T4, 1 pg/ml for T3 and 5 pg/ml for rT3 and T2 with equilibrium dialysis showing slightly better overall background. The intra- and inter-day CV’s were < 7% and between 2% to 8% respectively for all analytes for the best extraction techniques. The methods were compared using measurements from Standard reference material (SRM 971) from NIST and submitted samples.Conclusion: A sensitive, simple, specifi c and accurate liquid chromatography- tandem mass spectrometry method was developed and validated for the simultaneous measurement of Free and Total Thyroid hormones in human serum. The best sample preparation techniques were LLE and SPE for the Total Thyroid and equilibrium dialysis for Free Thyroid analysis since they gave the best sensitivity and ease of use. Positive ESI mode gave better results by a factor of 5 to 10 fold in both Free and Total Thyroids depending on the analyte.
A-196
Use of Maldi-TOF in a Brazilian Clinical Laboratory: Comparison of Bacterial Identifi cation TAT with Conventional Automated Methodology
C. Garcia, R. J. Marani, D. M. Cassiano, M. L. Campos, D. L. O. Santos, C. F. A. Pereira, C. F. Teixeira. DASA, Barueri, Brazil
Introduction: Currently, most clinical laboratories have automated systems used to identify microorganisms in general. One of the most used is the Vitek II (Biomerieux), which performs automated identifi cation and susceptibility testing by colorimetric technology. Vitek MS, on the other hand, uses the Maldi-TOF (Matrix Assisted Laser Disorption/Ionization Time-of-Flight Mass Spectrometry) methodology and it is recognized as a great innovation in microorganisms identifi cation. The mass spectrometry can very quickly identify profi les of bacterial proteins, thus enabling the characterization of most clinical signifi cant bacteria. The reduction in the time to identifi cation of pathogenic bacteria can contribute to a better prognosis of the patients and also to decrease the total cost of the treatment, mainly in hospital acquired infections.Objective: The objective of this study was to compare the TAT until identifi cation of the new Vitek MS against the Vitek II automated system.Methodology: The purity of the samples was confi rmed after cultivation in CPS chromogenic medium, (bioMerieux). After 24 hours of incubation, samples were identifi ed in the Vitek II equipment which uses the colorimetric method, and in the Vitek MS, which utilizes mass spectrometry (MALDI-TOF). The Vitek II system was evaluated after inoculation of the samples using the Vitek ID GN and GP cards, and we followed the manufacturer’s instructions concerning the inoculum preparation, incubation, reading and interpretation. We evaluated 100 bacterial species: Escherichiacoli, Enterobacteriaceae (Klebsiella pneumoniae, Klebsiella oxytoca, Enterobacter aerogenes, Enterobacter cloacae, Citrobacter koseri, Citrobacter freundii, Serratia marcescens, Proteus mirabilis, Morganella morganii), non-fermenters (Pseudomonas aeruginosa, Pseudomonas fl uorescens, Acinetobacter baumannii, Stenotrophomonas maltophilia, Burkolderia cepacia, Acinetobacter lwoffi i), Staphylococcus aureus, Staphylococcus epidermidis, Coagulase-Negative Staphylococcus, Enterococcus faecalis and Enterococcus faecium. We captured data from the beginning of the sample preparation to the fi nal identifi cation of the organism in both methodologies.Results: Both methods showed high agreement in the fi nal identifi cation result. In Vitek MS the average time of identifi cation was 51 min compared to 266 min obtained in Vitek II, being the Maldi-TOF 82.13% quicker. For different groups of bacteria, we found the following results favoring Vitek MS: Escherichia coli, 83.03% gain in time of identifi cation. Enterobacteria, 71.97%, non-fermenters, 85.76%, Staphylococcus spp. 86.40% and Enterococcus spp. 80.95%Conclusion: As expected, it was found that the new method used in our laboratory routine, Vitek MS, allowed a rapid and cost-effective diagnosis when compared with the cards of Vitek II. Doctors may have access to results more quickly and initiate or modify the antibiotic therapy more effectively. Patients can benefi t also from better prognosis and shorter hospital stays. It is interesting to say that the Vitek II already represented a great improvement over other automated or manual methodologies, making the gains obtained with the new Vitek MS even more impressive. The possibility of using the Vitek MS directly from positive blood culture will accentuate much more this advantage.
A-197
VALIDATION OF VITEK MS MALDI-TOF IN A ROUTINE MICROBIOLOGY LABORATORY IN BRAZIL
C. Garcia, A. P. d. Takushi, A. M. R. Santos, M. L. Campos, W. Schiavo, C. F. Teixeira, C. A. G. Dias, N. Z. Maluf, C. F. d. Pereira. DASA, Barueri, Brazil
Background: The introduction of matrix-assisted laser desorption ionization-time of fl ight mass spectroscopy (MALDI-TOF) in clinical laboratories for identifi cation of bacteria and yeast is recent and promising (Khot & Fischer, 2012). The system is based on proteomic; proteins are ionized by the laser, resulting in a characteristic mass spectral profi le. Each bacterial isolate produces a profi le that is compared to those of a database of species-specifi c reference proteins. Evaluations by different investigators show that MALDI-TOF is highly accurate when growth from colonies developed in solid media are tested, with concordance rates varying from 80% to 95%, depending on the set of species studied (Bille 2011, Bizzini 2010, Cherkaoui 2010, Dubois 2012, Neville 2011, Seng 2009, van Veen, 2010). OBJECTIVE: To evaluate and validate the MALDI-TOF for use in a routine microbiology lab.Methods: We compared the Maldi-TOF identifi cation of 1063 Isolates from the routine laboratory, including enterobacteria and Non-fermentative gram-negative bacilli, Staphylococci, Streptococci, Enterococci, Yeasts and Other fastidius bacteria with Conventional procedures and Vitek 2 identifi cation.Results: Overall, agreement between conventional and Vitek MS identifi cation was 95.8% (992/1063), with some differences among groups of microorganisms: 96.1% (494/514) for enterobacteria, 98.2% (56/57) for non-fermentative gram-negative bacilli (NFGNB), 92.2% (106/115) for staphylococci, 96.7% (234/242) for streptococci/enterococci, 95.0% (96/101) for yeasts, and 85.7% (6/7) for other species. After the repetition process included in our protocol, agreement was 98.1% (1016/1036), being 98.2% (505/514), 100% (57/57), 96.5% (111/115), 98.3% (238/242), 98.0% (99/101), and 85.5% (6/7) for enterobacteria, NFGNB, staphylococci, streptococci/enterococci, yeasts, and other species, respectively. A total of 44 isolates showed discrepant results between conventional systems and Vitek MS. Overall, agreement was obtained after the repetition step in 24 isolates, and in other 14 samples the Vitek MS were consistent after the process of repetition. After the repetition step, discrepant results were verifi ed in 20/1036 (1.93%) isolates, and were distributed in the different group of organisms as follows: enterobacteria n=9, staphylococci n=4, streptococci/enterococci n=4, yeasts n=2, and other organisms n=1.Conclusion: The agreement between conventional system and Vitek MS in our study was 95.8% and is similar to those observed in other studies. It is also important to consider that our protocol included a repetition step when a discrepancy was detected between conventional system and Vitek MS. Among 44 discrepancies originally observed, mere repetition provided agreement in 24 isolates and Vitek MS results were the same in 14 of these. Some of the discrepancies in the group of staphylococci and streptococci/enterococci were due to a preliminary identifi cation based on chromogenic media that was not confi rmed by use of an automated system (Vitek2). After this repetition step in the process, discrepancies were limited to only 20/1036 (1.93%) of the isolates. In summary, and in consonance with previous studies, we show that Vitek MS is a simple, easy to perform and accurate system for the bacterial identifi cation, with a high potential to replace conventional phenotypic methods in the clinical microbiology laboratory.
A-198
Ultra sensitive quantitative analysis and comparison of 5alpha-Dihydrotestosterone in serum un-derivatized and derivatized using Liquid Chromatography Triple Quadruple Mass Spectrometry with ion Funnel Technology in Positive ESI Modes.
R. M. Doyle1, A. Szczesniewski2. 1Agilent Technologies, Inc, Wilmington, DE, 2Agilent Technologies, Inc, Schaumberg, IL
Background: Dihydrotestosterone (DHT) is an androgenic sex hormone that is responsible for the development of the male external genitalia and secondary sexual characteristics particularly in the prostrate and in hair follicles. DHT has been shown to be involved in male pattern baldness in males while in females, DHT can cause the development of androgynous male secondary sexual characteristics. DHT also plays a role in prostratic cancer. An ultra sensitive quantitative analytical method was developed for Dihydrotestosteronein human serum to be able to measure its levels in men, children and women.

Mass Spectrometry Applications Tuesday, July 30, 9:30 am – 5:00 pm
CLINICAL CHEMISTRY, Vol. 59, No. 10, Supplement, 2013 A59
Methods: An Agilent 6490 tandem mass spectrometer with Ion Funnel technology and an Agilent Infi nity 1290 HPLC system were utilized in positive Electrospray (ESI) mode. 500 μl of human serum was used for the analysis of DHT and the sample preparation was liquid-liquid extraction. The sensitivity of the assay and the instrument was compared using derivatized and underivatized DHT to determine which gave the best response. The derivatives that were investigated included hydroxylamine, carboxymethylpyridine, picoloinic acid, etc. A Poroshell 120 EC-C18 column (2.1 x 50 mm, 2.7 um) was used for one-dimensional separation with a run time of 5 minutes. Quantitative analysis was performed using multiple reaction monitoring (MRM) transition pairs for each analyte and internal standard in positive mode.Results: Good linearity and reproducibility were obtained with the ultra sensitive concentration range of 10 pg/ml to 5000 pg/ml for the DHT underivatized. The lower limits of detection (LLOD) were achieved for the DHT at 5 pg/ml. The intra- and inter-day CV’s were < 10% respectively for the underivatized DHT For the derivatized DHT, the initial ultra sensitive concentration range of 1 pg/ml to 5000 pg/ml was achieved with oxime derivatization of DHT with an LLOD of 0.5 pg/ml being obtained. The methods were compared using measurements from Standard reference material (SRM 971) from NIST and submitted samples. Further analysis on the derivatives is being carried out to determine which derivative gives the best response while at the same time offering ease of use.Conclusion: A sensitive, simple, specifi c and accurate liquid chromatography- tandem mass spectrometry method was developed and validated for the measurement of DHT in human serum. The underivatized and derivatized DHT were evaluated and although underivatized DHT gives sensitive results, the oxime derivatized DHT is giving better sensitivity. Further work is being carried out using other derivatives as to which reagent gives the best results.
A-199
Determination of urinary vanillylmandelic acid, homovanillic acid and 5-hydroxyindoleacetic acid by LC-MS/MS for clinical research
L. Cote1, R. Doyle2, K. McCann3. 1Agilent Technologies, St-Laurent, QC, Canada, 2Agilent Technologies, Wilmington, DE, 3Agilent Technologies, Santa Clara, CA
Background: Liquid chromatography triple quadrupole mass spectrometry (LC-MS/MS) is ideally suited for the rapid analysis of multiple analytes. A highly sensitive and specifi c LC/MS/MS method has been developed for the quantitation of vanillylmandelic acid (VMA), homovanillic acid (HVA) and 5-hydroxyindoleacetic acid (5-HIAA) in urine. The level of creatinine in urine can also be quantifi ed at the same time.Methods: A simple sample preparation procedure involving only a dilution is used for the simultaneous determination of VMA, HVA, 5-HIAA and creatinine in urine. Calibrators were created by spiking clean urine with various concentrations of each analyte. The chromatographic system consists of a pentafl uorophenyl column and a mobile phase comprised of methanol and water containing 0.2% formic acid. Quantifi er and qualifi er MRM transitions were monitored and deuterated internal standards were included for each analyte to ensure accurate and reproducible quantitation.Results: Chromatographic separation of all analytes is achieved in less than four minutes through the use of a pentafl uorophenyl column. The described method achieves the required functional sensitivity and is capable of quantitating analytes over a suffi ciently wide dynamic range with a single injection. All analytes displayed excellent linearity from 0.1 to 100 mg/L. All calibration curves displayed an R2 > 0.999. Back calculated accuracies for all calibrators ranged from 92% to 115% and showed intra- and inter- day CVs below 6%.Commercially available quality control materials were used to test the accuracy and reproducibility of this method. Measurements were repeated on three separate days to assess interday reproducibility and CVs were found to be below 10%.Conclusion: A robust method for quantifying vanillylmandelic acid (VMA), homovanillic acid (HVA) and 5-hydroxyindoleacetic acid (5-HIAA) in urine with excellent reproducibility and accuracy has been developed.
A-200
Determination of plasma methanephrines and 3-methoxytyramine by LC-MS/MS for clinical research
L. Cote1, C. Deckers1, K. McCann2. 1Agilent Technologies, St-Laurent, QC, Canada, 2Agilent Technologies, Santa Clara, CA
Background: Liquid chromatography triple quadrupole mass spectrometry (LC-MS/MS) is ideally suited for the rapid analysis of multiple analytes. A highly sensitive and specifi c LC/MS/MS method has been developed for the quantitation of metanephrine, normetanephrine and 3-methoxytyramine in plasma. This method uses a solid phase extraction procedure for effi cient sample preparation.Methods: An effi cient solid phase extraction (SPE) sample preparation procedure was developed for the simultaneous extraction of metanephrine, normetanephrine and 3-methoxytyramine in plasma. Calibrators were created by spiking clean plasma with various concentrations of each analyte. The chromatographic system consists of a pentafl uorophenyl column and a mobile phase comprised of methanol and water containing 0.2% formic acid. Quantifi er and qualifi er MRM transitions were monitored and deuterated internal standards were included for each analyte to ensure accurate and reproducible quantitation.Results: Chromatographic separation of all analytes is achieved in less than four minutes through the use of a pentafl uorophenyl column. The separation of epinephrine/normetanephrine and metanephrine/3-methoxytyramine are especially critical since these compounds share common fragments. Without proper separation by retention time, fragmentation of these compounds can cause interferences with one another and lead to inaccurate quantitation.The described method achieves the required functional sensitivity and is capable of quantitating analytes over a suffi ciently wide dynamic range with a single injection. All analytes displayed excellent linearity from 15 to 10000 pg/ml (0.1-50 nmol/L). All calibration curves displayed an R2 > 0.999. Back calculated accuracies for all calibrators ranged from 91% to 118% and showed intra- and inter- day CVs below 6%. Commercially available quality control material was used to test the accuracy and reproducibility of this method. Measurements were repeated on three separate days to assess interday reproducibility and CVs were found to be below 10%.Conclusion: A robust method for quantifying metanephrine, normetanephrine and 3-methoxytyramine in plasma with excellent reproducibility and accuracy has been developed.
A-201
LC/MS quantitation without the use of full, batch-wise calibration sets
G. S. Rule1, T. L. Ohman1, H. J. Carlisle1, A. Wilson1, A. L. Rockwood2. 1ARUP Laboratories, Salt Lake City, UT, 2ARUP Laboratories- U Utah School of Medicine, Salt Lake City, UT
Background: We, and others, have been evaluating new approaches to calibration used for analyte quantitation by mass spectrometry. Moves continue toward improved effi ciency, with accurate, precise and reliable quantitation. Cost reduction is also a major driver, particularly in the clinical healthcare setting. The objective of this study was to evaluate alternatives in achieving these goals by eliminating use of regular, batch-wise, full calibration sets while, at the same time, continuing to monitor both method and MS instrument stability (systematic and random variability). We have explored this approach for three androgen analytes in human serum using HPLC tandem mass spectrometry. Historical calibration information is used to reduce the number of calibration samples and to eliminate the use of full calibration curves. Instead, a single point calibration verifi er is used to ascertain if a response factor is within acceptable limits. If within acceptable limits, this calibrator is factored into a running average response factor which is then used for the quantitation.Methods: We compare concentrations calculated using the alternative calibration strategy with those calculated by traditional, full, batch-wise calibration. To validate the approach, patient samples were compared using the two strategies. Control charts constructed using the two strategies were also compared.Results: Use of an average response factor determined across nine analytical runs and over six days is shown to provide excellent correlation with results obtained from use of a calibration set prepared with each analytical batch (Figure). Variations on this approach are discussed.Conclusion: In this proof of principle study, the alternative calibration strategy showed excellent correlation for patient samples when compared to the traditional

Tuesday, July 30, 9:30 am – 5:00 pm Mass Spectrometry Applications
A60 CLINICAL CHEMISTRY, Vol. 59, No. 10, Supplement, 2013
calibration method. Comparisons of control sample concentrations using the two calibration methods also showed excellent correlation. Comparison between control charts constructed using the two calibration methods support the validity of using this alternative calibration strategy.
A-202
Felbamate Detection and Quantitation in Human Serum Using LC-MS/MS
B. Boyadzhyan, K. Thomassian, L. G. Jambor. Quest Diagnostics, Valencia, CA
Background: Felbamate (FBM; Felbatol®) is a broad-spectrum anti-epileptic drug (AED) that is used to treat refractory partial seizures in adults and partial and generalized seizures associated with Lennox-Gastaut syndrome in children. The rare but severe adverse effects of FBM; its interactions with other AEDs such as phenytoin, valproic acid and carbamazepine; and its variable metabolism and clearance suggest that therapeutic drug monitoring (TDM) may be important for optimal felbamate therapy. Traditionally, FBM levels have been monitored using HPLC methods. An LC-MS/MS method could offer several advantages over HPLC, including better specifi city, sensitivity, higher throughput, and better turnaround time.Methods: Sample extraction was performed using simple protein precipitation with 0.050 mL sample and 0.940 mL of precipitating reagent (10.6:89.4 water:methanol ratio [volume:volume]) as well as felbamate-d4 as an internal standard. The analytical HPLC system was validated using 2 different columns: a Waters XBridge BEH Phenyl 2.5 mcm, 4.6 x 50 mm column and a Phenomenex Gemini C6-Phenyl 3 mcm, 4.6 x 50 mm column. The binary, aqueous mobile phase consisted of water and formic acid and the organic phase consisted of acetonitrile and formic acid. Detection was performed using an AB Sciex API 4000 LC-MS/MS system with ESI interface, with positive ion electrospray and multiple reaction monitoring (MRM) mode. A gradient time program was used and two FBM m/z transitions were monitored to ensure component identity: m/z 239>178 and 239>117; the 243>182 m/z transition was monitored for the felbamate-d4 internal standard. Runtime was 2.2 min/injection, with a detection window of 0.8 min/sample. Data analysis was performed using Analyst 1.5.2 software. Performance of the LC-MS/MS method for detecting FBM in 40 samples was compared with that of an HPLC method. The HPLC assay used 0.2 mL sample and liquid-liquid extraction, followed by 12 min HPLC detection.Results: The LC-MS/MS assay for felbamate was linear over the analytical range 5-200 mcg/mL, with a correlation coeffi cient (r2) of 0.997 compared to the HPLC method linearity of 10-200 mcg/mL. The LC-MS/MS method intra-assay and inter-assay imprecision (% CV) was <5% at different concentrations (n=25); the lower limit of detection was 1 mcg/mL, with a CV of 4.5% (n=4); spike and recoveries study (n=40) had very good correlation, with regression equation y = 0.9247x + 1.82 and r2 = 0.998. Correlation between the new LC-MS/MS method and the traditional HPLC method was very good, with the following regression equation: y = 0.9606x + -0.98 and r2 = 0.995. The sample extraction step (protein precipitation) in the LC-MS/MS method took only 0.5 h, shorter than the 1.5 h needed for sample extraction (liquid-liquid extraction) in the HPLC method.
Conclusion: A rapid, accurate, and sensitive LC-MS/MS method for the detection and quantifi cation of felbamate in human serum samples was validated. Sample extraction using protein precipitation is fast, requires less hands-on time than HPLC, and is easily automatable. The LC-MS/MS assay shows very good assay performance for monitoring FBM in serum, with a rapid runtime of 0.8 min per sample when using a multiplexed LC system with two channels.
A-203
LC-MS-MS Assay for the Rapid Quantitation of Bath Salts and Metabolites in Urine
K. Thomassian, L. G. Jambor. Quest Diagnostics/Valencia, Valencia, CA
“Bath salts” are illegal designer drugs that typically contain a cathinone such as mephedrone (4’-methylmethcathinone), methylone, 3,4-methylenedioxypyrovalerone (MDPV), or butylone. Very little is known about how bath salts interact with the brain and how they are metabolized by the body. They are similar to amphetamines in that they cause stimulant effects by increasing the concentration of catecholamines such as dopamine, serotonin, and norepinephrine in synapses. They are generally less able to cross the blood brain barrier than amphetamines due to the presence of a beta-keto group which increases the compound’s polarity. Traditionally used HPLC and GC-MS methods of detecting bath salt compounds in urine are time- and labor-intensive. Our goal was to develop a rapid LC-MS-MS assay for the detection and quantitation of these compounds in urine samples. For the assay, 0.1 mL of urine was mixed with methylone-D3, butylone-D3, and mephedrone-D3 internal standards and the compounds were extracted using protein precipitation and dilution of the urine specimen. Two mcL of the sample supernatant was injected into an API 4000 tandem mass spectrometer through a KinetexTM 5-mcm C18 100A, 50x2.1mm column (Phenomenex), with a mobile-phase fl ow rate of 1.6 mL/min. The data were collected in the MRM mode and the following transitions were monitored: butylone HCl 221.98 to 190.93, mephedrone-HCl 178.1 to 160.2, methylone HCl 208.10 to 160.2, and MDPV HCl 276.2 to 205.3. The run time was 4 min. Recovery studies for the 4 analytes were performed on 52 spiked urine samples. The calibration range was 39 to 10,000 ng/mL for all analytes and the total imprecisions in urine were 2.4% to 10.0%. Sensitivity was 1.1 ng/mL for butylone, 0.7 ng/mL for methylone, 0.5 ng/mL for mephedrone, and 4.5 ng/mL for MDPV. In the recovery studies, the recovered amount of each analyte was correlated with the target value. Correlations were very good, with R values of 0.99 or above. The new LC-MS/MS method is reliable and requires less time and labor than traditionally used methods.
A-204
LC-MS analysis of 20 intact amino acids on a novel mixed-mode HPLC column
I. Yazawa, H. Tachikawa. Imtakt Corporation, Kyoto, Japan
Background: There are four established methods for analyzing amino acids: pre-labeled, post-labeled, ion-pairing reversed-phase, and normal-phase, but each of these methods has disadvantages. The pre-labeled method has problems with derivitization effi ciency and cost, while the post-labeled method is usually not compatible with LC-MS due to non-volatile mobile phases. The ion-pairing reversed-phase method has diffi culty separating polar amino acids; on the other hand, the normal-phase mode has problems separating all the compounds, especially the Leu and Ile isomers.Methods: We have developed a novel amino acid separation column for LC-MS(/MS) which can separate all 20 amino acids in protein using a mixed-mode stationary phase structure. We have also estimated separation and detection characteristics using LC-MS instruments.Results: We found two methods to successfully analyze the complete array of 20 amino acids: 1) high throughput separation with Leu/Ile separation in 5min, and 2) simple gradient separation.We also found that detection can occur not only in single MS mode, but also in triple MS mode. In addition, no pre-derivitization is required, and a standard LC-MS(/MS) system is suffi cient for the analysis.In this presentation, we will show the sensitivity and application for amino acids in serum.

Mass Spectrometry Applications Tuesday, July 30, 9:30 am – 5:00 pm
CLINICAL CHEMISTRY, Vol. 59, No. 10, Supplement, 2013 A61
Conclusion: This novel HPLC method will be a powerful tool for amino acid LC-MS(/MS) analysis in many different biochemistry applications.
A-205
Comprehensive toxicological screening using generic MS/MSALL acquisition on a Q-TOF Tandem Mass Spectrometer
M. Jarvis1, J. Seegmiller2, J. Moshin2, A. M. Taylor1. 1AB SCIEX, Concord, ON, Canada, 2AB SCIEX, Foster City, CA
For research use only, not for use in diagnostic procedures. Objective: Investigate the use of a novel mass spectrometric acquisition for the comprehensive detection of both known and unknown compounds.Advances in Time-of-Flight (TOF) instrumentation have yielded analytical systems with the speed, sensitivity and dynamic range to be useful for rapid toxicology screening when coupled to liquid chromatography (LC). Q-TOF tandem mass spectrometer functionality enables a more selective analysis of compounds, by leveraging the enhanced specifi city of LC-TOF-MS/MS measurements. Compounds of interest must be pre-selected for isolation and fragmented by MS/MS, therefore, this targeted approach does not allow performing retrospective MS/MS data analysis to identify previously unknown compounds. We present here, the application of a novel experimental technique employing MS/MSALL with sequential windowed acquisition for the comprehensive toxicological screening of urine samples, using a Q-TOF instrument.Methods:The Q-TOF data was collected 1) using a TOF-MS survey scan with IDA-triggering of up to 20 product ion scans 2) Dedicated, looped MS/MS and 3) MS/MSALL with sequential windowed acquisition. The third procedure involved each MS/MS experiment using a Q1 isolation window of 12 amu resulting in 24 MS/MS experiments to cover a mass range of 400 amu. High-resolution extracted ion chromatograms were monitored for the characteristic MS/MS fragment ions of all compounds of interest.Results:A comparison of MS/MSALL with sequential windowed acquisition versus (i) LC-TOF-MS, and (ii) targeted LC-TOF-MS/MS was performed. Using only TOF-MS, even with a small extraction window (0.010 Da), there is still a possibility of observing interferences. In spiked urine, 4 out of 15 compounds displayed interferences in the retention time window. Chromatographic separation is absolutely essential if TOF-MS alone is being used. Using TOF-MS/MS all interferences were removed from the spectra of the 4 compounds. For unambiguous identifi cation MS/MS is required, through MS/MS extracted ion chromatograms or through library searching. We show in this example the advantage that TOF-MS/MS provides over TOF-MS. We set out therefore to show that using MS/MSALL with sequential windowed acquisition we could collect an MS and MS/MS spectrum at high resolution on every analyte in the sample. Using a Q1 isolation window of 25 Da potentially reduces the specifi city gains of using high resolution mass spectrometry. In this example for opiate analysis, hydrocodone was seen to have interference from oxycodone, codeine and oxymorphone. However with the ability to adjust the Q1 isolation window in SWATH™ and use a narrower range, we have the ability to remove these interferences and only extract from the data peaks that correspond to hydrocodone and codeine compounds.Conclusion:.The major advantages of this technique include: enhanced selectivity, with a reduced occurrence of false positives; the possibility of both retrospective TOF-MS and TOF-MS/MS data analysis to identify previously unknown compounds and no resultant increase in experimental cycle time as the number of compounds of
interest increases. The method of acquisition is generic and non-targeted, collecting MS/MS data for all compounds in a given sample throughout the entire LC run, whether known or unknown.
A-206
Colon Cancer Screening using an Automated, Flow Injection Tandem MS System.
D. Goodenowe, W. Jin, A. Mochizuki, W. Liu, Y. Jiang, J. Hannah, Q. Zheng. Phenomenome Discoveries Inc, Saskatoon, SK, Canada
Background: Depleted serum levels of a novel hydroxyl polyunsaturated long-chain fatty acid (GTA-446) are present in up to 90% of colorectal cancer (CRC) subjects and the negative predictive value of normal levels is 99.95%. As such, the measurement of this analyte is now being introduced worldwide for the screening of CRC risk and subsequent early detection and monitoring follow-up. Currently, fl ow injection tandem mass spectrometry (FI-MS/MS) is the only validated analytical platform for measuring GTA-446 in serum. Due to the volume and distribution requirements of a CRC screening test, a semi-automated system that is capable of processing >1000 samples per day and which can be operated by a skilled laboratory technician is neededMethods: A FI-MS/MS system comprised of 5 components: 1) A kit containing standards, quality control samples, pre-coded sample and injection vials, and a 96-well mixing plate; 2) A customized Gilson Pipetmax sample prep station; 3) A customized Gilson GX-271 autosampler and liquid delivery system; 4) An Ionics 3Q mass spectrometer; 5) Integrated software, was developed and used to perform a full method validation.Results: The average %CV of the standards was under 5%. The intra-day precision of the QC samples (GTA-446 in serum) was 5.6% (low, 0.600ug/ml), 5.9% (med, 1.100 ug/ml), and 5.5% (high 8.000 ug/ml). Total error of the system was 11.3%. One 96-well plate is comprised of 2 MS control samples, 3 GTA-446 QC samples, 6 standard curve samples, one blank, and up to 84 patient samples. The Pipetmax could prepare one plate per hour. The GX-271 had an injection frequency of <1 min and a 9 plate capacity giving it a 14 hour walk-away time. The tune, calibration, and sensitivity of the 3Q was automatically verifi ed and recorded for every plate. The fully automated peak analysis and reporting functions required no peak review and all data and results were tracked using a relational database that could be exported to existing LIMS or directly reported.Conclusion: This quantitative mass spectrometry system meets clinical chemistry requirements and is suitable for routine use in non-specialized laboratories.
A-207
Profi ling of N-linked glycans from human serum using Liquid Chromatography-Mass Spectrometry: A high throughput method for the diagnosis of Congenital Disorders of Glycosylation
D. Williams, L. G. Kyriakopoulou. Hospital for Sick Children, Toronto, ON, Canada
Objective: To develop a simple and sensitive method for the analysis and characterization of glycans of serum glycoproteins. Human serum contains a diverse group of glycoproteins whose glycoforms refl ect carbohydrate metabolism. Defects in genes encoding enzymes involved in glycosylation, result in several disorders collectively known as congenital disorders of glycosylation (CDG), an important group of inborn errors of metabolism. The current standard for CDG diagnosis involves assessment of the glycosylation state of transferrin, an abundant serum protein with a relatively simple glycosylation pattern. Profi ling of total serum protein glycans is becoming increasingly important in the diagnosis of diseases associated Congenital Disorders of Glycosylation (CDG).Methods: Serum sample of 200 uL, a volume suitable for pediatric samples, was used for the analysis. N-linked glycans were released by treatment with PNGaseF, reduced with sodium borohydride then purifi ed by solid phase extraction. The purifi ed glycans were separated on a porous graphitized carbon column coupled to an ABSciex 4000 QTRAP mass spectrometer operated in positive ion mode.Results: Enzymatic digestion and chromatographic performance were standardized using commercial transferrin and purifi ed glycan standards respectively. The lower limit of detection of the assay for a glycan standard was 500 nanograms. Glycans from normal human serum were characterized on the basis of their retention times and masses. Further characterization was obtained through analysis of the product ion spectra using the Analyst software application. Sera from patients with known
Tuesday, July 30, 9:30 am – 5:00 pm Mass Spectrometry Applications
A62 CLINICAL CHEMISTRY, Vol. 59, No. 10, Supplement, 2013
CDG defects were used to characterize and establish glycan profi les with incomplete glycosylation. The overall profi le of each CDG sample was compared to the glycan profi le obtained from normal serum and the glycan structures were determined based on their ion spectra.Conclusions: The technique obviates the need for purifi cation of specifi c glycoproteins from serum. The purifi cation is simple, inexpensive and requires instrumentation commonly available in the clinical laboratory. Microfl ow HPLC and positive ion mode ESI-MS maximize robustness and reproducibility. The method is applicable to the study of large cohorts of CDG patients
A-208
Design of experiments: a powerful technique for developing LC/MS methods
M. P. Eastwood, L. J. Calton. Waters Corporation, Greater Manchester, United Kingdom
Background: Traditional method development usually involves changing one parameter at a time while holding everything else constant. This can be a laborious, time consuming process that often relies on luck or tenacity to discover the optimal conditions. Here we discuss the use of Design of Experiments, a statistical technique for planning, conducting and analysing experimental data, for LC/MS method development.Methods: Statistical analysis of data generated using Design of Experiments is used to establish the relationship between the response being optimized and the experimental parameters being studied. These parameters may have simple, individual effects on the response or may have multiple effects that are inter-dependent on each other. Since each experiment is designed mathematically, there is statistical confi dence in the results obtained and the conclusions drawn from the experiments can be clearly defi ned. There are three phases to developing an LC/MS method using Design of Experiments. The fi rst stage is screening the experimental parameters to identify those that affect the response to be optimized. Typically, two-level fractional factorial designs are used at this stage allowing the individual effects of parameters and any interactions between parameters to be identifi ed. Fractional factorial designs offer a reduction in number of samples required without losing much information.The second stage of method development is to optimize the parameters shown to have an effect on the fi nal response. This is achieved using response surface methodology to construct a mathematical model describing the effect of each parameter on the response being optimized. From this model the optimal level for each parameter can then be estimated. Models can also be combined to determine the best overall set of conditions for multiple compounds, making it easier to optimize methods that multiplex multiple analytes. The fi nal stage is to assess the robustness of the optimized method. This can be evaluated using a two-level Plackett Burman experimental design, with high and low levels spanning the fi nal optimized conditions. An assay that is considered robust will be resistant to changes to the parameters so will give similar results across the experimental design. Where a lack of robustness exists, it can be identifi ed statistically and a tolerance range for the parameter determined.Conclusion: Design of Experiments allows LC/MS assays to be quickly and effi ciently developed and optimized, producing higher quality methods in less time.
A-210
Sensitive LC-MS/MS Quantitation of Thyroid Hormones (T3 and T4) in Serum
C. hao, H. Qiao, C. Jolliffe, S. Ye. Ionics, Bolton, ON, Canada
Introduction: Thyroid hormones play an important role in many biological processes including growth and development, carbohydrate metabolism, oxygen consumption, and protein synthesis. LC-MS/MS of thyroid hormones, Triiodothyronine (T3) and Thyroxine (T4), at low concentration levels, has shown to be superior to immunoassay and is becoming the method of choice for measurement of free T3 and T4 due to its high selectivity and sensitivity. This measurement is critical for diagnosis of thyroid disorders such as hyperthyroidism and hypothyroidism. In some cases the lack of specifi city of immunoassays provide inaccurate results leading to poor correlation of thyroid level with thyroid disorder. In this paper, a simple LC-MS/MS method is reported for sensitive T3 and T4 quantitation in serum.Experiments: Triiodothyronine and Thyroxine were purchased from Sigma and T3-13C6 and T4-13C6 from Cerilliant. LC-MS/MS analysis was performed on an IONICS 3Q Series 320 triple quadrupole mass spectrometer with a Shimadzu UFLCxr LC system. A 10 uL sample was loaded on a Kinetex C18 Phenyl-hexyl column (50x2.1mm, 2.6μ) at 40 °C with a gradient method at 500 uL/min: solvent B
(acetonitrile with 0.1% formic acid and 5 mM NH4OAc) was kept at 5 % until 0.5 min and increased to 95% at 1.6 min, washed, followed by 1.5 min post separation equilibrium. The LC cycle time was 5.0 min. The solvent A was water with 0.1% formic acid and 5 mM NH4OAc. All the solvents used are HPLC grade.Preliminary results: Results are presented for very sensitive detection of T3 and T4 in serum using negative ion mode LC-MS/MS, monitoring the MRM transitions of 650/127 and 776/127, respectively. This method takes advantage of enhanced ion sampling and ion transfer effi ciency of a new triple quadrupole mass spectrometer, to yield signifi cant advances in the limit of detection. Results show sub-pg/mL detection limits of T3 and T4 and a concentration linearity for T3 and T4 up to 700 pg/mL. Comprehensive LC-MS/MS results for the T3, T4 LOD, LOQ, linear dynamic range, accuracy and matrix effect will be discussed.
A-211
Use of Maldi-TOF for Identifi cation of Anaerobic Microorganisms in a Brazilian Clinical Laboratory
V. N. J. Egi, C. Garcia, C. F. A. Pereira, M. L. Campos, D. M. Cassiano, R. J. Marani, C. F. Teixeira, G. O. Reis. DASA, Barueri, Brazil
Introduction: A new method for bacterial identifi cation has recently been introduced as a complement to conventional methods to aid diagnosis, with special focus in rapidity and precision. The Maldi-TOF is an important innovation for the study of macromolecules and this method performs analysis of microbial proteins generating a profi le that is both reproducible and stable for each bacterial species. Anaerobic bacteria are defi ned as microorganisms which can survive and multiply in the absence of oxygen. Anaerobic infections are usually of endogenous origin.However, despite the variety of different genera and species of the normal anaerobic microbiota, anaerobic infections are mainly caused by Bacteroides fragilis group, Peptostreptococcusspp., Pigmented Gram-Negative (Prevotella spp.) and Fusobacteria.Objective: Our goal was to evaluate Maldi-TOF - Vitek MS - as a reference resource for the identifi cation of anaerobic bacteria in the microbiology laboratory.Methodology: Forty-nine isolates from various clinical specimens were characterized as anaerobes during the period of study. These samples were collected into Thioglycolate, plated on supplemented blood agar for anaerobic microorganisms and incubated in an anaerobic jar with an anaerobiosis generator at 37 degrees for 48 hours. The obtained microorganisms, suspected of being anaerobes, were plated again on blood agar and on chocolate agar with incubation at 37 degrees for 24 hours in regular atmosphere and CO2 jars, respectively, for evidence of colonies that could grow aerobically. Only the strains that developed exclusively on supplemented blood agar plates were considered for this study. Subsequently, staining was performed by the Gram method for evaluation of bacterial morphology. This review could identify the genus. All 49 isolates were identifi ed using Maldi-TOF methodology and the results are compared.Results: The following identifi cation was obtained with Maldi-TOF. There was 100% concordance with the genus identifi cation by the conventional methodology. Bacteroides fragilis - 26 isolatesBacteroides vulgatus - 3 isolatesBacteroides ovatus - 3 isolatesBacteroides stercoris - 2 isolatesBacteroides uniformis - 2 isolatesBacteroides thetaiotaomicron - 5 isolatesFusobacterium nucleatum - 1 isolatePrevotella spp - 2 isolatesPeptostreptococcus anaerobius - 3 isolatesClostridium spp. - 1 isolateConclusion: Maldi-TOF methodology showed 100% concordance with the conventional identifi cation at the genus level. It is not possible to assure that the species identifi cation of these 49 strains is precise. However, Maldi-TOF is a valuable tool for quick bacteria and fungi identifi cation, and as the literature and our data shows, it can be used to accelerate in more than 24h the anaerobic identifi cation, contributing additionally with the species identifi cation, that have important correlation with resistance expression.
Mass Spectrometry Applications Tuesday, July 30, 9:30 am – 5:00 pm
CLINICAL CHEMISTRY, Vol. 59, No. 10, Supplement, 2013 A63
A-212
Comparison of Diagnostic Methods for fungi Identifi cation.
K. H. Kuriki, M. L. Campos, C. Garcia, D. M. Cassiano, C. F. A. Pereira, R. Marani, M. A. Santana. DASA, Barueri, Brazil
Background: Invasive infections caused by Candida spp. are important causes of morbidity and mortality. Among the species of fungi related to clinical manifestations, the gender Candida spp. is the main responsible for them. Despite being the most commonly isolated species in superfi cial and invasive infections, the incidence of infections caused by non-albicans Candida is not growing in relation to its pathogenicity. Successful treatment of infections depends on identifying the type and sensitivity pattern to antifungal agents. Therefore, the rapid and specifi c diagnosis is critical to the early introduction of the correct therapy.Objective: The objective of this study was to evaluate the fastest and best diagnostic method considering the clinical importance, epidemiological and laboratory infections caused by Candida spp.Material and methods: Samples with suspected infection were sent to the laboratory for confi rmation of diagnosis. After growth, the characterization was confi rmed by the Gram method. All cultures were isolated from Chromogenic Candida Agar medium and incubated at 37 degrees for 24 hours for isolation and differentiation of the larger species of Candida spp. Afterwards, confi rmation was performed by the identifi cation method API 20 AUX, (Biomerieux), used as a diagnostic test and confi rmed by MALDI-TOF mass spectrometry to complete the study. We evaluated 119 samples of Candida spp., 2 Cryptococcus spp. and 2 Trichosporon spp.
Results: Through the chromogenic method we identifi ed 110 species of Candida spp., and 9 non-albicans. Through API 20 AUX and MALDI-TOF, we identifi ed thefollowing non-albicans Candida:Candida parapsilosis - 52 specimensCandida tropicalis - 27 specimensCandida glabrata - 18 specimensCandida guilhermondii - 5 specimensCandida polished - 1 specimensCandida haemuloni - 1 specimensCandida krusei - 5 specimensCandida pelliculosa - 1 specimensAnd:Cryptococcusneoformans - 2 isolatesTrichosporonasahi - 1 isolatedTrichosporoninkin - 1 isolatedThe Candida albicans specimens were also identifi ed by API 20 AUX and MALDI-TOF.
Conclusions: The chromogenic method presented good effi ciency to identify both albicans and non-albicans Candida. The methods used to identify non-albicansCandida (API 20 AUX and MALDI-TOF) presented similar results on these identifi cations. However, the MALDI-TOF methodology identifi cation was faster when compared to API 20 AUX.
A-214
ANALYSIS OF MERCURY IN BLOOD BY ICP-MS IN A BRAZILIAN LABORATORY
P. C. Souza, L. M. Hanhoerster, C. F. A. Pereira. DASA, Rio de Janeiro, Brazil
INTRODUCTION: Mercury is toxic to humans in both inorganic and organic compounds. The steam exists in monatomic state in elemental form (Hg0), has a high vapor pressure, is soluble in lipids and when inhaled is distributed mainly to the alveolar bed. The inorganic mercury is produced in various industrial processes. Organic compounds form salts with organic and inorganic acids and react with various organic compounds. The most used method for mercury dosage is the cold vapor generation coupled with atomic absorption spectrophotometry equipment. This
methodology requires a prior preparation of the sample (digestion) and, depending on the technique used, it takes a long time to obtain test results because of the three steps involved: “digestion”, steam generation and equipment reading.OBJECTIVES: The aim of this work is to validate the ICP-MS methodology for the analysis of mercury in blood.MATERIALS / EQUIPMENT: Standard: CertiPUR ® ICP multi-element standard solution VI, Merck PN: 1.10580.0100, Lot.: HC002032Internal Standard: PCI standard YtriumCertiPUR ®, Merck PN: 1.70368.0100, lot: HC116058Lyphocheck ® Whole Blood Metals Control, BIORAD, Level 1, Lot: 36741Lyphocheck ® Whole Blood Metals Control, BIORAD, Level 2, Lot: 36732Blood samples Laboratory DASA - Lot routine: MESA220612 and PBSA220612Equipment ICP-MS, Agilent 7700RESULTS: Test reproducibility: 20 dosages of heparin whole blood tube of the same patient.__________________________________________________________________| Sample: Pacient 8900202059 | Average = 5,0 ug/L | SD = 0,2 | CV = 3,1 % | n = 20 |¯¯¯¯¯¯¯¯¯¯¯¯¯¯¯¯¯¯¯¯¯¯¯¯¯¯¯¯¯¯¯¯¯¯¯¯¯¯¯¯¯¯¯¯¯¯¯¯¯¯¯¯¯¯¯¯¯¯¯¯¯¯¯¯¯¯Test with a population of 191 samples collected in different tubes: EDTA and heparin.___________________________________________________________________| Samples: Population | Average = 1,6 ug/L | SD = 0,9 | CV = 57,9 % | n = 191 |¯¯¯¯¯¯¯¯¯¯¯¯¯¯¯¯¯¯¯¯¯¯¯¯¯¯¯¯¯¯¯¯¯¯¯¯¯¯¯¯¯¯¯¯¯¯¯¯¯¯¯¯¯¯¯¯¯¯¯¯¯¯¯¯¯¯Internal controls:| BR-L1, range: 6,61 a 9,91 ug/L | Average = 7,0 ug/L | SD = 0,8 | CV = 12,0 % | n = 4 |¯¯¯¯¯¯¯¯¯¯¯¯¯¯¯¯¯¯¯¯¯¯¯¯¯¯¯¯¯¯¯¯¯¯¯¯¯¯¯¯¯¯¯¯¯¯¯¯¯¯¯¯¯¯¯¯¯¯¯¯¯¯¯¯¯¯| BR-L2, range: 15,3 a 31,2 ug/L | Average = 17,6 ug/L | SD = 1,5 | CV = 8,3 % | n = 4 |¯¯¯¯¯¯¯¯¯¯¯¯¯¯¯¯¯¯¯¯¯¯¯¯¯¯¯¯¯¯¯¯¯¯¯¯¯¯¯¯¯¯¯¯¯¯¯¯¯¯¯¯¯¯¯¯¯¯¯¯¯¯¯¯¯¯CONCLUSION: ICP-MS method proved adequate for analysis of mercury in whole blood. The test reproducibility was within a safe range, with CV of 3.1%. Controls, both lower and higher, comparing to the the reference range, scored within the limits set by the manufacturer (± 2 SD). The results for a random population of 191 patients had an average of 1.6 ug / L, mostly within the limits established by the literature – up to 10.0 ug / L. The analysis time of ICP-MS is shorter than atomic absorption because there is no need to execute the initial steps of digestion and steam generation.
A-215
Quantifi cation of Testosterone from Dried Blood Spots using Liquid Chromatography Tandem Mass Spectrometry
R. Mathieu, C. Riley, C. Wiley. PAML, Spokane, WA
Introduction: The use of the Dried Blood Spot (DBS) card as a screening method for various endogenous compounds is not a new concept in laboratory medicine; it has been used for a number of years in various capacities for a number of tests. With the advent of and improved sensitivities of LC-MS/MS technology these instruments provide the sensitivity required to perform testing on steroids extracted from DBS cards. The goal of this study was to create a simple extraction method that could be easily integrated into the current serum LC-MS/MS method without sacrifi cing sensitivity or specifi city.Methods: Advance Dx100 Technology (ADX) cards were selected as a result of their ability separate the cellular material from the serum component of whole blood in cellulose matrix. The cards were inoculated with 200μl of patient sample and processed by adding a 230μl modifi ed 0.1% BSA to a test tube followed by the addition of the 3/8” (14.8mm) square punched from the card to the tube. Samples were allowed to sit at room temperature for 12 -24 hours. Following incubation the samples were processed in the same manner as the serum testosterone samples, with the addition of 20 μL of 5ng/mL a deuterated internal standard, and the addition of 500 μl of an extraction reagent containing 90% Hexane, 10% MTBE.Preliminary Data: In our study we used 108 previously tested patient samples, 105 male, 3 female samples; no distinction was made as to condition or age of the patient. The DBS samples were tested against the known serum value and the data analyzed using Microsoft Excel. Samples were extracted, prepped and injected onto a Shimadzu 20AD, Prominence HPLC system coupled to an AB SCIEX Triple Quad 5500 mass spectrometer. MRM chromatograms were acquired in positive ion mode under the following conditions: declustering voltage 180V, dry temperature of 300°C, curtain gas 10 psi and a dwell time of 150 msec. DBS samples were run against the same curved used to quantify serum testosterone. The standard curve consists of 7 points (5.1, 12, 39, 296, 444, 666 & 1000 ng/ml). Our stated criteria for acceptability for the calibration curve is >0.997. Preliminary data demonstrated that the lower limit of quantifi cation for testosterone from dried blood spots was 25.0 ng/dL. Correlation between the DBS and serum samples was found to have r2 values of 0.95, 0.93 and

Tuesday, July 30, 9:30 am – 5:00 pm Mass Spectrometry Applications
A64 CLINICAL CHEMISTRY, Vol. 59, No. 10, Supplement, 2013
0.91 across three separate studies over 3 successive days. Within run precision was carried out using 5 unique samples in replicates of n=9 ranging from 17 - 91 ng/ml the greatest CV% observed was 8.3%. The results were found to be linear when evaluated using EP Evaluator Accuracy and Linearity module. The DBS samples had a linearregression of y=0.906x+3.496.Conclusion: Preliminary validation studies have demonstrated that it is possible to accurately quantify testosterone from DBS specimens.
A-216
Maximizing Triple Quadrupole Mass Spectrometry Productivity Through the Automated Use of an Expanded Dual-Channel HPLC System with Online Sample Cleanup
K. McCann, S. Nene, D. McIntyre, E. Neo, D. Nagtalon. Agilent, Santa Clara, CA
Background:Liquid chromatography triple quadrupole mass spectrometry (LC/MS/MS) is ideally suited for the direct, rapid analysis of prepared biological samples. However, a user is often interested in only a portion of the total data collected by an LC/MS/MS system typically analyzed serially. This work explores the ability to increase mass spectrometer productivity through the automated use of an expanded dual channel high performance liquid chromatography (HPLC) system with an online sample cleanup option. New system control software is capable of orchestrating the timing of all HPLC components and coordinating the analytical utilization of the mass spectrometer.Methods:The complete, integrated LC/MS/MS system is comprised of a triple quadrupole mass spectrometer coupled to a confi gurable HPLC system, all controlled by a single software application. For the purposes of this work, the expanded HPLC system consists of a high-capacity autosampler, four binary pumps, four HPLC columns, two temperature-controlled column compartments and three switching valves. To operate the system, a standard data fi le collected by LC/MS/MS is loaded into the software. The data analysis method is extracted from the data fi le and a window of interest is specifi ed using the data fi le’s chromatogram. Based on that information, the software automatically coordinates all timing related to running the HPLC system.Results:The analysis of 25-hydroxy vitamin D2 and D3 (25-OH D) is a common clinical research application analyzed by LC/MS/MS where sample throughput is a major concern. A previously developed LC/MS/MS method for the analysis of these analytes was used for testing the capabilities of this new instrument. The standard method uses an autosampler, two binary pumps, two HPLC columns, one temperature-controlled column compartment and one switching valve to perform online sample cleanup during the analysis. With a runtime of 5 minutes, the analytes of interest reach the mass spectrometer between approximately 2 minutes to 4 minutes. Hence, more than 50% of the data collected by the mass spectrometer is of no interest.The standard method utilizes what is considered a single HPLC stream. The expanded HPLC system mirrors certain components of this single stream system to provide a second stream, operating in parallel to the fi rst stream. By loading the standard method and window of interest into the automation software, the software is able to determine the most effi cient method of injecting and analyzing a list of 25-OH D samples without any user confi guration necessary. By staggering injections on parallel streams and switching between the two streams at the appropriate time, throughput of the integrated expanded system can double the throughput achieved with the standard method.Conclusion:Fully automated software controlling a completely integrated LC/MS/MS system with expanded dual-channel HPLC capable of online cleanup for increased throughput has been developed.
A-217
Quantitative analysis of the major Water and Fat soluble Vitamins in serum using Liquid Chromatography Triple Quadruple Mass Spectrometry
R. M. Doyle. Agilent Technologies, Inc, Wilmington, DE
Background: The major water vitamins such as Vitamin B1 (Thiamine), Vitamin B2 (Ribofl avin), Vitamin B3 (Nicotinic acid and Nicotinamide), Vitamin B5 (Pantothenic Acid), Vitamin B6 (Pyridoxal Phosphate, Pryidoxine), Vitamin B7 (Biotin), Folic Acid, Vitamin B12 (Cobalamin), and the fat soluble vitamins such as Vitamin A (Retinol)
Vitamin E (Alpha-, Delta-, Gamma-Tocopherol) and vitamin K (Phylloquinone) are essential nutrients required for normal body functioning that either cannot be synthesized by the body at all or in signifi cant amounts. These vitamins are acquired from the diet. However, these compounds can also be toxic in large doses. Therefore, a simple and accurate quantitative analytical method was developed to quantitatively measure these water and fat soluble vitamins in human serum.Methods: An Agilent 6460 tandem mass spectrometer with Jet Stream technology in positive Electrospray mode and an Agilent Infi nity 1260 HPLC system were utilized for this analysis. 100 ml of human serum was used for the analysis of the Fat and Water Soluble vitamins and the sample preparation involved liquid-liquid extraction (LLE) with MTBE for the Fat Soluble Vitamins and a simple protein crash for the Water Soluble vitamins in buffer. An Agilent Poroshell 120 SB-Aq, 100 x 2 mm, 2.7 um with water:methanol containing 0.1% formic acid gradient achieved baseline chromatographic separation of the water soluble vitamins. An Agilent Poroshell 120 EC-C18, 100 x 2 mm 2.7 um water:methanol containing 0.1% formic acid gradient achieved baseline chromatographic separation of the fat soluble vitamins. Quantitative analysis was performed using multiple reaction monitoring (MRM) transition pairs for each analyte and internal standard in positive mode and accuracy of the method was verifi ed using reference materials from Recipe and UTAK and serum and blood adult samples.Results: Good linearity and reproducibility were obtained with the all the vitamins across their respective ranges. The lower limits of detection (LLOD) were achieved at well below their respective clinical ranges. The intra- and inter-day CV’s were < 10% respectively for all the vitamins.Conclusion: A sensitive, simple, specifi c and accurate liquid chromatography- tandem mass spectrometry method was developed and validated for the measurement of water and fat soluble vitamins in serum and blood. The sample preparation is quick and easily applied for high throughput analysis.
A-218
Reducing the Hematocrit Effect for Dried Blood Spot Analysis
J. Wright, I. Valmont, J. Hill, J. Hill. Spot On Sciences, Austin, TX
Background: Dried blood spot (DBS) sampling methods are increasingly used due to many advantages over conventional venipuncture collection including reduced sample processing and infrastructure needs, ambient temperature shipment with no cold chain requirement and improved sample stability. Hematocrit levels in human blood vary due to gender, disease state, age and medications and can impact the spread and size of the blood spot, which causes discordance in analytical quantitation.Methods: Hematocrit levels of 25, 35, 45, 55 and 65% were prepared by adding or removing plasma in fresh human whole blood. These samples were spiked with common drugs tolbutamide, nefedipine and ramipril and 80μL was spotted on TFN fi lter paper (Munktell) and on HemaForm™ fan-shaped fi lter paper forms (Figure 1). After air drying overnight, punches (4 mm) were removed from the TFN spots. A blade was removed from the HemaForm sample.Each sample (n=3) was extracted in MeOH:H2O containing deuterated internal standards for 30 minutes with sonication and analyzed by LC-MS/MS.Results: With traditional blood spots, a trend was observed with increased drug levels recovered from higher hematocrit levels; this is likely due to decreased overall spot size from more viscous samples at higher hematocrit levels. HemaForm samples showed a more consistent recovery from all hematocrit levels. Additionally, variability between replicates (%CV) was reduced with HemaForm samples as compared to traditional spots.Conclusion: HemaForm fan-shaped fi lter paper can reduce analytical variability due to hematocrit effects for dried blood spot samples.

Mass Spectrometry Applications Tuesday, July 30, 9:30 am – 5:00 pm
CLINICAL CHEMISTRY, Vol. 59, No. 10, Supplement, 2013 A65
Figure 1:HemaForm and Traditional Blood Spot
A-219
Quantitative analysis of Prostaglandin F2-Alpha and its metabolites in urine using Liquid Chromatography Triple Quadruple Mass Spectrometry
R. M. Doyle. Agilent Technologies, Wilmington, DE
Background: Prostaglandin F2-Alpha (PGF-2a) is involved in the induction of labor and its metabolites are an indicator of lipid peroxidation from free radical generation. It’s metabolites are also biomarkers for the quantitation of endometriosis-associated oxidative stress, oxidative damage and antioxidant defi ciency. The quantitation of PGF-2A and its metabolites require specifi c chromatography to separate all the clinically relevant analytes as well as sensitive enough to achieve the low concentrations associated with biological samples. Therefore, we developed a sensitive and specifi c method for the separation and detection of PGF-2a, 8-Iso-PGF-2a, 15-(R)-PGF-2a, 11-beta-PGF-2a, 13, 14-Dihydro-15-Keto-PGF-2A and other metabolites in human urine to be able to measure the analytes accurately.Methods: An Agilent 6460 tandem mass spectrometer with Jet Stream technology in positive Electrospray mode and an Agilent Infi nity 1260 HPLC system were utilized for this analysis. 200 ul of human urine was used for the analysis of PGF-2a and its metabolites and the sample preparation involved liquid-liquid extraction (LLE) with prior acidifi cation. Various columns were evaluated for maximum separation to achieve baseline chromatographic separation of all the metabolites in less than 6 minute run time. Quantitative analysis was performed using multiple reaction monitoring (MRM) transition pairs for each analyte and internal standard in negative mode and accuracy of the method was verifi ed using in house controls and urine adult samples.Results: Good linearity and reproducibility were obtained with the concentration range of 0.1 ng/ml to 500 ng/ml for all the analytes with a coeffi cient of determination >0.99. The lower limits of detection (LLOD) and lower limit of Quantitation (LLOQ) were determined to be at least 0.05 ng/ml.Conclusion: A sensitive, simple, specifi c and accurate liquid chromatography- tandem mass spectrometry method was developed and validated for the simultaneous measurement of PGF-2a and its metabolites in urine.
A-220
DOSAGE OF METALS IN URINE BY ICP-MS: PERFORMANCE EVALUATION
P. C. Souza, L. M. Hanhoerster, C. F. A. Pereira. DASA, Rio de Janeiro, Brazil
INTRODUCTION: The dosage of metals has been widely discussed by many scientifi c studies. In recent decades, dosage of metals such as Al, Cr, Mn, Ni, Co, Cu, Zn, Cd, Sn, Hg and Pb in biological fl uids has gained a lot of strength because ofoccupational exposure in several industries). These markers can provide information for effective control of exposure, use of individual protection devices and improving the work environment.
Classically, Atomic Absorption Spectrometry (AAS) has been shown to be widely used, due to the large number of studies carried out, refl ecting the high accuracy and sensitivity of the methodology.AAS turned into a very slow solution because the process requires the dosage to be done one element at a time. In contrast, the dosage of metals by Inductively Coupled Plasma Mass Spectrometer (ICP-MS) becomes very attractive. In a single dosage all the elements of interest can be quantifi ed, without modifi ers and without prior digestion of the samples. Besides the rapid detection, this method delivers a much higher sensitivity comparing with AAS, reaching easily amounts in parts per trillion (ng/L), aiming for a new clinical interest - Orthomolecular medicine.OBJECTIVES: The aim of this work is to validate the ICP-MS methodology for the analysis of 11 simultaneous elements in urine. A simple dilution of samples with a simple standard linear curve permit the analyses of a large number of urine samples with 11 simultaneous elements (Cr, Mn, Ni, Co, Cu, Zn,Ar, Cd, Sn, Pb, Hg ). The analytical run for each sample is also very short - one and half minutes.MATERIALS / EQUIPMENT: Standard: CertiPUR ® ICP multi-element standard solution VI, Merck PN: 1.10580.0100, Lot.: HC002032Internal Standard: PCI standard YtriumCertiPUR ®, Merck PN: 1.70368.0100, lot: HC116058Lyphocheck ® Urine Metals Control, BIORAD, Level 1, Lot: 69151Lyphocheck ® Urine Metals Control, BIORAD, Level 2, Lot: 69152Urine samples Laboratory DASA - Lot routine: METU 080213Equipment ICP-MS, Agilent 7700RESULTS:Routine analysis of metals in urine from 228 patients by the methodology of ICP-MSElement ………..| Cr | Mn | Ni | Co | Cu | Zn | As | Cd | Sn | Hg | Pb |Average (ug/L) |2,17 |1,70|3,57|0,48|15,56|557,25|16,57|0,36|0,58|1,12|3,39|ControlLevel1..| 1,27|8,42|3,5|7,46|12,9|437|52,4|10,0| CQI*|38,8|11,3|ControlLevel2..| 23,7|21,0|25,2|22,7|42,6|943|160,6|17,9| CQI*|101,4|55,5IQC = Internal Quality Control ,Sn not available inLyphocheck Urine Metals BIORADCONCLUSION: From the data above, we can easily demonstrate the superiority of ICP-MS. With only one machine, 2,500 tests can be processed in just 5 hours and 47 minutes. The dosage of this number oftestswith AAS methodology would demand more than 10 simultaneous devices, withmany different reagents. It is evident the superiority of ICP-MS, faster, more effi cient and sensitive, offering a remarkable performanceand earning its place in the dosage of metals in biological samples.
A-221
Validation of a multiplex proteomic mass spectrometry method for identifi cation of cerebrospinal fl uid
J. W. Meeusen, D. Barnidge, P. Ladwig, R. Karras, J. Katzmann, M. Snyder, D. Murray. Mayo Clinic, Rochester, MN
Background: Detection of cerebrospinal fl uid (CSF) in clinical specimens is the most sensitive method for diagnosis of central nervous system fi stulas. The current methods rely on detection of a single marker for CSF and have limitations in the presence of serum contamination.Objectives: (1) To establish a mass spectrometry method to identify CSF and serum protein biomarkers in samples of undetermined origin. (2) To compare ß2-transferrin (ß2-Tf) detection by electrophoretic immunofi xation to multiplexed proteomic mass spectrometry for the identifi cation of CSF in clinical samples.Methods: A LC-MS/MS multiplex assay for the detection of CSF (ß-trace protein) and serum (α2-macroglobulin, complement C3) specifi c markers in trypsin digested samples was developed based on selective reaction monitoring of unique peptides. The LC-MS/MS method was analytically validated by comparison with nephelometric quantitation of ß-trace, α2-macroglobulin and complement C3 in CSF/serum mixtures. CSF detection by the ß2-Tf immunofi xation and multiplexed mass spectrometry methods were compared using both CSF/serum mixtures and clinical specimens.Results: Serial dilutions of pooled CSF (total protein<0.5g/dL) in pooled normal serum (total protein 6.6g/dL) measured by mass spectrometry correlated linearly with nephelometric quantitation across the range of 1.8-25mg/L ß-trace (R20.985), 35 200mg/dL α2 macroglobulin (R20.9915) and 35 165mg/dL complement C3 (R20.9811). The ß2-Tf band is identifi ed in the 100%, 80% and 50% CSF samples, however, at 20% CSF and lower, the serum protein ß1-Tf concentration overwhelms the gel. The lower limit of detection for ß-trace was determined by comparison of nephelometry and mass spectrometry quantitation for serial dilution of a 20% CSF/serum mixture in saline which was linear between 0.3-4.2 mg/L ß-trace (R20.9643). Intra-assay precision (n=20) for the LC-MS/MS method performed on a 20% CSF/serum mixture was 8.2% for ß-trace (8.95mg/L), 7.4% for α2-macroglobulin (185mg/

Tuesday, July 30, 9:30 am – 5:00 pm Mass Spectrometry Applications
A66 CLINICAL CHEMISTRY, Vol. 59, No. 10, Supplement, 2013
dL), and 21.8% for complement C3 (147mg/dL). Method comparison between LC-MS/MS, nephelometry and ß2-Tf was performed in 16 otolaryngological secretions with suffi cient volume for all tests. All ß2-Tf results were unequivocal; seven samples were found to be positive with a mean ß trace of 23.2mg/L by nephelometry (4.2x10⁵cps; range 7.8x10⁴ 3.0x10⁵cps [LC-MS/MS]), The mean ß trace was 0.7mg/L (6.9x10³cps; 6.4x10² 1.8x10⁴cps [LC-MS/MS]) for the nine ß2-Tf negative samples. Serum protein biomarkers were undetectable in the ß-trace/ß2-Tf positive samples. Finally, samples for CSF determination by ß2-Tf immunofi xation with known clinical histories were analyzed blindly by LC-MS/MS. Discordant results were followed up with the clinical history.Conclusions: The semi-quantitative identifi cation of CSF by multiplex mass spectrometry agreed with nephelometric quantitation and was capable of detecting 20% CSF in serum which is a signifi cant improvement over ß2-Tf immunofi xation. Serum contamination can lead to equivocal ß2 Tf immunofi xation results. The ability to evaluate the amount of serum in the sample expands the clinical utility of the LC-MS/MS method.
A-222
Method validation of 1-hydroxypyrene in urine by liquid chromatography/tandem mass spectrometry
C. Lin, Y. Huang, Y. Huang, T. Wu, H. Ning, J. Lu. Chang-Gung Memorial Hospital, Taoyuan, Taiwan
Background: Polycyclic aromatic hydrocarbons (PAHs) are ubiquitous and formed from incomplete burning of coal, oil, gas, wood, tobacco or charcoal broiled meat. Most of general population is exposed to PAHs from different sources. PAHs are own to be cytotoxic; however the dose-response relationship for adverse health effects due to the exposure is not known. 1-Hydroxypyrene (1-OHP) is the major metabolite of polycyclic aromatic hydrocarbons. It is useful to monitor the 1-OHP in urine to evaluate individual exposure. The purpose for this study was to develop a method by liquid chromatography-tandem mass spectrometry (LC-MS/MS) to determine 1-OHP in urine specimens. Methods: The 1-OHP standard was obtained by AccuStandard and prepared in methanol. The internal standard 1-OHP-D9 was obtained from Toronto Research Chemicals. Urine specimens and controls are hydrolyzed with beta-glucuronidase enzyme solution at pH 4.5 for 1 hour at 37oC to convert the1-OHP to their free forms and increase sensitivity. Deuterated analogs of the 1-hydroxypyrene are added as internal standards (IS) to the enzyme treated patient urine, controls, and standards. 1-OHP was separated from the biological fl uid using solid phase extraction (SPE). The elution solvent was injected into a LC-MS/MS (Thermo Fisher Scientifi c TSQ VANTAGE). The concentration of analyte(s)was calculated from the calibration curve and ion ratios between the analyte(s) and the internal standards. Results:The calibration curves obtained with human urine were linear with a correlation coeffi cient of over 0.98 in the range of 0- 2000 pg/mL. The coeffi cient variation for inter- and intra-day precision was within 15% at two different concentrations: 100, and 400 pg/mL. There was no carryover observed in this assay, with the high concentration of 2000 pg/mL. To evaluate accuracy, drug-free urine was pooled and used a matrix to spike 6 samples with 1-OHP. The recovery is 95%. Conclusion: Urine 1-OHP testing can be a useful approach in evaluating individual exposure to PAHs. We provide an option to quantify the 1-OHP concentration in urine by LC-MS/MS.

Immunology Tuesday, July 30, 9:30 am – 5:00 pm
CLINICAL CHEMISTRY, Vol. 59, No. 10, Supplement, 2013 A67
Tuesday, July 30, 2013
Poster Session: 9:30 AM - 5:00 PM
Immunology
A-223Clinical Evaluation of Total and High Avidity Anti-dsDNA Antibody EIA for the Diagnosis of Systemic Lupus Erythematosis
P. Wan1, S. Zhou2, H. Cao1, W. Li1, T. Prestigiacomo2, J. Zheng1. 1Shanghai Jiaotong University, Shanghai, China, 2Bio-Rad Laboratories, Hercules, CA
Background: Anti-dsDNA antibodies have been well recognized as a diagnostic marker of systemic lupus erythematosus (SLE). The clinical utility of anti-dsDNA antibody avidity in disease management has been evaluated in previous studies, with confl icting results. This study is to investigate the clinical utility of total (high and low avidity) and high avidity anti-dsDNA antibodies in an enzyme-linked immunosorbent assay (EIA).Methods: 221 sera from SLE patients, 51 sera from patients with various other autoimmune diseases including Sjögren’s syndrome, dermatomyositis, scleroderma and rheumatoid arthritis, and 159 sera from healthy subjects were collected. Modifi ed SLE disease activity index (M-SLEDAI) was calculated for SLE patients at the time of serum collection. Clinical data were obtained independently of the laboratory analyses and later related to the anti-dsDNA antibody test fi ndings. All 431 sera were measured using fi ve different formats of anti-dsDNA EIA kits. Two kits are commercially available at Bio-Rad Laboratories and the other three are research use only kits. The different formats of assay kits are characterized by different antigen sources and assay conditions: two kits were designed for detecting total (high and low avidity) anti-dsDNA IgG antibodies, two kits for measuring high avidity anti-dsDNA IgG antibodies and one for detecting anti-dsDNA antibodies of both IgG and IgM isotypes. The diagnostic sensitivity and specifi city, positive and negative likelihood ratio (LR+, LR-), and positive and negative predictive values (PPV and NPV) were calculated for each assay format. The agreements and linear regression between different formats of anti-dsDNA EIA tests were calculated and the correlation of anti-dsDNA antibody levels with disease activity and clinical manifestations were analyzed. Statistic analysis was performed using Analyse-it® software.Results: High avidity EIA tests have fewer false positives, especially in other autoimmune disease control group (8/51 vs 1/51 and 6/51 vs 2/51). The overall agreement and linear regression (R2) between the different assay formats ranged from 83.3% to 94.0% and from 0.42 to 0.96, respectively, depending mainly on the antibody avidity and immunoglobulin classes. The total and high avidity anti-dsDNA antibody levels have signifi cant correlation with disease activity (M-SLEDAI, spearman analysis, P<0.0001). Mann-Whitney and Fisher exact analyses show there are signifi cant differences of anti-dsDNA antibody level and positivity rate in the patients with or without kidney damage (P<0.0001), but not in the patients with or without hematological damage (P>0.05). The ratio of high avidity to total anti-dsDNA antibody is signifi cantly higher in the patients with M-SLEDAI >4 or with active kidney damage (t-test, P<0.0001).Conclusions: The overall performance between various anti-dsDNA assays demonstrates adequate overall agreement. However, the high avidity tests demonstrated improved specifi city for samples from the patients with other systemic autoimmune disorders, where the presence of anti-dsDNA is not clinically relevant. Additionally, the ratio of high avidity to total anti-dsDNA antibodies may be useful for monitoring patients as it demonstrated a correlation to disease activity.
A-224
Standardization of the Total IgE Reference Interval in Northern Alberta, Canada
O. R. Maries1, K. L. Schnabl2, K. Rodriguez-Capote3. 1University of Alberta, Edmonton, AB, Canada, 2University of Alberta Hospital, Edmonton, AB, Canada, 3DynaLIFEDX, Edmonton, AB, Canada
Background: Currently, the total IgE antibody reference interval in Alberta is partitioned by age. This partition is dependent on the instrument platform. Therefore, a total IgE concentration result can be easily misinterpreted without the proper testing platform context. Objective: To standardize the reference interval for total IgE across Northern Alberta, CanadaMethods:Reference intervals for total IgE (IgE-RI) were calculated according to the CLSI guidelines (C28-A3) from a database of 63,743 subjects who were tested for total IgE between the years of 2005-2009 at the University of Alberta Hospital and DynaLIFEDx. Measurements were performed on the ADVIA Centaur® XP, the ImmunoCAP® and Beckman Coulter DxI®. The need for age or gender partition was evaluated by two way ANOVA and verifi ed by the Harris-Boyd method. Outlier exclusion was performed using the Tukey’s method. Statistical analysis was performed using MedCalc® v11.4.2.0 and ExcelResults:Total IgE increases steadily from birth, peaks from 8 to 17 years of age and decreases in the adult and geriatric populations (Fig. 1). The total IgE-RI was calculated for the community and the hospital populations and then compared to the IgE-RI calculated from the combined population of community and hospital patients. No statistical differences were observed when the IgE-RI derived either from the community, hospital or total population patients were compared (DF= 63734, F=3.2, p=0.075). The proposed total IgE-RI is show in the tables below.Conclusion:There is no signifi cant difference between the community, hospital or combined populations after outlier removal, thus a common total IgE RI can be established across Northern Alberta.
Total IgE data partitioned according to age groups after Tukey outlier removal.Age Group (years) N(%males) Upper Limit (kU/L) 90% CI<1 808(60%) 12 11.03-13.451 129(61%) 20 19.87-21.382 to 3 1717(61%) 32 30.68-32.924 to 7 3191(57%) 40 39.28-41.468 753(58%) 65 61.62-68.239 to 10 1455(55%) 54 51.90-56.1311 to 17 2797(53%) 66 64.42-67. 66≥18 41096(38%) 35 32.90-37.49
A-225
Performance evaluation of an allele-specifi c oligonuleotide real-time PCR assay for the detection of minimal residual disease in multiple myeloma
M. M. Elfahal1, E. Karaszi2, A. Penyige3, G. Abel1. 1Lahey Hospital and Medical Center, Burlington, MA, 2St. László Hospital, Budapest, Hungary, 33Department of Human Genetics, Medical and Health Science Center, University of Debrecen, Debrecen, Hungary
Background: Immunoglobulin heavy chain (IgH) gene rearrangement provides a clone specifi c marker for the molecular detection of tumor cells and monitoring minimal residual disease in multiple myeloma and other B cell dyscrasias. The unique sequences of the CDR3 region can be used to design allele specifi c oligonucleotides (ASO) and an individualized detection system for each patient using real-time PCR (ASO-RT-PCR).Objective: To compare the lower limit of detection of clonal B cells using IgH gene rearrangement analysis by ASO-RT-PCR with that of PCR techniques using only consensus IgH primers.Methods: A monoclonal IgM lambda-producing human B cell line was used as a model for the detection of clonal proliferation seen in multiple myeloma. In addition, peripheral blood from healthy controls and remainders of diagnostic bone marrow and blood specimens from 9 patients with multiple myeloma were used in an IRB-approved study. For tests with consensus primers, 7 different primer pairs were used (VH1-6 with JH, and FR3 with Cx). PCR products were then detected by agarose gel electrophoresis and high-resolution fragment analysis. For high-resolution fragment analysis, PCR products were generated with fl uorescent primers and separated using a Long Read Tower automated sequencer and Genescan computer program (OpenGene, Siemens). In methods using the clone-specifi c ASO-CDR3 primers, sequencing of the IgH gene and identifi cation of the specifi c CDR3 region sequence were performed

Tuesday, July 30, 9:30 am – 5:00 pm Immunology
A68 CLINICAL CHEMISTRY, Vol. 59, No. 10, Supplement, 2013
fi rst. ASO-PCR with the CDR3-JH primer set generated approximately 90 bp PCR products that were detected by agarose gel electrophoresis, fragment analysis and quantitative real time PCR. Similar experiments were performed using bone marrow cells from patients with multiple myeloma with M-components of various immunoglobulin isotypes.Results: The detection limit of clonal B cells by each technique was determined by serial dilutions and mixing of the B cell line or bone marrow cells from patients with multiple myeloma with normal human peripheral blood mononuclear cells; and B cell or myeloma cDNA serial dilutions and mixing with human placental DNA. Methods with consensus primers had a detection limit of 10-3 for tumor cells both with agarose gel electrophoresis and Genescan detection, while the sensitivity of ASO-RT-PCR was 10-4 with both detection methods. ASO-RT-PCR was able to detect IgM-producing clonal B cells or multiple myeloma cells at a limit of 10-6. The specifi city of ASO primers was tested on human mononuclear cells from healthy controls and multiple myeloma patients. The lack of PCR products in these controls indicated the specifi c annealing of the primers, indicating high specifi city.Conclusion: ASO-RT-PCR is a more sensitive molecular method for the detection of minimal residual disease than techniques using consensus primers only. The optimized ASO-RT-PCR personalized medicine test has potential as a tool for the detection and monitoring of minimal residual disease in patients with multiple myeloma.Acknowledgement: This study was supported by the Robert E. Wise, M.D. Research and Education Institute.
A-227
Evidence for hybrid light chain IgG4 molecules in normal human serum.
E. Young, E. Lock, A. Cook, G. Wallis. The Binding Site Group Ltd, Birmingham, United Kingdom
Background: Human IgG4 molecules are dynamic and have been shown to exchange half molecules to become bi-specifi c antibodies in a process termed Fab-arm exchange. Bi-specifi c molecules cannot cross-link antigen nor elicit lymphoid cell activation. It has been proposed that this mechanism may dampen-down unnecessary infl ammatory responses. Here we show that polyclonal IgG4 antibodies with kappa or lambda light chains can similarly exchange resulting in hybrid asymmetrical IgG4κ/λ antibodies.Methods and Results: Polyclonal IgG4 was purifi ed from a pooled human plasma source (BioProducts Ltd) by affi nity chromatography on IgG4 Select and sequentially fractionated into either IgG4κ or IgG4λ. It was found that a substantial portion of purifi ed IgG4 (approx. 40%) possessed both kappa and lambda light chains and could not be fractionated by light chain specifi city. Size exclusion chromatographyshowed that this material was composed of principally immunoglobulin monomers (150 kDa) and a much lower level of aggregates of higher molecular weight. The monomers were collected and analysed by ELISA and SDS-PAGE immunoblotting. Analytical antibodies different to those used during the purifi cation process were employed to rule out idiotypic false positives. The results clearly indicated that IgG4 proteins containing different light chains on the same molecule were present. Based on the molecular weight these molecules were formed of 2 IgG4 heavy chains (non-identical?) plus 1 kappa and 1 lambda light chain. Polyclonal IgG depleted of IgG4 (mainly IgG1 and 2) was purifi ed using Mabselect SuRe and similarly fractionated according to light-chain specifi city. No evidence of hybrid IgG κ/λ antibodies was observed. This would rule out the possibility that the hybrid light-chain immunoglobulins had been generated by in vitro processing, and suggests that they are restricted to IgG4 subclass molecules. The analytical extraction procedure was repeated on normal serum from multiple individual donors. Hybrid IgG4κ/λ antibodies were found to be present in all of them.Conclusions: These results have unambiguously demonstrated that hybrid asymmetrical IgG4κ/λ antibodies are present in normal (non-immunised) human serum. This is a logical outcome from the process of ‘Fab-arm’ exchange in vivo. The clinical signifi cance of this has yet to be determined, however assays that measure IgG kappa and lambda serum levels and ratios are likely to produce discordant results. This possibility should be considered when interpreting these assay results.
A-228
In vitro Allergy Testing: Correlating IgE levels Among All Allergens
J. S. Kaptein, C. E. Lin, B. J. Goldberg. Southern California Permanente Medical Group, Los Angeles, CA
Background: Allergic reactions are believed to be mediated by IgE. Clinical in vitro testing is available for IgE against about 500 allergens comprising grass, weed, and tree pollens, animal and insect products, molds, foods, and others. It is impractical to test for all of these. Moreover, the result for one test may be related to the result of another test. This report delineates the relationships between IgE levels to various allergen pairs.Methods: Patient data from in vitro testing using ImmunoCAP® technology in a major Southern California medical organization were extracted from instrument log fi les. Approximately 2.5 million test results were examined covering a 4.5 year span. Allergens were paired in all combinations, with all patient samples tested for any given pair being compiled, and results analyzed to determine whether there was a relationship between the results for the two allergens selected. Parameters investigated include (1) the frequency of positive/negative results for the second allergen when the fi rst is positive/negative; (2) whether a positive/negative result for the second allergen occurs more frequently than chance when the fi rst allergen is positive/negative; (3) slope, intercept, correlation, and symmetry when IgE levels specifi c for the two allergens are compared.Results: We have suffi cient sample size to provide meaningful data for 10,000 pairs of allergens of the 250,000 possible pairs. Many of these show little or no relationship between levels of IgE for the two allergens. However, at least two types of interesting relationships were revealed.The fi rst type represents cases where levels of IgE against one allergen closely correlate to levels against the second (e.g. walnut/pecan, cockroach/shrimp/lobster/crab, carrot/celery, .....).The second type represents cases where levels of IgE against one allergen are similar to, or higher, but not less than, the levels against the second - e.g. patients with IgE against oranges have IgE directed against peanut, sesame, soybean, apple, peach and oat at least at the level to which they have IgE directed against orange, but not all patients with IgE to these other foods have IgE against orange. We interpret this as the allergenic component(s) of oranges being present in these other foods, but the other foods having additional allergenic component(s) not found in oranges.Additionally, we fi nd combinations of these two types. IgE levels against carrot and celery correlate, however the allergenic component(s) in these are subsets of those in birch pollen.Conclusion: This study correlates results of in vitro specifi c IgE tests among various allergens with results for 10,000 pairs of allergens now available. Pairs of related allergens and allergens whose components are subsets of other allergens are presented. Knowing these patterns may help elicit the cause of some allergies - e.g. shrimp allergy without any prior exposure, due to cockroach or dust mite exposure. It also helps patients know which other allergens to avoid when known to be reactive to a specifi c allergen. Additionally, it points out redundancies in clinical testing (especially among the grass pollens) which has cost-savings implications.
A-229
Multi-center Evaluation of New Free Light Chain Methods
W. K. Gentzer1, T. B. Ledue2, V. Luzzi3, R. H. Christenson4. 1Siemens Healthcare Marburg, Marburg, Germany, 2Foundation for Blood Research, Scarborough, ME, 3Henry Ford Hospital, Detroit, MI, 4University of Maryland School of Medicine, Baltimore, MD
Background: The International Myeloma Working Group has provided consensus guidelines for the use of immunoglobulin free light chain (FLC) determinations in the diagnosis and management of clonal plasma cell disorders. We describe preliminary repeatability, linearity, reference range, and method comparison data for two new immunoassays designed for the detection of free Ig light chains type kappa and lambda in serum and plasma. In addition, we investigated samples from patients with kidney impairment for their FLC content.Methods: Latex-enhanced mouse monoclonal antibody reagents from Siemens for free Ig light chain type kappa (N Latex FLC kappa)* and free Ig light chain type lambda (N Latex FLC lambda)* were assayed on three BN™ II Systems and three BN ProSpec® Systems using serum samples. Precision studies were carried out according to CLSI guideline EP5A-2 to estimate repeatability performance of three sample

Immunology Tuesday, July 30, 9:30 am – 5:00 pm
CLINICAL CHEMISTRY, Vol. 59, No. 10, Supplement, 2013 A69
pools and two controls each for kappa and lambda, using up to three independent reagent and calibrator lots at the four test sites. Linearity was evaluated by calculating the recovery of repetitions performed at higher or lower dilutions compared to the results obtained with the default dilutions. Reference ranges were conducted using 397 clinical samples from apparently healthy adults (aged 16-89 years). Qualitative method comparison studies using 314 samples from patients with diagnoses of multiple myeloma, amyloidosis, Waldenström’s macroglobulinemia, monoclonal gammopathy of undetermined signifi cance, polyclonal immunoglobulin stimulation, or renal disease were performed at two U.S. sites against commercially available FLC methods for the BN II system. Statistical analysis used concordance tables and the kappa statistic.Results: ANOVA studies for between-site, between-lot, and total precision for kappa on BN II system were 1.1-2.1%; 2.0-3.1%; and 3.7-5.2%, respectively. On the BN ProSpec system, the corresponding kappa results were 2.6-5.2%; 2.4-4.8%; and 3.6-6.9%. Lambda results on the BN II system were 0.4-3.7%; 3.5-7.8%; and 6.2-9.1%; on the BN ProSpec system, lambda results were 1.8-2.5%; 1.2-5.6%; and 4.3-7.7%. In terms of linearity, there were 78 kappa and 117 lambda data sets available for analysis. For kappa 89% and for lambda 97% of the repeats recovered within ±20% of the initial value. Reference range studies resulted in κ/λ ratios of 0.19/0.87/1.74 (min/median/max). Method comparison studies resulted in the following: Site 1 analyzed 139 samples and revealed concordance rates of 89.9% for kappa, 77.0% for lambda, and 91.4% for the κ/λ ratio. The results at Site 2 based on 175 samples were 88.6%, 81.7%, and 89.1%, respectively. Combining the data revealed concordance rates of 89.2%, 79.6%, and 90.1%. N Latex FLC results for 57 patients with kidney impairments ranged from 14.1-208 mg/L for kappa and 15.1-228 mg/L for lambda, respectively, and resulted in a κ/λ ratio distribution of 0.43/0.78/1.46 (min/median/max).Conclusion: The new FLC methods performed well under routine laboratory conditions on both BN platforms.* Not available for sale in the U.S.
A-230
Analysis of factors associated with indeterminate results of whole blood interferon-γ release assay during routine hospital use
O. Lee1, S. Kee1, H. Choi1, M. Shin1, J. Shin1, B. Park2, S. P. Suh1, D. Ryang1. 1Department of Laboratory Medicine, Chonnam National University Hospital and Medical School, Gwangju, Korea, Republic of, 2Mokpo National University, Muan, Korea, Republic of
Background: Interferon gamma release assay (IGRA) is an in vitro diagnostic assay, which is an alternative to replace in vivo tuberculin skin test for detection of latent tuberculosis infection and tuberculosis. However, higher rates of indeterminate results can limit the performance of the IGRA in a variety of immunosuppressive conditions. The aim of this study was to determine which factors were associated with indeterminate results of whole blood IGRA in a large cohort of patients.Methods: A retrospective cross-sectional study was performed on patients with determinate results versus patients with indeterminate results. We recruited 4,442 patients consecutively submitted to QuantiFERON-TB Gold-In Tube assay (Cellestis, Australia) during routine practice from March 2009 to October 2012 at the Chonnam National University Hospital. Clinical and laboratory information of the patients was collected.Results: Of 4,442 patients tested for QuantiFERON-TB Gold-In Tube assay, 4,024 (90.6%) were determinate and 418 (9.4%) indeterminate. In univariate analysis, younger age (<10 years vs 20-29 years; OR=4.32 [95% CI, 3.19-5.85], P<0.0001), older age (>80 years vs 20-29 years; OR=2.81 [95% CI, 2.05-3.86], P<0.0001), colder season (winter vs summer; OR=2.40 [95% CI, 1.75-3.30], P<0.0001), and methodology of ELISA (automation vs manual; OR=0.53 [95% CI, 0.39-0.72], P<0.0001), but neither gender nor incubation delay, were associated with an indeterminate IGRA result.Conclusion: Age, seasonality, and methodology of ELISA were signifi cantly associated with intermediate IGRA results. Analysis of these factors might contribute to a better performance of the assay.
A-231
Evaluation of Combylite, a single latex-enhanced assay for the measurement of combined serum κ and λ free light chains in patients with systemic lupus erythematosus
L. K. Assi1, H. Sharrod1, L. Lisnevskaia2, R. G. Hughes1, A. Rahman3, D. Isenberg3, S. J. Harding1. 1The Binding Site Group Ltd, Birmingham, United Kingdom, 2Oshawa Clinic, Oshawa, ON, Canada, 3Centre for Rheumatology, University College London, London, United Kingdom
Background: Recently, increased concentrations of polyclonal serum free light chains (FLC; κFLC and λFLC), markers of both immune status and renal function, have been reported in systemic lupus erythematosus (SLE) patients. Here we describe Combylite a single, latex-enhanced assay for the combined measurement of κFLC and λFLC (cFLC) and evaluate its utility in assessing SLE disease activity.Methods: cFLC measurements were determined using Freelite® (summated κFLC+λFLC; The Binding Site Group Ltd, UK) and Combylite (normal range for cFLC: 9.3-43.3mg/L) on the SPAPLUS turbidimeter (The Binding Site Group Ltd) in patients with SLE (N=56). Assay comparison analysis was performed using Analyse-it®. 89% of the population were female, with a median age of 43 years (range: 21-86); 52% were Caucasian. cFLC concentrations were compared to conventional biomarkers of SLE disease activity, notably anti-double stranded DNA (dsDNA) antibodies, complement C3, lymphocyte count, erythrocytesedimentation rate (ESR), cystatin C and immunoglobulins: IgG, IgA and IgM. Serologically active disease was defi ned as patients with elevatedanti-dsDNA antibody levels (>50IU/ml) and reduced C3 (<0.9g/L).Results:Combylite and summated Freelite were equivalent using Passing-Bablok analysis: y=0.94x - 2.68 and linear regression analysis: y=0.91x - 1.67, R2=0.95. Combylite agreed with summated Freelite in identifying patients with elevated cFLC (>43.3mg/L); positive predictive value: 100% and negative predictive value: 97%. Weak to moderate correlations were observed between cFLC vs: ESR (Spearman r: 0.49, p<0.001), cystatin C (r: 0.41, p=0.002), IgG (r: 0.56, p<0.001) and IgA (r: 0.64, p<0.001). cFLC did not correlate with anti-dsDNA antibodies (r: 0.22, p=0.116), C3 (r:-0.03, p=0.855), lymphocyte count (r:-0.13, p=0.356) or IgM (r: 0.008, p=0.955). Median cFLC levels were signifi cantly (p=0.03) elevated in patients with serologically active (N=14, 51.38mg/L (10.17mg/L-110.62mg/L) vs inactive disease (N=42, 29.02mg/L (12.34mg/L-163.99mg/L). However, there was no signifi cant difference in the levels of ESR (p=0.464), IgG (p=0.343), IgA(p=0.407) or IgM (p=0.953). Conclusion: Combylite showed very good analytical agreement with summated Freelite values. cFLC concentrations, but not immunoglobulins, were elevated in SLE patients with serologically active disease and therefore may be used as a marker of disease activity. Future work is warranted, using larger prospective populations, to determine how cFLC can be used to monitor disease progression in patients with SLE.
A-232
Quantifi cation of combined serum free light chains as a risk marker of cardiovascular events in chronic kidney disease
A. Burmeister1, J. M. Faint1, L. K. Assi1, H. Sharrod1, P. Cockwell2, S. J. Harding1. 1The Binding Site Group Ltd, Birmingham, United Kingdom, 2University Hospital Birmingham, Birmingham, United Kingdom
Background: Recent studies have demonstrated an association between elevated combined free light chain (cFLC (κFLC+λFLC)) concentrations and poor overall survival in disparate populations including chronic kidney disease (CKD). Here we describe a single immunoassay (Combylite) for the measurement of both κFLC and λFLC, and compare its performance to summated Freelite® values. Additionally, we evaluate the association of cFLC with cardiovascular disease (CVD) related mortality in CKD.Methods: cFLC levels (normal range 9.3-43.3mg/L) were measured in two independent CKD cohorts (515 CKD patients stages 2-5; and 1275 CKD patients stages 1-5D) and a CVD population (n=300) using Combylite and summated κFLC and λFLC (Freelite, The Binding Site Group Ltd, UK). Patients with a κ/λ FLC ratio outside of the normal range (0.26-1.65) were excluded. High-sensitivity CRP (hsCRP) was also measured in all available samples (Roche, Basel, Switzerland). Assay agreement was assessed using Passing-Bablok (PB) analysis. Correlation analyses between cFLC and hsCRP and Cox proportional hazard analysis were performed using Analyse-It® and SPSS v19.0.

Tuesday, July 30, 9:30 am – 5:00 pm Immunology
A70 CLINICAL CHEMISTRY, Vol. 59, No. 10, Supplement, 2013
Results: Combylite and summated Freelite showed equivalence in both CKD (PB slope y=0.95x - 1.35mg/L, n=515) and CVD (y=0.97x + 3.19mg/L, n=300) populations. The assay showed good agreement with summated Freelite in identifying patients with elevated cFLC (>43.3mg/L) in CKD (PPV:97% NPV:67%) and CVD (PPV:93% NPV:92%) populations. The precision of the Combylite assay at a concentration close to the upper limit of the normal range (53.98mg/L) was: total CV 5.5%; within run 2.1%; between run 2.9%; and between day 4.2%. In a second CKD population (n=1275), CVD mortality was signifi cantly associated with elevated cFLC (hazard ratio (HR) =3.10, p<0.001). cFLC correlated weakly with hsCRP (Spearman R=0.305, p<0.001), a well-established CVD risk factor, which was verifi ed in an independent CVD cohort (Spearman R=0.313, p<0.001). Furthermore, cFLC but not hsCRP, were independently associated with CVD mortality (HR=2.56, p<0.001), together with age (HR=1.79, p<0.001) and previous cardiovascular disease history (HR=2.21, p=0.005).Conclusion: Combylite showed good agreement with summated Freelite in determining cFLC concentrations. Elevated cFLC were associated with CVD mortality in CKD patients and were independent of hsCRP. This suggests that raised cFLC levels occur independently of infl ammation and may reveal a hitherto unidentifi ed role for B-cell activation in defi ning CVD risk in CKD.
A-233
Comparison of Manual and Automated Testing Methodologies for the New ZEUS IFATM ANA HEp-2 Test System
S. Merx1, M. J. Kopnitsky2, D. Bonilla2, K. Cichonski3, B. Blyskal4, J. L. Smith4, M. Stuff1, K. Davis-Fleischer4, D. Dowty5, M. Lee5, D. Schimkat1, F. Thiel5. 1Stratec Biomedical AG, Birkenfeld, Germany, 2Zeus Scientifi c, Inc., Raritan, NJ, 3Zeus Scientifi c, Inc., Rariton, NJ, 4Alere, Inc., Princeton, NJ, 5Stratec Biomedical US, Inc., Newbury Park, CA
Background: IFA and ELISA tests are routinely used as a diagnostic aid for autoimmune and infectious diseases. Manual processing of IFA and ELISA tests remain an expensive and labor-intensive task for all laboratories. Automation of IFA and ELISA testing provides a highly effi cient alternative to the manual laboratory routine. The new Gemini Combo system uses an effi cient dual IFA/ELISA technology based on a reliable and well-established ELISA platform. To increase productivity, the Gemini Combo offers processing of up to three ELISA plates or 16 different IFA slides for screening and/or titration with this walk-away system. Furthermore, automation provides increased accuracy for standardized dilutions and positive patient identifi cation, ensuring result consistency which is vital for laboratories. Here, we show the results of a direct comparison study between manual and automated processing utilizing ZEUS IFATM Anti-Nuclear Antibodies (ANA) HEp-2 test system, taking advantage of the newly established technology of the Gemini Combo.Methods: All ANA HEp-2 staining patterns of the samples used for this evaluation study have been previously tested and are well known. IFA testing of the new ZEUS IFATM ANA HEp-2 test system (ZEUS Scientifi c, Inc) was performed both by manual processing and using automated runs on the Gemini Combo (Stratec Biomedical AG). For the cross contamination study, alternating negative and strong positive ANA samples were used. For the reproducibility study, negative, strong positive and near cut-off samples of various ANA patterns (homogeneous, centromere, speckled, nucleolar) were tested in duplicate on three successive days. A correlation study with the ZEUS IFATM ANA HEp-2 test system was performed for screening of 92 samples (68 positive of different ANA patterns and 24 negative). Titration of 20 positive samples was performed on the Gemini Combo. All processed slides were evaluated by an IFA expert under an external fl uorescence microscope.Results: The cross contamination study revealed the total absence of carryover due to an effi cient and rapid well-by-well washing mode. The correlation study comparing manually processed ZEUS IFATM ANA HEp-2 tests versus automation on the Gemini Combo achieved 100 % sensitivity and 100 % specifi city with various ANA patterns. The titration study showed that results from the Gemini Combo matched on 18/20 samples, while 2/20 were within +/- one dilution. For reproducibility, results obtained over three days matched the expected results. No automated test parameters displayed any negative infl uence on the HEp-2 cells. The integrity of the HEp-2 cells was proven to be intact after processing on the Gemini Combo.Conclusion: This comparison study of the ZEUS IFATM ANA HEp-2 test system of manually processed IFA tests vs. automation on the Gemini Combo showed excellent results and met all expectations. It was clearly demonstrated that this system combines all advantages of an automated solution. The Gemini Combo offers walk-away automation for fast, cost-effective, reliable and easy to use IFA testing combined with an established ELISA platform.
A-234
Method Comparison of Two ELISA Platforms for the Detection of B.burgdorferi (Lyme) Antibodies; C6 Specifi c Peptide vs. Whole Cell Sonicate
S. Schwartz, T. Novicki, J. Flanagan, G. Simon. Marshfi eld Clinic, Marshfi eld, WI
Objective: To compare the performance of a B. burgdorferi C6 specifi c peptide antigen assay with a whole cell sonicate (WCS) assay to determine if the peptide based assay reduced the number of patient samples refl exed to Western blot. The lab had a goal to reduce the number of samples that were equivocal or positive by ELISA, but negative by Western blot, by fi nding a more specifi c method.Method: Fifty samples previously tested on a WCS based Lyme assay (VIDAS ® bioMerieux, Inc.) were collected for comparison purposes. All samples that were equivocal or positive had Western blot results. The values ranged from negative through equivocal to high positive. The samples were re-tested using a synthetic C6 peptide based assay (Immunetics® C6 B.burgdorferi Lyme ELISA) on the Quanta-lyser (Inova Diagnostics Inc.). In addition, sixty samples from both adult and pediatric individuals were used for a reference interval verifi cation of the C6 assay along with two levels of sample pools for precision testing. Evaluation was based on the agreement of the C6 assay results to the Western blot, concordance tables (sensitivity, specifi city), coeffi cient of variation (precision), and population percentile (reference interval).Results: The reference range for the assay was: ≤0.90 Neg; 0.91-1.09 Equivocal; ≥1.10 PosC6 Lyme Precision: (Within run/Between): Neg Pool (15.43/13.33); Pos Pool (6.48/15.21)Accuracy, Sensitivity and Specifi city
Concordance w Blot(Accuracy) Sensitivity vs. Blot Specifi city vs. Blot
WCS 0.571 100% 43%C6 Peptide 0.816 83% 81%
The result of the reference interval population study result at the 99.7th percentile was 0.57, with the cutoff for a negative result being 0.90.Conclusion: The correlation, sensitivity and specifi city studies between the two assays demonstrated that the Immunetics® C6 B.burgdorferi Lyme ELISA test had greater specifi city than the WCS assay. The use of this test would result in less patient samples being refl exed to Western blot. Other parameters demonstrated that the assay performed per the manufacturers claim.
A-237
Development of a latex-enhanced immunoturbidimetric assay for the measurement of KL-6 levels on automated clinical chemistry analyzers
C. Kaneko1, T. Yoshida1, H. Takahashi1, H. Yago1, K. Ushizawa2, J. Nishimura3. 1SEKISUI MEDICAL CO., LTD, Ryugasaki, Ibaraki Pref., Japan, 2SEKISUI MEDICAL CO., LTD, Chuo-ku, Tokyo, Japan, 3Dept. of Research & Development, EIDIA Co., LTD., Ami-machi Ibaraki Pref., Japan
KL-6 (Krebs von den Lungen-6) is a sialylated carbohydrate antigen expressed on type II pneumocytes and has a molecular weight of more than 1000kDa. Using a sandwich enzyme-linked immunosorbentassay (ELISA) kit, it has been demonstrated that measuring serum KL-6 levels is a suitable method for screening for interstitial pneumonia, as well as for monitoring the progress of the disease.We have developed a new method for measurement of serum and plasma KL-6 levels for use in clinical chemistry analyzers. The method is based on latex-enhanced immunoturbidimetry, using anti-human KL-6 mouse monoclonal antibody. The concentration is determined by measuring the change in absorbance that results from agglutination of latex particles.The reagents are supplied ready-to-use, and the assay can be completed within 10 min. Using a Roche/Hitachi 917 auto analyzer, 2.5 μL of human serum or plasma was mixed with 150 μL of the fi rst buffer solution and incubated for 5 min. at 37ºC. Then 50 μL of the second reagent, which contains the monoclonal antibody-conjugated latex particles, was added and the absorbance was monitored at 570 nm /800 nm (main/sub wavelengths) for 5 min.

Immunology Tuesday, July 30, 9:30 am – 5:00 pm
CLINICAL CHEMISTRY, Vol. 59, No. 10, Supplement, 2013 A71
The lower detection limit for KL-6 was 12 U/mL, and the upper quantitation limit was 5000 U/mL. No prozone effect was observed in KL-6 samples of concentrations from 5000 through 16000 U/mL. The within-run C.V. (n=10) at 380 U/mL, 850 U/mL, and 2100 U/mL was 0.5%, 0.7%, and 0.4%, respectively. The between-run C.V. (n=10) at 380 U/mL, 850 U/mL, and 2100 U/mL was 0.4%, 1.4%, and 1.9%, respectively. Interference studies showed no effect of bilirubin, hemoglobin, rheumatoid factor (RF), formazin turbidity at concentrations of 20 mg/dL, 500 mg/dL, 500 IU/dL, and 2000 respectively.Comparison of our assay kit with the approved IVD reagent, the principle of which is enzyme immunoassay, yielded a correlation coeffi cient of 0.981 and an equation of Y (present method) = 0.99X (the ELISA kit) - 5.88 (n = 109 serum specimens). Also, good correlation was obtained between serum and plasma (r:0.999 ; slope:0.96;intercept:-6.2).We concluded that this assay reagent provides an accurate, precise, and simple method for routine measurement of KL-6 levels in serum and plasma samples.
A-238
Activation and Regulation of TLR1, TLR2 and TLR6 of PBMC in patients with ovarian cancer
Y. Wen, S. Pan, J. Xu, B. Gu, M. Zhang, W. Zhao, Y. Jiang, L. Huang, R. Sun, F. Wang. the First Affi liated Hospital of Nanjing Medical University, Nanjing, China
Background: Recent studies implicated infl ammation in the initiation and progression of cancer, though the potential mechanisms of this effect were still not clear. The Toll-like receptors (TLRs), and their intracellular pathway were not only associated with the infl ammatory process, but also key regulators in cancer progression. The abnormal expression of TLRs could promote chronic infl ammation and cancer cells survival in the tumor microenvironment. We hypothesized that cancer cells could affect the infl ammatory microenvironment providing further support for cancer progression, which may be mediated by abnormal TLRs expression in infi ltrating immune cells.Methods: We analyzed TLR1-9 mRNA expression of human peripheral blood mononuclear cells (PBMCs) using quantitative real-time PCR. Assessment of expression levels for TLR1, TLR2 and TLR6 in PBMCs by fl ow cytometry. Cytokine bead array kit was used to quantitatively measure cytokine in the culture supernatant collected from cells treated with TLR1, TLR2 or TLR6 ligands. Furthermore, PBMC, SK-OV-3 co-culture system and anti-TLR1, anti-TLR2, anti-TLR6 mAb blocking experiment were used to explore the relationship between TLR1, TLR2 or TLR6 signaling and infl ammation in ovarian cancer. MyD88, TRAF6, TANK, NF-κB and P-NFκB were observed by western blot.Results: Here we sought to characterize the expression profi le of TLRs in PBMCs from ovarian cancer patients, benign disease controls and healthy normal controls. TLR1~9 were all expressed in PBMCs from the three groups, and the expression levels of TLR2, TLR6 mRNA in patients with ovarian cancer were higher than the healthy controls. Ovarian cancer patients aslo showed increased TLR2 levels compared to benign diseases group. We found that protein expression of TLR1, TLR2, and TLR6 were elevated in monocytes from ovarian cancer patients compared to controls subiects. In concordance with the above results, there was an observable increased induction of infl ammatory cytokine interleukin interleukin-1β(IL-1β) and tumour-necrosis factor-a (TNF-α) from PBMCs upon differential stimulation by Pam3CSK4 (TLR1/2 ligand), HKLM (TLR2 ligand) and FSL-1 (TLR6 ligand) in ovarian cancer patients compared to control subjects. In the PBMCs and SK-OV-3 co-culture system, we found the activation of TLRs signaling pathways, including MyD88, TRAF6, TANK, NF-κB and P-NF-κB in PBMCs, and production of IL-1β, interleukin-6 (IL-6) and TNF-a. Treatment of PBMCs with anti-TLR1, anti-TLR2 or -TLR6 mAb could inhibite infl ammatory cytokine production and activation of MyD88, TRAF6, TANK, NF-γB and P-NF-γB.Conclusion: We provided new evidence that links TLR1, TLR2 and TLR6 signaling to infl ammation in ovarian cancer. These results explained how advanced cancer cells usurp components of the host innate immune system, to generate an infl ammatory microenvironment hospitable for metastatic malignancy growth.
A-239
Antinuclear antibodies screening: evaluation of the diagnostic accuracy of indirect immunofl uorescence, ELISA and chemiluminescence immunoassays considering the clinical diagnosis as the gold-standard.
F. A. Brito1, S. M. E. Santos2, G. A. Ferreira2, W. Pedrosa1, J. Gradisse1, L. C. Costa1, S. P. F. Neves2. 1Hermes Pardini, Belo Horizonte, Brazil, 2Universidade Federal de Minas Gerais, Belo Horizonte, Brazil
Background: Detection of antinuclear antibodies (ANA) plays an important role in the diagnosis of systemic autoimmune rheumatic diseases (ARD). Different methods such as indirect immunofl uorescence assay on HEp-2 cells (IFA HEp-2), ELISA, chemiluminescence and multiplex bead-based immunoassays (MBI) can be used for ANA screening. Recently the American College of Rheumatology issued a position statement emphasizing that IFA HEp-2 should remain as the gold standard for ANA screening and that clinical laboratories using ELISA or MBI must guarantee that these assays present similar or improved sensibility and specifi city as IFA HEp-2.Methods: In this study we evaluated the diagnostic accuracy of three commercially available ELISA kits (ORGENTEC ANA Detect, QUANTA Lite ANA Elisa, IMTEC ANA Screen) and one chemiluminescent assay (LIAISON ANA Screen) for ANA detection. Clinical diagnostic was considered the gold-standard. We evaluated 143 patients with established diagnosis of ARD (G1), 166 patients with infectious diseases and other rheumatic diseases for which ANA test is not useful in diagnosis (G2), 89 outpatients with suspicion of ARD (G3) and 134 healthy subjects (G4). All assays were performed as recommended by the manufactures, except that indeterminate results were considered positive. Samples were classifi ed as IFA HEp-2 positive if a well-defi ned IFA pattern was identifi ed at 1:80 dilution by two observers.Results: The sensitivity, calculated in G1, was 87.4% for IFA HEp-2 and varied between 62.9% and 90.0% for other tests. The specifi city, calculated in G2, was 72.3% for IFA HEp-2 and varied between 45.2% and 90.4% for other tests.The agreement of the tests with the IFA HEp-2 ranged from regular to moderate (kappa 0,395 to 0,581). No signifi cant differences in areas under the ROC curve (0,895 for IFA and 0,807 and 0,897 for other tests) were found among the different assays. The diagnostic odds ratio was 18.5 for IFA HEp-2, and varied from 9.8 and 31.0 for other tests. Of 18 IFA HEp-2 negative samples in G1, from 66.7% to 77.8% were positive in the most sensitive ELISA. Moreover, the antibody concentrations of these samples were associated with positive likelihood ratios > 5 for ARD. The frequency of positive results of IFAH Ep-2 in G4 was 13.5%, and 6.0% to 36.0% for other tests. The sensitivity and specifi city of IFA HEp-2 in G3 was 92.0% and 57.8%, while for other tests ranged between 76.0% and 100% and 26.6% and 89.1%, respectively. The negative predictive value was 92.5% for IFA and varied between 89.3% and 100% for other tests.Conclusion: Some ELISA kits have comparable or superior diagnostic sensitivity to IFA HEp-2 and could be used as an alternative method for ANA screening, especially for large-scale ANA testing general laboratories in which the majority of ANA results are negative, therefore allowing the immediate report of the results with fewer false negatives than IFA HEp-2. Owing to the lower specifi city, ELISA positive samples should be submitted to IFA HEp-2 for confi rmation of results, determination of the title and the fl uorescence pattern.
A-240
Analytical and Clinical Comparison of Two Fully Automated Immunoassay Systems for the Diagnosis of Celiac Disease
G. Lakos1, G. L. Norman1, P. Martis1, D. Santora2, A. Fasano3. 1INOVA Diagnostics, Inc., San Diego, CA, 2University of Maryland, Baltimore, MD, 3Center for Celiac Research, Massachusetts Hospital for Children, Boston, MA
Background: QUANTA-Flash® h-tTG IgA and IgG, and DGP IgA and IgG are new, fully automated, microparticle chemiluminescent immunoassays (INOVA Diagnostics, Inc.) for the measurement of celiac disease (CD) antibodies. The EliA™ Celikey® tTG IgA and IgG, and DGP IgA and IgG assays are single well based, automated fl uoro- enzyme immunoassays from Thermo Fisher Scientifi c (formerly Phadia). Our goal was to assess and compare some of the analytical and clinical performance characteristics of the two automated systems.Methods: A total of 229 samples were tested in the study. After excluding CD patients on gluten-free diet and samples with insuffi cient quantity to run all tests, the cohort

Tuesday, July 30, 9:30 am – 5:00 pm Immunology
A72 CLINICAL CHEMISTRY, Vol. 59, No. 10, Supplement, 2013
included 75 biopsy-proven CD patients (2 with selective IgA defi ciency), and 139 controls, including age and sex matched healthy controls, and patients with food allergy, infl ammatory bowel disease and rheumatoid arthritis.Results: Clinical sensitivity and specifi city of the individual antibody assays were the following (* equivocal considered positive; ** equivocal considered negative):Assay Sensitivity, % Specifi city,%QUANTAFlash h-tTG IgA 93.2 99.3EliACelikey tTG IgA* 93.2 99.3EliACelikey tTG IgA** 78.1 99.3QUANTAFlash h-tTG IgG 33.3 99.3EliACelikey tTG IgG* 36.0 100.0EliACelikey tTG IgG** 28.0 100.0QUANTAFlash DGP IgA 72.6 98.6EliACelikey DGP IgA* 63.0 97.1EliACelikey DGP IgG** 54.8 97.1QUANTAFlash DGP IgG 74.7 96.4EliACelikey DGP IgG* 72.0 97.8EliACelikey DGP IgG** 57.3 97.8Eight tTGIgA result were above the analytical measuring range (AMR) with the Celikey assay, and three with QUANTA Flash. Auto-rerun of samples with results above the AMR is automatic with the QUANTA Flash assay, but manual dilution and second run is required with the Celikey for accurate quantitation. Thirty-four (50.0%) out of the 68 tTG IgA positive results with the QUANTA Flash assay were higher then 10 times of the upper limit on normal (ULN) that is the suggested threshold according the new ESPGHAN Guideleines for potentially avoiding biopsy for the diagnosis. Only 13 out of the 57 positive Celikey tTG IgA results (22.8%) were higher then 10 times of the ULN. Seventy-four (98.7%) out of all biopsy-proven CD patients were correctly identifi ed with the QUANTA Flash tTG IgA + DGP IgG combination, while 65 (86.7%) and 71 (94.7%) (depending on how equivocals are considered) were identifi ed with the same combination of Celikey assays.Conclusions: The wider AMR and higher resolution of results make the QUANTA Flash test analytically more useful for accurate quantitation of tTG IgA antibodies than its Celikey counterpart. All QUANTA Flash CD assays showed same or superior diagnostic performance compared to the EliA Celikey assays.
A-241
Risk factors for bone loss after renal transplantation
L. Luo1, Y. shi2, B. Cai1, Y. Bai1, Y. Zou1, L. wang1. 1Department of Clinical Immunological Laboratory, West China Hospital, Sichuan University, chengdu, China, 2Department of Nephrology, West China Hospital, Sichuan University, chengdu, China
Background: Bone loss is a common clinical problem after renal transplantation. In light of greatly improved long-term patient and graft survival, improving other clinical outcomes after renal transplantation such as risk of fracture is of paramount importance. However, the parameters influencing bone health in Chinese patients have not been well defined in its pathogenesis. So this study was performed to investigate the prevalence and risk factors of bone loss in renal transplant recipients.
Methods: Dual-energy X-ray absorptiometry (DEXA) was performed to measure BMD. All patients were divided into two groups according to BMD results: group 1 with normal bone mineral density (T score above -1.5), group 2 with low bone mineral density (T score below -1.5). Clinical information such as sex, age, types of immunosuppressive drug and time since transplantation were included. Laboratory tests for parameters included serum blood urea nitrogen(BUN),creatinine(CREA),uric acid(URIC),calcium(Ca),phosphorus(PO4),parathyroid hormone(PTH),25-hydroxy vitamin D(25-OHVD),bone-specific alkaline phosphatase (b-ALP), tartrate-resistant acid phosphatase-5b (TRAP-5b) levels and the concentration of tacrolimus. Statistical analyses were performed using non-conditional logistic regression analysis to assess the effects of the different parameters to fi nd possible risk factors and main factors. This study included a total of one hundred and twenty-four recipients who underwent living-related donor kidney transplantation between 2007 and 2011 at West China Hospital of Sichuan University. All patients received a triple immunosuppressive therapy consisting of steroids plus tacrolimus plus Mycophenolate Mofetil. The exclusion criteria were as follows: age<18 years, thyroid or parathyroid disorders, postmenopausal women, diabetes mellitus, gastrointestinal disease, and other diseases that affect bone mass(Cushing’s syndrome, acromegaly). To avoid the well-described effects of the initial using of high-dose steroid on bone metabolism, only patients whose time since transplantation more than 5 months were include.Results: Of 124 patients, 14.5% had low bone mass in Lumbar vertebrae L1-L4. Non-conditional logistic regression analysis revealed that BMI seemed to be preventative for bone loss after transplantation(P=0.029,OR=0.591,95%CI=0.369~0.947). 31.5% had bone loss in the neck of the femur, and low BMI, high CysC seemed to be the risk factors in this part of skeleton(CysC: P=0.007,OR=25.127,95%CI=2.403~262.776;BMI:P=0.012,OR=0.736,95%CI=0.580~0.935).Conclusion: Disturbances in bone metabolism are common complications after renal transplantation, which requires detection and treatment to reduce fracture incidence. Low BMI and high CysC were found to be main risk factors in our study.
A-242
Whole blood cytokine profi les for improved diagnosis of tuberculosis and discrimination between active and latent tuberculosis
S. P. Suh1, O. Lee1, J. Choi1, E. Won1, M. Jang1, H. Choi1, S. Kee1, M. Shin1, J. Shin1, B. Park2, D. Ryang1. 1Department of Laboratory Medicine, Chonnam National University Medical School, Gwangju, Korea, Republic of, 2Mokpo National University, Muan, Korea, Republic of
Background: Interferon gamma release assay (IGRA) cannot discriminate between active and latent tuberculosis (TB). In addition, IGRA show relatively low sensitivity in patients with active TB. To determine if cytokine profi les could discriminate between active and latent TB, and improve the detection of TB.Methods: Twenty-nine cytokines were measured by multiplex microbead-based immunoassay in supernatant of QuantiFERON-TB Gold-In Tube (QFT) assay tubes (Cellestis, Australia) obtained from subjects with QFT-negative healthy household contacts (n=13), QFT-positive healthy household contacts (latent TB infection: LTBI, n=15), culture confi rmed QFT-negative pulmonary TB (n=12), and culture confi rmed QFT-positive pulmonary TB (n=36). Cytokine[Nil] and cytokine[Ag-Nil] represent the cytokine concentration in a nil tube and the cytokine concentration in a TB antigen tube minus the cytokine concentration in a nil tube, respectively.Results: Among 29 cytokines, levels of IFN-γ[Ag-Nil], IL-2[Ag-Nil], IL-1Ra[Ag-Nil], IP-10[Ag-Nil], GM-CSF[Ag-Nil], IL-3[Ag-Nil], IL-13[Ag-Nil], and MIP-1β[Ag-Nil] in Mycobacterium tuberculosis (Mtb)-infected subjects were signifi cantly different from uninfected subjects. Combination of these cytokines detected 8 of 12 IGRA-negative TB subjects. Moreover, levels of EGF[Ag-Nil], GM-CSF[Ag-Nil], IL-5[Ag-Nil], IL-10[Ag-Nil], MIP-1β[Ag-Nil], VEGF[Ag-Nil], TNF-α[Nil], and VEGF[Nil] showed signifi cant differences between active and latent TB. Sensitvity, specifi city, positive predictive value, and negative predictive value of hierachial cluster analysis using infection cytokine profi les between Mtb-infected and uninfected subjects are 93.7%, 100%, 100%, and 76.5%, respectively. Sensitvity, specifi city, positive predictive value, and negative predictive value of hierachial cluster analysis using activity cytokine profi les between active TB and LTBI are 81.2%, 65.2%, 100%, and 65.2%, respectively.Conclusion: Whole blood cytokine profi les provide distinct signatures for differentiation of active TB from LTBI and increasing the detection of IGRA-negative active TB.

Immunology Tuesday, July 30, 9:30 am – 5:00 pm
CLINICAL CHEMISTRY, Vol. 59, No. 10, Supplement, 2013 A73
A-243
Performance characteristics of an anti-PCP IgA and an anti-PCP IgM ELISA
J. Harley, C. Budd, E. Harley, R. Budd. The Binding Site Ltd, Birmingham, United Kingdom
Objective: To investigate performance characteristics of the VaccZymeTM anti-PCP IgA and anti-PCP IgM EIA.Background: Vaccine response is a useful method of assessing functional immunoglobulin production. Measurement of specifi c anti-pneumococcal capsular polysaccharide IgG antibodies, following pneumococcal vaccination, has been used to aid diagnosis in cases of immunodefi ciency. Measurement of anti-PCP IgA and IgM antibody may provide additional information.Method: Anti-PCP IgA and IgM antibodies were determined using the VaccZyme™ Anti-PCP IgA EIA and IgM EIA kits (The Binding Site, UK). The concentration was assessed in 145 serum samples post pneumococcal vaccine immunisation. Precision testing was completed on three kit lots; intra-assay reproducibility was determined on six samples (20 replicates) and inter-assay precision was tested on eight samples in duplicate, on six separate occasions. Linearity was demonstrated on all three kit lots using a pool of high titre sera.Results: The incidence of anti-PCP IgA and anti-PCP IgM antibodies in 145 normal blood donors was shown to not follow a normal distribution (Anderson Darling A2 p<0.0001) with a 95% confi dence interval of 24.6 - 42.1 and 38.9 - 56.8 U/ml respectively.
Performance Characteristics Anti-PCP IgA U/mL Anti-PCP IgM U/mLIntra-assay reproducibility (%CV) n=20 1.8 - 6.3 2.2 - 11.6Inter-assay reproducibility (%CV) n=18 7.7 -13.3 7.0 - 11.5Linearity R2 Lot 1 0.9936 0.9971Linearity R2 Lot 2 0.9909 0.9886Linearity R2 Lot 3 0.9832 0.9910Linearity mean % recovery Lot 1 105.1% 89.9%Linearity mean % recovery Lot 2 98.0% 93.1%Linearity mean % recovery Lot 3 101.7% 95.1%Conclusion: The normal range in this non-immune defi cient study group suggests a wide response for IgA and IgM anti-PCP immunoglobulin. The VaccZymeTM anti-PCP IgA and IgM assays demonstrate good linearity and reproducibility. By testing pre and post-immunisation sera these assays may be of value in the assessment of individuals suspected of having an immunodefi ciency.
A-244
Profi ling neutrophil gelatinase-associated lipocalin (NGAL) and other biomarkers in suspected systemic lupus erythematosus patients
S. L. La’ulu1, B. B. Suh-Lailam2, K. W. Davis3, A. R. Wilson1, J. A. Straseski2, A. E. Tebo2. 1ARUP Institute for Clinical and Experimental Pathology, Salt Lake City, UT, 2Department of Pathology, University of Utah, Salt Lake City, UT, 3ARUP Laboratories, Salt Lake City, UT
Background: Lupus nephritis is a major complication in systemic lupus erythematosus (SLE) patients, with signifi cant morbidity and mortality rates. The lack of available specifi city and sensitivity estimates of current laboratory tools for determining renal exacerbations has led to the search for alternative biomarkers that may contribute to nephritis and help predict kidney failure. The objective of this study was to investigate the positive prevalence and correlation between neutrophil gelatinase-associated lipocalin (NGAL) and other biomarkers associated with lupus nephritis in a cohort of suspected SLE (sSLE) patients.Methods: Patient samples selected for evaluation had positive anti-dsDNA antibodies result by ELISA (Aesku Diagnostics) and titers ≥1:10 by Crithidia luciliae immunofl uorescence test (CLIFT, INOVA Diagnostics). High avidity dsDNA IgG antibodies (ELISA, INOVA Diagnostics), anti-C1q IgG antibodies (ELISA, INOVA Diagnostics), serum creatinine (Roche Diagnostics Modular P), as well as serum and urine NGAL (BioPorto Diagnostics on the Roche cobas c501) were determined in parallel. For these investigations, paired serum and urine samples from 71 sSLE patients (13-60 years of age; 52 female, 19 male) and 50 healthy adult controls (22-64 years of age; 33 female, 17 male) were evaluated.Results: Comparison of sSLE to healthy controls showed signifi cant differences for all markers evaluated (p values ≤ 0.005 by unpaired t-test). Elevated NGAL concentrations (>175 and >112 ng/mL for serum and urine, respectively) were found in 39% (range 6-2455 ng/mL) and 42% (range 2-1900 ng/mL) of sSLE patients compared to 4% (range 28-401 ng/mL) and 4% (range 1-211 ng/mL) in healthy
controls for serum and urine, respectively. For the sSLE group, the prevalence of elevated NGAL concentrations was comparable to serum creatinine (39%) and anti-C1q antibodies (35%); whereas high avidity dsDNA antibodies had a higher positive prevalence (55%) than NGAL. Additionally, the only signifi cant association observed between NGAL and the other markers evaluated was for serum creatinine (Pearson correlation coeffi cient of 0.627 and 0.658 for serum and urine NGAL, respectively). The overall combined concordance for all markers determined by Cronbach Alpha Coeffi cient was 0.615. This value was reduced when NGAL was removed from the combined concordance analysis (0.423 and 0.513 for serum and urine, respectively).Conclusions: Positive prevalence of elevated NGAL in sSLE patients was comparable to the positivity rate of other markers associated with renal involvement in SLE, except for the high avidity dsDNA antibodies. The inclusion of NGAL thus contributes to the overall combined concordance of SLE renal markers evaluated. These fi ndings suggest the usefulness of including NGAL, in conjunction with other biomarkers, for the evaluation and/or management of SLE.
A-245
Infl uence of temperature on the stability of various food and inhalant allergen sIgE antibodies
O. R. Maries, K. Rodriguez Capote, K. Schanbl. University of Alberta, Edmonton, AB, Canada
Background: Specimen stability is a crucial factor for samples that require extended transportation time or storage for add-on test requests.Objective: To determine the optimum storage temperature for serum specifi c IgE antibodies to common food and inhalant allergens over 15 days.Methods: Patient sera with allergen specifi c IgE concentrations ≥ 0.35kU/L were pooled. Pools were chosen to limit cross-reactivity amongst antigens accordingly: pool 1-peanut and hazelnut, pool 2- egg, milk and cod fi sh, pool 3 -soy, wheat and shrimp and pool 4- D. farinae dust mite, dog dander, timothy grass, silver birch and cat dander. Aliquots stored at -20°C, 4°C and 25°C were tested in duplicate on the ImmunoCAP® 250 with 2 levels of control material on day 1, 3, 6, 8, 11, 13 and 15. The absolute change value after storage was calculated for each specifi c sIgE as a percentage of the initial value. A 15% difference was chosen to account for assay variability and bias based on literature values.Results: Peanut, hazelnut, egg, cod fi sh, D. farinae, dog, silver birch and cat specifi c IgE antibodies were stable across all temperatures (Fig. 1). Soy, wheat and shrimp were most stable at 4°C, whereas milk and timothy grass were most stable at -20°C (Fig. 1). Some increase in sIgE concentration was observed on day 15 suggesting evaporation of sera can be a problem with small volumes, especially at room temperature.Conclusion: Serum allergen specifi c IgE concentrations are optimally stable at 4°C for up to 15 days.
Fig. 1 Absolute percent difference in sIgE concentration between the 1st and 15th day of testing. The black column represents storage at -20°C, the grey represents storage at 4°C, and the white column represents storage at 25°C.

Tuesday, July 30, 9:30 am – 5:00 pm Immunology
A74 CLINICAL CHEMISTRY, Vol. 59, No. 10, Supplement, 2013
A-246
Incidence of antinuclear antibodies in patients treated with TNF-inhibitors
W. Klotz, J. Eibl, M. Herold. Innsbruck Medical University, Innsbruck, Austria
Background: Since 1990 TNF-inhibitors have been used to treat infl ammatory rheumatic diseases like rheumatoid arthritis (RA), spondyloarthritis (SpA) and psoriatic arthritis (PsA). Induction of antinuclear antibodies (ANAs) during treatment with TNF-inhibitors was known from the very beginning (Charles PJ et al. Arthritis Rheum 2000;43:2383-90), in some cases induction of drug induced lupus was seen (Williams EL et al. Rheumatology 2009;48:716-20). ANA screening prior to and during anti-TNF therapy has been recommended. We evaluated the number of patients who induced ANA during treatment with different TNF-inhibitors.Methods: In this retrospective case-control-study 124 patients were selected, all of whom had received anti-TNF-therapy for at least 6 months. ANA titers were measured by indirect immunofl uorescence using HEp-2 cells. Patients were included with a clinical diagnosis of RA (n=87), SpA (n=28) and PsA (n=8).Results: 24 patients were found with ANA titers >1:100 before anti-TNF treatment was started and were excluded from further testing. This occurred primarily in patients diagnosed with RA (n=22) and one patient each in PsA and SpA. Among the remaining 100 patients, 33 showed a rise in ANA titer (either from negative to titer >1:100 or at least two titer steps) during anti-TNF treatment, 20 of them diagnosed with RA (23.0%), 3 with PsA (37.5%) and 10 with SpA (35.7%). HEp-2 patterns were classifi ed as homogenous (n=21, 63.6%), mixed homogenous & fi ne speckled (n=8, 24.2%), fi ne speckled (n=3, 9.1%) and nucleolar (n=1, 3.0%). Median time between start of treatment and occurrence of ANA titers was 33 weeks with a minimum of 4 and a maximum of 308 weeks. All TNF-inhibitors available in Austria were used (Adalimumab, n=43; Etanercept, n=32; Infl ixmab, n=31; Golimumab, n=8; Certolizumab, n=1), some patients received two or even 3 TNF-inhibitors sequentially. ANA were induced in 16 patients treated with Infl iximab (51.6 %), 13 with Adalimumab (30.2 %), two with Etanercept (6.3 %), one with Golimumab (12.5 %) and the single patient treated with Certolizumab. Additionally, one patient examined developed positive ANA titers during treatment with Anakinra, an IL-1 receptor antagonist, who retained positive ANA titers after switching to an anti-TNF treatment. In 13 times patients with positive ANA titers were switched to another anti-rheumatic biological drug, 10 times of which the p atients retained ANA titers. One patient showed decreasing titers after changing the drug, but increased again after some time, and two patients showed decreasing ANA titers.Conclusion: Incidence and increase of ANA titers during anti-TNF treatment is similar in patients with different diagnoses, but seems to differ among different types of TNF-inhibitors with the lowest rate under treatment with etanercept, a TNF receptor, compared to drugs based on monoclonal anti-TNF antibodies.
A-247
Role of Antiphospholipid Score and Anti-β2-glycoprotein I Domain I autoantibodies in the Antiphospholipid Syndrome diagnosis.
R. Mondéjar-García1, C. González-Rodríguez1, F. J. Toyos-Sáenz de Miera1, E. Melguizo-Madrid1, M. Mahler2, I. Romero Losquiño1, F. Fabiani1. 1Virgen Macarena University Hospital, Seville, Spain, 2Innova Diagnostics Inc., San Diego, CA
Background: Antiphospholipid Syndrome (APS) is characterized by the presence of circulating antiphospholipid antibodies (aPL) in patients with thrombosis or pregnancy morbidity. Recently it has been shown that multiple positive results defi ne a higher risk of clinical manifestation in APS patients. However, utilizing combined results generate challenges for physician. Therefore, the Antiphospholipid Score (APL-S), a new variable that encompasses all aPL assays, has been described. We analyze clinical performance of different APL-S based on ELISA or chemiluminescent (CIA) immunoassays.Methods: A total of 87 patients (27 primary APS; 12 secondary APS, 30 early onset rheumatoid arthritis; and 18 with other rheumatological diseases) and 30 healthy control were included in this study. All patients were tested for Lupus Anticoagulant (LAC). In addition, IgM/IgG anticardiolipin (aCL) and anti-β2-glycoprotein I autoantibodies (aβ2GPI) were tested by QUANTA Lite ELISA and QUANTA Flash CIA (QUANTA Lite®, INOVA Diagnostics). Anti-aβ2GPI Domain 1 (D1) antibodies were tested by QUANTA Flash CIA. Three aPL-S were calculated (ELISA, CIA and
with D1 instead of β2GPI) using the Otomo equation: aPL-S=5 x exp([OR]-5)/4. The upper limit of each aPL-S was determined as 20. Statistical analysis was performed with SPSS v15 for Windows.Results: IgG assays showed a good (aCL: rho=0.611, kappa=0.662; B2GPI: rho=0.604, kappa=0.643) while IgM assays showed moderate correlation (aCL: rho=0.595, kappa=0.482; B2GPI: rho=0.684, kappa=0.402). The relative risk of having clinical manifestation of APS (approximated by odds ratios [OR]) was calculated for each aPL test. The ORs for clinical manifestations of APS for aβ2GPI IgG and aβ2GPI-D1 by CIA were 9.1 (95% confi dence interval [95% CI] 3.0-27.5) and 17.4 (95% CI 3.4-89.5), respectively. All three aPL-S were higher in individuals with thrombosis or pregnancy morbidity than in those without APS manifestations (p<0.001) and the prevalence of APS manifestations increased with increasing aPL-S. AUC for ELISA, CIA, and CIA with aβ2GPI -D1 aPL-S were 0,893(95% CI 0,829-0,958), 0,846 (95% CI 0,742-0,950) and 0,852(95% CI 0,749-0,956), respectively.Conclusion: The CIAs are comparable with the ELISAs for the detection of aPL antibodies. aβ2GPI-D1 antibodies seem to be represent a strong indicator for clinical manifestations of APS. Any of aPL-S studied represents a useful quantitative index for APS diagnosis and could be helpful to physician to manage APS.
A-248
Evaluation of a novel IgA assay for use on the Binding Site Next Generation Protein Analyser
J. K. Robinson, A. J. Alvi, M. Solanki, S. J. Harding, P. J. Showell. The Binding Site Ltd., Birmingham, United Kingdom
IgA is the major class of antibody in human secretions. Levels below the normal range can be indicative of immunodefi ciency, whereas levels exceeding the upper limit of the normal range can be associated with infection or rarely B cell disorders. Here we present the performance characteristics of a new immunoassay designed for the quantifi cation of IgA in human serum using the Next Generation Protein Analyser. The instrument is a random-access bench top turbidimetric analyser capable of a wide range of on-board sample dilutions (up to 1/10,000) and throughput of up to 120 tests per hour. Precision is promoted by single-use cuvettes which are automatically loaded and disposed. The instrument automatically diluted a single calibrator to produce a calibration curve with a measuring range of 0.20 - 7.0 g/L at the standard, 1/10 sample dilution, with a sensitivity of 0.020 g/L with a 1/1 sample dilution. Linearity of the assay was established by running a serially-diluted patient sample across the width of the standard measuring range and comparing the observed and expected results. Acceptable linearity was demonstrated over a range of 0.21 to 8.71 g/L with a linear regression equation of y = 0.9908x - 0.0077, (R2 = 0.9981). The assay was evaluated for intra-run precision by measurement of twenty replicates of two separate sample pools on a single calibration curve; sample 1, 0.669g/L, CV = 1.04%, sample 2, 3.829g/L, CV = 1.24%. Interference was tested by addition of known concentrations of bilirubin (200mg/L), chyle (1500 formazine turbidity units), haemoglobin (5000mg/L) or rheumatoid factor (800 IU/mL) to serum samples with known IgA concentrations. No signifi cant interference (within 10%) was observed. Finally, a comparison study was performed between this assay and the IgA assay for use on the Binding Site SPA PLUS. Comparison with the SPA PLUS assay for 26 serum (median, range g/L) yielded a Passing & Bablok regression equation of y = 0.9638x + 0.0965 The results presented above allow us to conclude that the IgA assay for the Binding Site Next Generation Analyser is reliable, precise and accurate and shows good agreement with existing assays.
A-249
Evaluation of a C1 Inactivator assay on The Binding Site Next Generation Protein Analyser
S. K. I. Silvera, A. Kaur, S. J. Harding, P. J. Showell. The Binding Site Ltd, Birmingham, United Kingdom
C1 Inactivator is an important regulator of the classical complement pathway. Measurement of C1 Inactivator is routinely used to aid in the diagnosis of hereditary and acquired angioedema, defi cient levels of C1 Inactivator are found in type I Hereditary Angioedema and elevated levels in type II. Here we evaluate the use of a C1 Inactivator assay on the Binding Site’s next generation protein analyser. The instrument is a random-access bench top turbidimetric analyser capable of a wide range of on-board sample dilutions (up to 1/10,000) and throughput of up to 120 tests per hour. Precision is promoted by single-use cuvettes which are automatically loaded and disposed of. The instrument is programmed to automatically construct calibration

Immunology Tuesday, July 30, 9:30 am – 5:00 pm
CLINICAL CHEMISTRY, Vol. 59, No. 10, Supplement, 2013 A75
curves from a single serum based calibrator fl uid producing a measuring range of 0.06 - 0.4 g/L at the standard 1/5 sample dilution, with a sensitivity of 0.06g/L. High samples are re-measured at a dilution of 1/10 with an upper measuring range of 0.12 - 0.8 g/L. Intra-run precision was assessed by measurement of ten replicates of samples at 0.108g/L (0.85% CV) and 0.343g/L (0.59% CV). Furthermore, precision was assessed at the clinically relevant decision point of 0.169g/L (0.98%). Linearity was assessed by assaying a serially-diluted patient sample pool across the width of the measuring range and comparing expected versus observed results. The assay was shown to be linear over the range of 0.068 - 0.338g/L; y = 0.9526x + 0.01795 (R2 = 0.9961). Correlation to the Binding Site C1 Inactivator assay for the SPA PLUS was performed using 28 samples (range 0.081 - 0.406g/L). Good agreement was demonstrated when the data was analysed by Passing-Bablok regression; y=0.94x + 0.01. We conclude that the C1 Inactivator assay for the Binding Site next generation protein analyser is reliable, accurate and precise and shows good agreement with existing assays.
A-250
Evaluation of a Beta-2-Microglobulin assay for use on the Binding Site Next Generation Protein Analyser
C. N. Rowe, D. J. Matters, F. Murphy, S. J. Harding, P. J. Showell. The Binding Site Ltd, Birmingham, United Kingdom
Beta-2-microglobulin (B2M) is a low molecular weight protein that is routinely measured in serum in the assessment of patients with renal disease, rheumatoid arthritis and multiple myeloma and in urine as a marker of tubular-interstitial disorder. Here we evaluate the performance of a B2M assay for use on the Binding Site’s next generation protein analyser. The instrument is a random-access bench top turbidimetric analyser capable of a wide range of on-board sample dilutions (up to 1/10,000) and throughput of up to 120 tests per hour. Precision is promoted by single-use cuvettes which are automatically loaded and disposed of. Assay time was 12 minutes to fi rst result, and the results were measured at end point. The instrument automatically diluted a single serum based calibrator to produce a measuring range from 0.312mg/L – 40mg/L when using a 1/20 on board sample dilution. Samples reporting outside of the measuring range were automatically remeasured at dilutions of 1/10 and 1/40 as appropriate. Intra assay precision was assessed by measuring twenty replicates on a single calibration curve at serum samples with concentrations of 1.21mg/L (2.8% CV) and 20.57mg/L (1.2% CV). To assess linearity, serum sample was serially diluted over a measuring range of 2.27mg/L – 23.0mg/L and observed results were compared to expected values. Acceptable linearity was observed when results were analysed by linear regression; y=0.9832x + 0.2404, R2=0.999. Interference was tested by spiking haemoglobin (5000mg/L), bilirubin (200mg/L) and chyle (1500 FTU) into a serum sample containing 2.1mg/L B2M which was analysed at a dilution of 1/10, with no signifi cant interference (within ±10%) being observed. Finally, comparison to the Binding Site SPA PLUS B2M assay was performed by running 25 serum samples with a range of 0.89-36.1mg/L. There was good agreement when the data was analysed by linear regression analysis; y=1.0708x – 0.0825, R2=0.9968. We conclude that the B2M assay for the Binding Site next generation protein analyser is reliable, accurate and precise and shows good agreement with existing assays.
A-251
Evaluation of a Prealbumin assay for use on the Binding Site’s Next Generation Protein Analyser
S. Kausar, F. Murphy, S. J. Harding, P. J. Showell. The Binding Site Ltd, Birmingham, United Kingdom
Prealbumin is a 50kDa glycoprotein, which is routinely measured to assess nutritional status in critically ill patients. Here we describe the development of a prealbumin assay for use in serum on the Binding Site’s next generation protein analyser. The instrument is a random-access bench top turbidimetric analyser capable of a wide range of on-board sample dilutions (up to 1/10,000) and throughput of up to 120 tests per hour. Precision is promoted by single-use cuvettes which are automatically loaded and disposed of The instrument automatically dilutes a single calibrator fl uid to produce a measuring range of 0.06 - 0.66 g/L at the initial 1/10 sample dilution. Low samples are re-measured at a dilution of 1/1, producing a sensitivity of 0.006g/L. The assay is read at end point with an assay time of 12mins. Acceptable intra-assay precision produced analysing serum samples at concentrations of 0.11 (2.4% CV) and 0.49g/L (1.2% CV) twenty times against a single calibration curve. No signifi cant interference (within ±10%) was observed upon addition of bilirubin (200mg/L), haemoglobin
(5000mg/L) or chyle (1500 FTU = formazine turbidity units) to samples with 0.045 g/L prealbumin concentrations, measured at a 1/1 dilution. Linearity was assessed by serially diluting a normal serum sample across the width of the calibration curve and comparing observed results with expected values. The assay showed acceptable linearity by linear regression; y = 0.9864x + 0.0002 g/L, R2 = 0.9971. Comparison was made to the Binding Site prealbumin assay for the SPA PLUS by measuring 26 samples from 10 normal (range 0.2-0.426g/L) and 16 clinical patients (range 0.042-0.196g/L). Good agreement was demonstrated by Passing and Bablok regression: y = 0.9642x + 0.006 g/L, R2 = 0.9965. We conclude that the prealbumin assay for the Binding Site next generation protein analyser is accurate, rapid and precise and may be of use in laboratories where a large instrument may not be appropriate.
A-252
Evaluation of an Albumin assay for use on the Binding Site Next Generation Protein Analyser
H. Johnson, F. Murphy, H. J. Sharrod-Cole, S. J. Harding, P. J. Showell. The Binding Site Ltd., Birmingham, United Kingdom
Albumin measurement is routinely performed for the diagnosis of kidney and liver disease and for use in staging multiple myeloma patients. Here we describe the evaluation of a serum albumin assay for the Binding Site’s next generation protein analyser. The instrument is a random-access bench top turbidimetric analyser capable of a wide range of on-board sample dilutions (up to 1/10,000) and throughput of up to 120 tests per hour. Precision is promoted by single-use cuvettes which are automatically loaded and disposed of. The assay is programmed to automatically create a 5-point calibration curve from a single serum based calibrator. The main assay characteristics are summarised in the table below:
Assay SerumInitial sample dilution 1/70Initial range 3.1-93.17g/LMaximum sample dilution 1/121Maximum range 5.4-161.05g/LSensitivity 3.105g/LAssay time (mins) 10.5Acceptable intra-assay precision was observed when analysing known serum samples of 3.6 (1.6% CV) and 89.3g/L (2.2% CV) twenty times against a single calibration curve. Linearity was assessed using a pool of normal serum samples spiked with purifi ed human albumin to a fi nal concentration of X g/L. The fl uid was serially diluted and results were compared to expected values. The assay showed acceptable linearity when results were analysed by linear regression; y=1.016x-0.9581, R2=0.999. No signifi cant interference (within ±10%) was observed when a sample of known albumin concentration was spiked with bilirubin (200mg/L), haemoglobin (5000mg/L) or Chyle (1500 FTU’s). Comparison was made to the serum albumin assay for use on the Binding Site SPAPLUS analyser by comparing 33 samples from 17 normal (range 38.8-69.0g/L) and 16 clinical patients (range 20.8-37.5g/L). Good agreement was observed when the data was analysed by linear regression analysis; y=0.959X + 2.1156, R2=0.968. We conclude that the serum albumin assay for the Binding Site next generation protein analyser is reliable, accurate and precise and shows good agreement with existing albumin assays.
A-253
Inter-batch Variation and Within Batch Precision of The Binding Site Freelite Light Chain Assays
D. J. Matters1, P. J. Showell1, S. J. Harding1, H. D. Carr-Smith2, L. J. Smith1. 1The Binding Site, Birmingham, United Kingdom, 2The Binding Site Ltd, Birmingham, United Kingdom
International guidelines for the assessment of serum free light chains are based on the Freelite assay and recommend their measurement to identify and monitor patients with B cell disorders. Since the development of these assays, multiple myeloma (MM) patient outcomes have improved dramatically, highlighting the need for reproducible tests to monitor these patients over considerable periods of time. Here we present a study comparing batch to batch variation of the Freelite assay on the Siemens BN™II and The Binding Site SPAPLUS platforms. Briefl y, for each analyser 3 consecutive batches of reagents (comprising of latex bound antisera, supplementary, calibrators and controls) were used to compare a minimum of 119 samples, of which at least 76 fell within the published normal range and at least 43 pathological samples from patients with MM, SLE or AL amyloidosis. All results were compared to the fi rst of the consecutive batches using Passing Bablok analysis performed with Analyze-It

Tuesday, July 30, 9:30 am – 5:00 pm Immunology
A76 CLINICAL CHEMISTRY, Vol. 59, No. 10, Supplement, 2013
software. Further information was provided by comparing results from healthy adults with the manufacturers 95th percentile reference normal ranges of 3.3-19.4mg/L for kappa free and 5.71-26.3mg/L for lambda free light chains using Analyse-it. Within batch precision was assessed by testing fi ve replicates of the kit low control against fi ve separate calibration curves and calculating the overall CV for all 25 results.
Kappa SPAPLUS
Kappa BNII
Lambda SPAPLUS
Lambda BNII
Batch 2 vs batch 1 regression Slope (Y=) 1.02x+0.06 0.97x-0.01 0.98x+0.00 0.96x-
0.68Number of samples 119 134 122 136
Batch 3 vs batch 1 regression Slope (Y=) 1.09x-0.03 0.94x-0.15 1.11x-0.09 0.96x-
0.80Number of samples 119 134 122 136
Precision (%CV) and assigned value (mg/L) Batch 1 3.60%
(15.3)5.26% (19.0) 1.93% (27.2) 3.74%
(30.4)Batch 2 5.30%
(14.7)5.69% (16.6) 2.91% (28.7) 4.49%
(28.5)Batch 3 2.57%
(17.9)3.11% (16.1) 1.59% (28.3) 3.56%
(26.3)Normals outside 95% range Batch 1 0.0% 1.5% 1.7% 0.0%
Batch 2 0.0% 7.7% 3.4% 0.0%Batch 3 0.0% 7.7% 0.0% 0.0%
Inter-batch agreement for the last 3 batches produced was within acceptable limits. Furthermore, reference range comparison showed that there was no signifi cant difference between the results returned. The value of the low control was within 25% of the top end of the normal range and showed good precision at this medical decision point (19.4mg/L kappa, 26.3mg/L lambda). These results confi rm the suitability of the Freelite assays for FLC measurements in identifi cation and prolonged monitoring of patients with B cell disorders across batches of reagent.
A-254
Elucidating the relationship between SPE “nephrotic” pattern and proteinuria, and its utility in the investigation of monoclonal gammopathies
H. Li1, P. Chan2. 1University of Toronto, Toronto, ON, Canada, 2Sunnybrook Health Sciences Centre & University of Toronto, Toronto, ON, Canada
Background: Serum Protein Electrophoresis (SPE) is used to detect and quantify monoclonal immunoglobulins (M-proteins). In the absence of an M-protein, certain electrophoretic patterns, such as the so-called “nephrotic” pattern, are believed to refl ect pathologic protein changes that may be related to monoclonal gammopathy, and thus are the basis for further investigations. However, vigorous validation of these patterns has been lacking. Objective: Our goal is to elucidate the relationship between SPE “nephrotic” pattern and proteinuria, and to determine its utility in detecting M-proteins. Methods: SPE was performed on the Sebia Capillarys IITM and immunofi xation electrophoresis (IFE) on the PhoresisTM systems respectively. 203 consecutive cases with an SPE “nephrotic” pattern characterized by decreased albumin ([alb] <34 g/L; RI: 34-53) and increased alpha2 fraction ([α2] >9 g/L; RI: 4-9) from the past 2 years were examined for levels of proteinuria and presence of M-proteins (confi rmed by IFE). A separate cohort of 435 patients with clinical proteinuria (>500 mg/L) was examined for specifi c SPE patterns, if any, and positive rate for M-proteins.Results: For the 203 patients with “nephrotic” pattern, 34% had normal level of proteinuria, and only 12% had nephrotic level of proteinuria (>3.5 g/day for 24-h urine or 3.5 g/L for random). Varying the criteria for this “nephrotic” pattern i.e. [alb] <30 g/L, [α2] >10, [β1] <3 g/L, and so on, did not improve the detection of neither proteinuria nor M-proteins. In the second cohort (N=435) of proteinuric patients, the mean [alb] was ~30 g/L (RI: 34-53), and [α2] and [β1] were not increased. Different levels of proteinuria gave comparable positive rates for SPE (~26-50%) and M-protein (~40-80%) although both the SPE and M-protein positive rates were higher in the 24-hr urine group than the random ones, probably due to a higher pretest odds. When different “nephrotic” pattern criteria were applied in this cohort, both SPE+ and M-protein+ rates did not change signifi cantly. However, there was a reduction in the number of SPE and M-protein positive cases detected.Conclusion: Overall, M-protein positive cases spread quite evenly and were missed by SPE equally among different levels of proteinuria including normals. The second cohort of proteinuric patients showed a higher M+ rate than the “nephrotic” pattern cohort with [alb] <34 and [a2] >9, suggesting proteinuria itself is a more important predictor of monoclonal gammopathy. No specifi c SPE pattern predicted nephrotic
level of proteinuria or improved M-protein detection. Clinical proteinuria rather than SPE “nephrotic pattern” should be a criterion for further investigation by other techniques such as serum and or urine IFE.
A-255
Comparability of the AESKUSLIDES ANA-HEp-2 Antinuclear Antibody (ANA) Immunological Test System with a commercially available system.
T. Matthias, S. Pfeiffer, T. Martins, A. Petzold. AESKU.DIAGNOSTICS, Oakland, CA
Introduction: The method of choice for screening of ANA in clinical laboratories utilizes the indirect fl uorescent antibody method (IFA). This is sensitive, screens for a variety of autoantibodies and, through pattern recognition, offers insights into antigen identity and the associated autoimmune disorder (including SLE, Progressive Systemic Sclerosis, Mixed Tissue Connective Disease, Sjogren’s Syndrome and Polymyositis).We have validated the AESKUSLIDES ANA-HEp-2 antinuclear antibody immunological test system and compared its effectiveness with a commercially available system from another supplier. The AESKUSLIDES ANA-HEp-2 system utilizes the human epithelial cell line (HEp-2) established by Moore and colleagues. HEp-2 cells show greater sensitivity and sharper pattern recognition than tissue sections.Methodology: Human serum is reacted with the antigen substrate (HEp-2 cells), whereby, any ANA present will bind to the antigen forming stable antigen-antibody complexes. Other (unbound) antibodies are washed away and a fl uorescein labeled antihuman antibody is added to the reaction site. This binds to the complexes formed earlier. After washing away unbound antibody the slides are assessed under the microscope for the presence of ANA (represented by green fl uorescing antigen-antibody complexes). Fluorescence intensity may be semi-quantitated in accordance with CDC guidelines.Validation/Comparability: One hundred and thirty eight frozen samples were tested on two lots of the AESKUSLIDES ANA-HEp-2 and two lots of a commercially available alternative. 118 of 138 samples were from patients previously evaluated for rheumatic disease and 20 of 138 samples were from healthy donors with no known clinical symptoms of rheumatic disease. Comparison of the two systems was to demonstrate comparability, including pattern consistency.The confi dence intervals of the combined data set were found to be identical:Positive % Agreement = 116/116 = 100% (95th% CI: 96.8 - 100%)Negative % Agreement = 22/22 = 100% (95th% CI: 85.1 - 100%)Pattern comparison of the two systems was also found to be identical (Homogenous n=32; Speckled n=82; Nucleolar n=20; Centromere n=6; Peripheral n=3; Nuclear Membrane n=1).Using the CDC ANA reference panel, both analytical sensitivity and linearity were found to be equivalent between the AESKUSLIDES ANA-HEp-2 system and the other company’s device.Comparable data was obtained using three different readers.Summary: The AESKUSLIDES ANA-HEp-2 system was found to be comparative to the commercially available system with which it was compared. The system is intended for use as an aid in the diagnosis of systemic rheumatic diseases in conjunction with other clinical and laboratory fi ndings.
A-256
Evaluation of Anti-HCV CMIA testing in a comparative study with results of immunoblot Anti-HCV assay
M. F. Mantovani, N. L. R. Junior, L. G. S. Carvalho, T. F. Chrusciak, C. F. A. Pereira. Alvaro Center for Analysis and Clinical Research - Diagnósticos da América (DASA), Cascavel, Brazil
Background: Since initial fi ndings about hepatitis C virus (HCV), it has been identifi ed as the main agent of non-A non-B hepatitis, especially associated to post-transfusion and chronic hepatitis. As HCV has low blood concentration, serology against HCV antibodies is most often used to identify the infection. Anti-HCV serologic tests were developed and refi ned seeking new recombinant antigens more sensitive and specifi c. Chemiluminescence microparticle immunoassay (CMIA) and
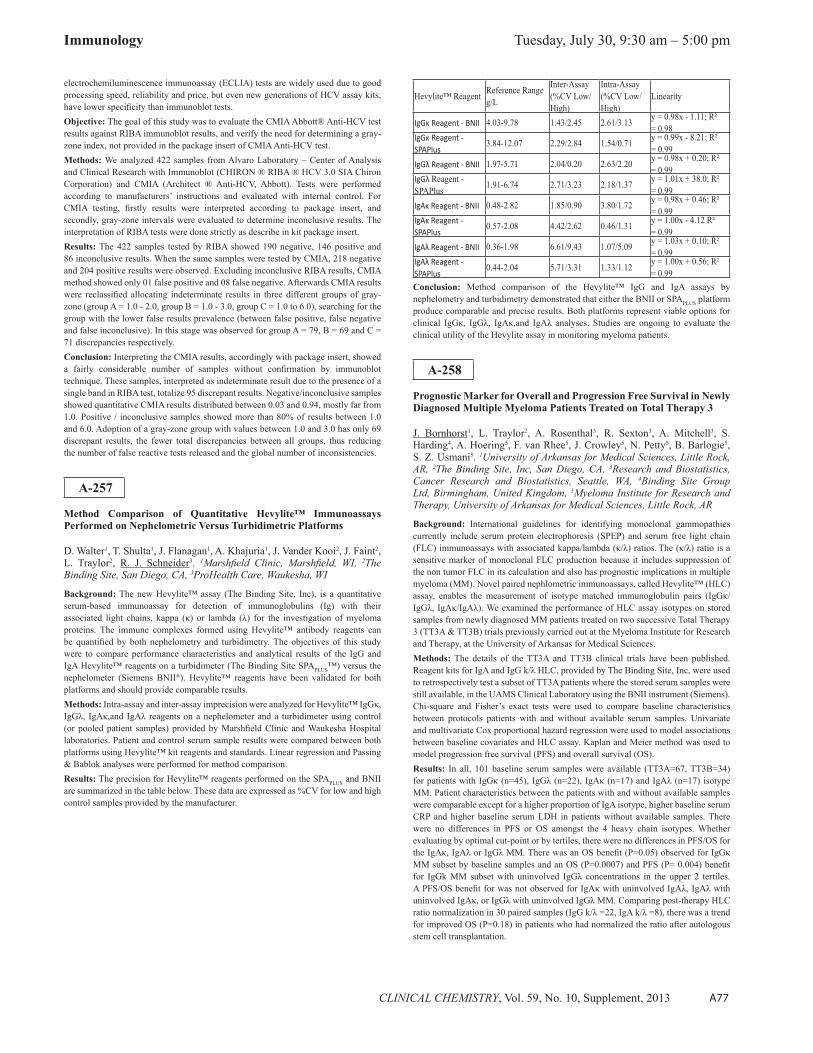
Immunology Tuesday, July 30, 9:30 am – 5:00 pm
CLINICAL CHEMISTRY, Vol. 59, No. 10, Supplement, 2013 A77
electrochemiluminescence immunoassay (ECLIA) tests are widely used due to good processing speed, reliability and price, but even new generations of HCV assay kits, have lower specifi city than immunoblot tests.Objective: The goal of this study was to evaluate the CMIA Abbott® Anti-HCV test results against RIBA immunoblot results, and verify the need for determining a gray-zone index, not provided in the package insert of CMIA Anti-HCV test.Methods: We analyzed 422 samples from Alvaro Laboratory – Center of Analysis and Clinical Research with Immunoblot (CHIRON ® RIBA ® HCV 3.0 SIA Chiron Corporation) and CMIA (Architect ® Anti-HCV, Abbott). Tests were performed according to manufacturers’ instructions and evaluated with internal control. For CMIA testing, fi rstly results were interpreted according to package insert, and secondly, gray-zone intervals were evaluated to determine inconclusive results. The interpretation of RIBA tests were done strictly as describe in kit package insert.Results: The 422 samples tested by RIBA showed 190 negative, 146 positive and 86 inconclusive results. When the same samples were tested by CMIA, 218 negative and 204 positive results were observed. Excluding inconclusive RIBA results, CMIA method showed only 01 false positive and 08 false negative. Afterwards CMIA results were reclassifi ed allocating indeterminate results in three different groups of gray-zone (group A = 1.0 - 2.0, group B = 1.0 - 3.0, group C = 1.0 to 6.0), searching for the group with the lower false results prevalence (between false positive, false negative and false inconclusive). In this stage was observed for group A = 79, B = 69 and C = 71 discrepancies respectively.Conclusion: Interpreting the CMIA results, accordingly with package insert, showed a fairly considerable number of samples without confi rmation by immunoblot technique. These samples, interpreted as indeterminate result due to the presence of a single band in RIBA test, totalize 95 discrepant results. Negative/inconclusive samples showed quantitative CMIA results distributed between 0.03 and 0.94, mostly far from 1.0. Positive / inconclusive samples showed more than 80% of results between 1.0 and 6.0. Adoption of a gray-zone group with values between 1.0 and 3.0 has only 69 discrepant results, the fewer total discrepancies between all groups, thus reducing the number of false reactive tests released and the global number of inconsistencies.
A-257
Method Comparison of Quantitative Hevylite™ Immunoassays Performed on Nephelometric Versus Turbidimetric Platforms
D. Walter1, T. Shulta1, J. Flanagan1, A. Khajuria1, J. Vander Kooi2, J. Faint2, L. Traylor2, R. J. Schneider3. 1Marshfi eld Clinic, Marshfi eld, WI, 2The Binding Site, San Diego, CA, 3ProHealth Care, Waukesha, WI
Background: The new Hevylite™ assay (The Binding Site, Inc), is a quantitative serum-based immunoassay for detection of immunoglobulins (Ig) with their associated light chains, kappa (κ) or lambda (λ) for the investigation of myeloma proteins. The immune complexes formed using Hevylite™ antibody reagents can be quantifi ed by both nephelometry and turbidimetry. The objectives of this study were to compare performance characteristics and analytical results of the IgG and IgA Hevylite™ reagents on a turbidimeter (The Binding Site SPAPLUS™) versus the nephelometer (Siemens BNII®). Hevylite™ reagents have been validated for both platforms and should provide comparable results.Methods: Intra-assay and inter-assay imprecision were analyzed for Hevylite™ IgGκ, IgGλ, IgAκ,and IgAλ reagents on a nephelometer and a turbidimeter using control (or pooled patient samples) provided by Marshfi eld Clinic and Waukesha Hospital laboratories. Patient and control serum sample results were compared between both platforms using Hevylite™ kit reagents and standards. Linear regression and Passing & Bablok analyses were performed for method comparison.Results: The precision for Hevylite™ reagents performed on the SPAPLUS and BNII are summarized in the table below. These data are expressed as %CV for low and high control samples provided by the manufacturer.
Hevylite™ Reagent Reference Range g/L
Inter-Assay(%CV Low/High)
Intra-Assay(%CV Low/High)
Linearity
IgGκ Reagent - BNII 4.03-9.78 1.43/2.45 2.61/3.13 y = 0.98x - 1.11; R² = 0.98
IgGκ Reagent - SPAPlus
3.84-12.07 2.29/2.84 1.54/0.71 y = 0.99x - 8.21; R² = 0.99
IgGλ Reagent - BNII 1.97-5.71 2.04/0.20 2.63/2.20 y = 0.98x + 0.20; R² = 0.99
IgGλ Reagent - SPAPlus
1.91-6.74 2.71/3.23 2.18/1.37 y = 1.01x + 38.0; R² = 0.99
IgAκ Reagent - BNII 0.48-2.82 1.85/0.90 3.80/1.72 y = 0.98x + 0.46; R² = 0.99
IgAκ Reagent - SPAPlus
0.57-2.08 4.42/2.62 0.46/1.31 y = 1.00x - 4.12 R² = 0.99
IgAλ Reagent - BNII 0.36-1.98 6.61/9.43 1.07/5.09 y = 1.03x + 0.10; R² = 0.99
IgAλ Reagent - SPAPlus
0.44-2.04 5.71/3.31 1.33/1.12 y = 1.00x + 0.56; R² = 0.99
Conclusion: Method comparison of the Hevylite™ IgG and IgA assays by nephelometry and turbidimetry demonstrated that either the BNII or SPAPLUS platform produce comparable and precise results. Both platforms represent viable options for clinical IgGκ, IgGλ, IgAκ,and IgAλ analyses. Studies are ongoing to evaluate the clinical utility of the Hevylite assay in monitoring myeloma patients.
A-258
Prognostic Marker for Overall and Progression Free Survival in Newly Diagnosed Multiple Myeloma Patients Treated on Total Therapy 3
J. Bornhorst1, L. Traylor2, A. Rosenthal3, R. Sexton3, A. Mitchell3, S. Harding4, A. Hoering5, F. van Rhee5, J. Crowley5, N. Petty5, B. Barlogie5, S. Z. Usmani5. 1University of Arkansas for Medical Sciences, Little Rock, AR, 2The Binding Site, Inc, San Diego, CA, 3Research and Biostatistics, Cancer Research and Biostatistics, Seattle, WA, 4Binding Site Group Ltd, Birmingham, United Kingdom, 5Myeloma Institute for Research and Therapy, University of Arkansas for Medical Sciences, Little Rock, AR
Background: International guidelines for identifying monoclonal gammopathies currently include serum protein electrophoresis (SPEP) and serum free light chain (FLC) immunoassays with associated kappa/lambda (κ/λ) ratios. The (κ/λ) ratio is a sensitive marker of monoclonal FLC production because it includes suppression of the non tumor FLC in its calculation and also has prognostic implications in multiple myeloma (MM). Novel paired nephlometric immunoassays, called Hevylite™ (HLC) assay, enables the measurement of isotype matched immunoglobulin pairs (IgGκ/IgGλ, IgAκ/IgAλ). We examined the performance of HLC assay isotypes on stored samples from newly diagnosed MM patients treated on two successive Total Therapy 3 (TT3A & TT3B) trials previously carried out at the Myeloma Institute for Research and Therapy, at the University of Arkansas for Medical Sciences.Methods: The details of the TT3A and TT3B clinical trials have been published. Reagent kits for IgA and IgG k/λ HLC, provided by The Binding Site, Inc, were used to retrospectively test a subset of TT3A patients where the stored serum samples were still available, in the UAMS Clinical Laboratory using the BNII instrument (Siemens). Chi-square and Fisher’s exact tests were used to compare baseline characteristics between protocols patients with and without available serum samples. Univariate and multivariate Cox proportional hazard regression were used to model associations between baseline covariates and HLC assay. Kaplan and Meier method was used to model progression free survival (PFS) and overall survival (OS).Results: In all, 101 baseline serum samples were available (TT3A=67, TT3B=34) for patients with IgGκ (n=45), IgGλ (n=22), IgAκ (n=17) and IgAλ (n=17) isotype MM. Patient characteristics between the patients with and without available samples were comparable except for a higher proportion of IgA isotype, higher baseline serum CRP and higher baseline serum LDH in patients without available samples. There were no differences in PFS or OS amongst the 4 heavy chain isotypes. Whether evaluating by optimal cut-point or by tertiles, there were no differences in PFS/OS for the IgAκ, IgAλ or IgGλ MM. There was an OS benefi t (P=0.05) observed for IgGκ MM subset by baseline samples and an OS (P=0.0007) and PFS (P= 0.004) benefi t for IgGk MM subset with uninvolved IgGλ concentrations in the upper 2 tertiles. A PFS/OS benefi t for was not observed for IgAκ with uninvolved IgAλ, IgAλ with uninvolved IgAκ, or IgGλ with uninvolved IgGλ MM. Comparing post-therapy HLC ratio normalization in 30 paired samples (IgG k/λ =22, IgA k/λ =8), there was a trend for improved OS (P=0.18) in patients who had normalized the ratio after autologous stem cell transplantation.

Tuesday, July 30, 9:30 am – 5:00 pm Immunology
A78 CLINICAL CHEMISTRY, Vol. 59, No. 10, Supplement, 2013
Conclusions: These data provide early evidence of pre- and post-therapeutic prognostic utility of the HLC assay. Although our study was conducted on a small subset of TT3 patients, these data support further investigation of HLC assays in multiple myeloma evaluation.
A-259
The expression of Delta-like-1 in PBMC from patients with autoimmune diseases
X. Peng1, X. Zhang2, J. Chen3, L. Chen2, X. Zhang2, Z. Luo2. 1Division of Clinical immunology, Department of Lab Medcine, West China Hospital, Sichuan University, chengdu, China, 2Department of Immunology, West China School of Preclinical and Forensic Medcine, Sichuan University, chengdu, China, 3Key Laboratory of West China school of stomatology, Sichuan University, chengdu, China
Background: Notch signaling is involved in many developmental processes and lineage decisions in fetal and post-natal organogenesis, as well as in adult self-renewing organs. It’s a regulator of immune cells’ differenciation, prolifi cation, survival, apoptosis, mature and function, including T lymphcyte, B lymphocyte and DCs etc. Various Notch ligands were closely associated with differenciation tendency of T cell type (Th1/Th2, Th17, Treg, etc). Because the abnormal differenciation and function of T lymphocytes is a key immunologic mechanism of autoimmune diseases, so it is worth to make clear that the expressiom of Notch ligands in autoimmune diseases. To adrress this issue, Delta-like-1, one ligand of Notch, was detected in peripheral blood mononuclear cells (PBMC) from patients with autoimmune diseases, including rheumatoid arthritis (RA), systemic lupus erythematosus (SLE), Sjogren’s syndrome (SS) and Scleroderma.Methods:Peripheral blood mononuclear cells (PBMC) from 89 RA, 81 SS, 96 SLE, 83 scleroderma, 52 lymphoma and 51 healthy control were analyzed the expression of Delta-like-1 at mRNA and protein level by RT-PCR, Western-blot and immunofl uorescence. The data obtained was statistically analyzed by chi-square test.Results: The expression of Delta-like-1 was detected in PBMC from the patients with autoimmune diseases, while no expression of Delta-like-1 was observed in PBMC from normal controls and patients with lymphoma. Moreover, the expression levels of Delta-like-1 in PBMC from the patients with RA, SLE or SS seems higher than that patients with scleroderma. It showed signifi cant difference between RA, SLE, SS, scleroderma and healthy controls, lymphoma (P < 0.01).Conclusion: The expression level of Delta-like-1 in PBMC was upregulated signifi cantly in patients with autoimmune diseases including RA, SLE, SS and scleroderma, and its extent in RA, SLE and SS is more obvious than that in Scleroderma. These results suggested that Delta-like-1 mediated Notch signaling pathway may involve in autoimmune diseases’ pathogenesis, and it would be a new therapy for autoimmune diseases by the regulation of this Notch signaling pathway.
A-260
HELIOS, a bright future for ANA - automated indirect immunofl uorescence (IIF) assay.
T. Matthias1, B. Gilburd2, N. Agmon-Levin2, T. Martins1, A. Petzold1, Y. Shoenfeld2. 1AESKU.DIAGNOSTICS, Oakland, CA, 2The Zabludowitcz Center for Autoimmune Diseases, Tel Aviv, Israel
Introduction: In the latest declaration of the American College of Rheumatology committee for autoantibodies detection, the IIF technique was considered the standard screening test for ANA determination. Thereafter, an extensive evolution to develop technological solutions for automatization of IIF was initiated, including devices for substrates (slides) preparation as well as for their interpretation.Objective of the study: To evaluate the fi rst fully automated (HELIOS) IIF processor including an integrated optical system for automatic slides reading aimed at positive/negative sample discrimination.Patients and methods: Two hundred samples (47 ANA negative, 70 ANA- ENA positive and 83 ANA positive by ELISA) were reevaluated for ANA utilizing the HELIOS system as well as manual routine microscopic evaluated by two different expert observers.Results: The agreement between ANA determination by the HELIOS system and results obtained by the expert observers reached 92% of which a concurrence of 97.6% was observed in the ANA negative group and 90% in the ANA positive group.
Notably, all discordant positive samples were characterized by very low fl uorescent signal and unidentifi ed patterns. On the other hand, the HELIOS system recognized a broad range of fl uorescence patterns, including one esoteric pattern.The correlation between the IFA performed by the automated system or manually and ELISA test was 91 %.Conclusions: The HELIOS system is able to discriminate correctly ANA positive/negative samples compared to manual microscopic IIF performed by two independent experts. This novel approach to IIF determination may reduce inter-laboratory variability and time required to perform this test especially in high throughput laboratories.
A-261
Evaluation of the Utility of Serum FLC Ratio for Screening and Monitoring PTLD in Post Solid Organ Transplant Patients
P. Wang1, I. Shu1, D. Kuhn2, K. Kuus2. 1The Methodist Hospital, Houston, TX, 2The Binding Site, San Diego, CA
Background: Post Transplant Lymphoproliferative Disease (PTLD) is primarily diagnosed histologically using tissue biopsy and distinguished by features such as cytogenetic abnormalities, immunoglobulin gene rearrangements, donor vs recipient origin and EBV status. Monitoring for the presence of a persistent monoclonal protein in the serum or urine using SPEP (serum protein electrophoresis), UPEP (urine protein electrophoresis) and IFE (immunofi xation electrophoresis) is an effective, inexpensive and non-invasive way to screen and monitor PTLD in post solid organ transplant patients. Although guidelines are available for the use of serum free light chain (FLC) ratio in the screening and monitoring of multiple myeloma and other B cell dyscrasias, the use of this ratio in the screening and monitoring of PTLD has not been studied. It is not clear what reference range should be used, and how this quantitative serum assay compares to SPEP/UPEP/IFE.Methods: We analyzed 75 serum samples of consecutive post solid organ transplant subjects (57 lung transplants, 4 heart, 5 kidney, 3 liver, 3 heart/lung, 2 kidney/lung and 1 liver/lung) using the serum FREELITE assay on a Beckman Immage analyzer. SPEP, UPEP, IFE results and clinical diagnosis related to PTLD were retrieved from medical records.Results: Sixty-three samples had normal SPEP, UPEP and no clinical diagnosis of PTLD or other B cell dyscrasias. In this group, the mean of free Kappa light chain concentration was 2.77 mg/dL, median was 1.35 mg/dL, and 95 percentile range was 0.44-11.18 mg/dL. The mean of free Lambda light chain concentration was 2.34 mg/dL, median was 1.52 mg/dL, and 95 percentile range was 0.59-8.17 mg/dL. The mean of Kappa/Lambda ratio was 1.15, median was 0.83, and 95 percentile range was 0.45-1.56. Twelve samples showed gammopathy on SPEP or UPEP but no clinical diagnosis of PTLD. Using the reference range of 0.26-1.65 for Kappa/Lambda ratio, the FLC ratio would identify 69 samples as low probability for PTLD, and 6 samples as high probability for PTLD, which calculated a clinical specifi city of 92%. In contrast, the SPEP/UPEP/IFE as screening/monitoring tool for PTLD had a clinical specifi city of 84%.Conclusions: The mean, median and upper 95 percentile range of FLC concentrations in transplant recipients without PTLD and gammopathy were higher than those of normal healthy population. The Kappa/Lambda ratio in this population was similar to that of healthy adults. When used as a screening/monitoring tool for PTLD, the FLC ratio demonstrated a higher clinical specifi city than SPEP/UPEP/IFE.
A-263
Expansion Tregs and inhibition Th17/Th1 by sirolimus-based regimen is dependent on STAT-signaling compared with tacrolimus-based regimen in renal transplant recipients
Y. Li1, Y. Shi2, Y. Bai1, J. Tang1, J. Zhang1, L. wang1. 1Department of Clinical Immunological Laboratory, West China Hospital, Sichuan University, chengdu, China, 2Department of Nephrology, West China Hospital, Sichuan University, chengdu, China
Background: Mammalian Target-of-Rapamycin inhibitors (mTOR inhibitors, Sirolimus) has been used as de novo base therapy with steroids and mycophenolate mofetil (MMF) in an effort to completely avoid the use of CNI (calcineurin inhibitors). Previous studies have demonstrated sirolimus (SRL), might facilitate immunoregulation by increasing Treg percentages, recent studies found the kinase

Immunology Tuesday, July 30, 9:30 am – 5:00 pm
CLINICAL CHEMISTRY, Vol. 59, No. 10, Supplement, 2013 A79
mTOR has emerged as an important regulator of the differentiation of helper T cells. So the recipients used sirolimus might affect the balance of the Th cells (Th17, Th1 and Treg).Methods: We included 48 renal transplantation recipient (24 recipient used sirolimus based regimen coversion from tacrolimus and 24 recipient used tacrolimus based regimen) and 24 healthy control in our study. Of all these subjects, Th cells and the STAT proteins frequencies in the peripheral blood were analyzed by fl ow cytometry (FCM).At the meantime, the plasma levels of IL-1β, IFN-γ, IL-17, IL-6 and IL-10 were analyzed by Bio-Plex® suspension array system.Results: Recipients who used tacrolimus based regimen exhibited renal dysfunction and hypertension.The frequencies of Treg cells in TAC group [1.5(1.2-1. 8)] decreased signifi cantly when compared with SRL group [3.9(2.5-5.5)] and healthy control group [4.9(3.8-5.5)] (P<0.01), the Th17 (CD8-IL17+/CD3+CD8- T cells) and Th1 (CD8-IFNr +/CD3+CD8- T cells) was lower in SRL group compared with TAC group ,while there was no obvious difference (P>0.05). The Th17/Treg ration in TAC group [1.2(0.6-1.6)] decreased signifi cantly when compared with SRL group [0.5(0.3-1.6)] and healthy control group [0.6(0.2-1.2)] (P<0.01). The plasma concentrations of Th1 related cytokine( IL-1β and IFN-r), Th17 related cytokine (IL-17and IL-6) and Th2 related cytokine IL-10 in TAC group increased signifi cantly when compared with SRL group (P<0.05), Furthermore, the recipients used sirolimus showed increased STAT5 activation and decreased STAT3 activation.Conclusion: Our results demonstrate that mTOR inhibition by rapamycin, prevented Treg cells down regulation, and strongly inhibited Th1 and Th17 effectors in renal transplant recipients. Furthermore, the recipients used SRL showed increased STAT5 activation, involved in regulatory T-cell induction, and decreased STAT3 activation, involved in T-helper 17 cell induction. Thus conversion to SRL may both minimize CNI toxicity and facilitate CNI withdrawal by promoting immunoregulation.
A-265
Elevated serum IL-6 and IL-8 as the critical factors for pemphigus developing
B. Cai1, M. Zou1, J. Tang1, L. Luo1, W. Feng1, W. Li2, L. wang1. 1Division of Clinical Immunology, Department of Laboratory Medicine, West China Hospital, Sichuan University, chengdu, China, 2Department of Dermatology, West China Hospital of Sichuan University, chengdu, China
Background: Pemphigus is one of severe autoimmune diseases with skin injury. Recently cellular and humoral immune was gradually considered as one of important factors to induce pemphigus. To exploring the role of cytokine and T lymphocytes in pemphigus developing, we investigated the immune state of T lymphocyte subsets and the level of important infl ammatory cytokines IL-6, IL-8 and soluble IL-2 receptors (sIL-2R) in patients with pemphigus.Methods: 72 patients (39 males and 33 females) diagnosed as pemphigus in our hospital from Jan. 2010 to Dec. 2012 were included. Among them there were 60 patients with pemphigus vulgaris (PV), and 12 patients with pemphigus foliaceus (PF). 30 healthy volunteers (14 males and 16 females) were included. Peripheral T lymphocyte subsets were analyzed by fl ow cytometry, and serum IL-6, IL-8 and sIL-2R were detected by chemiluminescence immunoassay.Results: ⑴ peripheral T lymphocyte subsets analysis: Compared with healthy control (HC), percentage of peripheral CD3+T cells and CD3+CD8+T cells in pemphigus patients (including PV and PF) was similar to those in HC, and the percentage of CD3+CD4+T cells lightly increased (all P value>0.05). And there was no signifi cant difference of T lymphocyte subsets percentage between PF patients and PV patients. ⑵ serum cytokine analysis: Serum sIL-2R in pemphigus was similar to that in HC. And serum IL-6 and IL-8 were both signifi cantly higher in pemphigus than those in HC. In PV patients serum IL-6 and IL-8 were both strikingly higher than those in PF patients and HC; as well as serum IL-8 in PF patients was higher than that in HC. (Figure 1)Conclusion: The disturbed immune state in pemphigus was characterized by the strengthened infl ammatory state induced by IL-6 and IL-8, which may play more important role in PV developing.
Figure 1. Serum sIL-2R, IL-6 and IL-8 analysis between patients with pemphigus and healthy control.
A-266
Anti-DSF70 antibodies: You can fi nd if You know what You are looking for
W. Klotz, S. Blunder, H. Naschberger, M. Herold. Innsbruck Medical University, Innsbruck, Austria
Background: Antinuclear antibodies (ANAs) are found in patients with different autoimmune diseases and part of several classifi cation criteria like lupus erythematodes, Sjögren’s syndrome and scleroderma but are also present in healthy individuals especially anti-DSF70 antibodies (Mahler M et al. Autoimmun Rev 2012;11:642-5). We tried to fi nd out whether DSF70 positive samples may be found by indirect immunofl uorescence (iIF) on HEp-2 cells if technicians are trained to recognize the specifi c DSF70 pattern.Methods: 297 with iIF on HEp-2 cells ANA positive but ELISA-tested subtype negative serum samples out of our routine diagnostics where screened for DFS70 pattern after technicians were trained to recognize DFS70 pattern with dense fi ne speckles uniformly distributed throughout the nucleus accompanied by metaphase chromatin staining (Watanabe A et al. Arthritis Rheum 2004,50:892-900). All samples were seen independently from three in ANA-diagnostic on HEp-2 cells well experienced technicians (WK, SB, HN). The result was the agreement of at least two technicians. All samples were also tested with the new chemiluminescence immunoassay (CLI; BIO-FLASH - DFS70 Assay; kindly provided by Inova Diagnostics, USA, within an unrestricted research grant).Results: 95/297 samples were identifi ed as DFS70 pattern, 67/297 were DFS70 positive by CLI, 55/297 were positive in iIF and CLI (58%). 12/297 (5% were positive in CLI without DFS70 pattern on HEp-2 cells. Agreement between iIF and CLI was found in 245/297 samples (82%).Conclusion: DSF70 antibodies can be found by experienced technicians within ANA-screening on HEp-2 cells. Confi rmation by specifi c immunoassay is useful to avoid further diagnostic procedures as anti DSF70 antibodies are seen in healthy individuals and not associated with autoimmune diseases
A-267
Immunoglobulin´s Kappa light chain proteins in cerebrospinal fl uid in patients with Multiple Sclerosis.
C. T. S. Díaz1, N. M. B. Carvalho2, L. M. Campos2, M. A. H. Pérez1, R. T. L. Travieso1. 1Hospital Universitario Ntra. Sra. de Candelaria (HUNSC), Santa Cruz de Tenerife, Spain, 2The Binding Site, Barcelona, Spain
Introduction: Multiple Sclerosis (MS) is a chronic infl ammatory and demyelinating disease of the central nervous system (CNS) affecting mainly young adults. Although magnetic resonance (MRI) and IgG oligoclonal bands (OCB) represent a help for MS
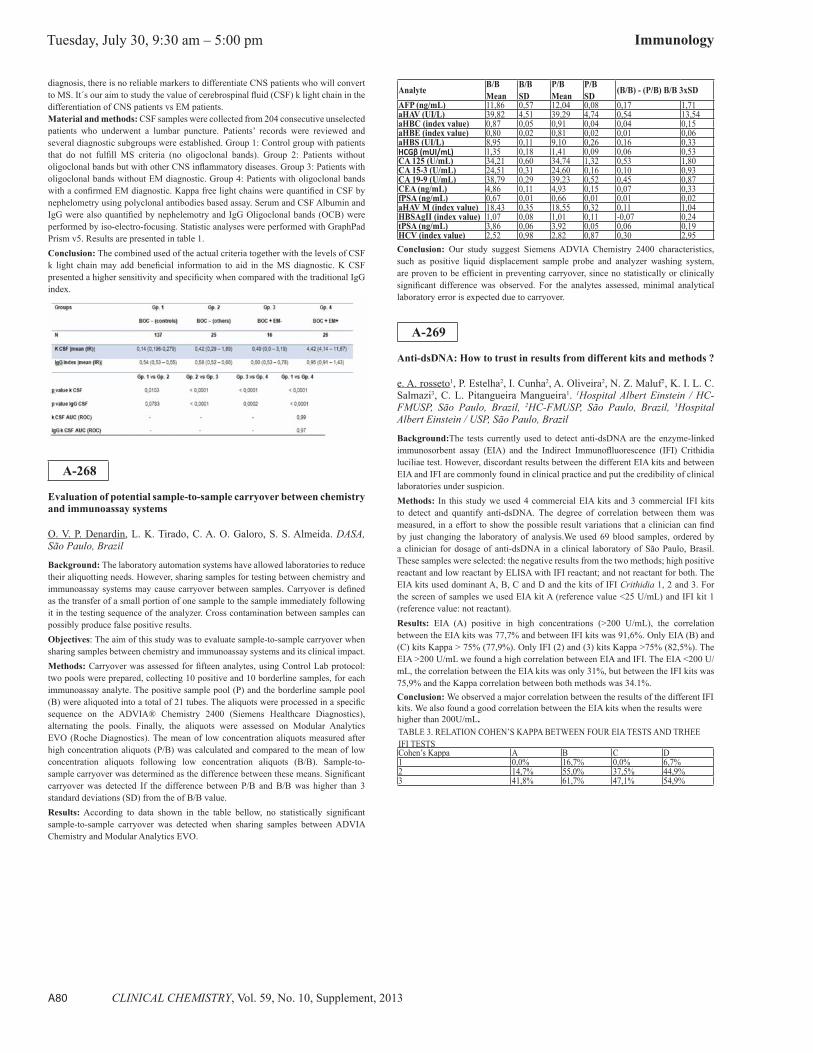
Tuesday, July 30, 9:30 am – 5:00 pm Immunology
A80 CLINICAL CHEMISTRY, Vol. 59, No. 10, Supplement, 2013
diagnosis, there is no reliable markers to differentiate CNS patients who will convert to MS. It´s our aim to study the value of cerebrospinal fl uid (CSF) k light chain in the differentiation of CNS patients vs EM patients.Material and methods: CSF samples were collected from 204 consecutive unselected patients who underwent a lumbar puncture. Patients’ records were reviewed and several diagnostic subgroups were established. Group 1: Control group with patients that do not fulfi ll MS criteria (no oligoclonal bands). Group 2: Patients without oligoclonal bands but with other CNS infl ammatory diseases. Group 3: Patients with oligoclonal bands without EM diagnostic. Group 4: Patients with oligoclonal bands with a confi rmed EM diagnostic. Kappa free light chains were quantifi ed in CSF by nephelometry using polyclonal antibodies based assay. Serum and CSF Albumin and IgG were also quantifi ed by nephelemotry and IgG Oligoclonal bands (OCB) were performed by iso-electro-focusing. Statistic analyses were performed with GraphPad Prism v5. Results are presented in table 1.Conclusion: The combined used of the actual criteria together with the levels of CSF k light chain may add benefi cial information to aid in the MS diagnostic. K CSF presented a higher sensitivity and specifi city when compared with the traditional IgG index.
A-268
Evaluation of potential sample-to-sample carryover between chemistry and immunoassay systems
O. V. P. Denardin, L. K. Tirado, C. A. O. Galoro, S. S. Almeida. DASA, São Paulo, Brazil
Background: The laboratory automation systems have allowed laboratories to reduce their aliquotting needs. However, sharing samples for testing between chemistry and immunoassay systems may cause carryover between samples. Carryover is defi ned as the transfer of a small portion of one sample to the sample immediately following it in the testing sequence of the analyzer. Cross contamination between samples can possibly produce false positive results.Objectives: The aim of this study was to evaluate sample-to-sample carryover when sharing samples between chemistry and immunoassay systems and its clinical impact.Methods: Carryover was assessed for fi fteen analytes, using Control Lab protocol: two pools were prepared, collecting 10 positive and 10 borderline samples, for each immunoassay analyte. The positive sample pool (P) and the borderline sample pool (B) were aliquoted into a total of 21 tubes. The aliquots were processed in a specifi c sequence on the ADVIA® Chemistry 2400 (Siemens Healthcare Diagnostics), alternating the pools. Finally, the aliquots were assessed on Modular Analytics EVO (Roche Diagnostics). The mean of low concentration aliquots measured after high concentration aliquots (P/B) was calculated and compared to the mean of low concentration aliquots following low concentration aliquots (B/B). Sample-to-sample carryover was determined as the difference between these means. Signifi cant carryover was detected If the difference between P/B and B/B was higher than 3 standard deviations (SD) from the of B/B value.Results: According to data shown in the table bellow, no statistically signifi cant sample-to-sample carryover was detected when sharing samples between ADVIA Chemistry and Modular Analytics EVO.
Analyte B/B Mean
B/BSD
P/B Mean
P/BSD (B/B) - (P/B) B/B 3xSD
AFP (ng/mL) 11,86 0,57 12,04 0,08 0,17 1,71aHAV (UI/L) 39,82 4,51 39,29 4,74 0,54 13,54aHBC (index value) 0,87 0,05 0,91 0,04 0,04 0,15aHBE (index value) 0,80 0,02 0,81 0,02 0,01 0,06aHBS (UI/L) 8,95 0,11 9,10 0,26 0,16 0,33HCGβ (mUI/mL) 1,35 0,18 1,41 0,09 0,06 0,53CA 125 (U/mL) 34,21 0,60 34,74 1,32 0,53 1,80CA 15-3 (U/mL) 24,51 0,31 24,60 0,16 0,10 0,93CA 19-9 (U/mL) 38,79 0,29 39,23 0,52 0,45 0,87CEA (ng/mL) 4,86 0,11 4,93 0,15 0,07 0,33fPSA (ng/mL) 0,67 0,01 0,66 0,01 0,01 0,02aHAV M (index value) 18,43 0,35 18,55 0,32 0,11 1,04HBSAgII (index value) 1,07 0,08 1,01 0,11 -0,07 0,24tPSA (ng/mL) 3,86 0,06 3,92 0,05 0,06 0,19HCV (index value) 2,52 0,98 2,82 0,87 0,30 2,95Conclusion: Our study suggest Siemens ADVIA Chemistry 2400 characteristics, such as positive liquid displacement sample probe and analyzer washing system, are proven to be effi cient in preventing carryover, since no statistically or clinically signifi cant difference was observed. For the analytes assessed, minimal analytical laboratory error is expected due to carryover.
A-269
Anti-dsDNA: How to trust in results from different kits and methods ?
e. A. rosseto1, P. Estelha2, I. Cunha2, A. Oliveira2, N. Z. Maluf2, K. I. L. C. Salmazi3, C. L. Pitangueira Mangueira1. 1Hospital Albert Einstein / HC-FMUSP, São Paulo, Brazil, 2HC-FMUSP, São Paulo, Brazil, 3Hospital Albert Einstein / USP, São Paulo, Brazil
Background:The tests currently used to detect anti-dsDNA are the enzyme-linked immunosorbent assay (EIA) and the Indirect Immunofl luorescence (IFI) Crithidia luciliae test. However, discordant results between the different EIA kits and between EIA and IFI are commonly found in clinical practice and put the credibility of clinical laboratories under suspicion. Methods: In this study we used 4 commercial EIA kits and 3 commercial IFI kits to detect and quantify anti-dsDNA. The degree of correlation between them was measured, in a effort to show the possible result variations that a clinician can fi nd by just changing the laboratory of analysis.We used 69 blood samples, ordered by a clinician for dosage of anti-dsDNA in a clinical laboratory of São Paulo, Brasil. These samples were selected: the negative results from the two methods; high positive reactant and low reactant by ELISA with IFI reactant; and not reactant for both. The EIA kits used dominant A, B, C and D and the kits of IFI Crithidia 1, 2 and 3. For the screen of samples we used EIA kit A (reference value <25 U/mL) and IFI kit 1 (reference value: not reactant). Results: EIA (A) positive in high concentrations (>200 U/mL), the correlation between the EIA kits was 77,7% and between IFI kits was 91,6%. Only EIA (B) and (C) kits Kappa > 75% (77,9%). Only IFI (2) and (3) kits Kappa >75% (82,5%). The EIA >200 U/mL we found a high correlation between EIA and IFI. The EIA <200 U/mL, the correlation between the EIA kits was only 31%, but between the IFI kits was 75,9% and the Kappa correlation between both methods was 34.1%.Conclusion: We observed a major correlation between the results of the different IFI kits. We also found a good correlation between the EIA kits when the results were higher than 200U/mL.TABLE 3. RELATION COHEN’S KAPPA BETWEEN FOUR EIA TESTS AND TRHEE IFI TESTSCohen’s Kappa A B C D1 0,0% 16,7% 0,0% 6,7%2 14,7% 55,0% 37,5% 44,9%3 41,8% 61,7% 47,1% 54,9%

Immunology Tuesday, July 30, 9:30 am – 5:00 pm
CLINICAL CHEMISTRY, Vol. 59, No. 10, Supplement, 2013 A81
A-270
Measurement of serum free light chain levels in HIV patients using a new rapid lateral fl ow test
J. Campbell, A. Stride, Y. Wang, M. Goodall, S. Bonney, A. Chamba, T. Plant, Z. Afzal, R. Jefferies, M. Drayson. University of Birmingham, Birmingham, United Kingdom
Background: B cell dysregulation contributes to immunodefi ciency, risk of AIDS and risk of B cell Non Hodgkins Lymphoma (NHL) in HIV patients. As viral load increases and CD4 counts decline, this B cell dysregulation is characterised by an increased production of intact immunoglobulins (e.g., IgA, IgM, IgG) and free light chains (FLC). Partly because FLC half-life in serum is 3-6 hours, compared to 5-21 days for intact immunoglobulin, FLCs are often regarded as a more sensitive marker of B cell activation. Two recent studies have demonstrated that levels of κ or λ FLC >40mg/L were associated with a greater odds-ratio of acquiring AIDS-defi ning infections and NHL. At present, laboratory FLC tests offer the only means of quantitating FLC and require expensive analytical instrumentation, skilled personnel and often a turnaround time of many days. The aim of this study was to assess the clinical utility of a new and cost-effective rapid lateral-fl ow test that quantitates serum and urine FLC in 10 minutes (Seralite™). Methods: Stored sera from HIV patients were tested for FLC by Seralite™ and results correlated with serum FLC levels measured by Freelite, total IgA, IgM, IgG, and CD4 counts. Samples were selected based on known FLC levels (Freelite™) falling within the following deciles (n=25 per decile): 0-10, 11-20, 21-30, 31-40 and 50+ mg/L for κ and λ FLC. Results: Results revealed that Seralite™ and Freelite™ had excellent quantitative concordance. Supporting prior fi ndings, FLC levels were positively associated with total immunoglobulin levels, and negatively associated with CD4 counts. Conclusion: Prospective use of Seralite™ to monitor FLC levels as an indicator of B cell dysregulation in HIV patients should now be investigated. Use of Seralite™ as a surrogate for CD4 counts in resource-limited settings should also be investigated.
A-271
The Method Matters: Multiple Macroenzymes Detected in the Presence of Hypergammaglobulinemia
S. P. Wyness1, S. L. La’ulu1, M. Yee2, L. Tosiello3, J. A. Straseski4. 1ARUP Institute for Clinical and Experimental Pathology, Salt Lake City, UT, 2SUNY, StonyBrook School of Medicine, StonyBrook, NY, 3Department of Medicine Jersey City Medical Center, Jersey City, NJ, 4Department of Pathology, University of Utah, Salt Lake City, UT
Background: We report the fi nding of an individual with hypergammaglobulinemia, elevated creatinine kinase (CK), elevated liver enzymes, and amylase concentrations at the high end of the normal range. Patient denied any symptoms associated with these values (myalgia, fevers, rashes, chest pain, or muscle weakness). The elevated CK was determined to be due to immunoglobulin bound macro-CK type 1, thus macroenzymes were considered as a possible source of the elevated liver enzymes. The presence of multiple macroenzymes, and the possible role of hypergammaglobulinemia, has not been previously reported in the literature. Methods: Polyethylene glycol (PEG) precipitation and ultrafi ltration (UF) were used to evaluate the presence of seven macroenzymes (alkaline phosphatase (ALP), alanine aminotransferase (ALT), amylase (AMYL), aspartate aminotransferase (AST), CK, lactate dehydrogenase (LD) and lipase (LIP)). Monomeric recoveries were determined by dividing the activity of the supernatant or ultrafi ltrate by the neat activity and converting to a percent. Results were compared to previously reported reference intervals established in healthy populations. Results: PEG monomeric recoveries suggested the presence of 6 of the 7 macroenzymes tested (all but ALP). UF revealed the presence of three macroenzymes (CK, AST and AMYL). These results were observed on two separate occasions, 10 months apart. Previous data had indicated that UF was the more precise method of macroenzyme detection of CK, AST, AMYL, LD, and LIP (Wyness et al., Clin Chim Acta, 2010 and 2011). Conclusions: The macroenzymes identifi ed by UF supported the clinical presentation of elevated CK and AST. MacroAMYL was also detected by UF, despite high-normal AMYL values. However, normal serum AMYL in the presence of macroAMYL is well documented. A previous report has shown that when globulins are present in excess, PEG may co-precipitate monomeric enzymes along with serum globulins,
causing false-positive reporting of macroenzymes (Ram et al., Ann Clin Biochem, 2008). This mechanism may explain the discrepancy between PEG and UF results in the presence of hypergammaglobulinemia, making UF a better method of detection in these circumstances. The presence of multiple macroenzymes in a single patient is novel, however, the preferential use of UF needs to be confi rmed in other hypergammaglobulinemic patients.
A-272
Evaluation of a novel IgG assay for use on the Binding Site Next Generation Protein Analyser
S. Kausar, A. J. Alvi, S. J. Harding, P. J. Showell. The Binding Site Ltd., Birmingham, United Kingdom
IgG is a routinely assessed serum protein whose concentration can be diagnostically useful in a wide range of diseases, including infection, autoimmune conditions, chronic lymphocytic leukemia and multiple myeloma. We present the performance characteristics of a new immunoassay designed for the quantifi cation of IgG in human serum using the Binding Site’s next generation protein analyser. The instrument is a random-access bench top turbidimetric analyser capable of a wide range of on-board sample dilutions (up to 1/10,000) and throughput of up to 120 tests per hour. Precision is promoted by single-use cuvettes which are automatically loaded and disposed of. The measuring range of the assay at a standard 1/10 dilution is 1.65 to 35.0g/L with refl ex dilutions above and below the standard range, giving a higher range of 6.60 to 140.0g/L and a sensitivity of 0.165g/L when using neat sample. Linearity of the assay was established by running a serially-diluted patient sample across the width of the standard measuring range and comparing the observed and expected results. Assay linearity was demonstrated over a range of 1.711 to 37.392g/L with a linear regression equation of y = 0.9705x + 0.2622, (R2 = 0.9972). The assay was evaluated for intra-run precision across the width of the standard measuring range by measurement of twenty replicates of sample pools at relevant medical decision points and the extremities of the curve (Sample 1, 3.097g/L, CV = 2.15%), lower medical decision point of 6.295g/L (Sample 2, CV = 1.55%), upper medical decision point of 15.523g/L (Sample 3, CV = 1.98%) and at the upper level of the curve (Sample 4, 33.116g/L, CV = 1.16%). Antigen excess capacity was determined as 195g/L by extending the upper range of the calibration curve. Interference was tested by the addition of known concentrations of Bilirubin (200mg/L), Chyle (1500 formazine turbidity units) or Haemoglobin (5g/L) to serum samples (median 11.711g/L; range 1.880 – 19.696g/L). No signifi cant (±10%) interference was observed. A comparison was made between this assay and the IgG assay for the Binding Site SPA PLUS using 28 normal (range 10.322 – 22.173g/L) and 37 pathological (range 2.869 – 34.50g/L) sera. A Passing & Bablok regression equation of y = 0.99x – 0.03 demonstrated acceptable agreement between the two assays with no sample having a greater than 9.49% discordance. The results presented allow us to conclude that the IgG assay for the Binding Site next generation protein analyser is reliable, precise and accurate and shows good agreement with the SPA PLUS assay.
A-273
Evaluation of immunoglobulin free light chain (Freelite®) assays on the Binding Site Next Generation Protein Analyser
D. G. McEntree, M. D. Coley, D. J. Matters, S. J. Harding, H. D. Carr-Smith, P. J. Showell. The Binding Site Ltd, Birmingham, United Kingdom
International guidelines based upon the Freelite® assay recommend use of serum free light chain (FLC) measurements as an aid in the diagnosis of patients with B cell disorders and as tools to monitor patients with AL amyloidosis, non-secretory myeloma and light chain myeloma. Here we describe the development of the Freelite assay for the Binding Site’s Next Generation Protein Analyser. The instrument is a random-access bench top turbidimetric analyser capable of a wide range of on board sample dilutions (up to 1/10,000), throughput of up to 120 tests per hour and multiple methods of antigen excess detection. Precision is promoted by single use cuvettes which are automatically loaded and disposed of. The instrument automatically dilutes a single calibrator to produce a calibration curve producing measuring ranges of 4-180g/L for Kappa FLC and 4.5-165mg/L for Lambda FLC at the standard 1/10 sample dilution. There was acceptable intra-assay precision when levels of 134mg/L (2.2% CV) and 6.5mg/L (4.9%) for kappa FLC, and 130mg/L (1.0%) and 7.56mg/L (3.7%) for lambda FLC were run twenty times on a single calibration curve. Similarly, there was good linearity for the kappa (y = 0.99x + 0.99mg/L; R2= 1.00) and lambda (y = 1.01x + 0.07mg/L; R2= 1.00) FLC assays as determined by serial dilutions of a

Tuesday, July 30, 9:30 am – 5:00 pm Immunology
A82 CLINICAL CHEMISTRY, Vol. 59, No. 10, Supplement, 2013
sample across the width of the calibration curves at the minimum sample dilution. Comparison of these assays to Freelite BNTMII assays for 141 kappa (79 normal, 62 monoclonal, mean 535.20mg/L, range 1.13-17,868.19mg/L) and 129 lambda (79 normal, 50 monoclonal, 275.06mg/L, range 0.52-3833.94mg/L) FLC samples showed good agreement (kappa, y=0.91x + 43.91mg/L R2= 0.98, and lambda, y=0.97x - 4.28g/L; R2= 0.96). A selected population of 9 kappa and 9 lambda FLC samples were analysed at a non-standard dilution to mimic antigen excess. In all cases (9/9 kappa and 9/9 lambda) antigen excess samples were identifi ed by the instruments protective function. We conclude that the Freelite assays for the Binding Site Next Generation Protein Analyser are rapid, accurate and precise and protected from false low results by the instruments automatic antigen excess check function.
A-274
Evaluation of a C4 assay for use on the Binding Site Next Generation Protein Analyser
P. S. Patel, F. Murphy, S. J. Harding, P. J. Showell. The Binding Site Ltd, Birmingham, United Kingdom
Serum complement consists of around 30 proteins that have a fundamental role in immune system functionality. Inherited defi ciencies in C4 are associated with an increased risk of developing systemic lupus erythematosus (SLE). Conversely, high levels of circulating immune complexes in SLE can reduce serum levels of complement components. C4 defi ciency is also associated with glomerulonephritis and vasculitis. Here we describe the evaluation of a serum C4 assay for Binding Site’s next generation protein analyser. The instrument is a random-access bench top turbidimetric analyser capable of a wide range of on-board sample dilutions (up to 1/10,000) and throughput of up to 120 tests per hour. Precision is promoted by single-use cuvettes which are automatically loaded and disposed of. The instrument automatically dilutes a single calibrator to produce a calibration curve with a measuring range of 0.064 - 0.9 g/L at the standard 1/10 sample dilution, with sensitivity of 0.0064 g/L. High samples are remeasured at a dilution of 1/20 with an upper measuring range of 0.128 -1.8 g/L. Precision studies (CLSI EP5-A2) were performed at three levels in duplicate over 21 working days. Antigen levels of 0.779, 0.166 and 0.117g/L were assessed for total, within-run, between-run and between-day precision, using one lot of reagent on three analysers. The coeffi cients of variation were 4.4%, 2.2%, 2.0% and 3.3% for the high sample, 7.7%, 2.2%, 1.5% and 7.3% for the medium sample and 5.2%, 2.0% 2.4% and 4.1% for the low sample respectively. Linearity was assessed by assaying a serially-diluted patient sample pool across the width of the measuring range (0.001 - 0.882 g/L) and comparing expected versus observed results. The assay showed a high degree of linearity when expected values were regressed against measured values (y=1.013x + 0.0177 R² = 0.998. No signifi cant interference (within ±10%) was observed on addition of bilirubin (200mg/L), haemoglobin (5000mg/L) or chyle (1500 formazine turbidity units) when spiked into to samples with known C4 concentrations at the minimum sample dilution. Correlation to the Binding Site C4 assay for the SPA PLUS was performed using normal and clinical samples (n=70, range 0.028-0.839g/L). Good agreement was demonstrated by Passing-Bablok regression; y=0.98x + 0.0g/L. We conclude that the C4 assay for the Binding Site next generation protein analyser is reliable, accurate and precise and shows good agreement with existing assays.
A-275
Evaluation of a novel assay for IgA subclasses for use on the Binding Site Next Generation Protein Analyser
S. K. Dhaliwal, N. L. Gilman, A. J. Alvi, S. J. Harding, P. J. Showell. The Binding Site Ltd., Birmingham, United Kingdom
There are two human IgA subclasses (IgA1 and IgA2), of which IgA1 is the most abundant in serum, representing 80-90% of total IgA. Elevated levels of either or both subclass may indicate infection whilst reduced levels are associated with IgA subclass specifi c immune-defi ciencies. Here we present the performance characteristics of two new IgA subclass immunoassays designed for the quantifi cation of IgA1 and IgA2 in human serum using the Binding Site next generation protein analyser. The instrument is a random-access bench top turbidimetric analyser capable of a wide range of on-board sample dilutions (up to 1/10,000) and throughput of up to 120 tests per hour. Precision is promoted by single-use cuvettes which are automatically loaded and disposed of, thus eliminating the risk of cuvette carry-over. Linearity of the assays was established by running serially-diluted patient samples across the width of the standard measuring range and comparing the observed and expected results. Interference was tested by the addition of known concentrations of Haemoglobin
(5g/L), Bilirubin (200mg/L) or Chyle (1500 formazine turbidity units) to serum samples at the immune-defi ciency medical decision points (IgA1: 760mg/L, IgA2: 67.260mg/L). The assays were evaluated for intra-run precision across the width of their standard measuring ranges by measurement of twenty replicates of sample pools at points emphasising the lower and upper portions of the curve. A comparison study was performed between these assays and the equivalent assays for the Binding Site SPA PLUS.
Assay IgA1 IgA2Range 362.12 – 6156.0 mg/L 50.92 – 1273.0 mg/LMinimum sample dilution 1/1 1/1Standard sample dilution 1/10 1/10Sensitivity 36.2 mg/L 5.092 mg/LLinearity – linear regression y = 0.9995x – 0.4164, R2 = 0.9994 y = 1.0011x – 3.0844, R2 =
0.9965Interference – Haemoglobin -3.31% -0.52%Interference – Bilirubin 2.44% -0.80%Interference – Chyle 4.91% -3.96%Comparison-linear regression
y = 0.9978x – 97.164, R2 = 0.9947 (n = 46, range = 462.9 – 6156.0mg/L)
y = 1.0469x + 18.445, R2 = 0.9909 (n = 49, range = 57.4 – 1012.0mg/L)
Intra-assay precision (n=20) %CV (Mean)
0.78%(4954.59mg/L)
1.74%(894mg/L)
1.04%(504.915mg/L)
1.14%(80mg/L)
The results presented above allow us to conclude that the IgA1 and IgA2 assays for the Binding Site next generation protein analyser are reliable, precise and accurate and show good agreement with the SPA PLUS assays.
A-276
Evaluation of a C3c assay for use on the Binding Site Next Generation Protein Analyser
L. W. Aston-Abbott, F. Murphy, S. J. Harding, P. J. Showell. The Binding Site Ltd, Birmingham, United Kingdom
Serum complement consists of around 30 proteins that have a fundamental role in immune system functionality. Inherited defi ciencies in C3c are associated with an increased risk of developing systemic lupus erythematosus (SLE). C3c defi ciency may present with recurrent infections such as pneumonia, septicaemia and meningitis. Here we describe the evaluation of a serum C3c assay for use on the Binding Site’s next generation protein analyser. The instrument is a random-access bench top turbidimetric analyser capable of a wide range of on-board sample dilutions (up to 1/10,000) and throughput of up to 120 tests per hour. Precision is promoted by single-use cuvettes which are automatically loaded and disposed of. The instrument automatically dilutes a single calibrator to produce a calibration curve with a measuring range of 0.25-3.0g/L at the standard 1/10 sample dilution, with sensitivity of 0.025g/L. High samples are automatically re-measured at a dilution of 1/20, with an upper measuring range of 0.5-6g/L. Precision studies (CLSI EP5-A2) were performed at three levels in duplicate over 21 working days. Antigen levels of 2.39, 0.793 and 0.39g/L were assessed for total, within-run, between-run and between-day precision, using one lot of reagent on three analysers. The coeffi cients of variation were 4.1%, 1.8%, 2.5% and 2.7% for the high sample, 4.9%, 1.5%, 1.7% and 4.4% for the medium sample and 4.0%, 2.1% 1.4% and 3.2% for the low sample respectively. Linearity was assessed by assaying a serially-diluted patient sample pool across the width of the measuring range (0.303-3.036g/L) and comparing expected versus observed results. The assay showed a high degree of linearity when expected values were regressed against measured values (y=1.03x + 0.017g/L, R² = 0.998). No signifi cant interference (within ±10%) was observed on addition of bilirubin (200mg/L), haemoglobin (5000mg/L) or chyle (1250 formazine turbidity units) when spiked into a sample with known C3c concentrations analysed at the minimum sample dilution. Correlation to the Binding Site C3c assay for the SPA PLUS was performed using both normal and clinical samples (n=78, range 0.41-4.75g/L). Good agreement was demonstrated by Passing-Bablok regression; y=0.95x + 0.01g/L. We conclude that the C3c assay for the Binding Site next generation protein analyser is reliable, accurate and precise and shows good agreement with existing assays.

Immunology Tuesday, July 30, 9:30 am – 5:00 pm
CLINICAL CHEMISTRY, Vol. 59, No. 10, Supplement, 2013 A83
A-277
Evaluation of an IgG4 assay for use on the Binding Site Next Generation Protein Analyser
L. D. Southan, R. E. Grieveson, A. Kaur, S. J. Harding, P. J. Showell. The Binding Site Ltd, Birmingham, United Kingdom
High polyclonal IgG4 levels are associated with autoimmune pancreatitis (AIP) and other hyper-IgG4-globulinemia’s. Here we evaluate the performance of an IgG4 assay for use on the Binding Site’s next generation protein analyser. The instrument is a random-access bench top turbidimetric analyser capable of a wide range of on-board sample dilutions (up to 1/10,000) and throughput of up to 120 tests per hour. Precision is promoted by single-use cuvettes which are automatically loaded and disposed of. The instrument automatically dilutes a single calibrator to produce a calibration curve with a measuring range of 0.03-3g/L at the standard 1/25 sample dilution, with a sensitivity of 0.0024g/L and a maximimum measuring range of 1.5-60g/L at a 1/500 dilution. Intra-run precision was assessed by measurement of twenty replicates of serum samples on a single kit lot using one instrument. The following coeffi cients of variation were produced: 0.073g/L IgG4 (4.64% CV), 1.126g/L IgG4 (2.66% CV) and 2.187g/L IgG4 (2.56% CV). Linearity was assessed by assaying a serially-diluted patient sample pool and comparing expected versus observed results. The assay was linear over the range of 0.03-2.39g/L when analysed by linear regression; y=0.9751x + 4.506 (R2=0.995). Correlation to the Binding Site IgG4 assay for the SPA PLUS was performed using 42 patient samples (range 0.026-2.39g/L). Acceptable agreement was observed when the data was analysed by Passing-Bablok regression; y=0.97x + 9.11. Antigen excess protection was assessed by measuring 18 analyte concentrations ranging 0.038-2.37g/L at the minimum sample dilution (equivalent to 0.96-59.2g/L at the standard 1/25 sample dilution). All samples up to 2.37g/L (equivalent to 59.2g/L at the standard sample dilution) were correctly fl agged. We conclude that the IgG4 assay for the Binding Site next generation protein analyser is reliable, accurate and precise and is protected from antigen excess when challenged with high serum IgG4 concentrations.
A-278
Evaluation of a Transferrin assay for use on the Binding Site Next Generation Protein Analyser
S. Amin, F. Murphy, S. J. Harding, P. J. Showell. The Binding Site Ltd, Birmingham, United Kingdom
Increased serum concentrations of transferrin are associated with iron defi ciency, pregnancy and oestrogen administration, whereas decreased serum concentrations occur with chronic infection, neoplasia, hepatic and renal disease. Here we describe the evaluation of a serum transferrin assay for use on the Binding Site’s next generation protein analyser. The instrument is a random-access bench top turbidimetric analyser capable of a wide range of on-board sample dilutions (up to 1/10,000) and throughput of up to 120 tests per hour. Precision is promoted by single-use cuvettes which are automatically loaded and disposed of. The instrument automatically dilutes a single calibrator to produce a calibration curve with a measuring range of 0.1333- 5.3330 g/L at the standard 1/10 sample dilution, with sensitivity of 0.1333 g/L. High samples are remeasured at a dilution of 1/40 with an upper measuring range of 0.5332 - 21.332 g/L. The assay time is 9 minutes and is read at end point. Intra-run precision was assessed by measurement of twenty replicates of samples at 4.417g/L (3.18% CV), 4.382 g/L (2.37% CV) and 0.223 g/L (1.02% CV). Furthermore, precision was assessed at the medical decision points of 3.407g/L (2.29% CV) and 2.108 g/L (1.22% CV). Linearity was assessed by assaying a serially-diluted patient sample pool across the width of the measuring range (0.078 – 5.745 g/L) and comparing expected versus observed results. The assay showed a high degree of linearity when expected values were regressed against measured values; y=0.9932x + 0.072, R² = 0.9991. No signifi cant interference (within 10%) was observed on addition of bilirubin (200mg/L), haemoglobin (5000mg/L) or chyle (1500 formazine turbidity units) when spiked into a sample with known transferrin concentrations and measured at the minimum sample dilution. Correlation of this assay with the equivalent assay for the Binding Site SPA PLUS was performed using normal and clinical serum samples (n=60, range 0.4435 – 4.4425 g/L). Good agreement was demonstrated by linear regression; y=1.0755x + 0.0648 g/L, R2 = 0.9898. We conclude that the transferrin assay for the Binding Site next generation protein analyser is reliable, accurate and precise and shows good agreement with existing assays.

Tuesday, July 30, 9:30 am – 5:00 pm Endocrinology/Hormones
A84 CLINICAL CHEMISTRY, Vol. 59, No. 10, Supplement, 2013
Tuesday, July 30, 2013
Poster Session: 9:30 AM - 5:00 PM
Endocrinology/Hormones
A-279Comparison of equilibrium dialysis, ultrafi ltration and constant-volume diafi ltration as potential methods for the measurement of free thyroxine and triiodothyronine in human serum by isotope dilution liquid chromatography tandem mass spectrometry
A. Ribera, J. C. Botelho, H. W. Vesper. Centers for Disease Control and Prevention, Atlanta, GA
Background: Free triiodothyronine (FT3) and free thyroxine (FT4) levels are routinely measured in serum as an important part of the diagnosis and management of hypo- and hyperthyroidism. Measurement of FT3 and FT4, is the measurement of the hormones which are not bound to thyroxine binding globulin, transthyretin and albumin. Although immunoassays for FT3 and FT4 are commonly used in patient care and research, these assays show high variability especially in samples collected during pregnancy and estrogen therapy use. The use of mass spectrometry (MS) can overcome these short comings. The measurement of FT3 and FT4 by MS require that the free hormone be isolated. Two of the most common practices used to isolate FT3 and FT4 from serum are equilibrium dialysis (ED) and ultrafi ltration (UF). A third method, diafi ltration (DF) is designed to overcome lengthy dialysis times and avoid possible disruption of equilibrium and conversion of free to bound thyroid hormone. The proposed DF method maintains FT3 and FT4 equilibrium by keeping sample volume constant during fi ltration of FT3 and FT4 from the protein bound analytes.Methods: The effi ciency of each isolation technique has been evaluated using an internal standard spiking scheme using a 0.9% saline solution with FT3 and FT4 added. Prior to analysis by MS, anion exchange solid phase extraction is used and chromatographic separation and quantitation is achieved by liquid chromatography tandem mass spectrometry. A triple quadrupole mass spectrometer using electrospray ionization in the positive mode coupled with HPLC is used for measurement. A gradient of water and acetonitrile with 0.1% formic acid is used for chromatographic separation on a C18 column. Two transitions were monitored for each analyte and internal standard. In addition each approach was evaluated using serum material from CAP. Free T3 and T4 are isolated by ED, UF, or DF, and then isotope-labeled internal standards (T3-13C6 and T4-13C12) are added to the serum material for quantifi cation. Internal standards are not added before FT3 and FT4 isolation to prevent the standards from equilibrating with the binding proteins in serum.Results: This method showed great stability when analytes were protected from light, with minimal conversion of T4 to T3 (<2.0%). With chromatography, T3 and reverse T3 were adequately resolved and 2 transitions were monitored to assure additional compounds did not interfere with value assignments. Effi ciency of FT3 isolation calculated by spiking at 1.0 ng/dL was 65% for UF, >100% for DF and 69% for ED. Effi ciency of FT4 isolation calculated by spiking at 2.0 ng/dL was 85% for UF, 77% for DF and 61% for ED. A linear response was obtained within the clinically relevant calibration range of 0.1-1.0 ng/dL for FT3 and 0.5-3.0 ng/dL for FT4. Cap K 2011 and 2012 survey samples with FT3 values of 0.56-1.60 ng/dL and FT4 values of 1.61-4.55 ng/dL were measured using the 3 separation techniques.Conclusion: The accuracy and isolation effi ciency of methods using ED, UF and DF to isolate FT3 and FT4 was assessed for measurement of these analytes in serum, using a sensitive ID-LC-MS/MS method.
A-280
Standardization of 25-hydroxyvitamin D assays: impact of vitamin-D binding protein concentrations and uremic media on the restandarization of six different 25(OH) vitamin D immunoassays.
E. Cavalier1, P. Lukas1, Y. Crine1, S. Peeters1, A. Carlisi1, C. Le Goff1, J. Souberbielle2. 1University Hospital of Liège, University of Liège, Liège, Belgium, 2Hôpital Necker-Enfants malades, Paris, France
Introduction: Different reports have shown the lack of standardization of 25-hydroxy vitamin D assays and have warned the potential clinical consequences of such a problem. Recently, the Vitamin D Standardization Program (VDSP), led by the NIH
in collaboration with the CDC and NIST have issued a series of 40 single patients whose 25D had been determined by a commonly accepted reference method. The aims of the VDSP are to study the differences and similarities in the distributions of 25-hydroxyvitamin D (25D) around the world, standardize 25D measurements in national health surveys and allow for the participations of commercial laboratories and manufacturers in the standardization effort. In this study, we assimilated the standardization process in six immunoassays and assessed their harmonization effectiveness in a population of healthy individuals, but also in different patients presenting some differences in their serum matrix. Materials and Methods: The LCMS ChromSystem (Chrom) kit was calibrated against the VDSP Phase 1 samples. Sera from apparent healthy subjects (n=88, calibration) were measured with the calibrated LCMS Chrom, Architect, Centaur, Elecsys, IDS-iSYS, Liaison XL and DiaSorin RIA. The regression equations of these results were used to adjust the immunoasssays. The samples from 1st trimester (n = 32) and 3rd trimester (n = 36) pregnant women, and dialysis (n = 28) samples were quantifi ed to determine the harmonization. The samples vitamin-D-binding protein (DBP) concentrations were also determined with a R&D ELISA kit.Results: Third trimester pregnant women have the highest DBP circulating levels among the investigated populations, 511±167, 410±114, 544±280 and 836±290 μg/mL for the apparently healthy, haemodialysis, 1st and 3rd trimester, respectively. Prior to the adjustment, the PB regression slope (95%Cl.) between immunoassays and calibrated LCMS of the entire samples cohort (n = 184) varied from 0.59 (0.55 to 0.63) to 0.99 (0.92 to 1.05), with RIA being the lowest and IDS-iSYS being the highest. The difference [Mean±SD (ng/mL)] between LCMS and Architect, Centaur, Elecsys, IDS-iSYS, XL and RIA was: -2.6±9.3, -4.5±10.8, -1.6±8.8, 4.7±6.7, -6.1±9.6 and -6.8±8.0, respectively. After adjustment, the regression slope became more consistent, ranging from 1.00 (0.94 - 1.07) to 1.05 (0.93 - 1.16). Most notable changes were the XL and RIA: 0.70 (before) vs. 1.05 (after), 0.59 (before) vs. 1.03 (after), respectively. The mean difference (ng/mL) was also improved: -0.7±10.2 (Architect); 0.4±11.3 (Centaur); -0.5±9.1 (Elecsys); 0.1±6.8 (IDS-iSYS); -1.2±10.2 (XL) and 0.3±6.7 (RIA). We also observed that large bias remained, especially in 3rd trimester and haemodialysis samples. The mean concentration bias in 3rd trimester samples was: -7.0±5.0 (Architect); -10.6±7.2 (Centaur); -6.7±5.2 (Elecsys); -3.2±4.5 (IDS-iSYS); -11.6±5.2 (XL) and -3.1±4.0 (RIA). The bias was more pronounced in haemodialysis samples: -12.5±9.5 (Architect); -4.3±13.0 (Centaur); -9.7±10.8 (Elecsys); -3.3±7.6 (IDS-iSYS); -11.0±10.0 (XL) and -5.5±7.6 (RIA).Conclusions: By calibrating the immunoassays against the same patient samples, the harmonization is achieved for the samples from apparent healthy subjects. The calibration process appears not to be effective for samples from 3rd trimester pregnant women and haemodialysis patients. The infl uence of vitamin-D binding protein concentrations and uremic media are more visible in some immunoassays than other.
A-281
A Highly Sensitive Analysis of Estradiol in Human Plasma by MicroLC-MS/MS, with Reduced Solvent Consumption and Increased Throughput
M. Jarvis1, A. Wang2, B. Patterson3. 1AB SCIEX, Concord, ON, Canada, 2AB SCIEX, Foster City, CA, 3AB SCIEX, Victoria, Australia
Background: For Research Use Only. Not for Use in Diagnostic Procedures. Micro fl ow chromatography, with fl ow rates ranging from 5-60uL/min, and with column diameters less than 1mm, is an exciting approach for sensitive, high-throughput LC/MS/MS analysis. This technique represents a compelling alternative to conventional HPLC due to its solvent-reduction, cost-reduction and time-saving potential. Compared to traditional HPLC, solvent consumption savings of up to 95% are possible using micro-fl ow LC, which signifi cantly reduces solvent and waste disposal costs. Furthermore, high on-column linear velocities and low mixing and delay volumes allow for fast chromatography and higher sample throughput. Micro-fl ow chromatography also enables the use of signifi cantly smaller sample injection volumes, while maintaining equivalent sensitivity compared to traditional HPLC, making micro-fl ow LC an excellent fi t for the analysis of estradiol (E2) in clinical research samples, which may be limited in size and availability.Methods: The Eksigent ekspert™ microLC 200 system, a dedicated microfl ow UHPLC system, has been used to develop a sensitive micro-LC/MS/MS method for the analysis of estradiol in human serum. Chromatographic separation was achieved in a run-time of 4 minutes, using a Halo C18 column (0.5x50mm) at a fl ow rate of 25 uL/min. This represents a signifi cant time savings compared to the equivalent high-fl ow LC-MS/MS analysis, which typically requires a run-time of greater than 7 minutes to achieve adequate chromatographic separation of estradiol from potential interferences

Endocrinology/Hormones Tuesday, July 30, 9:30 am – 5:00 pm
CLINICAL CHEMISTRY, Vol. 59, No. 10, Supplement, 2013 A85
in biological samples. The injection volume was set to 5uL, with an overfi ll volume of 2 uL. Mass spectrometric detection was accomplished using the AB SCIEX QTRAP® 5500 system, operating in the Multiple Reaction Monitoring (MRM) mode.Results: Using an injection volume of only 5uL, and at a fl ow rate of only 25 uL/min, the micro-LC/MS/MS method described above has enabled the detection of estradiol in human serum at concentrations as low as 1 pg/mL, with a S/N of approximately 10. A calibration curve was prepared in double charcoal-stripped human serum, over a concentration range from 1 to 500 pg/mL. The CV% over the calibration range ranged from 2.5% (at 500 pg/mL) to 11.70% (at 1 pg/mL), with accuracies ranging from 90 - 111% for n=10 replicate injections. The response was linear over the calibration range, with R = 0.9994.Conclusion: A micro-LC/MS/MS method has been developed for the analysis of estradiol in human serum, with equivalent performance to conventional HPLC-MS/MS analysis. The micro-fl ow method enabled solvent consumption savings of 95% compared to high-fl ow methods, and enabled a reduction of the sample-to-sample injection time, from approximately 7 minutes to approximately 4 minutes.
A-283
The polymorphism in the let-7 targeted region of the Lin28 gene is associated with increased risk of type 2 diabetes
J. Zhang, L. Zhang, R. Fan, J. Lu. Wenzhou Medical College, Wenzhou, China
Background: Genetic polymorphisms in the miRNAs pathway of the pathogenesis of disease might contribute to the risk of disease. Recently, a study reported the let-7/ Lin28 pathway plays important role in the pathogenesis of T2DM, and several polymorphisms have been identifi ed in the let-7 targeted gene Lin28. However, it is unclear whether these polymorphisms are associated with the risk of T2DM and whether the gene markers predict the risk of T2DM.Methods: We performed a case-control genetic association study based on 588 T2DM patients and 588 age and sex matched strictly healthy controls. Restriction fragment length polymorphism technique was used in distinguishing genotype.Results: For the rs3811463 polymorphism, compared with the wild TT genotype, the variant genotype TC+CC could signifi cantly increase the risk of T2DM in the total analysis (OR=1.47, 95%CI=1.13-1.93, P=0.005); after subgroup analysis by sex, the variant genotypes were associated with increased risk of disease in females but not in males. As for the rs3811464 polymorphism, no signifi cantly association was found in the total analysis (OR=1.04, 95%CI=0.79-1.36, P=0.78); after subgroup analysis by sex, the variant genotypes were not associated with increased risk of disease either males or females. In addition, statistically differences were observed in the clinical features of age at diagnosis, hypertension and peripheral neuropathy for the variant genotypes and wild genotype of the rs3811463 polymorphism.Conclusion: Our study indicated that the rs3811463 polymorphism in the let-7/ Lin28 pathway could signifi cantly increase the risk of T2DM.
A-284
Development and Validation of an Improved Chemiluminescent Assay for Inhibin B
M. Attaelmannan1, R. Pandian2, K. Thomassian1, S. Khachatryan1, A. Kumar3. 1Quest Diagnostics Nichols Institute, Valencia, CA, 2Pan Laboratories, Irvine, CA, 3Ansh Laboratories, Webster, TX
Relevance: Inhibins are protein hormones that are secreted by the granulosa cells of the ovary and the Sertoli cells of the testes. These hormones selectively suppress the secretion of pituitary follicle-stimulating hormone (FSH); they also exert local paracrine actions in the gonads. Elevated inhibin B levels have been associated with Sertoli cell function (potential marker for spermatogenesis and testicular function), ovarian reserve, and granulosa cell tumors. Inhibin B is a 32 kDa dimeric hormone composed of two distinct subunits, alpha (α) and beta (β), which are linked by disulfi de bonds. The free α subunit is usually physiologically inactive; the α-β dimer is the biologically active form.Objective: To develop and validate a quantitative chemiluminescent assay for serum inhibin B that conforms to WHO standards.Methodology: We have developed a sandwich-type, enzymatic microplate assay. This assay uses a well-characterized monoclonal antibody pair that is specifi c for inhibin B (captures β subunit and detects α subunit of inhibin B). The antibody pair does not
detect inhibin A, activin A, activin B, AMH, FSH, LH, and TGF-β1, even at twice their normal physiological concentrations. The assay calibrators range from 10 pg/mL to 1300 pg/mL. In this three-step procedure, calibrators, controls, and unknown samples are added to microplate wells coated with an anti-inhibin B antibodyand incubated. Inhibin B in the samples is detected using a biotinylated anti-inhibin B antibody, a streptavidin horseradish peroxidase conjugate (SHRP), and a luminogenic substrate. The emitted luminesence, measured in relative light output units (RLU) using a microplate luminometer, is directly proportional to the concentration of inhibin B.Validation Results: This Inhibin B assay is traceable to the WHO 96/784 IRP Standard and the assay had excellent correlation with a commercially available inhibin B assay. Comparison using 71 serum patient samples showed a correlation coeffi cient of >0.99, a slope of 1.13, and an intercept of 4.23 pg/mL. Total imprecision was 2.68% at 340 pg/mL and 10.59% at 116 pg/mL. No signifi cant interference was observed with hemoglobin, triglycerides, or bilirubin. The LOD was <3 pg/mL and LOQ was 10 pg/mL, and the new assay had an improved dynamic range compared with that of the current commercial assay. No high-dose hook effect was observed with inhibin B concentrations up to 13,000 pg/mL. The assay was also linear for concentrations up to 1300 pg/mL (highest calibrator).Conclusions: A highly sensitive and reproducible microplate inhibin B chemiluminescent assay has been developed. The favorable performance of this laboratory developed test makes it a useful tool for monitoring inhibin B changes in physiological and pathophysiological conditions.
A-285
Development of a Broad-range, Sensitive and Specifi c Immunoassay for Anti-Müllerian Hormone (AMH) with No Dilution Issues
M. Attaelmannan1, R. Pandian2, M. Sadri1, K. Thomassian1, S. Khachatryan1, A. Kumar3. 1Quest Diagnostics Nichols Institute, Valencia, CA, 2Pan Laboratories, Irvine, CA, 3Ansh Laboratories, Webster, TX
Objective: To develop a highly accurate chemiluminescent immunoassay for AMH quantitation that dilutes linearly even at high AMH concentrations.Background: AMH is a 140 kDa glycoprotein belonging to the transforming growth factor-β (TGF-β) superfamily. In males, AMH is produced in the testis from embryogenesis to puberty. In females, small amounts of AMH are produced by the ovaries from birth to menopause. AMH promotes involution of the Müllerian ducts and inhibits female gonadogenesis. It also controls primordial follicle recruitment by limiting the responsiveness of the growing follicles to Follicle Stimulating Hormone (FSH).A commonly used AMH assay, AMH Gen II, is a sandwich immunoassay using two monoclonal antibodies. Although the assay is reproducible, it does not show parallel dilution with standards at high AMH concentrations, thereby producing falsely elevated results. To address these dilution problems, we have developed an assay using two monoclonal antibodies, one specifi c for the pro region of AMH and the other specifi c for the mature region.Methodology: An immunochemiluminometric assay was developed using a capture antibody specifi c for the pro region of AMH (Clone 39/6C) and a detection antibody specifi c for the mature region of AMH (Clone 39/30A). The capture antibody was coated on microtiter plates and serum samples, calibrators, and controls were added to the coated plates and incubated for 90 minutes. AMH was detected using a biotinylated detection antibody, streptavidin-labeled horseradish peroxidase, and a luminol chemiluminescent substrate. Emitted light was measured in relative light units using a luminometer. Sample results were calculated using a standard curve based on human recombinant AMH. Samples with >12 ng/mL AMH were routinely diluted.Results: This new assay has a sensitivity of 0.027 ng/mL and a reportable range of 0.03 to 440 ng/mL. Serum samples with high AMH concentrations dilute in parallel with the standard curve. This assay is highly reproducible, with an interassay CV of 6.4%. The assay is highly specifi c for human AMH, has no cross-reactivity with other members of the TGF-β superfamily, and no interference with lipemic, icteric, and hemolysed samples. Correlation with the AMH Gen II immunoassay is excellent at low concentrations, ie, <10 ng/mL (y = 1.00x - 0.09; R2 = 0.90). However, correlation deviates signifi cantly from the line of unity for samples >10 ng/mL (y = 0.43x + 5.33; R2 = 0.71). This poor correlation is likely due to the Gen II dilution problem and its lack of parallelism for human samples.Conclusion: We have developed a highly sensitive and reproducible immunoassay to quantify all levels of AMH, including high concentrations. The assay is very specifi c for human AMH since human recombinant AMH was used. Because of its wide range, this assay could be used in various pathophysiological conditions.

Tuesday, July 30, 9:30 am – 5:00 pm Endocrinology/Hormones
A86 CLINICAL CHEMISTRY, Vol. 59, No. 10, Supplement, 2013
A-286
Role of Progranulin and Tumor Necrosis Factor-alpha in Polycystic Ovary Syndrome Pathogenesis
A. Uzdogan1, F. Akbiyik2, A. P. Cil3, M. Kuru Pekcan3. 1Hacettepe University Faculty of Medicine, Department of Medical Biochemistry, Ankara, Turkey, 2Hacettepe University Faculty of Medicine, Department of Medical Biochemistry and Clinical Pathology Laboratory, Ankara, Turkey, 3Kirikkale University Faculty of Medicine, Department of Obstetrics and Gynecology, Kirikkale, Turkey
Background: Polycystic ovary syndrome (PCOS) is the most prevelant endocrinological disorder (6-10%) of reproductive age women, which is characterized by menstrual irregularities, hirsutism, acne, obesity and insulin resistance. Chronic infl ammation is frequently associated with central obesity, insulin resistance, type 2 diabetes, dyslipidemia, PCOS and cardiovascular diseases. However the relationship between the basic pathogenesis of PCOS and adipokines is not known very well. Progranulin (PGRN) and TNF-alpha are very important adipokines which are involved in chronic infl ammation. Paraoxanase 1 (PON1), an enzyme associated with high-density lipoprotein (HDL), has anti-oxidant and anti-infl ammatory effects. The aim of this study is to analyze serum PGRN and TNF-alpha levels, serum total oxidant status (TOS), total anti-oxidant status (TAOS) and PON1 enzyme activities and to compare the results of PCOS patients to the healthy control group.Methods: A total of 40 patients with PCOS and 40 healthy women between 18-40 ages are involved in the study groups. Rotterdam criteria was used to evaluate patients. Body mass index (BMI) and homeostasis model of assessment-insulin resistance (HOMA-IR) are calculated for all woman in both groups. Serum PGRN and TNF-alpha levels were analyzed by enzyme immunoassay method. Serum TOS, TAOS levels and PON1 enzyme activities (phenyl acetate as substrate) were measured spectrophotometrically. Statistical evaluation was carried out by using t-test for independent samples and Pearson correlation analyses tests. The differences were considered statistically signifi cant if p<0.05.Results: BMI and HOMA-IR values were not signifi cantly different between patients and control groups. Serum PGRN and TNF-alpha levels are both increased in PCOS patients and control groups. In addition PGRN was positively correlated with TNF-alpha levels in patients with PCOS (p=0.002, r=0.427). TAOS levels and PON1 activity of PCOS patients were signifi cantly higher than the control group (p=0.038) (p=0.009).Conclusions: As it is known that PGRN uses the TNF-alpha receptor, serum PGRN levels may increase to oppose the infl ammatory effects of TNF-alpha in lean PCOS patients. The TAOS levels were increased in lean PCOS patients to reduce the harmful effects of oxidative stress. To observe the relationship of PGRN and TNF-alpha in patogenesis of obesity and insulin resistance, further study was planned to be carried out in obese PCOS patients and obese control groups. This study is supported by Hacettepe University Scientifi c Research Project Coordination Unit (Project number: 012D07101001).
A-287
Atrial Natriuretic Peptides, Renin and Aldosterone in HFRS - pathogenic role and potential therapy target
V. Starostina, A. Gilmanov. Bashkir State Medical University, Ufa, Russian Federation
Renin-angiotensin-aldosterone system (RAAS) and natriuretic peptides (NP) generally control the function of kidneys, adrenal glands and cardiovascular system. RAAS pathology may play a role in pathogenesis of Hemorrhagic Fever with Renal Syndrome (HFRS), and thus be a target for therapeutic actions.The aim of the present study was to measure NP levels and RAAS activity in patients with dif-ferent phases and severity of HFRS. 57 hospitalized patients aged 16-56 and 26 healthy volunteers as the control were included into investigation. Plasma levels of Atrial Natriuretic Peptide (ANP1-28) and N-terminal Atrial Natriuretic Propeptide (NT-proANP1-98) were measured by ELISA, serum level of aldosterone and Plasma Renin Activity (PRA) - by RIA (Immunotech, Czech Republic); data processed with nonparametric methods.We revealed phase-dependent decrease in ANP1-28 concentration in patients with moderate HFRS in oliguric, polyuric and early recovery phases (Me=83.6 - 57.8 - 68.2 ng/ml) compared to the control (Me=85.4 ng/ml); in severe HFRS the changes were more pronounced (Me=55.1 - 33.0 - 52.8 ng/ml). Perhaps, the dynamics of ANP1-
28 is due to atrial tissue damage (micro-hemorrhages) and release of ANP1-28 in early phases of the disease (feverish and oliguric) and further depletion of hormone synthesis and/or quick degradation caused by high plasma proteolytic activity as a result of system cytolysis and/or DIC (thrombin, plasmin etc).At the same time, signifi cant increase of NT-proANP1-98 plasma level was found in oliguric, polyuric and early recovery phases as in moderate HFRS (Me=2.5 - 4.9 - 2.0 nmol/l) as in severe HFRS (Me=3.0 - 7.6 - 2.0 nmol/l) compared to the control level (Me=1,2 nmol/l). These shifts may be the result of proANP1-126 accelerated cleavage to ANP1-28 and NT-proANP1-98 by active Neutral Endopeptidase (NEP) in tissues and blood while renal structures responsible for further metabolic transformation of NT-peptide are being seriously damaged.The signifi cant increase in aldosterone level was observed only in oliguria in patients with moderate and severe HFRS (Me=2660,5 - 4932,3 nmol/l), whereas in polyuria the hormone level was low (Me=75,7 - 112,1 nmol/l), slightly raised in early recovery (Me=211.4 - 327.8 nmol/l) but not reached the control level (Me=397.9 nmol/l). Similar dynamics observed in renin activity: PRA raised in oliguric phase in both moderate and severe HFRS (Me=11,2 - 18,5 ng AT-1/ml/h), lowered above the control in polyuric phase (Me=0,2 - 0,8 ng AT-1/ml/h) and came a little above the control level in early recovery (Me=1.6 - 3.8 ng AT-1/ml/h; in control Me=1.4).Thus, observed fall in ANP1-28 level in HFRS patients accompanied by RAAS activation may lead to sodium retention in tissues, spasm of afferent arteriole and decreased urine output - one of the main symptoms and factors of HFRS pathogenesis. It is known that the use of NEP inhibitors as drugs is accompanied by the increase in NP level in plasma and tissues due to the slowing-down of NP disintegration. That leads to increased diuresis, vasodilatation and improved renal hemodynamics. Meaning this NEP inhibitors may be potentially considered as pathogenic means of treatment of HFRS.
A-288
Development of a Hemoglobin A1c Assay for the ARCHITECT® c4000 and c8000 Analyzers.
M. I. Suszko, L. Templin, J. Viant, K. Duitsman, D. Markley, T. Hajduk, L. Zhou, T. Rosiere, C. Pestel. Abbott Laboratories, Abbott Park, IL
Background: Hemoglobin A1c (HbA1c) is the fraction of hemoglobin A that is glycated at one or both N-terminal valines of the beta-chain. Higher ambient glucose levels and longer red blood cell circulation time correlate with higher concentrations of HbA1c. HbA1c measurements have been widely used in the monitoring of long-term blood glucose control and compliance in individuals with diabetes mellitus. A new automated whole blood assay for Glycated Hemoglobin A1c was developed for use on the ARCHITECT® c4000 and c8000 as an aid in the diagnosis of diabetes mellitus, to identify patients who may be at risk for developing diabetes mellitus and for the monitoring of long-term blood glucose control in individuals with diabetes mellitus.The Hemoglobin A1c assay utilizes an enzymatic method that specifi cally measures N-terminal fructosyl dipeptides of the beta-chain of HbA1c and consists of two separate measurements: glycated hemoglobin (HbA1c) and total hemoglobin (THb). The two concentrations are used to determine the percent HbA1c (National Glycohemoglobin Standardization Program [NGSP] units) or the hemoglobin fraction in mmol/mol (International Federation of Clinical Chemistry and Laboratory Medicine [IFCC] units). This Hemoglobin A1c assay uses anticoagulated whole blood specimens that can be hemolyzed automatically on the system. It also processes both THb and HbA1c results from a single cuvette improving accuracy and precision of the results.Methods: A number of key performance measurements of the ARCHITECT clinical chemistry Hemoglobin A1c assay were confi rmed. A 20-day precision study was performed following CLSI EP5-A2 guidance document and using panels and controls across measuring interval. A multi-reagent lot method comparison study versus NGSP Secondary Reference Laboratory (SRL) method was completed following CLSI EP9-A2-IR and using 128 clinical specimens. Interferences from abnormal hemoglobin levels and potentially interfering hemoglobin derivatives, among others, were evaluated, and a sample comparison with a secondary reference laboratory was performed following the NGSP certifi cation protocol.Results: Within-lab (total) imprecision CVs for data reported in NGSP units ranged from 0.3% to 0.6%. Correlation to the NGSP Secondary Reference Laboratory (SRL) method demonstrated a slope of 1.01, intercept of -0.2, correlation coeffi cient of 0.995, and a predicted bias of less than 3% at 6.0, 6.5, and 7.0 %HbA1c using Deming regression. The assay’s measuring interval was established from 4.0 to 15.0 %HbA1c. In addition, 38 of 40 samples tested following the NGSP certifi cation protocol were within 7% of SRL results as required for the manufacturer’s certifi cation.

Endocrinology/Hormones Tuesday, July 30, 9:30 am – 5:00 pm
CLINICAL CHEMISTRY, Vol. 59, No. 10, Supplement, 2013 A87
Interference with acetylated, carbamylated or labile hemoglobin was observed at less than or equal to 3%. The assay is also designed to have a difference in specifi city of samples containing abnormal hemoglobin variants C, D, E, F and S within +0.14 %HbA1c for samples <5.7 %HbA1c, +3% for samples within the range of 5.7 to 7.0 %HbA1c, (inclusive), and +5% for samples >7.0 %HbA1c.Conclusion: These results demonstrate that the new ARCHITECT clinical chemistry Hemoglobin A1c assay is a precise and accurate method for measuring HbA1c in human whole blood on a high throughput analyzer. The performance supports use of this assay as an aid to diagnose and monitor diabetes mellitus.
A-289
Serum calcium (s-Ca) requesting inappropriateness to detect Primary hyperparathyroidism (pHPT): The forgotten test
M. Salinas1, M. Lopez Garrigos1, F. Pomares1, J. Lugo1, A. Asencio2, L. López-Penabad1, J. R. Dominguez1, C. Leiva-Salinas3. 1Hospital Universitario San Juan, San Juan, Spain, 2Primary Care Center of Mutxamel, Mutxamel, Spain, 3Hospital Universitario y Politécnico La Fe, Valencia, Spain
Background: With the introduction of automated multichannel continuous-fl ow analyzers, pHPT, the silent disease, began to be detected through hypercalcemia results. Later, with random access analysers, tests were again requested according to patient clinical symptoms; in that scenario s-Ca could become the forgotten test. In consensus with endocrinologists and general practitioners (GP), we implemented a strategy to “catch” pHPT patients.Methods: The laboratory serves a population of 234 551 inhabitants, including 9 different primary care centers (PCC). From 21/12/2011 to 3/10/2012, the Laboratory Information System automatically added s-Ca to every phlebotomized primary care patient older than 45, without s-Ca request in the previous three years. If hypercalcemia was detected (albumin-corrected s-Ca >2.6 mmol/L), phosphate, 25-hydroxy vitamin D and parathyroid hormone (PTH) were automatically processed in the same sample. Before establishment, the strategy was communicated to PCCs GPs coordinators. We reviewed the medical record for every patient with hypercalcemia.Results: Blood samples from 61674 patients were analysed. s-Ca was automatically added to 14461 samples, generating 73 hypercalcemia results. 21 corresponded to patients taking diuretics, malignancies, etc (Figure). 52 were unexpected: 34 resulted in a diagnosis of pHPT and 18 were not followed to fi nd out the hypercalcemia root cause, being actually in study. The prevalence in this population of pHPT was 0.24%. The cost of adding s-Ca, and extra tests in the 73 patients with hypercalcemia was 1987 dollars.Conclusion: Opportunistic screening to discover pHPT through adding s-Ca to every phlebotomized primary care patient above 45 years old, with no previous s-Ca requests is clearly cost-effective. s-Ca was not adequately requested to detect asymptomatic pHPT. This emphasizes the need to establish strategies to identify pHPT, to avoid complications of untreated disease. Pathologists should help physicians to detect and respond to clinically important results through strategies that aid to unmask key results.
A-290
Estimation of biological variation and reference change value of glycated hemoglobin (HbA1c) when two analytical methods are used
F. Ucar1, G. Erden1, Z. Ginis1, G. Ozturk1, S. Sezer2, M. Gurler3, A. Guneyk1. 1Diskapi Yildirim Beyazit Training and Research Hospital,Department of Clinical Biochemistry, Ankara, Turkey, 2Numune Training and Research Hospital,Department of Clinical Biochemistry, Ankara, Turkey, 3Ankara Branch of the Council of Forensic Medicine, Department of Chemistry, Ankara, Turkey
Background: To date, several studies have dealt with biological variation of HbA1c in diabetic or/and in healthy individuals. However, available data on biological variation of HbA1c revealed marked heterogeneity. There is still need for robust data. We therefore investigated and estimated the components of biological variation for HbA1c in a group of healthy individuals by applying a recommended and strictly designed study protocol using two different assay methods.Methods: Four EDTA whole blood samples were collected from each individual (20 women, 9 men; 20-45 years of age) and stored at -80°C until analysis. Each month, samples were derived on the same day, for three months. HbA1c values were measured by both high performance liquid chromatography (HPLC) (Shimadzu, Prominence, JAPAN) and boronate affi nity chromatography methods (Trinity Biotech, Premier Hb9210, Ireland) on the same day. All samples were assayed in duplicate in a single batch for each assay method. Data were analyzed by SPSS 15.0 and estimations were calculated according to the formulas described by Fraser and Harris.Results: All of the estimations were performed for both assay methods. No signifi cant differences for measured parameters were observed between the male and female participants except BMI (p<0.05). The within subject (CVI) - between subject (CVG) biological variation were 1.17% and 5.58% for HPLC, respectively. The calculated CVI and CVG were 2.15% and 4.03% for boronate affi nity chromatography, respectively. Reference change value (RCV) for HPLC and boronate affi nity chromatography was 5.4 % and 10.4 % respectively and individuality index (II) of HbA1c was 0.35 and 0.93 respectively. Minimum, desirable and optimal analytical goals for imprecision, bias, total error were also estimated by using obtained data for both assay methods.Conclusion:This study for the fi rst time described the components of biological variation for HbA1c in healthy individuals by two different assay methods. Obtained fi ndings showed the difference between CVA values of the methods might considerably affect RCV. These data regarding biological variation of HbA1c could be useful for a better evaluation of HbA1c test results in clinical interpretation.
A-291
Four Commonly Utilized Immunoassays Fail to Detect TSH in a Cohort of Euthyroid Patients: Are TSH Assays Hyper-Selective?
J. C. Drees1, J. A. Stone2, C. R. Reamer3, V. E. Arboleda3, K. Huang1, J. Hrynkow1, D. N. Greene1, M. S. Petrie1, C. Hoke1, T. S. Lorey1, R. S. Dlott1. 1Kaiser Permanente Regional Laboratroies, Berkeley, CA, 2UCSD Center for Advanced Laboratory Medicine, San Diego, CA, 3Siemens Healthcare Diagnostics, Tarrytown, NY
Background: The diagnostic accuracy of TSH immunoassays is considered suffi ciently reliable to support screening and therapeutic monitoring of thyroid dysfunction. Low TSH results due to functionally compromising TSH mutations have been reported. Here we describe a new phenomenon of functional TSH which is falsely undetectable by four widely-used FDA-approved TSH immunoassays marketed by a single vendor.Methods: A clinically euthyroid woman of South Asian descent with discordant TSH results was identifi ed by a physician. The patient had undetectable TSH on our routine assay and normal TSH on an alternate assay. Additional cases were identifi ed by refl exing all TSH results <0.01 μIU/mL to a second assay. Discordant samples were evaluated on up to eight FDA-approved TSH immunoassays. Retrospectively, thyroid results, diagnoses and medications from 1.6 million individuals were analyzed using electronic medical record database mining. Modifi ed TSH assays were built to investigate the cause of the undetectable results.Results: We have identifi ed a cohort of 17 individuals of shared ethnicity with falsely undetectable TSH (<0.01 μIU/mL) in four of eight commercially available TSH assays. In all cases, retrospective review revealed that clinical assessments, free T4, and T3 results were not consistent with the undetectable TSH results. Partial

Tuesday, July 30, 9:30 am – 5:00 pm Endocrinology/Hormones
A88 CLINICAL CHEMISTRY, Vol. 59, No. 10, Supplement, 2013
results from 11 of these patients are summarized in the accompanying table. Specifi c antibodies failing to detect TSH in these cases were identifi ed in the four affected assays.Conclusion: To date, 17 cases have been identifi ed out of approximately two million Northern California Kaiser Permanente members. We suspect these individuals have a previously unrecognized, functionally normal, TSH variant to which some monoclonal antibodies fail to bind. More than half of these individuals were initially treated based on repeated falsely undetectable TSH values. Health care providers should be aware of the limitations of hyper-selective TSH immunoassays.
A-292
Age and gender-related variation in concentrations of cortisol, cortisone and cortisol/cortisone ratio
M. M. Kushnir, S. L. La’ulu, R. Greer, J. A. Ray, A. L. Rockwood, M. L. Rawlins, A. W. Meikle, J. A. Straseski. ARUP Laboratories, Salt Lake City, UT
Background: Cortisol is commonly measured for diagnosis of neuroendocrine disorders associated with function of hypothalamus pituitary adrenal axis. Because of strong diurnal variation, reference intervals for cortisol are typically established for the morning and afternoon blood draw. Data describing the association of age and gender with concentrations of cortisol (F), cortisone (E), and the cortisol/cortisone ratio (FER) are limited. We determined concentrations of F, E and FER in serum samples from healthy adults (collected between 8 and 10am) and evaluated distributions of the observed concentrations for association with age, gender, menopausal status, and stage of menstrual cycle.Methods: Concentrations of F, E and FER were determined using a liquid chromatography - tandem mass spectrometry (LC-MS/MS) method in 76 serum samples from self-reported healthy adult volunteers 18-60 years old (yo) (42 men and 35 women: 19, 23, 23 and 11 individuals of age groups of 18-30, 31-40, 41-50 and 51-60, respectively). During the analysis two mass transitions were monitored for E, F and the internal standards; ratio of the mass transitions was used to confi rm specifi city of the measurements. Association of the observed values for the continuous variables was performed using ANOVA; estimate of the differences among the groups was performed with the Wilcoxon test.Results: Concentrations of F and E declined by an average 25 and 2.5 nmol/L per decade of life (p-values for parameters of linear regression 0.047 and 0.026), respectively. FER was lower in men than in women (p=0.017). No statistically signifi cant difference in distribution of concentrations was observed between premenopausal (PrMW) and postmenopausal (PoMW) women. Higher concentrations of F and E were observed in 18-30 yo women, as compared to 41-50 yo women (p= 0.06 and 0.005). FER was higher in 18-30 yo women than in 18-30 yo men (p=0.009). Concentrations of F and FER in PrMW decreased during the menstrual cycle; concentrations of F decreased on average by 30 nmol/L per week, and average FER decreased by 0.4 per week (p-values for parameters of linear regression 0.05 and 0.08,
respectively). No signifi cant differences in F, E and FER were observed among men 18-30, 31-40, and 41-50 yo; signifi cantly lower concentrations of F were observed in 51-60 yo men, as compared to 41-50 yo men (p=0.045).Conclusion: We observed a decline in concentrations of F, E, and FER in men and women with advancing age. Higher concentrations of F and E were observed in 18-30 yo women than in all other age groups in both genders. Concentrations of F and FER declined during the menstrual cycle, with the lowest concentrations observed at the end of the luteal phase. These observations suggest that typically used reference intervals for F, E and FER associated only with the time of the blood draw, may inaccurately describe the physiological variation of F, E and FER. Based on our data, age-, gender- and stage of menstrual cycle-associated reference intervals of F, E, FER are warranted.
A-293
Non-oxidized, biological active parathyroid hormone determines mortality in hemodialysis patients
B. Hocher1, F. Armbruster2, M. Tepel3. 1Inst. of Nurtitional Science, Potsdan Nuthetal, Germany, 2Immundiagnostik AG, Bensheim, Germany, 3Inst. of Nurtitional Science, Odense University Hospital, Denmark
Background: Animal studies showed that non-oxidized PTH (n-oxPTH) is bioactive, whereas oxidation of PTH at methionine residues results in loss of biological activity. Now, we analyzed the effect of n-oxPTH on mortality in hemodialysis patients.Methods: We performed a prospective cohort study in 340 hemodialysis patients. PTH was measured by means of a third generation intact-PTH immunoassay system, either directly (total intact parathyroid hormone, iPTH) and after prior removal of oxidized PTH molecules from the samples using specifi c monoclonal antibodies raised against oxidized human PTH. The association between n-oxPTH concentrations and survival was assessed by Kaplan-Meier analysis.Results: Hemodialysis patients (224 men/116 women) had a median age of 66 years. 170 patients (50%) died during the follow up time of 5 years. Median n-ox-PTH levels were higher in survivors (7.2 ng/L) comparedto deceased patients (5.0 ng/L; p=0.002). Survival analysis showed an increased survival in the highest n-ox-PTH tertile compared to the lowest n-oxPTH tertile (Chi square 14.3; p=0.0008). Median survival was 1702 days in the highest n-ox-PTH tertile, whereas it was only 453 days in the lowest n-oxPTH tertile. Multivariable-adjusted Cox regression showed that higher age increased odds for death, whereas higher n-oxPTH reduced the odds for death. Another model analyzing a subgroup of patients with iPTH concentrations at baseline above the upper normal limut of the iPTH assay (70 ng/L) revealed that mortality in this subgroup was associated with PTH oxidation but not with n-oxPTH levels.Conclusion: In conclusion, the predictive power of n-oxPTH and iPTH on mortality of patients on dialysis differs substantially indicating that the underlying biological processes might be different. The iPTH associated mortality especially when iPHH levels are high refl ects mainly protein oxidation/oxidative stress.
A-294
Comparison of three commercially available immunoassays for measurement of 25-hydroxyvitamin D with an LC-MS/MS method capable of resolving 3-epi-25-hydroxyvitamin D3
B. Niravel, G. Maine, E. Sykes, K. Leonard, S. Barden, B. Bailey, M. P. Smith. Beaumont Health System, Royal Oak, MI
Background: Two commonly used methods for 25-hydroxyvitamin D (25-OHD) measurement are automated immunoassays for total 25-OHD, and liquid chromatography-tandem mass spectrometry (LC-MS/MS) capable of separating and measuring 25-hydroxyvitamin D3 (25-OHD3) and 25-hydroxyvitamin D2 (25-OHD2). The presence of 3-epi-25-OHD3 is not often differentiated on LC-MS/MS due to co-elution and a shared mass-transition with 25-OHD3. However, by manipulating elution time and employing a fl uoro-phenyl column, we were able to effi ciently elute and measure 3-epi-25-OHD3 as a distinct peak (LOQ = 4.0 ng/mL). Compared to 25-OHD3, the active metabolite of 3-epi-25-OHD3 may have a reduced effect on calcium regulation while still suppressing PTH secretion. The purpose of this study was to compare our laboratory-developed LC-MS/MS method to three commercially available immunoassays measuring total 25-OHD (Abbott ARCHITECT, Diasorin Liaison, Siemens Centaur), and to determine the prevalence of 3-epi-25-OHD3 in this study cohort.

Endocrinology/Hormones Tuesday, July 30, 9:30 am – 5:00 pm
CLINICAL CHEMISTRY, Vol. 59, No. 10, Supplement, 2013 A89
Methods: Serum aliquots (n = 169) were frozen and tested in batches of 30 on each instrument. Each batch was assigned to an eight hour window for testing on 6 separate days. EP evaluator software was used for analysis.Results: See tableConclusions:1. Results from the Abbott ARCHITECT were not statistically different from LC-MS/MS. However comparison of results from the Diasorin Liaison and Siemens Centaur with LC-MS/MS were statistically different.2. The Diasorin Liaison demonstrated the best correlation with LC-MS/MS in 25-OHD defi cient samples (<24 ng/mL).3. 3-epi-25-OHD3 was measured in 28% of samples by LC-MS/MS, primarily in those with total 25-OHD levels that were suffi cient or elevated (>80 ng/mL).
Table: Immunoassay Comparison to LC-MS/MSInstrument Sample Cohort n* Slope Intercept SEM r p-valueAbbott ARCHITECT All 144 0.962 1.74 7.26 0.947 0.388Diasorin Liaison All 166 0.731 2.56 6.31 0.970 <0.001Siemens Centaur All 166 0.971 -4.64 10.9 0.949 <0.001Abbott ARCHITECT 25-OHD<24 67 0.813 5.32 2.9 0.876 <0.001Diasorin Liaison 25-OHD<24 67 0.803 2.15 2.55 0.901 0.477Siemens Centaur 25-OHD<24 67 0.536 5.65 3.05 0.732 0.970*Results falling outside the AMR or with greater than 100% difference between methods were excluded
A-295
Serum Soluble Transferrin Receptor is not higher in male diabetics compared to normal subjects in Singapore
L. Ong, M. Chong, S. Saw, S. Sethi. National University Health System, Singapore, Singapore
Introduction: Some studies show a relationship between body iron stores and hyperinsulinemia, with ferritin and serum soluble transferrin receptor (STFR) being commonly measured as surrogates for body iron stores. However, there are no local data on STFR elevations in hyperinsulinemia or diabetes mellitus (DM). Hence we look at STFR values in our male patients with DM, impaired fasting glucose (IFG) against normal controls and potential association with cardiovascular factors.Materials and methods: Archived samples sent to our laboratory for DM or hypertensive panels were screened, with female subjects and those with recent hemoglobin concentration below 14g/dL excluded as possible confounders of anemia. DM and IFG subjects were selected for STFR measurements, using Cobas® Integra STFR kit. Our hospital archived health screening samples served as normal controls.Results of the lipid profi le, fasting glucose concentrations and blood pressure readings were collated and analysed with the STFR concentration for possible correlations using SPSS software.Results: 152 subjects were included in the study (87 DM, 51 normal controls and 14 IFG). Median age was highest in diabetics (61, 58, 35 years old in DM, IFG and normal controls respectively), with lowest HDL (1.07, 1.14, 1.37 mmol/L) and LDL concentrations (2.30, 2.59, 3.06 mmol/L) (p<0.05). STFR concentrations were similar between DM, IFG and normal controls, and positively correlated with systolic blood pressure (p<0.05). After correction for age, HDL, LDL, TG and blood pressure readings, there was no statistical signifi cance.Conclusion: This is a cross-sectional study looking at STFR concentrations in DM, IFG against normal controls with negative fi ndings, but perhaps STFR measurements at more timepoints are needed. LDL concentrations were lowest in diabetics suggesting that their cardiovascular risk factors may be well controlled (median HbA1c was 7.1%) and hence the STFR concentrations were similar to normal controls.
A-296
Study of the association between acromegaly and the presence of BRAFV600E mutation and immunohistochemical expression of IGF-1 and galectin-3 in papillary thyroid carcinoma
R. M. MONTENEGRO1, M. G. CASTELO2, C. M. M. PONTE2, R. M. MONTENEGRO JR1, P. SABINO1, R. CINTRA1, T. J. P. G. BANDEIRA3, O. FERNANDES4. 1UFC, FORTALEZA, Brazil, 2UFC; DASA, FORTALEZA, Brazil, 3DASA, FORTALEZA, Brazil, 4DASA, SAO PAULO, Brazil
Background: Epidemiological studies suggest that thyroid carcinoma is the most common malignant neoplasm in acromegalic patients. At this moment there are no reports of studies evaluating molecular markers of papillary thyroid carcinoma (PTC) in this population. The present work aimed to evaluate the association between acromegaly, expression of the mutation BRAFV600E, immunohistochemical markers (galectin-3 and IGF-1), and clinical-pathological characteristics in acromegalic patients with PTC.Methods: This is a cross-sectional study conducted from January/09 to December/2011, where 11 acromegalic patients with CPT, from 5 Brazilian centers of reference in the treatment of acromegaly were compared with 45 patients with acromegaly without PTC. We evaluated clinical and histopathological variables of PTC. We used histological PTC embedded in paraffi n for mutation study BRAFV600E and immunohistochemical analysis of markers IGF-1 and galectin-3. In the analysis we used the Student t test and chi-square test (SPSS software, version 13.0 for Windows) (p <0.05).Results: The average age of acromegalic patients with PTC was 61.5 ± 6.02 years and 72.7% were female. The average time of diagnosis of acromegaly was 7.7 ± 3.90 years, and the interval between diagnosis of acromegaly and PTC was an average 3.4 ± 2.71 years. The serum levels of IGF-1 in the diagnosis of acromegaly PTC was 417.0 ng / mL. There was no difference in the TNM (Tumor, Nodule, Metastasis) and AMES prognostic index (Ages, Metastasis, Extent, Size) between groups. There was a higher prevalence of the BRAFV600E mutation (90.9% vs 55.6%, p = 0.039) and stronger immunohistochemical expression for IGF-1 (88.9% vs 38.1%, p = 0.017) in acromegaly. There was no difference in the expression of galectin-3 between the groups.Conclusion: This work for the fi rst time showed a high prevalence of mutations in BRAFV600E in PTC of acromegalic patients superior to those described in the population with PTC in this and previous studies (approximately 40%). However, this mutation was not associated with a more aggressive tumor phenotype, which differs from the fi ndings in acromegalic population without PTC. We conclude that acromegaly is possibly associated to a mutation BRAFV600E in acromegalic patients with CPT. Further studies are needed to defi ne the mechanisms responsible for this association.
A-297
Validation of clinical risk-prediction models for gestational diabetes
S. Thériault1, J. Forest1, J. Massé2, Y. Giguère1. 1CHU de Québec Research Center, Québec, QC, Canada, 2CHU de Québec, Québec, QC, Canada
Background: Gestational diabetes (GDM) is a steadily-increasing cause of adverse pregnancy outcomes worldwide. It is generally diagnosed late in pregnancy, during the third trimester. This study aims to validate, in a large population, models based on clinical characteristics recently proposed to identify, early in pregnancy, women at high risk of developing GDM.Methods: This is a cohort study including 7,929 pregnant women recruited at their fi rst prenatal visit between 2005 and 2010 in the Quebec City metropolitan area. Exclusion criteria were: age < 18 years old, renal disease, pregestational diabetes, multiple pregnancy and uncertain diagnosis. Clinical information was obtained by a self-administered questionnaire and extraction of data from the medical records. GDM diagnosis was established based on glucose measurements according to the recommendations of the Canadian Diabetes Association. The performance of four recently proposed risk-prediction models was evaluated to detect women who developed GDM and those who subsequently required insulin therapy.Results: The four models yielded areas under the receiver operating characteristic curve (AUROC) between 0.68 and 0.76 for the identifi cation of women who developed GDM (Table 1). Although calibration was poor (χ2= 29.71-73.33, p<0.0001), the performance was similar to those obtained in the original studies.

Tuesday, July 30, 9:30 am – 5:00 pm Endocrinology/Hormones
A90 CLINICAL CHEMISTRY, Vol. 59, No. 10, Supplement, 2013
The most performing model, based on ethnicity, body-mass index, familial history of diabetes and past history of GDM, resulted in sensitivity, specifi city, positive and negative likelihood ratio and AUROC of 73%, 81%, 3.8, 0.3 and 0.82 respectively for the identifi cation of women with GDM requiring insulin therapy.Conclusion: External validation in a large cohort of Caucasian women of four risk-prediction models based on clinical characteristics yielded a moderate performance, but the strategy seems particularly promising for the early prediction of GDM requiring insulin therapy. Addition of selected biochemical markers to such model has the potential to reach a performance justifying clinical implementation.$$MISSING OR BAD TABLE SPECIFICATION {9B5AF915-94D4-445F-8E12-EECAC406DAF6}$$
Table 1: Performance of the clinical risk-prediction models to identify women who developed GDM
Model Risk Factors n GDM
n Total Se Sp LR+ LR- AUROC
(95% CI)Naylor et al. (1997) Maternal age, BMI, Ethnicity 324 6,160 72.2 55.1 1.6 0.5
0.67 (0.64-0.70)
Caliskan et al. (2004)
Maternal age, BMI, Fam. History of diabetes, Prev. macrosomic infant, Prev. adv. obst. outcome
311 5,639 71.1 59.3 1.7 0.50.68 (0.65-0.71)
Van Leeuwen et al. (2010)
BMI, Ethnicity, Fam. history of diabetes, Prev. GDM 280 5,302 60.4 80.7 3.1 0.5
0.76 (0.73-0.79)
Teede et al. (2011)
Maternal age, BMI, Ethnicity, Fam. history of diabetes, Prev. GDM
247 4,408 65.6 75.0 2.6 0.50.74 (0.70-0.78)
BMI: body-mass index; GDM: Gestational diabetes; Se: sensitivity; Sp: specifi city; LR+: positive likelihood ratio; LR-: negative likelihood ratio; CI:confi dence interval; Performance at the threshold optimizing Youden index
A-298
Establishment of Reference Intervals for Prolactin after Precipitation with Polyethyleneglycol and Detection of Macroprolactin
D. T. Meier, M. A. V. Willrich, D. R. Block, N. A. Baumann. Mayo Clinic, Rochester, MN
Background: Approximately 15% of hyperprolactinemic patients have 30-60% macroprolactin, a complex of prolactin and immunoglobulin. Macroprolactinemia is a benign condition and should be suspected when hyperprolactinemia is asymptomatic or pituitary imaging studies are not informative. Polyethyleneglycol (PEG) precipitation is a widely used method to detect macroprolactinemia. However, controversy exists about how to report and interpret PEG-precipitation results. The objectives of this study were to: i) compare PEG-precipitation to gold standard gel fi ltration chromatography (GFC) for detecting macroprolactin in serum; ii) establish reference interval (RI) for post-PEG-precipitation prolactin (post-PEG PRL) and %PEG-precipitated prolactin (%PEG-ppt PRL) in normoprolactinemic subjects; iii) validate the established RIs using samples from patients with clinically-defi ned hyperprolactinemia; and iv) compare the use of post-PEG PRL RIs with a % PEG-ppt PRL cut-off for detecting macroprolactinemia.Methods: Prolactin was measured using the Roche Prolactin II assay on a Cobas 8000e immunoassay analyzer (Roche Diagnostics). Precision (intra-assay, n=10; inter-assay, n=13days), measurable range and analyte stability were determined for the PEG-precipitation method. Method comparison between GFC and PEG-precipitation was performed (n=15). Residual serum samples from female (F, n=217) and male (M, n=138) patients having prolactin concentrations within gender-stratifi ed reference intervals (M, 2.0-15.3ng/mL, F, 3.0-23.3ng/mL) were PEG-precipitated and prolactin (post-PEG PRL) in the supernatant was measured. Reference intervals and 90% confi dence intervals (CI) were established using EP Evaluator (nonparametric analysis). A hyperprolactinemia (prolactin greater than reference interval) cohort included patients with physician-ordered prolactin (F n=26, M n=97) or macroprolactin (F n=191, M n=41). Residual serum samples were PEG-precipitated and post-PEG PRL was measured. Medical records were reviewed for 49 hyperprolactinemic patients and divided into symptomatic with known etiology (n=34) or asymptomatic with unknown etiology (n=15). Results: Intra- and inter-assay imprecision were 3% and 7%, respectively. The measurable range was 1-400ng/mL (slope=1.00, y-intercept =1.78, r2=1.00) and prolactin recovery for x400 dilutions was 91-96%. Samples were stable (<13% change from baseline) at room temperature for 24h, refrigerated 7 days, frozen 30 days and 3 freeze/thaw cycles. Linear regression analysis of the method comparison between GFC and PEG-precipitation yielded: %PEG-ppt PRL = 0.78(GFC %Macroprolactin) + 20.3 (R2=0.72). Post-PEG PRL reference intervals(RI) and 90% confi dence intervals(CI) were: Female: 3.4-18.5ng/mL (90%CI: 2.4-3.6,17.0-20.6) and Male: 2.7-13.1ng/mL (90%CI: 1-3.3,12.2-14.2). The RI for %PEG-ppt
PRL was 9-61% (90%CI:6-10,55-66). Of 355 patients with elevated serum prolactin, 47(13%) post-PEG PRL and 22(6%) %PEG-ppt PRL results were within RI. Nineteen (5%) patients had both post-PEG PRL and %PEG-ppt PRL results within RI. For those hyperprolactinemic patients with post-PEG PRL within or outside the RI, the mean±SD %PEG-ppt PRL was 55±19% and 19±11%, respectively (p<0.0001). Of 48 symptomatic hyperprolactinemic patients, 94% of post-PEG PRL results exceeded the RI while 100% of %PEG-ppt PRL were within the RI. Only one patient with asymptomatic hyperprolactinemia had post-PEG PRL within the RI (F, 13.6ng/mL) and the %PEG-ppt PRL was 64%.Conclusions: Post-PEG PRL and %PEG-ppt PRL RIs were established and validated in a clinically-defi ned hyperprolactinemic population. The sole use of a %PEG-ppt PRL cut-off could potentially misclassify patients.
A-299
Modifi cation of a urinary metanephrine HPLC assay to include 3-methoxytyramine
L. Liu, S. E. Taylor, M. A. Virji. University of Pittsburgh School of Medicine, Pittsburgh, PA
Background: Biologically functional tumors of neural crest origin, such as pheochromocytoma, produce high levels of catecholamines (epinephrine and norepinephrine) resulting in systemic hypertension and associated morbidities that are amenable to surgical management. Dopamine producing pheochromocytoma although rare, also exists and may present a diagnostic challenge. 3-Methoxytyramine (3-MT), together with metanephrines (metanephrine and normetanephrine), are the 3-O-methylated metabolites of dopamine, epinephrine and norepinephrine, respectively. Urinary or plasma metanephrines are currently the most reliable laboratory tests for pheochromocytoma. Rare dopamine producing pheochromocytoma can be missed if 3-MT analysis is not available as a part of the catecholamine assay profi le. The aim of this study is to modify our current urinary metanephrine high performance liquid chromatography (HPLC) profi le to include 3-MT, therefore providing 3-MT analysis helpful in the diagnosis of dopamine producing pheochromocytoma.Methods: The analysis system for urinary metanephrines (metanephrine and normetanephrine) is an ESA HPLC system comprised of a C18 column (5μm, 250 mm x 4.6 mm, ESA Meta-250), a model 584 pump, and a CoulArray™ detector with eight electrochemical cells. Isocratic mobile phase (ESA Ucat/Mets) for the assay has a fl ow rate of 1.2 mL/min. 3-MT standard solution or spiked urine samples were acid hydrolyzed, diluted, and fi ltered prior to analysis. 3-MT quantifi cation was carried out by using a Bio-Rad calibrator. 3-MT detection was evaluated for precision, linearity, limit of detection, and limit of quantifi cation.Results: Initial injection of pure 3-MT in the metanephrine HPLC system with a run time of 30 minutes failed to detect this compound. However, after increasing the HPLC run time to 40 minutes, 3-MT was successfully identifi ed with a retention time of 35.7 minutes. The linearity was determined at eight concentration levels from 20 to 1000 ng/mL. The limit of detection was determined to be 10 ng/mL. Within run and between run precision were calculated with a coeffi cient of variation (CV) of 8% and 9%, respectively.Conclusion: Urinary 3-MT is accurately analyzed in the current metanephrine HPLC assay system with minimal modifi cations. The limit of detection is well below the normal urine 3-MT concentrations. This method is sensitive and specifi c for clinical assay of urinary 3-MT. Using this method, 3-MT elevations in patient samples have been identifi ed. We conclude that including 3-MT in our metanephrine HPLC assay system to analyze all catecholamine metabolites simultaneously provides a relatively simple and low cost way to diagnose dopamine secreting pheochromocytomas.
A-300
The association between leptin and insulin resistance in obese adult Nigerian females.
I. D. Osegbe. Lagos University Teaching Hospital, Lagos, Nigeria
Background: Obesity is one of the leading preventable causes of death worldwide. It is associated with insulin resistance and is independently associated with higher cardiovascular risk. Leptin is a hormone produced directly from adipocytes, which has been independently associated with several cardiovascular risk factors including type 2 diabetes mellitus in developed countries. Higher serum leptin levels have been described in females than males. Due to the recent lifestyle changes associated with urbanization and westernization, obesity is on the increase in sub-Saharan

Endocrinology/Hormones Tuesday, July 30, 9:30 am – 5:00 pm
CLINICAL CHEMISTRY, Vol. 59, No. 10, Supplement, 2013 A91
Africa, including the metabolic and cardiovascular complications. Leptin has been inadequately explored as a risk factor for cardiovascular events here. Therefore, the aim of this study is to determine the association between leptin and insulin resistance, an established CVD risk factor, in obese adult Nigerian females.Method: This was a cross-sectional study of obese, adult Nigerian female outpatients at the Lagos University Teaching Hospital, Nigeria. Participants were examined for body mass index (BMI) at their clinic visit. Those with BMI >30kg/m2, not diabetic, pregnant nor lactating, were voluntarily recruited as subjects and instructed to return in a fasting state on an agreed date when serum leptin, fasting plasma glucose, and insulin were determined. Insulin resistance (IR) was calculated with HOMA method using the formula: HOMA-IR = (glucose x insulin)/22.5 for glucose in mmol/l. Pearson correlation coeffi cient was used to determine the association between leptin and HOMA-IR. A p <0.05 was considered to be signifi cant.Results: Eighty (80) obese BMI≥30kg/m2 female subjects (mean±SD age 44.9±9.8years; BMI 39.1±7.24kg/m2) participated in the study. The mean±SD serum leptin level was 48.47±24.73ng/ml; fasting insulin 13.99±10.35μIU/ml; fasting plasma glucose 4.97±1.40mmol/l; and HOMA-IR 3.05±2.53.The association between leptin and HOMA-IR among the subjects was: BMI 30-34.9kg/m2: n=27, r=0.178, p=0.417; BMI 35-39.9kg/m2: n=24, r=0.357, p=0.112; BMI ≥40kg/m2: n=29, r= 0.515, p=0.004*. After controlling for BMI, only subjects with BMI ≥40kg/m2 still had a positive association that was signifi cant (r= 0.458, p=0.014*).Conclusion: Serum leptin levels were positively correlated with IR, which was very signifi cant when BMI was ≥40kg/m2, even after controlling for BMI. This association may indicate thatadult Nigerian females may develop IR at the high extreme of obesity, but more studies would be needed to confi rm this.
A-301
Fasting Serum Soluble CD 163 Predicts Risk for Type 2 Diabetes in Individuals with the Metabolic Syndrome in Rivers State
C. G. Orluwene1, I. N. Nnatuanya2. 1University of Port Harcourt Teaching Hospital, Port Harcourt, Nigeria, 2Madonna University Teaching Hospital, Elele Campus, Elele Town, Rivers State, Nigeria
Background: Activation of adipose tissue macrophages with concomitant low-grade infl ammation is believed to play a central role in the evolution of type 2 diabetes.Aim: To assess whether a new macrophage-derived biomarker, soluble CD163, identifi es at-risk individuals with metabolic syndrome before overt disease develops.Methods: A prospective study of 72 subjects with metabolic syndrome and without overt type 2 diabetes was done from 2006-2011 for incidence of type 2 diabetes. Risk of diabetes was categorized according to age, gender and level of soluble CD163. Statistical analysis system (SAS) 9.2 for windows was used to analyze data.Results: A total of 9 (30%) of the subjects in the age bracket of 20-40 years and 16 (38.1%) of the subjects in the age bracket of 41-60 years and who had high fasting serum soluble CD163 levels (> 1.5mg/L) developed diabetes in 5 years of follow-up. More females [7 (23.3%)] as against 2 (6.7%) male in the 20-40 year age bracket and 11 (26.2%) female as against 5 (11.9%) males in the 41-60 years age bracket progressed to overt type 2 diabetes within the 5 years period.Conclusion: Increased concentrations of soluble CD163 in individuals with metabolic syndrome predict increased risk of type 2 diabetes and may be a useful marker for identifi cation of high risk metabolic syndrome individuals.Keywords: Soluble CD 163, Type 2 diabetes mellitus, Metabolic syndrome
A-302
Mathematical model for hemoglobin A1c formation predicts estimated average glucose for reduced red cell lifetimes
R. J. Molinaro1, L. J. McCloskey2, J. D. Landmark3, J. H. Herman2, D. F. Stickle2. 1Emory University School of Medicine, Atlanta, GA, 2Jefferson University Hospitals, Philadelphia, PA, 3University of Nebraska Medical Center, Omaha, NE,
Background: The established relationship of estimated average glucose (eAG) to hemoglobin A1c (Hb A1c) may not be applicable to patients with reduced red cell lifetimes (RCL) attributed to certain hemoglobin variants. We used a mathematical
model for Hb A1c formation, consistent with eAG vs. %A1c for normal RCL (120 days), to predict the relationship between glucose (G) and %A1c for two selected reduced RCLs (90 or 75 days).Methods. Cellular hemoglobin was modeled as three probability states: native (A), Schiff’s base aldimine (B), and ketoamine A1c (C). Transitions between states were according to A↔B↔C, with initial condition (A+B)=1, C=0. Interconversion A↔B was characterized as an equilibrium dependent on G: B/(A+B)=G/(G+K); K=1040 mmol/L. Interconversion B↔C was given by: dC/dt = kB - krC, where kr accounted for a low rate of A1c reversal. The analytical solution C(t) represents the fraction of A1c within a red blood cell (RBC) of age t. C(t) was combined with the cell age distribution (0-120 days) to obtain %A1c for the total cell population. Parameters k=0.163/day and kr=0.0025/day produced results consistent both with established in-vivo hemoglobin glycation rates, and with established eAG vs. %A1c (solid points vs. dashed line in Figure, r2>0.99). Using this model, eAG vs. %A1c was calculated for RCLs of 90 days and 75 days, by proportionally changing only the time scale of the red cell age distribution.Results: In comparison to eAG vs. %A1c for RCL = 120 days, eAG predicted for a given %A1c was signifi cantly increased when RCL was reduced to 90 or 75 days (open points, Figure).Conclusions: Results of model calculations may help inform clinicians about the scale on which substantial deviations from the established relationship between eAG and %A1c may be operative for patients suspected of having reduced RCL.
A-303
Average glucose operative during short intervals between hemoglobin A1c measurements: predicted relationship to estimated average glucose
R. J. Molinaro1, L. J. McCloskey2, D. F. Stickle2. 1Emory University School of Medicine, Atlanta, GA, 2Jefferson University Hospitals, Philadelphia, PA
Background: Estimated average glucose (eAG) is a linear function of %A1c. The inverse slope, Smax = Δ(%A1c)/Δ(eAG), is a constant that corresponds to the maximum Δ(%A1c) that can occur for a change in glucose (ΔG) (Smax = 0.035 (%A1c)/(mg/dL)). When the interval between sequential %A1c measurements is not long enough to span the entire red cell lifetime (120 days), the apparent Δ(eAG) as calculated from Δ(%A1c)/ Smax must underestimate that true ΔG operative during the interval, because the entire circulating red cell population has not yet been uniformly exposed to this change. Our objective was to predict the relationship between Δ(eAG) and ΔG for short measurement intervals (<120 days), using a mathematical model for hemoglobin A1c formation.Methods: Changes in hemoglobin states A (native), B (aldimine), and C (ketoamine, or A1c) were modeled according to dC/dt=kB-krC, where B is in equilibrium with A depending on glucose (G) according to B/(A+B)=G/(G+K). C(t) represents the hemoglobin A1c fraction within a cell of age t. Coupled with cell age distribution data, model validation calculations of C(t) vs. G using parameters K=1040 mmol/L, k=0.163/d, and kr=0.0025/d reproduced literature data for both cellular hemoglobin A1c-formation rates and the standard relationship of eAG to %A1c. Using this model, we calculated Δ(%A1c) results vs. ΔG, for initial %A1c=6-14%, for ΔG=95-355 mg/dL, and for time intervals (Δt) between measurements of 15-120 days.

Tuesday, July 30, 9:30 am – 5:00 pm Endocrinology/Hormones
A92 CLINICAL CHEMISTRY, Vol. 59, No. 10, Supplement, 2013
Results: For each interval Δt, the calculated slope S = Δ(%A1c)/ΔG was found to be a constant value, S(Δt). Across intervals, S(Δt) approached Smax as Δt approached 120 days. The predicted relationship between Δ(eAG) and ΔG as a function of Δt was given by the ratio R = S(Δt)/Smax = Δ(eAG)/ΔG (see Figure).Conclusions: For %A1c measurement intervals Δt<120 days, Δ(eAG) underestimates actual ΔG operative during the interval, especially for Δt<60 days (R<0.8).
A-304
Impact of vitamin K antagonists on the plasma levels of dephospho-uncarboxylated Matrix Gla Protein (dp-ucMGP) in hemodialysis patients.
E. Cavalier, P. Lukas, A. Carlisi, P. Delanaye. University Hospital of Liège, University of Liège, Liège, Belgium
Background: Matrix Gla-protein (MGP) could act as an inhibitor of vascular calcifi cations. Its physiological action is highly dependent of vitamin K which is necessary for the activation of Gla-proteins via a carboxylation process. Measurement of the inactive form of the protein, namely the desphospho-uncarboxylated matrix Gla-protein (dp-ucMGP), is now available (IDS, Boldon, UK). In the general population and in chronic kidney disease patients, it has been suggested that plasma concentrations of dp-ucMGP are higher in patients treated by vitamin K antagonist compared to non-treated. In this work, we tested if this hypothesis is observed in hemodialysis patients, too.Methods: Prevalent hemodialysis patients from three centers were recruited for this study. We separated patients treated, or not, by acenocoumarol. Clinical (age, gender, BMI, dialysis vintage, status of hypertension and diabetes, smoking status, presence of vascular antecedents) and biological variables were then compared between these two groups. Among biological variables, we compared classical data of the phosphorus-calcium metabolism (calcium, phosphorus, parathormone, 25-OH vitamin D), bone biomarkers [bone-specifi c alkaline phosphatase (b-ALP), C-terminal telopeptide of collagen type I, intact amino-terminal propeptide of type I procollagen (P1NP), tartrate-resistant acid phosphatase 5b, osteoprotegerin] and various biomarkers of interest (albumin, magnesium, C-reactive protein, troponin T, homocysteine, interleukin-6, TNFα, FGF-23, fetuin and dp-ucMGP). We used the Mann-Whitney test or independent samples t-test according to the distribution.Results: The sample included 165 patients with the following clinical characteristics: median age was 74 y [63;80], mean BMI was 26±7 kg/m², median dialysis vintage 22 months [11;43], 44% were diabetic, 87% were hypertensive, 21% were smokers and 65% had cardiovascular antecedents. Among these patients, 143 were not treated by vitamin K antagonists and 20 were treated by acenocoumarol. Data about therapy was lacking in 2 patients. No statistical difference was observed in clinical and classical biological variables. Among biological, variables, we found differences between treated and non-treated for dp-ucMGP: 3802 pM [2274;5232] versus 1280 pM [955;2178], p<0.0001, for b-ALP: 22 μg/L [17;34] versus 15 μg/L [10;23], p=0.004 and for P1NP: 330 pg/mL [173;519] versus 206 pg/mL [107;342], p=0.04, respectively.
Conclusion: In this study, we confi rmed that levels of dp-ucMGP were strongly infl uenced by vitamin K antagonist therapy in hemodialysis. The moderate effect of vitamin K antagonist on b-ALP and P1NP deserve further studies.
A-305
Validation of a Bioanalytical Method for the Quantifi cation of Serum Ergocalciferol and Cholecalciferol by LC-MS/MS
B. Holmquist, M. Morr, S. Pepkowitz, D. W. Chandler. Endocrine Sciences, Esoterix, Inc., a LabCorp company, Calabasas, CA
Objective: The development of a simple, fast, LC-MS/MS method to allow quantitative measurements of the precursors of 25-hydroxyvitamin D2 and 25-hydroxyvitamin D3 (Ergocalciferol; vitamin D2 and Cholecalciferol; vitamin D3) from serum or plasma.Introduction: Many different vitamin D metabolites in serum are measured in the clinical laboratory. The most commonly measured vitamin D test is 25-hydroxyvitamin D, which is a marker of vitamin D suffi ciency. Another commonly ordered vitamin D test is 1,25-dihydroxyvitamin D, which can be useful in diagnosing rare disorders of calcium homeostasis. Other, less commonly ordered vitamin D tests are 24,25-dihydroxyvitamin D (a catabolic product in the vitamin D endocrine pathway that retains some biological activity) and the vitamin D that is made directly in the skin from ultraviolet light or is consumed through foods or dietary supplements (referred to as “calciferols”). This new method is specifi cally for measuring ergocalciferol and cholecalciferol (the class of vitamin D2 and vitamin D3 that has not yet been hydroxylated other than carbon #3 by any tissues). The measurement of calciferol has historically been diffi cult owing to its very hydrophobic nature and complex biological matrices. Some applications for measuring calciferol include assessing compliance with oral supplement therapy, evaluating patients with disorders of lipid absorption, patients taking anticonvulsants and in cases of presumed toxicity due to acute vitamin D poisoning.Methodology: An analytical method was developed using a Thermo/Cohesive TX-4 HPLC system (Thermo-Fisher/Cohesive Technologies) with Agilent® 1200SL pumps (Agilent Technologies, Inc.) and an AB Sciex® 5000 (AB Sciex PTE. LTD.) triple quadrupole mass spectrometer. Independent calibration curves were prepared for Ergocalciferol (VD2) and Calciferol (VD3) in depleted serum (Golden West Biologicals). Sample preparation consisted of isotope dilution using a cocktail of both internal standards (IsoSciences) followed by protein precipitation and purifi cation by phospholipid depletion (Phree). A Phenomenex® Synergi Max-RP® analytical column (50 x 2.1mm, 2.5um, 100A) was used with solvent gradient to achieve chromatographic separation. Positive mode atmospheric pressure chemical ionization (APCI) was used for detection in Multiple Reaction Monitoring (MRM) mode.Validation: Analytical sensitivity was 1.0 ng/mL per analyte. Analytical measurement range was up to 100 ng/mL (up to 400 ng/mL with dilution). Precision ranged from 3.8 - 11.4% (inter-assay). Accuracy ranged from 100.9% to 109.2%. Reference intervals were developed for total calciferols using discarded routine wellness screening specimens and found to be 0 - 57 ng/mL total calciferol. Individual responses to 50,000 units of Ergocalciferol or Cholecalciferol were studied in healthy volunteers.Conclusions: A simple, fast, LC-MS/MS method was developed to allow quantitative measurements of the precursors of 25-hydroxyvitamin D2 and 25-hydroxyvitamin D3 from serum or plasma. Signifi cant levels of Ergocalciferol and Cholecalciferol have been found during retrospective analysis of routine screening specimens for 25-hydroxyvitamin D.
A-307
The Emerging Role of Mass Spectrometric Free and Total Thyroid Hormone Measurement in the Diagnosis of Thyroid Disorders
V. Gounden1, B. Stolze1, F. S. Celi2, S. J. Soldin1. 1Department of Laboratory Medicine, Clinical Center, National Institutes of Health, Bethesda, MD, 2NIDDK, National Institutes of Health, Bethesda, MD
Background: Accurate measurement of free thyroid hormones is important for the diagnosis and management of hypo/hyperthyroidism. Currently available direct immunoassays used for free and total thyroid hormone analysis are inaccurate in conditions affecting thyroid hormone protein binding and at the limits of reference intervals. Measurement of total thyroxine (TT4), total triiodothyronine (TT3), free thyroxine (FT4) and free triiodothyronine (FT3) by LC-MS/MS has been shown to be more accurate in these situations. Mass spectrometric methods agree better with thyroid stimulating hormone (TSH) for TT3 and TT4 and with log TSH (for FT4,

Endocrinology/Hormones Tuesday, July 30, 9:30 am – 5:00 pm
CLINICAL CHEMISTRY, Vol. 59, No. 10, Supplement, 2013 A93
FT3) than current immunoassays. Here we present a patient with confounding thyroid hormone immunoassay fi ndings where LC-MS/MS thyroid hormone measurement permitted elucidation of the patient’s condition.Case report: A seventy-year-old Caucasian female presented with a history of receiving thyroid hormone replacement therapy for several decades. Her current complaints were increased lethargy and weight gain of ±10 pounds over the past year despite increase in levothyroxine(LT4) replacement dosage to 150 μg daily. On physical examination no thyromegaly or thyroid nodules were palpable.Laboratory testing: Immunoassay results for thyroid functions tests analyzed on the Dimension Vista (Siemens Diagnostics, Tarrytown, US) were as follows: TSH 0.6 mIU/L (0.4-4.0), FT4 1.2 ng/dL (0.8-1.5), FT3 247pg/mL (180-420) and TT4 10.3 μg/dL(4.5-12.5). Total T3 analyzed on the Immulite XPi (Siemens Diagnostics, Tarrytown, US) was 107 ng/dL (90-215). Testing for thyroid peroxidase antibodies and thyroglobulin antibodies were negative. Blood samples were later analyzed by LC-MS/MS as per methods previously published (Clin Chim Acta. 2004;343(1-2):185-90,Clin Chem. 2011 ;57(1):122-7 and Clin Chem 2011;57:A82 Abstract B-99.) MS/MS Results were as follows: TT3 64 ng/dL (74-168), FT3 1.9 pg/mL (1.5-6.3), TT4 7.2 μg/dL(4.2-10.9), FT4 1.8 ng/dL (1.3-2.4). In view of the low total T3 and low normal FT3 on mass spectrometry analysis, the patient was initiated on a trial of combination of LT4 75μg daily and levotriiodothyronine18.75 μg (three times daily). On follow-up: TSH level was 0.01 mIU/mL (0.4- 4.0) and a decrease in total cholesterol (from 202 mg/dL to 160 mg/dL) and LDL cholesterol (from 133 mg/dL to 89 mg/dL) were also noted due to thyroid hormone replacement. With cessation of replacement therapy TSH levels increased to 0.03 mIU/L and MS/MS TT3 and TT4 remained low at 34 ng/dL ng/dL (74-168), and 1.1 μg/dL(4.2-10.9 respectively, with the patient’s complaints of fatigue persisting. To exclude possible secondary/tertiary hypothyroidism an MRI Brain was performed. Findings showed no intracranial mass or pituitary lesion. Genetic studies for type 2 deiodinase (D2) polymorphisms revealed that the patient was heterozygous for the Thr92Ala polymorphism.Discussion: D2 catalyses the intracellular conversion of T4 to T3, and thus plays a major role in thyroid hormone metabolism. The presence of the D2 Thr92Ala polymorphism has been shown to predict the need for higher T4 intake or addition of T3 in those requiring replacement therapy. The fi nding of the low mass spectrometry TT3 and low normal FT3 levels together with the persistent hypothyroid symptoms despite seemingly adequate (as refl ected by immunoassay results) thyroid hormone replacement alerted to the possibility of a deiodinase disorder.
A-308
Prevalence of subclassifi cations of subclinical hypothyroidism: comparison to reclassifi cations when using FT4-dependent reference ranges for TSH
H. L. Matlin, L. J. McCloskey, D. F. Stickle. Jefferson University Hospitals, Philadelphia, PA
Background: Subclinical hypothyroidism (SH: normal free T4 (FT4), elevated TSH) is the subject of frequent inquiries to the laboratory. New practice guidelines for hypothyroidism from the American Association of Clinical Endocrinologists and the American Thyroid Association (Endocr Pract 2012;18:988-1028) defi ne subclassifi cations of SH with respect to whether TSH is less than or greater than 10 mIU/L (here defi ned as subclassifi cations A and B, respectively), delineating whether recommendation for T4 replacement therapy is automatic (for subclass B). Our objectives were to determine %A and %B in our patient population, and, because of the log-linear relationship between TSH and FT4, to examine how prevalence of subclasses might change if FT4-dependent TSH reference ranges were used.Methods: Paired TSH and FT4 results from our institution over a period of 1 year (2012) were obtained from electronic records. A subset database was formed from fi rst-or-only results from individual patients having normal FT4 (0.7-1.7 ng/dL) (n = 4781). Spreadsheet analyses determined classifi cation as subclinical hypothyroidism (SH), from which %A (TSH <=10 mIU/L) and %B (TSH >10 mIU/L) were determined. TSH distributions were analyzed as a function of FT4 as a preliminary step in specifying FT4-dependent TSH reference ranges.Results: Among paired TSH and FT4 results, 616 patients (12.9% of total) were classifi ed as SH, using TSH reference range = 0.3-5.0 mIU/L. Subclassifi cations of SH patients were 75.6% A and 24.4% B. TSH distributions were analyzed as a function of FT4. Each distribution was well-characterized as a log-normal distribution (that is, on a log scale, the distributions were individually well characterized by parameters of a median (xm) and a standard deviation (s) such that probabilities of results were a normal distribution according to xm ± s). xm was a linear function of FT4: for FT4 = 0.6-1.6 ng/dL, xm = -0.478 FT4+ 0.850 (r2 = 0.929) (Eqn.1). Standard deviations s for TSH were a parabolic function of FT4 (range: s = 0.35-0.9), with a minimum s =
0.35 centered at FT4 = 1.1 ng/dL. This minimum s was only marginally greater than s associated with the TSH reference range (s = 0.31). The fact that all-patient-inclusive TSH data showed log-normal distributions indicated that any assumed FT4-dependent TSH reference ranges should likewise possess these same FT4-dependent medians. We therefore assumed, very conservatively, FT4-dependent reference ranges having medians according to Eqn.1, and having fi xed widths equal to that of the standard TSH reference range (±2s = ±0.62). Applying these FT4-dependent TSH reference ranges to the paired TSH-FT4 patient data, 245 patients (5.1% of total) were classifi ed as SH, with subclassifi cations of 43.3% A, 56.7%B.Conclusions: Comparing to use of a standard, FT4-independent TSH reference range, paired TSH-FT4 measurements classifi ed as SH were reduced by 60% when conservative FT4-dependent TSH reference ranges were applied. Additionally, FT4-dependent TSH reference ranges were also more highly selective for SH subclassifi cation B patients, for whom T4 replacement therapy would be automatically recommended.
A-309
Sex Hormone Binding Globulin As A Marker Of Categories Of Glucose Intolerance And Undiagnosed Diabetes In First Degree Relatives (FDR) Of Type 2 Diabetic Patients.
O. A. Mojiminiyi, N. A. Abdella. Faculty of Medicine, Kuwait University, Kuwait, Kuwait
Background: Recent evidence showed that raised sex hormone binding globulin (SHBG) levels could reduce the risk of Type 2 diabetes but the exact mechanisms remain unknown. This study explores the associations of SHBG with categories of glucose intolerance and undiagnosed diabetes in fi rst degree relatives (FDR) of T2DM patients and explores the associations with potential risk factors.Methods: Anthropometric indices (BMI, waist (WC), Hip circumference and waist:hip ratio (WHR)), fasting lipids, glucose, C-peptide, insulin, adiponectin, SHBG, oestradiol (E2), testosterone (T), androstenedione (AND), dehydroepiandrosterone sulphate (DHEA-S), high-sensitivity C-reactive protein (hsCRP) and alanine aminotransferase (ALT - marker of hepatic steatosis) were measured in 141 (61M, 80F) FDR aged 20-48 years. Homeostasis model assessment-estimated insulin resistance (HOMA-IR), beta cell function (%B), insulin sensitivity (%S) and Free androgen index (FAI) were calculated. Categories of glucose intolerance and diagnosis of diabetes were defi ned based on fasting glucose and/or HbA1c (ADA criteria).Results: 82 subjects were normoglycemic; 40 had impaired fasting glucose and 19 had undiagnosed diabetes. SHBG showed signifi cant positive correlations with adiponectin (r=0.35), %S (0.33) and HDL-C (r = 0.45) and signifi cant negative correlations with BMI (r=-0.39), WC (r = -0.35), WHR (r = -0.62), T (r = - 0.35), FAI (r = -0.72), DHEAS (r= -0.26), C-Peptide (r = -0.30), insulin (r = -0.37), %B (r=-0.38), HOMA-IR (-0.39), ALT (r=-0.39), Triglycerides (r = - 0.32) and HbA1c (r=-0.22). After partial correlation analysis correcting for BMI, only correlations with WHR (r= -0.53), FAI (r= - 0.41) and HDL-C (r = 0.37) remained signifi cant. SHBG decreased stepwise with worsening categories of glucose intolerance in females but not in males whereas FAI decreased stepwise with worsening categories in males only. The area under the Receiver Operating Characteristic Curve for detection of diabetes for FAI and SHBG were 0.711 and 0.386 respectively for males and 0.430 and 0.660 respectively for femalesConclusion: Associations of SHBG with some anthropometric and metabolic variables in FDR suggests that lower levels may contribute to the risk of T2DM through obesity dependent metabolic pathways but low FAI is a better marker of diabetic state in males. The obesity independent associations of SHBG with HDL-C and WHR deserve further studies.
A-310
Magnesium Regulates Reticular NADPH production in the Hepatocytes; Possible implications of Magnesium in Diabetes and Obesity onset
c. B. voma1, A. P. Romani2. 1Cleveland State University, Brooklyn, OH, 2Case Western Reserve University, Cleveland, OH
Background: The current western diet is approximately 35% defi cient in magnesium (Mg2+). Magnesium defi ciency has been correlated with the onset and progression of several pathologic conditions that include diabetes and obesity. As opposed to other electrolytes, Mg2+ is not given the same clinical attention due to the poor understanding

Tuesday, July 30, 9:30 am – 5:00 pm Endocrinology/Hormones
A94 CLINICAL CHEMISTRY, Vol. 59, No. 10, Supplement, 2013
of its homeostasis. The hormonal regulation of magnesium has not been fully elucidated, and we continue to interpret the serum concentrations relative to urinary Mg2+ excretion. Also, our understanding of the extra- and intra-cellular role of Mg2+ is further complicated by the fact that the principal reservoir of Mg2+ (i.e., the bones) are not readily exchangeable with circulating Mg2+ in the extracellular fl uid space. Thus, in states of a negative Mg2+ balance, initial losses come from the extracellular space since equilibrium with bone stores does not begin for several weeks. The long term goal of this research is to elucidate the implications of magnesium defi ciency for liver and whole body metabolism. Our laboratory has previously reported that Mg2+ defi ciency increases G6P transport into the liver ER, and its hydrolysis by G6Pase. The study reported here evaluates the role of Mg2+ defi ciency on G6P conversion by Glucose-6-Phosphate Dehydrogenase (G6PD), the other intrareticular metabolic pathway for G6P, and its connection with 11Beta-Hydroxysteroid Dehydrogenase 1 (11β-HSD1), the NADPH-dependent enzyme responsible for the conversion of cortisone to cortisol. Both enzymes have been implicated in onset/progression of diabetes and obesity. The results reported here validate our working hypothesis that a defi ciency in hepatic Mg2+ content enhances the activities of both G6PD and 11Beta-HSD1within the lumen of the hepatic endoplasmic reticulum.Methods: Minimal deviation hepatocellular carcinoma cell line (HepG2-C34) were grown in media containing 0.2mM, 0.4mM (defi cient) and 0.8mM (physiological) [Mg2+]o acutely (i.e., 5 days) and analyzed for NADPH production by fl uorescence detection (350 nm excitation; 460 nm emission). NADPH production was induced by addition of varying concentrations of glucose 6-phosphate to digitonin-permeabilized cells. G6PD, G6Pase, and 11Beta-HSD1 expression levels were analyzed by western blot method for up- or down-regulation following Mg2+ defi ciency onset. Production of cortisol from cortisone as a measure of the activity of 11Beta-HSD1 was analyzed by reversed phase HPLC.Results: NADPH production increased by ~60% under conditions of Mg2+ defi ciency compared to cells presenting physiological levels of Mg2+, and resulted in a marked increase in cortisol production through 11Beta-HSD1 activity.Conclusion: Defi ciency in Mg2+ appears to upregulate the utilization of G6P by G6PD for energetic purposes, with increased synthesis of NADPH. In turn, the increased level of intrareticular NADPH will favor the conversion of cortisone to cortisol. Increased cortisol production can explain – at least in part- the insulin resistance observed in several diabetic and/or obese conditions. Validation of these results in human patients represents the next step in our study.
A-311
Evaluation of Hemoglobin A1c Assay on Mindray’s BS-800 Clinical Chemistry System*
Y. Wang, J. Cai, W. Luo. Shenzhen Mindray Bio-medical Electronics CO., LTD., Shenzhen, China
Objective: The objective of this study was to evaluate the performance of a HbA1c assay on Mindray’s BS-800 clinical chemistry system.Relevance: Hemoglobin A1c (HbA1c) is used to monitor long term glucose control in patients with diabetes mellitus.Methodology: Human whole blood samples were pre-treated off-line with hemolyzing reagent prior to analysis. HbA1c concentration, relative to that of total hemoglobin, was determined by enzymatic assay of HbA1c and colorimetric measurement of total hemoglobin. The assay successfully completed the National Glycohemoglobin Standardization Program (NGSP) manufacturer certifi cation, and results can be converted to IFCC units.Results: The HbA1c assay demonstrated acceptable observed within-run and total imprecision of </= 1.13 %CV and </=1.38 %CV, respectively, on the BS-800 system in the range 4.6-9.3 %HbA1c.Method comparison demonstrated substantial correlation versus the Hitachi/SEKISUI System; r = 0.996, slope = 1.03 and intercept of 0.00 %HbA1c, when tested with a panel of patient samples (n=40; Range 3.52 – 14.34 % HbA1c). The Mindray test system provides an analytic range of 3 – 16 % HBA1c. No signifi cant interference (<±10%) was observed from bilirubin, lipemia, ascorbic acid, and glucose up to concentrations of 50 mg/dL, 2000 mg/dL, 30 mg/dL and 1000 mg/dL, respectively. Reagents are stable for 28 days when stored refrigerated on the analyzer. NGSP sample testing showed that the assay was capable of fulfi lling the new criteria for NGSP certifi cation (95% Confi dence Interval of the differences between test method and SRL method must fall within the clinically signifi cant limits of ±0.75%HbA1c).
Conclusion: The new HbA1c assay provides a rapid, accurate, and convenient means of measuring HbA1c in human whole blood on Mindray’s BS-800 clinical chemistry system.* not yet available for in vitro diagnostic use in the US.
A-312
Associations of Insulin-Like Growth Factor-1 (IGF-1) and Bioavailable IGF with Insulin Resistance in Patients with Polycystic Ovaries Syndrome (PCOS)
F. H. Safar1, O. A. Mojiminiyi2, M. F. Diejomaoh2. 1Mubarak Al Kabeer Hospital, Kuwait, Kuwait, 2Faculty of Medicine, Kuwait, Kuwait
Introduction: Insulin like growth factor-1 (IGF-1) and insulin share common structural homology and function. As insulin resistance (IR) plays a pivotal role in the pathogenesis of PCOS, the aim of this study was to evaluate the associations between IGF-1 level, bioavailable IGF with insulin resistance in patients with PCOS.Methods: Anthropometric, biochemical and hormonal parameters were measured in 92 women with PCOS and 44 apparently healthy control subjects. Bioavailable IGF was calculated as IGF-1/IGFBP3. Homeostasis model assessment of insulin resistance (HOMA-IR) was used to assess IR. Univariate and logistic regression analyses were used to fi nd the associations between IGF-1, bioavailable IGF with different variables and IR in PCOS.Results: IGF-1 and bioavailable IGF showed signifi cant (p < 0.05) positive correlations with HDL-C (r = 0.18 vs 0.28), DHEA-S (r = 0.27 vs 0.30) and adiponectin (r = 0.32 vs 0.35) and negative correlations with age (r = -0.36 vs -0.36), waist circumference (r = -0.40 vs -0.39), BMI (r = -0.38 vs -0.35), fasting glucose (r = -0.28 vs -0.31) and TG (r = -0.30 vs -0.43) respectively. Bioavailable IGF showed signifi cant negative correlations with HOMA-IR(r = -0.3, p < 0.0001) and insulin (r = -0.28, p = 0.001) in contrast to the correlations (r = -0.17, p = 0.05) and (r = -0.14, p= 0.12) respectively for IGF-1. In contrast to IGF-1, bioavailable IGF level is signifi cantly different between PCOS patients with IR versus PCOS patients without IR (p=0.02). Also in contrast to IGF 1, binary logistic regression analysis showed signifi cant association of bioavailable IGF with IR in patients with PCOS (OR = 0.954, CI 0.916-0.993, p =0.022). However, this association was lost when WC was added as a confounding factor.Conclusions: Bioavailable IGF is signifi cantly associated with metabolic parameters as well as IR. In PCOS, bioavailable IGF rather than IGF-1 is the signifi cant determinant of IR.
A-313
Dermatologic manifestations from small bowel carcinoid tumor: A case report
B. Pineda-Navarro, J. Romero-Aleta, A. I. Alvarez-Rios, A. Baños, J. M. Guerrero. H.U. Virgen del Rocio, Sevilla, Spain
Background: Carcinoid tumors are neuroendocrine tumors (NET) that are derived from enterochromaffi n cells and produce and secrete different substances that can be detected in plasma or urine and cause hormone-related syndromes. Carcinoid syndrome is characterized by fl ushing, diarrhea, and bronchospasms. Other clinical manifestations such as necrolytic erythema may also indicate a NET. Erythema may be the fi rst sign of a systemic disease such as infl ammatory bowel disease, or cancer. Sometimes, patients present no, or just vague, symptoms that can be found incidentally during diagnostic imaging procedures or at operation. Diagnosis is usually established by measuring the specifi c tumor marker in plasma and urine. We report a case of skin lesions classifi ed as tinea corporis and later as fi gurative erythema whose etiologic assessment allowed us to discover a carcinoid tumor on small intestinal.Methods: A 38 year-old man without notable medico-surgical history had suddenly presented multiple skin lesions on the forearms and legs. There were no other clinical manifestations. The lesions were treated with anti-fungical because these were due to the suspicion of tinea corporis. After a year of evolution without responding to treatment and the appearance of new lesions with similar characteristics, which established the clinical judgment of fi gurative erythema and extended the analytical study and chest X-rays.Results: Results of laboratory tests and chest X-rays were normal. Abdominal initial ultrasound examination discovered solid, hypoechogenic mass in the splenic parenchyma. It prompted further evaluation with computed tomography (CT) and

Endocrinology/Hormones Tuesday, July 30, 9:30 am – 5:00 pm
CLINICAL CHEMISTRY, Vol. 59, No. 10, Supplement, 2013 A95
abdominal magnetic resonance imaging (MRI) was performed to further characterize the mass, revealing a small ileus mass (3 x 2cm) probably a carcinoid tumor with infi ltrated mesenteric fat and desmoplastic-like appearance, and a small adenopathy nearby. Two hepathic lesions are also showed, they are suggestive of metastasis. The determination of 5-hydroxyindoleacetic acid (5HIAA) and serotonin in 24-hour urine sample and plasma chromogranin A were solicited. Data are 5HIAA= 94.5 nmol/mgCr (0-34), serotonin= 0.56 nmol/mgCr (0-0.80) and chromogranin A= 66 ng/mL (19.4-98.1). Surgical resection was performed.Conclusion:To our knowledge, this observation describes the case of skin manifestations associated with carcinoid tumor of the small bowel. The detection of this tumor at an early stage, revealed by fi gurative erythema, which was possible because of the availability of markers.
A-314
Comparison of Three Automated Hb A1c Assays
F. Gerin, O. Baykan, M. Arpa, O. Sirikci, G. Haklar. Marmara University School of Medicine Department of Biochemistry, Istanbul, Turkey
Background: Hemoglobin A1c (Hb A1c) is used for monitoring glycemic control and response to therapy in diabetic patients. The American Diabetes Association (ADA) recommended its use in diagnosis of diabetes. We evaluated the analytical performances of 3 automated assays; Recipe and Zivak HPLC, and Roche immunoassay. We paid special attention to the interference of uremia, different hemoglobin concentrations, carbamylated hemoglobin (cHb), acetylated hemoglobin (AcHb), and fetal hemoglobin (Hb F).Methods: A total of 199 EDTA anticoagulated venous samples from 62 healthy individuals, 90 diabetic patients, chronic hemodialysis patients (n=8) and samples with low (Hb<10 g/dL, n=10) and high (Hb>15 g/dL, n=10) hemoglobin concentration, or high Hb F (n=19) were analyzed within 2 hours. The interference of cHb and AcHb was checked by incubating pooled blood samples (Hb A1c, 5.0%) with sodium cyanide (≤2 mmol/L) or acetaldehyde solutions (2–10 mol/L), respectively.All Hb A1c analyses were performed at the Marmara University Pendik Hospital Biochemistry Laboratory with two ion-exchange HPLC methods; the Recipe HPLC (Recipe Chemicals–Instruments, Germany) and the Zivak HPLC automated system (Zivak Technologies, Turkey), and the Roche immunoassay reagent on Roche Modular autoanalyzer. Precision, bias and correlation studies were performed according to ‘Approved Guideline’ (EP09-A2). NGSP approved control materials were used. Statistical analysis were performed using the SPSS 15.0 software and MedCalc 11.6.0.0. The differences between methods and signifi cance of pairwise differences were conducted with Friedman and Wilcoxon sign test, respectively. Bland-Altman and relative differences plots were used for comparison. Passing-Bablok regression analysis and correlation coeffi cents were calculated. p<0.05 was used to infer statistical signifi cance.Results: The bias assessments were within NGSP criteria. Within-run imprecision for all methods and between-run imprecision for Roche immunoassay and Recipe HPLC were below 1.8%. Between-run CV was 2.75% for normal levels and 3.83% for pathologic samples for Zivak HPLC. Comparison of Hb A1c values revealed signifi cant differences between Roche immunoassay and Recipe HPLC for nondiabetic cases, and Recipe HPLC-Zivak HPLC and Recipe HPLC-Roche immunoassay pairs in diabetic cases. Correlations among the results were calculated for all patient samples except those with HbF. The correlation coeffi cients of Recipe HPLC-Zivak HPLC, Recipe HPLC-Roche immunoassay, and Zivak HPLC- Roche immunoassays were 0.914, 0.944, and 0.895, respectively. There was no signifi cant interference of uremia and Hb content. Roche immunoassay was excluded from anemia interference study due to manufacturer’s claim. In vitro carbamylation resulted in a bias less than ±5% in Hb A1c measurements. The bias of AcHb was 1% for Recipe Hb A1c measurements, but more than 5% for other methods. The effect of fetal Hb is tested in neonatal samples with median Hb F level of 9.1% (range 4.6-49.1). Recipe HPLC system was not included in Hb F interference study due to manufacturer’s claim. The correlation between Hb chromatography and Roche immunoassay was good (r=0.86, p<0.001), but was inversely correlated with Zivak HPLC (r=-0.84 p<0.001).Conclusion: In conclusion, when selecting an Hb A1c assay for the laboratory, analytical performance and performance characteristics should be carefully considered according to the patient population served.
A-315
Avoiding the Effects of Common Hemoglobin Variants on Hemoglobin A1c Results - Evaluation of Alternative Hemoglobin A1c Assays
D. D. Koch, K. Stevens, A. Young. Emory University, Atlanta, GA
Background: Hemoglobin A1c (Hb A1c) serves as a well-established laboratory tool for monitoring glucose control. Numerous methodologies are available for determining Hb A1c, including immunoassays, boronate affi nity or cation exchange liquid chromatography, and capillary electrophoresis. Grady Memorial (GMH) is one of the largest public hospitals in the United States. A predominance of GMH patients is African American, a population known to possess a high prevalence of hemoglobin variants, especially S and C. The Clinical Chemistry Laboratory transitioned to a Beckman Coulter AU® chemistry analyzer in July of 2011 from a DxC® analyzer and soon discovered several unexpectedly elevated Hb A1c values.Allowable Error for Hb A1c: 1.0% at a decision point of 7.0%.Evaluation of the AU Hb A1c Method: The AU method showed a bias vs. the DxC of -0.075% at a Hb A1c of 7.00%, which is very acceptable performance.Case Report: A 44-yr-old female, followed at Grady because of obesity and other issues, had never exhibited poor glucose control. Her Hb A1c results over the past two years spanned 4.5 – 5.9%. On this admission, however, her Hb A1c value was 8.0%. Glucose control was checked; fasting glucose was 93 and 2-hr postprandial was 103 mg/dL, neither of which was consistent with the Hb A1c result. The Hb A1c repeated as 8.2%. The sample was measured by an ion-exchange HPLC method; the result was 6.8%. Further investigation included hemoglobinopathy testing, which showed that the patient possesses the Hemoglobin C trait. The National Glycohemoglobin Standardization Program compilation indicates that the Beckman AU Hb A1c method experiences interference from Hb C and Hb S (http://www.ngsp.org/interf.asp).Response: To correct this problem, three Hb A1c methods were evaluated: Trinity Biotech Premier Hb9210® (boronate affi nity); BioRad D-10 Analyzer (cation exchange); and Sebia Capillarys™ 2 Flex system (capillary electrophoresis).Methods: The precision of each instrument was evaluated using two levels of control material, tested on weekdays for 3-4 weeks. The comparison of methods study was performed between the AU immunoassay and each platform using samples from patients known not to harbor hemoglobin variants. Additional samples from patients with Hemoglobin variants were tested on each platform. The three platforms were also assessed by the technologists for ease of use.Results: Based on the allowable error, all three instruments were suffi ciently precise. The comparison of methods study showed that in patients without hemoglobin variants, the D10 displayed a high bias of 0.60% A1c as compared to the AU immunoassay. In patients with hemoglobin variants, there was concordance in values between the three test instruments, while the expected bias was observed in the immunoassay.Conclusions: At GMH, it is critical to use an A1c assay which is not affected by common Hb variants. Among the three instruments evaluated in this study, all appeared to provide non-biased results in patients with hemoglobin variants. In patients without variants, the D-10 showed a positive bias. On the basis of the accuracy data and ease-of-use as determined by the technologists, the Premier Hb9210 was selected for Hb A1c testing at GMH.
A-316
A comparison of six automated cortisol immunoassays with LC-MS/MS using serum from healthy and ICU subjects
R. W. Greer, S. L. La’ulu, M. M. Kushnir, M. L. Rawlins, J. A. Ray, W. L. Roberts, J. A. Straseski. ARUP Laboratories, Salt Lake City, UT
Background: Measurement of serum cortisol is of particular importance in patients who are critically ill. However, commercial cortisol immunoassays exhibit differences in specifi city, often attributed to potential cross reactivity with steroids other than cortisol. It is likely that these steroids may be elevated in critically ill patients, thus increasing the described inter-assay variability between standard immunoassays.Objective: Evaluate serum cortisol concentrations between six commercial immunoassays and an in-house liquid chromatography - tandem mass spectrometry (LC-MS/MS) method in both healthy and critically ill populations.Methods: We measured random total serum cortisol concentrations in 152 critically ill (ICU) subjects , 75 healthy subjects, and Standard Reference Material (SRM) 971 using 6 commercial immunoassays (Abbott ARCHITECT i2000SR; Beckman Coulter DxI 800; Roche Modular E170; Siemens ADVIA CENTAUR XP; Siemens

Tuesday, July 30, 9:30 am – 5:00 pm Endocrinology/Hormones
A96 CLINICAL CHEMISTRY, Vol. 59, No. 10, Supplement, 2013
IMMULITE 2000; Ortho VITROS ECi) and an in-house LC-MS/MS method. Additionally, cortisone was measured by LC-MS/MS in both populations.Results: Agreement was observed for most of the six automated immunoassays when compared with LC-MS/MS using samples from healthy subjects and SRM material. Substantial positive biases were observed using samples from ICU subjects (Table). Statistically signifi cant differences were observed between regression slopes of ICU and healthy subjects for all immunoassays (p <0.0001). The greatest bias was observed with the VITROS ECi and lowest with the ARCHITECT i2000SR. Cortisone accounted for 2.5-3.5% of the differences, indicating that cortisone is not the only cross-reacting steroid affecting these results.Conclusion: These data suggest that commercially available automated immunoassays should be used with caution when evaluating adrenal function in critically ill patients. Structurally related steroids (other than cortisone) may cross-react with the antibodies used in these immunoassays, contributing to the positive bias observed in samples from critically ill patients. To alleviate this concern, LC-MS/MS may be a more appropriate methodology for measuring cortisol in these populations.
Method(Compared to LC-MS/MS)
Specimen Group R Slope (95%
CI)Intercept (95% CI)nmol/L
Cortisol SRM 971% accuracy
DxI HealthyICU
0.690.91
0.86 (0.69-1.03)1.44 (1.34-1.55)
8.75 (-29.61-50.43)-19.96 (-62.57-7.09) 97.1
ARCHITECT i2000
HealthyICU
0.760.96
0.89 (0.76-1.03)1.08 (1.04-1.13)
-3.13 (-36.55-25.53)-1.06 (-16.02-16.13) 94.5
Centaur XP HealthyICU
0.860.94
1.06 (0.93-1.18)1.31 (1.23-1.38)
2.82 (-30.28-33.59)-8.64 (-25.52-18.58) 117.6
E170 HealthyICU
0.860.87
1.08 (0.96-1.21)1.84 (1.69-2.01)
5.82 (-25.32-35.5)-69.02 (-125-(-18.51))
115.2
ECi HealthyICU
0.940.88
0.89 (0.82-0.94)1.98 (1.82-2.17)
4.77 (-8.98-21.71)-114.15 (-186.44-(-51.27))
104.6
IMMULITE2000
HealthyICU
0.720.93
1.16 (1.00-1.33)1.48 (1.39-1.58)
-8.51 (-54.28-28.95)-14.53 (-42.87-7.29) 112.1
A-317
Ischemia-modifi ed albumin levels in patients with thyroid dysfunction
G. Ozturk, G. Erden, Z. Ginis, F. Ucar, M. Yavuz Taslipinar, A. Güneyk. Diskapi Yildirim Beyazit Education and Research Hospital,Department of Clinical Biochemistry, Ankara, Turkey
Background: Untreated patients with overt hyperthyroidism or hypothyroidism exhibit increased reactive oxygen species generation and impairments of the antioxidant system. Oxidative stress may contribute to the infl ammatory state in atherosclerosis. Increased or reduced action of thyroid hormone on certain molecular pathways in the heart and vasculature causes relevant cardiovascular derangements. Ischemia-modifi ed albumin (IMA) may act as a biomarker for ischemia-related diseases or an individual’s oxidative stress status. This study aimed to investigate serum IMA levels of patients with overt hypothyroidism or overt hyperthyroidism.Methods: A total of 31 patients with overt hyperthyroidism, 36 patients with overt hypothyroidism, and 31 control subjects were enrolled in the study. In the morning, blood samples were obtained from all patients and control subjects. The samples was centrifuged at 5000 X g for 10 minutes, the serum was separated and stored at −80°C until analyzing. IMA levels were manually determined by using a spectrophotometric Co (II)-albumin binding assay method. Free triiodothyronine (FT3), free thyroxine (FT4) and TSH were analyzed by chemiluminescence immunoassay (Centaur XP, Siemens Healthcare Diagnostics Inc., Tarrytown, USA). Lipid profi les including triglyceride (TG), high density lipoprotein (HDL) and low density lipoprotein (LDL) using direct method were measured by routine spectrophotometric methods (Advia 2400 ,Siemens Healthcare Diagnostics Inc., Tarrytown, USA) . Data was presented as mean values with standard deviation.
Results: Patients and controls were well matched with regard to age and gender. Analyses showed that TG and LDL levels in patients with hyperthyroidism, were signifi cantly lower than the control group (p‹0.05 ). The IMA levels for hyperthyroidism, hypothyroidism, and control groups were 0.88±0.17, 0.977±0.23 and 88±0.23, respectively.There was no statistically signifi cant difference in serum IMA level among hyperthyroidism, hypothyroidism, and control groups.Conclusions: Serum IMA levels among the patients with hyperthyroidism, hypothyroidism and the control subjects were not different. Severity and duration of thyroid dysfunction might be a possible affect on serum IMA levels. However, further investigations involving larger numbers of subjects are required to understand the association between the thyroid hormones and IMA levels.
A-318
Performance of the IDS-iSYS 1,25-Dihydroxy Vitamin D Assay.
E. Cavalier, P. Lukas, A. Carlisi, R. Gadisseur. University Hospital of Liège, University of Liège, Liège, Belgium
Background: 1,25-dihydroxyvitamin D [125D] is the active form of vitamin D and is procuded primarily in the kidney by the hydroxylation of 25-hydroxyvitamin D (25D). Levels of 125D are increased in calcium-defi cient individuals, children and during pregnancy and lactation. Compared to 25D, 125D circulated in the human body at 1000 folds lower, making its serum levels challenging to assess. We report the validation results of the IDS-iSYS 1,25-Dihydroxy vitamin D assay.Methods: The accuracy profi le was determined with 5 serum pool levels (16.9 - 175.4 pg/mL). Method comparison was performed using multiple kit lots; 260 serum samples were measured by the IDS RIA and IDS-iSYS and 65 samples by the IDS EIA and IDS-iSYS. In addition to establishing the reference intervals with specimens for apparently healthy subjects, we defi ned the observation ranges for the pediatric (stratrifi ed by every 2 years), pregnant women and hemodialysis population.Results: The assay range is 6.5 to 210pg/mL with precision of 1.3%, 2.2%, 3.6%, 7.8% and 16.0% for samples at 16.9, 33.2, 52.9, 100.3 and 175.4 pg/mL, respectively. Method comparisons agains the IDS RIA and the IDS EIA yield a Passsing Bablok regression of: IDS-iSYS = 0.92 x (IDS RIA) + 3.9; Pearson r = 0.92 (P<0.0001) and IDS-iSYS = 1.09 x (IDS EIA)+3.9; Pearson r = 0.97 (P<0.0001). The reference intervals and observed ranges are illustrated in fi gure below.Conclusion: The IDS-iSYS 1,25-Dihydroxy Vitamin D kit is a completed test system with the proven immunocapsules extraction and automated chemiluminescence immunoassay. With excellent precision and good correlation to current IDS methods, the automated IDS-iSYS 1,25D assay will be a valuable tool for clinical laboratories to accurately assess 125D concentrations.

Endocrinology/Hormones Tuesday, July 30, 9:30 am – 5:00 pm
CLINICAL CHEMISTRY, Vol. 59, No. 10, Supplement, 2013 A97
A-319
Plasma Aldosterone measured using DiaSorin ALDOCTK-2 and DiaSorin LIAISON® XL; a comparison using the software StatisProTM (CLSI-Analyse-it)
R. M. Dorizzi, V. Zanardi, S. Vallicelli, A. Piscopo, S. Bellini, C. Gollini. Laboratorio Unico di AVR, Cesena, Italy
Background: CLSI standards are used all around the world in clinical practice by many laboratorians but very often they require complex calculations not easily performed by standard commercial softwares. CLSI developed in conjunction with Analyse-it a Software (StatisProTM) which friendly carries out all the calculations required by relevant CLSI standards: EP10-A3, EP09-A2-IR, EP15-A2, EP05-A2, EP06-A, EP17-A, C28-A3 that we are using quite frequently in daily activity. The aim of our study was to compare the results yielded by ALDOCTK-2 (CTK2) and DiaSorin LIAISON® XL (XL) in the measurement of plasma aldosterone using EP9A2-IR CLSI standard and StatisProTM (CLSI and Analyse-it, Wayne, PA, USA). Methods: We measured aldosterone using respectively CTK2 and XL (DiaSorin, Saluggia, Italy) in 44 plasma samples collected in patients suffering from hypertension. The measurements were simultaneously carried out in duplicate strictly following the EP9A2-IR CLSI standard and the calculations and the graphs were carried out using StatisProTM. Results: We found a moderate correlation (r : 0.900), an intercept= 28.617 and a slope =0-593 (Passing Bablok regression); Sy.x was 58.2. The difference plot shows a fair consistency under 131.9 ng/L (mean bias: 6.17 ng/L), higher RIA concentration between 131.95 and 243 ng/L (mean bias: 54.15 ng/L), and much higher RIA concentration at values higher than 243 ng/L values (mean bias: 165.64 ng/L). The repeatability plots demonstrate excellent repeatability of LIAISON®XL (Figure, bottom) compared to RIA (Figure, top).
Conclusion: An automated assay of aldosterone could be very attractive for laboratorians. Even if its results are not very comparable to those yielded by the previously used RIAs, these assays are known to be plagued by lower consistency. StatisProTM allows an easy and fast comparison of methods via paired results from patients and can be employed for providing the necessary information to clinicians and carries out the required calculations and graphs.
A-320
Analytical Performance Of The Premier Hb9210 For HbA1c Measurement
J. Arias-Stella, J. Zajechowski, L. Stezar, M. Cosman, D. Swiderski, C. Feldkamp, V. I. Luzzi. Henry Ford Hospital, Detroit, MI
Background: Glycated hemoglobin (A1c%) is used in the diagnosis and management of diabetes and directly correlates with the mean blood glucose concentration 8 to 12 weeks prior. We use the BioRad Variant II system and perform approximately 800 tests per day. The average turn-around-time (TAT) for results is approximately 20 hours. The goal of this study was to decrease the TAT, increase the accuracy in the presence of Hb variants and decrease the cost of the test. We investigated the analytical performance of the Trinity Hb9210 boronate affi nity chromatography method to measure glycated Hb. The Trinity instrument is reported to be unaffected by most variants and also allowed instrument interface with autovalidation.Methods: A1c % was measured on the BioRad Variant II and the Trinity Hb9210 instrument on ~ 50 consecutive specimens. Imprecision and linearity were examined using human whole blood specimens or commercially available reagents. A1c controls were used for the imprecision. Linearity was demonstrated by mixing different proportions of selected low and high concentration specimens (3% and 18.7%). TAT is the average time from arrival of the specimen in the laboratory to the time results were reported.Results: For specimens not containing Hb variants the correlation was excellent (Hb9210=0.95(BioRad) + 0.08; R2=0.99, n=49). Three specimens with Hb variants were discrepant. Hb9210 values were confi rmed by an alternate method (fi gure). Imprecision (coeffi cient of variation, CV (%)) was 0% at 5.4%, and 0.5% at 10.8%.

Tuesday, July 30, 9:30 am – 5:00 pm Endocrinology/Hormones
A98 CLINICAL CHEMISTRY, Vol. 59, No. 10, Supplement, 2013
Average percent recovery of controls between 3.7% and 18.5% was 98% with maximum deviation of 92%. TAT for autovalidated results using the Hb9210 was <8 hours. The cost per reportable decreased 35%.Conclusion: A1c% measured using the Hb9210 are accurate, precise and provide a better TAT and lower cost.
A-321
The change of serum vitamin D levels in Graves’ ophthalmopathy
M. Zhang, J. Zhou, Z. Xiong, H. He, H. Huang. West china Hospital,sichuan university, Chengdu, China
Background: Graves’ ophthalmopathy(GO) is an autoimmune thyroid disorder that affects the orbit and eyelids. It has been shown that vitamin D defi ciency is associated with several autoimmune diseases. There is no study comparing vitamin D status between the patients with and without GO. Our aim was to study the change of serum vitamin D levels in Graves’ ophthalmopathy.Methods: A total of 71 GO patients were recruited, 68 Graves’ diaease(GD) was diagnosed by clinical and biochemical symptoms of hyperthyroidism, and without eye disease, and 37 control healthy subjects who had normal thyroid function without TPOAb and TgAb were recruited in the same period. Demographic information, including gender, age, diseases and medication history were collected. Serum TSH, FT3, FT4, TPOAb, and TgAb levels were measured by electrochemiluminescence immunoassay 25(OH)D3 levels were measured by ELISA.Results: . Serum 25(OH)D3 levels were signifi cantly lower in GD patients compared to control subjects (35 ± 4.8 nmol/L vs. 47 ± 5.6 nmol/L, P < 0.05), and lower in GO patients compared to GD patients(30 ± 4.5 nmol/L vs. 35 ± 4.8 nmol/L, P < 0.05). 2. TSH levels in GD group were signifi cantly higher than GO group and normal control group, FT3, FT4 levels were signifi cantly lower than the other two groups. There was no correlation between 25 (OH) VD and TSH, FT4 and FT3.Conclusion: Serum 25(OH)D3 levels in GD and GO patients are decreased and no association with thyroid function status, Therefore, It is necessary to monitor 25(OH)VD levels in Graves’ patients, especially Graves’ ophthalmopathy patients.
A-322
A statistical basis for harmonization of thyroid stimulating hormone assays using a robust factor analysis method.
D. Stöckl1, S. K. Van Houcke2, S. Van Aelst3, K. Van Uytfanghe2, L. M. Thienpont2. 1STT-consulting, Horebeke, Belgium, 2Laboratory for Analytical Chemistry, Faculty of Pharmaceutical Sciences, Ghent University, Gent, Belgium, 3Department of Applied Mathematics and Computer Science, Ghent University, Gent, Gent, Belgium
BACKGROUND: Harmonization of measurements among laboratory procedures ideally is achieved by calibration against an SI-traceable reference measurement procedure. For heterogeneous analytes, such as thyroid stimulating hormone (TSH), it is unlikely that this goal can be accomplished on mid-term. Therefore, we investigated the use of a factor analysis (FA) model on data from a method comparison as statistical alternative for calibration.METHODS AND RESULTS: A FA model with one factor was fi tted on a set of 94 TSH results for clinical samples measured with 14 immunoassays. The TSH concentrations ranged from 0.04 to 80 mIU/L. Principal component analysis (PCA) is the standard fi tting method for a FA model, but is very sensitive to the occurrence of outliers and cannot easily handle missing data . Because both events occurred in our dataset, we used a robust alternating regressions (RAR) method. In this procedure the squared deviations as measure of the differences between xij and its predicted xij (pred xij) were replaced by weighted absolute differences, i.e. minimizing ∑i,j wij abs(xij - pred xij). Missing values could be handled easily by excluding the corresponding absolute deviation in the minimization criterion. Because the RAR fi tting procedure assumed that the spread of the errors was constant, standardized measurements were used to fi t the FA model. The resulting estimates were mapped back to the original scale of the data to give the targets.We assessed the quality of the statistical procedure by correlation and regression analysis of the data by the 14 immunoassays against the target values according to the robust FA method. The correlation coeffi cients (for the best fi tted regression line) ranged from 0.995 to 0.999, while the SD of the %-residuals (which is a measure of the theoretical outcome after recalibration) ranged from 3.2% to 10.5%. We also evaluated the effect of recalibration by calculating the between assay CV for each sample before and after mathematical recalibration. The median between assay CV decreased from 9.1% to 3.6%.CONCLUSION: We developed a FA method, robust against outlying measurements and missing samples, which is fi t for the purpose of harmonization of TSH immunoassays.

Endocrinology/Hormones Tuesday, July 30, 9:30 am – 5:00 pm
CLINICAL CHEMISTRY, Vol. 59, No. 10, Supplement, 2013 A99
A-323
Demonstration of a Combined Total Hemoglobin and Hemoglobin A1c Control with Extended Stability
J. Starobin, B. Fernandez, S. Musngi, M. Ghadessi, M. Ban. Quantimetrix Corporation, Redondo Beach, CA
Background:Total Hemoglobin (Hb) and the Hemoglobin A1c variant (HbA1c) have become increasingly important tests, particularly in the point-of-care (POC) setting. Hb is used to detect the presence of several conditions and diseases including anemia, chronic renal disease, chronic lung disease, and dehydration. HbA1c is used to both diagnose diabetes mellitus and assess long-term glycemic control in diabetic patients.Objective:To formulate a liquid combined Hb/HbA1c control with stability of at least 6 months at 2-8ºC and 3 weeks at room-temperature (RT) for utility in both the central laboratory and POC settings.Methods:A two level control was formulated in whole blood and adjusted for Hb and HbA1c levels. Level 1 (normal) consisted of Hb in the 14.5 to 15.5 g/dL range and HbA1c in the 5.0 to 7.5% range. Level 2 (abnormal) consisted of Hb in the 9.5 to 10.5 g/dL range and HbA1c in the 10 to 15% range. Samples of both levels were subjected to accelerated stability testing at 25°C and 30°C as well as on-going real-time stability testing. HbA1c testing was performed on the Siemens Dimension ExL™. Hb testing was performed on the HemoCue Hb 201+™. The accelerated stress data was used to create an Arrhenius model allowing for the prediction of long-term stability.Results:Accelerated Stability for Hb and HbA1cLevel 1Analyte Calculated Ea
(cal/mol)Predicted -20ºC Stability
Predicted 4ºC Stability
Predicted 22ºC Stability
Total Hemoglobin 16,706 > 10 years 8.5 months 40 days% HbA1c 22,118 >> 10 years 36 months 93 daysLevel 2 Analyte Calculated Ea
(cal/mol)Predicted -20ºC Stability
Predicted 4ºC Stability
Predicted 22ºC Stability
Total Hemoglobin 15,211 8 years 7 months 39 days% HbA1c 27,296 >> 10 years 35 months 52 daysConclusion:The new Quantimetrix combined Hb/HbA1c control shows 2-8ºC stability of at least 7 months and room temperature stability of at least 5 weeks. Real-time results at 25ºC correlate well with the room temperature (22ºC) prediction. On-going real-time analysis will be used to validate the 2-8ºC stability prediction. The control is suited to both the central laboratory and POC settings where the extended room temperature stability is ideal for locations where refrigeration is not conveniently available.
A-324
A Sensitive and Selective Analysis of Allopregnanolone and Pregnanolone in Human Plasma using LC-MS/MS and Differential Ion Mobility Spectrometry
W. Jin1, M. J. Y. Jarvis1, M. Star-Weinstock2, B. Patterson3, M. Altemus4. 1AB SCIEX, Concord, ON, Canada, 2AB SCIEX, Framingham, MA, 3AB SCIEX, Victoria, Australia, 4Weill Medical College, Cornell University, New York, NY
Background: For Research Use Only. Not For Use In Diagnostic Procedures. There is growing interest in the therapeutic potential of gabaergic neuroactive steroid compounds, and the 3-alpha metabolites of progesterone, testosterone, deoxycortisol and androstenedione have been shown to have potent anxiolytic, analgesic, antiseizure, and neuroprotective effects in animal models and to activate GABAA receptors. The most studied of these has been allopregnanolone. However, understanding of the physiological role of these compounds has been limited by the diffi culty of measuring these compounds in biological samples. Currently only GC/MS assays with labor intensive extraction steps have adequate sensitivity to measure these compounds in biological samples and only a few specialized academic laboratories have the expertise to conduct these measurements. We propose to develop the capacity to use LC-MS/MS to measure GABAergic neurosteroid compounds in biological samples to enable the identifi cation of biomarkers of disease risk, predictors of treatment response, and new therapeutic targets.Methods: The challenges for LC-MS/MS analysis of allopregnanolone are (i) its poor ionization effi ciency, and (ii) the presence of numerous isobaric interferences
in biological samples including, but not limited to, its isomer pregnanolone. To overcome these challenges, ion mobility separation was combined with conventional LC-MS/MS detection using a highly sensitive AB SCIEX Triple Quad™ 6500 mass spectrometer equipped with the SelexION™ ion mobility device. The method employed liquid-liquid extraction of 100μL serum or plasma. After extraction, the sample was derivatized using a commercially available quaternary aminooxy reagent. Liquid chromatography (LC) separation of allopregnanolone and its isomer pregnanolone was achieved using a Phenomenex Kinetex C18 2.1x100 mm column.Results: The analytical method was developed to cover a calibration range from 5 pg/mL to 100 ng/mL in serum or plasma. Inter- and intra-day precision was determined to be less than 10%, and inter- and intra-day accuracy was between 91 and 108%. The observed recovery for the extraction method was greater than 95%, and the limit of quantitation for the method was 5 pg/mL, for both allopregnanolone and pregnanolone, which is signifi cantly better than what can be found in the literature. In reality, this method is suffi ciently sensitive to enable the measurement of less than 1 pg/mL of allopregnanolone and pregnanolone, however it was diffi cult to fi nd blank matrix material (double-charcoal stripped human plasma) containing less than 1-2 pg/mL of endogenous allopregnanolone and pregnanolone, for which reason we have prepared our lowest calibrators at 5 pg/mL.Plasma samples from ‘normal’, pregnant, and postpartum women were analysed using this method. Measured concentrations of allopregnanolone ranged from 4,000-16,000 pg/mL in the pregnant samples, from 25-210 pg/mL in the ‘normal’ samples, and from 6-30 pg/mL in the postpartum samples.Conclusions: Employing LC-MS/MS and differential ion mobility spectrometry, a highly sensitive method has been developed to enable the measurement of allopregnanolone and pregnanolone at concentrations as low as 5 pg/mL in human plasma.
A-325
Circulating levels of matrix metalloproteinases(MMP-2), tissue inhibitors of metalloproteinases(TIMP-2), reactive carbonyl compounds and advanced glycation end products in type 2 diabetic patients
H. Erman1, R. Gelisgen2, Ö. Tabak3, H. Uzun2. 1Kafkas university Kafkas medical faculty Department of Medical Biochemistry, Kars, Turkey, 2Istanbul university Cerrahpasa medical faculty Department of Medical Biochemistry, Istanbul, Turkey, 3Istanbul Education and Research Hospital, Internal Medicine Clinic, Istanbul, Turkey
Background:Diabetes mellitus (DM) is associated with an increased incidence of cardiovascular events and microvascular complications. Alterations in vascular structure, characterized by extracellular matrix deposits in the capillary and basement membranes, contribute to the pathogenesis of vascular complicatios of diabetes. Among several biochemical pathways mediated by hyperglycemia, the accumulation of advance glycation end products (AGEs) has been shown to correlate with the degree of diabetic complications. In particular, increases in extracellular matrix (ECM) are associated with the accumulation of AGEs, which reduces matrix turnover. The balance between MMPs and TIMPs are critical for the eventual ECM remodelling in the tissue. Disturbances of physiological balance between metalloproteinases and their inhibitors seem to play an important role in the development and progression of diabetic microangiopathy. RCOs react nonenzymatically with protein amino groups and eventually yield AGE. A role for glucose and for AGEs in the regulation of MMP expression has also been demonstrated in vitro. In this study, we aimed fi rstly to measure the plasma levels of MMP-2 an their specifi c tissue inhibitors TIMP-2 in type 2 diabetic patients with microvascular complications and without complications and in healthy subjects, secondly to investigate the plasma levels of AGEs and RCOs, which are precursors of AGEs and their relationship with MMPs-TIMPs levels.Methods:We studied 65 patients with type 2 diabetes and 25 healthy subjects as control. Type 2 diabetic patients were divided into two groups as with microvascular complications (n:40) and without complications (n:25). Plasma levels of MMP-2, TIMP-2, AGE were determined using immunoenzymatic assays. Plasma levels of RCO were determined using spectrophotometric methods.Results:MMP-2, TIMP-2, AGE and RCO plasma levels were found signifi cantly higher in tip 2 diabetic patients(p<0,001), diabetic patients with microvascular complications(p<0,001) than the nondiabetic controls. MMP-2, TIMP-2 and AGE plasma levels were found signifi cantly higher in diabetic patients with microvascular complications than diabetic patients without microvascular complication(p<0,01,

Tuesday, July 30, 9:30 am – 5:00 pm Endocrinology/Hormones
A100 CLINICAL CHEMISTRY, Vol. 59, No. 10, Supplement, 2013
p<0,001, p<0,001, respectively). AGE and RCO levels were positive correlated with both MMP-2 (p<0.001, p<0.047 respectively) and TIMP-2 (p<0.001, p<0.004 respectively); AGE levels were positive correlated with RCO in type 2 diabet patients.Conclusion:It is considered that AGE and RCO, cause imbalance in MMP-2 and TIMP-2 system which play role in ECM regulation.
A-326
Serum vaspin and adiponectin levels in patients with prolactinoma
Z. Ginis1, F. Ucar1, S. Erdogan2, G. Ozturk1, G. Erden1, M. S. Arslan3, T. Delibası3. 1Diskapi Yildirim Beyazit Training and Research Hospital, Department of Clinical Biochemistry, Ankara, Turkey, 2Atatürk Training and Research Hospital, Department of Clinical Biochemistry, Ankara, Turkey, 3Diskapi Yildirim Beyazit Training and Research Hospital, Department of Endocrinology and Metabolism, Ankara, Turkey
Background:Prolactinomas are the most frequent hormonally active pituitary tumors. Hyperprolactinemia has been associated with impaired metabolism, including insulin resistance. Vaspin and adiponectin are secreted from adipose tissue, which have potential insulin-sensitizing effects that might be implicated in glucose regulation. Reduced glucose tolerance and hyperinsulinemia have been demonstrated in patients with elevated prolactin levels. Moreover, increased insulin resistance using homeostasis model assessment index is described in patients with hyperprolactinemia. Today, there are poor data investigating serum vaspin and adiponectin levels in subjects with prolactinoma. We aimed to evaluate serum vaspin and adiponectin levels in patients with prolactinoma and controls.Methods: A total of 42 women patients with prolactinoma were divided into two groups according to disease control: group-1 composed of 19 patients newly diagnosed with prolactinoma, group-2 made up of 23 follow-up subjects who had been previously diagnosed with prolactinoma and who had been on cabergoline treatment for at least six months. 30 healthy subjects (group-3) matched for age and body mass index were taken as controls. All subjects were evaluated for fasting glucose, HOMA index, serum vaspin and adiponectin levels. Serum vaspin (Biovendor, Brno, Czech Republic) and adiponectin (eBioscience, Vienna, Austria) levels were measured by using the appropriate commercially available enzyme-linked immunosorbent assay kits. Serum prolactin and insulin levels were analyzed by chemiluminescence immunoassay (Centaur XP, Siemens Healthcare Diagnostics Inc., Tarrytown,USA).The assessment of insulin resistance was performed through the homeostasis assessment model of insulin resistance [HOMA (mmol/l×μU/ml)=fasting plasma glucose (mmol/l)×fasting plasma insulin (μU/ml)/22.5]. A value ≥ 2.71 mmol/l × μU/ml was taken as indicative of insulin resistance.Results: Patients with prolactinoma showed the expected higher HOMA values (p<0.001). Group 1 and 2 showed signifi cantly lower adiponectin and vaspin levels than control group (p< 0.01, p<0.001 respectively). Conclusion: This is the fi rst study which showed that the vaspin levels were reduced in patients with prolactinomas when compared with healthy controls. These data suggested that prolactinomas might be associated with low levels of adiponectin and vaspin which were more closely related to insulin resistance and hyperinsulinemia. Further studies should be performed in order to better defi ne the roles of vaspin and adiponectin in prolactinoma.
A-327
The Time Pattern of Classical Insulin-Induced Hypoglycemia Provocative Test Results in False Negative Results.
F. D. Sandrini, M. D. Freire, F. Sandrini. DASA, Cascavel - PR, Brazil
Background:The use of growth hormone (GH) provocative tests to diagnose children with short stature continues to be a controversial issue. Despite the indication for treatment of short stature be determined by clinical criteria, the provocative tests, are still used as the decisive criteria for the indication of treatment with synthetic GH. The insulin-induced hypoglycemia provocative test (IIHT) is considered the most sensitive test to determine the defi ciency of GH. However there is no consensus on the IIHT protocol for blood sampling time or cut off values. Objective: Our objective was to evaluate the clinical laboratory database of IIHT with times of sampling up to 120 minutes and observe the patterns of GH responses. Methods: IIHT containing collecting samples before and at 15, 30, 45, 60, 90 and 120 minutes after 0,1u/kg of regular insulin administration and with glucose level decreased to less than 40mg/dl were evaluated. We considered a peak of GH greater than 10ng/ml at any time of blood
sample collection the expected value for children who were not defi cient in GH. For comparison, we considered classical methods, recent methods and prolonged methods as with the time of sample collection up to 60, 90 and 120 minutes, respectively. Results: A total of 166 IIHT were included in the study. Of these, 110 (66.2%) showed peaks of GH below 10ng/ml. From the 56 tests that were considered normal, the GH peaks occurred at basal time (n=2), 30 (n=6), 45 (n=8), 60 (n=12), 90 (n=14) and 120 minutes (n=14). There was no predominance of any time interval between nadir blood glucose and GH peak. These time intervals ranged from 0, 15, 30, 45, 60, 75, 90, and 105 minutes in 5, 7, 8, 8, 7, 10, 3, 8 IIHT respectively. By analyzing the defi cient IIHT, there was no GH peak (<1,0ng/ml) in 8 of them and, in the remaining tests, the GH peaks occurred at basal time (n=4), 30 (n=5), 45 (n=19), 60 (n=29), 90 (n=24) and 120 minutes (n=21). The time intervals from the hypoglicemia and GH peaks were 0, 15, 30,45,60,75,90, and 105 minutes in 5, 11, 25, 20, 11, 12, 2, 16 IIHT respectively. When comparing the tests according to the sampling time, we observed 64.39% and 35.71% of false negative results in the classical and recent methods.Conclusion: The GH peaks on IIHT occur at any of the sampling time and at any time interval after hypoglycemia. No difference in time response in the IIHT was found between the normal and defi cient patients in GH. IIHT protocols in which sampling time is limited to 60 or 90 minutes results in a signifi cant number of false negative results.
A-328
Analytical performance evaluation of the SHBG immunoassay to calculate a free testosterone and bioavailable testosterone levels.
R. R. Rodrigues1, R. C. Basso1, R. C. A. Sansão1, L. G. S. Carvalho1, G. C. Neto1, N. L. Rubetti Junior1, M. D. C. Freire2. 1DASA, Cascavel, Brazil, 2DASA, São Paulo, Brazil
Background: Sex hormone-binding globulin (SHBG) is a glycoprotein, with a high binding affi nity for steroid hormones such as estradiol, dihydrotestosterone, and testosterone. SHBG measurement is a useful marker of androgen disorders, including hirsutism, virilization and polycystic ovary syndrome, when it is combined with testosterone measurement to calculate a free testosterone and bioavailable testosterone. However, some assays have inherent limitations and biases that affect measurement of low-testosterone values. Biological SHBG concentration deeply infl uences the bioavailable and total testosterone levels. Siemens Healthcare Diagnostics developed a fully automated SHBG immunoassay for testing plasma or serum samples on the ADVIA Centaur platform. The objective of this study was to evaluate the analytical performance of the SHBG assay on this platform.Methods: 43 serum samples from the laboratory routine, with pre-defi ned results within the analytical range for SHBG assay, were analyzed simultaneously by both methods ADVIA Centaur (Siemens Healthcare Diagnostics) and Modular Analytics EVO (Roche Diagnostics) for SHBG and testosterone. SHBG for ADVIA Centaur is a quantitative, two-site sandwich immunoassay, that uses anti-SHBG bound magnetic micro particles as solid phase, and anti-SHBG acridinium labeled conjugate as tracer. Relative light units (RLUs) detected by the system are directly proportional to the amount of SHBG present in the sample. The assay range is 0-180 nmol/L. Samples are pre-diluted onboard.Results: For the ADVIA Centaur SHBG assay the intrassay precision test showed a variation coeffi cient (CV) of 3.72% and 5.81% at a concentration of 23.86 and 48.35nmol/L, respectively. The inter-assay variation coeffi cient was 4.44% and 5.01% at a concentration of 23.84 and 132.95nmol/L, respectively. The SHBG Advia Centaur assay correlated positively (r = 0.965) with the Modular Analytic method, yielding a regression equation with slope of 0.989 and y-intercept of 10.486 (n=43). Comparison of free and bioavailable testosterone calculated by both methods, showed a positive correlation coeffi cient (r = 0,94254), yielding a regression equation with slope of 0.854 and y-intercept of 5,38 for free testosterone and y-intercept of 0,12615 for bioavailable testosterone.Conclusion: The CVs obtained in the precision test were within the analytical quality range specifi ed by laboratory. Linear regression analysis showed no signifi cant differences between the SHBG results reported by the both immunoassay methods evaluated and also for free testosterone and bioavailable testosterone calculated. Our data suggested that the ADVIA Centaur (Siemens Healthcare Diagnostics) SHBG immunoassay is a precise method for measuring SHBG in serum into range the clinically relevant concentrations and shows equivalent performance to the Roche Modular SHBG assay.

Endocrinology/Hormones Tuesday, July 30, 9:30 am – 5:00 pm
CLINICAL CHEMISTRY, Vol. 59, No. 10, Supplement, 2013 A101
A-329
Multi-center comparison of testosterone measurements using immunoassay and mass spectrometry
D. M. Milhorn1, D. W. Chandler2, S. H. Pepkowitz2, N. L. Korpi-Steiner1, C. A. Hammett-Stabler1. 1UNC Hospitals, Chapel Hill, NC, 2Endocrine Sciences, a LabCorp Company, Calabasas Hills, CA
Background: Measurement of circulating total testosterone can be important in the evaluation of endocrine function as well as in the investigation of other endogenously and exogenously produced androgen disorders. These investigations encompass all ages and include females as well as males. Thus analytical methods must be able to span a broad measuring range, typically over 1-1000 ng/dL. The aim of this study was to compare the analytical performance of a micro-well competitive testosterone immunoassay with a testosterone measurement using LC-MS/MS to determine the suitability of this immunoassay for all populations.Methods: Serum samples (n=45) submitted for routine testosterone evaluation were used for this comparative study as part of ongoing quality initiatives. Testosterone measurements were performed using the VITROS 5600 Integrated System (Ortho Clinical Diagnostics, Rochester, NY) and a laboratory developed method (Endocrine Sciences, a LabCorp company, Calabasas Hills, CA) using the API5000 High Performance LC-MS/MS (Applied Biosystems Sciex, Grand Island, NY). The results of the samples used for the comparison study ranged from 5 ng/dL to 1530 ng/dL. In addition calibrations were compared on each instrument by exchange of calibration material.Results: Comparative analysis of the testosterone VITROS automated immunoassay with testosterone by LC-MS/MS yielded the regression equation: VITROS = 0.67x LC-MS/MS + 5.9, (R2 = 0.976). These data demonstrated the VITROS immunoassay has a proportional bias that included a positive bias at reportable testosterone levels of ≤ 35 ng/dL and a negative bias at the higher end of the AMR as compared to the LC-MS/MS method. Analysis of calibration materials yielded a negative bias throughout the AMR using the immunoassay as compared to LC MS/MS on both sets of calibrators.Conclusion: While the VITROS automated immunoassay is a sensitive and specifi c assay likely suffi cient for the measurement of testosterone in the adult healthy male, its use in the pediatric and female populations may be problematic because in our hands the assay overestimates testosterone concentration in the ranges necessary for these populations. Given this positive bias we recommend its use for screening purposes with consideration of follow-up confi rmation using LC-MS/MS based upon clinical needs. Noteworthy, calibration comparisons demonstrated a different bias profi le compared to patient specimens suggesting matrices effect and lack of commutability. This study further supports the need for the development of communicable standards as well as harmonization of testosterone measurement procedures, such as the CDC steroid hormone standardization project, in order to improve comparability and facilitate interpretation of clinical data.
A-330
OPTIMIZING GLUCAGON STIMULATING TEST FOR CHILDHOOD GROWTH HORMONE DEFICIENCY
Y. Schrank, M. Freire, R. Fontes, O. Fernandes. DASA - laboratory medicine, rio de janeiro, Brazil
Background: There is no consensus on the stimulation test considered the “gold standard” for the diagnosis of GH defi ciency, although the GH stimulation test with insulin continues to play a major role in the diagnosis of GH defi ciency, because it has the best overall test performance (sensitivity and specifi city). The administration of insulin represents, however, not an entirely risk-free procedure, and is therefore contraindicated in children younger than 3 years, as well as in children with a history of seizures. In this context, the glucagon stimulation test has been increasingly indicated (because of its safety and tolerance), especially in children below 6 years.The greatest limitation of this test is its long duration (blood samples are taken before intramuscular or subcutaneous administration of glucagon, and then every half hour for 3 hours).Objectives: In order to optimize the specimen collection for the glucagon stimulation test we studied timing of the peak value of GH. The aim of our study was to examine whether the glucagon stimulation test could be performed with fewer samples without compromising its diagnostic value.
Materials and Methods: We retrospectively reviewed 100 responsive GH stimulation test with glucagon performed at our clinical laboratory. A test was considered responsive when peak GH was above 5ng/mL.Results: The mean age of our patients was 8 years, and male:female ratio was 2:1. Median GH values were respectively 2.4ng/mL, 5.9ng/mL, 12.8ng/mL, 8.4ng/mL, 5.6ng/mL and 2.5ng/mL before and 90, 120, 150, 180 and 210 minutes after the stimulus. Eighty-four patients showed GH peak response 120 minutes after glucagon. Only 8% hat a peak GH response at any other time than 90, 120 and 150 minutes. However, half of these patients showed a GH satisfactory response (but not a peak response) at 90, 120 or 150 minutes after the stimulus. We further note that the omission of the basal time, in no way compromises the interpretation of GH stimulus with glucagon.Conclusions: We conclude that GH stimulations test with Glucagon can be optimized, without compromising its end result, by collecting only three specimens for GH determination 90, 120 and 150 minutes after sub-cutaneous administration of the secretagoge.
A-331
Total vitamin D status in the patients with diabetes mellitus and possible connection with low levels of pancreatic elastase in the feces
R. Stojkovic, S. Jovicic, S. Ignjatovic, N. Majkic-Singh. Clinical Center of Serbia, Belgrade, Serbia
In pancreas, the cells of Langerhans islets are scattered within the exocrine pancreatic tissue achieving close contact via islet-acinar portal system. The measurement of pancreatic elastase (PE) in feces is used widely to screen for pancreatic exocrine disfunction. There is a convincing evidence that vitamin 1,25-(OH)2D regulates β-cell function by various mechanisms, such as the effect on insulin secretion through the regulation of intracellular Ca2 + levels, increased resistance to β-cell apoptosis and a likely increase of β-cell replication. We examined the prevalence of insuffi cient concentrations of total vitamin D in the patients with diabetes mellitus (DM) and possible connection between low levels of PE in the feces and inadequate levels of the total vitamin D, as a measure of qualitative malnutrition.The study population was comprised of a cohort of 48 patients with type 1 and type 2 diabetes mellitus. Study also included a control group that consisted of 24 healthy volunteers. PE was determined by ELISA method, using monoclonal antibody (ScheBo Biotech, Giessen, Germany), while the total vitamin D concentration in serum was assayed by electrochemiluminiscence technology on Cobas e601 analyzer (Roche Diagnostics, Wiesbaden, Germany).Compared to the control group, patients with DM had signifi cantly lower values (Student t-test, P<0.05) of total vitamin D (۬۬x: 16.7 vs. 26.1 μg/L) and PE (x: 426 vs. 715 μg/g stool). In the group of patients with DM, 68% of subjects with type 2 DM had a total vitamin D lower than 20 mg/L, while this share was 50% among patients with type 1 DM. We examined existence and degree of correlation between levels of PE and total vitamin D, by using the Spearman nonparametric correlation analysis. We found no signifi cant correlation (P=0.158).Our results are consistent with signifi cantly lower levels of total vitamin D in patients with DM. It is possible that this result can be explained by the lack of pancreatic exocrine function, which is a common condition among patients with DM. The vitamin D replacement therapy should be considered in the context of numerous studies that linked vitamin D defi ciency with pathophysilogy of DM.
A-332
Simultaneous measurement of total estradiol and testosterone in human serum by LC-MS/MS
Y. Wang, M. Gatcombe, J. Farris, J. Botelho, H. Vesper. CDC, Atlanta, GA
Background: Accurate and comparable measurements of hormone steroids are critical for the effective diagnosis, treatment and prevention of hormone related diseases. The CDC hormone standardization program is working with clinical, research, and public health laboratories and professional and medical organizations to improve the quality and comparability in hormone measurement. As part of this program, CDC is providing data on hormone levels in the U.S. population using the National Health and Nutrition examination Survey (NHANES). For this purpose, highly accurate analytical methods with appropriate sample throughput and specimen requirements are needed.

Tuesday, July 30, 9:30 am – 5:00 pm Endocrinology/Hormones
A102 CLINICAL CHEMISTRY, Vol. 59, No. 10, Supplement, 2013
Methods: E2 and TT were simultaneously isolated from proteins, phospholipids, and other matrix components in serum (200 μl) through liquid-liquid extractions (LLE). All extraction procedures were performed with a 96-well plate platform using an automated Hamilton liquid handling system to allow for high throughput. Internal standards of 13C-labeled estradiol (E2) and testosterone (TT) were used for quantifi cation. The LC separation was performed on a Thermo Scientifi c Accucore Phenylhexyl column (150 x 3.0 mm, 2.6 μm particle size) with a gradient of water and methanol and ammonium fl uoride modifi er to improve the ionization of E2. An ABSciex 5500 quadrupole instrument was operated in electrospray positive-negative switching selected reaction monitoring mode. E2 and its internal standard were quantifi ed in negative-ion mode with the ion transition m/z 271 to 145 and 274 to 148, respectively. Simultaneously TT and its internal standard were quantifi ed in positive-ion mode with transition m/z 289 to 97 and 292 to 100.Results: E2 and TT were measured simultaneously by ID LC-MS analysis coupled with LLE in a 96 well plate format using an automated system. The LODs of E2 and TT were determined to be 2.0 pg/mL and 0.35 ng/dL, respectively. The upper limit of linearity was 1000 pg/ml for E2 and 1300 ng/dL for TT. Between run CVs were 3.5-5.2% for E2 at 3 representative levels and 1.2-5.0% for TT, respectively. Within run CV were 4.3-7.1% for E2 and 1.4-2.3 % for TT, respectively. The testosterone and estradiol were well separated, and no interference was detected for the 32 analogues tested. The accuracy of the method was evaluated with comparisons to 40 serum based certifi ed reference materials with the average bias within the suggested performance criteria: E2 (8.3%) and TT (6.4%).Conclusion: Total E2 and TT were measured simultaneously by this method with accuracy and appropriate sample throughput. This method can be used in serum of male and female including pediatrics, old men, and postmenopausal women. This method will be used to measure E2 and TT in the NHANES and other research studies.
A-333
Age-specifi c increase in thyrotropin (TSH): a population based study in Brazil
R. FONTES1, C. C. R. COELI2, F. AGUIAR2, M. FREIRE1, M. VAISMAN2. 1DASA, RIO DE JANEIRO,RJ, Brazil, 2UFRJ, RIO DE JANEIRO,RJ, Brazil
Background: Some studies show a tendency to increase TSH levels with advancing age, with greater increase in those older than 60 years old.Objectives: To estimate changes in TSH by age groups in a cohort of elderly individuals comparing with young ones and determine central tendency values for each age group.Methods: Cross-sectional analysis of 1,220 individuals (50% women), mean age 62.2 ± 18 years (20-100), without goiter, no previous personal or family history of thyroid disease and negative thyroid antibodies, stratifi ed by age.Results: In the whole sample, women and man had no different distribution of TSH values (2.45 ± 1.94 mUI/L vs. 2.25 ± 1.84 mUI/L; p=0.7786). Median TSH levels increased signifi cantly with age: (p<0.0001: 20 to 49 years = 1.54 mUI/L, 50 to 59 years = 1.82 mUI/L, 60 to 69 years = 1.2 mUI/L, 70 to 79 years = 2.01 mUI/L, ≥ 80 years = 2.4 mUI/L). The median of TSH values in persons up to 49 years differed from those with more than 60 years (p <0.01), and were even more signifi cant when compared with patients over 70 and 80 years (p <0.0001). In this cohort, 0.8% of individuals up to 49 years had TSH above the reference value of the method, while this percentage increased to 7.8% in individuals older than 60 years and to 18.0% for those with 80 years or more.Conclusions: Our study shows a gradual increase in TSH levels in healthy aging and that this increase is more signifi cant in individuals over 80 years.
A-334
Reference intervals on the Abbott Architect i2000 for serum prolactin in a population-based study
B. S. Moura, L. G. S. Assunção, L. Moutinho, H. Garcia, M. D. Farace. LABREDE, BELO HORIZONTE, Brazil
Background: Reference values are widely used for clinical decision in medical practice. They are usually represented as statistical confi dence intervals comprising a percentual dispersion of variables in healthy subjects. Although challenging task, each laboratory should establish its own expected ranges, which may be unique to the population served, depending on its demographics. Considering manufacturer’s reference range, the fi nding of high results with change of patient’s profi le during
analytical platform migration should be studied. The aim of this study was to establish reference intervals for prolactin send to Labrede (Reference Laboratory of Specialized Diagnostics), MG, Brazil using a commercial reagent.Methods: Samples were obtained from 125 female and 322 male blood donors, presumably healthy based on interview and clinical examination, according to national regulation of blood donation. These criteria excluded patients with acute illness, chronic diseases, pregnant women, users of various drugs and accepted the use of female hormones. The sample was taken after donation and physical rest, but fasting was not observed. The samples were stored at -20oC. We used Architect i2000, microparticle chemiluminescence immunoassay (Abbott Park, IL, USA). The maximum imprecision for controls was 4.57%. The reference range was defi ned as 95% central interval. Statistical analyses were performed by EP Evaluator® and applied CLSI nonparametric and parametric transformed protocols. Results and Conclusions: The 95% central interval non-parametric approach was 4.1-37.5ng/ml to females and 4.0-29.0ng/mL for males. It was concluded that the manufacturer’s values (n = 100), 3.46-19.40ng/mL and 5.18-26.53ng/mL, for men and women respectively, do not apply to the present study population. Thus, use of samples of database, as selected, consists in a viable option to statistical analysis and populational reference values calculation, providing improvement in laboratorial practice as occurred with prolactin in Architect System.
A-335
Detection of exogenous insulin use: Cross-reactivity of synthetic insulins in serum with commercial immunoassays and absolute determination using a mass spectrometric assay
E. Kaleta1, A. Gorsh1, L. Ouverson1, M. Thevis2, R. Singh1. 1Department of Laboratory Medicine and Pathology, Mayo Clinic, Rochester, MN, 2Institute of Biochemistry, Center for Preventative Doping Research, German Sport University, Cologne, Germany
Background: Detecting iatrogenic hypoglycemia due to exogenous insulin use in the clinical setting can be diffi cult, complicated by true clinical symptoms and lack of confi rmation by insulin testing. Typically, an insulin:C-peptide ratio is useful in identifying exogenous insulin, but relies on the principle that all exogenous insulin will be detected, resulting in an elevated ratio. However, many prescribed insulins are known to have limited cross-reactivity with routine immunoassays, and may not point toward exogenous insulin use. This ultimately leads to unnecessary testing and treatment for patients. This study investigated the cross-reactivity of 6 synthetic insulins across 6 commercial immunoassays. Additional testing using mass spectrometry for quantitation was also performed.

Endocrinology/Hormones Tuesday, July 30, 9:30 am – 5:00 pm
CLINICAL CHEMISTRY, Vol. 59, No. 10, Supplement, 2013 A103
Objective: Assess the cross-reactivity of synthetic insulins by commercial immunoassays to develop a testing strategy for physicians suspecting exogenous insulin useMethods: Spiked serum was prepared in triplicate at 50, 200 and 500 μIU/mL insulin, including Humalog (Lispro, Eli Lilly), NovoLog (Aspart, Novo Nordisk), Lantus (Glargine, Sanofi -Aventis), Novolin N (NPH, Novo Nordisk), Levemir (Detemir, Novo Nordisk) and Apidra (Glulisine, Sanofi -Aventis). Each sample was analyzed according to manufacturer’s specifi cations on six immunoassay platforms, including Beckman Access and Unicel DxI, Abbott Architect, ADVIA Centaur XP, Siemens Immulite 2000 and Roche Cobas e602. Mass spectrometric evaluation was performed as referenced in the literature by immunoaffi nity chromatography and MS/MS on an Applied Biosystems QTrap mass spectrometer. Cross-reactivity was calculated as [(measured-blank/expected)x100], where the expected value was the known amount spiked into serum. For each set of samples, a serum blank was assayed without spiked synthetic insulin to account for endogenous insulin present.Results: Cross-reactivity results are demonstrated below:Conclusion: Results demonstrate that the Roche e602 assay has little cross-reactivity with synthetic insulins; under this circumstance, the recommended assay for assessing exogenous insulin uses an alternative immunoassay platform which can confi rm most of the pharmaceutical insulins.
Cross-Reactivity of Synthetic Insulins by Immunoassay and MS Quantitation (as a percentage)
Humalog NovoLog Lantus Novolin Levemir ApridaBeckman Access 72.1 55.1 98.4 75.8 18.3 8.52Abbott Architect 81.5 48.3 104.0 76.0 110.7 10.9ADVIA Centaur XP 65.5 70.5 87.7 77.3 54.6 1.53Beckman DxI 67.7 54.9 89.8 70.8 21.5 10.6Siemens Immulite 2000 25.1 18.8 54.8 78.3 95.8 -2.84Roche e602 0.00 -0.01 15.4 90.9 0.34 -0.12Mass Spectrometry 92.4 79.0 N/A* 113.5 106.1 109.4*Due to sample instability and international shipping, results were not obtainable for Lantus with mass spectrometry.
A-337
Prolactin and Reproductive Hormone Status in Oligomenorrheic and Infertile Females
R. SUWAL, A. NEPAL, B. GELAL, S. GAUTAM, M. LAMSAL, S. MAJHI, N. BARAL. B P Koirala Institute of Health Sciences, Dharan, Nepal
Background: Oligomenorrhea is one of the signifi cant problems of female these days. Oligomenorrhea during reproductive age group may lead to infertility which may cause matrimonial disharmony which is taken as serious problem in Asian sub-continent. The present study was designed to assess the prolactin, Follicular Stimulating Hormone (FSH) and Luteinizing Hormone (LH) in oligomenorrheic patients in Eastern region of Nepal. Materials and Methods: A total of 126 patients came to the immunoassay laboratory of Department of Biochemistry for the testing of Prolactin, LH and FSH from Department of the Obstetrics and Gynecology with complain of oligomenorrhea and primary and secondary infertility were enrolled in this study. Five milliliters venous blood samples were collected in plain vials and transported to the laboratory maintaining cold chains. Serum Prolactin, FSH and LH were measured by ELISA method (Eliscan, India). Kolmogorov-Smirnov test was used to test the normality of the data. Man-Whitney test was used to test the signifi cance of hormone level between the groups at p value <0.05. Results: The mean age of patients was 24.33±5.91 ranges from 15-45 years. Majority (96, 76.2%) of them had complain of oligomenorrhea and 30 (23.8%) of them had either primary or secondary infertility in whom pregnancy test was ruled out and kept under single category. Out of 96 oligomenorrheic patients elevated level of FSH, LH and Prolactin were found in 17 (17.7%), 16 (16.67%) and 40 (41.66%) respectively. Similarly, in 30 patients with primary or secondary infertility, elevated level of FSH, LH and Prolactin were found in 6 (20.00%), 3 (10.00%) and 16 (53.33%) respectively. The median and interquartile range of FSH, LH and Prolactin were 9.0 (6.6; 20.4) mIU/mL, 6.3 (3.6; 15.6) mIU/mL and 725.7 (502.0; 925.1) mIU/L respectively. There was no statistical difference between the median values of FSH (p=0.214), LH (p=0.959) and Prolactin (p=0.143) in oligomenorrhea and infertile group. Conclusion: Our study showed that there was no remarkable difference of serum FSH, LH and Prolactin between oligomenorrheic and infertile women. Early management of irregular menstruation can diminish the rate of infertility.
A-338
Diabetes-Induced Reversal Of Fortune? - Contrasting Effects of the ACE Gene Insertion/Deletion Polymorphism on Metabolic Perturbations in Type 2 Diabetic Subjects and their First Degree Relatives.
O. A. Mojiminiyi, N. A. Abdella, F. Al Mulla. Faculty of Medicine, Kuwait University, Kuwait, Kuwait
Background: Heritable metabolic traits are fundamental to the pathogenesis of Type 2 diabetes (T2DM) and its complications. As several studies have shown strong associations between the DD genotype of the ACE insertion/deletion (I/D) polymorphism with metabolic perturbations and complications of diabetes, the aim of this study was to investigate whether the associations of ACE gene I/D polymorphism with cardio-metabolic risk factors are refl ected in fi rst degree relatives (FDR) of subjects with T2DM.Methods: Fasting plasma glucose, lipids, insulin and adiponectin as well as HbA1c and plasma ACE were determined in 123 T2DM subjects and 209 non diabetic FDR (190 offspring (son/daughter) and 29 siblings). Homeostasis model assessment-insulin resistance index (HOMA-IR) and insulin sensitivity (%S) were calculated.Results: In each group, plasma ACE was highest in DD and lowest in II genotype. Age, BMI and waist circumference did not differ by genotype. In T2DM, the ACE DD genotype compared to the II genotype was associated with CHD (binary logistic regression analysis odds ratio = 5.2 ), higher HbA1c (105 vs 88 mmol/mol), higher insulin (18.9 vs 13.5uU/ml), lower %S (64% vs 81%) higher HOMA-IR (8.9 vs 6.3) , higher triglycerides (2.0 Vs 1.5 mmol/L), lower HDL-cholesterol (1.1 vs 1.28 mmol/L) and lower levels of the protective adipokine, adiponectin (6.1 vs 7.9 ug/ml). In contrast, II genotype compared to DD genotype in FDR was associated with higher HbA1c (45 vs 40 mmol/L), higher insulin (9.5 vs 7.9 uU/ml), lower %S (87 vs 112), higher HOMA-IR (2.4 vs 1.7), higher triglycerides (1.5 vs 1.2 mmol/L), lower HDL-cholesterol.(1.01 vs 1.20) and lower adiponectin (8.3 vs 9.5ug/ml).Conclusion: In T2DM, II genotype is associated with cardio-protective variables in sharp contrast to FDR, where the DD genotype appears to be protective. As the genetic predisposition to T2DM and complications is strongly infl uenced by environmental and other factors, we postulate that the contrasting associations of ACE I/D genotypes may be due to effects of other genetic, environmental or metabolic factors that predispose the DD genotype to development of complications in the diabetic state.
A-339
Hypogonadism and Metabolic Syndrome in Nigerian Male Patients with both Diabetes and Hypertension
O. AKINLOYE, B. B. Popoola. Ladoke Akintola University of Technology, Osogbo, Osun State, Nigeria
Background:Type 2 Diabetes Mellitus and hypertension are few of the major diseases common in the elderly and low testosterone is associated with a variety of clustersincluding hyperglycemia, increased body mass index, waist/hip ratio, hyperglycemia, dyslipidemia and high blood pressure some of which are predisposing factor of cardiovascular disease. Objectives: The current study was designed to investigate the level of testosterone in patients with both diabetes and hypertension and the relationship of low testosterone with severity of metabolic syndrome in these patients. Methods: Eighty-three male subjects (49 newly diagnosed men with both diabetes and hypertension and 34 apparently healthy controls) were recruited from Ladoke Akintola University of Technology Teaching Hospital, Osogbo and University College Hospital, Ibadan, Nigeria. Demographic, anthropometric and sexual characteristics were obtained using structured questionnaires and standard methods. Blood plasma glucose (BPG), total cholesterol (TC), triglycerides (TG) and high density lipoprotein (HDL-C) were measured by standard colorimetric method while low density lipoprotein (LDL-C) cholesterol was calculated using Friewald’s formula. Testosterone (T) was analyzed by enzyme immunoassay. Data obtained was analyzed statically with SPSS 15.0 software version. Results: This study showed signifi cantly lowered concentrations of testosterone and HDL in addition to the expected increased concentrations of glucose in the subjects compared with controls (p<0.05). An inverse signifi cant correlation was observed in the serum testosterone concentration and metabolic syndrome (BMI or/and Waist/Hip ratio and dyslipidemia; LDL, HDL, TG) (p<0.05). Also, the testosterone level decreased with increase in central obesity (p<0.05).

Tuesday, July 30, 9:30 am – 5:00 pm Endocrinology/Hormones
A104 CLINICAL CHEMISTRY, Vol. 59, No. 10, Supplement, 2013
Conclusion: This study establishes a strong relationship between serum testosterone and metabolic syndrome in subjects with both diabetes and hypertension. This suggests that hypogonadism is a common phenomenon in patients with both diabetes and hypertension in Nigeria.It may therefore be advisable to include routine measurement of testosterone level in the management of patients presented with both diabetes and hypertension. Furthermore, testosterone replacement therapy may improve the life expectancy of these patients.
A-340
Novel sandwich immunoassay for quantifi cation of 25-hydroxy vitamin D on fully automated analyzer
T. Ando, Y. Kitamura, T. Sakyu, Y. Uchida, M. Tomita, F. Takemura, T. Shirakawa, K. Aoyagi, K. Goishi, K. Omi. Fujirebio Inc., Tokyo, Japan
Background: Vitamin D is well known for its role as an important regulator of calcium homeostasis and bone remodeling, and also known to affect the development of several non-bone diseases. 25-hydroxy vitamin D (25OH-D) is the best vitamin D marker, and can be measured by using competitive immunoassay, HPLC, or liquid chromatography tandem mass spectrometry at present. As the number of tests increases, demand for an automated 25OH-D assay continues to grow, but the automated assays available from various diagnostic manufacturers adopting competitive immunoassay with one antibody reportedly fail to meet accuracy and specifi city requirements. Converting the assay principle from competitive to sandwich should greatly improve the assay performance. However, conventional sandwich immunoassay cannot be applied for measuring haptens, because haptens are too small for two antibody molecules to bind simultaneously. By using an antibody that specifi cally recognizes an immunocomplex consisting of 25OH-D and anti-25OH-D antibody, we have developed a sandwich immunoassay for 25OH-D that accurately measures 25OH-D.Methods: An antibody was established by ADLib (Autonomously Diversifying Library) system developed by Chiome Bioscience Inc. In ADLib, antibodies are generated in vitro from antibody libraries established by activating immunoglobulin gene diversifi cation of chicken-derived DT40 cell. Human specimens were mixed with anti-25OH-D antibody-conjugated magnetic beads in treatment solution. The immunocomplex was quantifi ed using an alkaline phosphatase-labeled secondary antibody recognizing the complex. All reactions were executed on fully automated chemiluminescence analyzer (LUMIPULSE, Fujirebio Inc.).Results: 25OH-D in human specimens was detected in a dose-dependent manner, and signifi cant correlation with the commercially available Total Vitamin D RIA was observed (Pearson’s correlation coeffi cient, R2 = 0.94). Precision ranges (CV %) of our sandwich assay were 1.0-2.3% within run, and 1.9-3.5% for total precision. The use of the two antibodies enabled our assay to exhibit improved specifi city against immunoreactive derivatives such as 24,25(OH)2-D, which are present in human serum and known to cross-react with antibodies used in most commercially available immunoassay kits.Conclusion: Assay performance was signifi cantly improved by converting the immunoassay principle from competitive to sandwich. Our novel assay would provide high-throughput, accurate and specifi c immunoassay for 25OH-D. Our hapten sandwich immunoassay platform should be the simplest and most practical approach for routine assays of haptens including vitamins, hormones, drugs and toxins, leading to the breakthrough in analytical/clinical chemistry.
A-341
Evaluation of a Next Generation Enzymatic Assay for Hemoglobin A1c on the Abbott ARCHITECT c8000 Chemistry System
T. Teodoro-Morrison1, Y. Wang2, P. M. Yip2. 1University of Toronto, Toronto, ON, Canada, 2University Health Network, Toronto, ON, Canada
Background: Current guidelines from the American and Canadian Diabetes Association have recommended the use of HbA1c testing in the management and diagnosis of type 2 diabetes mellitus. With this expanded role for HbA1c, there is a clinical need for accurate and precise test methods for HbA1c quantifi cation as endorsed by the National Glycohemoglobin Standardization Program (NGSP). Furthermore, screening for early diabetes in the general population will fi nd increased use considering the increasing prevalence of obesity. This present study evaluated a next generation fully automated and high-throughput enzymatic assay for HbA1c that is run on the Abbott ARCHITECT c8000 chemistry system (List #4P52). Using a whole blood sample, red blood cells are lysed and total hemoglobin is measured
in the fi rst step. Following protease digestion in the second step, a fructosyl-Val-His dipeptide from the N-terminus of the beta-chain of hemoglobin is released and provides a substrate for fructosyl peptide oxidase. This enzymatic method produces hydrogen peroxide which is then measured using a colormetric reagent.Methods: Method comparisons were performed against the on-market Abbott ARCHITECT HbA1c on the i2000 immunoassay system (List #4P72) and the Bio-Rad Variant II Turbo 2.0 ion-exchange HPLC using fresh whole blood patient samples as well as specimens with reference values assigned by NGSP. Additionally, heterozygous hemoglobin variants HbS, HbC, HbD, HbE, and HbF were assessed for potential interference using approximately 20 samples for each variant.Results: Method comparison of the ARCHITECT c8000 enzymatic assay (y) with 124 patient samples across a range of 4.3 to 12.8 %HbA1c with the ARCHITECT i2000 immunoassay (x) showed a regression relationship of y=0.953-0.05 and R=0.984, while the comparison with the Bio-Rad Variant II Turbo HPLC assay (x) showed a regression relationship of y=1.006x-0.25 and R=0.9851. The set included 60 samples which were in the clinically relevant diagnostic range 6.0 to 7.0 %HbA1c and sub-range analysis showed a mean bias of -0.3 %HbA1c relative to both immunoassay and HPLC. Although assay imprecision was not formally assessed, the enzymatic assay performed better than the immunoassay which showed a standard error estimate of 0.05 between replicates for the enzymatic assay compared to 0.24 for the immunoassay. Finally, hemoglobin variants HbS, HbC, HbD and HbE did not interfere with the enzymatic assay when compared to assigned values determined by the NGSP primary reference laboratory. The mean biases were -0.28, -0.45, -0.26, and -0.09 %HbA1c, respectively, across HbA1c concentrations from 4.1-13.5%. Samples containing HbF, however, showed signifi cant negative interference when levels were >10% HbF.Conclusion: We have evaluated the performance of the next generation Abbott ARCHITECT enzymatic HbA1c assay on the c8000 chemistry system. This assay has excellent agreement with the Bio-Rad Variant II Turbo HPLC assay and has no signifi cant interference from hemoglobin variants S, C, D, and E, while negative bias was observed in the presence of >10% HbF. Overall, the clinical chemistry HbA1c assay showed acceptable performance for clinical use and shows minimal interference from common hemoglobin variants.
A-342
Clinical Importance of “Bioavailable” Vitamin D: Development and analytical validation of Bioavailable 25Hydroxy Vitamin D assay
R. Pandian, J. Pandian, A. N. Elias. Pan Laboratories, IRVINE, CA
Objective:To develop a reproducible assay for quantitation of “bioavailable “ vitamin D (Bio D) in human serum samples.Relevance: Vitamin D defi ciency is determined by measuring circulating 25 hydroxy Vitamin D (25(OH)D). Over 85 % of circulating 25(OH) D is tightly bound to a specifi c vitamin D binding protein (DBP). A lesser amount is bound loosely with albumin. Less than 1% is free Vitamin D (Free D). The free fraction along with the albumin bound fraction, called Bioavailable Vitamin D, is readily available for metabolic function.Recent studies indicate that bioavailable, and not total 25(OH) D, correlate well with serum calcium. There was poor correlation between 25(OH) D levels with bone mineral density in studies that examined this relationship. However, the correlation between Bio D and bone mineral density was good. Similarly, measurement of Bio D in hemodialysis patients showed better correlation in terms of mineral metabolism and PTH levels than total Vitamin D measurement. It is therefore important to measure Bio D in some of the clinical conditions associated with potential mineral metabolic changes.Methodology: Bioavailable 25(OH) D is vitamin D (25 OH) not bound to DBP. To obtain the bioavailable fraction, total vitamin D was quantitated using an immunoassay with equal cross reactivity with D2 and D3 (Calbiotech) . DBP was quantitated by an immunoassay using reagents from R & D systems. Albumin was quantitated by a calorimetric method. Using the affi nity constant of 25(OH)D for DBP ( Ka = 7 X 10⁸ M-1 ) and albumin (Ka = 6 X10⁵M-1), Bio D, DBP bound 25(OH)D , albumin bound 25(OH)D and free 25(OH)D were calculated . Bioavailable is the combination of albumin bound 25(OH)D + free 25(OH)D.Results: The assays used in this study are 25(OH)D, DBP and albumin. All the assays are all very reproducible, individually and in combination, for calculations of Bio D with a CV of less than 13 %. Sensitivity, specifi city, and interference studies met the

Endocrinology/Hormones Tuesday, July 30, 9:30 am – 5:00 pm
CLINICAL CHEMISTRY, Vol. 59, No. 10, Supplement, 2013 A105
acceptability criteria .All the three assays were run in normal samples and calculated Bioavailable vitamin D ( 3.87 ± 2.0 ng/ml ), calculated free D ( 9.94 ± 5.47 pg/ml )and DBP bound 25(OH)D ( 28.14 ± 15.2 ng/ml ). Correlation of Bio D with calculated free D in these normal samples was good (r2 = 0.97) whereas correlation with Bio D with total 25(OH) D was poor (r2 =0.366).Conclusion: We have developed a reproducible bioavailable 25( OH ) Vitamin D assay , useful for routine testing in a clinical lab . The availability of “Bioavailable “ vitamin D may be useful to elucidate accurately the nature of relationship between Vitamin D and wide range of disorders including fracture , infection, cancer and cardiovascular diseases .
A-343
Elevated hs-CRP correlates with other atherosclerotic risk factors in young patients of type 1 Diabetes Mellitus
N. G. CHAUDHARY, H. Sharma. GOVERNMENT MEDICAL COLLEGE, BHAVNAGAR, India
Aims: The present research work is designed to study serum high sensitivity C-reactive protein (hs-CRP) as a marker of low grade infl ammation and its association with lipid profi le for assessment of future risk of atherosclerosis in pediatric and young patients with type 1 diabetes mellitus.Methods: In the present study, 60 Patients of known type 1 diabetes mellitus with mean duration of disease of 7.8 ± 2.8 year and 60 apparently healthy subjects were included and their body mass index (BMI), waist circumference and waist to hip ratio (WHR) were measured. Fasting blood samples were collected from each participant and analyzed for hs-CRP, blood glucose, HbA1c, cholesterol, triglyceride, HDL and LDL. Statistical analysisi were carried out by applying student t test and pearson correlation test.Results: The levels of serum hs-CRP (p<0.0001), cholesterol (p<0.0001), triglyceride (p<0.0001), HbA1c (p<0.0001) and WHR (p<0.0001) were found to be signifi cantly elevated in patients of type 1 DM as compared to the control group. In the patient group levels of hs-CRP were positively correlated with triglycerides (r=0.86), triglyceride to HDL ratio (r=0.72), HbA1c (r=0.82), waist circumference(r=0.59), waist to hip ratio (r=0.57), body mass index (r=0.56) and duration of disease (r=0.86). However, hs-CRP levels had not shown any signifi cant correlation with total cholesterol, HDL and LDL.Conclusion: Increased levels of serum hs-CRP and its positive association with other atherosclerotic risk factors suggest that low grade infl ammation starts at earlier age, which indicates an increased risk of future cardiovascular disease in youth with type 1DM.Key words:High sensitivity C-reactive protein, type 1 diabetes mellitus, atherosclerosisAbbreviation:1. BMI- Body mass index2. CVD – Cardiovascular disease3. DM – Diabetes Mellitus4. FBS – Fasting Blood Sugar5. hs-CRP - high sensitivity C-reactive protein6. WHR – Waist to hip ratio
A-344
Hemoglobin J: underestimated HbA1c values by HPLC method
B. del Castillo Figueruelo1, I. Domínguez-Pascual1, P. Ropero-Gradilla2, E. Trujillo-Arribas1, C. Narváez-García1, M. D. Pineda-Escribano1, J. M. Guerrero-Montávez1, M. T. Herrera-Rey1. 1Virgen del Rocio University Hospital, Sevilla, Spain, 2San Carlos University Hospital, Madrid, Spain
Background:HbA1c remains the gold standard to monitore glucemic control, assess the risk complications and, recently, diagnose diabetes mellitus patients. The most frequently method for identifying and quantifying HbA1c is cation-exchange HPLC (high perfomance liquid chromatography). Results may be falsely raised or lowed depending on the particular method used to measure HbA1c and the type of hemoglobinopathy: Hb S, Hb C and other abnormal forms, as silent variants. The
objective of this study was to confi rm the presence of hemoglobin variants in our patients: they give a false HbA1c result which means a bad control of diabetes mellitus. Methods: In the routine HPLC assays (Bio-Rad Variant II Turbo 1.5 min. program), some samples were found to have an abnormal peak before the HbA0 peak. After checking the chromatogram, samples were tested by latex aglutination inmunoassay (DCA System, Siemens) and alternative HbA1c levels were determined. The α-globin gene was amplifi ed by PCR and sequencing was performed on a ABI Prism 310 sequencer.Results: Samples came from patients in the same family and a peak before HbA0 (P4) was observed in all of them. Alternative results suggested the presence of abnormal Hb variant. In fact, a 15 % difference regarding previous results was observed. After sequencing, the presence of GCC>GAC mutation was described at codon 12 in the fi rst exon of Alfa-2 gene. This mutation determines alanine change for aspartic acid known as Hb J-Paris - I.
Conclusion: We found a peak eluting before HbA0 peak, identifi ed as Hb J -Paris- I, which modifi es results with lower values than the real ones for HbA1c. This group of results in different patients points out the necessity of careful inspection of chromatograms and the use of additional methods for HbA1c measurement when the presence of aberrant peaks is detected.
A-345
Evaluation of the Second Generation Testosterone assay (2P13) on the Abbott Architect i2000 Immunoassay System
J. E. Raizman1, I. M. Blasutig1, B. R. Hoffman2, L. Kyriakopoulou3, Y. Wang1, P. Yip1. 1University Health Network, Toronto, ON, Canada, 2Mount Sinai Hospital, Toronto, ON, Canada, 3The Hospital for Sick Children, Toronto, ON, Canada
Objective: To evaluate the analytical performance of the Abbott ARCHITECT 2nd Generation Testosterone assay (List #2P13) for measurement in human serum/plasma. Methods: The ARCHITECT 2nd Generation assay uses a sheep monoclonal anti-testosterone antibody in a delayed one-step competitive immunoassay using chemiluminescent microparticle immunoassay (CMIA) technology. Precision, functional sensitivity, method comparison, and reference interval studies adhered to CLSI protocols. Precision (4 replicates per day over 20 days) was evaluated using Abbott testosterone controls and Bio-Rad Liquichek Immunoassay Plus controls at 3 different levels with a single reagent lot and a single assay calibration. Functional sensitivity was assessed over 5 days using 2 replicates per day. Linearity was assessed across a low range using undiluted samples and an extended range which included automatic on-board dilutions. Method comparison studies evaluated the Abbott 2nd Generation method against the current Abbott ARCHITECT fi rst generation assay (List #6C28), the Roche Testosterone II assay on the Modular E170, and a validated

Tuesday, July 30, 9:30 am – 5:00 pm Endocrinology/Hormones
A106 CLINICAL CHEMISTRY, Vol. 59, No. 10, Supplement, 2013
LC/MS/MS method on the Applied Biosystems API4000. Gender specifi c reference interval verifi cation was performed on each of 20 apparently healthy male and female subjects. Standard statistical analyses were performed using EP Evaluator Release 7 software. Results: Imprecision (CV) of Abbott Low, Medium, and High controls at mean values of 0.3, 2.2, and 7.7 nmol/L equaled 5.6%, 3.8%, and 3.9%, respectively, and agreed with the manufacturer’s claimed precision. Bio-Rad controls at mean concentrations of 4.5, 17, and 40 nmol/L gave CVs of 3.5%, 2.9%, and 3.2%, respectively. The claimed functional sensitivity is ≤0.15 nmol/L which was verifi ed at a concentration of 0.14 nmol/L with a CV of 6.9%. Linearity was achieved with a <5% systematic error from the regression line for the extended assay range (0.2-60 nmol/L), and a <10% systematic error in a clinically low range (0.14-5.5 nmol/L). Method comparison studies over a range of 0.1 to 42 nmol/L for the 2nd Generation assay (y) against the current ARCHITECT assay (n=108), Roche Testosterone II (n=85), and LC/MS/MS (n=49) demonstrated correlations of y=1.08x-0.3 (R=0.99), y=1.18x+0.08 (R=0.99), and y=1.26x-0.1 (R=0.995), respectively. In the female range, the 2nd Generation assay measured approximately 40% lower than the current Abbott assay but showed a positive bias of 0.5 nmol/L compared to the other methods. Lastly, reference intervals studies verifi ed a normal range of 4.9-32 nmol/L in healthy males and 0.4-2.0 nmol/L in healthy females. Conclusions: The 2nd Generation Abbott ARCHITECT Testosterone assay demonstrated acceptable precision and very good overall agreement with the current ARCHITECT assay as well as with Roche Testosterone II and the LC/MS/MS methods. The improvement in sensitivity at low concentrations versus the fi rst generation assay and correlation with mass spectrometry should provide reliable testosterone measurements especially in the female and pediatric patient populations.
A-346
PlGF testing: evaluation of the new KRYPTOR compact PLUS assay.
d. GRUSON, C. Depoix, P. Lison, F. Debiève. Cliniques Universitaires St Luc, Bruxelles, Belgium
Background: Placental growth factor (PIGF) is a pro-angiogenic factor involved in the arterial growth during pregnancy. In pre-eclamptic pregnancies, the biological activity of PlGF is blunted by increased concentrations of the soluble fms-like tyrosine kinase-1. PlGF appears therefore as one of the biomarkers for the early identifi cation of pregnant women at risk for preeclampsia, including women screen at the fi rst trimester. The aim of our study was to evaluate the analytical performances of the KRYPTOR compact PLUS PlGF assay, a recently developed automated immunoassay for measurement of free PlGF, as well as its relationship with PAPPA, a biomarker related to adverse outcomes in pregnant women.Methods: Imprecision of the KRYPTOR compact PLUS PlGF assay (Thermo Scientifi c) was determined with quality control materials and with seven pools of serum covering a broad spectrum of PlGF concentrations, ran in duplicates two times a day for nine days. PlGF and PAPPA circulating levels were measured with KRYPTOR immunoassays in 273 pregnant women (mean age: 33 years) coming to the hospital for a fi rst trimester work-up. These specimens were also used for a method comparison with the Cobas PlGF electrochemiluminescent immunoassay (Roche Diagnostics).Results: With the KRYPTOR compact PLUS assay, the between-run coeffi cients of variation (CV) for the quality control materials were 5.2%, 4.2% and 3.6% for PlGF concentrations of 34.3, 104.1 and 435.9 pg/mL, respectively. The concentrations of the serum pools were 5.89, 10.6, 21.3, 59.3, 811.4, 2026 and 5896 pg/mL; their within run CVs were respectively 19.3, 12.1, 5.5, 2.8, 1.5, 1.8 and 1.5% and their between run CVs were respectively 19.3, 12.1, 6.8, 5.1, 4.0, 4.7 and 6.5%. In the 273 pregnant women the PlGF levels measured with the KRYPTOR compact PLUS assay were ranging from 7.5 to 132.9 pg/mL (median: 41.1) and PAPPA levels from 0.2 to 16.1 mU/mL (median: 3.8). KRYPTOR compact PLUS PlGF assay was signifi cantly correlated with the Cobas assay, with a concordance correlation coeffi cient of 0.83, a pearson coeffi cient (precision) of 0.93 and Cb bias coeffi cient factor (accuracy) of 0.89. A signifi cant correlation was also observed between PlGF measured with the KRYPTOR and PAPPA levels (r = 0.40, p<0.001).Conclusions: Our preliminary results showed for the KRYPTOR compact PLUS PlGF assay a satisfactory imprecision and a very good concordance with the Cobas assay. Our data also highlight a signifi cant relation between PlGF and PAPPA that should be integrated in algorithm designed for the risk estimation of pre-eclampsia in pregnant women.
A-347
Analytical Performance of the IDS-iSYS N-Mid Osteocalcin Immunoassay
E. Cavalier, P. Lukas, A. Carlisi, R. Gadisseur. University Hospital of Liège, University of Liège, Liège, Belgium
Background: Serum osteocalcin, also known as bone Gla protein, is a marker of bone turnover with short half-life, and is hydrolyzed in the kidney and liver. Osteocalcin is a 49-residue (5.8 kDa) polypeptide; the C-terminal fragment is easily cleaved and the N-terminal mid-fragment shows greater stability. Immunoassays detecting only intact osteocalcin will be particularly sensitive to samples degradation; assays detecting fragments may, depending on the fragments recognized, overestimate the concentrations of intact osteocalcin. The intact molecule and the N-terminal fragment are the most abundant immunoreactive forms in normal and osteoporotic patients. We reported the analytical performance of the automated IDS-iSYS N-Mid Osteocalcin assay.Materials and methods: The precision profi le was determined with 5 serum pool levels (3.0 - 177.5 ng/mL). The linearity was verifi ed with two sets of high/low serum samples. Over 200 serum samples were used for the method comparison between three N-Mid Osteocalcin assays: IDS-iSYS versus the IDS ELISA (n = 262, 1.9 - 176.2 ng/mL) and the IDS-iSYS versus Roche Elecsys (n = 206, 3.0 - 142.2 ng/mL).Results: The total precision ranged from 1.9 - 8.2%. The linearity regression was: Expected = 0.99 x (Observed) + 1.8. The Passing Bablok regressions were: IDS-iSYS = 1.03 x (IDS ELISA) + 1.0, r = 0.995 (P<0.0001) and IDS-iSYS = 0.92 x (Roche Elecsys) - 2.1, r = 0.988 (P<0.0001).Conclusion: The IDS-iSYS N-Mid Osteocalcin gave similar results to two other 510(k) cleared N-Mid osteocalcin immunoassays. This automated assay demonstrated suitable characteristics as a high throughput, fully automated bone turnover assay for clinical laboratories.
A-348
Estimated average glucose in gestational diabetes through HbA1c
M. C. Garcia-Saborido, E. Trujillo-Arribas, A. I. Alvarez-Rios, I. Dominguez-Pascual, J. M. Guerrero, D. Acosta-Delgado, T. Herrera-Rey. H.U. Virgen del Rocio, Sevilla, Spain
Background: In order to standardize HbA1c in accordance with different consensus, there is little evidence confi rming the usefulness of estimated Average Glucose (eAG) in clinical practice. Previous studies have connected HbA1c with glucose levels throughout 5-12 weeks; however they have included only small homogeneous cohorts. Therefore, research is required in more diabetic patients groups includingpediatric patients, pregnant women, ethnic groups, etc. The aim of this research is to the connect eAG computed in accordance with the A1c-Derived Average Glucose (ADA) equation, in pregnant women with diabetes type 1 and type 2 with the average fasting glucose calculated through patients´ measurements during a month (MG: Median Glucose).Methods: A total of 43 pregnant women who suffer diabetes and whose pregnancy was attended at the Diabetes and Pregnancy Unit at Virgen del Rocío Hospital in Seville, were included in the study. The eAG was calculated in agreement with ADA equation through HbA1c. The samples arrived at laboratory collected in EDTA tubes and HbA1c was measured using High Performance Liquid Chromatography (HPLC) by BIO-RAD Variant Turbo II. Fasting glycemia was determined by the patients with BM-Test at home, this fact could have affected the measure, and then we computed the average of these values. The Wilcoxon test was used to compare the eAG and the MG.Results: Data of Average Glucose concentration was not normal, thus a Wilcoxon Signed Rank test was performed. This test shows signifi cant differences between the eAG, calculated through the HbA1c, and MG, computed with the pregnant women´s values.Conclusion: Signifi cant differences exist in results of eAG and GM. With these results, it appears to be impossible to use the estimated Average Glucose, calculated in accordance with the ADA equation, in gestational diabetes. Therefore, this equation cannot provide a correct estimation for the interpretation of eAG calculated from HbA1c levels. Because of this, we have proposed a new approach to this study with a profi le with six data collection points for 3 months.

Endocrinology/Hormones Tuesday, July 30, 9:30 am – 5:00 pm
CLINICAL CHEMISTRY, Vol. 59, No. 10, Supplement, 2013 A107
A-349
Development of a Well Characterized Ultra-sensitive Human Anti-Müllerian Hormone (AMH) ELISA.
A. Kumar, B. Kalra, A. S. Patel, S. Shah. Ansh Labs, Webster, TX
Objective: Development of a specifi c and sensitive human AMH ELISA for the quantitative measurement of biologically active AMH in serum, plasma and follicular fl uid.Relevance: AMH is a member of the transforming growth factor-β (TGF-β) superfamily responsible for the regression of Müllerian ducts in the male embryo. In female embryos, the Müllerian ducts give rise to the uterus, fallopian tubes, and upper part of the vagina. AMH is produced in small amounts by ovarian granulosa cells after birth until menopause, and then becomes undetectable. In the adults, AMH also plays a role in Leydig cell differentiation and function and follicular development.Like other TGF-β superfamily members, AMH is produced as a large, 140-kDa homodimeric precursor linked by disulfi de bridges. Cleavage at the monobasic site generates a 110-kDa N-terminal homodimer and a 25-kDa C-terminal homodimer, which remain associated in a non-covalent complex. Recent studies have shown that the AMH C-terminal homodimer is much less active than the non-covalent complex, but almost full activity can be restored by associating the N-terminal pro-region, which re-forms a complex with the mature C-terminal dimer. The fi nding suggests that the AMH non-covalent complex is the active form of protein.Methodology: We have developed a two-step, sandwich-type enzymatic microplate assay using highly characterized monoclonal antibody pair to measure human AMH levels in 25 μL of sample in less than 3.5 hours. The assay uses stabilized recombinant human AMH as calibrators (0.06-14 ng/mL). The assay measures the non-covalent complex of human AMH and does not detect inhibin A, inhibin B, activin A, activin B, activin AB, FSH, LH, TSH, α2M, progesterone, estradiol, prolactin, myostatin at two times their physiological concentrations.Validation: The Ultra-sensitive AMH ELISA, when compared to AMH Gen II assay using 90 serum samples in the range of 0.1-13 ng/mL, yielded a correlation coeffi cient of >0.98 and a slope of 1.10 with an intercept of 0.06 ng/mL. Forty matched Lithium heparin plasma and serum specimens in the range of 0.13-13.01 ng/mL yielded a correlation coeffi cient of >0.99 and a slope of 1.06 with an intercept of -0.1 ng/mL. Total imprecision calculated on three serum pools and two kit controls over 40 runs, two replicates per run, was 5.4% at 0.51 ng/mL, 5.7% at 0.71 ng/mL, 5.6% at 1.05 ng/mL and 5.5% at 1.1 ng/mL, 5.9% at 2.7 ng/mL, respectively. The functional sensitivity calculated at 20% CV was 0.023 ng/mL. Dilution and spiking studies showed average recoveries between 90-110%. When potential interferents (hemoglobin, triglycerides and bilirubin) were added at twice their physiological concentrations, AMH concentrations were within ±10% of the control.Conclusions: A highly sensitive, specifi c and reproducible AMH assay has been developed that measures the non-covalent complex of human AMH. The performance of the AMH assay is ideal for research involving neonatal gender determination, ovarian reserve assessment, premature ovarian failure (POF), primary ovarian insuffi ciency (POI), polycystic ovary syndrome (PCOS), peri-menopausal transition, testicular function, and monitoring of granulosa cell tumor therapy.
A-350
Development of a Sensitive Inhibin B ELISA Optimized to Eliminate False Positive Results.
A. Kumar, B. Kalra, A. S. Patel, S. Shah. Ansh Labs, Webster, TX
Objective: Development of a sensitive Inhibin B ELISA for the quantitative measurement of inhibin B in serum, plasma and follicular fl uid.Relevance: Inhibins are heterodimeric protein hormones secreted by granulosa cells of the ovary in the female and Sertoli cells of the testis in the male. The role of inhibin B in male factor and female infertility has been extensively published. In males inhibin B is a potential marker for spermatogenesis and testicular function. In females inhibin B is a useful tool for assessment of ovarian reserve, oocyte quality, and granulosa cell tumors. Early commercial Inhibin B assays required pre-treatment of samples with an oxidation procedure, which allowed for full immunoreactivity. This important pre-treatment step minimized the risk of false positive results by removing binding proteins, deactivating proteases and catalases. However, these original assays requiring overnight incubation were time-consuming and procedurally cumbersome for laboratories. A commercially available Inhibin B Gen II assay does not require oxidation.
Methodology: We have developed a two-step, sandwich-type enzymatic microplate assay to measure inhibin B levels. This convenient assay utilizes oxidation and binding protein-releasing reagents that eliminate potential false positive results. Results are generated in less than 3.5 hours with excellent precision. The assay measures inhibin B in 50 μL of serum or Li-Hep plasma samples. The assay uses human inhibin B calibrators (10-1200 pg/mL). The highly characterized dual monoclonal antibody pair is specifi c to inhibin B and does not detect inhibin A, activin A, activin B, activin AB, AMH, FSH, LH, follistatin 288 and 315 at two times their physiological concentrations.Validation: The Ansh Labs Inhibin B ELISA assay was compared against two commercially available assays using 97 random male and female samples. The assay showed signifi cant positive linear correlations to the Inhibin B Gen II assay and the AnshLite Inhibin B CLIA assay (r=0.97; P<0.0001; & r=0.99; P<0.0001, respectively). Method comparison to Inhibin B Gen II assay and AnshLite Inhibin B CLIA assays resulted in the following slope and intercept (Ansh Labs ELISA =0.93 Gen II +1.08 pg/mL & Ansh Labs ELISA = 1.01 AnshLite CLIA + 5.9 pg/mL), respectively. Matched serum and Li-Hep plasma samples (n=40) demonstrated a correlation coeffi cient of >0.99 and a slope of 1.04 with -0.23 intercept. Total imprecision calculated on three serum pools over fi fteen runs, four replicates per run was 7.4% at 50.3 pg/mL, 5.48% at 109.5 pg/mL, 5.98% at 397.2 pg/mL. The LoD of the assay when calculated using six serum samples and twelve assays was 7.23 pg/mL. Dilution and spiking studies demonstrated average recoveries between 90-110%.Conclusions: A highly specifi c, sensitive, reproducible and precise microplate Inhibin B assay has been developed to measure inhibin B in serum, plasma and follicular fl uid. The assay has been optimized to eliminate false positive results that can result in incorrectly elevated values. The performance of the assay is ideal for investigation of the physiologic roles of inhibin B in men and women.
A-351
CDC Vitamin D Standardization Certifi cation Program - Updates and Outlooks
Y. E. Rahmani, J. C. Botelho, H. W. Vesper. CDC, Atlanta, GA
Background: Laboratory measurements preformed in patient care and public health need to be accurate and comparable for the effective diagnosis, treatment and prevention of diseases related to vitamin D defi ciency. Research suggesting that vitamin D defi ciency is a risk factor for more than just bone diseases has not only increased interest in vitamin D testing but also exposed the signifi cant variability in current measurement results. This wide spread variation hinders appropriate detection, treatment and prevention of vitamin D related diseases. For example, the Institute of Medicine has acknowledged that an individual may be deemed defi cient depending on the laboratory where the sample is tested. This variability can lead to misdiagnosis of patients, inconsistency in clinical trial outcomes, and misinterpretation of population data for public health policy making. To minimize these problems, clinical vitamin D measurements need to be standardized.Objective: Assay calibration is one of the key elements in assuring the standardization of clinical vitamin D measurements because it creates measurement results that are accurate and comparable regardless of the method used or the time and place of measurement. The Centers for Disease Control is leading a Vitamin D Standardization-Certifi cation Program designed to provide a metrologically traceable calibration that can be verifi ed and certifi ed over one year. The program will also allow participants to identify the sources of measurement variability and help in re-calibration through method comparison and bias estimation between the reference laboratory and the testing laboratory. The program launched in October 2012 and is open to all assay manufactures, laboratories with lab-developed tests, and any vitamin D laboratory interested in achieving standardized results.Methods: Standardization will be established through the use of common reference materials and calibrators that can reliably transfer measurement values from the reference method to routine methods. To ensure an unbroken traceability chain, a panel of non-pooled, single-donor sera was prepared following a standard protocol developed by the Clinical Laboratory and Standards Institute (CLSI) and each patient sample was value assigned with the reference method. The program consists of two phases. In Phase 1, the calibration phase, participants will receive a panel of 40 serum samples with assigned reference values to verify the accuracy and precision of their assay and adjust calibration if necessary. In Phase 2, the verifi cation/certifi cation phase, the established calibration is verifi ed with 10 blinded samples every quarter over a period of one year. Method comparison and bias estimation will be performed by the procedures described in CLSI EP9-A2 “Method Comparison and Bias Estimation Using Patient Samples.” A laboratory is considered standardized and will receive certifi cation when the observed bias and imprecision are within the predefi ned

Tuesday, July 30, 9:30 am – 5:00 pm Endocrinology/Hormones
A108 CLINICAL CHEMISTRY, Vol. 59, No. 10, Supplement, 2013
limits of +5.0% and ≤10.0%, respectively, after four consecutive challenges. Assays are evaluated based on total 25-hydroxyvitamin D, which is defi ned as the sum of 25-hydroxyvitamin D2 and 25-hydroxyvitamin D3.Results: Currently there are 15 participants enrolled in various stages of the program, including clinical laboratories, academic institutes, and immunoassay manufactures. To date, two quarters have been completed.
A-352
Hemoglobin variant integration method for HbA1c analysis by HPLC
S. K. Tanaka. Bio-Rad Laboratories, Hercules, CA
Background: Improved precision and accuracy for HbA1c testing in the presence of the most common hemoglobin variants (E, D, S, and C) is needed to meet the tightening criteria from NGSP and external quality assessment programs. A new integration approach separates HbA0 from HbA2, and improves precision and accuracy for HbAE, HbAD, HbAS, and HbAC sample types.Methods: Previous hemoglobin variant HbA1c analysis method included HbA0 and HbA2 in the total area and %HbA1c calculation. The new analysis method applies an HbA0 peak fi t to all samples, and excludes all post HbA0 area.Verifi cation of the improved integration method on the Variant II TURBO 2.0 method was performed in the following manner: (1) Variant patient samples previously analyzed by an NGSP reference laboratory were tested using the test integration method. Criteria of ±7% of true value was used to assess clinically signifi cant interference. Test and reference methods were correlated to determine bias at 6.5% and 8.5% by linear regression analysis. (2) A dose-response interference study per CLSI guideline EP-7A2 was conducted for each variant at the clinically signifi cant HbA1c values of 6.5% and 8.5%. Homozygous variant patient samples were spiked into a non-variant patient sample pools.
Conclusion: HbA1c analysis for most commonly occurring hemoglobin variant sample types using the HbA0 peak fi t integration method produced HbA1c results that are: (1) within 5% of the NGSP secondary reference laboratory results at 6.5% and 8.5% A1c based upon regression analysis of patient sample correlation. (2) within 7% of reference values at normally occurring levels of heterozygous variant hemoglobins (approximately 28% for HbE and 40% for HbD, S, and C) following the CLSI EP-7A2 dose response protocol.
A-353
Evaluating serum vitamin D levels in elderly patients with subclinical hypothyroidism
F. Ucar1, G. Ozturk1, Z. Ginis1, G. Erden1, M. Y. Taslıpınar1, A. E. Arzuhal1, T. Delibası2. 1Diskapi Yildirim Beyazit Training and Research Hospital, Department of Clinical Biochemistry, Ankara, Turkey, 2Diskapi Yildirim Beyazit Training and Research Hospital, Department of Endocrinology and Metabolism, Ankara, Turkey
Background: Vitamin D is the principal regulator of calcium homeostasis and also known as an immune modulator hormone. It has been recently shown that vitamin D defi ciency is associated with various diseases such as cardiovascular disease, cancer, osteoporosis and autoimmune diseases. Increasing researches have indicated the relation between serum vitamin D level and several autoimmune diseases regarding to important roles of this hormone in immune regulation. However the role of vitamin D in the etiopathogenesis of these diseases is also not well understood. As similar the detailed mechanism of vitamin D action on thyroid hormone metabolism and autoimmune thyroid diseases is still poorly understood. It was reported more recently that patients with autoimmune thyroid disease had lower vitamin Dlevels. However, there are few studies examining vitamin D status in elderly patients with subclinical hypothyroidism. We therefore aimed to investigate vitamin D levels in elderly patients with subclinical hypothyroidism.Methods: In the present study, a total of 37 patients (>70 years old) with subclinical hypothyroidism and 40 healthy controls (>70 years old) were retrospectively analyzed. Serum free triiodothyronine (fT3), free thyroxine (fT4) and thyrotrophic hormone (TSH) were analyzed by chemiluminescence immunoassay (Centaur XP, Siemens Healthcare Diagnostics Inc., Tarrytown, USA). Serum levels of 25-Hydoxy vitamin D (25-OH D) were measured by chemiluminescence immunoassay (DiaSorin,Liaison, Italy). Serum anti thyroid peroxidase (anti-TPO) and anti thyroglobulin (anti-TG) were measured by using a solid-phase, enzyme-labeled, chemiluminenescent sequential immunometric assay (Immulite 2000 XPi, Siemens Healthcare Diagnostics Inc., Tarrytown, USA).Results: There was no signifi cant difference between groups in terms of age and gender distribution. Serum TSH, anti-TPO and anti-TG levels in elderly patients with subclinical hypothyroidism showed expected higher values than healthy controls. Serum 25-OH D levels in elderly patients with subclinical hypothyroidism were lower than healthy controls (p< 0.001).Conclusions: These data confi rm the association between serum 25-OH D levels and subclinical hypothyroidism in elderly patients. Vitamin D insuffi ciency is associated with subclinical hypothyroidism in elderly patients. Further studies are needed to determine whether vitamin D insuffi ciency is a casual factor in the etiopathogenesis of subclinical hypothyroidism in elderly patients or rather a consequence of the disease.
A-354
Serum levels of matrix metalloproteinases(MMP-2, MMP-9), tissue inhibitors of metalloproteinases(TIMP-1, TIMP-2) in type 2 diabetic patients with microvascular complications
H. Erman1, R. Gelisgen2, Ö. Tabak3, H. Uzun2. 1Kafkas university Kafkas medical faculty Department of Medical Biochemistry, kars, Turkey, 2Istanbul university Cerrahpasa medical faculty Department of Medical Biochemistry, Istanbul, Turkey, 3Istanbul Education and Research Hospital, Internal Medicine Clinic, Istanbul, Turkey
Background:ECM is a dynamic structure that requires constant synthesis and degradation by matrix metalloproteinases (MMPs) and this is tightly controlled by tissue inhibitors of matrix metalloproteinases (TIMPs). Disturbances of physiological balance between MMPs and TIMPs seem to play an important role in the development and progression of diabetic microangiopathy. In this study, we aimed to measure the plasma levels of MMP-2, MMP-9 an their specifi c tissue inhibitors TIMP-1 and TIMP-2 in type 2 diabetic patients with microvascular complications and without complications and patients with early stage nephropathy and in healthy subjects,.Methods:We studied 65 patients with type 2 diabetes and 25 healthy subjects as control. Type 2 diabetic patients were divided into two groups as with microvascular complications (n:40) and without complications (n:25). We formed a subgroup of patients with diabetic nephropathy(n:19) from the group of patients with microvascular complications. Plasma levels of MMP-2, MMP-9, TIMP-1, TIMP-2 were determined using immunoenzymatic assays.

Endocrinology/Hormones Tuesday, July 30, 9:30 am – 5:00 pm
CLINICAL CHEMISTRY, Vol. 59, No. 10, Supplement, 2013 A109
Results:MMP-2, MMP-9, TIMP-1,TIMP-2 plasma levels were found signifi cantly higher in tip 2 diabetic patients(p<0,001), diabetic patients with microvascular complications(p<0,001) and diabetic patients with nephropathy(p<0,001) than the nondiabetic controls. MMP-2, TIMP-1,TIMP-2 plasma levels were found signifi cantly higher in diabetic patients with microvascular complications than diabetic patients without microvascular complication(p<0,01, p<0,05, p<0,001 respectively). The plasma level MMP-2, TIMP-1,TIMP-2 were higher in group with nephropathy when compared to group without nephropathy (p<0,01, p<0,05, p<0,001 respectively).Conclusion:It is considered that MMP-2, MMP-9, TIMP-2, TIMP-1 levels are increased in microvascular complications, especially in early stage nephropathy. In type-2 diabetes patients without micro- and macrovascular complications, MMP-2, MMP-9, TIMP-2 and TIMP-1 circulation levels change before clinical evident vascular disease development, and increase in circulation MMP-2,-9 and TIMP-1, TIMP-2 levels either might be fi rst signs of renal involvement or might refl ect general vascular damage.
A-355
No Thyroid Stimulating Hormone Annual or Seasonal Variation in a Clinical Laboratory Database.
F. Sandrini, O. Fernandes, M. M. P. Andrade. DASA, Cascavel - PR, Brazil
Background: The dosages of thyroid hormones are one of the most frequently requested tests in a clinical laboratory. It is known that several factors can infl uence the secretion and / or dosage of thyroid hormones. There is no conclusive data regarding to the biorhythm of serum thyroid stimulating hormone (TSH) in the course of the year. Objective: Our objective was to evaluate the TSH biorhythm in a large sample of a clinical laboratory database by spectral analysis and the infl uence of the gender in TSH variability.Methods: Samples containing TSH values and the anti-thyroglobulin and anti-thyroid peroxidase antibodies negatives were extracted from a large database of a clinical laboratory from January 1st, 2005 to July 30th, 2012. All data were used, including those with abnormal values; therefore no exclusion criteria based on clinical status of the individuals were used. Outlier values were excluded from the analysis and the remaining data (n=83,461) were grouped by gender in patients from 18 to 95 years old. Rhythm components were obtained by the Lomb Scargle method and Cosinor analysis. Cosinor parameters were used to obtain the midline estimating statistic of rhythm (MESOR), amplitude (measure of one half of distance between peak and though of rhythm), acrophase (time at which peak occurs), and signifi cance of rhythm (p). Estimation of 95 % confi dence intervals (CI) of periods of all gender groups was conducted by using non-linear least square analysis.Results: TSH biorhythm was not observed in this database (Figure 1) in general. Also, there was no predictable change within the course of the year in male or female independent group. Conclusion: TSH does not have biorhythm therefore the seasonal time when it was evaluated may not have relevant infl uence on pre-analytical variability of clinical laboratory results.
A-356
Vitamin D Status in a Large Database of a Clinical Analysis Laboratory in Brazil.
M. F. Mantovani, M. D. Freire, F. Sandrini. DASA, Cascavel - PR, Brazil
Background: The vitamin D (Vit-D) defi ciency was previously related only to changes in bone quality. In recent years, it has been observed that Vit-D interacts with other body functions and its defi ciency may lead to several clinical conditions in addition to osteoporosis. Vit-D is produced primarily by skin exposure to ultra-violet (UV) ray in sunlight. Brazil is located in an inter-tropical region and it is easily supposed that its population is largely exposed to UV light, and for that Vit-D defi ciency less prevalent. Objectives: The aim of the study is to evaluate the characteristic levels of 25OH hydroxi Vit-D (25OH-D) in a large sample of a clinical laboratory database in Brazil. Methods: We analyzed 789.086 samples from a large database of clinical laboratory, tested for 25OH-D in the period from January 2011 to December 2012. In this period 03 methods were used, chemiluminescence kit (DiaSorin Liaison ® Vitamin D Total), CMIA (Kit Architect 25-OH Vitamin D Abbott ®), ECLIA Kit (25-OH Vitamin D Roche ®) platforms respectively DiaSorin Liaison ®, Architect I200 ® Abbott and Roche Modular E170 ®. Test results of both methods are equivalent and matched with controls provided by the kit suppliers. We determine the Brazilian area into three geographic regions accordingly to latitute that were north and northeast (N / NW), southwest and mid-west (SW / CW) and south (S). Also ranked the data into clinical characteristics as defi cient, insuffi cient, normal or toxic if the sample values were less than 20, between 20 and 30, between 30 and 100 and greater than 100ng/ml respectively. The time-year was divided into 4 trimesters and, from the fi rst to fourth, there were the predominance of summer, fall, winter and spring. Results: The average values of all 25OH-D was 29.67ng/ml, and clinically observed as 22.35% defi cient, 36.16% insuffi cient, 41.13 normal and 0,36 % toxic. Throughout the year, the average vitamin D result was 31.62, 31.57, 27.75 and 28.77 ng/ml. In clinical perspective, 47.63, 46.67, 35.44 and 37.93% were considered normal in the fi rst, second, third and fourth trimester, respectively. The highest 25OH-D frequency of normal results was observed during the second trimester in the N/NE region (54.91%). The lowest frequency of normal testing was observed during the third trimester in the S region (31.65%) and, at the same period of time and region, occurred the highest frequency of defi cient results (31.64%). Conclusion: Approximately half of the samples are 25OH-D defi cient or insuffi cient. In agreement with the literature, vitamin D levels are higher for lower latitude, however, even during the summer and in a sub-equatorial area, nearly one third of patients had low 25OHD levels. The defi ciency of 25OHD was even more severe in sub-tropical regions. Our data support the literature where other tropical regions or countries also have a high level of patients with defi ciency of 25OHD.
A-358
Let’s Simplify the Diagnosis of Precocius Puberty
M. P. Campagnoli1, M. Scharf Pinto1, J. L. Rocha1, O. Fernandes2. 1DASA,
Curitiba Paraná, Brazil, 2DASA, São Paulo, Brazil
Background: The incidence of precocious puberty (PP) has risen in recent years and their consequences can have a negative impact in the lives of these children, determining, among other things, short stature and psycho-emotional sequelae. The diagnosis of PP is clinical and the determination of etiology depends on laboratory tests and imaging. And only with these data it is possible to initiate therapy. Therefore, the speed and accuracy of laboratory tests are important for therapeutic success. The stimulation test with GnRH (LHRH) is currently the choice of laboratory tests for differentiating between true precocious puberty, in which there is activation of the gonadotropic axis, the peripheral precocious puberty, in which there isn’t rising gonadotropins (LH and FSH) and thelarche, which is early onset breast with predominant elevation of FSH (follicle stimulating hormone) without activation of the gonadotropic axis. However, this test depends on the hormonal intravenous administration of a GnRH agonist (Gonadorelin) raising the fi nal cost of the exam and sometimes being impossible its realization in case of unavailability of medication.Objectives: This study seeks to identify a cutoff in basal LH (Luteinizing Hormone), without stimulation, which could predict positive response to GnRH stimulation test.Methods: Between 2006 and 2013, 975 tests were performed with GnRH stimulus. Of these, 392 were performed in children with clinical criteria of early puberty (girls

Tuesday, July 30, 9:30 am – 5:00 pm Endocrinology/Hormones
A110 CLINICAL CHEMISTRY, Vol. 59, No. 10, Supplement, 2013
aged up to 8 years and 9 years boys). We determined serum levels of LH in basal and GnRH-stimulated by Chemiluminescence (Centaur XP) in 846 girls (367 children under 8 years) and 129 boys (25 below 9 years), as requested their own doctors.Results: Based on retrospective evaluation of the results of these tests, 104 girls aged up to 8 years tested positive for precocious puberty and 06 boys with age until 9 years also showed puberty levels of LH after stimulation. This study demonstrated that basal LH levels above 0.42 mIU / mL in girls showed 54.3% sensitivity, 90.3% specifi city and 79.6% accuracy for the diagnosis of gonadal axis activation (true puberty) . In boys, basal LH levels above 0.69 mIU / mL has 80% sensitivity, 96.3% specifi city and 91.9% accuracy for the diagnosis of true precocious puberty.Conclusion: Basal LH levels above 0.42 mIU/mL for girls and 0.69 mIU/mL in boys are indicative of activation of the gonadotropic axis and may, in the presence of clinical signs (age and Tanner), corroborate to confi rm diagnosis and indicate the begin of therapy for true precocious puberty, without the need of intravenous administration of a GnRH agonist and performing a multiple sample hormone curve.
A-359
Role of Transthyretin (TTR) in balancing cell renewal and energy metabolism - applying a holistic view.
T. M. Pettersson1, C. Lowbeer2. 1LeanLabMed, Stockholm, Sweden, 2Aleris Medilab, Stockholm, Sweden
Background - Approach: Transthyretin (previous pre-albumin until 1985) is extensively studied and associated with several functions the major two related to binding of thyroid pro-hormone thyroxine (T4) and holo- /apo- Retinol Binding Protein (RBP4). Null mutated mice indicate TTR redundancy with very limited phenotype impact. This overview of observed multiple TTR relationships intends re-evaluation of TTR role as to multi-functionality as well as common function in metabolism.Methods - Summarizing relationships: Four major sites of TTR synthesis are considered, that in the liver, plexus choroideus, alpha cells in pancreas and retinal pigment epithelium as well as ciliar epithelial cells in the eye. The hormone binding in relation to that of the competing binding proteins Albumin, TBG and HDL is re-evaluated as well as the signifi cance of TTR heterogeneity and dynamics regarding tetramer stability and conditions for dissociation into dimers and monomers in vivo. Variation in role in relation to compartmentalized functions in combination with mechanistic aspects of TTR amyloid formation as well as tissue localization of TTR amyloid is recognized. Possible roles of TTR in neuro-transmittor related functions (Glu, Gly, monoamines, NO) are included as well as considerations of specifi c metabolic role of the RBP4-vitamin A complex. The relevance of tissue variation in Basal Metabolic Rate and oxygen consumption/extraction at rest and activity is considered including aspects related to cell proliferation and death. Considerations of related plasma membrane transporting functions, pro-hormone activation/ deactivation (T4, T3, rT3, T2), intra cellular/nuclear signalling and crosstalk are notifi ed. Aspects of TTR evolution are considered as well as comparison of perceived TTR role in thyroid hormone metabolism with that of the major binding protein of Vitamin D with respect to vitamin/hormone bio-availability and co-operativity of signalling ligands at the nuclear level.Result and Conclusions: In plasma the free fraction of pro-hormone T4 (FT4) is under strong regulation supporting the hypothesis of free hormone bio-availability. No lack of TTR is observed in man and the fraction of TTRT4 in plasma is under physiological conditions signifi cant and controlled. Acidic pH and plasma components in combination dissociate TTR into monomers indicating possible interstitial mechanism at acidic pH gradients (6 - 5) regulating FT4 availability involving TTRT4. TTR therefore provides regulatory mechanisms of pull system design introducing benefi cial elasticity in relation to tissue need of thyroid hormone in basal/activity induced metabolism and growth promotion but at the risk of amyloid formation and thyreotoxic cell death in conditions of oxygen sensitivity and disruptive metabolism such as gluco- or lipotoxicity in Type-2-Diabetes. Suggested model indicates that TSH and FT4 plasma measurements - presently the in vitro thyroid diagnostic standards - may be appropriate in estimating thyroid gland functionality but not variation in thyroid hormone effect on peripheral tissues at cellular level. Further aspects on multiplicity of TTR functionality are outlined and support integrative role of the protein.
A-360
Müllerian Inhibiting Substance and Sex Hormone Levels in Attention-Defi cit/Hyperactivity Disorder
A. B. Erbagci, C. Gökcen, M. Orkmez, N. Aksoy, A. Karayagmurlu. University of Gaziantep, Gaziantep, Turkey
Background: Testicular Müllerian inhibiting substance (MIS) is involved in the regression of the Müllerian ducts in male embryos during the fi rst trimester of pregnancy. However, plasma concentration of MIS is continued at high levels until puberty. MIS receptor typeII (MISRII), a MIS-dependent signaling pathway in the brain inducing neuroserpin expression, and MIS dependent sexual dimorphic behavior have been shown in rats. Neuroserpin and MIS are suggested to protect neurons against glutamate N-methyl-D-aspartate (NMDA) receptor mediated excitotoxicity in vivo. Attention-defi cit/hyperactivity disorder (ADHD) is a complex neurodevelopmental disorder with a strong gender bias, considering frequency, psychiatric, cognitive, and functional impairment, and risk for co morbid major depression favoring boys. In addition to dopaminergic and norepinephrinergic pathways excessive glutamate stimulation of the prefrontal cortex is suggested to contribute clinical manifestations of ADHD. A fairly new drug for ADHD treatment; Atomoxetine also antagonizes NMDA receptors. In this study we aimed to investigate possible effect of MIS and sex hormone levels in ADHD.Methods: Present study included 49 boys with ADHD at the time of fi rst diagnosis and 30 healthy age matched boys as the control group (min-max age: 5-9 years). 36 of the patient group were re-evaluated after 30 days’ methylphenidate treatment. ADHD diagnosis was assessed using the schedule for affective disorders and Schizophrenia for school age children. Conners parent and teacher rating scales were assesed at the fi rst visit and the 1st month of treatment. AMH levels were analyzed by Beckman Coulter® AMH Gen II ELISA reagents, serum testosterone, estradiol, and albumin concentrations were assessed by Abbott reagents and sex hormone binding globulin (SHBG) levels by Immulite reagents according to the manufacturers’ instructions. Serum samples were concentrated before testosterone and estradiol analyses.Results: Patients with ADHD had lower SHBG and estradiol levels (p<0.05), and higher free and bioavailable testosterone percentages (p<0.005) than the control group. Pre- and post treatment MIS levels were not signifi cantly different. ROC curve analysis of MIS levels, bioavailable testosterone percentage and estradiol levels had relatively higher specifi city (77, 86, 64% respectively) than sensitivity (41, 45, 47%) for diagnosis of ADHD. A general linear analysis model, CTRS-hyperactivity scores of the patients as the dependent variable revealed signifi cant negative relation of pre treatment MIS levels and age (p<0.05).Conclusion: This is the fi rst clinical study that investigates MIS levels in ADHD, and shows a negative relation between MIS levels and hyperactivity scores of the patients. Recent fi ndings have shown that the immature neurons in mice express MISRII and, MIS or MISRII knock-out mice exhibit mild feminization of their exploratory behavior. Additionally, MISRII is expressed in rat pituitary cells and MIS-mediated ac va on of LH β and FSH β gene expressions have been shown. It is possible that MIS may contribute to severity of ADHD symptoms directly by aff ec ng behaviours or, indirectly by aff ec ng sex hormone levels. This study reveals a signifi cant difference in SHBG and estradiol levels and free or bioavailable testosterone percentages in boys with ADHD suggesting possible contribution of sex hormones.
A-362
The Effect of Polyethylene Glycol Precipitation on TSH Measurements
S. DOGAN1, S. OZDEM1, G. YUCEL1, S. OZDEM2. 1Akdeniz University Medical Faculty, Department of Biochemistry, Antalya, Turkey, 2Akdeniz University Medical Faculty, Department of Pharmacology, Antalya, Turkey
Background: TSH is one of the most commonly-measured hormone parameter. Usage of immunochemical techniques in clinical laboratories has enabled the addition of several new parameters to test lists and provided a fast and easy way for preformation of endocrinological diagnosis, treatment and follow up. However, immunoglobulins/antibodies present in plasma may cause interferences in these techniques with resultant false higher or lower values in test results. Polyethylene glycol (PEG) solutions are frequently used to remove immunoglobulins/immunoglobulin - analit complexes from serum samples. In the present study we investigated the effect of PEG precipitation on TSH measurements in sera from patients with normal or high immunoglobulin levels.

Endocrinology/Hormones Tuesday, July 30, 9:30 am – 5:00 pm
CLINICAL CHEMISTRY, Vol. 59, No. 10, Supplement, 2013 A111
Methods: The study was performed in sera from 51 multiple myeloma patients with high immunoglobulin levels from 20 control healthy subjects with normal immunoglobulin levels. Biochemical measurements were performed with Roche Elecsys 2010 immunochemistry apparatus using electrochemiluminescence method. Following initial TSH measurements, immunoglobulins were precipitated using PEG 6000. PEG solution prepared as 20% were mixed with serum samples in a ratio of ½ and vortexed. Following centrifuge for 5 min at 10000 g, supernatants were collected and used for repeat TSH measurements. Results were multiplied by 2.Results: There were statistically signifi cant reductions in measured TSH values (repeat) following PEG precipitation in sera from both groups compared to initial values; mean serum TSH levels before and after PEG precipitation were 2.20 ± 1.48 vs. 1.31 ± 0.78 μIU/ml, around 41% (p<0.05) in sera from patients with high immunoglobulin levels and 2.54 ± 1.88 vs. 1.93 ± 1.26 μIU/ml, around 24% (p<0.05) in sera from control subjects with normal immunoglobulin levels.Conclusion: The fi nding of signifi cant reductions in serum TSH levels following PEG exposure both in control subjects and more markedly in patients with high immunoglobulin levels might refl ect precipitation of TSH in both monomeric and macro forms. More importantly, such an interaction may lead to errors in diagnosis and management of thyroid diseases due to false test results in TSH measurements.
A-363
Reference Intervals for Thyroid Hormones in Adult Population from a Large Brazilian database.
H. S. Dallazuanna, R. R. Rodrigues, G. Cury Neto, O. Fernandes, A. E. Marassi, F. Sandrini. DASA, Cascavel - PR, Brazil
Background: Thyroid hormones are one of the most frequent clinical laboratory analytes requested. There are still some uncertainties about what would be the reference range (RR) for these hormones. Objective: We determined the RR of the thyroid related hormones in a large Brazilian population database. Methods: The thyroid stimulating hormones (TSH), thyroxine (T4), free T4 (FT4) and triiodothyronine (T3) values were extracted from a database of a clinical laboratory in Brazil from January 1st, 2005 to July 30th, 2012. The TSH data from samples which the anti-thyroglobulin and anti-thyroid peroxidase antibodies were measured and no detected were included. The outliers were excluded from the analysis, the Weibull distribution was observed in this sample collection and then the RR were determined by detecting the 2.75th and the 97.5th percentile of the distribution of TSH. The T4, FT4 and T3 RRs were established using the samples from the whole database in which the TSH level was within the new RR. These references were also determined based on the 2.5th and 97.5th percentile of the hormones levels. The references were stratifi ed in ages as young (from 2 to 18 years), adult (from between 18 to 65 years) and elderly (from 65 to 110 years). Results:The RR, median value, mean age, and the number of sample included in the evaluation are presented in the table 1. Conclusion: The thyroid hormones have shown a narrowing of its range of reference values. The RR of TSH has followed a global trend with the decrease of the upper limit. Also, these values are higher in pediatric and the elderly population. The TSH reference limits at 0.32 and 4.12 in adults is similar to that recommended by the American Academy of Clinical Endocrinology.
Hormone measured, the age group, mean age for the group, number of sample and the reference rangeHormone age group mean age (years) number of
samples median value reference rangeTSH adult 41.98 62,625 1.69uU/ml 0.27-4.29 uU/mlTSH young 10.25 9,816 2.07uU/ml 0.48-5.7 uU/mlTSH elderly 74.08 11,080 1.63uU/ml 0.43-5.36 uU/mlT4 adult 42.49 1,714,904 8.2ug/ml 5.4-12.7 ug/mlT4 young 8.77 324,368 8.6ug/ml 5.6-12.9 ug/mlT4 elderly 74.11 299,278 8.3ug/ml 5.3-12.2 ug/mlFT4 adult 42.7 4,158,332 1.14ng/dl 0.82-1.59 ng/dlFT4 young 9.86 584,261 1.2ng/dl 0.85-1.65 ng/dlFT4 elderly 74.56 898,311 1.2ng/dl 0.84-1.73 ng/dlT3 adult 42.09y 1,396,747 118.3ng/dl 78.7-194.2ng/dlT3 young 9.59 228,705 145.5ng/dl 84.7-224.3 ng/dl T3 elderly 74.01 226,143 107.8ng/dl 663 - 168.1ng/dl

Tuesday, July 30, 9:30 am – 5:00 pm Clinical Studies/Outcomes
A112 CLINICAL CHEMISTRY, Vol. 59, No. 10, Supplement, 2013
Tuesday, July 30, 2013
Poster Session: 9:30 AM - 5:00 PM
Clinical Studies/Outcomes
A-364
Evaluation of Critical Laboratory Result Reporting Processes
J. H. Noguez1, R. J. Molinaro1, S. E. Melanson2, W. J. Lane2, C. Schmotzer3, C. R. Fantz1. 1Emory University, Atlanta, GA, 2Brigham and Women’s Hospital, Boston, MA, 3Case Western Reserve University and University Hospitals Case Medical Center, Cleveland, OH
Background: The timeliness of reporting critical values is vital to patient safety. Laboratories are required by regulatory agencies to communicate critical laboratory results to providers; however, the effectiveness and institutional variation of these notifi cation practices is not well understood. The objective of this study was to evaluate the critical result reporting processes of three academic medical centers of similar size and patient complexity.Method: We fi rst studied the time difference in the reporting of critical results and non-critical results by abstracting the data from each institution’s laboratory information system for 3 tests that are run in different sections of the clinical laboratory [chemistry (potassium), immunoassay (troponin), hematology (platelets)]. The time from when the result was ready on the instrument to its release into the electronic medical record was measured. Second, we benchmarked treatment intervention times based on the availability of a critical low potassium result by measuring the elapsed time from when the critical result was reported to when an order for potassium supplementation was placed.Results: Critical results were found to be released 3X-20X slower than non-critical results. Institutions that documented contact with a provider before releasing a critical result into the medical record were found to have results available in the medical record 2-3X faster for potassium, 5X faster for troponin, and 2X faster for platelets than the institution that did not. In one institution it was found that the median time to intervention for a critically low potassium level was 23 minutes for the emergency department, 31 minutes for the intensive care units, 14 minutes for the general medicine units and 9.5 minutes for the surgical units.Conclusions: Our data revealed that in all three medical centers the critical results took longer to report in comparison to non-critical results. Furthermore, intervention orders were initiated shortly after the result was released, emphasizing that medical decisions/interventions are prompted by laboratory alerts. While calling critical results is intended to ensure that necessary interventions will not be delayed for the safety of the patient, our current reporting practices may actually be delaying their treatment. This is this fi rst report to benchmark a relationship between laboratory critical value communications and treatment interventions.
A-365
Use of urinary Neutrophil Gelatinase-Associated Lipocalin (NGAL) in the diagnosis of Acute Kidney Injury (AKI) among stroke patients. Is it time to rethink our diagnostic criteria for AKI?
K. Makris1, K. Koniari2, E. Gialouri2, M. Koursopoulou1, L. Spanou1, O. Glezakou2. 1Clinical Biochemistry Department, KAT General Hospital, Kifi ssia, Athens, Greece, Athens, Greece, 2Internal Medicine Department, KAT General Hospital, Kifi ssia, Athens, Greece, Athens, Greece
Background: Acute kidney injury (AKI) is a common complication following acute stroke (AS). However its diagnosis is hampered by the absence of specifi c biomarkers in the currently used diagnostic criteria which are based on serum creatinine (sCrea) changes and urinary output. Recently urinary neutrophil gelatinase-associated lipocalin (uNGAL) has been proposed as an early biomarker for the detection of tubular damage and a recent meta-anlaysis found that urinary levels >150ng/mL are indicative of AKI. The utility of uNGAL for the early detection of AKI was evaluated in a prospective study of 98 adults with AS. We also studied the effect of AKI on mortality and severity of stroke.
Methods: sCrea and uNGAL were measrued upon admission and at 24, 48 and 72 hours thereafter, with a fi nal measurement on day-7. Stroke severity was measured at the time of admission with the Scandinavian Stroke Scale (SSS). Functional outcome was measured with the modifi ed Rankin scale (mRS) on day-7. Patients categorized into 3 severity groups according to mRS score: mild (mRS-score 0-2), moderate (mRS-score 3-4) and severe (mRS-score 5-6). AKI was defi ned using the AKIN (Acute Kidney Injury Network) criteria (an absolute increase in sCrea above baseline of at least 0.3 mg/dL or a percentage increase of at least 50%) plus uNGAL levels >150 ng/mL. sCrea was determined with the Jaffe reaction on Architect-ci8000 analyzer (Abbott Laboratories, Il.) and uNGAL was measured with an ELISA (Bioporto Gentofte, Denmark)Results: The mean age (SD) of the patients was 75.2(9.4) years. Forty-two patients (42.86%) died during a follow-up period of 1 year. The mean time (SD) between the onset of neurological symptoms and hospital admission was 3.22(1.58) hours. AKI was diagnosed in 24(24.49%) patients. Using the AKIN criteria we diagnosed 19 cases that developed AKI during hospitalization. uNGAL was diagnostic of AKI within 24 hours from admission (mean increase from 86.69 to 182.06ng/mL, p<0.001), while sCrea was diagnostic at 72 hours (1.17 vs 1.74mg/dL respectively p<0.001). Mean levels of uNGAL in patients with AKI were signifi cantly higher (p<0.001) at baseline (86.69ng/mL) compared with those who did not develop AKI (26.13ng/mL) as well as at 24-hours (182.06 vs 29.96ng/mL), 48-hours (228.76 vs 39.40ng/mL) and 72-hours (300.13 vs 28.61ng/mL) respectively (P<0.0001 in all cases). Adding uNGAL in our diagnostic markers 5 more cases were diagnosed, consisting of patients presenting with AKI upon admission. These patients presented with high sCrea (mean 1.84mg/dL) and high uNGAL levels (mean 585.44ng/mL) and did not fulfi ll the AKIN criteria for AKI diagnosis. Since baseline sCrea was unknown AKI diagnosis was based solely on uNGAL levels upon admission. Mortality was signifi cantly higher (p<0.005) among AKI patients compared to non-AKI patients (70.83% vs 51.02%). AKI has also impact on stroke severity since 66.67% of AKI-complicated cases were classifi ed in the high severity group whereas only 27.02% of non-AKI patients (p<0.001).Conclusion: AKI is a major complication of AS contributing in signifi cant morbidity and mortality. Addition of uNGAL to our diagnostic criteria can aid in earlier and more accurate diagnosis of AKI.
A-366
Differentially expressed plasma amino acids as potential biomarkers for selective serotonin reuptake inhibitor (SSRI) treatment in major depressive disorder
H. I. Woo1, M. R. Chun1, J. S. Yang2, S. W. Lim3, D. K. Kim4, S. Y. Lee1. 1Departments of Laboratory Medicine and Genetics, Samsung Medical Center, Seoul, Korea, Republic of, 2Clinical Trial Center, Samsung Medical Center, Seoul, Korea, Republic of, 3Samsung Biomedical Research Institute, Samsung Medical Center, Seoul, Korea, Republic of, 4Department of Psychiatry, Samsung Medical Center, Seoul, Korea, Republic of
Background Major depressive disorder (MDD) is one of the most common mental disorders. The most frequently used antidepressant is selective serotonin reuptake inhibitor (SSRI). However, about half of the MDD patients show a failure to respond to SSRI. Therefore, the identifi cation of blood biomarkers for the prediction of therapeutic response for MDD has been a crucial issue. Discovering alterations of amino acids in MDD would not only help the selection of therapeutic agents but also improve the understanding of the disease. In this respect, we compared plasma amino acid levels (1) in pre-treatment specimens according to the therapeutic response to SSRI to identify potential prognostic markers, (2) between pre- and post-treatment specimens of patients with MDD to observe the response of amino acids to SSRI treatment, and (3) between pre-treatment specimens of patients and healthy individuals.Patients and methods Total 136 plasma specimens, pre- and post-treatment paired specimens of 68 patients with MDD, and 22 plasma specimens from age- and sex-matched healthy individuals were included in this study. The treatment response was defi ned as the 50% or more reduction of HAM-D score before 6 weeks since the initiation of antidepressant treatment. For 40 amino acid analysis, we used the aTRAQTM kits for Amino Acid Analysis in Physiological Fluids (AB Sciex, Foster City, CA). The Agilent 1260 Infi nity liquid chromagotraphy (LC) system (Agilent Technologies, Inc., Santa Clara, CA) with a reverse-phase C18 column was used to separate amino acids. The amino acids were monitored using Agilent 6460 Triple Quadrupole mass spectrometry (MS)/MS (Agilent Technologies, Inc.) with positive electrospray ionization (ESI) in multiple-reaction monitoring (MRM) mode. The amounts of amino acids were calculated by comparing the peak intensities between in specimen and in internal standard at one to one.

Clinical Studies/Outcomes Tuesday, July 30, 9:30 am – 5:00 pm
CLINICAL CHEMISTRY, Vol. 59, No. 10, Supplement, 2013 A113
Results α-amino-n-butyric acid predicted the therapeutic response to SSRI. This result was conserved after the multivariable analysis with clinical factors (p = 0.019; odds ratio (OR), 1.12; 95% confi dence interval (CI), 1.02-1.23). Arginine (p = 0.039), asparagine (p = 0.017), and cysteine (p = 0.039) were differentially expressed between pre- and post-treatment specimens of patients with MDD. Especially, glutamic acid was showed the signifi cant change between pre- and post-treatment specimens only in response group (p = 0.045). In comparison between pre-treatment patients and healthy individuals, L-alanine (p = 0.043), β-alanine (p = 0.024), γ-aminobutyric acid (p = 0.050), β-aminoisobutyric acid (p < 0.001), cystathionine (p < 0.001), glutamic acid (p = 0.047), homocysteine (p < 0.001), methionine (p = 0.004), O-phospho-L-serine (p < 0.001), and sarcosine (p < 0.001) were differentially expressed.Conclusion We identifi ed differentially expressed amino acids, especially relating to the glutamic acid and sulfur-containing amino acid pathways, between pre-treatment patients with MDD, and either healthy individuals or patients after treatment. Our fi ndings also showed the possibility of plasma amino acids as potential predictive biomarkers for SSRI response and warrant further validation studies.AcknowledgementsThis study was supported by a grant of the Korean Health Technology R&D Project, Ministry of Health & Welfare, Republic of Korea (A110339).
A-367
Clinical Laboratory Testing Patterns in Kampala, Uganda: Test Volumes, Test Menus, and Alignment with Disease Burden
L. F. Schroeder1, A. Elbireer2, T. Amukele3. 1Department of Pathology, Stanford University School of Medicine, Stanford, CA, 2Johns Hopkins University Clinical Core Laboratory at Infectious Diseases Institute, Makerere University, Kampala, Uganda, 3Department of Pathology, Johns Hopkins University School of Medicine, Baltimore, MD
Background: The most basic information about laboratories in sub-Saharan Africa (SSA) such as their number, quality, and testing volumes are unknown. We created a practical method for obtaining this information in SSA towns and cities. Here we present some results of our initial city-wide survey of clinical laboratories in Kampala, Uganda.Methods: Kampala city (population 1.7 million) was divided into 5 partially-overlapping regions. Each region was assigned to 2-3 surveyors who identifi ed and surveyed laboratories in their respective regions; in person and on foot. A modifi ed version of the WHO/AFRO Laboratory Strengthening Checklist was used to obtain baseline measures of quality for all clinical laboratories within Kampala. The checklist consisted of 80 ‘yes’/’no’ questions covering all levels of the laboratory process and ultimately translated into a 0- to 5-star scale of quality. The surveyors also measured other attributes such as test menu and self-reported testing volume.Results: A total of 954 laboratories were identifi ed and surveyed in Kampala, with an overall daily testing volume of 13134 tests or an average of 14.9 tests per laboratory per day. The vast majority of laboratories (n=909) did not meet the lowest quality standards defi ned by the WHO/AFRO-derived laboratory strengthening tool (i.e. they achieved zero stars). These 909 zero star laboratories accounted for roughly half of daily testing volume. When limiting analysis to the 20% of laboratories accounting for 80% of volume, the most commonly offered tests in order of decreasing frequency were HIV, syphilis, urinalysis, typhoid, hCG, stool analysis, blood smear, brucellosis, glucose, ABORh, malaria, hemoglobin, tuberculosis, CBC, viral hepatitis, and H. pylori.Conclusions: The active survey method used in this study identifi ed twice as many laboratories as were previously registered in the Ministry of Health. Laboratories per capita in Kampala are commensurate with levels in the United States (1781 vs 1337 people per laboratory) with estimated annual testing volumes per capita ~10 times lower in Kampala (2 vs 22 tests per person per year). However, according to World Bank estimates, Uganda spends nearly 200 times less on health care per person than does the United States ($46 vs $8362). In this light, the people of Kampala are investing relatively heavily in laboratory medicine. The Institute for Health Care Metrics estimates that in those over 5 years of age in Eastern Africa, mortality due to NCDs (cardiovascular disease, diabetes mellitus, cancer, and chronic respiratory disease) is nearly two-thirds that of infectious disease. Aside from glucose testing and urinalysis, the tests most often offered focused on infectious disease.This comprehensive evaluation of the number, scope, and quality of clinical laboratories in Kampala is the fi rst published survey of its kind in sub-Saharan Africa. A key fi nding from this study is that signifi cant laboratory testing is taking place in Kampala, but it is possibly misaligned from the burden of disease and is likely of low quality.
A-368
Magnesium balance in patients with long term Proton Pump Inhibitor(PPI) therapy
S. CHAKRABORTY1, C. BHATTACHARYA2. 1Dept. of Biochemistry,PEERLESS HOSPITAL & B K ROY RESEARCH CENTRE, KOLKATA, India, 2Dept. of Medicine,PEERLESS HOSPITAL & B K ROY RESEARCH CENTRE, KOLKATA, India
Background: Proton Pump Inhibitors (Omeprezole, Lansopresole, Rabeprezole, Pantoprezole etc.) are a group of very commonly used medications used for gastric acid suppression. Globally their use has increased many folds over the last decade. Recently the US-FDA has issued a warning regarding the risk of hypomagnesemia in patients receiving long term PPI therapy. The risk is even higher in patients with concomitant diuretics, patients with diabetes and early CKD. This black box warning of USFDA is due to a number of case reports and some case series which have been published. It has been suggested that PPI’s cause hypomagnesemia possibly as a result of decreased intestinal absorption. Unfortunately till date very few studies have been conducted to evaluate the infl uence of long tern PPI therapy on the magnesium homeostasis. Thus this study was conducted with the objective of evaluating the renal handling of magnesium in such patients and also to compare the serum magnesium levels of such patients with the normal population.Methods: The study was designed as a case control study consisting of adult patients on long term PPI therapy (more than 1 year) and age and sex matched healthy controls not on any medication. Patients on PPI’s with diabetes, chronic kidney disease or on diuretics were excluded. Serum Magnesium and Urinary Fractional Excretion of magnesium (FE-Mg) were measured using an automated clinical chemistry autoanalyser in both these groups. Study was conducted for one year followed by statistical analysis of data with GraphPad software.Results: The mean(SD) age of the long term PPI group was 47.5(5.9) and 45.9 (6.0) in the control population with no statistical difference between the two groups.The mean duration of PPI use was 15(2.0)months Among study patients, long term PPI users (n = 43,Male 20 Female 23) had a mean(SD) Mg level of 1.80 (0.17) mg/dL, and non-users (n = 43,Male 21,Female 22) 2.06 (0.30) mg/dL, p = 0.001. PPI use was associated with lower serum Mg levels (95% CI = - 0.30 to - 0.19).The FE-Mg of long term PPI users had a mean (SD) of 1.37(0.65) % and the control population 2.72(0.88), p = 0.001.Among the PPI group, 9 patients (20%) had a serum Mg less than the lower limit of our population reference interval (1.7 mg/dl) none of them were clinically symptomatic for hypomagnesemia.The serum magnesium levels showed a negative correlation with the duration of PPI therapy( r= 0.502 , p 0.01).Conclusion: PPI use is associated with slightly lower serum Mg levels than the normal population. The FE-Mg of the PPI group is signifi cantly reduced suggesting increased renal conservation of magnesium in order to maintain near normal serum levels.It seems that if patients with impaired renal handling of Mg (diabetes, CKD or those on diuretics) receive long term PPI therapy they might possibly be at a greater risk of clinically signifi cant hypomagnesemia. Clinically evident hypomagnesemia is possibly the tip of the iceberg below which lies the vast spectrum of subclinical hypomagnesemia and thus magnesium levels need to be monitored periodically and supplemented if required in patients on long term PPI therapy.
A-371
Association of Tumor Necrosis Factor-Alpha (TNFA) Promoter Polymorphisms with plasma TNF-α levels and susceptibility to Diabetic Nephropathy in North Indian Population
J. K. GAMBHIR, S. Gupta, O. Kalra, M. Mehndiratta, K. Shukla, S. Aggarwal, R. Shukla. University College of Medical Sciences, Delhi, India
BACKGROUND: The traditional concept of diabetic nephropathy (DN) as a metabolic disease is now being replaced by chronic low-grade infl ammatory disease. Tumor necrosis factor-alpha (TNF-α) is a proinfl ammatory cytokine which may play an important role in the pathogenesis and clinical outcome of DN. Therefore, this work was planned to evaluate whether -863C/A (rs1800630) and -1031T/C (rs1799964) polymorphisms in TNFA gene are associated with plasma TNF-α levels and diabetic nephropathy among Type 2 diabetic subjects from North India.METHODS: We screened 100 healthy controls (HC), 100 Type 2 diabetic subjects without nephropathy (DM) AND 100 subjects with DN for these polymorphisms using the PCR-RFLP methods. Plasma TNF-α levels were measured by ELISA. Analysis of variance and logistic regression were used to associate individual polymorphisms with plasma TNF-α levels and DN.

Tuesday, July 30, 9:30 am – 5:00 pm Clinical Studies/Outcomes
A114 CLINICAL CHEMISTRY, Vol. 59, No. 10, Supplement, 2013
RESULTS: The allelic frequencies of -863C/A were 0.86/0.14 in HC, 0.72/0.23 in DM and 0.84/0.16 in DN, and that of -1031T/C were 0.89/0.11 in HC, 0.95/0.05 in DM and 0.80/0.20 in DN. The carriers of -863A allele had signifi cantly lower plasma TNF-α levels (p<0.05), however, no association was observed between -1031T/C polymorphism and TNF-α levels. The -863C/A (OR=0.439, 95% CI=0.244-0.789, p=0.006) and -1031T/C (OR=3.0, 95% CI=1.355-6.642, p=0.007) were found to be associated with DN when compared with DM group.CONCLUSIONS: These results suggest that above polymorphisms along with plasma TNF-α levels may be associated with diabetic nephropathy, -863C/A polymorphism might be protective whereas -1031T/C may confer a risk for developing nephropathy in DM patients.
A-372
Association of Collagen Type 1 alpha 1 Gene Polymorphism with inguinal hernia
S. Sezer1, N. Şimşek2, H. T. Çelik3, G. Erden4, G. Öztürk4, A. P. Düzgün5, F. Coşkun5. 1Numune Training and Research Hospital, Department of Biochemistry, Ankara, Turkey, 2Healty Ministry, Ankara, Turkey, 3Turgut Ozal University, Faculty of Medicine, Department of Biochemistry, Ankara, Turkey, 4Yıldırım Beyazıt Training and Research Hospital, Department of Biochemistry, Ankara, Turkey, 5Numune Training and Research Hospital, Department of Surgery, Ankara, Turkey
Background: A positive family history is an important risk factor for inguinal hernia development, suggesting a genetic trait for hernia disease. However, gene mutations responsible for abdominal wall hernia formation in humans have not yet been studied. This study aimed to evaluate whether the functional Sp1 binding site polymorphism within intron 1 of the COL1A1 gene was associated specifi cally with inguinal hernia disease.Methods: 85 participants with surgically diagnosed inguinal hernia disease, and 82 physically active controls without any history of connective tissue disease and hernia were recruited for this case-control genetic association study. Polymerase chain reaction (PCR) and restriction fragment length polymorphism (RFLP) and agarose gel electrophoresis techniques were used to dedect these polymorphisms.Results: Signifi cantly more patients in the inguinal hernia group gave a positive family history for an inguinal hernia compared to healthy controls (OR: 3.646; %95 CI 1.375-9.670; p = 0.006). The distributions of genotype frequencies for SNPs were in Hardy-Weinberg equilibrium, and a comparison between the patient group and healthy controls revealed an increased frequency of COL1A1 Sp1 Ss genotype in inguinal hernia patients (OR:3.593; %95 CI 1.867 - 6.915; p = 0.000).Conclusion: Findings of this study suggest that polymorphism of the COL1A1 Sp1 binding site may be associated with an increased risk for developing inguinal hernias. However larger population studies are needed to confi rm these fi ndings.
A-373
Oral paricalcitol improves infl ammatory profi le in haemodialysis patients
M. MUROS1, J. DONATE2, M. MENDEZ1, J. GARCIA-PEREZ1, C. MORA2, J. NAVARRO1. 1University Hospital Nuestra Senora de Candelaria, Santa Cruz de Tenerife, Spain, 2Research Unit, University Hospital Nuestra Senora de Candelaria, Santa Cruz de Tenerife, Spain
Background: Hemodialysis (HD) patients are affected by an infl ammatory syndrome, which has been related to diverse complications, including anemia and malnutrition. Moreover, infl ammation is a strong factor in the development and progression of atherosclerotic disease, being considered a key link between chronic kidney disease (CKD) and cardiovascular disease (CVD). During the last years, a growing interest has developed related to the pleiotropic effects of vitamin D in CKD. Paricalcitol, a selective vitamin D receptor (VDR) activator, has demonstrated in experimental studies a potential capacity to modulate the infl ammatory process. However, data about this effect in the clinical setting are very scarce. The aim of the present study is to analyze in HD patients the anti-infl ammatory effects of oral paricalcitol.Methods: Eighty patients were initially considered for inclusion in the study. Fifty-fi ve were excluded by different criteria, included intact PTH (iPTH) > 300 pg/ml, previous partiroidectomy or transplant, treatment with anti-infl ammatory or immunosuppressant drugs. Twenty-fi ve HD patients (mean age, 62 years; mean
HD time, 12 months; 56% diabetics) were included in the study. All of them were previously treated with intravenous calcitriol, and after a 4-weeks wash-out period, oral paricalcitol (1 mcg/day) was administered for 12 weeks.Results: Basal values of serum calcium (Ca), phosphorus (P), Ca-P product, and iPTH were 9.1 mg/dl, 4.8 mg/dl, 44.2 mg2/dl2 and 317 pg/ml, respectively. At the end of the study, these parameters did not change, except for iPTH, which decreased signifi cantly to 302 pg/ml (p<0.05). Serum concentrations of high-sensitive C-reactive protein (CRP), interleukins (IL)-1,6 and 10, and tumor necrosis factor-alpha (TNFa) were measured. After paricalcitol administration, serum IL levels did not change. However, CRP and TNFa concentrations experienced a signifi cant decrease: 5.9 2.3 vs 7.2 3.4 mg/l (p<0.001), and 7.1 2 vs 7.6 2.6 pg/ml (p<0.05), respectively. The percent decrease of these parameters were 4% and 14%, respectively, respect to their basal values. The ratio between pro- (IL-1, IL-6 and TNFa) and anti-infl ammatory (IL-10) cytokines experienced a benefi cial change: IL-6/IL-10 (p=0.05) and TNFa/IL-10 (p=0.01).Conclusion: Results of the present study show that oral paricalcitol administration to HD patients is associated with modulation of infl ammatory process, specifi cally with a reduction of CRP and TNFa, as well as an improvement of IL-6/IL-10 y TNFa/IL-10 ratios.
A-374
The clinical signifi cance of mesothelial cells in peritoneal dialysis effl uent detected by CellaVision DM96
M. Idei1, Y. Tabe1, K. Miyake1, C. Hamada1, H. Takemura2, H. Io1, K. Ishii2, T. Horii2, Y. Tomino1, A. Ohsaka2, T. Miida1. 1Juntendo University School of Medicine, Tokyo, Japan, 2Juntendo University Hospital, Tokyo, Japan
Background: Encapsulating peritoneal sclerosis (EPS) is a serious complication of peritoneal dialysis (PD). A risk of EPS increases with a development of peritoneal dysfunction where increased peritoneal permeability is associated with exfoliation and loss of peritoneal mesothelial cells. The total nucleated cell (TNC) count and the differential count of polymorphonuclear cells (PMNs) / mononuclear cells (MNs) of the peritoneal dialysis effl uent (PDE) are usually performed by manual microscopic method. Although the presence of large mesothelial cells in PDE is a potential predictive marker for EPS, mesothelial cells in PDE is usually assessed by cytology, but not by the conventional microscopic method. The aim of this study was to evaluate the ability of CellaVision DM96 (DM96), a digital microscopy system, to classify cells and detect mesothelial cells in PDE. In addition, we investigated the clinical signifi cance of morphological assessment of mesothelial cells in PDE.Methods: A total of 79 PDE samples from 33 PD patients (PD duration; 30 ± 29 months) undergoing peritoneal equilibration test (PET) were examined. TNC count and the differential count of PMNs / MNs were examined by manual microscopic method in 46 samples with more than 80 TNCs / mm3. DM96 utilized PDE cytocentrifuge preparations with May- Giemsa stain. PMNs were further classifi ed into neutrophils, eosinophils and basophils, while MNs into lymphocytes, macrophages, mesothelial cells and histiocytes by DM96. When the diameters of mesothelial cells were more than double those of neutrophil, we defi ned them into a large mesothelial cell. To assess the association of peritoneal dysfunction and mesothelial cells in PDE, 33 samples in non-peritonitis phase within one month after PET were further tested by DM96. According to the PET results, patients were categorized into four transporter groups; high (H), high average (HA), low average (LA), and low (L).Results: DM96 showed a strong correlation with manual microscopic method (PMNs / MNs; r = 0.86, p < 0.001, n = 46, respectively). In the analysis by DM96, mesothelial cell count was less in H (n = 3, 2.7 ± 0.6 / 36 mm2) transporter group than HA (n = 16, 15.8 ± 11.4 / 36 mm2) (p < 0.05), and did not differ among HA, LA (n=11, 14.8 ± 21.7 / 36 mm2), and L (n = 3, 11.3 ± 12.9 / 36 mm2) groups. Normal, large, and polymorphonuclear mesothelial cell counts didn’t differ among PET groups. In peritonitis phase, mesothelial cell count was greater than in non-peritonitis phase (p < 0.05). Large mesothelial cell count was signifi cantly greater in peritonitis than non-peritonitis phase, whereas normal and polymorphonuclear mesothelial cell counts didn’t differ between these phases.Conclusion: DM96 is useful for detailed cell classifi cation and mesothelial cell detection in PDE. Decreased number of mesothelial cells in PDE in a high transporter membrane state may be a convenient and useful predictor for advanced peritoneal dysfunction. We speculate that it might refl ect the loss of peritoneal mesothelial cells during chronical peritoneal injury.

Clinical Studies/Outcomes Tuesday, July 30, 9:30 am – 5:00 pm
CLINICAL CHEMISTRY, Vol. 59, No. 10, Supplement, 2013 A115
A-375
Bone Specifi c Alkaline Phosphatase and Cardiovascular Morbidity among Patients on Maintenance Hemodialysis
F. M. El Shanawani, M. M. Hasan. Theodor Bilharz Research Institute, Cairo, Egypt
Background: Vascular calcifi cation is common in individuals with chronic kidney disease (CKD) and signifi cantly correlated to the high cardiovascular death risk. In advanced CKD, stages 3 through 5, secondary hyperparathyroidism (SHPT), along with renal osteodystrophy, are common and may be associated with abnormal mineral metabolism and / or abnormal serum or tissue mineral levels, vascular calcifi cation, and poor survival, especially among those who undergo maintenance dialysis treatment. Serum alkaline phosphatase (ALP) is a biochemical marker of bone turnover and is used to monitor metabolic bone disease associated with renal insuffi ciency. Higher levels of serum ALP were associated with vascular calcifi cation in hemodialysis patients MHD. Bone-specifi c ALP is a byproduct of osteoblasts and is a more specifi c measure of bone formation as well as bone turnover and is increased in MHD patients, probably as a result of high turnover bone disease. Atherosclerosis, in addition to being a disease of lipid accumulation, also represents a chronic infl ammatory process. Infl ammatory markers such as high-sensitivity C-reactive protein (hsCRP) may provide an adjunctive method for global assessment of cardiovascular risk.Objectives of this work:1. Estimate the clinical utility of serum biomarkers of bone metabolism like ALP, bALP, intact parathyroid hormone, calcium, and phosphorus as potential markers and indicators in diagnosis of renal osteodystrophy in MHD patients aiming to improve their clinical outcomes.2. Evaluate the association between renal osteodystrophy and progression of vascular calcifi cation detected by echocardiography and carotid Duplex in MHD patients.3. Testing the role of CRP and hsCRP in mediating the increased cardiovascular risk in MHD patients.Patients and methods: Seventy MHD patients and 15 healthy volunteers were enrolled in the study. All patients and controls were subjected to echocardiography, carotid duplex and predialysis blood sampling for estimation of routine blood chemistry (Calcium, Phosphorus, urea, creatinine, glucose, albumin, ALT, AST, ALP, cholesterol, triglyceride, HDLc ) using autoanalyzer, intact parathormone(iPTH) and hsCRP by a solid-phase chemiluminescent enzyme-labeled immunometric assay. Bone specifi c alkaline phosphatase (bALP) was measured by using a radioimmunometric assay.Results: Plasma levels of ALP, bALP, iPTH, CRP, hs-CRP, urea, creatinine, glucose, phosphorus, were signifi cantly higher in MHD group compared to control group. Statistical analysis revealed highly signifi cance statistical difference in EDD, ESD, EF, IVS, PWT, IMT in MHD group compared to the control group. Mitral valve calcifi cation was found in 27.4% and aortic valve calcifi cation was found in 71.4% of hemodialyzed patients. B-ALP sensitivity, specifi city and positive predictive value of the test at a cut off > 10 IU/L were found to be 89%, 67% and 79% respectively.Conclusion: The results of this study demonstrate that plasma bALP can be measured with a reliable immunoassay in hemodialysis patients. It represents a highly sensitive and specifi c biochemical marker of skeletal remodeling in these patients, even better when associated with plasma iPTH levels. Abnormal mineral metabolism and infl ammation are pivotal factors for the increased cardiovascular risk in CKD patients.
A-376
Albumin-to-creatinine Ratio in Early-morning Urine versus 24 hour Urine Albumin in Kidney Transplant Patients.
I. López-Pelayo, A. Sáez Benito-Godino, J. Gutiérrez-Romero, M. Calero-Ruiz, M. Samper-Toscano, J. Vergara-Chozas, M. Bailén-García. Hospital Puerta del Mar, Cádiz, Spain
Background: it is generally accepted that the best measure of albuminuria is that based on a 24h urine collection, but the variability of results obtained make this view questionable. The objective of this study was to determine if albumin-to-creatinine ratio (ACR) in early-morning urine (EMU) is interchangeable with 24h albuminuria (Alb24h) in kidney transplant patients at various cut-offs.Methods: we included 170 kidney transplant patients controlled at the Nephrology Department, with EMU and 24h urine samples. We measured ACR and 24h albumin on Cobas 6000 (Roche Diagnostics). Patients transplanted the previous six months
or with diuresis less than 500 ml were excluded. Statistical analyses: Spearman´s rank correlation and Passing-Bablock regression test for different cut-offs (30, 300 and 700 mg/24h). The ability of ACR to predict abnormal Alb24h at these cut-offs was determined from Receiver Operator Characteristic (ROC) curve analysis and calculating sensitivities, specifi cities and likelihood ratios (LR).Results: for cut-offs of 30, 300 and 700 mg/dl, the Spearman´s coeffi cients were 0.668; 0.709 and 0.889 respectively (p<0.0001 all). The regression test showed a non-linear relationship for the fi rst cut-off and signifi cant differences for the second. The equations were: Y=-144.62+0.883*X (Cut-off>300 mg/24h) and Y=-276.8+0.94*X (Cut-off>700 mg/24h). 95%Confi dence Interval were (-273.4 to -17.6), (0.763 to 1.044) and (-795.3 to 58.1), (0.735 to 1.323) respectively. ROC curve analysis was described in table 1.Conclusion: this study shows a good correlation between both samples. ACR underestimates Alb24h and is progressively greater as the degree of albuminuria increased. Linear regression allows estimating Alb24h from ACR for concentrations higher than 300 mg/24h, with two different equations depending on the cut-off considered. We could use the same cut-offs for ACR than for Alb24h to facilitate clinical purpose. We fi nally conclude that we can not use EMU to predict albumin excretion in the range of major clinical interest.
A-377
High Serum Creatinine Variability Prior to Intravenous Contrast Medium Administration May Confound a Diagnosis of Contrast-Induced Nephropathy
J. S. McDonald, R. J. McDonald, E. E. Williamson, D. F. Kallmes. Mayo Clinic, Rochester, MN
Background: Administration of iodinated contrast media has been associated with the development of acute kidney injury (AKI), termed “contrast-induced nephropathy”, however contrast-independent sources of AKI can confound a diagnosis of contrast-induced nephropathy. We sought to determine the effect of serum creatinine (SCr) variability prior to contrast exposure on the incidence of AKI.Methods: All contrast-enhanced and unenhanced abdominal, pelvic, and thoracic CT scans performed at our institution between 2000-2010 were identifi ed. Patients were stratifi ed by baseline SCr into < 1.5 mg/dL, 1.5 - 2.0 mg/dL, and > 2.0 mg/dL mg/dL subgroups. Patients with high pre-scan SCr variability (delta > 0.5 mg/dL in the 7 days prior to scan) were identifi ed and subdivided into increasing SCr or decreasing SCr subgroups. The effect of pre-scan SCr on the incidence of post-scan AKI (SCr ≥ 0.5 mg/dL over baseline in the 1-3 days post-scan) was assessed using Fisher’s Exact test.Results: A total of 49,421 scans performed on 29,422 patients met inclusion criteria, of which 10,677 (22%) had high pre-scan SCr variability. Incidence of high SCr variability increased with increasing baseline SCr (11% for baseline < 1.5 mg/dL, 42% for baseline 1.5-2.0 mg/dL, 75% for baseline > 2.0 mg/dL). Of the 4370 patients who developed AKI, 2417 (55%) had high pre-scan SCr variability. Patients who developed post-scan AKI were more than four times likely to have high pre-scan SCr variability compared to patients who did not develop AKI (23% versus 5%, OR= 5.51 (95% CI 5.17-5.88), p<.0001). Both increasing and decreasing SCr subgroups had markedly elevated incidence of post-scan AKI compared to patients with unchanged SCr (Increasing: 42%, OR = 13.1 (95% CI 12.0-14.3), p<.0001; Decreasing: 16%, OR = 2.83 (95% CI 2.54-3.16), p<.0001; Unchanged: 6%). These fi ndings were observed both in patients that received a contrast-enhanced CT scan and patients that received an unenhanced CT scan.Conclusions: Patients with elevated baseline SCr frequently demonstrate high SCr variability independent of contrast exposure. A substantial percentage of AKI following contrast exposure may be attributable to this SCr variability instead of contrast-mediated renal injury.

Tuesday, July 30, 9:30 am – 5:00 pm Clinical Studies/Outcomes
A116 CLINICAL CHEMISTRY, Vol. 59, No. 10, Supplement, 2013
A-378
Procalcitonin as a Biomarker of Bacterial Infection in Acute Liver Failure
J. A. Balko1, L. S. Hynan1, N. Attar1, C. Sanders1, W. J. Korzun2, W. M. Lee1. 1UT Southwestern Medical Center, Dallas, TX, 2Virginia Commonweatlh University, Richmond, VA
Background: Because acute liver failure (ALF) patients share many clinical features with severe sepsis and septic shock, identifying bacterial infection in ALF is diffi cult. Procalcitonin (PCT) is a precursor form of calcitonin normally produced in the parafollicular C cells of the thyroid gland. In bacterial infection or sepsis, PCT is produced by other cell types; elevated levels of PCT are useful in detecting bacterial infection. We examined PCT as a biomarker of bacterial infections in patients with ALF.Methods: We classifi ed 1863 patients enrolled in the US ALF Study based on the patient’s severity of disease by standard defi nitions of systemic infl ammatory response syndrome (SIRS), severe sepsis, and septic shock. We randomly selected 115 patients: without SIRS (n = 30); SIRS (n = 29); severe sepsis (n = 40); and septic shock (n = 16). Twenty subjects with chronic liver disease (primary biliary cirrhosis or viral hepatitis, CLD) were randomly chosen from UT Southwestern Liver Disease Data /Sample repositories and classifi ed as not infected. The area under the receiver-operator characteristic curve (AUROC) was determined after separating PCT values by the absence (n = 79) or presence (n = 56) of documented bacterial infection. Sera were tested for PCT using the Siemens ADVIA Centaur BRAHMS PCT assay, a sandwich, chemiluminescent immunoassay. PCT values <0.10 ng/mL are considered negative (not consistent with bacterial infection), while values >2.00 are indicative of severe sepsis (consistent with bacterial infection).Results: All ALF median PCT values were near or above the 2.0 ng/mL cut-off, with a trend but no signifi cant difference between groups (p = 0.169): without SIRS - 1.57 ng/mL, SIRS - 2.29 ng/mL, severe sepsis - 2.51 ng/mL, and septic shock - 5.89 ng/mL. When CLD (control, no infection) subjects were compared to the ALF groups, there was a signifi cant difference (p = <0.001). The CLD median PCT value was 0.104 ng/mL, with all values <0.25 ng/mL. PCT values for ALF subjects with acetaminophen (APAP) toxicity were higher than subjects with other etiologies across all severity categories. Median PCT values for APAP subjects without infections were above 2.0 ng/mL (without SIRS - 4.53 ng/mL; SIRS - 3.38 ng/mL), while subjects with other etiologies and bacterial infections were below 2.0 ng/mL (severe sepsis - 1.16 ng/mL; septic shock - 1.71 ng/mL). The AUROC value was 0.697 (SE = 0.044; p < 0.001). A PCT cutoff of 1.62 ng/mL had poor discriminatory value with a sensitivity and specifi city of only 0.643 and 0.620, respectively.Conclusion:PCT appears to be a robust assay for detecting bacterial infection and sepsis in the general population, but showed limited discrimination between ALF patients with or without bacterial infection because of elevations related to etiology itself. Massive necrosis of hepatocytes with infl ammation likely mimics sepsis in the ALF setting rendering PCT useless for determination of presence of sepsis in ALF. Further elucidation of the relationship between increased PCT and severe acute liver damage such as that resulting from APAP toxicity is required.Supported by U-01 58369 from NIDDK and Siemens Healthcare Diagnostics, Tarrytown, NY.
A-379
Serum heart-type fatty acid binding protein in the various diseases predicts short term mortality.
J. Jeong, P. Park, M. Park, M. Kim, Y. Seo, J. Ahn, K. Kim. Gachon University Gil Medical Center, Incheon, Korea, Republic of
Background: Amino-terminal pro-B type natriuretic peptide (NT-proBNP) is the gold standard as a diagnostic marker in patient with acute heart failure (HF). However, numerous other diagnoses are associated with an elevation in NT-proBNP levels and the age-related increase in sub-clinical cardiac abnormalities may lead to elevations in NT-proBNP as well as parallel decreases in renal function. Heart-type fatty acid binding protein (H-FABP) has a high potential as a sensitive biomarker for cardiac disease in early stage. High sensitive C-reactive protein (hsCRP) is also acute phase protein which is increased in infl ammatory conditions, malignancy, tissue injury or necrosis injury. Biomarkers can become predictive factors of clinical outcomes. The aim of this analysis was to defi ne the utility of acute response markers, hsCRP and H-FABP as predictors of survival in patients with increased NT-proBNP level.
Methods and Results: We selected 295 patients with increased NT-proBNP level who were admitted or visited outpatient clinic in Gachon University Gil Medical Center during 1 month (Dec, 2012). Serum concentrations of H-FABP and hsCRP were measured in 295 patients and outcome was determined on day 30. The 62 patients showed cardiac arrest or were diagnosed with acute myocardial infarction (AMI). 157 patients had a history of cardiac disease including AMI, HF, arrhythmia or valvular disease and 60 patients presented infectious disease or septic condition. Other 16 patients got regular treatment due to the end stage renal disease. During a follow-up period, 263 (89.2%) patients were survived and 32 (10.8%) patients were expired. The performance of biomarkers in predicting mortality was assessed using receiver operating characteristic (ROC) curve analysis and area under curve (AUC) were 0.818 for H-FABP and 0.755 for hsCRP. In the patient with acute cardiac disease, AUC were 0.858 for H-FABP and 0.657 for hsCRP. The patient group with other cardiac disease showed 0.73 for H-FABP and 0.645 for hsCRP. Infection group showed 0.714 for H-FABP and 0.543 for hsCRP. There was no expire patient in group with end stage renal disease. These demonstrated the usefulness of H-FABP in predicting mortality during short term period. The Pearson correlation coeffi cients between NT-proBNP and H-FABP were 0.429 (p<0.001), NT-proBNP and hsCRP were 0.140 (p=0.016), and FABP and hsCRP were 0.197 (p=0.001) respectively. The correlation between the markers in patients with cardiac or infectious or renal diseases was statistically signifi cant. Correlations were further evaluated by partial correlation analysis and age was an independent factor.Conclusion: H-FABP has been known for an early and sensitive biomarker of myocardial ischemia. This study suggests H-FABP can be a reliable marker for predicting short term survival in non-acute cardiac, infectious and renal diseases. NT-proBNP, hsCRP and H-FABP showed statistically signifi cant correlations in the studied group. To validate these results and develop a panel of prognostic biomarkers, further studies are required.
A-380
Proposing new analytic performance goals for immunoassay systems
N. Akbas1, A. Algeciras-Schimnich1, N. A. Baumann1, D. R. Block1, J. R. Budd2, S. Gaston2, G. G. Klee1. 1Mayo Clinic, Rochester, MN, 2Beckman Coulter, Chaska, MN
Relevance: Clinical laboratories must have well-defi ned analytical performance goals to evaluate test results. Laboratories should determine whether assays meet these goals and adopt quality assurance systems to ensure assays continue to meet the analytic performance desired for the intended use.Objective: Techniques for setting analytical performance goals were proposed for precision, trueness, linearity, detection limits, and consistency across instruments and reagent lots. Resultant goals were used to evaluate the performance of twenty-fi ve immunoassays performed on the Beckman Coulter, DxI 800 immunoassay systems in two laboratories at Mayo Clinic, Rochester, MN.Methods: The analytic precision and accuracy goals were set using biologic variation based desirable limits. The College of American Pathologists Linearity Surveys limits were used as linearity goals. Minimum detection limit goals were set at the 0.1 percentile of patient test results for one year. Consistency goals were proposed based on the cumulative distribution of patient test values and the variability of these distributions around key decision points. These techniques used for setting goals may result in signifi cantly higher or lower limits than those typically used in the clinic and may vary with a laboratory’s patient mix. The lowest and highest observed value for percent coeffi cient of variation was used to assess intra- and inter-assay precision. Linearity of each assay was evaluated based on the data for smallest and largest observed slope for linearity. The proposed detection limit goals were compared to Beckman Coulter’s package insert claims. Lot-to-lot consistency was assessed measuring approximately 20 specimens on three reagent lots. The analytical bias was calculated using the regression equation at key decision levels. Consistency between instruments was evaluated by measuring the serum quality control sample over a period of six months at one laboratory and by measuring the average of 20 specimens over a year at another laboratory. Regression equations were used to calculate observed bias at each decision level.Validation: Most of the assays met the proposed goals for precision: 64 of 82 intra-assay evaluations and 60 of 87 inter-assay evaluations were within desirable limits as defi ned by Fraser and Peterson (Clin Chem 45:321, 1999). Except for Total Thyroxine, all assays met the proposed goals for trueness. Linearity results were within the proposed goals for all assays. Eight assays had more than 0.1% of test results below the detection limit of the assay. With respect to lot-to-lot consistency, only Vitamin B12 exceeded the proposed goals at two decision levels, while fi ve other assays (Cortisol, Ferritin, Follicle Stimulating Hormone, Thyroid Stimulating Hormone

Clinical Studies/Outcomes Tuesday, July 30, 9:30 am – 5:00 pm
CLINICAL CHEMISTRY, Vol. 59, No. 10, Supplement, 2013 A117
and Total Thyroxine) exceeded the proposed goal at one decision level. Instrument consistency results of Thyroid Stimulating Hormone and Total Thyroxine exceeded the desirable goals at two decision levels, while Follicle Stimulating Hormone, Prolactin and Vitamin B12 exceeded the proposed goal at one decision level.Conclusions: New techniques for setting analytical performance goals have been proposed. This investigation indicated that Beckman Coulter, DxI 800 immunoassay system meets most of these resultant goals.
A-381
Comparison of maternal and umbilical cord blood soluble lectin-like oxidized low density lipoprotein receptor 1 levels and the frequency of the two gene polymorphisms in early- and late-onset preeclampsia
A. Tüten1, H. Erman2, B. Aydemir3, G. Guntas Korkmaz4, A. Kiziler5, V. Sözer6, R. Gelişgen7, M. Albayrak8, S. Acıkgoz1, G. Simsek9, G. Simsek9, H. Uzun10. 1Departments of Obstetrics and Gynecology, Istanbul University, Cerrahpasa Medical Faculty, Istanbul, Turkey., Istanbul, Turkey, 2Department of Biochemistry ,Istanbul University, Cerrahpasa Medical Faculty, Istanbul, Turkey, Istanbul, Turkey, 3Department of Biophysics, Medical Faculty, Sakarya University, Sakarya, Turkey, 4Kırklareli University, School of Health, Kırklareli, Turkey, Kırklareli, Turkey, 5Department of Biophysics, Medical Faculty, Namık Kemal University, Tekirdag, Turkey, Tekirdag, Turkey, 6Department of Biochemistry, Yildiz Technical University, Istanbul, Turkey, Istanbul, Turkey, 7Departments of Biochemistry, Istanbul University, Cerrahpasa Medical Faculty, Istanbul, Turkey., Istanbul, Turkey, 8Department of Obstetrics and Gynecology, Duzce University School of Medicine, Duzce, Turkey, Duzce, Turkey, 9Departments of Physiology, Istanbul University, Cerrahpasa Medical Faculty, Istanbul, Turkey., Istanbul, Turkey, 10Department of Biochemistry, Istanbul University, Cerrahpasa Medical Faculty, Istanbul, Turkey, Istanbul, Turkey
Background: The main purpose of this study was to determine the maternal and umblical cord blood soluble lectin-like oxidized low-density lipoprotein receptor 1 (sLOX-1) and oxidized LDL (oxLDL) levels in early and late-onset preeclampsia. Additionally, we aimed to investigate whether LOX-1 3’UTR188CT and LOX-1 K167N polymorphysms could effect the development of preeclampsia in Turkish population. Methods: A population based case-control study was conducted in pregnant women with early- (24-32 weeks’ gestation; n=19) and late-onset (35-42 weeks’ gestation; n=22) preeclampsia compared to gestational age-matched healthy normotensive pregnant women (n=44). Groups were compared for the maternal and umblical cord serum soluble sLOX-1 and plasma oxidized LDL (oxLDL) levels. Additionally, the frequency of the two LOX-1 gen polymorphysms, 3’UTR188CT and K167N, determined by PCR-RFLP technique were compared between 113 preeclamptic and 96 uncomplicated pregnant women. Results: The mean maternal and umblical cord serum sLOX-1 and plasma oxLDL levels were signifi cantly increased in early- and late-onset preeclampsia compared to control pregnant women (p<0.001). When early and late onset preeclamptic women were compared, the increase in these parameterswas more pronounced in early preeclampsia (p<0.001). LOX-1 3’UTR188 TT and LOX-1 K167N NN genotypes were associated with signifi cantly increased LOX-1 level (P=0.05) and the risk of preeclampsia when compared with the C and K alleles carriers (P=0.001, OR: 3.396; P=0.01, OR:2.057, respectively). Conclusions: Our fi ndings strongly indicate that sLOX-1 has potential to be used as a novel biomarker in the diagnosis of preeclampsia and for the evaluation of early-onset preeclampsia. A higher serum LOX-1 concentration, and the LOX-1 3’UTR188CT and LOX-1 K167N gene polymorphisms were signifi cantly associated with risk of preeclampsia. sLOX-1 may be a potential therapeutic target in the treatment of early-onset preeclampsia.
A-386
Performance of fl ow cytometry to screen urine for bacteria and white blood cells prior to urine culture
C. D. Giesen, A. M. Greeno, K. A. Thompson, R. Patel, S. M. Jenkins, J. C. Lieske. Mayo Clinic, Rochester, MN
Background: The gold standard test for diagnosis of urinary tract infection is bacterial culture. However, urine cultures are labor intensive, costly and take 1-2 days. Therefore, many patients are treated presumptively without culture or prior to culture results being known. The aim of this study was to evaluate the clinical performance of the UF-1000i for predicting positive urine cultures in comparison to the standard urine Gram stain.Methods: We evaluated the Sysmex UF-1000i for quantifi cation of bacteria and white blood cells (WBCs) in urine in order to determine if it could be used to predict positive culture. Consecutive urine samples submitted to our laboratory for aerobic culture processing over 26 days (n=791) were studied.Results: The UF-1000i demonstrated good linearity, within and between run precision for bacterial and WBC quantifi cation. Using ROC analysis, the AUC for predicting a positive culture (>105 cfu/mL) was 0.95 and 0.90 for bacteria and WBCs, respectively, with optimum cutoffs of 288.9 bacteria/μL and 31.8 WBCs/μL, respectively. At these cutoffs, sensitivity (SE) and specifi city (SP) for culture positivity were 0.93 and 0.86, respectively for bacterial counts and 0.89 and 0.79, respectively for WBC counts. Use of gender specifi c bacterial cutoffs improved performance, especially in males. SE and SP of urine Gram stain were 0.94 and 0.68, respectively.Conclusion: Quantifi cation of bacteria in unspun urine samples by the Sysmex UF-1000i can be used to screen urine samples for those likely to grow >105 cfu/mL. The Sysmex UF-1000i demonstrated increased SP over urine Gram stain, and would allow for a 55% reduction in urine cultures.
A-387
Appropriate Hb A1c testing frequency is not associated with proper treatment changes.
J. Noguez, R. Molinaro. Emory University, Atlanta, GA
Background: It is recommended that Hb A1c testing be performed at least twice per year on patients who are meeting treatment goals and demonstrate stable glycemic control. For those who have had treatment changes or are not meeting glycemic goals, quarterly testing is suggested. While Hb A1c utilization and adherence to testing frequency recommendations is important, so is the adjustment of treatment when changes in Hb A1c are considered signifi cant. The objective of this study was to assess clinician practice by monitoring Hb A1c testing and medical chart review with clinician survey.Methods: Using retrospective data analysis, we determined whether recommendations are followed for Hb A1c testing frequency, and in those cases, whether appropriate treatment changes are made based on calculated Hb A1c reference change values.Hb A1c values (n=32,112) over a one-year period were extracted from the laboratory information system and the data fi ltered to include only patients who were tested at least twice within the time frame of our study. This data (n=4,380) was partitioned into patients that were tested at the recommended frequency and those that were not. Patients tested at the recommended frequency were further partitioned into those who demonstrated glycemic control (HbA1c<7.0%) (n=410) and those who did not (Hb A1c≥7.0%) (n=327) based on their initial Hb A1c values. Chart review and clinician survey was conducted to assess treatment changes for patients whose initial Hb A1c demonstrated glycemic control but subsequent Hb A1c testing at the recommended frequency did not (n=64).Results: The testing frequency observed supports previous fi ndings for Hb A1c overutilization and suggests only ~17% (n=737) of patients were being tested at the recommended frequency.Based on the analytical performance of the instrument used for Hb A1ctesting in this study, a calculated reference change value of ≥0.6 % Hb A1c must be met in order to be considered a signifi cant change. Our data also indicates that when Hb A1ctesting frequency recommendations are met, treatment changes were made only 30% (n=23) of the time even when the ΔHb A1c represented a signifi cant increase.Conclusion: The appropriate utilization of laboratory tests is necessary for optimal patient care, which involves testing patients at the recommended frequency as well as adjusting treatment when clinically signifi cant changes in test results are observed.

Tuesday, July 30, 9:30 am – 5:00 pm Clinical Studies/Outcomes
A118 CLINICAL CHEMISTRY, Vol. 59, No. 10, Supplement, 2013
This study revealed that <20% of patients in our institution were tested at the recommended frequency and evenwhen HbA1c testing frequency recommendations were met and a signifi cant increase in reference change value was observed (≥0.6 % Hb A1c), treatment changes were made only 30% of the time. While the reasons behind the lack of treatment observed are not well understood, increasing communication between the laboratory and clinicians regarding these signifi cant reference change values may help to improve awareness and interpretation of Hb A1cresults.
A-388
Analysis of the relationship between endotoxin and endothelin-1 with hepatorenal syndrome.
G. Li. Department of Laboratory Medicine, West China Hospital, Sichuan University, chengdu, China
Background: To study the effect of endotoxin and endothelin-1(ET-1) on the development of hepatorenal syndrome (HRS) by analyzing clinical data, laboratory parameters, infection rates, serum procalcitonin(PCT) and ET-1 levels of cirrhosis patients with ascites and type 1 HRSMethods: Between January 2009 and October 2012, 56 cirrhosis inpatients with ascites and type 1 HRS of our hospital were enrolled in HRS group while 60 cirrhosis inpatients with ascites but normal renal function were included in non-HRS group. Clinical data, cirrhosis etiology, infection rates and types, Child-pugh classifi cation, systemic infl ammatory response(SIRS) score and mean arterial pressure(MAP) of the two groups were recorded; Blood samples of the two groups were obtained for laboratory analysis of liver function, renal function, electrolyte, PCT and ET-1. All the data were compared between the two groups.Results: Infection rates of HRS group(75.0%) was signifi cantly(χ2=25.68,P<0.05) higher than that of non-HRS group(28.4%). PCT,ET-1 and SIRS score,of HRS group(8.72(3.14,31.68)ng/L,13.04±2.82pg/ml and 2.1±1.1) were signifi cantly(P<0.05) higher than those of non-HRS group(0.11(0.04,0.45)ng/L,5.76±1.68pg/ml and 0.6±0.6). In addition, Urea,Crea,Cys.C and K levels of HRS group were signifi cantly (P<0.05) higher than those of non-HRS group while the Na and Cl levels of the HRS group showed a signifi cant decrease (P<0.05) to the non-HRS group. ALT and AST levels of the two groups did not differ(P>0.05).Conclusion: Endotoxin and ET-1 are closely associated with development of HRS through severe renal vasoconstriction resulting from elevated ET-1 caused by endotoxin.
A-389
Clinical Impact on Reference Ranges Using a Mixed Population of Beckman AU and DxC Chemistry Analyzers in a Multi-site Integrated Delivery Network
J. Thebo1, S. Ishii2. 1Sparrow Health System, Lansing, MI, 2Beckman Coulter, Brea, CA
Background: Sparrow Health System is an integrated health care organization in Michigan, with over 900 affi liated physicians, fi ve hospitals, and 20 laboratory centers. The laboratories perform over 6 million chemistry tests annually using AU and DxC chemistry analyzers (Beckman Coulter, Brea, CA). AU analyzers are used in the core laboratory, with DxC 600i systems at four hospital laboratories.Objectives: Our goal is to provide standardized reference ranges and results for routine chemistry assays throughout our system. With the mixed population of analyzers (AU versus DxC), a study was performed to identify assay(s) with clinically signifi cant differences.Method: Correlation studies were performed in parallel on AU400/2700 and DxC 600i analyzers. A minimum of 40 samples per analyte were analyzed at each laboratory site. Statistical evaluation was performed using EP Evaluator (Data Innovations, Inc.) and analysis of results alignment with decision points/clinical impact of the observed differences.Results: Enzyme assays exhibited the largest statistical differences (data shown). Two assays were identifi ed with clinically signifi cant differences that could impact care for patients tested at multiple sites_amylase and lipase. Further, the observed slope and bias for LD prompted examination of the patient data and ordering practices for this analyte. It was determined that there would be minimal patient impact. For amylase and lipase, a reverse slope and offset were entered into the DxC 660i software and the correlations were repeated.
Conclusion: Correlation studies demonstrated that the AU and DxC chemistry analyzers produce clinically comparable results, allowing for common reference ranges for most routine assays. Of the 25 basic assays evaluated, enzymes showed the greatest differences, with lipase and amylase identifi ed as clinically signifi cant. Slope/offset adjustments were entered into the DxC software. Repeat correlations yielded acceptable results, allowing for common reference ranges across all Sparrow sites.
Correlation Data From Representative Laboratory SiteAnalyte N Slope Intercept Deming R2 Bias (%)Amylase 51 1.214 7.1 0.9941 30.3Amylase Adjusted 49 1.022 0.7 0.9979 3.0ALP 51 0.917 4.8 0.9984 -4.6ALT 51 0.968 2.9 0.9988 3.9AST 51 1.054 3.1 0.9998 11.1CK 51 0.991 7.0 0.9979 3.0LD 51 0.809 13.1 0.9996 -13.9Lipase 50 0.684 9.5 0.9709 -4.8Lipase Adjusted 49 1.042 -2.4 0.9876 1.6
A-390
Pending Microbiology Cultures at Hospital Discharge and Post-Hospital Patient Outcomes in Medicare Patients Discharged to Sub-Acute Care
S. E. Walz. Arkansas State University, State University, AR
Each year, greater than 20% of Medicare patients are re-hospitalized within 30 days, costing over $17 billion. Pneumonia, septicemia, and urinary tract infections are common healthcare-associated infections, and are among the top 10 reasons for re-hospitalizations in these patients. Microbiology cultures are key tools used to detect infections, and >27% of general medicine and sub-acute care patients are discharged from the hospital with a pending blood, urine or sputum culture. Whether there is a link between pending microbiology cultures at hospital discharge and re-hospitalization, emergency department (ED) visits, or death within 30 days, remains unknown.We retrospectively analyzed Medicare and laboratory data for 773 stroke, hip fracture, and cancer patients discharged from a single large academic medical center to sub-acute care facilities in 2003-2008. Multinomial logistic regression modeling was used to examine relationships between pending microbiology cultures at discharge, and re-hospitalization, ED visits, or death within 30 days. Models controlled for patient sociodemographics and medical history.Patients with preliminary results available at discharge for a pending culture had greater odds (1.8) of being re-hospitalized or visiting the ED for an infection within 30 days compared to those with no pending culture. This result was statistically signifi cant at the 0.10 level.Pending microbiology cultures may represent a potential target for improved follow-up and communication of test results post-discharge.
A-391
The association of white matter microstructure and function change with CLU Gene in nondemented old subjects
Y. He, Y. Zhou, H. Tang, L. Zou, B. Ying, L. Wang, Q. Gong. West China Hospital of Sichuan University, chengdu, China
Background: Alzheimer’s disease (AD) is the world’s most common demented illness, and MRI study demonstrated structural and functional degeneration. AD is considered highly heritable, variant of CLU (rs11136000) is implicated in late-onset AD. However, it’s not clear the association of C allele with structural and functional change in healthy people. In our study we investigate the brain changes of AD genetic risk variants in nondemented elderly subjects, which may help to understand disease development and further interventions for those at risk.Methods: 51 nondemented old subjects were enrolled in our study. we compared subjects with (CC) genotype and (TT+TC) genotype. Verbal fl uency scores and MMSE scores were also available for all subjects. Each subject was scanned on a 3T Siemens Trio system (Erlangen, German) by using single-shot echo planar imaging sequence to acquire Diffusion-weighted image. SPM 8, Matlab 2010 and FSL4.1 were used to analyze the data. FA values in each region that revealed group difference were extracted and partial correlations were computed to examine relationships between the FA changes and clinical measures using age and sex as covariates.Results: The CC genotype group revealed lower FA in left anterior cingulate gyrus and left extra-nuclear and increased FA in bilateral frontal, right subcallosal and left temporal lobe (fi gure 1). The negative correlation were found between the FA in left

Clinical Studies/Outcomes Tuesday, July 30, 9:30 am – 5:00 pm
CLINICAL CHEMISTRY, Vol. 59, No. 10, Supplement, 2013 A119
middle frontal gyrus and the verbal fl uency scores (r = -0.377, p = 0.028), the positive correlation of FA discrepancy in left extra-nuclear with MMSE scores were also identifi ed (r = 0.382, p = 0.026) in CC genotype group.Conclusion: Nondemented healthy carriers of the CLU gene risk variant showed complex FA discrepancy when compared with T allele carriers, some of which related with cognitive measures. These changes can be considered as abnormal imaging phenotypes for the risk genetic type.
A-392
Elevated ET-1/NO and TXA2/PGI2 in cirrhosis patients with ascites and type 1 hepatorenal syndrome
N. Xin, H. Yong, W. Bin, H. Hualan, M. Qiang, S. Haolan, L. Tongxing, G. Baoxiu, H. Jun, L. Guixing. Department of Laboratory Medicine, West China Hospital, Sichuan University, chengdu, China
Background: Hepatorenal syndrome (HRS) is a severe complication of End Stage Liver Disease (ESLD) but the pathogenetic mechanism of it is still elusive at present. Recent studies indicate that severe renal vasoconstriction is associated with the development of HRS. The aim of this study is to investigate the mechanisms of renal vasoconstriction in HRS by exploring serum levels of endothelin-1(ET-1), nitric oxide (NO), thromboxane A2(TXA2) and prostacyclin I2(PGI2), which have antagonistic vasoactive effect on kidney, in cirrhosis patients with ascites and type 1 hepatorenal syndrome.Methods: Between January 2009 and May 2011, 38 cirrhosis inpatients with ascites and type 1 HRS (HRS group) and 41 cirrhosis inpatients with ascites but normal renal function (Non-HRS group) in our hospital were enrolled in this study. Clinical characteristics of the subjects were recorded and serum samples of the two groups were obtained for laboratory analysis of ET-1, NO and stable metabolites of TXA2 and PGI2, TXB2 and 6-keto-PGF1α.Results: No signifi cant difference (P>0.05) was found in age, gender, etiology and severity of the underlying liver disease between the two groups. However, the patients of HRS group had higher systemic infl ammatory response syndrome (SIRS) score than the non-HRS group (P<0.05). Furthermore, ET-1, NO, ET-1/NO, TXB2 and TXB2/6-keto-PGF1α level of patients of HRS group ((93.7±22.6)μmol/L, (13.50±2.38)pg/ml, 0.15±0.07, (7432±2186) pg/ml and 0.23±0.06) showed signifi cant increases (P<0.05) compared to the non-HRS group ((58.3±18.2)μmol/L, (7.77±2.69)pg/ml, 0.13±0.06, (5032±2104) pg/ml and 0.17±0.08) while 6-keto-PGF1α levels of the two groups did not differ (P>0.05).Conclusion: The ET-1/NO and TXA2/PGI2 in cirrhosis patients with ascites and HRS-1 were disturbed by SIRS. The imbalance of ET-1/NO and PGI2/TXA2 might be involved in the development of HRS.
A-393
Association Between Graft Function and Serum TNF-α, TNFR1 and TNFR2 Levels in Patients With Kidney Transplantation
D. Budak, H. Akbas, G. Suleymanlar, G. Yucel. Akdeniz University, Faculty of Medicine, Antalya, Turkey
Background: Tumor necrosis factor-alpha (TNF-α) is a monocyte-derived cytokine involved in systemic infl ammation, tumor regression, septic shock and cachexia. TNF-α mediates a wide range of infl ammatory and immunological responses including the elaboration of other proinfl ammatory cytokines and chemokines, that promote local reaction and activation of leucocytes. These are important factors in allograft rejection. TNF acts through two different TNF receptors: TNFR1 and TNFR2. Recent studies have suggested that TNFR1 and TNFR2 may predict acute rejection (AR) after renal transplantation. This prospective observational study aimed to assess the relevance of serial postoperative serum TNF-α, TNFR1 and TNFR2 measurements for predicting graft function and AR after transplantation.Methods: We studied 50 kidney transplant recipients (31 female, 19 male; mean age: 38.36 ± 12.88). Blood samples were collected immediately before and after surgery at day 7, month 1 and month 3. Serum TNF-α, TNFR1 and TNFR2 levels were measured by ELISA using a commercial kit (Invitrogen ELISA). Serum creatinine levels were
analysed by modifi ed Jaffe method in Cobas 8000 analyser. GFR was estimated by Modifi ed Diet in Renal Disease (MDRD) equation. Patients were assigned to 2 groups depending on their history and clinically diagnosed acute rejection [AR(+)] and without acute rejection [AR(-)]. Data wereexpressed as mean ± Standard errors. We compared cytokine levels between the groups using both Mann-Whitney U and Student’s t tests.Results: Among 50 recipients, 6 had AR(+) and 44 had AR(-). Serum TNF-α, TNFR1 and TNFR2 levels demonstrated consistent signifi cantly decreases after transplantation while GFR values hadconsistent increases (p=0.001). Pretransplant levels were not statistically different between AR(+) and AR(-) groups (TNF-α: 30.79±5.96 vs 27.95±2.43 pg/mL, TNFR1: 55.96±21.6 vs 40.52±7.41 ng/mL, TNFR2: 58.31±8.06 vs 50.9±3.34 ng/mL, respectively (p>0.05). Serum TNF-α, TNFR1 and TNFR2 levels on day 7 and month 1 were also signifi cantly higher AR (+) group compared to AR (-) (p=0.012, p=0.049 for TNF-α, p=0.001, p=0.002 for TNFR1, p=0.001, p=0.002 for TNFR2).Conclusion: Furthermore, our preliminary fi ndings suggest that serum TNF-α, TNFR I and TNFR 2 levels might be considered useful markers of predicting graft function after renal transplantation. The sequential monitoring of these parameters may identify the patients at the risk in the early period post-transplant. Prospective studies are needed to clarify the usefulness of these parameters for identifying risks of AR.
A-394
Risk stratifi cation with Adrenomedullin in emergency patients with acute dyspnea
J. Searle, A. C. Slagman, C. Müller, D. Meyer zum Büschenfelde, J. von Recum, J. O. Vollert, M. Stockburger, M. Möckel. Charité - Universitätsmedizin Berlin, Berlin, Germany
Background: Acute dyspnea can be caused by severe cardiac and non-cardiac diagnoses and is associated with high in-hospital mortality. Adrenomedullin is a peptide hormone with hypotensive, natriuretic and positive inotropic effects, and is released upon increased cardiac pressure- and volume load. The objective of this analysis is to evaluate MR-proADM as a marker for short-term risk-stratifi cation in patients with acute dyspnea.Methods: Consecutive, adult patients with dyspnea (n=305) were enrolled in the ED, patients with anemia were excluded. Blood samples were drawn at admission. Outcome was assessed after 3 months. MR-proADM was measured from frozen samples at the end of recruitment.Results: Patients had a median age of 67 (58-74) years, 63.4% were male. AHF was the most frequent underlying diagnosis (15.7%), 13.8% were diagnosed with COPD or Asthma, 7.5% with pneumonia. Median ADM was 0.9 (0.63-1.43) nmol/L. Patients with acute and chronic heart failure had the highest ADM values (1.54 (1.03-2.47) and (1.52 (1.28-2.20) nmol/L, respectively).After 3 months, 6.6% (n=20) of the patients had died. Non-survivors had signifi cantly higher ADM values (1.52 / 0.84-2.6 nmol/L) than survivors (p<0.0001; fi gure 1).When dividing patients into risk-associated subgroups, using published cut-off values (0.75 and 1.5 nmol/L), 3.4% of low-risk, 5.1% of medium risk and 14.7% of the high-risk patients died. ROC-analysis shows an AUC of 0.691 (95%-CI: 0.561-0.820; p=0.004) for the prediction of death. ADM showed a better performance than BNP (0.650 / 95%-CI: 0.523-0.777; p=0.026).Conclusion: MRpro ADM levels were associated with mortality and rehospitalization in unselected dyspnea patients and were superior compared to BNP for risk stratifi cation. Therapeutical consequences of elevated proADM levels are yet to be defi ned.

Tuesday, July 30, 9:30 am – 5:00 pm Clinical Studies/Outcomes
A120 CLINICAL CHEMISTRY, Vol. 59, No. 10, Supplement, 2013
A-395
Levels of apelin-13 and total oxidant / antioxidant status in sera of Alzheimer patients
Z. DENİZ YILDIZ, N. -. EREN, F. GOKYIGIT, F. TURGAY, L. GUNDOGDU CELEBİ. şişli etfal trainig and research hospital, İstanbul, Turkey
Objective: In this study, serum levels of Apelin-13, a cytokine derived from adipocytes and a potential diagnostic biomarker for AD, and its relationship with TAS and TOS due to its anti-ROS properties were investigated.Materials anD Methods: The study included 31 patients diagnosed with AD (13 male/18 female) and 30 individuals (9 male/21 female) as a control group of healthy subjects without dementia. The control group included healthy volunteers who had similar demographic characteristics with patients. The mean age of patients and control group were 72.73 ± 6.17, 75.54 ± 5.27 years, respectively. Apelin-13 measurement process has been completed in SEAC RADIM Company ALISEI analyser by using Bachem Human Apelin 13 (Cat No. S-1416) ELISA Kit. TAS and TOS measurements have been completed by using full-automated colorimetric method developed by Erel (Rel Assay Diagnostics, Turkey).Results: In our study, a statistically signifi cant difference was not found between the patients and the control group for the TOS levels (p> 0.05). TAS measurements of the patient group were signifi cantly lower than that of the control group (p <0.01). Apelin-13 measurements of the patient group were signifi cantly lower than that of the control group (p <0.01). We observed no relationship between anti-ROS Apelin-13 and TOS in both groups. However, we observed moderate relationship between Apelin-13 and TAS, but the relationship between TAS and Apelin-13 was not statistically signifi cant.Conclusion: We could not fi nd any connection among serum TOS, TAS and apelin levels. Both TAS and Apelin-13 levels have been found signifi cantly lower in the patient group when compared to the control group. Apelin-13 might help the diagnosis of AD. By thinking of Apelin-13’s neuroprotective effect in mouse brain, doing next level studies about Apelin-13’s therapeutical use in the earlier stages of AD might be useful.
A-397
Evaluation of a fully automated chemiluminescence immunoassay analyzer for IgG and IgM isotypes of anti Cardiolipin and Beta-2 Glycoprotein antibodies.
L. V. Rao, R. Ambacher, J. Schwartz, M. R. Al-Turkmani. Department of Pathology, UMass Memorial Medical Center, Worcester, MA
Introduction: Laboratory tests for the diagnosis of antiphospholipid syndrome (APS) comprise elevated titers of either anti cardiolipin (aCL), anti beta-2 glycoprotein (β2GPI) antibodies (IGG/IGM) by ELISA or Lupus anticoagulant test. All lab tests considered for classifi cation of APS have limitations related to robustness,
reproducibility, standardization and clinical relevance. This study describes validation and analytical performance of the new automated BIO-FLASH analyzer using QUANTA Flash Chemiluminescent immunoassay (CIA).Methods: IgG and IgM isotypes of aCL and β2GPI are evaluated for concordance, sensitivity and specifi city in 50 test samples between QUANTA Flash CIA using BIO-FLASH analyzer and QUANTA Lite ELISA using QUANTA-Lyser analyzer (Inova Dx, San Diego, CA). In addition hundreds of test samples from various clinics were analyzed before and after implementation of CIA method for clinical use.Results: QUANTA Flash CIA for both aCL IgG and IgM demonstrated good specifi city and acceptable sensitivity compared with QUANTA Lite ELISA. On the other hand QUANTA Flash CIA for β2GPI IgG and IgM showed very good sensitivity and acceptable specifi city compared with QUANTA Lite ELISA. The intra and inter assay precision of both low and high control samples had less than 10% CV for all assays.
Test Analytical Sensitivity%
Analytical Specifi city %
Agreement %
Analytical Range (CU)
Cut off (20 CU) Precision%
aCL IGG 70.0 97.1 89.0 2.6 - 2024 3.7aCL IGM 67.0 95.0 91.3 1.0 - 774 1.1b2GPI-IGG 100 89.5 93.1 1.1 - 841 1.8b2GPI-IGM 100 80.0 90.0 6.4 - 6100 8.0
Conclusion: QUANTA Flash CIA using BIO-FLASH analyzer for testing IgG and IgM isotypes of aCL and β2GPI reported here are very simple and agrees well qualitatively with existing QUANTA Lite ELISA method. Cut-off point differentiation (20 CU for BIO-FASH analyzer or GPL, MPL (aCL IgG, IgM) or SGU, SMU (β2GPI IgG, IgM) ELISA units for QUANTA-Lyser) between Positive and Negative samples remain unchanged between both methods. Semi-Quant reportable numbers with respect to cut-off level agreed well within the negative samples, but not well with positive samples. Overall, the automation and simplifi cation of the assay makes it ideal for non specialized staff and high throughput.
A-398
Evaluation of a fully automated chemiluminescence immunoassay analyzer for IgA and IgG isotypes of anti tissue transglutaminase (tTG) and deamidated gliadin (DGP) antibodies.
L. V. Rao, R. Ambacher, J. Schwartz, M. R. Al-Turkmani. Department of Pathology, UMass Memorial Medical Center, Worcester, MA
Introduction: Celiac disease (CD) is an autoimmune multisystem disorder in genetically susceptible persons caused by a mucosal injury by a complex of gliadin with tTG. Although there are no universally accepted tests for the diagnosis of CD, specifi c serologic testing is very sensitive/specifi c for making the diagnosis. Anti-tTG antibodies are highly sensitive and specifi c for the diagnosis of CD. DGP assays seem to be equivalent and may have additive benefi ts, as combination of both tests can increase sensitivity. The DGP test may be benefi cial when the tTG results are indeterminate. This study describes validation and analytical performance of the new automated BIO-FLASH analyzer using QUANTA Flash Chemiluminescent immunoassay (CIA).Methods: IgA and IgG isotypes of tTG and DGP are evaluated for concordance, sensitivity and specifi city in 40 test samples between QUANTA Flash CIA using BIO-FLASH analyzer and QUANTA Lite ELISA using QUANTA-Lyser analyzer (Inova Dx, San Diego, CA). In addition hundreds of test samples from various clinics were analyzed before and after implementation of CIA method for clinical use.Results: QUANTA Flash CIA for both tTG IgA, IgG and DGP IgA, IgG demonstrated good specifi city and acceptable sensitivity compared with QUANTA Lite ELISA. The intra/ inter assay precision of both low/ high control samples had < 6% CV for all assays.
Test Sensitivity % Specifi city % Agreement %
Analytical Range (CU)
Cut off (20 CU) Precision %
h-tTG- IGA 69.3 100 89.5 1.9 - 4965 2.2h-tTG- IGG 92.3 100 97.8 3.7 - 2560 2.3DGP-IGA 67 100 92 5.2 -2596 2.9DGP-IGG 78 100 94 1.9 -2565 1.5
Conclusion: QUANTA Flash CIA using BIO-FLASH analyzer for IgA/ IgG isotypes of tTG and DGP antibodies reported here is very simple and agrees well qualitatively

Clinical Studies/Outcomes Tuesday, July 30, 9:30 am – 5:00 pm
CLINICAL CHEMISTRY, Vol. 59, No. 10, Supplement, 2013 A121
with existing ELISA method. Cut-off point differentiation (20 CU for BIO-FASH analyzer or ELISA Units for QUANTA-Lyser) between Positive/ Negative samples remain unchanged between both methods. Semi-Quant reportable numbers with respect to cut-off agreed well within the negative samples, but not well with positive samples. Overall, the automation and simplifi cation of the assay makes it ideal for non specialized staff and high throughput.
A-399
Clinical and Analytical Evaluation of the ARCHITECT HAVAB-G Assay
D. T. Shaar1, P. Moreno1, S. Du1, J. Huang1, J. Yen1, D. Brotherton1, S. Worobec1, P. Schwebel1, W. Castellani2, M. Petruso3, M. E. Boyle4. 1Abbott Diagnostics, Abbott Park, IL, 2MS Hershey Medical Center, Hershey, PA, 3Nationwide Laboratory Services, Fort Lauderdale, FL, 4University of Colorado Hospital, Aurora, CO
Objective: To evaluate the performance of the ARCHITECT® HAVAB-G assay in a diagnostic population.Method: ARCHITECT HAVAB-G is a chemiluminescent microparticle immunoassay for the qualitative detection of IgG antibody to hepatitis A virus (IgG anti-HAV). A 5-day system reproducibility study was performed based on guidance from the Clinical and Laboratory Standards Institute (CLSI) document EP15-A2. For method comparison, ARCHITECT HAVAB-G results were compared to the fi nal HAV IgG status, which was determined with AxSYM HAVAB 2.0 (total HAV assay) and ARCHITECT HAVAB-M (HAV IgM assay). Percent agreement of positive results (positive percent agreement or PPA) and percent agreement of negative results (negative percent agreement or NPA) were calculated for the following populations: a) individuals at increased risk of HAV infection and individuals with signs and symptoms of hepatitis infection, b) apparently healthy individuals, c) Hepatitis A vaccine recipients, and d) surplus pediatric specimens.Results: The ARCHITECT HAVAB-G assay demonstrated a %CV range of 4.3-4.9 for within-laboratory imprecision at clinically relevant analyte levels. In the method comparison study, the positive percent agreement (PPA) was as follows: individuals at increased risk of HAV infection and individuals with signs and symptoms of hepatitis infection 95.30% (385/404), apparently healthy individuals 98.69% (151/153), Hepatitis A vaccine recipients 100.00% (68/68), and surplus pediatric specimens 97.62% (82/84). The negative percent agreement (NPA) was as follows: individuals at increased risk of HAV infection and individuals with signs and symptoms of hepatitis infection 97.84% (363/371) apparently healthy individuals 99.18% (364/367), Hepatitis A vaccine recipients 100.00% (2/2), and surplus pediatric specimens 97.81% (223/228).Conclusion: The ARCHITECT HAVAB-G assay provides detection of IgG antibody to Hepatitis A virus. The presence of IgG anti-HAV implies a past HAV infection (recent or distant) or vaccination against HAV. Detectable levels above the assay cut-off imply immunity to HAV infection.
A-400
Multimarker Logistic Regression Models Predict Sepsis Prior to Onset of Overt Clinical Symptoms
J. M. Colón-Franco, D. A. Anderson, S. Litt, S. Srinivasa Gowda, T. W. Rice, A. P. Wheeler, W. D. Dupont, A. Woodworth. Vanderbilt University Medical Center, Nashville, TN
Background: Sepsis is a life-threatening condition characterized by systemic infl ammatory response syndrome (SIRS) along with a documented infection. Rapid diagnosis and early initiation of therapy signifi cantly reduces mortality, but diagnosis during early stages of disease is diffi cult because many clinical conditions present with SIRS. No single biochemical or clinical marker can accurately identify early sepsis among patients with SIRS.Objective: To develop prediction models able to identify sepsis up to two days before overt clinical presentation of SIRS in Medical Intensive Care Unit (MICU) patients and to compare their diagnostic utilities to the only FDA approved sepsis biomarker, procalcitonin (PCT) Methods: This retrospective cohort study enrolled 201 MICU patients with SIRS who were identifi ed by an electronic system that scans electronic medical records (EMRs) and alerts when patients meet ≥2 SIRS criteria (temperature >38°C or <36°C, heart
rate >90 beats/min, respiratory rate >20 breaths/min and white cell count >12x109 or <4x10⁴). Residual plasma specimens sent to the VUMC core laboratory for metabolic panels one and/or two days before SIRS criteria were met (Days -1 and -2) were utilized. The biomarkers TNFα, IL-6, IL-10, CRP and LBP were quantifi ed on the Immulite 1000 (Siemens Healthcare Diagnostics) and Procalcitonin (PCT) was quantifi ed using the B·R·A·H·M·S® PCT assay in the VIDAS® analyzer (Biomeriéux, Durham, NC). Patient demographics, clinical and laboratory values were obtained through review of EMRs. Two MICU physicians, blinded to the biomarkers results, adjudicated non-infectious SIRS or sepsis as follows: SIRS, n=109 and sepsis, n=92 (among these, 42 had septic shock). Three logistic regression models containing different combinations of biomarkers, demographics, and laboratory values collected one or two days prior to onset of SIRS were generated for prediction of sepsis or septic shock; Model 1: baseline demographics, routine laboratory and clinical values, Model 2: highest concentration of biomarkers (days -1 and -2), and Model 3: combination of models 1 and 2. Areas under receiver operator characteristic (ROC) curves (AUCs) were used to evaluate the diagnostic strength of the models and of the highest concentration of PCT on days -1 and -2.Results: The AUCs for PCT for the prediction of sepsis and septic shock before SIRS were 0.67 (p<0.0001) and 0.70 (p=0.0001), respectively. The AUCs for Models 1, 2 and 3 to predict sepsis before SIRS were 0.74 (p=0.0001), 0.77 (p<0.0001), and 0.81 (p<0.0001), respectively. The AUCs for Models 1, 2, and 3 to predict septic shock before SIRS were 0.76 (p=0.001), 0.82 (p<0.0001), and 0.87 (p<0.0001), respectively. Combining Models 1 and 2 signifi cantly improved the individual diagnostic utilities of the models to predict early sepsis and shock (p=0.02 and p=0.001).Conclusions: Logistic regression models combining plasma infl ammatory biomarkers, demographics, and laboratory values collected before patients develop overt clinical symptoms accurately predict sepsis in MICU patients. These models demonstrated superior diagnostic utility compared to baseline demographics and laboratory values as well as PCT for early prediction of sepsis and septic shock.
A-402
Assessing the impact of cardiac troponin analytical sensitivity for clinical decision-making in the emergency department
P. Kavsak, A. Worster. Hamilton Health Sciences, Hamilton, ON, Canada
BACKGROUND: Current guidelines recommend cardiac troponin (cTn) to be measured for the diagnosis of myocardial infarction; however, its measurement may also be useful for discharging emergency department (ED) patients home. To assess this, we compared via ROC analysis 3 different cTn assays with varying degrees of analytical sensitivity with respect to early decision-making in the ED.METHODS: Two adult hospitals with ED departments switched from Roche’s 4th-generation cTnT assay to the Abbott ARCHITECT STAT TnI assay. At the same time, all ED orders for cTnI also had the Abbott hsTnI assay measured (blinded to physicians) on the same sample. All cTn results on ED orders 2-months before and after the switch were obtained as well as the fi nal ED depart disposition (i.e., discharge home or admission/death). The highest cTn result in the ED per patient was used in ROC analyses to obtain the area under the curve (AUC) for hospital admission/death. This study received research ethics approval.RESULTS: In the 2-months prior to the switch of cTn assays there were 5613 cTnT results on 3099 patients (average age=68y; 51% female), with 54%(95%CI:52-56) of these patients having a hospital admission/death from the ED visit. The AUC of the cTnT assay in this setting was 0.65(95%CI:0.64-0.67) with 24%(95%CI:22-25) of results ≥0.01 ug/L. The 2-months post switch to the cTnI assay there were 5583 cTnI results on 3226 patients (average age=68y; 49% female), with 55%(95%CI:53-57) of these patients having a hospital admission/death from the ED visit. The AUC of the hsTnI assay was signifi cantly higher than the cTnI assay in this setting (hsTnI AUC=0.79 (95%CI:0.78-0.81) vs. cTnI AUC=0.73 (95%CI: 0.71-0.74);p<0.0001) (Figure) with 93%(95%CI:92-94) of hsTnI concentrations >1.2 ng/L as compared to 43%(95%CI:41-44) of cTnI concentrations ≥0.01 ug/L.CONCLUSIONS: Increasing the analytical sensitivity of cTn might facilitate ED physicians’ decision-making to admit or discharge.

Tuesday, July 30, 9:30 am – 5:00 pm Clinical Studies/Outcomes
A122 CLINICAL CHEMISTRY, Vol. 59, No. 10, Supplement, 2013
A-403
The clinical Laboratory can demonstrate value by leveraging technology to reduce Hospital Acquired Infections (HAIs)
D. L. Uettwiller-Geiger. John T. Mather Memorial Hospital, Port Jefferson, NY
Background: Hospital acquired infections (HAIs) are a major cause of morbidity, mortality, increased length of stay and excessive healthcare costs. The federal Centers for Disease Control and Prevention (CDC) estimates that, each year there are 1.7 million HAIs, causing about 100,000 deaths annually. Objectives: To implement a rapid testing program to cost effectively detect Methicillin Resistant Staphylococcus Aureus (MRSA) and Clostridium diffi cile (C. diffi cile) in colonized and/or infected patients using new technologies. The availability of rapid testing on demand and in real time provides clinicians with key test results within one hour instead of days. An effective infection control program along with strong laboratory support will reduce the number of HAIs and the associated morbidity and mortality.Methods: A program for MRSA was implemented in March 2008 using rapid polymerase chain reaction (PCR) on the Cepheid GeneXpert® System. The system uses a single test cartridge delivering test results in less than an hour. In May 2010, the C. diffi cile program was implemented using the C. DIFF Quik Chek Complete™ from Alere, manufactured by TechLab Inc. The technology uses antibodies to identify and confi rm the presence of toxigenic C. diffi cile by detecting toxins A and B in a single assay device and glutamate dehydrogenase (GDH) antigen, delivering test results in < 45 minutes.Results: Our testing strategy for MRSA focused on high risk populations of intensive care units, cardiac care unit, and Orthopedics. In 2007, before rapid PCR MRSA screening, the infection rate was .90/1000 discharges and fi ve years after implementation of the rapid PCR MRSA screening program the infection rate in 2012 was .23/1000. Comparing MRSA infection rates from 2007 to 2012 there was a 76% reduction with a corresponding 76% reduction in associated infection costs. The fi ve year PCR screening cost was $448,400. Based on the average cost of medical care for a MRSA infection of $35,000 dollars per infected patient, we decreased the cost of infection by $1,511,600 during the fi ve year period and the length of stay for the critical care units decreased by 21%. In 2009, the C. diffi cile infection rate was .95/1000 and three years after implementation of the simultaneous testing the infection rate in 2012 was .34/1000. Comparing C. diffi cile infection rates from 2009 to 2012 there was a 63% reduction with a corresponding 63% reduction in associated infection costs. The three year C. diffi cile testing cost was $86,460. Based on the average cost of medical care for a C. diffi cile infection of $35,000 dollars per infected patient, we decreased the cost of infection by $1,453,540 during this three year period. Total cost avoidance/savings due to the decrease in MRSA and C. diffi cile infections was $2,965,140.Conclusions: Our Laboratory’s rapid testing programs for MRSA and C.diffi cile using new technologies demonstrate the Laboratory’s value by supporting our infection control measures and strategies that permit rapid identifi cation and interventions that assure patient safety, improve bed management, decrease length of stay, and saves millions of dollars, while enhancing patient outcomes and signifi cantly reducing hospital acquired infections.
A-404
Enhanced Liver Fibrosis (ELF) Panel as a Predictor of Liver Fibrosis in Chronic Hepatitis C Patients
F. Fernandes1, A. Dellavance2, L. E. Andrade2, F. Campos1, G. H. Pereira3, C. Terra1, J. Pereira3, F. Figueiredo1, R. Perez1, M. L. Ferraz2. 1Hospital Universitário Pedro Enesto - UERJ, Rio de Janeiro, Brazil, 2Fleury Laboratory, São Paulo, Brazil, 3Hospital Federal de Bonsucesso, Rio de Janeiro, Brazil
Relevance: Fibrosis is the most important issue in the assessment of chronic hepatitis C (CHC), with treatment and prognostic relevance. Liver biopsy remains the gold standard for staging fi brosis, despite its many drawbacks. In recent years much has been researched in the fi eld of non-invasive serological markers of liver fi brosis. Among these one of the most promising is ELF panel which comprises hyaluronic acid (HA), tissue inhibitor of matrix metalloproteinases-1 (TIMP-1) and aminoterminal propeptide of procollagen type III (PIIINP). To date, there is scarce data on ELF performance as a non-invasive marker of fi brosis in patients with CHC.Objective: To evaluate the performance of ELF as a non-invasive marker of fi brosis in CHC patients.Material and Methods: A hundred and twenty patients with CHC that were consecutively submitted to liver biopsy were included. Exclusion criteria: human immunodefi ciency virus and hepatitis B co-infection, daily alcohol intake of more than 40g, cholestasis, chronic kidney failure, right-sided heart failure, fi brogenic drugs use, less than six portal tracts or concomitant pathology in the liver biopsy. The blood sample was collected within an interval of at most 3 months from the biopsy. The serum was frozen at - 70° C in an interval no longer than 3 hours. PIIINP, HA, and TIMP-1 were measured in all patients by a CE-marked, random-access, automated clinical immunoassay system that uses magnetic particle separation technology with direct chemiluminescence (ADVIA Centaur®, Siemens Healthcare Diagnostics, Tarrytown, NY, USA). The ELF score was calculated using the algorithm: ELF = 2.278 + 0.851 ln(HA) + 0.751 ln(PIIINP) + 0.394 ln(TIMP-1). Cut-off points proposed by the manufacturer were applied: < 7.7 absent or mild fi brosis, ≥ 7.7 and < 9.8 moderate fi brosis and ≥ 9.8 severe fi brosis. Biopsies were reviewed by one experienced pathologist. The study was approved by the local Ethics Committee. Statistical analyses were performed using SPSS 17.0 (SPSS Inc., Chicago IL).Results: Thirty-four percent of the patients were men, mean age 53 (SD ± 11.3) years old. The distribution of fi brosis stages according to METAVIR was: stage 0 - 2%; stage 1 - 52%; stage 2 - 30%; stage 3 - 9% and stage 4 - 7% . According to ELF cut-off points we had: three (2%) patients with absent or mild fi brosis (F0-1), seventy-four (61%) with moderate fi brosis (F2-3) and forty-four (37%) with cirrhosis (F4). When compared to histological analysis ELF overestimated fi brosis in 76% of cases and underestimated in one case. The Spearman correlation coeffi cient of ELF with the histological staging was 0.57 (p <0.001). The ELF accuracy (AUROC) for the diagnosis of signifi cant fi brosis (F≥2) was 0.81 (95% IC: 0.73-0.87), for the diagnosis of advanced fi brosis (F≥3) was 0.82 (95% IC: 0.74-0.88) and for the diagnosis of cirrhosis was 0.78 (95% IC: 0.70-0.85).Conclusion: ELF panel had a good performance as a non-invasive marker. However, new cut-off points need to be established to improve the discrimination of different stages of fi brosis in CHC patients.
A-407
Full validation and implementation of NOVA View® at DASA Lab in Brazil
N. Gaburo1, F. Flumian2, A. Cintra3, C. Buchner4, O. Denardin1, G. Lakos4. 1DASA, Sao Paulo, Brazil, 2DASA, Sao Paulo Brasil, Brazil, 3Werfen Medical Ltda., Sao Paulo, Brazil, 4INOVA, San Diego, CA
Background: NOVA View® is an automated fl uorescence microscope that is designed to streamline the workfl ow of autoimmune laboratories using the indirect immunofl uorescent (IIF). NOVA View acquires high resolution digital images of the substrate, stores and displays them allowing their management. Image analysis capabilities include the detection and quantifi cation of fl uorescent light intensity of certain cellular structures, and proposal of antinuclear antibody (ANA) pattern based on software algorithm. The digital images enable the Operator to make clinically relevant decisions equivalent to those using a conventional microscope. The software makes no independent fi nal interpretations of the data; all results have to be reviewed (revised if appropriate) and confi rmed by the Operator.
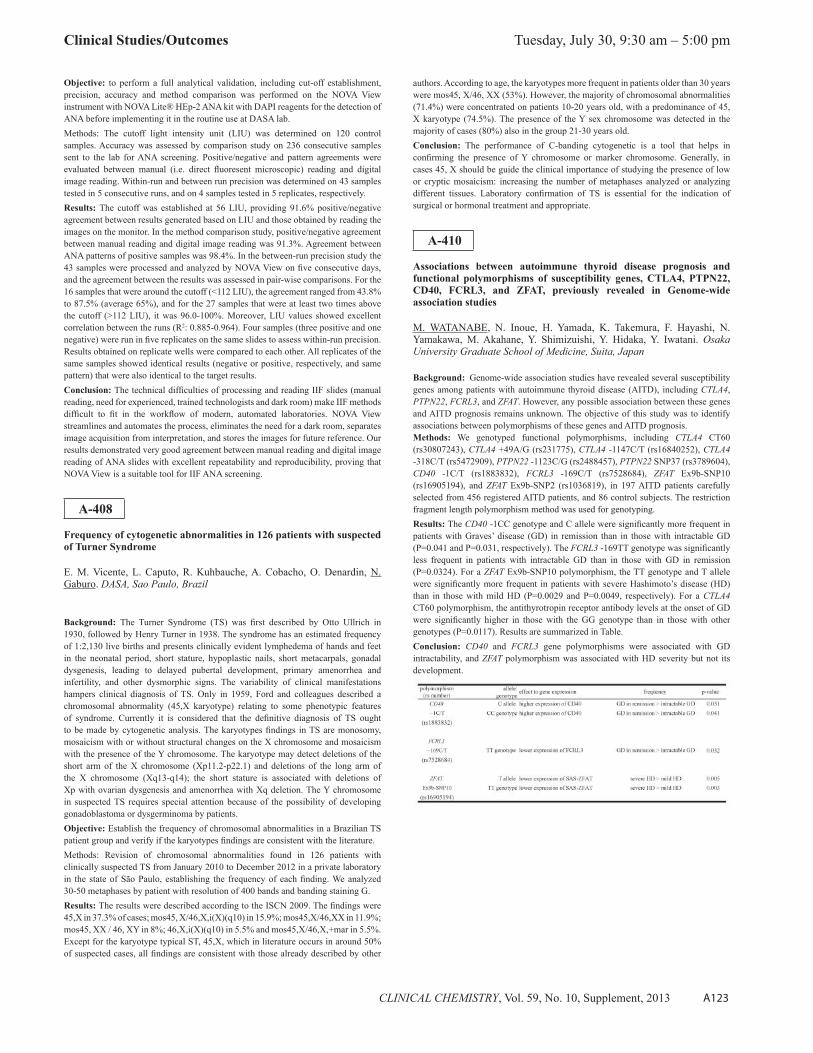
Clinical Studies/Outcomes Tuesday, July 30, 9:30 am – 5:00 pm
CLINICAL CHEMISTRY, Vol. 59, No. 10, Supplement, 2013 A123
Objective: to perform a full analytical validation, including cut-off establishment, precision, accuracy and method comparison was performed on the NOVA View instrument with NOVA Lite® HEp-2 ANA kit with DAPI reagents for the detection of ANA before implementing it in the routine use at DASA lab.Methods: The cutoff light intensity unit (LIU) was determined on 120 control samples. Accuracy was assessed by comparison study on 236 consecutive samples sent to the lab for ANA screening. Positive/negative and pattern agreements were evaluated between manual (i.e. direct fl uoresent microscopic) reading and digital image reading. Within-run and between run precision was determined on 43 samples tested in 5 consecutive runs, and on 4 samples tested in 5 replicates, respectively.Results: The cutoff was established at 56 LIU, providing 91.6% positive/negative agreement between results generated based on LIU and those obtained by reading the images on the monitor. In the method comparison study, positive/negative agreement between manual reading and digital image reading was 91.3%. Agreement between ANA patterns of positive samples was 98.4%. In the between-run precision study the 43 samples were processed and analyzed by NOVA View on fi ve consecutive days, and the agreement between the results was assessed in pair-wise comparisons. For the 16 samples that were around the cutoff (<112 LIU), the agreement ranged from 43.8% to 87.5% (average 65%), and for the 27 samples that were at least two times above the cutoff (>112 LIU), it was 96.0-100%. Moreover, LIU values showed excellent correlation between the runs (R2: 0.885-0.964). Four samples (three positive and one negative) were run in fi ve replicates on the same slides to assess within-run precision. Results obtained on replicate wells were compared to each other. All replicates of the same samples showed identical results (negative or positive, respectively, and same pattern) that were also identical to the target results.Conclusion: The technical diffi culties of processing and reading IIF slides (manual reading, need for experienced, trained technologists and dark room) make IIF methods diffi cult to fi t in the workfl ow of modern, automated laboratories. NOVA View streamlines and automates the process, eliminates the need for a dark room, separates image acquisition from interpretation, and stores the images for future reference. Our results demonstrated very good agreement between manual reading and digital image reading of ANA slides with excellent repeatability and reproducibility, proving that NOVA View is a suitable tool for IIF ANA screening.
A-408
Frequency of cytogenetic abnormalities in 126 patients with suspected of Turner Syndrome
E. M. Vicente, L. Caputo, R. Kuhbauche, A. Cobacho, O. Denardin, N. Gaburo. DASA, Sao Paulo, Brazil
Background: The Turner Syndrome (TS) was fi rst described by Otto Ullrich in 1930, followed by Henry Turner in 1938. The syndrome has an estimated frequency of 1:2,130 live births and presents clinically evident lymphedema of hands and feet in the neonatal period, short stature, hypoplastic nails, short metacarpals, gonadal dysgenesis, leading to delayed pubertal development, primary amenorrhea and infertility, and other dysmorphic signs. The variability of clinical manifestations hampers clinical diagnosis of TS. Only in 1959, Ford and colleagues described a chromosomal abnormality (45,X karyotype) relating to some phenotypic features of syndrome. Currently it is considered that the defi nitive diagnosis of TS ought to be made by cytogenetic analysis. The karyotypes fi ndings in TS are monosomy, mosaicism with or without structural changes on the X chromosome and mosaicism with the presence of the Y chromosome. The karyotype may detect deletions of the short arm of the X chromosome (Xp11.2-p22.1) and deletions of the long arm of the X chromosome (Xq13-q14); the short stature is associated with deletions of Xp with ovarian dysgenesis and amenorrhea with Xq deletion. The Y chromosome in suspected TS requires special attention because of the possibility of developing gonadoblastoma or dysgerminoma by patients.Objective: Establish the frequency of chromosomal abnormalities in a Brazilian TS patient group and verify if the karyotypes fi ndings are consistent with the literature.Methods: Revision of chromosomal abnormalities found in 126 patients with clinically suspected TS from January 2010 to December 2012 in a private laboratory in the state of São Paulo, establishing the frequency of each fi nding. We analyzed 30-50 metaphases by patient with resolution of 400 bands and banding staining G.Results: The results were described according to the ISCN 2009. The fi ndings were 45,X in 37.3% of cases; mos45, X/46,X,i(X)(q10) in 15.9%; mos45,X/46,XX in 11.9%; mos45, XX / 46, XY in 8%; 46,X,i(X)(q10) in 5.5% and mos45,X/46,X,+mar in 5.5%. Except for the karyotype typical ST, 45,X, which in literature occurs in around 50% of suspected cases, all fi ndings are consistent with those already described by other
authors. According to age, the karyotypes more frequent in patients older than 30 years were mos45, X/46, XX (53%). However, the majority of chromosomal abnormalities (71.4%) were concentrated on patients 10-20 years old, with a predominance of 45, X karyotype (74.5%). The presence of the Y sex chromosome was detected in the majority of cases (80%) also in the group 21-30 years old.Conclusion: The performance of C-banding cytogenetic is a tool that helps in confi rming the presence of Y chromosome or marker chromosome. Generally, in cases 45, X should be guide the clinical importance of studying the presence of low or cryptic mosaicism: increasing the number of metaphases analyzed or analyzing different tissues. Laboratory confi rmation of TS is essential for the indication of surgical or hormonal treatment and appropriate.
A-410
Associations between autoimmune thyroid disease prognosis and functional polymorphisms of susceptibility genes, CTLA4, PTPN22, CD40, FCRL3, and ZFAT, previously revealed in Genome-wide association studies
M. WATANABE, N. Inoue, H. Yamada, K. Takemura, F. Hayashi, N. Yamakawa, M. Akahane, Y. Shimizuishi, Y. Hidaka, Y. Iwatani. Osaka University Graduate School of Medicine, Suita, Japan
Background: Genome-wide association studies have revealed several susceptibility genes among patients with autoimmune thyroid disease (AITD), including CTLA4, PTPN22, FCRL3, and ZFAT. However, any possible association between these genes and AITD prognosis remains unknown. The objective of this study was to identify associations between polymorphisms of these genes and AITD prognosis.Methods: We genotyped functional polymorphisms, including CTLA4 CT60 (rs30807243), CTLA4 +49A/G (rs231775), CTLA4 -1147C/T (rs16840252), CTLA4 -318C/T (rs5472909), PTPN22 -1123C/G (rs2488457), PTPN22 SNP37 (rs3789604), CD40 -1C/T (rs1883832), FCRL3 -169C/T (rs7528684), ZFAT Ex9b-SNP10 (rs16905194), and ZFAT Ex9b-SNP2 (rs1036819), in 197 AITD patients carefully selected from 456 registered AITD patients, and 86 control subjects. The restriction fragment length polymorphism method was used for genotyping.Results: The CD40 -1CC genotype and C allele were signifi cantly more frequent in patients with Graves’ disease (GD) in remission than in those with intractable GD (P=0.041 and P=0.031, respectively). The FCRL3 -169TT genotype was signifi cantly less frequent in patients with intractable GD than in those with GD in remission (P=0.0324). For a ZFAT Ex9b-SNP10 polymorphism, the TT genotype and T allele were signifi cantly more frequent in patients with severe Hashimoto’s disease (HD) than in those with mild HD (P=0.0029 and P=0.0049, respectively). For a CTLA4 CT60 polymorphism, the antithyrotropin receptor antibody levels at the onset of GD were signifi cantly higher in those with the GG genotype than in those with other genotypes (P=0.0117). Results are summarized in Table.Conclusion: CD40 and FCRL3 gene polymorphisms were associated with GD intractability, and ZFAT polymorphism was associated with HD severity but not its development.

Tuesday, July 30, 9:30 am – 5:00 pm Clinical Studies/Outcomes
A124 CLINICAL CHEMISTRY, Vol. 59, No. 10, Supplement, 2013
A-411
Diabetes Risk Stratifi cation by a Multivariate Index Comprising Only Parameters Derived from a Single NMR Spectrum of Plasma
J. Otvos, I. Shalaurova, K. Mercier, T. O’Connell. LipoScience, Raleigh, NC
Background: Risk of progression to Type 2 diabetes is assessed primarily by fasting glucose measurements, with concentrations 100-125 mg/dL identifying those with “pre-diabetes”. However, many high-risk individuals have glucose levels <100 mg/dL and many others in the pre-diabetic category have relatively low risk. To better identify the highest-risk patients who would benefi t the most from lifestyle or pharmacologic intervention, we developed a Diabetes Risk index (DRI) that uses only information derived from a single nuclear magnetic resonance (NMR) spectrum of a fasting plasma sample. This information includes glucose, lipoprotein subclass/size parameters previously linked to insulin resistance (VLDL size, large+medium VLDL particle number, total HDL and medium HDL subclass particle number), the branched-chain amino acid valine, and GlycA, a novel NMR marker of systemic infl ammation that senses global protein glycoslyation levels.Methods: We used NMR spectra collected at baseline from the Multi-Ethnic Study of Atherosclerosis (MESA) to develop the DRI score. The dataset consisted of 4985 non-diabetic participants, 411 of whom developed diabetes during 6 years of follow-up.Results: The Figure shows that diabetes conversion rates were low (2.2%) and high (60.8%) in individuals with fasting glucose <90 and >110 mg/dL, respectively, and intermediate (10.3%) for glucose between 90-110 mg/dL. Diabetes risk in the latter group was extremely heterogeneous as stratifi ed by the DRI score, ranging from 22.5% to 2.6% in the extreme quintiles of DRI. Thus, among patients with intermediate glucose levels, the DRI score, without any additional clinical information, identifi es individuals with diabetes risk differing almost 10-fold.Conclusion: This simple tool could enable the highest risk patients to be targeted for intervention before the onset of substantial beta-cell dysfunction.
A-415
Evaluation of Relationship between Levels of HBsAg, Anti-HBc and HBV DNA Quantitation in Patients with Hepatitis
Y. M. Tsai, C. H. Shen, H. Chang, Y. M. Chen, L. L. Wen. En Chu Kong Hospital, New Taipei City, Taiwan
Background: Hepatitis B surface antigen (HBsAg) screening is carried out routinely to detect hepatitis B virus (HBV) infection. At present, levels of HBsAg and HBV-DNA in patients are often used to evaluate effect of antiviral drug therapy on hepatitis. Previous researches showed that relationship between concentrations of HBsAg and HBV DNA in patients with hepatitis is unclear. In this study, we evaluated correlation of HBsAg levels and HBV DNA concentrations in serum of patients by quantitation determining.Methods: HBsAg and anti-HBc were measured by Abbott ARCHITECT i2000SR. HBV DNA concentrations were detected by real-time TaqMan PCR assay. Aspartate
aminotransferase (AST) and alanine aminotransferase (ALT) were measured by Siemens Dimension® RxL Max®. Results were analyzed using non-parametric two-tailed Spearman’s test in software package SPSS 17.0.Results: Of 41 patients, 25 were males (61%) and 16 were females (39%) with ages of 46±10 years old (Median±SD). The average HBsAg level was 0.9±0.9 IU/ml and the average HBV DNA concentration was 1.9×10³±8.5×10³ IU/ml. As a whole, these results are not signifi cant comparing to levels of anti-HBc and HBV DNA in patients with weakly positive HBsAg (p>0.05). However, we have found weak but signifi cant correlation between HBsAg and age (p<0.05). Meanwhile, we have also found no correlation between concentrations of ALT and AST in patients with positive HBsAg (p>0.05). Due to HBsAg synthesis and HBV DNA replication from different pathway in hepatocytes that the two markers, HBsAg and HBV-DNA, are not signifi cantly correlated in patients with hepatitis virus infected. Maybe mutations of HBV DNA caused the protein structure changes which used the Abbott ARCHITECT i2000 System can not measure the concentration of HBsAg.Conclusion: In summary, our study indicates that HBsAg levels and HBV DNA concentrations in patients with hepatitis are not signifi cantly correlated.
A-416
Serum Beta 2-Microglobulin and Cystatin C As Early Markers for Renal Dysfunction
M. T. Rodriguez1, G. B. Dayrit1, S. V. Lumanga1, R. W. Lo2. 1Trinity University of Asia, Quezon City, Philippines, 2St. Luke’s Medical Center, Quezon City, Philippines
Background: Nephropathy is one of the major complications of diabetes mellitus and causes premature deaths among diabetic patients. The alarming rise in the mortality rate of diabetics globally due to this complication is the foremost concern of this undertaking. This study aimed to determine the serum levels of beta 2-microglobulin and Cystatin C among diabetics, as early markers of kidney dysfunction. It sought to fi nd if Cystatin C, a low molecular weight plasma protein which is normally being fi ltered by the glomeruli, totally reabsorbed and catabolized in the proximal convoluted tubule of the kidneys, can detect renal insuffi ciency earlier than blood urea nitrogen and serum creatinine. Beta 2-microglobulin (b2m), another protein in which plasma level is also being maintained by the kidneys, was also included in this study. Pearson coeffi cient correlation was used for statistical analysis.Method: One hundred diabetic participants without renal dysfunction were selected by purposive sampling. A control group composed of nondiabetics with the same gender and age bracket as the test group was also included. Fasting blood glucose, blood urea nitrogen (BUN), serum creatinine, b2m and Cystatin C were measured using the reagents from Abbott Diagnostics and its equipment, the Architect c4000.Results: Computed r-values of -0.118 (0.224) for fasting glucose and 0.195 (0.052) for urea nitrogen imply that the two parameters are not signifi cantly related to the level of serum cystatin. However, computed r-value of 0.526 (0.000) for creatinine indicates that when creatinine level increases cystatin also increases, while the 0.766 (0.000) for b2m shows that there is a great possibility that when b2m is elevated, the cystatin of diabetic patients is also high. Also, serum levels of cystatin were elevated in 27% of the total diabetic participants, while 19% have increased beta 2-microglobulin, that is, in the presence of normal blood urea nitrogen and serum creatinine. Moreover, using Bevc formula (90.63 x cystatin C-1.192), 25% of the diabetic participants have eGFR below 90 mL/min/1.73m2, a vivid refl ection of mild to moderate decrease in renal function.Conclusion: The fi ndings suggest that serum beta 2-microglobulin and cystatin C are early markers for kidney dysfunction in cases of incipient diabetic nephropathy, as seen in increased levels of these serum proteins, with normal levels of the routine kidney markers’ BUN and creatinine. Further, the results also imply that the inclusion of new B (beta 2-microglobulin) and C (cystatin C) kidney function tests which could identify mild renal insuffi ciency would surely become a cornerstone of diabetes care.
A-419
Karyotype analysis in patients with recurrent miscarriages
A. Castilho1, N. Gaburo1, m. J. Camilo1, D. Abreu2. 1DASA, Sao Paulo Brasil, Brazil, 2DASA, Rio de Janeiro, Brazil, Brazil
Background: Recurrent miscarriages are usually associated with genetic factors. Thus, couples should always be investigated after the third abortion when there was no other factor such as trauma or thrombophilias. Furthermore, 6% of couples

Clinical Studies/Outcomes Tuesday, July 30, 9:30 am – 5:00 pm
CLINICAL CHEMISTRY, Vol. 59, No. 10, Supplement, 2013 A125
with recurrent abortion often have chromosomal abnormalities such as balanced translocations, or aneuploidy polymorphisms. In these cases, when a parent is a carrier of chromosomal rearrangement, the probability an abortion occurrence varies between is 25 to 50%.Objective: The aim of this study was identify the chromosomal abnormalities in patients with recurrent abortions attended in our service from March 2012 to January 2013 using the conventional cytogenetic methodology.Methods: We evaluated 623 patients with clinical indication of recurrent abortion (389 female and 234 male). The mean age was 37 years (25-50 years) for men and 35 years (22-46 years) among women. Cytogenetic analysis was performed on metaphase chromosomes obtained by lymphocytes culture from peripheral blood and using Case Data Manager System (Applied Spectral Imaging Ltd.).Results: Twenty three samples (3.7%) presented chromosomal alterations of which 10 (1.60%) showed structural changes such as balanced translocations and 13 (2.1%) had karyotype polymorphisms. Among the polymorphisms, the alterations observed were: pericentric inversion of chromosome 9 in seven patients (53.8%), increased satellite on chromosome 22 in three patients (23.1%), increased heterochromatin on chromosome 9 in two cases (15.4%) and increased heterochromatin on chromosome 1 in one patient (7,7%). Among patients who had chromosomal abnormalities, seven were female and three were male. Regarding to polymorphism seven patients were female patients and six (6) were male patients.Conclusion: In this study, chromosomal abnormalities and polymorphisms showed similar frequency. Cytogenetic analysis is an important tool in aid of diagnosis and prognosis defi nition, helping to defi ne the procedure for genetic counseling, given that the presence of chromosomal abnormality may lead to the development of abnormal zygote resulting in miscarriage as consequence.
A-420
Oxidative stress index and levels of paraoxonase -1 in people with coronary artery disease identifi ed by multislice computed tomography
n. -. eren1, S. Yayla1, S. Cigerli1, C. Kırma2, E. Senem1. 1şişli etfal trainig and research hospital, İstanbul, Turkey, 2Kosuyolu trainig and research hospital, İstanbul, Turkey
Key Word: Coronary artery desease, oxidative stress,Paraoxanase familyBackground: Recent studies with the aim of reducing the high mortality rates in Coronary Artery Disease (CAD) and determining the degree of coronary stenosis before the symptoms suggest that biochemical assestments play a prominent role.Methods: In our study,we performed Multislice Computed Tomography (MSCT) to 76 people and we determined that 43 people of them had coronary artery disease. Total antioxidant status (TAS), total oxidant status (TOS), oxidative stress index (OSI), paraoxonase (PON1) and arylesterase (ARE) levels of all subjects included in the study were analyzed. TAS, TOS; was measured by the method of Erel (Rel Assay Diagnostics, Turkey). PON and aryl esterase enzyme activities was determined spectrophotometrically (Rel Assay Diagnostics, Turkey).Results: In our study, mean values of TAS in patients with CAD (1.83 ± 0.46) was statistically signifi cantly lower (p = 0.029) than in patients without CAD(2.05 ± 0.36). Mean values of TOS (28.68 ± 15.6, 11.25 ± 5.05) was signifi cantly higher, respectively (p = 0.001). Median values of OSI which is obtained from the rate of TOS to TAS were signifi cantly higher in patients with CAD (p = 0.001). According to Agatstron classifi cation, TAS levels in the cases without calcifi ed plaque (2.05 ± 0.36) were signifi cantly higher (p = 0.042) than in patients with high-calcifi ed plaque (1.75 ± 0.46). TOS levels in patients with light+mid-level and high-level of calcifi ed plaque (11.25 ± 5.05, 27.23 ± 15.67, 30.12 ± 15.77) were signifi cantly lower (p = 0.001), respectively and ODI levels were signifi cantly lower in patients with calcifi ed plaque (p = 0.001), were detected. OSI values in patients with coronary artery disease were signifi cantly higher than patients without CAD. According to vessel situations, the same fi ndings were analyzed. These results show that the processes of oxidative stress is responsible in the formation of plaque in coronary arteries. There is no signifi cant difference between the groups at PON levels (p> 0.05). ARE levels of patients without calcifi ed plaque were found signifi cantly higher than patients with light + medium-level and high-level calcifi ed plaque (p = 0.001).Conclusions: Our study showed that there is no signifi cant difference between patients with and without CAD at levels of oxidative stress and arylesterase activity. This difference suggests that coronary artery disease was subjected to a severe oxidative stress. We conclude that oxidative stress levels and arylesterase activity could be used as an indicator for the development of calcifi ed plaque and stenosis state.
A-421
Evaluation of a new workfl ow for syphilis screening using Brazilian guidelines
D. Panisa, V. Alastico, I. C. Almeida, S. Mendonça, O. Denardin, N. Gaburo. DASA, Sao Paulo, Brazil
Background: Treponema pallidum, the agent of syphilis infection leads to the production of specifi c (treponemal) and non-specifi c (non-treponemal) antibodies. In our service, the screening for syphilis infection was done using RPR (rapid plasma reagin), a non-treponemal assay. If positive, ELISA and FTA-Abs (treponemal tests) were performed. The increased number of syphilis tests requested an automated methodology for initial screening as CMIA (Chemiluminescent microparticle immunoassay), a high sensitivity treponemal test.Objective: Implement a new workfl ow for screening and diagnosis of syphilis starting the process with a treponemal test (CMIA) followed by a non treponemal test (RPR).Methods: We analyzed serum samples from 1,000 patients using commercial kits Architect Syphilis TP for CMIA (Abbott, Tokyo, Japan) and RPR - Rapid Bras Plasm Reagin (Laborclin, Paraná, Brazil). Both tests were performed according to the manufacturer’s recommendations. For discrepant results between CMIA and RPR, two treponemic assays were also performed: Treponema pallidum hemagglutination-TPHA (Fujirebio, Tokyo, Japan) and FTA-Abs (Simedix, New Jersey, USA). In our study, we followed the Brazilian guidelines of the ordinance CCD-25 from 07.18.2011.The results obtained were interpreted qualitatively as positive, negative and inconclusive.Results: The results are described in Table 1.Table 1. Results of tests performed for screening and diagnosis of syphilis.
CMIA RPR TPHA FTA-abs Total+ + N.A N.A 44.80%+ - + + 9.10%+ - - - 4.20%- - N.A N.A 32.90%INC - + + 1.50%INC - + - 4.00%INC - - + 2.00%INC - - - 1.50%Legend: +: Positive result; -: Negative result; INC: inconclusive result; N.A: not applied.Conclusion: CMIA and RPR showed agreement of 77.7%. The CMIA test showed higher detection rate of positive samples than RPR, confi rmed by TPHA and FTA-abs in 9.10% of samples. Inconclusive results in CMIA test (9.0%) may be attributed to the window period and false-positive results. We concluded that CMIA as initial test is highly sensitive and optimized and RPR should be still performed in CMIA positive samples.
A-422
Enhanced Liver Fibrosis (ELF) panel in the evaluation of several chronic liver diseases
A. Dellavance1, F. F. Fernandes2, D. C. Baldo1, E. L. Neto3, E. Oliveira4, J. M. Camargo1, L. Borzacov4, R. M. Perez2, L. E. C. Andrade4, M. L. C. G. Ferraz4. 1Fleury Medicine and Health, São Paulo, Brazil, 2Universidade Federal do Rio de Janeiro, Rio de Janeiro, Brazil, 3Universidade Federal de Pernambuco, Pernambuco, Brazil, 4Universidade Federal de São Paulo, São Paulo, Brazil
Background: Hepatic fi brosis characterizes the natural history of chronic liver diseases and is considered a marker of disease progression to cirrhosis and its complications. Liver biopsy is the gold standard for semi-quantitative staging of fi brosis, although its accuracy is questionable. In addition to being an invasive procedure that poses a risk to the patient, the hepatic fragment is not always representative of the overall fi brotic process. Some non-invasive alternatives have been proposed for detecting hepatic fi brosis, including serum biochemical markers and direct ultrasound imaging. The literature has recently emphasized the accuracy of the ELF (Enhanced Liver Fibrosis) score, which is based on the quantifi cation of hyaluronic acid (HA), procollagen III amino terminal peptide (PIIINP), and tissue inhibitor of metalloproteinase 1 (TIMP-1) in serum samples. The aim of the present study is to evaluate the degree of liver fi brosis according to the ELF score in several chronic liver diseases.

Tuesday, July 30, 9:30 am – 5:00 pm Clinical Studies/Outcomes
A126 CLINICAL CHEMISTRY, Vol. 59, No. 10, Supplement, 2013
Methods: We evaluated 592 serum samples, from patients with the following diseases: HCV (n=266); Autoimmune Hepatitis (n=110); Schistosomiasis (n=109); Pre-Clinical Primary Biliary Cirrhosis (n=49); Established Primary Biliary Cirrhosis (n=29) and Delta Hepatitis (n=29). Serum samples were frozen at -70ºC within an interval no longer than 3 hours after blood collecting. PIIINP, HA, and TIMP-1 were measured in all patients by a CE-marked, random-access, automated clinical immunoassay system that uses magnetic particle separation technology with direct chemiluminescence (ADVIA Centaur®, Siemens Healthcare Diagnostics, Tarrytown, NY, USA). The ELF score was calculated using the algorithm: ELF = 2.278 + 0.851 ln(HA) + 0.751 ln(PIIINP) + 0.394 ln(TIMP-1). Cut-off points proposed by the manufacturer were applied: < 7.7 absent or mild fi brosis, ≥ 7.7 and < 9.8 moderate fi brosis and ≥ 9.8 severe fi brosis.Results: ELF score was able to detect some degree of fi brosis in the majority of individuals with all forms of chronic liver diseases in this study. However, there was considerable variability in the severity of liver fi brosis according to the etiology of liver disease. Autoimmune Hepatitis exhibited the highest and Delta Hepatitis exhibited the lowest frequency of severe ELF score (53.63%; mean 11.8±1.18 and 6.9%; mean 10.62±0.82; respectively). Established Primary Biliary Cirrhosis, Chronic Hepatitis C and Schistosomiasis were intermediate in frequency of severe ELF score (31.0%; mean 10.65±0.48; 30.8%; mean 10.7±0.89 and 27.7%; mean 10.59±0.65, respectively). Interestingly, the group of patients with Pre-Biochemical stages of Primary Biliary Cirrhosis showed a considerably better ELF score profi le (14.3%; mean 7.0± 0.49). However, it was clear that even these individuals already presented some degree of liver fi brosis, not associated with alterations in serum levels of alkaline phosphatase.Conclusion: This preliminary evaluation showed the promising potential of the non-invasive ELF method for estimating the degree of liver fi brosis in distinct chronic liver diseases. The spectrum of fi brosis severity observed refl ects the expected heterogeneity in the fi brotic component in the several forms of chronic liver disease.
A-423
Prognostic accuracy for all-cause mortality of a biomarkers panel in elderly hospitalized patients with suspected lower respiratory tract infection focused on procalcitonin and mid-regional pro-adrenomedullin
M. Zaninotto1, M. M. Mion1, G. Bragato1, D. Faggian1, M. Miolo2, A. Dainese3, P. Carraro2, A. Pilotto3, M. Plebani1. 1Department of Laboratory Medicine, University-Hospital, Padova, Italy, 2Department of Laboratory Medicine, Azienda ULSS 16, S. Antonio Hospital, Padova, Italy, 3Geriatrics Unit, Azienda ULSS 16 Padova, S. Antonio Hospital, Padova, Italy
Background: The aim of the study was to assess the prognostic accuracy for all-cause mortality of a panel of routine and new biomarkers (mid-regional pro-adrenomedullin, MR-proADM; procalcitonin, PCT) in a population of elderly subjects hospitalized for suspected lower respiratory tract infection (LRTI). MR-proADM is a new diagnostic parameter for outcome prediction in patients (pts) with acute congestive hearth failure and/or with dyspnea in general; furthermore it is particularly strong in predicting short-term prognosis within 30 days after assessment. PCT increases early and specifi cally in response to clinically relevant bacterial infections and sepsis; it is an important aid in the differentiation between bacterial infection and other causes of infl ammatory reaction.Methods: From 20/2/12 to 23/7/12, 50 patients were hospitalized to the Geriatrics Unit of our hospital with a suspect of LRTI [24 females (F), 26 males (M); age: range, median=67-102, 86 years]. At the follow-up monitoring (3/10/12), 28 pts (56%) survived (group “alive”) (14 F, 14 M), and 22 pts (44%) died (group “dead”) (10 M, 12 F). The mean hospital stay was 9 days (range, median=1-30, 7). Death occurred on average 26 days after discharge (range, median=0-162, 12). We evaluated, Clinical characteristics: 1-Primary discharge diagnosis; 2-Concomitant discharge diagnosis; 3-Fever (>37° C), CF and O2 saturation; 4-Multidimensional prognostic index, MPI: a validated frailty instrument, signifi cantly correlated with short and long-term mortality in hospitalized older pts (grade of risk: low -L-, ≤0.33; moderate -M-, 0.34-0.66; severe -S-, ≥ 0.66). Biochemical parameters: A- Routine biomarkers: WBC, CRP, ESR, CRE; B- New biomarkers: MR-proADM and PCT (automated immunofl uorescent assay, Thermo Fisher), manufacturer declared URL in healthy subjects, respectively: 0.55 nmol/L (97.5 % percentile) and 0.064 μg/L (95 % percentile). Routine biomarkers were evaluated at hospitalization, while PCT and MR-proADM have been monitored at 4 different time points: admission (T 0), 24 hours (T 1), 72 hours (T 2) and than 5-6 days (T 3).
Results: 1-Primary discharge diagnosis (n pts, %): LRTI (26, 52%), cardiac diseases (12, 24%), respiratory diseases other than LRTI (4, 8%), other (8, 16%). 2-Concomitant discharge diagnosis (n pts, %): LRTI (13, 26%), cardiac diseases (29, 58%), neurologic disorders (18, 36%), muscle disorders (16, 32%), gastroenteric disease (8, 16%), pulmonary insuffi ciency and BPCO (6, 12%), other (20, 40%). 3-Fever: “alive” vs “dead”=61 vs 32%; 4-MPI “alive” vs “dead” (Mann Whitney, p=0.08): L+M=54%, S=46% (“alive”); L+M=32%, S=68% (“died”). A-Mann Whitney (p): n.s. for all parameters. B- “alive” vs “dead”, Mann Whitney (p): MR-proADM (0.01), PCT (0.07). The fi rst two points (T0 and T1) were found to be more related with the clinical course.Conclusions: The most frequent primary and concomitant discharge diagnosis was LRTI and cardiac diseases, respectively. Among clinical characteristics fever differed signifi cantly between “alive” and “dead” pts. MPI levels as well as MR-proADM and PCT concentrations showed a different distribution between “alive” and “dead” pts, even if not always statistically signifi cant; MPI results the most important frailty instrument for the studied population, even if MR-proADM and PCT are two strong additional aid in predicting death.
A-424
THE ROLE OF CALPROTECTIN AND GHRELIN IN DIAGNOSIS OF POST ERCP PANCREATITIS
F. M. El Shanawani, M. M. Hasan. Theodor Bilharz Research Institute, Cairo, Egypt
Acute pancreatitis is a common and dreaded complication of endoscopic retrograde cholangiopancreatography (ERCP) patients. The study identifi ed the incidence of post ERCP pancreatitis and role of serum calprotectin and ghrelin in its diagnosis. One hundred forty two patients underwent ERCP-related procedures were studied. Serum amylase, lipase, calprotectin and ghrelin concentrations were measured 24 hours after the procedure using ELISA, kinetic and colorimetric methods. Thirty two healthy controls were enrolled. In post ERCP group, mean level of amylase was 146.03+57.40 U/L, lipase 328.37+133.95 U/L, calprotectin 3.26+2.99 U/L and gherkin 2.56+1.76 mg/l. In controls mean level of amylase was 58.13+/-15.96U/L, lipase 181.63+/- 51.94 U/L, calprotectin 0.49+/-0.17U/L and ghrelin 2.59+/-0.19 mg/l. A statistical signifi cant increase was reported (p<0.001) in levels of amylase, lipase and calprotectin between the two groups without signifi cant in ghrelin level.conclusion :The outcome result showed that acute pancreatitis ,followed ERCP based on clinical and consensus defi nitions were poorly correlated.The calprotectin and the ghrelin can be used as markers for pancreatitis post ERCP,but its signifi cance in predicting post-ERCP pancreatitis and its severity has to be evaluated.

TDM/Toxicology/DAU Tuesday, July 30, 9:30 am – 5:00 pm
CLINICAL CHEMISTRY, Vol. 59, No. 10, Supplement, 2013 A127
Tuesday, July 30, 2013
Poster Session: 9:30 AM - 5:00 PM
TDM/Toxicology/DAU
A-425
Detection and Quantifi cation of Synthetic Cathinones by LC/Triple Quadrupole Mass Spectrometry
F. Mbeunkui, J. V. Wiegel, R. B. Dixon. Physicians Choice Laboratory Services, Charlotte, NC
Background: Many of the new psychoactive substances remain unfamiliar to health care providers. Synthetic cathinones, commonly called “bath salts,” have resulted in emergency department visits nationwide for severe agitation, sympathomimetic toxicity, and death. The objective of this study was to develop a sensitive, specifi c and rapid liquid chromatography-tandem mass spectrometry method to detect and quantify synthetic cathinones in urine samples.Methods: Urine samples were prepared by solid phase extraction in a 96-deep-well SPE-plate after pretreatment with β-glucuronidase enzyme. Urine samples were analyzed by LC-MS/MS using an Agilent LC/Triple quadrupole instrument. Chromatographic separation was carried out in a Poroshell 120-SB-C18 column with 99.9% water, 0.05% formic acid and 0.05% ammonium formate as mobile phase A; and 99.95% acetonitrile and 0.05% formic acid as mobile phase B. The column was eluted with a 2 min gradient from 5-95% B. Mass spectral data were obtained in positive electrospray mode. Detection and quantitation were performed by MRM of two transitions for each analyte and one transition for each internal standard.Results:Calibration curves generated for synthetic cathinones (10-640 ng/mL) with duplicate injections using 1/x weighting showed a good linearity (R2 ≥ 0.99). The average accuracy at 10 ng/mL was 99.7%. The limit of quantifi cation was 10 ng/mL for all compounds and the limit of detection was 4 ng/mL for all compounds except for methylenedioxypyrovalerone and methylone (3 ng/mL). The matrix effect was found to be less than 20% of the nominal values for all compounds. This method was applied to the screening and quantifi cation of synthetic cathinones in patient urine samples from suspected patients. Six samples out of nearly 500 investigated were tested positive for synthetic cathinones (methylone 70-245 ng/mL and methcathinone 15-170 ng/mL).Conclusion:The validated LC-MS/MS method described here offers highly sensitive and rapid detection and quantifi cation of synthetic cathinones in urine.
A-427
Development and validation of a HPLC-UV method for the quantifi cation of three anti fungal agents in human serum
L. R. Sanches, L. G. B. Toni, J. Pasternak, A. C. L. Faulhaber, T. Romanatto, E. V. Almeida, C. E. S. Ferreira. Hospital Albert Einstein, São Paulo, Brazil
Background: Invasive fungal infections are one of the most common causes of morbidity and mortality in immunocompromised patients. In recent years, the antifungal therapy has expanded and the clinicians have the opportunity to choose from several antifungal classes but they need accurate methods for drugs monitoring during the treatment. Simultaneous determination of different antifungal is desirable as a way to obtain fast results using small samples.Methods: The purpose of this study was to develop and validate an ultra-performance liquid chromatography with ultraviolet detection (HPLC-UV) method to simultaneously monitor the concentration of voriconazole (VOR), itraconazole (ITR) and posaconazole (POS) in human serum. Samples were prepared using a liquid-liquid extraction with diethyl ether (0.5 and 2.5 mL, respectively). HPLC-UV analysis were performed using an Agilent 1290 Infi nity System equipped with Eclipse Plus C18 (50 mm x 2.1 mm; 1.8 μm) column. The analysis was achieved with a gradient elution using water and methanol (60:40, v/v) as the mobile phase at 0.7 mL/min fl ow rate. The internal standard (voriconazole compound related D, USP 1718041) was used at 4 μg/mL. The wavelength and the injection volume were 256 nm and 4 μL respectively.Results: The method validation assays were performed according to the currently accepted RE 899 Anvisa Bioanalytical Validation Guide. The linearity range validated for VOR was 0.25 to 16 μg/mL and 0.25 to 8 μg/mL for ITR and POS. Weighted least square linear regressions using the weighting factor of 1/y2 resulted in correlation coeffi cients above 0.99. The average accuracy ranged from 108% to 113% to VOR, 86% to 100% to ITR and 111% to 113% to POS and the coeffi cient of variation (CV) interday precise ranged from 4.5% to 6.8%, 4.5% to 4.7% and 4.9 to 6.2 to VOR, ITR and POS respectively. The CV intra-day precise ranged from 1.7 to 6.2, 1.1 to 9.5 and 0.6 to 8.6 to VOR, ITR and POS respectively. The limit of quantifi cation (LOQ) and the limit of detection (LOD) were 0.25 μg/mL and 0.125 μg/mL, respectively for all analytes. The extraction recovery was 71.3%, 78.7% and 90.3% for VOR, ITR and POS respectively. The analyte stability was assessed under storage conditions as follows: room temperature for 4 and 24 hours, 4 oC for 3 days, -20 oC followed by thawing at room temperature (3 cicles) and post preparative stability. The hemolyzed and lipemic samples showed interference in selectivity assay just for POS.Conclusion: The validation results indicate that the method is accurate, precise, sensitive, selective and reproducible.
A-429
Development of a Rapid LC/MS/MS Method for 46 Drugs of Abuse Screening in Urine
L. Yang1, G. Ball2, G. Hoag1. 1Vancouver Island Health Authority and Faculty of Medicine, University of British Columbia, Victoria, BC, Canada, 2Vancouver Island Health Authority, Victoria, BC, Canada
Background: Drugs of abuse screening in urine is used to monitor compliance and evaluate patients in the emergency room. Immunoassays are commonly used for screening but have a limited scope of target compounds and lack sensitivity and specifi city. Liquid chromatography tandem mass spectrometry (LC/MS/MS) can provide high sensitivity and specifi city to targeted drug screening and has been increasingly used in clinical laboratories. The objective is to develop a rapid LC/MS/MS screening method to replace our current immunoassay screening method for drugs of abuse (DOA) and provide confi rmations.Methods: Sample preparation involves adding 100 μL of methanol with internal standards morphrine-d3 and diazepam-d5 to 100 μL of urine or controls, followed by vortex mixing and centrifugation. Then, 100μL of supernatant is diluted with 400 μL of water and 20 μL of the dilution is injected for analysis by a Shimadzu Prominence HPLC system and AB SCIEX 4000 QTRAP mass spectrometer with electrospray ionization in positive polarity. We set up a targeted urine drug screen for 46 drugs or drug metabolites using our modifi ed AB SCIEX iMethod with gradient elution (6.6 min run time). The method consists of a multiple reaction monitoring (MRM) survey scan and an information-dependant acquisition (IDA) triggered dependent enhanced product ion scan (EPI). A MRM survey scan is used to identify potential drugs. The EPI spectrum can be searched against a drug screen library for compound confi rmation. Generally, we use the combination spectral purity match (>70%), a retention time window (± 0.1 min) and medication use by the patient to

Tuesday, July 30, 9:30 am – 5:00 pm TDM/Toxicology/DAU
A128 CLINICAL CHEMISTRY, Vol. 59, No. 10, Supplement, 2013
report positive results. For ten drugs (Amphetamine, Benzoylecgonine, MDEA, Methadone, Methamphetamine, Morphine, Nortriptyline, Oxazepam, Oxycodone, and THC-COOH) with an established immunoassay cut-off, we determined an area count corresponding to a level equal to minus 50% of the immunoassay cutoff by spiking urines with standards at the defi ned concentrations.Results: The reproducibility of the method in terms of purity values is determined by analyzing DOA urine toxicology liquid controls containing the ten drugs. Intra-assay and inter-assay precision were 1-12% and 1-14%, respectively. Assay carry-over is less than 0.1% for nine drugs and 1.2% for nortriptyline at 10x cutoff level. A comparison of LC/MS/MS method with immunoassay (Nova Century kit and DXC800 analyzer) method is performed by analyzing patient samples (n=108). The agreements with immunoassay method within drug classes are 100% for opiates, oxycodone, methadone and cocaine, 98% for amphetamines (two positive in immunoassay were negative in LC/MS/MS), 92% for benzodiazepines (eight negative in immunoassay were positive for 7-amino-clonazepam or lorazepam in LC/MS/MS, confi rmed by patient medication review), 88% for marijuana (13 positives in immunoassay were negative in LC/MS/MS, MRM signals were positive but EPI quality was not suffi cient for confi rmation) and 84% for tricyclic antidepressants (17 positives in immunoassay were negative in LC/MS/MS).Conclusion: A rapid and reliable LC/MS/MS method to detect and identify 46 drugs or drug metabolites in urine with minimal sample preparation is developed. Specifi c identifi cation does not require confi rmatory testing. The assay can be used for target drug screening in clinical laboratories.
A-430
Timing Is Everything: A Quality Assurance Study of Specimen Collection and Immunosuppressant Therapeutic Drug Monitoring
T. K. Jackson1, P. A. Andrews1, H. K. Lee2. 1Geisel School of Medicine at Dartmouth, Lebanon, NH, 2Geisel School of Medicine at Dartmouth & Dartmouth-Hitchcock Medical Center, Lebanon, NH
Background: Cyclosporine, tacrolimus or sirolimus are given to transplant patients to minimize rejection. It is important to monitor these drug levels - too much can result in toxicity and too little can result in transplant rejection. The optimal specimen collection time is just prior to the next dose, as the therapeutic ranges are those of trough levels. As a Quality Assurance study, patient results have been reviewed and specimen collection times were investigated for appropriateness.Objective: We aimed to determine how often a drug level that fell outside of the established therapeutic range was associated with improper timing of specimen collection and utilize this information to educate patients, nurses and practitioners.Methods: Retrospective review of cyclosporine, tacrolimus, and sirolimus results over a twelve month period was performed. A total of 4626 results were reviewed. Less than 30 or >400 ng/mL for cyclosporine, and <3 or >15 ng/mL for tacrolimus and sirolimus were considered to be out of range. Patient data was entered onto a spreadsheet with the name, date and time of specimen collection, location, provider’s name, and test result. The patients’ charts were then reviewed to correlate dosing information.Results: For cyclosporine, out of 685 total test results, 79 (11.5%) fell outside the therapeutic range. Of those, 34% were too low, and 66% were too high. For tacrolimus, out of 3716 test results, 326 (8.8%) fell outside the therapeutic range. Of those, 63% were too low, and 37% were too high. For sirolimus, out of 225 total test results, 41 (18.2%) fell outside the therapeutic range. Of those, 98% were too low, and 2% were too high. The majority of results falling outside the therapeutic ranges were found to be appropriate (dose changes and correct specimen collection times). Out of those that were inappropriate, the main reasons found for low test results were no prescription for the drug, patient non-compliance, no dose given/taken, and improper specimen collection time. The majority of those for tacrolimus and sirolimus were outpatients, 74% and 82% respectively. The main reasons found for high test results include the patients having been given/taken the dose and line contamination. The majority of those for tacrolimus, 77%, were outpatient. The majority of those for cyclosporine, 83%, were inpatient.Conclusions: Reporting immunosuppressant results that are inaccurate due to inappropriate specimen collection times can lead to incorrect dose calculation. Testing for a drug that is not being prescribed to a patient due to ordering errors, or retesting for the same drug due to inappropriate collection times lead to increasing cost for the patients and waste of resources for the testing laboratory. Results of this study suggested the need for educating patients in outpatient settings and providers in inpatient settings of appropriate specimen collection times to ensure accurate results
for dosing purposes. A dosing policy is being developed in collaboration with the pharmacy department and education sessions for outpatients and inpatient providers are in progress to address this issue.
A-431
Reference Interval Determination for Anabasine in Urine: A Biomarker of Active Tobacco Use
B. B. Suh-Lailam1, H. Carlisle2, T. Ohman2, G. A. McMillin1. 1University of Utah, Salt Lake City, UT, 2ARUP Laboratories, Salt Lake City, UT
Background: Laboratory detection of nicotine exposure is important for establishing eligibility for organ transplant and elective surgery. Nicotine testing is also used to verify compliance with nicotine replacement therapies (NRT), smoking cessation programs, and for life insurance purposes. Nicotine metabolites, such as cotinine (COT) and trans-3’-hydroxycotinine (3-OHCOT), are used as biomarkers of nicotine exposure. For some clinical applications, it is important to distinguish between active use of tobacco products versus NRT. Anabasine is a tobacco alkaloid that has been used as a biomarker of active tobacco use. However, the use of anabasine as an insecticide, and its presence in consumables other than nicotine products, suggests that anabasine may not be specifi c to tobacco use.Objective: To determine the reference interval for anabasine in the urine of non-smokers, and compare it to the range of anabasine concentrations observed in the presence of nicotine metabolites.Methods: Urine samples were collected from 120 self-proclaimed, consenting non-smokers (60 males and 60 females, 20-68 years old). COT, 3-OHCOT and anabasine were detected by LC-MS/MS. Briefl y, an aliquot of urine was added to a mixture of deuterium labeled analogs of COT, 3-OHCOT and anabasine as internal standards (IS), and subjected to solid phase extraction. The samples were analyzed by APCI ionization and multiple reaction monitoring; two transitions were monitored per analyte and IS. The reference interval was compared to the range of anabasine concentrations determined for 2594 consecutive urine specimens that tested positive for nicotine and/or metabolites, at ARUP Laboratories, during a 1 year period.Results: Urine anabasine concentrations for the 120 non-smoking individuals ranged from 0.1-5.6 ng/mL, with a mean of 1.0 ng/mL and a median of 0.8 ng/mL. No statistically signifi cant difference was observed between males and females. A reference interval was determined using non-parametric methods. The upper 95th percentile was determined to be 2.86 with a 95% confi dence interval (CI) of 1.07 to 4.65. Applying a cutoff concentration of 3 ng/mL, 1161 of the 2594 nicotine-containing urine specimens (45%) were anabasine-positive while 1433 were anabasine-negative. At a cutoff of 3 ng/mL, the Youden score was 99.16%, the ROC area was 0.9994 and CI was 0.9981 to 1.0000. Anabasine distribution in urine samples that were positive for at least one nicotine metabolite ranged from 3-1698 ng/mL, with a mean of 13.5 ng/mL and a median of 8.0 ng/mL. These values were notably higher than that of the reference (nicotine-negative) population, and may refl ect tobacco users. However, concentrations of anabasine between 3-6 ng/mL may or may not refl ect active use of tobacco, due to potential overlap with the distribution of anabasine concentrations observed in the reference population. The nicotine-positive samples that were anabasine-negative (<3 ng/mL) could be attributed to people on NRT.Conclusions: This study suggests that a 3 ng/mL cutoff is appropriate for anabasine as it approximates the 95th percentile of the reference population. However, conclusions cannot be made on the actual clinical specifi city of anabasine for predicting tobacco use based on this data alone, as patient history is lacking.
A-432
Clinical and Analytical Performance of Total and Fractionation Assays for Urine Arsenic
S. A. Hackenmueller, F. G. Strathmann. University of Utah, Salt Lake City, UT
Background: Arsenic toxicity is dependent upon the form of arsenic. Toxic arsenic species include inorganic arsenic, As(III) or As(V), and methylated metabolites which include monomethylarsonic acid (MMA) and dimethylarsinic acid (DMA). Organic arsenic species, commonly arsenobetaine and arsenocholine, are non-toxic. The ACGIH Biological Exposure Index for arsenic in urine is 35 mcg/L for the sum of inorganic and methylated species. Arsenic is measured by inductively coupled plasma-mass spectrometry (ICP-MS) as a total arsenic concentration, or fractionated using high performance liquid chromatography (HPLC) coupled to ICP-MS to

TDM/Toxicology/DAU Tuesday, July 30, 9:30 am – 5:00 pm
CLINICAL CHEMISTRY, Vol. 59, No. 10, Supplement, 2013 A129
quantify arsenic species. The objective of this study was to evaluate the clinical and analytical performance of a urine total arsenic screen with refl ex to fractionation in identifying patients with arsenic exposure.Methods: A retrospective analysis of results from urine total arsenic with refl ex to fractionation was conducted. Total arsenic samples were analyzed on Perkin-Elmer SCIEX ELAN 9000 or DRC II ICP-MS instruments. Arsenic fractionation was conducted using an Agilent Technologies 1200 Series HPLC with a model #7700x ICP-MS instrument. The refl ex criterion was a total arsenic concentration ≥35 mcg/L. The positivity rate was used to evaluate clinical performance. Quantitative agreement between total arsenic and the sum of fractionated species (arsenobetaine, As(III), As(V), MMA and DMA) was used to evaluate analytical performance. The percent difference between methods was calculated as 100*[(total arsenic) - (sum of arsenic species)]/(total arsenic).Results: Of 12,595 urine total arsenic results, 1110 (8.8%) were refl exed to fractionation. Of the samples refl exed, 102 (9.2%, 0.8% of total arsenic samples) were clinically positive (sum of inorganic and methylated arsenic species ≥35 mcg/L) and 949 (85.5%) were analytically positive (sum of inorganic, methylated and organic arsenic species ≥35 mcg/L). Since only the clinically concerning (inorganic and methylated) and major organic (arsenobetaine) arsenic species are quantifi ed upon fractionation, some discrepancy between total arsenic concentration and the sum of fractionated species was expected. The slope and correlation coeffi cient (r2) of the linear regression of the sum of fractionated species versus total arsenic were 0.97 and 0.99, respectively, indicating linearity and correlation between the methods. The percent difference between total arsenic and the sum of fractionated arsenic ranged from -97.0% to 100%. The median of the distribution was 7.5%, and the 25th and 75th percentiles were -0.7% and 17.4%, respectively. The mean bias in a Bland-Altman difference plot (total arsenic - sum of fractionated arsenic) was 5.4 mcg/L and the limits of agreement were -36.7 and 47.5 mcg/L, which indicated a slight positive bias of the total arsenic concentration compared to the sum of fractionated arsenic species.Conclusion: Less than 10% of urine total arsenic samples assayed were refl exed to fractionation to quantify the arsenic species present, resulting in an overall clinical positivity rate of <1%. Comparing the total arsenic and sum of fractionated arsenic species indicated there is correlation between the methods and a slight positive bias toward total arsenic was observed.
A-433
Digoxin Immunoassays on the ARCHITECT i2000SR and ARCHITECT c8000 Analyzers are Free from Interferences of Asian, Siberian, and American Ginseng
B. W. Baugher1, M. Berman1, J. E. Dierksen2, D. A. Armbruster1, A. Dasgupta2. 1Abbott Laboratories, Abbott Park, IL, 2University of Texas - Houston Medical School, Houston, TX
Asian, Siberian and American ginseng represent three common types of ginsengs sold worldwide with Asian ginseng being one of the best selling herbs in the US market. These three ginsengs are known to interfere with serum digoxin measurements using FPIA (fl uorescence polarization) technology, ex. Digoxin II and Digoxin III assays (Abbott Laboratories) and Digoxin immunoassays manufactured by other manufacturers. Abbott Laboratories recently launched two new digoxin assays: iDigoxin (iDig), a chemiluminescent microparticle immunoassay for application on the Architect i1000 and i2000 immunoassay analyzers and Dixoxin (Dig), a particle-enhanced turbidimetric inhibition immunoassay for application on the Architect c4000 and c8000 Clincal Chemistry analyzers. However, potential interference of various forms of ginsengs on these two relatively new digoxin assays has not been reported. Here we report our fi ndings of the effect of different forms of ginseng on the ARCHITECT immunoassay and clinical chemistry analyzers. Extracts of the three ginsengs were prepared so that the concentrations would mimic in vivo concentrations after taking a recommended dosage or an overdose as described earlier: Dasgupta et al. J Clin Lab Anal 2008; 22: 295-301. A drug free serum pool was treated with activated charcoal (50 mg/mL) to remove any residual digoxin like immunoreactive substances. A digoxin-positive serum pool was prepared by combining left-over sera of patients receiving digoxin. The identifi cation of individual specimens was removed as per an approved IRB protocol. Aliquots of the drug free serum pool were supplemented with 5, 10 or 20 microliters of Asian, Siberian or American ginseng extracts per milliliter of serum and Digoxin values were measured. No detectable levels of Digoxin were observed using both ARCHITECT assays indicating no interference from these forms of ginsengs. In addition, when aliquots of the digoxin-positive pool (prepared above) were supplemented with these ginseng extracts and the Digoxin values measured, we observed no statistically signifi cant difference in observed digoxin values compared to the original digoxin value of the pool. For example, when an aliquot of the digoxin
pool was supplemented with 20 microliter of Asian ginseng per milliliter of the pool, the observed mean value of 0.93 ng/mL of digoxin (SD: 0.03, n =3) was not different from the original digoxin value of the pool (mean: 0.92 ng/mL, SD: 0.02, n =3). These results further establish that Digoxin assays that employ specifi c monoclonal antibodies against Digoxin are free from interferences from Asian, Siberian and American ginseng.
A-434
Evaluation of the QMS® Tacrolimus Assay
E. K. Leung, X. Yi, C. Gloria, K. T. J. Yeo. The University of Chicago, Chicago, IL
Background: Tacrolimus is an immunosuppressive macrolide that inhibits T-lymphocyte signal transduction and IL-2 transcription by binding to FKBP12 and calcineurin. Although LC-MS/MS is becoming the method of choice to measure tacrolimus, automated immunoassays remain widely used, especially in smaller clinical laboratories. Advantages include increased sample throughput, 24/7 availability, and the ability to incorporate into existing automation systems and laboratory workfl ow. We evaluated the analytical performance of the QMS Tacrolimus immunoassay (ThermoFisher, Fremont, CA) and compared it with our in-house LC- MS/MS method.Methods: The QMS Tacrolimus assay is a turbidimetric method that was used on the Roche Modular Analytics P-System. Precision studies were conducted using Bio-Rad ISD Control Level 1 (Bio-Rad, Hercules, CA) and MDI ISD Control Levels 1, 2, and 3 (More Diagnostics, Los Osos, CA) quality control (QC) materials. Analyte measuring range studies were conducted by diluting a high tacrolimus whole blood sample with tacrolimus negative whole blood. Calibration stability was conducted by measuring 4 QC levels over 12 days and analyte stability studies were conducted by storing low and high specimens at 4°C, -20°C, and -80°C over 5 days. LOQ studies were conducted using 4 low level specimens analyzed over 5 days. Interferences studies were conducted using pooled whole-blood samples spiked with increasing amounts of bilirubin, hemolysate, and intralipid. Comparison studies were conducted using 65 de-identifi ed whole blood samples collected after routine tacrolimus determination using LC-MS/MS.Results: Within-run precision showed CV ranging from 3.9-8.1%. Between-day precision was analyzed two times a day, over 21 days for 4 QC levels and showed CV ranging from 4.7-10.0%. Measurements were linear (r2 = 0.99) up to 30 ng/mL and calibration was stable up to 12 days. Tacrolimus in whole blood was stable up to 2 days when stored at 4°C and at least 5 days when stored at -20°C or -80°C. LOQ was determined to be 0.7 ng/mL (CV of 14.4%). Bilirubin (up to 48 mg/dL), hemoglobin (up to 345 H-index), and intralipid (<2800 mg/dL) did not show any signifi cant interference. Comparisons of all samples showed good overall agreement to the LC-MS/MS method (Passing-Bablok regression: y = 1.09x+0.83 (n = 65, range = 1.8-89.2 ng/mL r2 = 0.97).Conclusion: Overall, the QMS Tacrolimus assay showed good analytical performance and agreement with our LC-MS/MS tacrolimus assay.
A-435
A sensitive and selective method of Corticosteroids in serum using Liquid Chromatography-Tandem Mass Spectrometry analysis.
E. Lazo1, C. E. Heine2, M. E. Witte1, F. Amole1, P. Ruiz1. 1University of Miami, Miami, FL, 2Waters Corporation, Beverly, MA
Background: Corticosteroids are important medications prescribed for a variety of clinical conditions, including solid organ transplantation. Laboratory measurement of corticosteroids is challenging and several technologies have been applied for this purpose. Our objective was to develop and validate an LC-MS/MS method with high sensitivity and selectivity, for the simultaneous quantifi cation in serum of six corticosteroids (Cortisol, Cortisone, Methylprednisolone, Dexamethasone, Prednisone and Prednisolone) of clinical relevance for transplantation.Methods: LC-MS/MS analysis was performed on a Xevo TQ Mass spectrometer coupled with ACQUITY UPLC system (Waters). An Acquity UPLC BEH C18 column (1.7 μm, 2.1 x 50 mm) was used. Gradient of 0.1% formic acid, 2 mM ammonium acetate in water/methanol was used as mobile phase. The overall run time was 6 minutes. The mass spectrometer was equipped with electrospray ionization (ESI) probe and operated in positive mode. A quantifi er and a qualifi er transition were monitored for each corticosteroid to increase selectivity. For sample preparation; 100

Tuesday, July 30, 9:30 am – 5:00 pm TDM/Toxicology/DAU
A130 CLINICAL CHEMISTRY, Vol. 59, No. 10, Supplement, 2013
μL of serum diluted with 5% H3PO4, and mixed with the internal standard solution was loaded into Oasis HLB 30 mg 96-Well Plate (Waters). The fi nal eluents were evaporated and reconstituted for analysis. The validation procedure included linearity, analytical recovery, precision, lower limit of quantitation (LLOQ) and method comparison.Results: Solid Phase Extraction (SPE) procedure was developed to reduce matrix effects and troubleshoot operational robustness. 5% and 40% methanol were chosen as sequential washing solvents for removing endogenous interferences and 85% methanol was selected as elution solvent. The overall percent of recovery (n = 5) of the SPE extraction process ranged from 71.1 % (cortisone) to 85.3 % (dexamethasone). The study of matrix effects by single analyte was acceptable, in the range between -11% (cortisone) to 3.7% (prednisone). The method was linear up to 600 ng/mL for cortisol, cortisone, methylprednisolone and prednisolone and up to 400 ng/mL for dexamethasone and prednisone; with R2 values greater than 0.998 for all compounds using a 1/x weighting linear regression. The overall analytical recovery within the measurement range was from 91.0 to 110.6%. The coeffi cients of variation intra-assay (n=10) and inter-assay (testing duplicates of each QC samples on 10 different days) were all less than 5% at three concentration levels. No carry-over was observed with this method. The LLOQ (lowest concentration that could be assayed with CV ≤ 15) was determined to be 0.5 ng/mL for cortisone; 1 ng/mL for cortisol and 2 ng/mL for dexamethasone, methylprednisolone, prednisone and prednisolone. The signal to noise ratio at the LLOQ was > 14:1 for all compounds. Excellent comparison was found with the reference LC-MS/MS method established in Department of Laboratory Medicine and Pathology, Mayo Clinic using 20 patient samples and covering the reportable range. Deming regression analysis gave a range of slopes (0.672 to 1.147) and correlation coeffi cients (r= 0.989 to 0.998).Conclusions: Our laboratory developed and validated a selective, sensitive, reproducible and robust analytical method for therapeutic monitoring of corticosteroids in human serum by combining a selective SPE for sample preparation with a highly sensitive LC-MS/MS analysis.
A-436
Antiarrhythmic Drugs Reverse Bath Salts Induced Tachycardia In Vivo
T. J. Pitcher, H. A. Jortani, W. W. Tucker, H. A. Jortani, T. Kampfrath, S. A. Jortani. University of Louisville, Louisville, KY
Introduction: Designer stimulant drugs are an emerging public health problem that is confounded by the lack of rapid diagnostics and specifi c treatment regiments. Among the many types of designer drugs on the market, synthetic cathinones (“bath salts”) have become increasingly popular. Typically bath salts are consumed by insuffl ation, ingestion or application to mucous membranes and are known to cause severe adverse effects including tachycardia, hypertension and respiratory distress. However, little is known regarding pharmacodynamic properties of bath salts in humans, specifi cally regarding their cardiogenic effects. The objective of this study was to evaluate the effects of bath salts on the hearts of Daphnia magna and determine if elevations in heart rate could be reversed using antiarrhythmic drugs. We hypothesize that cathinones will signifi cantly increase the heart rate of daphnia, but this effect will be reversed using antiarrhythmic drugs.Methods: The physiologic effects of three synthetic cathinones (provided by UTAK Laboratories Inc.) were evaluated using the D. magna heart rate model. D. magna have a myogenic heart similar to vertebrates and have been used as a bioassay to evaluate effects of various compounds on heart rate and environmental toxicity. The drugs mephedrone, 3,4 methylenedioxypyrovalerone (MDPV) and methylone were evaluated. Additionally, antiarrhythmic drugs (Diltiazem and Verapamil) were also characterized and used to determine if they could counteract the tachycardia caused by synthetic cathinones. Briefl y, D. magna were incubated for 30 seconds in a solution containing multiple concentrations of cathinones (0.14-141 μM), antiarrhythmic drugs (0.4-2.9 μM), and combinations of the two drugs. Following exposure, groups of fi ve D. magna were transferred to slides and the heart rates were determined using a video microscopy and subsequent time-delayed video analysis. The effective concentration required to affect the heart rate 50% (EC50) were determined and the t-test was used to demonstrate signifi cant changes.Results: Dose-response analysis of fi ve concentrations of bath salts demonstrated that the cathinones were able to signifi cantly increase the heart rate of D. magna by 150% from 310 to 451bpm, with an EC50 of 1.9 μM. However, increasing concentrations of the cathinones above 14 μM did not signifi cantly increase the heart rates, indicating saturation of the cardiac receptors. In contrast, antiarrhythmic drugs such as Verapamil exhibited the opposite effect, decreasing the heart rate by 50% from 310 to 158bpm,
with an EC50 of 1.5 μM. When the D. magna were exposed to the 14 μM of a mixture of cathinones, followed by treatment with 2.1 μM Verapamil, the tachycardia caused by the cathinones was signifi cantly reduced from 451 to 326 (P<0.05).Conclusions: This study demonstrated that synthetic cathinones have a dose dependent effect on cardiac function and signifi cantly elevate heart rate. Conversely, calcium channel inhibiters such as Verapamil depress heart rate in a dose dependent manner. Tachycardic effects of cathinone exposure in D. magna were alleviated by treatment with Verapamil. Overall, these results show that the symptoms of cathinone exposure can be treated by antiarrhythmic drugs.
A-437
Validation of the CATACHEM enzymatic ethylene glycol assay on the Roche COBAS c501.
S. Melito, M. O. Carayannopoulos. UMDNJ-RWJ Medical School, New Brunswick, NJ
Background: Accidental or intentional ingestion of ethylene glycol, a component of anti-freeze, can be fatal if not treated promptly. While the parent compound is relatively nontoxic, metabolism of this organic molecule by alcohol dehydrogenase results in the formation of toxic metabolites, including oxalic acid and glycolic acid. Within hours, accumulation of these toxins can result in organ dysfunction, the most signifi cant being kidney failure. In cases of suspected ethylene glycol intoxication, treatment with drugs such as fomepizole, which inhibits metabolite production by saturating alcohol dehydrogenase, is implemented until confi rmation of ingestion is determined. Traditionally, measurement of ethylene glycol and its toxic metabolites required relatively sophisticated methods such as gas chromatography (GC) and/or mass spectrometry (MS). Often not readily available, institutions are obligated to send this testing out resulting in signifi cant delay. Assays using enzymatic methods are available but have historically been compromised by poor specifi city. Recently, adaptation of a commercial enzymatic assay for automated chemistry analyzers was reported. Modifi cations were made to the method application to eliminate cross reactivity and optimize use on the Hitachi 917 and Olympus AU400. We describe validation of this modifi ed method on another automated chemistry analyzer, the Roche COBAS c501.Methods: The Catachem ethylene glycol method utilizes the bacterial enzyme, glycerol dehydrogenase, to catalyze the oxidation-reduction reaction of ethylene glycol in the presence of NAD. This two-point kinetic procedure is read at 340nm and the increase in absorbance is directly proportional to the concentration of ethylene glycol. Method parameters as provided by the manufacturer were added as an open channel application on the Roche COBAS c501. To validate the performance of this assay, pooled plasma recovered from discarded patient specimens was spiked with reagent grade ethylene glycol at concentrations ranging from 5 mg/dL to 500 mg/dL. Correlation studies were performed against a previously validated method, which utilizes gas chromatography, coupled with fl ame ionization detection (GC-FID). Recovery experiments, linearity determination, and imprecision studies were performed using these spiked specimens. Additionally, interference studies were performed by spiking propylene glycol, 1, 2-butanediol, and ethanol into pooled plasma at concentrations ranging from 5 - 300 mg/dL.Results: Correlation of the Catachem enzymatic assay compared to GC-FID revealed acceptable agreement between the two methods (y = 0.837x + 7; r2 = 0.991). The linear range was confi rmed from 2 - 250 mg/dL and the within run imprecision expressed as a coeffi cient of variation was calculated to be 4.50%, 1.54% and 1.22 % at mean concentrations of 7.8 mg/dL, 64.1 mg/dL, and 224.8 mg/dL, respectively. Interference studies were preformed with propylene glycol, 1,2-butanediol, and ethanol, and found to cause minimal inference in this assay.Conclusion: Taken together, these data support the use of this assay as an alternative to traditional, high complexity methods for the measurement of ethylene glycol. Implementaion of this assay at a large urban hospital would decrease delay in confi rmation of ethylene glycol ingestion directly impacting patient care and management.

TDM/Toxicology/DAU Tuesday, July 30, 9:30 am – 5:00 pm
CLINICAL CHEMISTRY, Vol. 59, No. 10, Supplement, 2013 A131
A-438
Development of a gas chromatography-mass spectrometry (GC-MS) -based qualitative “bath salts” assay in urine
L. Liu1, S. Giannoutsos1, A. Karunamurthy1, J. A. Rymer1, R. Venkataramanan2, K. Tamama1. 1University of Pittsburgh School of Medicine, Pittsburgh, PA, 2University of Pittsburgh, Pittsburgh, PA
Background: “Bath salts” refer to the new emerging stimulant drugs that contain synthetic cathinones. They are the latest addition to the list of abuse drugs and are gaining popularity. At present more than 100 compounds have appeared on the underground market and have caused acute toxicity and even death. Due to the lack of standard screening methods for these compounds, it is important for clinical toxicology laboratories to develop accurate screening methods to detect these drugs. The aim of this study is to develop and evaluate a urinary gas chromatography-mass spectrometry (GC-MS) test for common constituents of “bath salts” in our clinical toxicology laboratory.Methods: Pyrovalerone, methylone, methedrone, butylone, 3-fl uoromethcathinone and 4-fl uoromethcathinone obtained from Cayman Chemical (Ann Arbor, MI) were used in this study. Blank urine samples spiked with 5, 50, 500, and 5000 ng/mL of these compounds underwent liquid-liquid extraction with activated charcoal and methylene chloride under neutral and alkaline conditions. Derivatization of amine with pentafl uoropropionic anhydride (PFPA) and ethyl acetate was performed at 70 C for 20 minutes. The samples were then evaporated under nitrogen gas fl ow and redissolved in methanol before injection. Chromatography separation was carried out on an Agilent HP-5MS capillary GC column (30 m x 0.25 mm x 0.25 μm). The GC was operated in splitless injection mode with inlet temperature of 250 C and a fl ow rate of 1 ml/min. Analytes were detected on an Agilent Technologies 5975 mass spectrometer operated in full scan using electron ionization. Total run time was 42.75 minutes. Compounds were identifi ed through spectral match by using Mass Spectra of Designer Drugs 2012 (Wiley, Hoboken, NJ) and Cayman Spectral Library (Cayman Chemical). Results: The limit of detection of each compound with and without derivatization was defi ned in this system. Butylone, methylone, methedrone, 3-fl uoromethcathinone and 4-fl uoromethcathinone were detected at 500 ng/mL without derivatizatin and at 50 ng/mL with derivatization. Pyrovalerone was detected at 50 ng/mL with and without derivatization. The retention time of each compound is distinguishable from common urinary constituents, such as urea or creatinine. None of these six compounds had cross reactivity with in-house EMIT II immunoassay of amphetamine and other drug screens. These drugs are also shown to be stable in urine samples. With this GC-MS-based platform, we were able to identify methylone without derivatization in a patient urine sample.Conclusion: A qualitative GC-MS screening method for bath salts in urine was developed and evaluated. Using this method, “bath salts” in patient urine samples can be detected at clinically relevant concentrations. This will provide valuable information regarding the usage and clinical effect of these new abuse drugs.
A-439
Predicted ability of dosage rate-dependent reference ranges for urine hydrocodone measurements to distinguish between results from different dosage rates
L. J. McCloskey, D. F. Stickle. Jefferson University Hospitals, Philadelphia, PA
Background: Quantitative urine testing to assess pain medication prescription compliance is not well established. Couto et al. [J Clin Pharm Ther 2011;36:200-7] measured distributions of urine concentrations of hydrocodone from among volunteers given hydrocodone in dosage rates of 20 (A), 60 (B) and 120 (C) mg/d. These data are useful in establishing central 95% reference ranges for urines from these three basis dosage rates. We evaluated additionally the extent to which reference ranges for these groups could exclude results derived from alternative dosage rates.Methods: Urine concentration distributions for A-C were well fi tted by log-normal distributions using a log scale median (xm) and a log scale standard deviation (s) (r2>0.99). Both xm and s were linear with hydrocodone dosage rate (R, mg/d) on a log scale: xm = 0.9327 log(R) + 2.341 (r2 = 0.9984) (Eqn.1); s = -0.1151 log(R) + 0.3492 (r2 = 0.9898) (Eqn.2). Using Equations 1 and 2, predicted urine hydrocodone distributions for arbitrary dosage rates other than A, B or C were calculated. As a
function of presumed alternative hydrocodone dosage rates, overlaps of the predicted distributions with central 95% reference ranges for basis dosage rates A-C were calculated.Results: See Figure. Using curve B as an example (basis dosage rate = 60 mg/d): for an alternative dosage rate of 150 mg/d, approximately 20% of the predicted urine concentration distribution is still within (overlaps with) the central 95% reference range of the basis distribution. For all three basis dosage rates A-C, an alternative higher dosage rate that is at least 2-fold greater is required before exclusion (non-overlap) of at least 80% of the predicted urine concentration distribution occurs.Conclusions: Predicted overlaps of distributions as in Figure should enable clinicians to judge whether capabilities of quantitative urine hydrocodone testing to discriminate between varying dosage rates are adequate to meet intended clinical objectives.
A-440
2011 Detroit Area Survey of “Spice” Products
J. M. Wilson1, J. Bargeon2, K. S. Leonard1, M. P. Smith1. 1William Beaumont Hospital, Royal Oak, MI, 2Children’s Hospital of Michigan Poison Control Center, Detroit, MI
On November 24, 2010 the Drug Enforcement Administration (DEA) listed JWH-018, JWH-073, JWH-200, CP-47,497 and CP-47,497 C8 as temporary Schedule I substances [75 FR 71635]. These entities, frequently identifi ed as “Spice” and “K2” were developed as agonists at human endocannabinoidCB-1 and CB-2 receptors. Promoted as “legal highs”, products of this type consist of vegetation to which has been added an application of a single or multiple chemical(s). In the summer of 2011 we undertook a survey of samples acquired in the Detroit Metropolitan area to assess the impact of the federal law. The results of this survey are displayed in table 1. Analysis was conducted on a Hewlett-Packard 5972 MSD equipped with a DB-5 MS, 30 m. capillary column with 0.25 mm id with a 0.25 micron fi lm thickness. Samples were prepared by immersing a product portion in methanol and injecting 1 L of supernate after centrifugation. Of note is the absence of a controlled substance, the frequent presence of AM-2201(9 of 12) and that four of the products contained multiple substances. A review of the literature provided estimates of affi nity constants at the CB-1 receptor for Tetrahydrocannabinol (THC), JWH-018, JWH-073, JWH-200 and CP-47,497 as 41.0, 9.0, 8.9, 42.0, and 9.5, respectively. Affi nity constants, in parentheses, for the six synthetic chemicals identifi ed were JWH-081 (1.2), JWH-122 (0.7), JWH-210 (0.5), AM-2201 (1.0), and AM-2233 (1.8) indicating that the post-regulatory group of products were, at minimum, more than twenty times more potent than THC and at least fi ve times more potent than the strongest of the scheduled substances.

Tuesday, July 30, 9:30 am – 5:00 pm TDM/Toxicology/DAU
A132 CLINICAL CHEMISTRY, Vol. 59, No. 10, Supplement, 2013
Table 1.
Comercial Synthetic CannabinoidsJWH-022 JWH-081 JWH-122 JWH-210 AM 2201 AM 2233
1 Astronaut Fuel 1 (Silver) X2 Astronaut Fuel 1 (White) X3 Bayou Blaster X X4 Diesel 3G X5 Ed Hardy X6 Funky Green Stuff X X X7 Kamel K2 X8 Legal Devil X9 Loud! X10 Professor’s Choice X11 Sonic Boom X X X12 Super Kush X X X X
A-441
Development of a Highly Sensitive Polyclonal Antibody for the Determination of Carbamazepine, Oxcarbazepine and Associated Active Metabolites
J. Frew, S. Savage, P. McClintock, M. E. Benchikh, P. Lowry, R. I. McConnell, S. P. Fitzgerald. Randox Laboratories Limited, Crumlin, United Kingdom
Introduction: Carbamazepine (CBZ) and oxcarbazepine are anti-convulsant and mood-stabilising drugs which are prescribed for the treatment of various conditions, including anxiety, attention-defi cit disorder, bipolar disorder, schizophrenia and epilepsy. Carbamazepine is metabolised mainly to carbamazepine -10,11-epoxide (CBZ-E), 10,11-dihydro-10-hydroxycarbazepine (10-OH-CBZ) and the major urinary excretory product: 10,11-dihydro-10,11-dihydroxycarbazepine (10,11-diOH-CBZ). The therapeutic range is reported as 2-10μg/ml for total carbamazepine (free and protein bound) and 0.5-3.6μg/ml for free carbamazepine. The corresponding toxic values are given as greater than 12μg/ml and 4μg/ml, respectively. Toxic concentrations can provoke drowsiness, headaches, affect motor function and in extreme cases are fatal. Given this narrow therapeutic index allied to inter-patient variability in drug-responsiveness, it is extremely important to monitor the levels of the active drug in the patient’s serum during treatment to allow physicians to tailor treatments for each individual patient. Oxcarbazepine rapidly metabolises to 10-OH-CBZ and is also considered a candidate for Therapeutic Drug Monitoring (TDM).Relevance: The aim of this study was to develop a highly sensitive polyclonal antibody suitable for the determination of carbamazepine, oxcarbazepine and associated active metabolites. This is relevant for the development of effi cient immunoassays for applications in TDM.Methodology: Carbamazepine was conjugated to bovine thyroglobulin (BTG) as a carrier. Adult sheep were immunized with the resulting immunogen on a monthly basis to provide target-specifi c polyclonal antisera. Immunoglobulin fraction was extracted and evaluated via competitive enzyme-linked immunosorbent assay (ELISA). The absorbance was read at 450nm.Results: The assay was standardized to carbamazepine and the specifi city of the developed polyclonal antibody, expressed as % cross-reactivity, was: 299% (Oxcarbazepine), 68.3% (CBZ-E), 67.4% (10-OH-CBZ) and 14% (10,11-diOH-CBZ). It did not cross-react with amitriptyline (<1.1%) or imipramine (<1.1%). The sensitivity, expressed as half maximal inhibitory concentration (IC50), was 2.135ng/ml (calibration range: 0-200ng/ml).Conclusion: Data indicates that the developed antibody is suitable for the detection of carbamazepine, oxcarbazepine and associated active metabolites and is highly sensitive. This is relevant for the development of immunoassays for the detection of these compounds in therapeutic drug monitoring.
A-442
Development of UPLC-Visible Light Detection Method for Serum Rifampin Quantifi cation
D. Li, M. Pudek. Vancouver General Hospital, Vancouver, BC, Canada
Introduction: Tuberculosis (TB) is known as the world’s second largest killer due to either bacteria or virus. In order to combat antibiotic resistance the treatment for TB involves a strict 6-9 month regiment of multiple-drug therapy. Rifampin along with isoniazid, pyrazinamid and ethambutol are fi rst-line antibiotics. The therapeutic
range of rifampin is 8 - 24 mg/L 2 h after oral dose. It has been reported that over 70% of patients have plasma/serum levels lower than 8 mg/L. Therefore therapeutic monitoring is desirable.Objective: To develop a UPLC method for quantifi cation of serum rifampin. To study sample stability and reagent stability.Methods: Rifampin standards were prepared in pooled serum free of anti-TB drugs. Serum sample was prepared by protein precipitation with acetonitrile in a 1:3 (serum: acetonitrile) ratio in the presence of internal standard rifapentine (2 μg). Ten micro liters of the extracts was injected into Waters ACQUITY UPLC H-Class System. Rifampin and internal standard in the extracts were resolved by Waters ACQUITY UPLC column (HSS T3, 50 x 2.1 mm, 1.8 μm) with isocratic elution (45% mobile phase B methanol; mobile phase A: 50 mM KH2PO4, 3 mM H3PO4, pH 2.6) at column temperature 25oC, fl ow rate 0.695 mL/min, and detected at λ 480 nm. Total run time was 3 minutes. L-ascorbic acid (fi nal concentration of 0.5 mg/mL) was added to the reagent rifampin to prevent oxidation. To stabilize rifampin, the protein-free extracts were reconstituted in a buffer with composition similar to mobile phase except at neutral pH 7.0.Results: Three wave lengths 254, 336 and 480 nm were tested. The 480 nm was chosen due to its clean background absorbance, even though it gave the lowest peak height/area. The absorbance in peak area of reagent rifampin solution containing ascorbic acid decreased by 10% after 2 months at -20oC. Whereas the absorbance in peak area of internal standard rifapentinen solution decreased by 10% after only 3 weeks in the absence of ascorbic acid. The rifampin concentration in patient serum samples decreased by 12% after 3 weeks at -20oC. The serum rifampin assay was linear from 1 - 100 mg/L. CV was 4.5% at 1 mg/L (n = 11). At 10 and 25 mg/L, within-run CVs (n = 10) were 3.5% and 2.5%, and between-run CVs (n = 7) 5.2% and 3.8%, respectively. Recovery study was done by spiking two patients’ serum samples with two levels of pure rifampin and analysis was done in quadruplicate. The recovery was 95% at 10 mg/L and 112% at 20 mg/L. Close correlation was found with a commercial reference lab’s HPLC method (x): y = 1.0431x - 0.0389, R2 = 0.9898, n = 15.Conclusion: UPLC-Visible light detection is a sensitive, accurate, and reliable method for therapeutic monitoring of rifampin. The stock solutions of rifampin and internal standard rifapentine should be stored at -20oC with ascorbic acid as preservative. These reagent solutions are stable for 2 months, and patient serum samples are stable at -20oC for 3 weeks.
A-444
A TFLC-MS/MS Method for Quantitation of Hydroxychloroquine in Serum and Whole Blood
A. K. Fuezery, A. Breaud, W. A. Clarke. Johns Hopkins Medical Institutions, Baltimore, MD
Background: Hydroxychloroquine (HQ) is routinely used in managing systemic lupus erythematosus and rheumatoid arthritis. HQ is administered orally as 200 mg or 400 mg of the racemic sulfate salt. These regimens may not be optimal for all patients, however, as reports suggest marked pharmacokinetic variability for HQ. Multiple studies have been carried out on HQ blood levels and clinical effect. Two early, serum-based studies reported confl icting results but later studies on whole blood suggested that the two parameters may be related. Because HQ distributes preferably into red blood cells, the discrepant results in serum-based studies were attributed to sample hemolysis and differences in the elapsed time between specimen collection and processing. However, defi nitive evidence that supports these assumptions is lacking and it is equally plausible that the discrepancies were due to the small study populations and poorly characterized assays used in the studies. We present a robust assay for HQ that is well-suited to further investigate the implications of using serum versus whole blood HQ levels in clinical practice.Methods: HQ and its internal standard HQ-d4 (both from Toronto Research Chemicals) were extracted from whole blood or serum by injecting the supernatant from a protein precipitation step onto a Cyclone TFLC column (Thermo Fisher Scientifi c). Subsequent separation was achieved on a HypersilGold C8 analytical column (Thermo Fisher Scientifi c) using water and methanol with 0.1% formic acid and 10 mM ammonium formate. Analytes were detected over a 6.83 minute run time using a TSQ Quantum Vantage tandem mass spectrometer (Thermo Fisher Scientifi c) with a heated electrospray-ionization source in positive ionization mode. For HQ the collision energy was 20 V and the m/z 336.2 > 247.1 transition was monitored; for HQ-d4 the collision energy was 21 V and the m/z 340.2 > 251.1 transition was monitored.

TDM/Toxicology/DAU Tuesday, July 30, 9:30 am – 5:00 pm
CLINICAL CHEMISTRY, Vol. 59, No. 10, Supplement, 2013 A133
Results: Analytical performance for whole blood and serum samples was very similar. Linearity was observed from 15.7 to 2000 ng/ml for both sample types. Total imprecision for whole blood HQ at 50 ng/ml, 500 ng/ml, and 1500 ng/ml was 9.6%, 8.7%, and 8.5%, respectively; total imprecision for serum at the same concentrations was 2.6%, 1.9%, and 2.0%, respectively. Accuracy at these concentrations was within ± 15% for both sample types. The lowest HQ concentration that resulted in a CV of 20% was 3.6 ng/ml for whole blood and 6.0 ng/ml for serum. Based on these values and the linearity of the method, the lower limit of quantitation was designated as 15.7 ng/ml for both sample types. The extraction effi ciency and matrix factor for whole blood were 73% and 101%, respectively; for serum they were 103% and 101% respectively.Conclusions: We developed a robust and rapid TFLC-MS/MS method for the quantitation of HQ in whole blood and serum. The method shows similar analytical performance for both sample types. We are currently using the method to quantify HQ in paired whole blood and serum samples with the goal of rigorously and systematically evaluating the relationship between HQ levels in these sample types.
A-445
Analytical Performance of the SYVA EMIT 2000 Tacrolimus Assay on the Beckman DxC 800.
J. Arias-Stella, C. Feldkamp, J. Zajechowski, L. Stezar, V. I. Luzzi. Henry Ford Hospital, Detroit, MI
Background: Tacrolimus is an immunosuppressant used for prevention of organ rejection on transplant patients. It inhibits T-lymphocyte activation by binding to intracellular proteins and complexes to inhibit calcineurin phosphatase activity. Because high levels of this compound may be toxic and low levels inadequate to avoid organ rejection, therapeutic drug monitoring is essential for patient care. We investigated the analytical performance of SYVA EMIT 2000 Tacrolimus assay adapted for the Beckman DxC 800 in an effort to decrease the turn-around-time for results (TAT).Methods: The Beckman SYVA EMIT 2000 Tacrolimus assay is a homogenous competitive immunoassay with spectrophotometric detection performed on pre-treated specimens. Correlation with a predicate method, imprecision, linearity and functional sensitivity were examined using human or commercially available whole blood specimens. We use liquid chromatography/mass spectrometry (LC/MS) as the predicate method for validation. For imprecision, commercially available control materials at 5.4, 12.3, and 27.6 ng/mL were used (n=14 for levels 1 and 2; n=8 for level 3). The data were analyzed using Microsoft Excel or EP Evaluator. The TAT was measured from the time the specimen arrived to the laboratory to the time the results were available in the electronic medical record.Results: Correlation with LC/MS demonstrated a slope of 0.93, and a correlation coeffi cient of 0.96 (n= 19) (fi gure). Imprecision (coeffi cient of variation, CV (%)) was 15.2% at 5.5 ng/mL, 7.1% at 12.7 ng/mL, and 5.3% at 27.8 ng/mL. Average percent recovery between 2 ng/mL and 30 ng/mL was 100.4%. The functional sensitivity was 2 ng/mL. A precision profi le showed a CV < 20% at 2 ng/mL. The average TAT decreased from 24 hours to less than 4 hours.Conclusions: The Beckman SYVA EMIT 2000 Tacrolimus assay analytical performance is within acceptable limits and enables the laboratory to offer a short TAT to support the current needs of our inpatient population.
A-446
Analytical validation studies of a 5-fl urouracil assay; the use of the Siemens Advia® 1800 for personalized medicine in oncology.
A. Teggert1, J. Dowd1, G. D. Lundell2, J. B. Courtney2, I. Baburina2, S. J. Salamone2. 1James Cook University Hospital, Middlesbrough, United Kingdom, 2Saladax Biomedical, Inc., Bethlehem, PA
Introduction: Despite its 50 year history of use in the treatment of solid tumor cancers, the chemotherapeutic agent 5-fl uorouracil (5-FU) remains the foundation drug in treatment regimens for colorectal cancer. The addition of other agents and changes in protocols has resulted in incremental improvements in treatment outcomes over the years, and now the focus on personalized medicine bring yet another opportunity for even better and cost-effective patient care. It has been demonstrated in phase II and III clinical studies that patient outcomes can be improved when 5-FU dosing is personalized to achieve target systemic exposure through the use of therapeutic dose management (TDM) to measure 5-FU plasma concentration levels. These studies were performed using physical methods to quantitate 5-FU. The country specifi c availability of a 5-FU immunoassay gives clinical laboratories the potential to provide this important test in routine clinical settings. Objective: Validation of the Saladax Biomedical, Inc.(SBI) My5-FU® assay on the Siemens Advia 1800. Methods: My5-FU is a homogenous, two-reagent, immunoassay based on nanoparticle agglutination. CLSI protocols and established procedures were used to evaluate precision, linearity, accuracy, sample carry-over and onboard reagent and calibration stability. Repeatability was tested on two days, n=20 for low, medium QC material and two plasma pools spiked with 5-FU. Within-laboratory (total) precision was evaluated with high, medium and low controls according to CLSI EP15-A. In the method comparison 50 clinical samples were run in duplicate over two days. Results were compared to the Beckman AU400® system, which had been previously validated for accuracy by comparison to a validated LC-MS/MS method. The My5-FU kit, and patient samples and pools were provided by SBI. Results: Within-run repeatability had coeffi cients of variation (CV) of 4.7% and 4.5% for the low control (228ng/mL) and patient pool 1 (241ng/mL) and 2.2% for the medium control (465ng/mL) and 1.9% for patient pool 2 (712ng/mL). The CV for the total precision was 4.3%, 2.9%, and 1.4% for the low (228ng/mL), medium (466ng/mL) and high (903ng/mL) controls respectively. The assay was linear throughout the test range (86-1800ng/mL): all mean results were within ±9% of the assigned values (median deviation -1.6%), the CV on the replicates was ≤5% (median 1.2%). The regression line through the points deviated <6% (median 0.0%) demonstrating clinical linearity. The method comparison to the AU400 performance resulted in a Deming regression with a slope =0.995, an intercept =26.2 ng/mL and R=0.9964. Analysis detected no outliers within or between methods. The calibration and onboard stability was demonstrated at 32 days. Sample carry-over testing showed no positive bias. All tests passed the manufacturer’s performance specifi cations. Conclusion: Instrument specifi c performance characteristics were validated on the Siemens Advia 1800. The precision, linearity, accuracy of the Saladax Biomedical, Inc. My5-FU immunoassay were comparable to the validated performance on the Beckman AU400 system. The assay is convenient with onboard and calibration

Tuesday, July 30, 9:30 am – 5:00 pm TDM/Toxicology/DAU
A134 CLINICAL CHEMISTRY, Vol. 59, No. 10, Supplement, 2013
stability of at least a month. With excellent precision and accuracy of this application the Advia 1800 could be employed to provide results for the dose adjustment of 5-FU and potentially improve patient outcomes.
A-447
Ultrafast Quantitative Analysis of Benzodiazepines and Buprenorphine in Urine Using High-Throughput SPE/MS/MS
N. Parikh, M. Youssef, M. Romm, K. Schlicht, V. Miller, W. LaMarr, C. Ozbal. Agilent Technologies, Wakefi eld, MA
Introduction: Law Enforcement offi cials, employers and pathologists use forensic drug screening extensively today. The steady increase in sample volume has led to the need for greater analytical capacity within forensic toxicology laboratories, placing a strain on traditional technologies like GC/MS or LC/MS. In the present study, we evaluated the ability of an ultrafast SPE/MS/MS system to quantitatively measure a panel of benzodiazepines or Buprenorphine/Norbuprenorphine in urine at low ng/ml concentrations, with sample cycle times of <15 seconds per sample. Accuracy, precision, and linearity results achieved with this ultrafast SPE/MS/MS were comparable to LC/MS/MS at rates faster than 20-30 fold.Methods: Blank matrix containing internal standard was spiked with the analytes of interest in a range of concentrations to prepare a calibration curve. The benzodiazepine panel consisted of: Oxazepam, Temazepam, Lorazepam, Nordiazepam, 7-Amino Clonazepam and Alpha-hydroxy Alprazolam. Benzodiazepine samples were subjected to enzymatic hydrolysis followed by centrifugation and then diluted (1:50) with water. Buprenorphine/Norbuprenorphine samples were extracted by an offl ine solid phase extraction procedure using 96 well SPE plates, dried down and reconstituted in 5% methanol in water. Analysis of all samples was performed at a rate of <15 seconds per sample using a RapidFire High-throughput Mass Spectrometry system coupled to a triple quadrupole mass spectrometer. Online SPE methods were optimized for each analyte.Results: The analytes in the benzodiazepine panel had good linearity within the measured range of 50-12,500 ng/ml with an R^2 value greater than 0.99. Intra- and interday accuracies for all concentrations were within 15% and intra- and interday precision was within 10%. A robustness test comprising of 2000 sequential injections of the same samples on a single SPE cartridge revealed a CV of less than 10% with no changes to peak signal or SPE cartridge pressure. No signifi cant carry-over was seen for any of the benzodiazepine analytes. Buprenorphine/Norbuprenorphine standard curves also had excellent linearity within the measured range (2.5-400 ng/mL) with an R^2 value greater than 0.995. Quality controls were analyzed to obtain interday and intraday precision and accuracy values. Accuracies were determined to be within 10 % and CV values were all less than 5 % for concentrations within the measured range. Blinded samples will be evaluated to further validate these methods. The linearity, accuracy and precision results from SPE/MS/MS analysis are comparable to those from traditional LC/MS/MS, but at 20-30 fold the throughput. With sample to sample analysis speeds of 240 samples per hour.Conclusions: Benzodiazepines and Buprenorphine/Norbuprenorphine can be quantifi ed accurately and precisely with an ultrafast SPE/MS/MS system capable of analyzing >240 samples per hour. These results are comparable to LC/MS/MS, but at 20-30 fold the throughput. This ultrafast SPE/MS/MS method is a faster and more effi cient alternative to traditional LC/MS/MS methodology.
A-448
Implementation of secondary quality control measures in a dried blood spot assay for immunosuppressants
J. A. Dickerson, K. Sadilkova, B. Busby, R. M. Jack. Seattle Children’s Hospital, Seattle, WA
Background: Therapeutic drug monitoring of immunosuppressive drugs is important in achieving and maintaining correct levels in transplant patients. We developed and validated a liquid chromatography-mass spectrometry (LC-MS/MS) assay for simultaneous quantitation of tacrolimus (TaC), sirolimus (SrL), and cyclosporin A (CsA) in dried blood spots (DBS) collected remotely by patients and mailed into the laboratory. Assessment of accuracy is a primary concern, given that standards and control material both need to be made in the laboratory performing the test, as there is no commercial source for DBS calibration material. We have implemented a unique approach to quality control using real-time patient comparison samples with our whole blood assay.
Methods: To prepare DBS from whole blood, standards, quality controls, and patient samples were gently well-mixed and 50 μL of blood was immediately spotted by volumetric pipette onto the center of the printed circle on the Whatman 903 DBS cards. Discs were punched from the DBS cards with an 8 mm punch into 2 mL microcentrifuge tubes. 150 μL of working IS solution containing 0.01 M ZnSO4 was added. The sample was then mixed on a MixMate mixer for 20 minutes at 2000 rpm. After extraction, samples were analyzed by LC-MS/MS in multiple reaction monitoring mode. Dried blood spots were prepared weekly from whole blood patient specimens for daily quality assurance comparisons.Results: The assay was linear between 1.2-40 ng/mL for TaC and SrL, and 30-1000 ng/mL for CsA. Inter- and intra-assay precisions showed coeffi cient of variation ≤ 14.8% for all three drugs. This method correlated well with the existing clinical whole blood assay, with coeffi cients of determination greater than 0.95 for all three drugs. DBS quality control samples were stable for at least 30 days up to 25 oC. Stability of patient DBS samples was at least 5 days at temperatures up to 60 oC, except for SrL where degradation was observed at 60 oC within 24 hrs. No effect of hematocrit level, blood spot volume or punch location was observed. Percent deviation was calculated for comparison of whole blood/DBS specimens. The average % deviation was 5.8%, -0.9%, and 1.2% for tacrolimus, sirolimus, and cyclosporin, respectively.Conclusion: Immunosuppressant drug levels measured in DBS correlate well with a whole blood LC-MS/MS assay. Assay drift was more effectively monitored by comparing whole blood and DBS values with every run. A quality assurance program that includes ongoing whole blood/DBS comparisons in addition to routine quality control is recommended.
A-449
ARK™ Posaconazole Assay for the Roche/Hitachi 917 Analyzer
S. Oh, J. Valdez, B. Moon. ARK Diagnostics, inc, Fremont, CA
Background: Posaconazole (PSZ) is a triazole antifungal used for prophylaxis in high-risk hematology-oncology patients and in the treatment of invasive aspergillosis. A concern with immunocompromised patients is the wide range of exposures to PSZ, while PSZ concentrations correspond with prophylactic effi cacy. Bioavailability of PSZ varies due to saturable oral absorption, which is infl uenced by poor dissolution and intestinal pH. Coadministration with food increases PSZ bioavailability by up to 4-fold; conversely, medications such as proton pump inhibitors have been shown to signifi cantly decrease PSZ exposure due to increased gastric pH. Low PSZ concentrations have been commonly reported in clinical practice. A quantitative homogeneous enzyme immunoassay intended for the quantitative determination of PSZ in human serum or plasma has been developed for routine therapeutic drug monitoring.Methods: The ARK Posaconazole Assay is a liquid-stable, homogeneous enzyme immunoassay. The assay system consists of two reagents, 6 calibrators containing PSZ in a synthetic matrix (0.00, 0.50, 1.50, 3.00, 6.00 and 12.00 μg/mL), and tri-level controls. Performance of the assay was evaluated on the Roche/Hitachi 917 analyzer. Limit of detection, 5-day precision (N = 40; CLSI guideline EP15-A2) at 1.00 μg/mL, 5.00 μg/mL and 10.00 μg/mL, specifi city and recovery were studied.Results: The assay detected PSZ well at low concentrations, 0.33 μg/mL ± 0.02. Within-run precision ranged from 1.7 to 3.1 %CV and total precision ranged 3.2 to 4.7 %CV. No signifi cant interference was observed with other antifungal drugs such as fl uconazole, itraconazole, and voriconazole. The assay accurately recovered spiked PSZ samples throughout the assay range. Simulated specimens were prepared by supplementing individual serum samples with PSZ at concentrations throughout the range. Observed measurements were compared to spiked values by Passing Bablock regression: y = 0.97x + 0.03; correlation coeffi cient (r²) of 0.97.Conclusion: The ARK Posaconazole Assay measured PSZ in human serum with excellent precision at low concentrations. Ability to measure trough levels of PSZ accurately and with fast turn-around time will enable clinically useful, routine monitoring of PSZ.
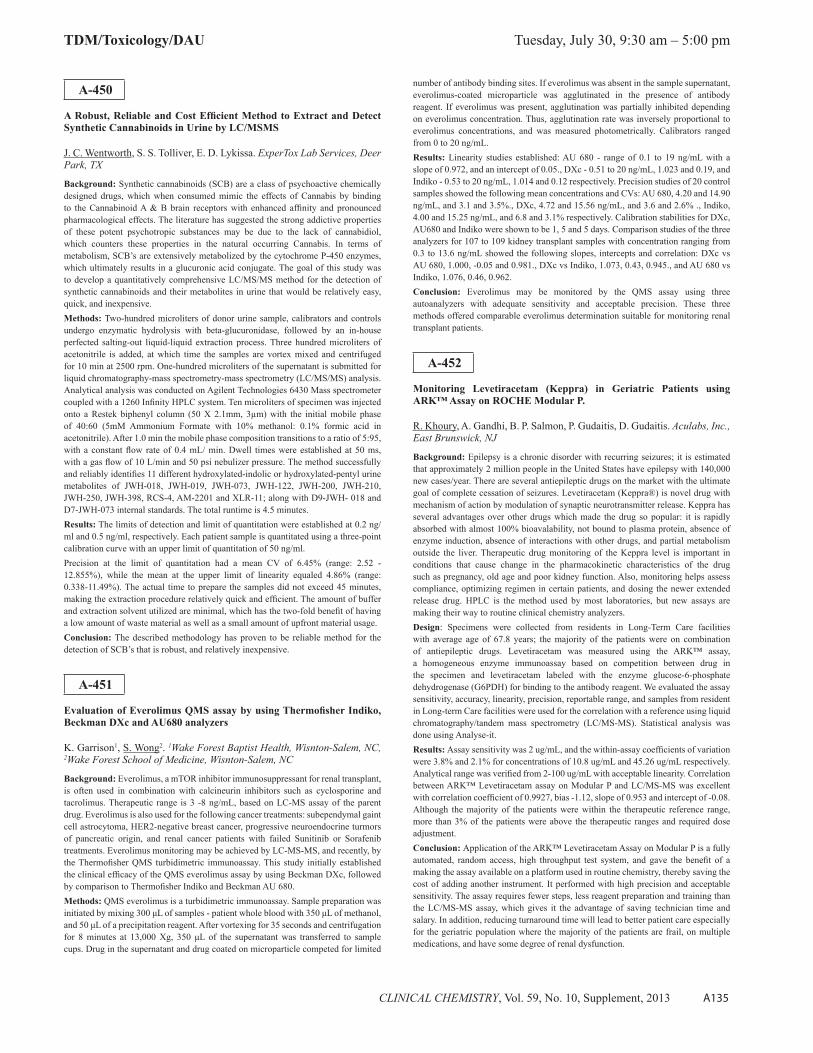
TDM/Toxicology/DAU Tuesday, July 30, 9:30 am – 5:00 pm
CLINICAL CHEMISTRY, Vol. 59, No. 10, Supplement, 2013 A135
A-450
A Robust, Reliable and Cost Effi cient Method to Extract and Detect Synthetic Cannabinoids in Urine by LC/MSMS
J. C. Wentworth, S. S. Tolliver, E. D. Lykissa. ExperTox Lab Services, Deer Park, TX
Background: Synthetic cannabinoids (SCB) are a class of psychoactive chemically designed drugs, which when consumed mimic the effects of Cannabis by binding to the Cannabinoid A & B brain receptors with enhanced affi nity and pronounced pharmacological effects. The literature has suggested the strong addictive properties of these potent psychotropic substances may be due to the lack of cannabidiol, which counters these properties in the natural occurring Cannabis. In terms of metabolism, SCB’s are extensively metabolized by the cytochrome P-450 enzymes, which ultimately results in a glucuronic acid conjugate. The goal of this study was to develop a quantitatively comprehensive LC/MS/MS method for the detection of synthetic cannabinoids and their metabolites in urine that would be relatively easy, quick, and inexpensive.Methods: Two-hundred microliters of donor urine sample, calibrators and controls undergo enzymatic hydrolysis with beta-glucuronidase, followed by an in-house perfected salting-out liquid-liquid extraction process. Three hundred microliters of acetonitrile is added, at which time the samples are vortex mixed and centrifuged for 10 min at 2500 rpm. One-hundred microliters of the supernatant is submitted for liquid chromatography-mass spectrometry-mass spectrometry (LC/MS/MS) analysis. Analytical analysis was conducted on Agilent Technologies 6430 Mass spectrometer coupled with a 1260 Infi nity HPLC system. Ten microliters of specimen was injected onto a Restek biphenyl column (50 X 2.1mm, 3μm) with the initial mobile phase of 40:60 (5mM Ammonium Formate with 10% methanol: 0.1% formic acid in acetonitrile). After 1.0 min the mobile phase composition transitions to a ratio of 5:95, with a constant fl ow rate of 0.4 mL/ min. Dwell times were established at 50 ms, with a gas fl ow of 10 L/min and 50 psi nebulizer pressure. The method successfully and reliably identifi es 11 different hydroxylated-indolic or hydroxylated-pentyl urine metabolites of JWH-018, JWH-019, JWH-073, JWH-122, JWH-200, JWH-210, JWH-250, JWH-398, RCS-4, AM-2201 and XLR-11; along with D9-JWH- 018 and D7-JWH-073 internal standards. The total runtime is 4.5 minutes.Results: The limits of detection and limit of quantitation were established at 0.2 ng/ml and 0.5 ng/ml, respectively. Each patient sample is quantitated using a three-point calibration curve with an upper limit of quantitation of 50 ng/ml.Precision at the limit of quantitation had a mean CV of 6.45% (range: 2.52 - 12.855%), while the mean at the upper limit of linearity equaled 4.86% (range: 0.338-11.49%). The actual time to prepare the samples did not exceed 45 minutes, making the extraction procedure relatively quick and effi cient. The amount of buffer and extraction solvent utilized are minimal, which has the two-fold benefi t of having a low amount of waste material as well as a small amount of upfront material usage.Conclusion: The described methodology has proven to be reliable method for the detection of SCB’s that is robust, and relatively inexpensive.
A-451
Evaluation of Everolimus QMS assay by using Thermofi sher Indiko, Beckman DXc and AU680 analyzers
K. Garrison1, S. Wong2. 1Wake Forest Baptist Health, Wisnton-Salem, NC, 2Wake Forest School of Medicine, Wisnton-Salem, NC
Background: Everolimus, a mTOR inhibitor immunosuppressant for renal transplant, is often used in combination with calcineurin inhibitors such as cyclosporine and tacrolimus. Therapeutic range is 3 -8 ng/mL, based on LC-MS assay of the parent drug. Everolimus is also used for the following cancer treatments: subependymal gaint cell astrocytoma, HER2-negative breast cancer, progressive neuroendocrine turmors of pancreatic origin, and renal cancer patients with failed Sunitinib or Sorafenib treatments. Everolimus monitoring may be achieved by LC-MS-MS, and recently, by the Thermofi sher QMS turbidimetric immunoassay. This study initially established the clinical effi cacy of the QMS everolimus assay by using Beckman DXc, followed by comparison to Thermofi sher Indiko and Beckman AU 680.Methods: QMS everolimus is a turbidimetric immunoassay. Sample preparation was initiated by mixing 300 μL of samples - patient whole blood with 350 μL of methanol, and 50 μL of a precipitation reagent. After vortexing for 35 seconds and centrifugation for 8 minutes at 13,000 Xg, 350 μL of the supernatant was transferred to sample cups. Drug in the supernatant and drug coated on microparticle competed for limited
number of antibody binding sites. If everolimus was absent in the sample supernatant, everolimus-coated microparticle was agglutinated in the presence of antibody reagent. If everolimus was present, agglutination was partially inhibited depending on everolimus concentration. Thus, agglutination rate was inversely proportional to everolimus concentrations, and was measured photometrically. Calibrators ranged from 0 to 20 ng/mL.Results: Linearity studies established: AU 680 - range of 0.1 to 19 ng/mL with a slope of 0.972, and an intercept of 0.05., DXc - 0.51 to 20 ng/mL, 1.023 and 0.19, and Indiko - 0.53 to 20 ng/mL, 1.014 and 0.12 respectively. Precision studies of 20 control samples showed the following mean concentrations and CVs: AU 680, 4.20 and 14.90 ng/mL, and 3.1 and 3.5%., DXc, 4.72 and 15.56 ng/mL, and 3.6 and 2.6% ., Indiko, 4.00 and 15.25 ng/mL, and 6.8 and 3.1% respectively. Calibration stabilities for DXc, AU680 and Indiko were shown to be 1, 5 and 5 days. Comparison studies of the three analyzers for 107 to 109 kidney transplant samples with concentration ranging from 0.3 to 13.6 ng/mL showed the following slopes, intercepts and correlation: DXc vs AU 680, 1.000, -0.05 and 0.981., DXc vs Indiko, 1.073, 0.43, 0.945., and AU 680 vs Indiko, 1.076, 0.46, 0.962.Conclusion: Everolimus may be monitored by the QMS assay using three autoanalyzers with adequate sensitivity and acceptable precision. These three methods offered comparable everolimus determination suitable for monitoring renal transplant patients.
A-452
Monitoring Levetiracetam (Keppra) in Geriatric Patients using ARK™ Assay on ROCHE Modular P.
R. Khoury, A. Gandhi, B. P. Salmon, P. Gudaitis, D. Gudaitis. Aculabs, Inc., East Brunswick, NJ
Background: Epilepsy is a chronic disorder with recurring seizures; it is estimated that approximately 2 million people in the United States have epilepsy with 140,000 new cases/year. There are several antiepileptic drugs on the market with the ultimate goal of complete cessation of seizures. Levetiracetam (Keppra®) is novel drug with mechanism of action by modulation of synaptic neurotransmitter release. Keppra has several advantages over other drugs which made the drug so popular: it is rapidly absorbed with almost 100% bioavalability, not bound to plasma protein, absence of enzyme induction, absence of interactions with other drugs, and partial metabolism outside the liver. Therapeutic drug monitoring of the Keppra level is important in conditions that cause change in the pharmacokinetic characteristics of the drug such as pregnancy, old age and poor kidney function. Also, monitoring helps assess compliance, optimizing regimen in certain patients, and dosing the newer extended release drug. HPLC is the method used by most laboratories, but new assays are making their way to routine clinical chemistry analyzers.Design: Specimens were collected from residents in Long-Term Care facilities with average age of 67.8 years; the majority of the patients were on combination of antiepileptic drugs. Levetiracetam was measured using the ARK™ assay, a homogeneous enzyme immunoassay based on competition between drug in the specimen and levetiracetam labeled with the enzyme glucose-6-phosphate dehydrogenase (G6PDH) for binding to the antibody reagent. We evaluated the assay sensitivity, accuracy, linearity, precision, reportable range, and samples from resident in Long-term Care facilities were used for the correlation with a reference using liquid chromatography/tandem mass spectrometry (LC/MS-MS). Statistical analysis was done using Analyse-it.Results: Assay sensitivity was 2 ug/mL, and the within-assay coeffi cients of variation were 3.8% and 2.1% for concentrations of 10.8 ug/mL and 45.26 ug/mL respectively. Analytical range was verifi ed from 2-100 ug/mL with acceptable linearity. Correlation between ARK™ Levetiracetam assay on Modular P and LC/MS-MS was excellent with correlation coeffi cient of 0.9927, bias -1.12, slope of 0.953 and intercept of -0.08. Although the majority of the patients were within the therapeutic reference range, more than 3% of the patients were above the therapeutic ranges and required dose adjustment.Conclusion: Application of the ARK™ Levetiracetam Assay on Modular P is a fully automated, random access, high throughput test system, and gave the benefi t of a making the assay available on a platform used in routine chemistry, thereby saving the cost of adding another instrument. It performed with high precision and acceptable sensitivity. The assay requires fewer steps, less reagent preparation and training than the LC/MS-MS assay, which gives it the advantage of saving technician time and salary. In addition, reducing turnaround time will lead to better patient care especially for the geriatric population where the majority of the patients are frail, on multiple medications, and have some degree of renal dysfunction.
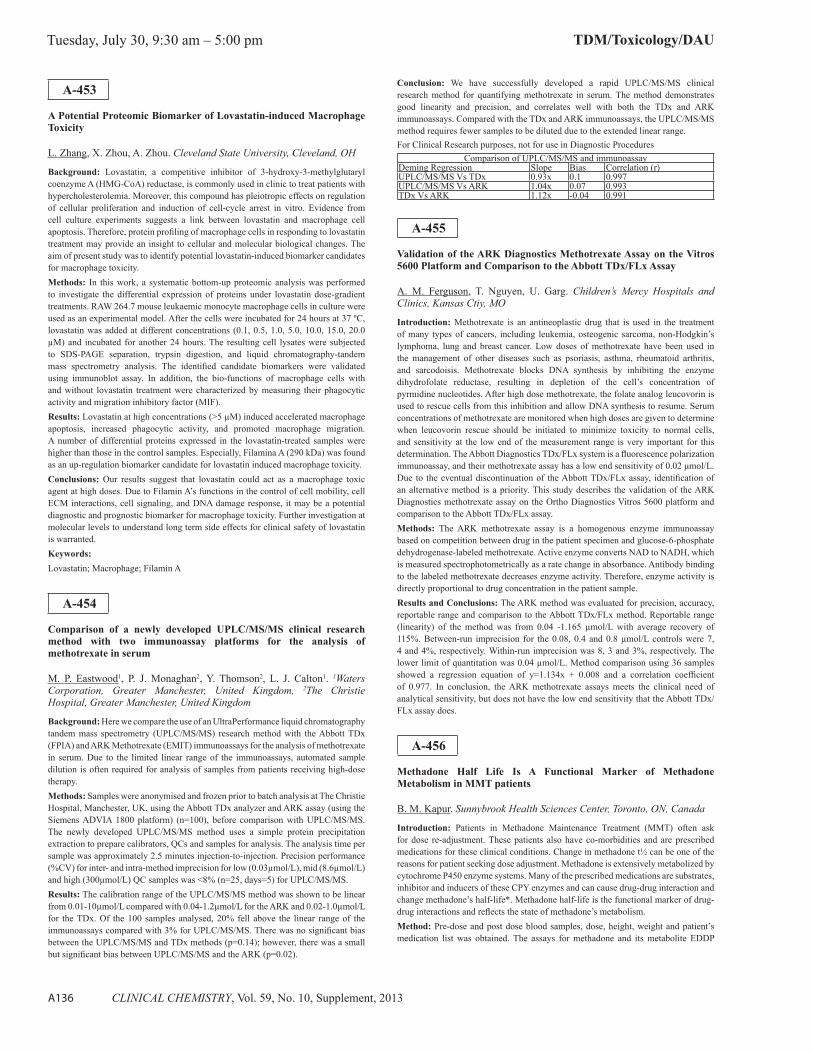
Tuesday, July 30, 9:30 am – 5:00 pm TDM/Toxicology/DAU
A136 CLINICAL CHEMISTRY, Vol. 59, No. 10, Supplement, 2013
A-453
A Potential Proteomic Biomarker of Lovastatin-induced Macrophage Toxicity
L. Zhang, X. Zhou, A. Zhou. Cleveland State University, Cleveland, OH
Background: Lovastatin, a competitive inhibitor of 3-hydroxy-3-methylglutaryl coenzyme A (HMG-CoA) reductase, is commonly used in clinic to treat patients with hypercholesterolemia. Moreover, this compound has pleiotropic effects on regulation of cellular proliferation and induction of cell-cycle arrest in vitro. Evidence from cell culture experiments suggests a link between lovastatin and macrophage cell apoptosis. Therefore, protein profi ling of macrophage cells in responding to lovastatin treatment may provide an insight to cellular and molecular biological changes. The aim of present study was to identify potential lovastatin-induced biomarker candidates for macrophage toxicity.Methods: In this work, a systematic bottom-up proteomic analysis was performed to investigate the differential expression of proteins under lovastatin dose-gradient treatments. RAW 264.7 mouse leukaemic monocyte macrophage cells in culture were used as an experimental model. After the cells were incubated for 24 hours at 37 ºC, lovastatin was added at different concentrations (0.1, 0.5, 1.0, 5.0, 10.0, 15.0, 20.0 μM) and incubated for another 24 hours. The resulting cell lysates were subjected to SDS-PAGE separation, trypsin digestion, and liquid chromatography-tandem mass spectrometry analysis. The identifi ed candidate biomarkers were validated using immunoblot assay. In addition, the bio-functions of macrophage cells with and without lovastatin treatment were characterized by measuring their phagocytic activity and migration inhibitory factor (MIF).Results: Lovastatin at high concentrations (>5 μM) induced accelerated macrophage apoptosis, increased phagocytic activity, and promoted macrophage migration. A number of differential proteins expressed in the lovastatin-treated samples were higher than those in the control samples. Especially, Filamina A (290 kDa) was found as an up-regulation biomarker candidate for lovastatin induced macrophage toxicity.Conclusions: Our results suggest that lovastatin could act as a macrophage toxic agent at high doses. Due to Filamin A’s functions in the control of cell mobility, cell ECM interactions, cell signaling, and DNA damage response, it may be a potential diagnostic and prognostic biomarker for macrophage toxicity. Further investigation at molecular levels to understand long term side effects for clinical safety of lovastatin is warranted.Keywords:Lovastatin; Macrophage; Filamin A
A-454
Comparison of a newly developed UPLC/MS/MS clinical research method with two immunoassay platforms for the analysis of methotrexate in serum
M. P. Eastwood1, P. J. Monaghan2, Y. Thomson2, L. J. Calton1. 1Waters Corporation, Greater Manchester, United Kingdom, 2The Christie Hospital, Greater Manchester, United Kingdom
Background: Here we compare the use of an UltraPerformance liquid chromatography tandem mass spectrometry (UPLC/MS/MS) research method with the Abbott TDx (FPIA) and ARK Methotrexate (EMIT) immunoassays for the analysis of methotrexate in serum. Due to the limited linear range of the immunoassays, automated sample dilution is often required for analysis of samples from patients receiving high-dose therapy.Methods: Samples were anonymised and frozen prior to batch analysis at The Christie Hospital, Manchester, UK, using the Abbott TDx analyzer and ARK assay (using the Siemens ADVIA 1800 platform) (n=100), before comparison with UPLC/MS/MS. The newly developed UPLC/MS/MS method uses a simple protein precipitation extraction to prepare calibrators, QCs and samples for analysis. The analysis time per sample was approximately 2.5 minutes injection-to-injection. Precision performance (%CV) for inter- and intra-method imprecision for low (0.03μmol/L), mid (8.6μmol/L) and high (300μmol/L) QC samples was <8% (n=25, days=5) for UPLC/MS/MS.Results: The calibration range of the UPLC/MS/MS method was shown to be linear from 0.01-10μmol/L compared with 0.04-1.2μmol/L for the ARK and 0.02-1.0μmol/L for the TDx. Of the 100 samples analysed, 20% fell above the linear range of the immunoassays compared with 3% for UPLC/MS/MS. There was no signifi cant bias between the UPLC/MS/MS and TDx methods (p=0.14); however, there was a small but signifi cant bias between UPLC/MS/MS and the ARK (p=0.02).
Conclusion: We have successfully developed a rapid UPLC/MS/MS clinical research method for quantifying methotrexate in serum. The method demonstrates good linearity and precision, and correlates well with both the TDx and ARK immunoassays. Compared with the TDx and ARK immunoassays, the UPLC/MS/MS method requires fewer samples to be diluted due to the extended linear range.For Clinical Research purposes, not for use in Diagnostic Procedures
Comparison of UPLC/MS/MS and immunoassayDeming Regression Slope Bias Correlation (r)UPLC/MS/MS Vs TDx 0.93x 0.1 0.997UPLC/MS/MS Vs ARK 1.04x 0.07 0.993TDx Vs ARK 1.12x -0.04 0.991
A-455
Validation of the ARK Diagnostics Methotrexate Assay on the Vitros 5600 Platform and Comparison to the Abbott TDx/FLx Assay
A. M. Ferguson, T. Nguyen, U. Garg. Children’s Mercy Hospitals and Clinics, Kansas Ctiy, MO
Introduction: Methotrexate is an antineoplastic drug that is used in the treatment of many types of cancers, including leukemia, osteogenic sarcoma, non-Hodgkin’s lymphoma, lung and breast cancer. Low doses of methotrexate have been used in the management of other diseases such as psoriasis, asthma, rheumatoid arthritis, and sarcodoisis. Methotrexate blocks DNA synthesis by inhibiting the enzyme dihydrofolate reductase, resulting in depletion of the cell’s concentration of pyrmidine nucleotides. After high dose methotrexate, the folate analog leucovorin is used to rescue cells from this inhibition and allow DNA synthesis to resume. Serum concentrations of methotrexate are monitored when high doses are given to determine when leucovorin rescue should be initiated to minimize toxicity to normal cells, and sensitivity at the low end of the measurement range is very important for this determination. The Abbott Diagnostics TDx/FLx system is a fl uorescence polarization immunoassay, and their methotrexate assay has a low end sensitivity of 0.02 μmol/L. Due to the eventual discontinuation of the Abbott TDx/FLx assay, identifi cation of an alternative method is a priority. This study describes the validation of the ARK Diagnostics methotrexate assay on the Ortho Diagnostics Vitros 5600 platform and comparison to the Abbott TDx/FLx assay. Methods: The ARK methotrexate assay is a homogenous enzyme immunoassay based on competition between drug in the patient specimen and glucose-6-phosphate dehydrogenase-labeled methotrexate. Active enzyme converts NAD to NADH, which is measured spectrophotometrically as a rate change in absorbance. Antibody binding to the labeled methotrexate decreases enzyme activity. Therefore, enzyme activity is directly proportional to drug concentration in the patient sample. Results and Conclusions: The ARK method was evaluated for precision, accuracy, reportable range and comparison to the Abbott TDx/FLx method. Reportable range (linearity) of the method was from 0.04 -1.165 μmol/L with average recovery of 115%. Between-run imprecision for the 0.08, 0.4 and 0.8 μmol/L controls were 7, 4 and 4%, respectively. Within-run imprecision was 8, 3 and 3%, respectively. The lower limit of quantitation was 0.04 μmol/L. Method comparison using 36 samples showed a regression equation of y=1.134x + 0.008 and a correlation coeffi cient of 0.977. In conclusion, the ARK methotrexate assays meets the clinical need of analytical sensitivity, but does not have the low end sensitivity that the Abbott TDx/FLx assay does.
A-456
Methadone Half Life Is A Functional Marker of Methadone Metabolism in MMT patients
B. M. Kapur. Sunnybrook Health Sciences Center, Toronto, ON, Canada
Introduction: Patients in Methadone Maintenance Treatment (MMT) often ask for dose re-adjustment. These patients also have co-morbidities and are prescribed medications for these clinical conditions. Change in methadone t½ can be one of the reasons for patient seeking dose adjustment. Methadone is extensively metabolized by cytochrome P450 enzyme systems. Many of the prescribed medications are substrates, inhibitor and inducers of these CPY enzymes and can cause drug-drug interaction and change methadone’s half-life*. Methadone half-life is the functional marker of drug-drug interactions and refl ects the state of methadone’s metabolism.Method: Pre-dose and post dose blood samples, dose, height, weight and patient’s medication list was obtained. The assays for methadone and its metabolite EDDP

TDM/Toxicology/DAU Tuesday, July 30, 9:30 am – 5:00 pm
CLINICAL CHEMISTRY, Vol. 59, No. 10, Supplement, 2013 A137
were done by immunoassay that had previously been validated against both HPLC and GC. We calculated t½, Cl and Vd for both methadone and EDDP. All assays were done at the request of the attending physician.Result: From June 2002 to January 2013, 250 patient samples were analysed. On 78 patients we also had the list of medications. Eight of these had no other medication and the remaining 70 had received an average of 3.5 medications (range 1 to 13). The most commonly prescribed drugs were amitriptyline (5) duloxetine (6), venlafaxine (6), bupropion (7), citalopram (8) ibuprofen (12) and oxybutynin (12). Methadone half-life could be calculated on 224 patients. T½ ranged from 6.6h to 167h (mean 33.8h). Removing extreme values <15h to >60h, n=195, mean t½ = 29.1h was obtained. Half-life correlated signifi cantly with dose in mg/kg (p<0.004) and pre-dose methadone blood levels (p=0.000). Cl, Vd and AUC were also signifi cantly correlated with methadone t½ (all p=0.000). In addition to methadone the patient with half-life of 167h had been prescribed eight different medications whereas the one with t½ of 6h had only one other drug (phenytoin) prescribed. Mean EDDP t½ = 23.44h. Cl, Vd and AUC were also correlated with EDDP t½ (all p=0.000)Conclusion: Patients in MMT programs are prescribed drugs that can cause drug-drug interaction. Half-life can be considered as a functional marker of methadone metabolism. Our study clearly shows that when considering methadone half-life the infl uence of the prescribed medications should be considered.*Kapur et.al. Critical Reviews in Clinical Laboratory Sciences, 2011: 48: 171-195
A-457
Drug Screening for Chronic Pain Patients: Compliance Rates, the Role of Mass Spectrometry and Clinical Action.
J. A. Hayden, A. N. Hoofnagle, G. S. Baird. University of Washington, Seattle, WA
Background: Overdose deaths from prescription opioids increased to 16,651 per year in 2011 and now account for more deaths than cocaine and heroin combined. The increase in deaths parallels the increased sale of prescription opioids. Urine drug testing has been proposed as a tool to combat prescription opioid abuse and the objective of this study was to investigate the clinical utility of urine drug screening. We evaluated the compliance rate in our patient population, the utility of mass spectrometry in urine drug screening and the clinical action resulting from non-compliant drug screens. Methods: Between July of 2012 and February of 2013, 1,476 urine samples from 1,298 patients (54% female, average age of 47) prescribed opioids for cancer and non-cancer pain were screened with a waived point-of-care immunoassay and an in-house developed liquid chromatography mass spectrometry (LC-MS/MS) assay. This LC-MS/MS method detects fourteen opioids and six opioid glucuronides. Every patient submitting a sample was evaluated by chart review by a single investigator (JAH).Results: The majority of the patients (56%) were prescribed a single opioid, though two (30%) and three or more (14%) were also encountered. The most commonly prescribed opioids were oxycodone (40%), methadone (15%), hydrocodone (15%) and morphine (15%). The screened patient population showed a 67% compliance rate with a 20% rate of diversion and 17% rate of abusing non-prescribed opioids (4% were abusing and diverting). The compliance rate for patients 16 to 45 (66%, n = 603), the at risk age range defi ned by the opioid risk tool, was comparable to those outside this range (67%, n = 873). The 20 to 29 year old age group showed a signifi cantly lower compliance rate (42%, n = 166). The abuse of non-prescribed opioids outnumbered abuse of methamphetamine, heroin and cocaine, which combined only accounted for a third of those abusing. The prevalence of abused prescription opioids mirrored their prescription prevalence, with oxycodone the most frequent followed by methadone, hydrocodone and morphine. Our screening immunoassay showed poor agreement with our LC-MS/MS assay and if clinical action had been taken on the immunoassay alone, 19% of the patients would have been falsely categorized as non-compliant. Of the non-compliant patients (n = 430), most had a single non-compliant screen while 9% had two and 6% had three or more over 7 months. As assessed by chart review alone, the majority of non-compliant screens were never addressed. When addressed, the most frequent action was a decrease in dose; cessation of prescription opioids or referral to substance abuse treatment programs was rare.Conclusion: The low compliance rate in our patient population highlights the substantial problem of prescription drug abuse. This study also highlights the value of LC-MS/MS in monitoring chronic pain compliance. In spite of our ability to reliably report non-compliant results, very little clinical action was taken as a result of aberrant urine drug screens.
A-458
Automated online solid phase extraction for the analysis of mycophenolic acid in plasma
M. P. Eastwood1, G. Chusney2, L. Calton1. 1Waters Corporation, Greater Manchester, United Kingdom, 2Hammersmith Hospital, London, United Kingdom
Background: The Waters ACQUITY UPLC Online SPE Manager (OSM) is a new online solid phase extraction (SPE) system coupled with Ultra Performance liquid chromatography tandem mass spectrometry (UPLC/MS/MS) for the preparation and analysis of biological matrices. The OSM performs automated sample preparation and elution in parallel with LC/MS analysis allowing a faster throughput than manual sample preparation methods. The OSM also has a method development mode to facilitate the use of Design of Experiment techniques and can perform two-dimensional SPE across multiple extraction chemistries. Here we evaluate the potential of the OSM for the automated sample preparation and analysis of mycophenolic acid in plasma for clinical research purposes.Methods: Commercially available kits were used for calibrators and QC material. Samples were obtained from, and previously quantifi ed by, Hammersmith Hospital, London, UK. All samples were pre-treated with zinc sulphate and methanol. Automated online extraction was carried out with a Waters® ACQUITY UPLC coupled to an OSM using Waters XBridge™ C18 Online SPE cartridges washed with methanol, water and 25% aqueous methanol. Analytes were eluted onto a 2.1x30mm Waters HSS C18 SB column using a water/methanol/ammonium acetate gradient and analyzed with a Waters ACQUITY® TQ Detector.Results: Following CLSI-EP6-A, the method was shown to be linear from 0.01-50μg/mL (n=5). Coeffi cients of variation for inter- and intra-method imprecision for low (1.94μg/mL), mid (2.35μg/mL), high (5.5μg/mL) QC samples were all <10% (n=25, days=5). Comparison with samples previously analyzed by Hammersmith Hospital, London, UK, (n=50) was described by the Deming equation y=0.99x-0.01. Compared with conventional one-dimensional chromatography, matrix effects were reduced by the online SPE as determined qualitatively by targeted multiple reaction monitoring of phospholipids and post-column infusion of analytes.Conclusion: We have successfully quantifi ed mycophenolic acid utilising automated online SPE with UPLC/MS/MS for clinical research purposes. The method demonstrates good linearity, precision and accuracy with minimal ion suppression.For Clinical Research purposes, not for use in Diagnostic Procedures
A-459
Evaluation of Low Level Methotrexate Following Leucovorin Rescue Therapy and Impact on Hospital Stay
S. Zibrat, R. Saguinsin, M. Hainzinger, N. Babic. The University of Chicago Medical Center, Chicago, IL
Objective: Methotrexate (MTx) is an antineoplastic agent that inhibits DNA synthesis. It is effective against malignancies such as leukemia, non-Hodgkin’s lymphoma, lung and breast cancer when administered at high dose, followed by leucovorin rescue to bring MTx to non-toxic levels, defi ned at our hospital, as <0.05 μmol/L for adults and <0.1 μmol/L for children. Patients remain hospitalized until non-toxic levels of MTx are achieved. We evaluated two currently available MTx assays: Syva® Emit® (Siemens Diagnostic Healthcare Inc.) and ARK™ Methotrexate Assay (ARK Diagnostics, Inc.) on our cobas® c501 analyzer (Roche Diagnostics) and compared performance of these assays to our clinical method at the time, Abbott TDx/FLx (Abbott Laboratories, Abbott Park, IL).Methods: Both Syva and ARK MTx assays are homogeneous enzyme immunoassays, based on the EMIT principle and use parameters developed for the c501. Limit of quantitation (LOQ) and method comparison studies were performed for both assays. Concordance analysis was performed by comparison of MTx measurements in 11 hospitalization events distributed among 8 different patients undergoing routine drug monitoring.Results: LOQ was 0.04 μmol/L for Syva and 0.05 μmol/L for ARK. Patient correlation data is shown in Table 1. Concordance analysis showed that ARK correlated better with TDx when MTx toxicity cut-off of <0.05 μmol/L was used. In 6 of 11 hospitalizations, measuring MTx levels using Syva assay would result in at least one additional hospital day for adult patients. At the cut-off of MTx <0.10 μmol/L, both methods are equivalent.
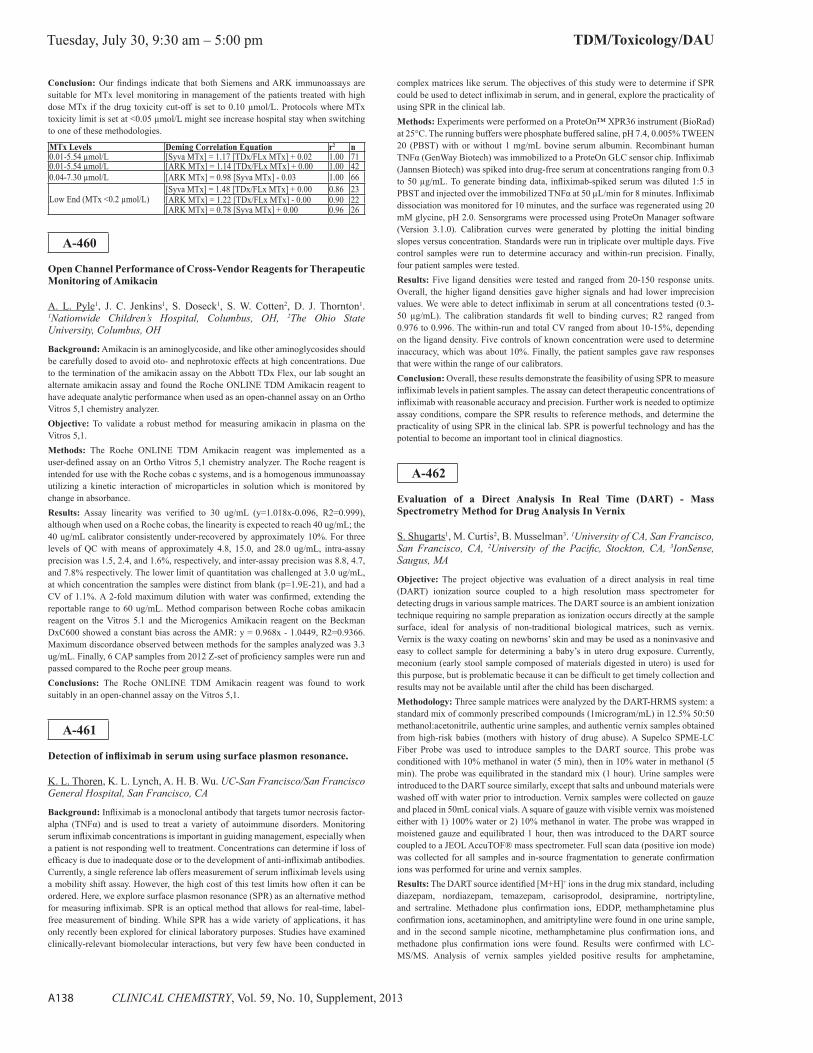
Tuesday, July 30, 9:30 am – 5:00 pm TDM/Toxicology/DAU
A138 CLINICAL CHEMISTRY, Vol. 59, No. 10, Supplement, 2013
Conclusion: Our fi ndings indicate that both Siemens and ARK immunoassays are suitable for MTx level monitoring in management of the patients treated with high dose MTx if the drug toxicity cut-off is set to 0.10 μmol/L. Protocols where MTx toxicity limit is set at <0.05 μmol/L might see increase hospital stay when switching to one of these methodologies.
MTx Levels Deming Correlation Equation r2 n0.01-5.54 μmol/L [Syva MTx] = 1.17 [TDx/FLx MTx] + 0.02 1.00 710.01-5.54 μmol/L [ARK MTx] = 1.14 [TDx/FLx MTx] + 0.00 1.00 420.04-7.30 μmol/L [ARK MTx] = 0.98 [Syva MTx] - 0.03 1.00 66
Low End (MTx <0.2 μmol/L)[Syva MTx] = 1.48 [TDx/FLx MTx] + 0.00 0.86 23[ARK MTx] = 1.22 [TDx/FLx MTx] - 0.00 0.90 22[ARK MTx] = 0.78 [Syva MTx] + 0.00 0.96 26
A-460
Open Channel Performance of Cross-Vendor Reagents for Therapeutic Monitoring of Amikacin
A. L. Pyle1, J. C. Jenkins1, S. Doseck1, S. W. Cotten2, D. J. Thornton1. 1Nationwide Children’s Hospital, Columbus, OH, 2The Ohio State University, Columbus, OH
Background: Amikacin is an aminoglycoside, and like other aminoglycosides should be carefully dosed to avoid oto- and nephrotoxic effects at high concentrations. Due to the termination of the amikacin assay on the Abbott TDx Flex, our lab sought an alternate amikacin assay and found the Roche ONLINE TDM Amikacin reagent to have adequate analytic performance when used as an open-channel assay on an Ortho Vitros 5,1 chemistry analyzer.Objective: To validate a robust method for measuring amikacin in plasma on the Vitros 5,1.Methods: The Roche ONLINE TDM Amikacin reagent was implemented as a user-defi ned assay on an Ortho Vitros 5,1 chemistry analyzer. The Roche reagent is intended for use with the Roche cobas c systems, and is a homogenous immunoassay utilizing a kinetic interaction of microparticles in solution which is monitored by change in absorbance.Results: Assay linearity was verifi ed to 30 ug/mL (y=1.018x-0.096, R2=0.999), although when used on a Roche cobas, the linearity is expected to reach 40 ug/mL; the 40 ug/mL calibrator consistently under-recovered by approximately 10%. For three levels of QC with means of approximately 4.8, 15.0, and 28.0 ug/mL, intra-assay precision was 1.5, 2.4, and 1.6%, respectively, and inter-assay precision was 8.8, 4.7, and 7.8% respectively. The lower limit of quantitation was challenged at 3.0 ug/mL, at which concentration the samples were distinct from blank (p=1.9E-21), and had a CV of 1.1%. A 2-fold maximum dilution with water was confi rmed, extending the reportable range to 60 ug/mL. Method comparison between Roche cobas amikacin reagent on the Vitros 5.1 and the Microgenics Amikacin reagent on the Beckman DxC600 showed a constant bias across the AMR: y = 0.968x - 1.0449, R2=0.9366. Maximum discordance observed between methods for the samples analyzed was 3.3 ug/mL. Finally, 6 CAP samples from 2012 Z-set of profi ciency samples were run and passed compared to the Roche peer group means.Conclusions: The Roche ONLINE TDM Amikacin reagent was found to work suitably in an open-channel assay on the Vitros 5,1.
A-461
Detection of infl iximab in serum using surface plasmon resonance.
K. L. Thoren, K. L. Lynch, A. H. B. Wu. UC-San Francisco/San Francisco General Hospital, San Francisco, CA
Background: Infl iximab is a monoclonal antibody that targets tumor necrosis factor-alpha (TNFα) and is used to treat a variety of autoimmune disorders. Monitoring serum infl iximab concentrations is important in guiding management, especially when a patient is not responding well to treatment. Concentrations can determine if loss of effi cacy is due to inadequate dose or to the development of anti-infl iximab antibodies. Currently, a single reference lab offers measurement of serum infl iximab levels using a mobility shift assay. However, the high cost of this test limits how often it can be ordered. Here, we explore surface plasmon resonance (SPR) as an alternative method for measuring infl iximab. SPR is an optical method that allows for real-time, label-free measurement of binding. While SPR has a wide variety of applications, it has only recently been explored for clinical laboratory purposes. Studies have examined clinically-relevant biomolecular interactions, but very few have been conducted in
complex matrices like serum. The objectives of this study were to determine if SPR could be used to detect infl iximab in serum, and in general, explore the practicality of using SPR in the clinical lab.Methods: Experiments were performed on a ProteOn™ XPR36 instrument (BioRad) at 25°C. The running buffers were phosphate buffered saline, pH 7.4, 0.005% TWEEN 20 (PBST) with or without 1 mg/mL bovine serum albumin. Recombinant human TNFα (GenWay Biotech) was immobilized to a ProteOn GLC sensor chip. Infl iximab (Jannsen Biotech) was spiked into drug-free serum at concentrations ranging from 0.3 to 50 μg/mL. To generate binding data, infl iximab-spiked serum was diluted 1:5 in PBST and injected over the immobilized TNFα at 50 μL/min for 8 minutes. Infl iximab dissociation was monitored for 10 minutes, and the surface was regenerated using 20 mM glycine, pH 2.0. Sensorgrams were processed using ProteOn Manager software (Version 3.1.0). Calibration curves were generated by plotting the initial binding slopes versus concentration. Standards were run in triplicate over multiple days. Five control samples were run to determine accuracy and within-run precision. Finally, four patient samples were tested.Results: Five ligand densities were tested and ranged from 20-150 response units. Overall, the higher ligand densities gave higher signals and had lower imprecision values. We were able to detect infl iximab in serum at all concentrations tested (0.3-50 μg/mL). The calibration standards fi t well to binding curves; R2 ranged from 0.976 to 0.996. The within-run and total CV ranged from about 10-15%, depending on the ligand density. Five controls of known concentration were used to determine inaccuracy, which was about 10%. Finally, the patient samples gave raw responses that were within the range of our calibrators.Conclusion: Overall, these results demonstrate the feasibility of using SPR to measure infl iximab levels in patient samples. The assay can detect therapeutic concentrations of infl iximab with reasonable accuracy and precision. Further work is needed to optimize assay conditions, compare the SPR results to reference methods, and determine the practicality of using SPR in the clinical lab. SPR is powerful technology and has the potential to become an important tool in clinical diagnostics.
A-462
Evaluation of a Direct Analysis In Real Time (DART) - Mass Spectrometry Method for Drug Analysis In Vernix
S. Shugarts1, M. Curtis2, B. Musselman3. 1University of CA, San Francisco, San Francisco, CA, 2University of the Pacifi c, Stockton, CA, 3IonSense, Saugus, MA
Objective: The project objective was evaluation of a direct analysis in real time (DART) ionization source coupled to a high resolution mass spectrometer for detecting drugs in various sample matrices. The DART source is an ambient ionization technique requiring no sample preparation as ionization occurs directly at the sample surface, ideal for analysis of non-traditional biological matrices, such as vernix. Vernix is the waxy coating on newborns’ skin and may be used as a noninvasive and easy to collect sample for determining a baby’s in utero drug exposure. Currently, meconium (early stool sample composed of materials digested in utero) is used for this purpose, but is problematic because it can be diffi cult to get timely collection and results may not be available until after the child has been discharged. Methodology: Three sample matrices were analyzed by the DART-HRMS system: a standard mix of commonly prescribed compounds (1microgram/mL) in 12.5% 50:50 methanol:acetonitrile, authentic urine samples, and authentic vernix samples obtained from high-risk babies (mothers with history of drug abuse). A Supelco SPME-LC Fiber Probe was used to introduce samples to the DART source. This probe was conditioned with 10% methanol in water (5 min), then in 10% water in methanol (5 min). The probe was equilibrated in the standard mix (1 hour). Urine samples were introduced to the DART source similarly, except that salts and unbound materials were washed off with water prior to introduction. Vernix samples were collected on gauze and placed in 50mL conical vials. A square of gauze with visible vernix was moistened either with 1) 100% water or 2) 10% methanol in water. The probe was wrapped in moistened gauze and equilibrated 1 hour, then was introduced to the DART source coupled to a JEOL AccuTOF® mass spectrometer. Full scan data (positive ion mode) was collected for all samples and in-source fragmentation to generate confi rmation ions was performed for urine and vernix samples. Results: The DART source identifi ed [M+H]+ ions in the drug mix standard, including diazepam, nordiazepam, temazepam, carisoprodol, desipramine, nortriptyline, and sertraline. Methadone plus confi rmation ions, EDDP, methamphetamine plus confi rmation ions, acetaminophen, and amitriptyline were found in one urine sample, and in the second sample nicotine, methamphetamine plus confi rmation ions, and methadone plus confi rmation ions were found. Results were confi rmed with LC-MS/MS. Analysis of vernix samples yielded positive results for amphetamine,

TDM/Toxicology/DAU Tuesday, July 30, 9:30 am – 5:00 pm
CLINICAL CHEMISTRY, Vol. 59, No. 10, Supplement, 2013 A139
methamphetamine plus confi rmation ions, and N-ethylamphetamine, for one vernix sample. The second vernix sample was positive for methadone, EDDP, and amitriptyline. Total analysis time, including sample incubation, was sub- 2 hours. Analysis of additional vernix samples is on-going to further assess correlation of DART-HRMS results to standard drug testing procedures.Conclusions: The DART-HRMS platform provides easy and fast sample analysis from a variety of biological matrices, including those (e.g.vernix) diffi cult to prepare by conventional means. This allows noninvasive and timely analysis of newborn drug exposure. While optimization of sample treatment is in progress, preliminary data indicates good agreement with clinical presentation and suggests this methodology could be useful in the clinical laboratory.
A-464
Should all screen-positive elevated blood lead (EBL) samples be retested before reporting?
L. J. McCloskey1, J. D. Landmark2, D. F. Stickle1. 1Jefferson University Hospitals, Philadelphia, PA, 2University of Nebraska Medical Center, Omaha, NE
Background: Common laboratory practice in lead (Pb) testing is to retest samples having initial results that are positive for elevated blood lead (EBL: [Pb] ≥5 μg/dL) before reporting. An unintended outcome of this practice is that it in fact reduces the overall screening sensitivity for EBL detection. This is for the simple reason that among all fi rst-measurement positives, which includes both false positives (FP) and true positives (TP), the only possible change for TP upon retesting is reclassifi cation as negative (decreasing the number of TP, and increasing the number of false negatives (FN)), due simply to assay imprecision. Accordingly, the screening sensitivity (S = TP/(TP+FN)) can only decrease when only fi rst-measurement positives are retested. The scale on which this affects sensitivity for EBL detection can only be guessed at without performing detailed calculations that account for assay imprecision and the underlying patient population distribution for [Pb]. In order to assess this scale, we undertook such calculations by simulation of testing using a known patient population distribution for [Pb] and assuming an appropriate fi xed value for assay imprecision.Methods: A basis patient [Pb] distribution was that of fi rst-or-only measurements among pediatric subjects at the University of Nebraska Medical Center during a one-year period (2011; n=10,333), for which 4.4% were classifi ed as EBL (≥5 μg/dL). For sake of argument, this distribution was treated as a “true” results distribution. This distribution was “measured” by simulation, using a fi xed standard deviation (s) of measurement, s=0.77 μg/dL. This s was chosen as a boundary value which would produce a sample pass rate of >99% for current profi ciency testing requirements of ±2 μg/dL accuracy. In simulated testing, each sample [Pb] was individually replaced by a value from the normal distribution [Pb]±2s, according to the probabilities of that normal distribution; this is as if each “true” [Pb] was measured by an assay with imprecision s. Simulated testing was conducted either without retesting (singletons, case A), with retesting when fi rst test results were ≥EBL cutoff (≥5 μg/dL) (duplicates, case B), or with retesting only when fi rst test results were ≥EBL cutoff +2s (≥6.5 μg/dL) (duplicates, case C). The original basis distribution classifi cations (EBL, non-EBL) were compared to results of simulated testing to determine sensitivity, S, for EBL detection under conditions A, B, or C. Simulations were of 10,000 samples per run, replicated for 1000 runs.Results: For case A (singletons), S was 89.6±1.5 %. For case B (duplicates for fi rst-measurement ≥5 μg/dL), S was 87.3±1.6 %, a decrease of 2.3% in comparison to A. For case C (duplicates for fi rst-measurement ≥6.5 μg/dL), S was 89.6±1.5%, identical to results for A.Conclusions: For this patient distribution, there was a penalty of retesting of samples that were fi rst-measurement screen-positive for EBL, which decreased sensitivity for EBL detection by >2%. This penalty is an inherent aspect of assay imprecision when only fi rst-measurement positives are retested. Retesting only of fi rst-measurement positives that are at least 2s greater than the EBL cutoff can avoid this effect on S of retesting.
A-465
Method development for determining iohexol in human plasma by UPLC
Y. Zou, S. Wang, Y. Li, Y. Liao, J. Tang, L. wang. Department of Laboratory Medicine, West China Hospital , Sichuan University, chengdu, China
Objective: Iohexol(IHO) is a suitable marker for glomerular fi ltration rate (GFR) testing because its elimination occurs in glomerular without secretion or resorption in tubular. Therefore, iohexol clearance is widely used in clinical practice for GFR testing.This research aimed to develop a quickly and sensitively method to determine the human plasma iohexol by ultra-high Performance Liquid Chromatography (UPLC) .Methods:We used iohexol related compound C as the internal standard (IS). Protein precipitation and iohexol extraction from plasma sample (0.2ml) was carried out by adding 0.6ml acetonitrile followed by vortex mixing and centrifugation. The supernatant was reextracted using 3 ml trichloromethane,then the 5ul upper aqueous was analysed on Waters BEH C18 column(2.1*50mm,1.7um), IHO and IS were eluted by the mobile phase consist of 0.02mol/L PH4.50 ammonium acetate buffer(A) and acetonitrile(B) under 40℃ at a fl ow-rate of 0.3ml/min and monitored by UV absorption at 254 nm.Results:The Average extraction recovery of IHO and IS was 90.8% and 90.4%, respectively; good linearity(r2=0.9994) was observed througuout the range of 0.025-200 ug/ml and the Lower limit of detection was 12.5ng/ml, the retention time of IHO and IS were 1.12min and 1.85min, respectively; The intra-assay and inter-assay variations were lower than 2.22% and 2.37%, respectively, for all the examined concentrations; the overall accuracy of the method was 100.6%-103.4%; the stability of IHO in plasma was assessed, that coeffi cients of variance at room temperature for 6h ,frozen/thawed at room temperature then refrozen at -20℃ for three cycles and stored at -20℃ for 29 days were less than 1.25%, 1.56% and 2.56% , respectively.Conclusions:This method was sensitive, accurate, simple and rapid.it not only has the capability of being used for determination of iohexol in clinical settings, but also can be useful for clinical plasma concentration measurement and pharmacokinetic study.
Tab1 . The precision of IHOIntra-day Inter-day
C(ug/ml) Measured(ug/ml) RSD(%) Measured(ug/ml) RSD(%)100 100.5±2.2 2.22 100.2±1.88 1.886.25 6.46±0.09 1.44 6.28±0.12 0.570.39 0.394±0.002 0.7 0.39±0.003 1.340.1 0.102±0.002 1.95 0.1±0.002 2.37
A-466
Red Eyes, Flushed Face, Slurred Speech, and More: A Clinical Dilemma in a Complex Mental Illness Unit
E. Wong, C. Stefan-Bodea. Centre for Addiction and Mental Health, Toronto, ON, Canada
Background. A client of the Centre for Addiction and Mental Health in Toronto with outside privileges started returning late to the unit with signs of intoxication including red eyes, fl ushed face, slurred speech, lack of co-ordination while playing games at which he was normally good as well as disorganized thoughts, not being able to get his story straight as to where he was or when he signed out. Another client experienced quick change in mental status including verbally aggressive, paranoid, psychotic. Comprehensive urine drug screens were unremarkable.The possibility that these symptoms may have been due to use of herbal products containing synthetic cannabinoids, overall known as “Spice” but also available under a variety of names, was considered. We describe the identifi cation of JHW-type synthetic cannabinoids metabolites in urine specimens using high resolution Orbitrap mass spectrometry approach, thus overcoming lack of commercially available standards. Materials and Methods. Urine specimens were analyzed using the Q-Exactive LC-MS mass spectrometer. A database with monoisotopic masses for various drugs and metabolites was created. Drug standards from Cerilliant were used to validate the mass accuracy, retention times and mass fragmentation spectra. LC separation was on Phenomenex Kinetex PFP column 100 x 2.1 mm, 2.6 μm, 100Å, using gradient elution and UPLC Accela pump. The cycle time was ~15 min with positive and negative polarity switching, and fragmentation in the HCD in the same run. Precursors were scanned from m/z 100 to 800 at 70,000 resolutions and HCD fragment ions between m/z 50 to 800 at 17,500 resolutions. Data was analyzed with XCalibur software adapted for high resolution. Non-threshold approach was used for reporting positive fi ndings.

Tuesday, July 30, 9:30 am – 5:00 pm TDM/Toxicology/DAU
A140 CLINICAL CHEMISTRY, Vol. 59, No. 10, Supplement, 2013
Results. Synthetic cannabinoids were reported to have very short half life being quickly metabolized to hydroxylated and/or carboxylated metabolites and then conjugated with glucuronic acid. Hence the actual parent drugs are not expected to be detected. Using mass-accuracy Orbitrap technology we identifi ed the following metabolites in the patients’ specimens: JWH-018 N-(5-hydroxypentyl) glucuronide, JWH-073 N-Butanoic acid glucuronide, JWH-073-3-OH-glucuronide, Carboxy-THC glucuronide. We show total and extracted mass chromatograms at mass accuracy < 5 ppm for each of these metabolites; for example, JWH-018 N-(5-hydroxypentyl) glucuronide 534.2122 vs 534.2123 in positive mode or 532.1977 vs. 532.1975 in negative mode. After confrunted with the laboratory results, one patient admitted to using Kryptonite herbal product, and the other one admitted to using IZMS herbal incense.Conclusion We describe a rapid and accurate approach for detection of JWH-018 and JWH-073 metabolites and/or their conjugates in urine specimens. Given the large variety of synthetic cannabinoids that can be available on the drug market, the same approach can be used for any other compound regardless of reference standard availability. The use of synthetic cannabinoids use can lead to severe side effects, hence a laboratory testing for addiction and mental health setting has a signifi cant value for patient management.
A-467
Performance characterization of a new topiramate immunoassay on a high-throughput analyzer
J. M. El-Khoury, S. E. Lawson, K. E. Lembright, S. Wang. Cleveland Clinic, Cleveland, OH
Background: Topiramate is an anticonvulsant used for the treatment of epilepsy and migraines, and various off-label applications such as posttraumatic stress and bipolar disorder. Therapeutic drug monitoring of topiramate is helpful for optimizing individual therapy, managing comedications, and assessing compliance. Our objective was to evaluate a topiramate immunoassay (ARK Diagnostics, Sunnyvale, CA) on a Siemens ADVIA 1200 (Siemens Healthcare Diagnostics, Deerfi eld, IL). Methods: Linearity was assessed by spiking a left-over patient serum sample to a topiramate level of 60 μg/mL followed by serial dilution with saline and analyzing the resulting specimens in triplicate. Intra-assay precision was evaluated by analyzing two quality control materials (low and high) included in the ARK reagent package for 10 replicates a day while inter-day precision was assessed by analyzing three quality control materials once a day for 20 days. Accuracy was assessed by comparing results of the samples by the ARK immunoassay to a reference laboratory method (n=40, ARK Diagnostics on Roche P-modular analyzer) and to a fl uorescence polarization immunoassay (FPIA) (n=29, Abbott Diagnostics TDX analyzer). Results: The assay was linear from 1.0 to 60 μg/mL with recoveries ranging from 99.2% to 115.1%. No carryover was observed up to 100 μg/mL. Intra- and inter-assay precision were less than 8.7% for all concentrations tested. Two samples were lower than the quantitation limit of both FPIA and ADVIA and were not included in the correlation analysis. The assay compared favorably with FPIA (TDX) and the reference laboratory method (P-modular) as shown in fi gure 1.Conclusion: The ARK Diagnostics immunoassay on Advia 1200 offered reliable quantitation for topiramate.
A-468
Methanol Quantitation: Evaluating the CATACHEM Methanol Enzymatic Assay on an AU400e
J. M. Juenke1, P. I. Brown1, K. L. Johnson-Davis2. 1ARUP Institute for Clinical and Experimental Pathology, Salt Lake City, UT, 22Department of Pathology, University of Utah School of Medicine, Salt Lake City, UT
Introduction: Methanol (MeOH) poisoning is an important and common toxicological problem that requires clinical diagnosis. MeOH is commonly found in windshield washing fl uid, gas line antifreeze, model airplane fuel, solid cooking fuel, photocopying fl uid, perfumes, and moonshine. MeOH is metabolized to formaldehyde, then formic acid. Formic acid is a mitochondrial toxin, working in a similar way as cyanide to obstruct oxidative phosphorylation. Ocular toxicity is prominent, causes visual effects including blurry vision, loss of color vision, ‘snowfi eld’ vision, or total blindness. Both pancreatitis and renal failure have also been reported. Rapid methanol quantifi cation in serum is important to both the diagnosis of poisoning and guiding therapy. Serum methanol quantifi cation is not widely available in the hospital setting due in large part to the lack of an automated assay. Methanol concentrations are determined using chromatographic techniques. An enzymatic assay for methanol available through CATACHEM has been able to screen and quantify methanol using an automated chemistry analyzer (AU400e). Objective: The MeOH enzymatic assay by CATACHEM was evaluated after implementing method parameters for the AU400e. Methodology: The assay is based on the affi nity of the enzyme Alcohol Oxidase from bacteria to catalyze the oxidation of methanol to formaldehyde and H2O2, the formaldehyde thus produced is subsequently converted to formic acid by the action of formaldehyde dehydrogenase in the presence of NAD. This two point kinetic procedure is read at 340nm and the increase in absorbance is directly proportional to the concentration of methanol. Results: The linearity of the assay was evaluated by serial diluting a 100 mg/dL spike serum sample. The lower limit of quantitation 5 mg/dL was the lowest concentration at which all samples were accurate to 20% of the target concentration. The upper limit of quantitation of 145 mg/dL was tested using a patient sample that had been confi rmed at 145 mg/dL tested in duplicate and was accurate to 20% of the target concentration. Precision was performed at four levels over three days (n=15) with all CV% less than 9%. Fifty nine samples were correlated with GC-FID, with 16 samples giving greater than 5 mg/dL results yielding a Deming Regression Equation of y=1.08x+3.19, r=0.993, standard error= 3.58.

TDM/Toxicology/DAU Tuesday, July 30, 9:30 am – 5:00 pm
CLINICAL CHEMISTRY, Vol. 59, No. 10, Supplement, 2013 A141
Conclusions: The CATACHEM assay may be used to rapidly screen and quantitate methanol thereby preventing unnecessary medical treatment when methanol is absent. The assay may also be used to monitor decontamination efforts related to methanol treatment.
A-469
Development of an automated SPE procedure for the measurement of serum Celecoxib by LC-MS/MS
D. W. S. Stephen, I. Clunie, A. J. Dunlop, W. G. Simpson. NHS Grampian, ABERDEEN, United Kingdom
Background: Cyclooxygenase-2 (COX-2)-selective inhibitors, such as Celecoxib (Celebrex®), have recently found therapeutic benefi t not only in the treatment of neuroinfl ammatory and neurodegenerative disorders but also as an alternative therapy for pain management. Management of severe pain is usually with opioid-based pain medications, such as Codeine or Morphine, but they have signifi cant side effects including respiratory depression that has resulted in death. The non-steroidal anti-infl ammatory drug (NSAID), Celecoxib, is devoid of such opioid-related side effects. As the use of this alternative medication in pain management has increased, this laboratory has received interest in the monitoring of Celecoxib blood concentrations in patients receiving the drug to gauge adequacy of therapy whilst striving to avoid potential toxic side effects. We have developed a rapid LC-MS/MS method for the measurement of Celecoxib in blood samples prepared for analysis using an automated solid phase extraction (SPE) technique.Methods: Extraction of Celecoxib from serum samples was carried out by an HTS-PAL autosampler robot, using disposable ITSP C18 SPE cartridges. Celecoxib was quantifi ed by LC-MS/MS via electrospray ionisation (ESI) using multiple reaction monitoring (MRM) and Celecoxib-d4 as internal standard.Results: The assay was linear over the analytical range 0.5-10,000 ng/mL. Lower limits of detection (LLOD) and quantifi cation (LLOQ) of Celecoxib were 0.88 ng/mL and 3.34 ng/mL, respectively. Intra-assay (n = 5) and inter-assay (n = 5) imprecision of Celecoxib in all samples were 0.05% relative standard deviation (RSD) (r2 for slope of calibration curve 0.9995) and 0.11% RSD (r2 for slope of calibration curve 0.9994), respectively. The analytical recovery of Celecoxib spiked into serum was >95%. Matrix effect in serum was 3.5% and extracted samples were stable for at least 14 days at 10°C.Conclusion: The described validated LC-MS/MS method for the detection of Celecoxib in SPE-prepared serum is a quick and easy procedure for the measurement of this drug in samples taken for therapeutic drug monitoring purposes. The method can be readily introduced onto a laboratory LCMS system, a technology now available to and employed by many clinical laboratories.
A-470
Cross-reactivity Assessment of Bath salts in different Immunoassays
T. Kampfrath, A. Sibio, S. Jortani. University of Louisville, Louisville, KY
Background: Bath salts, a class of synthetic molecules known as cathinones, are the latest drugs of abuse becoming increasingly popular in the United States. They are very popular among younger abusers trying to avert detection by the standard drug screening procedures. With little information known on their risks and effects by the medical community, frequent overdoses, hallucinations, and even death have been reported. Currently, the different cathinones are analyzed by gas chromatography - mass spectrometry by referral and highly specialized laboratories. Since the structures of cathinones are similar to amphetamines, cross-reactivities with common immunoassays are expected. Herein, we report on the cross-reactivity analysis of three different synthetic cathinones in varies commercial immunoassays used in routine drug screening practice.Methods: The selected synthetic cathinones for cross-reactivity assessment were Mephedrone, MDPV (3,4-methylenedioxypyrovalerone), and Methylone. These substances are currently the most prevalent members of the bath salts in the United States and were kindly provided by Utak Laboratories Inc. (Valencia, CA). Those compounds were added to aliquots of pooled normal human urine at a concentration of 10000 ng/mL a typical concentration utilized for cross-reactivity studies with unrelated drugs. In addition, one sample contained a mixture of all three cathinones at a concentration of 10000 ng/mL each as street drugs are rather a mixture and rarely
pure. The tested immunoassays were the Roche Integra (Roche Diagnostics GmbH), Triage® 8 Drugs of Abuse Panel (Inverness Medical, San Diego, CA) and Beckman Coulter Unicel DxC 800 (Brea, CA).Results: The Roche amphetamine screen was the only assay that we tested that showed cross-reactivity with bath salts. At fi rst, we tested a mixture of Mephedrone, MDPV, and Methylone providing a positive result as indicated by a reaction rate of 1642 while 1000 is set for the cutoff (equivalent in assay reactivity to 500 ng/mL). Next, we tested each cathinone separately at a concentration of 10000 ng/mL. Here, only mephedrone was able to cross-react and provide a positive result (1060), while MDPV (417) and methylone (651) were well below the cutoff limit. None of those compounds gave positive results at the 10000 ng/mL cutoff in the Triage® 8 panel (amphetamine, barbiturate, cocaine, opiate, benzodiazepine, THC, methadone, PCP) and in the Beckman Coulter Unicel DxC 800 (amphetamine, barbiturate, cocaine, opiate, benzodiazepine, THC, methadone).Conclusion: Out of the three popular bath salts tested, only mephedrone cross-reacted in the Roche’s amphetamine screen. Neither of the bath salts tested either alone or as a mixture cross-reacted in the Triage or Beckman amphetamine assays. All other immunoassay screens resulted in negative results when bath salts were added to the urine. Considering the long turn-around time for sending samples for testing bath salts, the observed cross-reactivity in the Roche’s amphetamine assay may be an advantage since the clinical management of amphetamine and bath salts overdoses are similar.
A-471
Direct analysis of 26 urinary opioids and metabolites by mixed-mode μElution SPE combined with UPLC/MS/MS - Improved performance vs. “Dilute-and-shoot” methodology.
J. Danaceau, E. Chambers, K. Fountain, D. Mason. Waters Corporation, Milford, MA
Background: The analysis of natural and synthetic opioid drugs continues to be an important area of analytical research. Typical methods to detect these drugs often require enzymatic hydrolysis prior to analysis. However, incomplete hydrolysis can result in inaccurate measurement. The method presented herein directly analyzes glucuronide metabolites, eliminating uncertainty associated with enzymatic hydrolysis. The presented work details a technique for analysis of 26 opioid drugs and their metabolites in urine using mixed-mode solid phase extraction (SPE) followed by revered-phase UPLC/MS/MS analysis. Methods: Urine samples (100 μL) were pretreated with equal parts 4% H3PO4 and internal standard solution (dissolved in water). After conditioning mixed-mode SPE plates, pretreated urine samples were loaded onto the sorbent bed. After washing each well with water and MeOH, samples were then eluted with 60:40 ACN:MeOH containing 5% NH4OH. Sample eluates were then evaporated to dryness, reconstituted in starting mobile phase and injected onto the LC/MS/MS system. Results and Conclusions: All analytes eluted in less than 5.5 minutes, and baseline separation was achieved for all isobaric compounds. All compounds demonstrated excellent linearity, accuracy and precision from 5-500 ng/mL. All calibration points fell within 10% of their target values, and %CVs were under 15%. Intraday imprecision for quality control samples at 7.5, 75, 250 and 400 ng/mL were all under 10% CV with only one exception (morphine @ 7.5 ng/mL; %CV = 10.1%), and all QC samples deviated by less than 15% from target values. When compared to a simple dilution method, mixed-mode SPE resulted in signifi cantly reduced matrix effects and improved linearity, accuracy and precision. Authentic urine samples, which had been previously analyzed by enzymatic hydrolysis, were also analyzed. Comparison of the two methods revealed good agreement for oxycodone and hydrocodone, which do not undergo glucuronidation. However, the method described here resulted in signifi cantly higher calculated concentrations for total oxymorphone and hydromorphone, in agreement with previous reports of incomplete or inconsistent hydrolysis of their glucuronide metabolites, and emphasizing the importance of direct analysis of these metabolites. Disclaimer: This method is intended for clinical research use only, not for use in diagnostic procedures

Tuesday, July 30, 9:30 am – 5:00 pm TDM/Toxicology/DAU
A142 CLINICAL CHEMISTRY, Vol. 59, No. 10, Supplement, 2013
A-472
Effect of Piperine extract on Liver function in non-Transgenic Mice.
J. R. Peela1, F. Elshaari2, E. Fathoom2, M. Elfrady2, A. M. Jarrari2, S. Shakila1, H. M. El Awamy2, R. Singh3, A. Belkheir3, S. D. Kolla4. 1Faculty of Medicine,Quest International University Perak,, IPOH, Malaysia, 2Department of Biochemistry,Faculty of Medicine,Benghazi University, Benghazi, Libyan Arab Jamahiriya, 3Department of Pharmacognosy,Faculty of Pharmacy, Benghazi University, Benghazi, Libyan Arab Jamahiriya, 4Department of Biochemistry,RangaRaya Medical College,NTR University of Health Sciences, Kakinada, India
Background: Piperine extract is isolated form Piper nigrum, popularly known as black pepper. Many studies have shown its role in increasing the bioavailability of certain drugs especially antibiotics. The present study conducted in our laboratory to observe its effect on the assessment of liver function using liver enzymes as specifi c markers of liver function.Materials and Methods: 30 non-transgenic mice CF-1 albino mice (strain 023) used for this study have been obtained from animal house, faculty of medicine, Garyounis University, Begazhi, Libya. All of these mice were categorized into two groups. Piperine extract was isolated from Piper nigrum from the department of pharmacognosy, faculty of pharmacy, Garyounis University, Bengazhi, Libya. A group of 20 mice (test group) were administered the piperine extract for 3 weeks and another group of 10 mice (control group) used as controls. Mice from both the groups were given similar diet and exposed to similar living conditions. Blood for the estimation of liver enzymes, Alanine amino transaminase, Aspartate amino transaminase and Alkaline Phosphatase and serum total protein as an indicator of liver function, was drawn by cardiocentesis after anaesthetizing the mice with ketamine and halothane from test group and control group. Mice from the test group only were given the piperine extract orally (5mgs/kg body wt) along with their usual diet for a period of 3 weeks. Blood was drawn again from both the groups of mice after a period of 3 weeks using the same procedure. Analysis of liver enzymes, Alanine amino transaminase, Aspartate amino transaminase, Alkaline Phosphatase (ALP) and Total proteins in serum was done using authentic biochemical methods available.Results: There was a signifi cant increase in the level of serum Alanine amino transferase in mice belonging to the test group than in that of the control group (p = 0.0002). Serum Aspartate amino transferase level was signifi cantly increased (p = 0.046) in the test group than in that of the controls. Serum Alkaline phosphatase levels have also shown a signifi cant increase (p = 0.0001) in test group than in the control group of mice. Serum total protein levels have shown a signifi cant decrease (p = 0.011) in test group when compared to that in control group.Conclusion: Present study has shown a considerable effect on the liver function as indicated by a signifi cant elevation in the liver enzymes in spite of its benefi cial role as an enhancer of bioavailability of various drugs. This study has not only shown signifi cant hepatocellular damage, it is also indicating an obstructive phenomenon as shown by a signifi cant elevation in serum alkaline phosphatase levels. Further research is required to substantiate these fi ndings. A dose dependent hepatic function study by feeding a serial dose of piperine is required to observe the effects of piperine as a hepatoprotective substance or a hepatotoxic substance.
A-473
An improved high performance liquid chromatography-fl uorescence detection method for the analysis of Pimozide in human plasma samples
A. Barassi, F. Ghilardi, C. A. L. Damele, R. Stefanelli, G. Melzi d’Eril. Dipartimento di Scienze per la Salute, Università degli Studi di Milano, Milano, Italy
Background: Tourette Syndrome (TS) is a chronic neurodevelopmental disorder characterised by combined motor and vocal tics. Neuroleptic drugs are considered the fi rst choice for the treatment of TS. Pimozide represents one of the alternative therapies and it is included in the atypical neuroleptic drugs. Since Pimozide has cardiotoxic and neurologic adverse effects, the therapeutic drug monitoring is essential. The aim of this study was to validate a sensitive, specifi c and reproducible method using high-performance liquid chromatography (HPLC) with fl uorescence detection and both small volumes of plasma sample and reduced quantities of reagents. Methods: The Pimozide working solutions for calibration and controls were prepared from the stock solution by adequately diluting in distilled water:methyl alcohol (50:50, v/v). The extraction procedure consisted in mixing 500 μL of plasma with 0,5
mL of sodium hydroxide 1 M and 2,5 mL of n-hexane-isoamyl alcohol (49/1, v/v), followed by upernatant evaporation under a continuous nitrogen fl ow. The samples were reconstituted with 200 μL of an ethanol:acetonitrile:water (10:45:45, v/v) mixture. The volume injected was 50 μL.The chromatographic separation of Pimozide and internal standard (IS), i.e. dextromethorphan hydrobromide monohydrate, was performed under isocratic conditions on a ZORBAX Eclipse XDB-C18 column (4,5 x 150 mm, 5 μm particle size, Agilent Tecnologies, USA) using the mixture acetonitrile:sodium dihydrogen phosphate 50 mM (65:35, v/v) as a mobile phase with a fl ow rate of 1 mL/min. The fl uorescence detection was performed at excitation wavelength of 285 nm and emission wavelength of 320 nm. Working solutions of Pimozide and IS, were obtained from Sigma (Sigma-Aldrich, Germany). The method was validated according to the European Medicines Agency guidelines (EMA, 21 July 2012). Results: IS and Pimozide retention times were at 2,66 and 11,56 min respectively. Linearity was confi rmed into the range 0-100 ng/mL. No carry-over effect was observed. The precision evaluation, based on low, medium, high as well as the lower and upper limit of quantifi cation, was satisfactory in the range tested, with relative standard deviation of 2,5-15,5% for intra-assay and 0,3-7,6% for inter-assay. The within-assay accuracy was found between -6,16 and +2,00 and the between-assay accuracy was between -5,14 and +5,90. Conclusion: This method was established, in course of validation, as precise, accurate, simple, rapid and useful for the limited volume of plasma and reagents employed. It is recommended for therapeuthic drug monitoring in TS patients.
A-474
Performance of the ARKTM Methotrexate Homogeneous Immunoassay on the Roche Cobas C-501.
V. C. Dias1, K. Gaeler1, D. A. Colantonio2, W. Walsh2. 1Department of Pathology and Laboratory Medicine, University of Calgary, Calgary Laboratory Services, Calgary AB,, Calgary, AB, Canada, 2The Hospital for Sick Kids, Toronto, ON, Canada
Background: Therapeutic monitoring of Methotrexate (MTX) is indicated in patients undergoing treatment of some sarcomas and neoplastic malignancies who are on high dose therapy ( >20 mg/kg body weight). In this institution, the monitoring protocol involves measuring MTX levels 4h post dose and at 24 h, 48 h, 72 h (and 96 h if necessary). To avoid serious toxicity, “rescue” treatment with folonic acid is administered until serum methotrexate levels are < 0.1 umol/L by 72 h, or until delayed excretion criteria is reached at <0.05 umol/L at 96 h. The objective of this study was to evaluate the analytical performance of the ARKTM Diagnostics MTX immunoassay (Sunnyvale, CA) a user-defi ned test on the Roche Cobas C-501.Methods: ARK Reagents, calibrators and instrument assay parameters for the Roche C-501 were obtained from Clinitox Diagnostix Inc. (Mississauga, ON). Comparative testing with an LC-MS-MS assay was performed using pooled patient specimens from a pediatric oncology clinic. Bio-Rad Liquicheck TDM controls, ARK methorexate controls and calibrators and patient samples were used for the assessment of imprecision and linearity. Method agreement studies were performed with our previous Abbott TDX, a Siemens EMIT method and an in house LC-MS-MS method.Results: Intra-assay imprecision (%CV) of 11.0%, 6.0%, 15.8% were observed for MTX levels of 0.07, 0.39 and 1.51 umol/L, respectively. The method was observed to be linear from 0.04 to 1.20 umol/L and the analytical measuring range expanded with fi xed serial dilutions. Method agreement results are shown in the table below.Conclusion: The ARKTM MTX immunoassay on the Roche C-501 provided equivalent results to the other immunoassay methods. However, signifi cant proportional bias was observed at MTX levels greater than 20 umol/L when compared with the LC-MS-MS method. We speculate this may be attributed to the manual differences necessary for dilution of levels greater than the analytical measuring range.
TableMethod(x) n Range(umol/L) Reg. Eq. R2 Average Bias
umol/LTDX 27 0.01 - 2.69 y=0.83x+0.05 0.98 -0.06EMIT 24 0.07 - 8.10 y=0.97x-0.03 0.97 -0.09
LC-MS-MS 50 0.05 - 2000 y=0.69x-2.08 0.91
-124.8 (all results)-0.30 (<20 umol/L)-389.5 (>20 umol/L)

TDM/Toxicology/DAU Tuesday, July 30, 9:30 am – 5:00 pm
CLINICAL CHEMISTRY, Vol. 59, No. 10, Supplement, 2013 A143
A-475
Drug testing in cerebral spinal fl uid by mass accuracy mass spectrometry: implications for forensic analysis
A. Rutledge1, E. Wong2, J. Zeidler3, C. Stefan2. 1McMaster University, Hamilton, ON, Canada, 2Centre for Addiction and Mental Health, Toronto, ON, Canada, 3Hamilton Regional Laboratory Medicine Program, Hamilton, ON, Canada
Background: A patient with no signifi cant medical history received an epidural anesthesia injection and unexpectedly died a short time later. As part of the investigation, a cerebral spinal fl uid (CSF) sample was collected and sent for testing. Epidurals commonly contain local anesthetics, opiates, and/or opioids, so these were the focus of the testing.Methods: The CSF sample was diluted ten-fold with water and internal standard (cyproheptadine and phenfl uramine) was added. 15 μL were then injected into an ultra high pressure liquid chromatography (UPLC)-Q Exactive tandem mass spectrometer. The UPLC was performed with a pentafl uorophenyl reverse-phase pre-column and column, using a gradient of 98% water/2% methanol to 5% water/95% methanol over 15 minutes, containing 10 mmol/L ammonium formate throughout. The Q Exactive, manufactured by Thermo Fisher, combines the mass selection capabilities of a quadropole with the high resolution, accurate-mass detection of the OrbitrapTM. In this case, switching between negative and positive electrospray ionization was used, the quadropole was set to scan mass-to-charge ratios of 100-800, and compounds present in the sample within this mass range were detected by the Orbitrap, which determined their accurate masses within fi ve parts per million. The Q Exactive has many advantages over typical liquid chromatography-tandem mass spectrometry systems. First of all, the required sample preparation is very quick, easy, and inexpensive, and because there is no extraction, there is no loss of compounds. In addition, the Q Exactive can effectively perform both targeted and non-targeted searches. For non-targeted drug screening, data from a single run of a sample can be reviewed an unlimited number of times, comparing the theorectical mono-isotopic accurate mass of a drug of interest to the extacted mass chromatogram from the sample for a match. This is only possible due to the high degree of accuracy achieved in mass determination with the Orbitrap. For targeted drug investigations, for example, to confi rm matches from a non-targeted approach or to quantify results, a standard (pure solution of a compound of interest) can be included in the run to compare retention times, theoretical mass, and peak areas to the patient sample. This approach is important to ensure correct identifi cation when there are isobaric compounds to be distinguished (e.g. morphine and hydromorphone), which cannot be done on mass alone. The data generated from running standards can also be added to a library to facilitate identifi cation of that compound in future specimens.Results: In this case, morphine, bupivicaine, benzocaine, lidocaine, atropine, fentanyl, and ondansetron were identifi ed as being present in the CSF sample by non-targeted screening. The concentration of fentanyl in the sample was estimated to be approximately 5 ng/mL when compared to a fentanyl standard. Another laboratory using gas chromatography-mass spectrometry also found morphine and bupivicaine in the sample, confi rming some of the Q Exactive fi ndings.Conclusion: This example demonstrates the vast power of the Q Exactive, which can be exploited for identifi cation of drugs in a specimen, especially for forensic purposes. The sample preparation required is very simple and accurate identifi cation, and potentially quantifi cation, are easily attained.
A-476
Therapeutic Drug Monitoring of Antiepileptic Drugs During Pregnancy
J. C. Ritchie1, P. Scott-Harrell1, C. Ramsey1, R. Lukacin2. 1Emory University, Atlanta, GA, 2Chromsystems Instrument & Chemicals, Munich, Germany
Background: Epilepsy is the most frequent neurological disorder worldwide with a prevalence of approximately 0.5 % in western countries. Around one quarter of people with epilepsy are women of reproductive age and most of them use antiepileptic drugs (anticonvulsants, AEDs) for adequate control of their seizures. Additionally, anticonvulsants are also used for the treatment of a broad range of other medical conditions such as bipolar disorders, cancer, neuropathic pain, anxiety disorders and migraines. Recent clinical studies have revealed that physiologic changes during different stages of pregnancy may lead to altered pharmacokinetics (especially altered clearance) for AEDs and broad individual variations which can result in diffi culty predicting appropriate drug dosages. It is also well known that fetal drug exposure to
some older AEDs (e.g. valproic acid) increases the risk of congenital malformations. Therefore, therapeutic drug monitoring for AEDs should play an important role in the management of patients on these medicines who become pregnant. Here, we describe the measurement of a wide variety of AEDS in two groups, of pregnant women (epileptics and bipolar).Methods: We measured serum AED levels once per month through out pregnancy in both groups using a commercially available mass spectrometry kit (MassTox. TDM Series A) from Chromsystems (Munich). The assay system is capable of measuring 26 different AEDs utilizing a single set of standards and a common extraction protocol. Samples are then chromatographed on one of 5 HPLC gradients and analysis by MS/MS. For each drug we plotted the dose to plasma concentration curve and calculated apparent clearance and relative clearance.Results: Dose to plasma concentration correlations varied widely between the different drugs. Almost all the drugs showed an increased clearance in the second and third trimester. This was true even for the use of the AEDs in bipolar patients where the drugs are used at much lower concentration as adjunct therapy.Conclusions: This pilot study demonstrates the utility of therapeutic drug monitoring of antiepileptic medications throughout pregnancy and highlights the use of LC-MS/MS in performing these measures. Additionally, the multiplexed MRM assay used in the study allows for the analysis of several different AEDs in a single run adding effi ciencies of staffi ng and instrument times in the process.

Tuesday, July 30, 9:30 am – 5:00 pm Hematology/Coagulation
A144 CLINICAL CHEMISTRY, Vol. 59, No. 10, Supplement, 2013
Tuesday, July 30, 2013
Poster Session: 9:30 AM - 5:00 PM
Hematology/Coagulation
A-477
Role of GGT in diagnosis of pulmonary embolism
Q. Niu, M. Yue, C. Zuo, J. Jia, H. Jiang. West China Hospital of Sichuan University, Chengdu, China
Objective: Increased gama-glutamyl transferase (GGT) level is associated with increased oxidative stress, which is the main causes of metabolic syndrome and the development of cardiovascular disease. However, the role of GGT in pulmonary embolism (PE) is unknown. In this study, we aimed to investigate the relationship between GGT and acute PE, expecting to fi nd a new biomarker for laboratory diagnosis of acute PE.Methods: A total of 62 patients [(20 with confi rmed acute PE, 22 with acute pneumonia, 20 with acute myocardial infarction (AMI)] and 20 healthy subjects were evaluated. Acute pneumonia and AMI patients were included as disease control. GGT and D-Dimer were measured with Sysmex CA7000 automatic coagulation analyzer and Roche Cobas 8000 automatic biochemical analyzer, respectively. Kruskal-Wallis H test and Nemenyi test were performed to detect the differences among groups. Spearman’s correlation was used as a test of correlation between GGT and D-Dimer in PE patients. P Values less than 0.05 were considered signifi cant.Results: GGT level in acute PE group was signifi cantly higher [92.5(29.8~192.5)] than that of healthy control [16.0(13.0~24.0)] (P=0.000), as well as those of acute pneumonia group [29.0(17.0~54.8)] (P=0.011) and AMI group [29.5(18.8~44.8)] (P=0.008). PE patients with negative D-Dimer (D-Dimer<0.55 mg/L) still had a higher GGT level [73.5(43.8~218.0)] than that of healthy subjects [16.0(13.0~24.0)] (P=0.001). In addition, in PE patients with positive D-Dimer and healthy subjects, the GGT level showed a positive correlation with D-Dimer level (r=0.514, P=0.001).Conclusions: Our results suggested a potential role for GGT in diagnosis and differential diagnosis of acute PE, even for patients whose D-Dimer levels were normal. The combination of GGT with D-Dimer may be a better diagnostic pattern than single D-Dimer detection for laboratory diagnosis of acute PE.
A-479
Assessment of Excess Anticoagulation on Specimens Processed with the Bloodhound™ Integrated Hematology System
J. Linder1, D. Bracco2, T. Khartabil2, T. Allen2, D. Hawkins3, D. Zahniser2. 1U. Nebraska, Omaha, NE, 2Constitution Medical Inc, Westborough, MA, 3University of Minnesota, Minneapolis, MN
Introduction: Proper collection of specimens before processing is a necessary factor in ensuring correct results. For hematologic analysis collection of an inadequate volume of blood in an EDTA tube may lead to a high ratio of anticoagulant to cell volume which may affect cell morphology. The Bloodhound™ Integrated Hematology System (Constitution Medical Inc., Westborough, MA, USA) is a fully automated hematology analyzer that uses proprietary technology to print undiluted whole blood onto a microscope slide, stain the slide, and then uses imaging to determine CBC parameters. Thus, the analysis depends on the integrity of cell morphology. This study assesses the effects of excess anti-coagulation on the performance of the Bloodhound Instrument.Methods: Residual undiluted whole blood samples collected in K2 EDTA collection tubes were used for this study. Samples were processed in triplicate on the Bloodhound Instrument within three (3) hours of venipuncture and the average result represented the Control for each parameter. Subsequently, three (3) equal aliquots of 500 μL from
the Control sample were transferred into three (3) separate K2 EDTA 13 x 75 lavender top tubes to mimic excessive EDTA exposure. Each of these samples was immediately processed using the automated mode on the Bloodhound Instrument and the average of the three (3) established the Test result for each parameter. A matched pairs t test and Bland-Altman analysis was performed for WBC< RBC, MCV, MCH, PLT, MPV, NRBC NEUT, LYMPH, MONO, EOS, BASO NRBC and RETIC. A red blood cell morphology evaluation was also performed on both the Control and Test samples by a Medical Technologist who grading images on the Bloodhound Viewing Station for the presence or absence of 21 abnormal RBC featuresResults: Thirty two (32) samples comprised the fi nal analysis. The paired results from each sample were analyzed by matched pairs t tests for equivalence. The results of this analysis showed that the following parameters had a statistical difference between Control and Test: PLT, MPV, NEUT%, NRBC% and MCH; however, Bland-Altman analysis showed that none of these parameters were outside of the pre-defi ned bias acceptance limits. The RBC morphology assessment showed strong concordance between, the Control and Test samples. There was no induction of abnormal RBC morphology by the excess anticoagulation with the exception of Burr cells in 40% of cases.Conclusions: The results of the study show that excessive EDTA, at the volumes evaluated in the study, does not alter cell morphology suffi cient to impair the ability of the Bloodhound Instrument to perform an automated CBC and WBC differential. Differences that were observed were within acceptable bias limits, and may be explained by differences in sample processing time. *The Bloodhound™ Integrated Hematology System is under development and is not currently cleared by the Food and Drug Administration.
A-480
Verifi cation of the Reference Range for Platelet Function Testing: Evaluation of Normal Donors for the VerifyNow PRU Test
J. Coleman, C. Napolitano, J. R. Dahlen. Accumetrics, San Diego, CA
Background: The Accumetrics VerifyNow PRU Test contains an off-drug reference range of 194 - 418 PRU which requires verifi cation or validation prior to result reporting. This range is the 95% confi dence interval determined on subjects with a history of cardiovascular disease prior to the planned administration of a P2Y12 inhibitor and is calculated according to the recommendations contained in the CLSI C28-A2 guideline. It is often diffi cult to obtain blood samples from this population in order to validate or verify the reference range; alternatively, blood samples from healthy volunteers are used. The purpose of this study is to compare the range of PRU results obtained on healthy volunteer subjects to the reference range reported in the VerifyNow PRU Test package insert.Method: Whole blood samples were obtained from normal volunteers at sites performing validation studies on the VerifyNow PRU Test (formerly P2Y12 test) from January through December 2011. Blood used for testing was collected into 3.2 percent sodium citrate using a 21 gauge needle following blood collection into a sodium citrate or no-additive discard tube. Samples were allowed to equilibrate at room temperature for 10 minutes, and all tests were completed within 4 hours. Volunteers were questioned and self-reported any use of an anti-platelet agent within 10 days prior to sample collection, and any volunteer who reported such exposure was excluded from the validation or verifi cation activities. Each sample was collected according to individual institution policies and practices, and no donor identifi ers were recorded.Results: There were 779 individual donor results obtained from 176 VerifyNow instruments at 158 hospital sites during the time period, representing data obtained from 21 test device lots. The mean of the normal subject dataset is 324.5 PRU, which is greater than the mean of the reference range subjects of 306.7 PRU. The 95% confi dence interval of the normal donor data is 248 - 406 PRU, as compared to the 95% reference range interval of 194 - 418 PRU reported in the test package insert on subjects with a history of cardiovascular disease. One value (0.1%) was below and 10 values (1.2%) were above the reference range of 194 - 418 PRU.Conclusions: The 95% confi dence interval of the normal donor is within the wider reference range contained in the package insert. The reference range was developed from a population with a history of cardiovascular disease, with increased age and potential comorbidities and concomitant medications. It is acceptable to utilize normal donors to validate or verify the reference range; however it is important to note that results from a normal donor population may not span the entire reference range from the typical patient population.

Hematology/Coagulation Tuesday, July 30, 9:30 am – 5:00 pm
CLINICAL CHEMISTRY, Vol. 59, No. 10, Supplement, 2013 A145
A-481
Optimising The Use Of A Conversion Factor For Calculation Of Total Iron Binding Capacity From Transferrin
M. Rehan, N. Caruso, J. Beattie, M. Pai, A. Don-Wauchope. McMaster University and Hamilton Regional Laboratory Medicine Program, Hamilton, ON, Canada
Introduction Transferrin is the body’s primary iron-transport protein, and measurements of transferrin saturation (TS) are useful in the investigation of anemia and iron overload. Total iron binding capacity (TIBC) is the maximum amount of additional iron needed to saturate transferrin, and is an indirect way of assessing transferrin. Theoretically, 1 mol of transferrin binds 2 mol of ferric iron, yielding a ratio of TIBC (in μmol/L) to transferrin (in g/L) of 25.1. However, the literature reported mean ratio ranges from 17.6 to 29.2, depending upon the precision and bias of the analytic method.The Hamilton Regional Laboratory Medicine Program (HRLMP) recently moved from the Roche Modular platform, which measured serum and plasma iron and unsaturated iron binding capacity (UIBC; which when added to serum iron yields the TIBC) using a colorimetric assay, to the Abbott Architect platform, which measures plasma iron and transferrin using colorimetric and immuoturbidometric assays respectively. Our objective was to determine the ratio of TIBC to transferrin using these two analytic platforms, in order to calculate TIBC using an optimal conversion factor.Method Routine blood samples received at the HRLMP over a three week period (Oct/Nov 2012) were used to randomly select approximately 80 samples in each of three groups (low, high and within reference interval iron and ferritin). These were subsequently analyzed for iron and UIBC on the Roche Modular and iron and transferrin on the Abbott Architect.Three methods were used to establish a conversion factor to calculate TIBC from transferrin. First, weighted linear fi t was used to calculate a constant and a proportional bias, which were added together to get a conversion factor. Second, each measured TIBC was divided by the corresponding measured transferrin to get individual conversion factors, which were then averaged. Third, the sum of all TIBCs was divided by the sum of all transferrins to get a conversion factor.Result 238 samples were available for analysis. Eleven samples were excluded due to missing values and 8 outliers were excluded after reviewing the scatter plot. The weighted linear fi t, using transferrin on the x-axis and TIBC on the y-axis, showed proportional bias of 21.32 and constant bias of 1.81. The sum yielded a conversion factor of 23.1. Conversion factors of 22.2 and 21.2 were derived using the second and third method, respectively.Individual values of transferrin were then multiplied by each of the conversion factors to calculate TIBC. Descriptive statistics and box and whisker plots of the results were reviewed. The factor of 22.2 derived from individual patient results matched the Roche-derived TIBC most closely.Conclusion Our derived factor of 22.2 is optimal for calculating TIBC from transferrin, and will minimize the impact of our transition from Roche Modular to Abbott Architect platforms on clinically important results. There is no analytical standard to assess transferrin saturation and thus, we recommend that laboratories derive in-house conversion factors, instead of relying on theoretical ratios.
A-482
Measurement of zinc protoporphyrin and non-complexed protoporphyrin in human erythrocytes by liquid chromatography
K. M. Kloke, M. J. Magera, P. A. Chezick, K. M. Raymond, S. Tortorelli. Mayo Clinic, Rochester, MN
Background: Erythrocyte (RBC) porphyrins consist almost entirely of protoporphyrin. Increased RBC non-complexed (free) protoporphyrin (FPP) is characteristic of erythropoietic protoporphyria (EPP). In X-linked dominant protoporphyria (XLDPP), both FPP and zinc protoporphyrin (ZPP) are increased. Iron defi ciency anemia is the most common cause of increased RBC ZPP with other causes being related to chronic intoxication caused by exposure to heavy metals, halogenated solvents, some pesticides and medications. Therefore, when total RBC porphyrins are elevated, fractionation and quantitation of ZPP and FPP is necessary to differentiate the inherited protoporphyrias from other potential causes of elevations. Current laboratory evaluations may consist of a total porphyrin determination, measurement of ZPP by hematofl uorometry or a combination of two extractions: the fi rst to determine
the total porphyrin concentration via spectrophotometry and a second to determine ZPP and FPP utilizing high performance liquid chromatography (HPLC). Results from the total and the fractionation are combined to calculate the concentration of each protoporphyrin fraction. These differential and step-wise approaches often yield incomplete or ineffi cient and time-consuming characterizations. We describe a simplifi ed method using a single extraction and measurement of ZPP and FPP by HPLC technology alone. This modifi ed approach has lowered the amount of supplies and reagents used (~40%) and decreased technologist time required to prepare the samples (~50%).Methods: One hundred μL of washed erythrocytes was added to 200 μL of water to lyse the cells. Porphyrins were extracted from the sample using 1 mL of ethyl acetate: acetic acid (80:20, v:v). After vortexing and centrifugation, 25 μL of the supernatant was injected onto a HPLC system with fl uorescence detection (Shimadzu Corporation, Columbia, Maryland). The excitation wavelength was set at 408 nm with an initial emission wavelength at 589 nm, switched to 632 nm after 6 minutes. The analytical time was 10 minutes for an isocratic elution using methanol: aqueous phosphate buffer, pH 3.5 (90:10, v:v).Results: Method performance was demonstrated through imprecision, linearity, recovery and specimen stability studies. Intra-run imprecision coeffi cients of variation (CVs) ranged from 2.0% to 5.7% for ZPP and 0% to 6.2% for FPP. Inter-run imprecision CVs for ZPP ranged from 6.9% to 8.9% and 0% to 4.5% for FPP. Linearity studies were performed using standard solutions of known concentrations. Linearity was demonstrated for each analyte over the range 10 to 250 μg/dL, yielding the following relationships: y ZPP = 0.896x + 3.44, R2 = 0.9979; y FPP= 1.053x + 0.4772, R2 = 0.9994. Recoveries averaged 79% for ZPP and 89% for FPP across the analytical measurement range. A stability study demonstrated that ZPP and FPP in washed erythrocyte specimens are stable without any signifi cant change in analyte concentration at ambient, refrigerated and frozen (-20ºC) temperatures for up to 14 days and through 3 freeze/thaw cycles.Conclusion: This streamlined evaluation by HPLC is a cost effective method modifi cation providing simultaneous, rugged and reliable analysis of zinc protoporphyrin and non-complexed protoporphyrin in washed erythrocytes for the differential evaluation of an inheritable protoporphyria versus other causes.
A-483
Nitric oxide synthase (NOS) in thin fi lms as a nitric oxide-generating coating to counteract thrombosis on medical devices
B. Gunasekera, M. Bayachou. Cleveland State University, Cleveland, OH
Thrombosis is a major problem on blood-contacting medical devices. Artifi cial coatings releasing small amounts of nitric oxide (NO) are known to counteract platelet adhesion, and the thrombosis cascade. Sources releasing NO have been proposed as coatings for blood-contacting devices. We proposed a novel approach using recombinant NOS in thin layers, which generate NO using substrates from blood or the bathing medium. We fi rst introduced the Layer-by-layer (LbL) adsorption of inducible NOS oxygenase domain (iNOSoxy) on polyethylenimine (PEI) matrix. In the current work, we study the effect of pH and matrix structure on NOS loading onto LbL coatings. We also study the effects on the catalytic effi ciency of immobilized NOS and the resulting NO fl uxes.We examined how the pH of the protein solution modulates the amount of iNOSoxy adsorbed onto a PEI-coated surface. We also examined whether the charge density of PEI matrix can modulate enzyme loading. We used iNOSoxy solutions and both linear and branched PEI solutions to investigate the charge-driven immobilization. We used Fourier Transform infrared spectroscopy (FTIR) to characterize immobilized iNOSoxy fi lms.Atomic force microscopy (AFM) suggests more iNOSoxy immobilized on fi lms formed at pH 8.6 or using the branched version of the PEI matrix.We used catalytic reduction of exogenous NO mediated by immobilized iNOSoxy as a measure of activity. Results show higher activity for fi lms immobilized at pH 8.6 compared to pH 7. We monitored NO release using the Griess assay. Again, results show higher levels of NO released from fi lms constructed with iNOSoxy solution at pH 8.6 compared to pH 7. Also, a higher average NO fl ux is observed from PEI/iNOSoxy LbL fi lms having the branched version of PEI as opposed to the linear form. We will discuss these fi ndings in light of platelet adhesion from platelet-rich plasma on surfaces coated by the fi lms.

Tuesday, July 30, 9:30 am – 5:00 pm Hematology/Coagulation
A146 CLINICAL CHEMISTRY, Vol. 59, No. 10, Supplement, 2013
A-484
Serum free light chain (SFLC) ratio and serum protein electrophoresis (SPEP) as a substitute for 24-hour urine paraproteinuria in phase I myeloma patients.
N. N. Shah1, J. Kaufman2, A. Langston2, E. Waller2, L. Boise2, R. Harvey2, S. Lonial2, A. Nooka2. 1Emory University, Atlanta, GA, 2Winship Cancer Institute, Emory University, Atlanta, GA
Background: Paraprotein estimation in myeloma patients includes testing SPEP, immunofi xation (SIFE), SFLC ratio, and 24-hour urine collection for UPEP and UIFE. 24-hour urine collection is a cumbersome process. Prior studies evaluating its substitution with SFLC ratio and SPEP had limitations of including variety of plasma cell dyscrasias and both newly diagnosed and relapsed/refractory myeloma. We evaluated if SFLC ratio and SPEP can substitute for 24-hour urine collection in a homogenous population of advanced myeloma patients, where a shift in secretion from intact immunoglobulin to SFLC (free light chain escape) is observed.Methodology: We analyzed 116 myeloma patients that enrolled in a phase I clinical trial between 08/2006-12/2012 with SPEP, SIFE, SFLC ratios, UPEP and UIFE. Sensitivity of testing for SFLC ratios, SPEP and SIFE were compared to UIFE. Subsequently, we assessed the linear relationship between SFLC dichotomized by abnormal ratio (<0.26 or >1.65) vs. 24-hr paraproteinuria. We used SAS version 9.3 for analysis.Results: The sensitivities of SPEP, SIFE and abnormal SFLC ratio assays were 77%, 95% and 96%, respectively. The sensitivity of SFLC+SPEP/SFLC+SIFE increased to 100% enabling detection of paraprotein in all patients (Table 1). In our second analysis, the quantifi cation of SFLC correlated with 24-hr urinary paraprotein estimation. With every log increase in lambda and kappa light chains, 24-hr urinary paraprotein log increased by 0.52 times (p<0.0001) and 0.53 times (p<0.0001); correlation coeffi cients 0.62 and 0.6, respectively (Figure 1).Conclusions: In advanced myeloma patients, SFLC ratio in combination with SPEP or SIFE detected monoclonal paraprotein in 100% of patients. In addition, there was a linear correlation of SFLC with 24-hr urinary paraprotein estimation questioning the need for 24-hour collection. Further studies to monitor SFLC ratios and 24-hour urine over a period of time may completely eliminate this cumbersome test in advanced myeloma patients.
A-485
Predicting Iron Defi ciency from Complete Blood Counts using a Mathematical Model of RBC Maturation
H. Patel, H. R. Patel, J. M. Higgins. Center for Systems Biology and Department of Pathology, Massachusetts General Hospital; and Department of Systems Biology, Harvard Medical School, Boston, MA
Background: Iron defi ciency is the most common nutritional defi ciency worldwide and is often the fi rst sign of serious illnesses such as colon cancer. Earlier and more routine identifi cation of iron defi ciency would improve public health. Current methods of diagnosis typically depend on the presence of anemia to trigger the measurement of iron levels, which are not routinely measured and require different tube types and additional costs. In contrast, complete blood counts are routinely measured on most patients and are often done on modern automatic hematology analyzers which provide a high-resolution single-cell assessment of the dynamic processes of red blood cell (RBC) production, maturation, and clearance. Previous work described a mathematical model of RBC population dynamics that enables the inference of single-RBC rates of maturation and clearance from a single routine complete blood count (CBC) and reticulocyte count [1]. These rates appear to be perturbed in consistent ways in iron defi ciency anemia and latent iron defi ciency.Hypothesis: We hypothesize that rates of RBC production, maturation, and clearance as inferred from a complete blood count and reticulocyte count measured on an Abbott Sapphire Cell-DYN automated hematologic analyzer can predict iron defi ciency with or without anemia up to 4 months before it actually occurs.Methods: We measured complete blood counts and reticulocyte counts for outpatients undergoing routine testing at a large tertiary care medical center. We established a reference range in 20 healthy individuals for RBC maturation and clearance rates as inferred using a published mathematical model of RBC population dynamics [1]. We then established a diagnostic threshold for iron defi ciency by analyzing CBCs and reticulocyte counts from 15 patients with iron defi ciency anemia and assessed its accuracy in the prediction of iron defi ciency in a separate group of cases and controls.Results: We identifi ed 20 case patients who had a normal hematocrit followed no more than 4 months later by iron defi ciency, defi ned as low iron or low ferritin. We also identifi ed 20 control patients with normal hematocrit who showed no evidence of iron defi ciency in the subsequent four months. Using CBC and reticulocyte counts at the time of normal hematocrit for the cases and controls, we inferred single-RBC rates of maturation and clearance and predicted iron defi ciency with a sensitivity of 80% and a specifi city of 90%. Because the case patients were not anemic at the time of the analysis, diagnostic sensitivity for these cases using current approaches is 0%.Conclusions: Iron defi ciency can be accurately predicted from normal CBC and reticulocyte counts by inferring single-RBC maturation and clearance rates using a mathematical model of RBC population dynamics.References:1. Higgins, J.M. and L. Mahadevan, Physiological and pathological population dynamics of circulating human red blood cells. Proceedings of the National Academy of Sciences of the United States of America, 2010. 107(47): p. 20587-20592.

Hematology/Coagulation Tuesday, July 30, 9:30 am – 5:00 pm
CLINICAL CHEMISTRY, Vol. 59, No. 10, Supplement, 2013 A147
A-486
Expansion of a Multisite, Advanced Analytical QC Program to include Prothrombin Time Testing using Sigma Statistics Based on Auto-Generated Peer Values.
H. H. Harrison, D. Young, D. Sargent, J. Labarbera, C. Fereck, W. Fitt, D. Kimmich, D. Kremitske, M. Lopatka, S. Sharretts, K. Smeal, P. Dorion, R. Rolston, M. Wilkerson, E. Yu, J. Jones. Geisinger Medical Laboratories, Danville, PA
Background:: We have previously described an electronically integrated method of QC standardization that includes application of the Westgard sigma statistics and OPspecs approach to selection of QC rules for chemistry analyzers across eleven Geisinger Medical Laboratories in central PA. The objective of the present project is expansion of this enterprise-wide advanced analytical QC (AAQC) approach to coagulation assays, namely prothrombin time. In contrast to chemistry QC data, the coagulation control materials have no publically available peer performance data. However, with thirteen coagulation instruments, there were suffi cient data to auto-generate a peer group of target means within GML. Methods: In preparation we validated a systemwide reference range using the same lot of Neoplastine activation reagent, and then had all labs use the same lot of QC material. A single vendor (Diagnostica Stago) was source for the instrumentation, which included the Evolution (2), Compact (4), Satellite (1), and Start4 (7); and the control materials (Coag N and Coag ABN). Results: Three months of daily QC data were used to establish the baseline prothrombin time (sec) peer group targets and sigma values shown below:
BASELINE PEER GROUP DATA: Oct ‘12 Nov ‘12 Dec ‘12COAG NORMAL: Mean 13.0 13.0 13.0
Std Dev 0.40 0.41 .019CV 3.08% 3.15% 1.46%
COAG ABNORMAL: Mean 36.9 36.9 36.6Std Dev 1.23 1.34 1.03CV 3.33% 3.63% 2.81%
BASELINE SIGMA VALUES: (N=9) (N=11) (N=11)COAG NORMAL: Mean σ 7.8 8.4 8.5COAG ABNORMAL: Mean σ 7.3 7.3 6.9We found day-to-day variation of less than 4% for both controls. Site-specifi c mean deviations are all well within the 15% CLIA criterion for TEa, with only 3 of 62 in excess of 6.1%. Conclusion: Baseline sigma values achieved with the Stago instruments are consistently in excess of 4, the value used as the threshold for widening the initial QC warning to 1-3s. Accordingly we have adjusted the QC acceptance criteria for the prothrombin time assays and are now compiling the initial enterprise-wide data for 1-3s events to test the hypothesis that, as with previously adjusted chemistry rules, the new QC rules will result in a reduction of 60 to 80% false QC “stops” and associated workfl ow disruption.
A-487
Quality Control Practices in Ontario Coagulation Laboratories
B. Aslan1, A. Raby1, K. Moffat2, R. Selby3, R. Padmore4. 1Ontario Medical Association, Quality Management Program – Laboratory Services (QMP-LS), Toronto, ON, Canada, 2Hamilton Regional Laboratory Medicine Program, Hamilton, ON, Canada, 3Sunnybrook Health Sciences Centre and University Health Network, Toronto, ON, Canada, 4Ottawa Hospital - General Campus, Ottawa, ON, Canada
Background: Quality control (QC) procedures are crucial in reporting accurate patient test results. QMP-LS provides an external quality assessment program for Ontario laboratories. In 2012, a patterns-of-practice survey was conducted to gather and share information on current quality control practices for coagulation testing and to assess and provide guidance on recommended practices.Methods: A web-based survey questionnaire was distributed to 174 laboratories that are licensed to perform prothrombin time (reported as an international normalized ratio) (PT/INR) and activated partial thromboplastin time (APTT) in Ontario. All laboratories responded. Results: All laboratories use commercial QC materials, obtained from the analyzer’s manufacturer (75%) or another source (32%). 12% also use an in-house QC comprised of pooled patient plasma. Most laboratories (PT/INR [69%] and APTT [68%]) run commercial QC at the beginning of each shift and 25% of laboratories run QC when the analyzer has not been in use for a certain length of time. A small
number of participants (PT/INR [6%] and APTT [7%]) only run commercial QC at the beginning of the day. In addition, other participants (PT/INR [59%] and APTT [55%]) run QC following maintenance, reagent change, middle of each shift, and with every repeat sample. Laboratories determined the frequency of performing QC based on manufacturer recommendations (PT/INR [71%] and APTT [70%]). Other factors infl uencing the frequency of the QC run included stability of test (PT/INR/APTT [27%]), clinical impact of incorrect test result (PT/INR [25%] and APTT [24%]), and the number of samples potentially requiring repeat analysis (PT/INR [10%] and APTT [11%]). Of note, 72 (41%) laboratories reported other frequency determinants. Of these, 72% use Ontario Laboratory Accreditation (OLA) requirements, 6% use other guidelines, and 22% use either directive from the laboratory director, past practices and/or the length of the workday. All laboratories use preset QC limits for the assessment of QC results. These limits are based on precision goals provided by manufacturers (46%), standard deviation of the QC results (66%), published precision goals (26%), and QMP-LS allowable performance limits (20%). 51 % use combination of more than one sources. For the PT/INR, 107 laboratories reported precision goals as the coeffi cient of variation (% CV). Of these 59% use 5% CV while 29% use less than, and 12% use greater than 5% CV. For APTT, 100 laboratories reported precision goals as % CV, 45% use 5% CV, 41% use less than 5% and 14% use between 6-25% CV.In the case of QC failure, 97% (n= 168) of the laboratories repeat the QC, if it passes results are reported, 95% (n=166) open new QC, 93% (n=161) look for trending, 90% (n=156) discontinue testing, and 42% (n=73) repeat all patient samples from last acceptable QC.Conclusion: These data illustrate the wide variability in QC practices for coagulation testing in Ontario. In 2013, the QMP-LS Hematology Scientifi c Committee will publish a Consensus Practice Recommendation to help reduce the variation in practice and encourage best practices.
A-491
Novel haemostatic biomarkers in acute cardioembolic stroke
I. Kitajima, K. Hirano, N. Tani, K. Tanaka. University of Toyama, Toyama, Japan
Background: We studied the usefulness of haemostatic biomarkers in assessing the pathology of thrombus formation, subtype diagnosis, prognosis in the acute phase of cerebral infarction, and differences between various haemostatic biomarkers.Methods: Our study included 69 patients (50 men and 19 women; mean age 68±12.0 years) with acute cerebral infarction who had been hospitalized within 2 days of stroke onset. Fibrin monomer complex (FMC), thrombin-antithrombin complex (TAT), D-dimer, and fi brin/fi brinogen degradation products (FDP) were assayed as haemostatic biomarkers on days 1, 2, 3 and 7 of hospitalization. FMC, D-dimer and FDP were assayed by turbidimetric immunoassay (TIA), and TAT was measured by time-resolved fl uoroimmunoassay (TR-FIA). Changes over time in FMC, TAT, D-dimer and FDP were analyzed using the paired t test. p<0.05 was considered statistically signifi cant.Results: In the cardioembolic (CE) stroke group, FMC levels were signifi cantly higher on day 1 (37±69 μg/mL) compared to the non-cardioembolic (non-CE) stroke group (6.6±8.6 μg/mL) (p<0.01), and D-dimer levels were also signifi cantly higher on 1 day (5.4±8.9 μg/mL), compared to non-CE stroke group (1.5±1.5 μg/mL) (p<0.01). Both markers were decreased on days 3 and 7 of hospitalization. FDP levels were signifi cantly higher at all times in the CE group compared to the non-CE group (p<0.05), whereas levels of TAT was not elevated. Neither the National institute of Health Stroke Scale (NIHSS) score during hospitalization nor the modifi ed Rankin Scale (mRS) used at discharge found any signifi cant correlations to haemostatic biomarkers, but the NIHSS score during hospitalization was signifi cantly higher in the CE group than in the non-CE group (p<0.05).Conclusion: Measurements of haemostatic biomarkers such as FMC and D-dimer on the early stage of cerebral infarction are useful for distinguishing between CE and non-CE stroke.

Tuesday, July 30, 9:30 am – 5:00 pm Hematology/Coagulation
A148 CLINICAL CHEMISTRY, Vol. 59, No. 10, Supplement, 2013
A-492
CBC PARAMETER PRECISION PROFILES FOR UNICEL DXH HEMATOLOGY SYSTEMS
L. Tejidor, R. Magari, K. Lo, P. ONeil. Beckman Coulter, Miami, FL
Introduction: Instrument validation includes the evaluation of system precision throughout the measuring range including medical decision levels. The concept of precision profi les is referenced in CLSI H26-A2, with CLSI EP5-A2 providing the fundamental defi nition for estimating repeatability. Hematology parameters have several medical decisions levels, making it necessary to characterize precision throughout the measuring range. Characterizing system precision also provides information for the determination of the lower limit of quantitation, and establishing claims at those levels. Using a method established by the authors (Magari, Lo, Tejidor) an assessment of the CBC parameters on the DxH Series of Hematology systems was evaluated providing an estimate of system precision throughout the parameter measuring range using precision profi les.Method: Blood samples from a multi-center study consisting of normal, abnormal and prepared samples covering the measuring range were used in the study. Ten replicates were collected for each sample. Precision profi les were based on the relationship between the mean for each sample and the coeffi cient of variation (CV%), and were modeled with a power functions as:CV = α Meanβ + εWhere α and β were the parameters of the model and ε was the random error. SAS statistical software was used for analysis. Precision profi les were estimated for the CBC hematology parameters. Precision performances at different medical decision levels along with their 95% confi dence upper bounds were also included.Results: Throughout the measuring range, the precision performance (CV%) was not constant for the CBC count parameters. PLT CV% increased to 15.8% at the lower limit of quantitation, 3.45 x 10⁶ cells/uL. WBC CV% at an ultra-low level of 0.05 x 10 3 cells / μL was 11.6% with an upper 95% confi dence limit of 13.1%. WBC CV% at 396.4 x 10 3 cells / μL was 0.25% with an upper 95% confi dence limit of 0.31%. Precision performance specifi cations were met for all CBC count parameters.Conclusion: Estimating the precision of hematology parameters across the measuring range using precision profi les provides an improved visualization of system precision for parameters at clinically relevant levels. Using a multitude of samplings, precision profi les provide a greater degree of confi dence over the routine analysis consisting of a small number of replicates and reduces the potential for errors. The precision profi les provided represent typical responses for the CBC parameters as performed on DxH Series Hematology systems under routine laboratory conditions. Instrument and laboratory conditions are variables that should be considered as they may contribute to the actual precision performance results obtained.
A-493
Evaluation of Data Segmentation Results using Metrics on Beckman Coulter CytoDiff™ Application in HematoFlow Solution
C. Ramirez, C. Godefroy, J. Riley, E. Gautherot, G. Bouvier-Borg, J. Naegelen, P. ONeil. Beckman Coulter, Miami, FL
Background: The CytoDiff analysis software automates the analysis of the 10-part WBC differential provided by the fl ow cytometry system on the Beckman Coulter HematoFlow solution eliminating the need for manual gating. The CytoDiff CXP software provides new metrics that assess the degree of certainty in the automated population classifi cation.Methods: The software encompasses two histogram based confi dence metrics: a region separability score and a data distribution score. The region separability score is used to analyze the data along the boundary of a region and can be applied to detect poorly separated clusters of data. The data distribution scored is used to analyze the behavior of the data within the region and is useful to establish the similarity of the data to a known distribution (e.g. Gaussian). Low scores on data distribution might be caused by noise, debris or events originating from a bigger population rather than from a pure data cluster.Population based confi dence metrics collect and summarize the information from independent metrics. Histogram based metrics for each of the regions involved in the identifi cation of a population are combined to take into account their interdependency. Other metrics, such as estimated percent of aggregation, template matching score or
the like are also incorporated in the population based metric. Metrics are weighted to account for their numerical signifi cance. The CytoDiff software provides a population based confi dence metric for each of the populations in the 10-part Differential.Results: 844 CytoDiff sample runs collected along with Manual reference were analyzed to characterize the behavior of the Blast confi dence score metric when plotted against the difference between the reported CytoDiff Total Blast % and the Manual Reference Blast %. Polynomial models are used to capture the overall data behavior.The data shows a tendency for samples to have a low Blast confi dence score as the numerical difference between the two methods increases. The data was divided according to the amount of Blast % reported in the Manual reference.Conclusion: The CytoDiff analysis software provides a set of metrics (i.e., numerical values) used in conjunction with other parameters to assess the certainty of the population classifi cation, thus enhancing the laboratory’s review and auto-validation of process.CytoDiff is not available for in vitro diagnostic use in the United States.
A-494
The Stability of Anti Xa Activity on Frozen Plasma Samples For a One Year Period
K. Finnegan, G. Hornstein, D. Kochhar, T. Smith. Stony Brook University, Stony Brook, NY
Laboratories routinely freeze plasma samples for coagulation refl ex testing; however, the stability of Anti-Xa activity has not been measured over the long-term. Heparin and LMWH are anticoagulants that can be monitored using an Anti-Xa assay. The study was initiated to validate the integrity of frozen samples, thawed and tested at day 1, month 1, month 3, month 6 and one year when performing an Anti-Xa assay using a chromogenic method. One-hundred and three plasma samples were acquired from patients on heparin between ages 35 and 65 with Anti Xa values ranging from 0.1. to 1.15 IU/ml. Using a pre-calibrated pipette, 0.5 mL aliquots were transferred to labeled micro-centrifuge tubes, and subsequently frozen at -70⁰C (with the exception of day 1 which was tested upon arrival to the laboratory). On respective testing days, samples were thawed in a 37⁰C water bath for fi ve minutes. The Anti Xa assay was performed on a STA Compact® with STA Rotachrom Heparin®; STA Heparin Control®; STA Quality HBPM/LMWH®; STA Hepanorm H (UFH) ®; and STA Calibrator HBPM/LMWH®. Assays were performed in singlicate and the values were compared at day 1, month 1, month 3, month 6 and one year by linear regression. Linear regression analysis demonstrated a strong correlation between day I and one year values (R2). An R2 value of .98, .96, .97, and .98 was observed when comparing results for day 1 with month 1, month 3, month 6, and one year respectively representing a strong linear association, or little change in the amount of active heparin.
Linear RegressionN Slope Intercept R2
Month 1 102 .969 -0.0149 .978Month 3 103 .972 -0.0011 .961Month 6 103 .980 0.0216 .974One Year 76 .976 -0.0027 .980Our Conclusion is that frozen plasma thawed and tested at day 1, month 1, month 3, month 6 and one year yields stable laboratory results when analyzing Anti-Xa activity.
A-495
Prognosis of Chronic Myelogenous Leukemia and Acute Lymphoblastic Leukemia patients with BCR-ABL Fusion Gene subtypes
Y. Ye, J. Zhou, Y. Zhou, X. Song, Y. Zhou, J. Wang, l. Lin, B. Ying, X. Lu. West China hospital of Sichuan university, Chengdu, China
Background: It is now reported that about 15-20% adult acute lymphoblastic leukemia (ALL) have the characteristic t(9;22)(q34;q11) cytogenetic other than 90-95% cases of chronic myeloid leukemia(CML) and different subtypes were found such as M-bcr, m-bcr and μ-bcr. It is known that CML patients show a higher prevalence of M-bcr and ALL patients show a higher prevalence of m-bcr, but the relationship between BCR-ABL subtypes in progression of CML and ALL is still not fully understood. In this study, clinico-biogical risk factors were collected and assessed in order to make a preliminary investigation on the relationship between BCR-ABL subtype and patient feature in different disease entities.

Hematology/Coagulation Tuesday, July 30, 9:30 am – 5:00 pm
CLINICAL CHEMISTRY, Vol. 59, No. 10, Supplement, 2013 A149
Methods: 349 CML chronic phase(CML-CP) patients and 71 ALL patients before treatment detected as BCR-ABL fusion gene positive were involved in this study and were divided into M-bcr , m-bcr and mixed group. Clinico-biogical risk factors at diagnosis were collected and assessed in order to make a preliminary investigation on the relationship between BCR-ABL subtypes. To further analysis the relationship between BCR-ABL subtype and prognosis for CML and ALL patients, patients under imatinib treatment were followed with BCR-ABL relative concentration collected after 3 months, 6 months, 9 months and 1 year.Results: Our results indicates that there are signifi cant difference between CML-CP, CML-BP and ALL group (p<0.05) in BCR-ABL subtype distribution. Taking other clinico-biogical factors into consideration, both CML and ALL patients with M-bcr tend to show characteristics of older age and higher-WBC counts in both CML and ALL patients. For the followed-up patients, in CML group, although BCR-ABL relative concentration showed no signifi cant difference among three groups at diagnosis, there were signifi cantly differences after 3 months’ treatment and the differences enlarged with further treatment; in ALL group, although there was no signifi cant difference in BCR-ABL relative concentration after treatment at early stage, there was signifi cant difference in BCR-ABL relative concentration after 1 year.Conclusion: This study identifi es the BCR-ABL gene as an important factor in CML and ALL. The result suggests that subtype M-bcr associated more with CML while subtype m-bcr associated more with ALL. As showed from the followed-up patients, our study also confi rmed that patients with the m-bcr subtype may have a worse prognosis in patients with the M-bcr subtype.
A-496
Elevated Th17 cells of patients with Multiple myeloma.
J. Li, Q. Niu, D. Tang, J. Su, H. Jiang, Y. Jia. West China Hospital of Sichuan University, Chengdu, China
Background: Multiple myeloma (MM) is characterized by the production of monoclonal immunoglobulin. Relapse of MM occurs because of minimal residual disease. Therefore, additional treatments are needed to control the disease. Immunologically, the bone marrow (BM), which is a reservoir of T cells possess some unique properties. The BM also serves as a reservoir of T-helper 17(Th17) cells. It is mentioned in many researches that the immune system is important in controlling MM. Th1 cells are classic cells in the immunoreactions, but the recent studies show that Th17 cells play an important role in inducing immune responses. This study is to evaluate the potential role of Th17 cells in immune dysfunction of MM.Methods: BM samples were collected from 60 patients with MM (39 patients in untreated group, 21 patients in remission group) and 20 healthy donors in control group. Flow cytometry was employed to determine the frequencies of Th17 and Th1 cells. All data were analyzed by SPSS16.0 statistical software. The results of normality were expressed as the mean and standard deviation. P<0.05 was considered to be signifi cant.Results: The frequencies of Th17 cells in both untreated and remission groups were lower than that of control group (P<0.05). Comparing the untreated and remission groups, the frequency of Th17 cells was higher in untreated group with no signifi cance (P>0.05). There were no obvious difference in the frequencies of Th1 cells between MM and control groups (P>0.05).Conclusion: The results demonstrate that T cell subsets in BM expressed abnormally in MM patients, characterized by the increasing expression of Th17 cells, while the result of Th1 cells was normal. Immunologically, the elevated Th17 cells play a role in the development of MM.Tab1. Frequencies of Th17 cells and Th1 in MM patients and control (%, x ±SD)Group n Th17 cells Th1 cellsUntreated MM 39 2.19±1.48* 26.5±5.74Remission MM 21 1.70±1..21▲ 24.5±6.12Control 20 0.70±0.49 26.1±4.89* p<0.05 vs. Control, ▲p>0.05 vs. Untreated MM
A-498
The association study of SR-BI gene single nucleotide polymorphism and coronary heart disease
T. Zeng, H. Jiang, Q. Zheng, Y. Jia. West China Hospital of Sichuan University, Chengdu, China
Background:Cardiovascular diseases are serious threats to human health all over the world, and atherosclerosis (AS) is the foundation of a series of diseases of heart blood-vessel. Scavenger receptor (SR) family is a category of pattern recognition receptors. In recent years, studies reveal that SRs can start a series of signal regulating program which can infl uence development and stability of atherosclerotic plaque. Scavenger receptor class B type I(SR-BI) is one of the important SRs. The role of SR-BI protein in atherosclerosis has attracted much attention, and the infl uence of single nucleotide polymorphisms (SNPs) of SR-BI gene on diseases is also one of the focuses of researches in recent years.Objective:The relationship between SR-BI gene SNPs and cardiovascular disease was discussed in this paper.Methods:353 unrelated, randomized patients with coronary heart disease (CHD) (218 males and 135 females) including acute myocardial infarction(AMI) and unstable angina were enrolled in the case group. 376 unrelated, randomized healthy controls (234 males and 142 females) who did not have any atherosclerotic disease composed control group. 2 ml EDTA-K2 anticoagulant whole blood was collected from each individual. Clinical data were collected in either patients or healthy controls. Genome DNAs were extracted from whole blood samples, and SNPs genotype analysis was done by using high resolution melting curves (HRM). Statistical analysis was done by using software SPSS Statistics 11.0. Differences of allele and genotype frequency distribution between case and control groups were analyzed by the online software SHEsis (http://analysis.bio-x.cn). So did the Hardy-Weinberg Equilibrium (HWE) of the frequency distribution and the haplotype analysis of SNPs.Results:5 SNPs (rs5888, rs10846744, rs10744182, rs2278986 and rs838893) were determined as the target SNPs in this research. Signifi cant differences were found in allele and genotype frequencies of rs10846744 and rs2278986 between case and control groups ignoring gender difference (P < 0.05). C alleles of rs10846744 and rs2278986 might be a protection factor of CHD (P = 0.058 and P = 0.0001). According to statistics considering gender difference, signifi cant differences were found in allele and genotype distribution frequencies of rs2278986 between male patients with CHD and the control group (P < 0.05). C allele of rs2278986 might be a protection factor of CHD. No difference was found in female patients with CHD.Haplotyes with different frequency distribution in CHD and control group were (in rs5888, rs10846744, rs10744182, rs2278986, rs838893 order) C C T T C, C G C T T, C G T C T, C G T T C and T C C T C. Haplotypes related with protection from CHD were C C T T C, C G T C T, T C C T C.Conclusion:Allele and genotype distribution frequencies of SNP rs2278986 were Signifi cant different between male patients with CHD and the healthy controls. T allele of rs2278986 might be related with CHD susceptibility in men. Haplotypes related with CHD risk were C G C T T and C G T T C (in rs5888, rs10846744, rs10744182, rs2278986, rs838893 order).
A-499
The Effect of Common CYP2C19 Genetic Variants on High Platelet Reactivity During Thienopyridine Therapy
I. Paskaleva1, D. Dineva1, V. Baycheva1, R. Tzveova2, R. Kaneva2, N. Gocheva1. 1National Heart Hospital, Sofi a, Bulgaria, 2Centre of Molecular Medicine, Sofi a, Bulgaria
Background: High on-treatment platelet reactivity (HPR) has been associated with specifi c polymorphisms of cytochrome P450 (CYP) genes. It has been also shown as independent risk factor for post-stenting ischemic events. The purpose of this study was to evaluate the effect of P2Y12 inhibitors, clopidogrel and prasugrel, with the common CYP vatriants CYP2C19*2 and CYP2C19*17 in patients with adequate and high platelet reactivity.Methods: Platelet function was assessed with multiple electrode impedance aggregometry (MEA) in whole blood on Multiplate analyzer. Adequate response to ADP P2Y12 receptor blocking medication with ADP 6.5 μM was defi ned as ADP-test > 455 AU, on the base of cut-off value, determined by ROC analysis (area under the curve was 0.864, with 0.84 specifi city and 0.78 sensitivity). We studied 54 patients with good response to chronic daily 75 mg clopidogrel and 81 mg aspirin therapy after coronary artery stenting and 50 patients with low response and HPR. Blood samples

Tuesday, July 30, 9:30 am – 5:00 pm Hematology/Coagulation
A150 CLINICAL CHEMISTRY, Vol. 59, No. 10, Supplement, 2013
were drawn into tubes containing hirudin at least 14 h after the loading or maintaining doses of clopidogrel. Genotyping of the CYP2C19*2 (681 G>A) and 2C19*17 (-806 C>T) variants was done by TaqMan SNP assay.Results: Compared with normal response (ADP-test 220±80 AU), the thienopyridine treatment was switched from clopidogrel to prasugrel 10 mg/d (ADP-test 250±82 AU) in 36 of 50 patients with HPR (ADP-test 660±95 AU). Three out of the non-responder patients required higher maintaining dose of prasugrel (15 mg daily). At least one CYP2C19*2 allele was present in 53 of all 104 patients genotyped: the *2 allele frequency was higher in low response patients (HPR) than in patients with good response (37/100 (37.0 %) vs. 18/108 (16.7 %), Chi2 11.04, p < 0.05). The CYP2C19*17 allele was found in 44 patients: the *17 allele frequency was similar in both groups studied (25/108 (23.1 %) vs. 23/100 (23.0 %), Chi2 0.00, p = n.s.).Conclusion: Carriers of CYP2C19*2 allele have higher platelet reactivity and show good response to prasugrel than non-carriers.
A-500
A clotting AT assay insensitive to Heparin Cofactor II
M. Goldford, N. Nnachi. r2 Diagnostics, Inc., South Bend, IN
Background: ThromboTek AT, an APTT based factor assay, is a patented clotting AT assay under development as an alternative to expensive chromogenic AT assays. Because the penultimate reaction in any clotting assay is fi brinogen cleavage by generated thrombin, this study was undertaken to determine any possible interference from Heparin Cofactor II. HCII was shown in the early 1980’s to interfere in human thrombin based chromogenic AT assays of that era and caused a 10-15% overestimation of AT concentration. Most current AT assays use either bovine thrombin or bovine FXa to circumvent this concern.Methods: Two experimental approaches were taken. In the fi rst, dilution series of pooled plasma were prepared with either IBS or IBS supplemented with 90 ug/mL of purifi ed HCII, the physiologically normal concentration of HCII in plasma. In the second approach dilution series of pooled plasma in AT defi cient plasma were prepared and supplemented with either a neutralizing antibody to human HCII or a non immune antibody.The experiment with added HCII was tested on the STA Compact, and included an arm wherein the samples were also tested with the bovine FXa based Stago STACHROM ATIII chromogenic assay. The experiment with added neutralizing antibody was tested on the Stago ST4. Regression and analysis of covariance of the data were performed with JMP version 7 by SAS.Results: The 95% confi dence intervals of the slopes and intercepts of the added HCII experiment using the ThromboTek AT assay showed considerable overlap, suggesting coincident regression lines of the measured AT regardless of the experimental treatment. In contrast, while the 95% CI for the slopes of the STACROM ATIII assay also showed considerable overlap, the 95% CI of the intercepts were non overlapping, suggesting parallel slopes with a biased intercept of these regressions. The ANCOVAR p value of the treatment effect of HCII was 0.044 for the ThromboTek assay and 0.0001 for the Stago assay. The 95% CI of the slopes and intercepts of the neutralizing antibody experiment with the ThromboTek assay also showed overlapping slopes and intercepts, again suggesting coincident regression lines. The ANCOVAR p value of the treatment effect of the antibody was 0.172.Conclusion:We see in the added HCII experiment that the ThromboTek AT assay shows no more sensitivity to HCII than the bovine FXa based STACHROM assay, and see no HCII effect in the neutralizing antibody experiment. We conclude that HCII does not interfere in the ThromboTek AT assay.
A-501
Comparability of the Bloodhound™ Integrated Hematology System to the Sysmex XE5000
D. Zahniser1, J. Linder2, M. Zahniser1, D. Bracco3, T. Allen3, J. W. Winkelman4. 1Constitution Medical Inc, Boston, MA, 2University of Nebraska Medical Center, Omaha, NE, 3Constitution Medical Inc, Westborough, MA, 4Harvard Medical School, Boston, MA
INTRODUCTION: The Bloodhound™ Integrated Hematology System (Constitution Medical Inc., Westborough, MA, USA) employs a proprietary method to perform an automated CBC, WBC differential and reticulocyte count by applying undiluted whole blood onto a microscope slide and staining the resultant monolayer. The instrument
then uses multispectral image analysis to count and classify cells, and determine other CBC parameters. The Bloodhound Instrument does not use impedance, conductance or laser-based methods for cell measurement. For specimens “fl agged” for potential abnormality, data and images from a 600 cell WBC differential count, as well as RBC, PLT and other cells are available for a technologist to view on a computer monitor if “fl agged” for potential abnormality. This study assesses the comparability of the Bloodhound Instrument to a widely used automated hematology analyzer.METHOD: This study was performed on over one-thousand (1,183) whole blood samples including normal and abnormal specimens from patients seen at an academic medical center. Samples were processed on both a Sysmex XE-5000 (Sysmex Corporation, Kobe, Japan) and on a Bloodhound Instrument to assess comparability (r) between the two systems for thirteen (13) common parameters. This study was performed consistent with the ICSH Guidelines, and CLSI H26-A2 and CLSI EP9-A2 standardsRESULTS: Correlation of Bloodhound Instrument and Sysmex XE5000
Parameter r Slope BiasWBC 0.99 1.04 0.07RBC 0.99 0.95 0.03HGB 0.99 1.02 -0.07MCV 0.90 1.06 -0.43HCT 0.97 1.04 -0.15MCH 0.99 0.99 -0.25PLT 0.98 0.99 -4.08MPV 0.85 0.99 -0.28NEUT 0.98 0.99 1.68LYMPH 0.98 0.96 -2.02MONO 0.82 0.89 0.57EO 0.97 0.97 0.04BASO 0.69 0.92 0.20CONCLUSION: The Bloodhound™ Instrument shows excellent comparability to a widely used automated hematology analyzer. The variation in results between these two instruments was similar to that typically seen between different instrument platforms for all of the common CBC parameters. These data indicate that the innovative technical approach of a slide-based CBC and WBC differential by the Bloodhound instrument performs well over a wide range of specimens types and compares favorably to existing technologies. *The Bloodhound™ Integrated Hematology System is under development and is not currently cleared by the Food and Drug Administration.
A-502
Imprecision Study of the Bloodhound™ Integrated Hematology System
D. Bracco1, K. Horton1, D. Zahniser1, W. Swinehart1, M. Braga1, T. Allen1, J. W. Winkelman2, J. Linder3. 1Constitution Medical Inc, Westborough, MA, 2Harvard Medical School, Boston, MA, 3University of Nebraska Medical Center, Omaha, NE
INTRODUCTION: The Bloodhound™ Integrated Hematology System (Constitution Medical Inc., Westborough, MA, USA) employs a proprietary method to perform an automated CBC and WBC differential by applying undiluted whole blood onto a microscope slide, staining the slide then using multispectral image analysis to count and classify cells, including nRBC and reticulocytes, and determine other CBC parameters, such as HGB, HCT, MCV, MCH and MPV. This study evaluated the imprecision of the Bloodhound Instrument across a wide range of normal samples and in various abnormal samples at medically important decision thresholdsMETHOD: The study was run according the ICSH Guidelines to determine imprecision (%CV). Nine (9) whole blood samples with suffi cient volumes were collected from the routine workload at an academic medical center for each of the following ranges: WBC (x103/μL) 2.0- >25.0, RBC (x106/μL) 3.0 - >5.5, HGB (g/dL) 10- >16.0, PLT (x103/μL) 50- >400. Additionally, three (3) abnormal whole blood samples were collected for each the following abnormal conditions in the ranges specifi ed: Anemia- 6-10 g/dL HGB, Thrombocytopenia- <50 x103/μL PLT and severe leucopenia- 0–2 x10³/μL WBC. Each sample was run thirty-one (31) times using the replicate sample processing mode of the Bloodhound Instrument. The results were compared to CLIA guidelines and currently reported performance of various automated analyzers.RESULTS: For the normal samples, the imprecision (%CV) of Bloodhound instrument was: RBC 1.18, WBC 2.99, PLT 3.11, HGB 1.59, HCT 1.66, MCV 1.19, MPV 3.19, MCH 1.06, MCHC 0.82, RDW 4.05, RET (%) 26.17, NEUT(%) 2.63, LYMPH(%) 8.50, MONO(%) 13.11, EOS(%) 21.11, BASO(%) 38.75. For the abnormal samples, the imprecision (%CV) of Bloodhound instrument was: Anemia: RBC 1.92, HGB 1.87, HCT 1.95, Leucopenia: WBC 10.16 and Thrombocytopenia: PLT 11.11.

Hematology/Coagulation Tuesday, July 30, 9:30 am – 5:00 pm
CLINICAL CHEMISTRY, Vol. 59, No. 10, Supplement, 2013 A151
CONCLUSION: The imprecision of the Bloodhound instrument was very low for RBCs and their associated indices, WBCs and PLTs. Results for all parameters were well-within CLIA thresholds, and equal to or better than the published %CV of automated hematology analyzers that employ fl ow methods with impedance and/or laser-based detection. The imprecision results for abnormal samples were also favorable considering the wide range of variability typically seen in these types of samples. In particular, the imprecision results for the anemic samples were excellent and showed that the Bloodhound Instrument is capable of producing consistent values in these medically important decision ranges. *The Bloodhound™ Integrated Hematology System is under development and is not currently cleared by the Food and Drug Administration.
A-503
Inter-instrument Reproducibility of the Bloodhound™ Integrated Hematology System
W. Swinehart1, T. Allen1, D. Bracco1, D. Zahniser1, J. Linder2, J. W. Winkelman3. 1Constitution Medical Inc, Westborough, MA, 2University of Nebraska Medical Center, Omaha, NE, 3Harvard Medical School, Boston, MA
Introduction: Assessing the reproducibility of split samples across multiple hematology analyzers is essential to assure that the device produces clinically valid results. The Bloodhound™ Integrated Hematology System (Constitution Medical Inc., Westborough, MA, USA) is a recently developed analyzer that uses proprietary technology to perform a CBC, WBC differential and reticulocyte count by drawing undiluted whole blood into a dispensing needle that places a precise volume uniformly onto a microscope slide for analysis. This study evaluated reproducibility when the same whole blood sample was processed on three different Bloodhound Instruments.Methods: The experiment was run on three (3) instruments on two (2) different days, at ambient temperature. The analyzers were calibrated with whole blood, and controlled with stabilized material (Streck, Omaha, NE). Forty (40) normal, and three (3) whole blood samples from patients with leukopenia, anemia and thrombocytopenia were collected in K2 ethylenediaminetetraacetic acid (EDTA) and processed on the Bloodhound instruments within eight (8) hours of collection. This study employed statistical methods outlined in the Clinical and Laboratory Standards Institute (CLSI) EP5-A2 standard to determine pooled within-run repeatability, inter-instrument reproducibility and total imprecisionResults: Summary Imprecision Data for normal subjects (%CV (95% CI)
Parameter Repeatability Reproducibility ImprecisionWBC 3.15(2.89-3.46) 0.95 (0.47-9.62) 3.54(3.19-3.99)RBC 1.01(0.93-1.11) 0.086 (0.026--) 1.24(1.13-1.36)PLT 3.38 (3.10-3.71) 2.14(1.09-15.70) 4.58 (3.71-5.98HGB 1.23 (1.13-1.35) 0.38 (0.18-6.18) 1.64(1.47-1.85)HCT 1.37 (1.25-1.50) 0.48 (0.23-5.84) 1.79(1.60-2.04)MCV 1.02 (0.94-1.12) 0.440 (0.22-4.33) 1.383(1.210-1.61)MCH 0.66 (0.61-0.73) 0.31 (0.15-3.19) 0.97(0.85-1.14)#Neut 4.04 (3.698-4.424) 1.04(0.50-12.37) 4.45(4.04-4.94)#Lymph 8.72 (8.00-9.58) 0.81(0.31-810.64) 8.815(8.164-9.58)#Mono 14.415(13.23-15.83) 0.000 (---) 14.67(13.59-15.95)#Eos 32.79(30.10-36.01) 2.01 (0.671--) 31.78 (29.5-34.46)For abnormal samples the same parameters of within-run repeatability, inter-instrument reproducibility and total imprecision were assessed on 3 instruments (%CV (95% CI): WBC repeatability 4.81 (3.64-7.12) reproducibility 9.11(4.66-65.53) total imprecision 10.43 (5.96-37.07); RBC repeatability 1.26 (0.95-1.86) reproducibility 1.29 (0.66-8.87) total imprecision 1.69 (1.07-3.96); PLT repeatability 24.42 (18.45-36.12) reproducibility 4.47 (1.33--) total imprecision 24.18 (18.81-33.87)Conclusions: The inter-instrument reproducibility of the Bloodhound Instrument is consistent across the three (3) instruments included in the study. The results demonstrate that the Bloodhound Instrument has excellent reproducibility for commonly measured parameters in the CBC.*The Bloodhound™ Integrated Hematology System is under development and is not currently cleared by the Food and Drug Administration.
A-504
Platelet Counting by Multi-Spectral Analysis with the Bloodhound™ Integrated Hematology System Versus Flow Cytometry and the Sysmex XE-5000
D. Bracco1, M. Braga1, D. Hawkins2, J. W. Winkelman3, J. Linder4, J. Tabor1, D. Zahniser1. 1Constitution Medical Inc., Westborough, MA, 2University of Minnesota, Minneapolis, MN, 3Harvard Medical School, Boston, MA, 4University of Nebraska Medical Center, Omaha, NE
INTRODUCTION: Accurate platelet counting in a CBC especially important for transfusion decisions. The Bloodhound™ Integrated Hematology System (Constitution Medical Inc., Westborough, MA) (Bloodhound Instrument) is a recently developed automated hematology analyzer that performs a CBC and WBC differential and reticulocyte determination by applying whole blood onto a microscope slide, staining, then performing multispectral imaging. This study evaluated the accuracy of automated platelet (PLT) counts from the Bloodhound Instrument compared to those of established instrumentation (Sysmex XE-5000, Kobe, Japan) and by fl ow cytometry (Cytomics FC 500, Beckman Coulter, Miami, FL).METHOD: Residual samples were collected in K2 EDTA blood collection tubes and processed within eight (8) hours of venipuncture. Platelet counts ranging from 0-50 to > 600 (x 103/μL) were determined on both hematology analyzers using split samples. Flow-based platelet counting was done with monoclonal antibodies(Anti-Human CD41-FITC and Anti-Human CD61-FITC, BioLegend, San Diego, CA).RESULTS: Results were analyzed using a weighted Deming regression of both automated hematology instruments against fl ow cytometry. Confi dence intervals for intercept and slope of the regressions were determined using jack-knifi ng, and Bland-Altman plots were constructed.Summary Statistics for Sysmex XE-5000 and Bloodhound Instrument
Instrument Correlation Parameter Estimate 95% CISysmex 0.972 Intercept 1.424 0.078 2.771
Slope 1.016 0.972 1.059Bloodhound 0.990 Intercept 8.076 0.980 15.172
Slope 0.961 0.910 1.011Both analyzers had positive intercepts indicating an upward bias at very low platelet levels. Regression slopes were not statistically signifi cantly different, and showed high correlations with fl ow cytometry. The Bland-Altman plots showed no signifi cant bias between the Bloodhound Instrument and fl ow cytometry. The bias was constant with no upward or downward swings associated with high or low PLT counts.CONCLUSION: When compared to a fl ow cytometry reference method, PLT counts from the Bloodhound Instrument demonstrate high correlation across a wide range of concentrations. The Bloodhound Instrument also has excellent PLT count correlation with the Sysmex XE-5000, a widely used hematology analyzer.*The Bloodhound™ Integrated Hematology System is under development and is not currently cleared by the Food and Drug Administration.
A-505
Performance evaluation of Actin FSL reagent for Activated Partial Thromboplastin Time (APTT) detection.
M. P. REZENDE, C. PEREIRA, R. IANNACCARO. DASA S/A, SÃO PAULO, Brazil
Background: The Activated Partial Thromboplastin Time (APTT) is an in vitro screening procedure, primarily used to evaluate coagulation system abnormalities in the intrinsic pathway. Its result may indicate altered functional defi ciency of factors VIII, V, X, XI and II. Furthermore, APTT is an universally recognized test which monitor unfractionated heparin therapy that makes clotting time prolongation proportional to the heparin level. The presence of nonspecifi c suppressive substances such as lupus anticoagulant may cause a prolonged APTT. The detection depends on the composition of APTT phospholipids contained in the reagent. APTT determination is a valuable clinical screening with wide possibilities of use in diagnosing coagulation disorders and monitoring patient’s therapy prone to bleeding or thrombosis.Plasma Incubation with the optimal quantity of phospholipids (vegetable and/or animal) and an activator (ellagic acid) leads to factors activation of the endogenous clotting system. The coagulation process is initiated with the addition of calcium chloride and the time is measured until the formation of the fi brin clot.

Tuesday, July 30, 9:30 am – 5:00 pm Hematology/Coagulation
A152 CLINICAL CHEMISTRY, Vol. 59, No. 10, Supplement, 2013
Methods: Two reagents were used for this study: Actin and Actin FSL which have reference ranges as follows: 22,7 to 31,8 seconds and 25,0 to 31,3 seconds, respectively. Fresh samples were simultaneously processed within four hours after blood drawn in both protocols in two hospital laboratories. In Hospital Campo Limpo, fi fty samples (n=50) were tested using Siemens Sysmex® CA-1500 System and in Hospital Marcia Maria Braido, seventeen samples (n=17) were tested using Siemens Sysmex® CA-560 System.Results: Comparative results analysis using linear regression are the following for Hospital Campo Limpo, Mean of 28,04 seconds (Actin) and 28,79 seconds (Actin FSL), slope is 0,64, intercept is 10,79 and correlation (r) is 0,93; and for Hospital Marcia Maria Braido, mean is 33,36 seconds (Actin) and 32,11 seconds (Actin FSL), slope is 0,74, intercept is 7,19 and correlation (r) is 0,98.Conclusion: Study concludes Actin and Actin FSL have good correlation when tested in both systems. Moreover, Actin FSL performance was satisfactory for both instruments, Siemens Sysmex CA-560 and Siemens Sysmex CA-1500. The Actin FSL reagent is more sensitive for the detection of Lupus-like inhibitors and its use adds value to the APTT test as a screening tool.
A-506
Cleavage site Arg1018 by thrombin plays minimal role during activation of coagulation factor V
M. Na1, J. Wiencek2, J. Hirbawi3, M. Kalafatis2. 1Cleveland State University, Westlake, OH, 2Cleveland State University, Cleveland, OH, 3Cleveland clinic, Cleveland, OH
Background:Coagulation fV is a single chain quiescent procofactor . Thrombin generation is the key event involved in the coagulation cascade. The proteolytic conversion of prothrombin (Pro) to thrombin is catalyzed by the prothrombinase complex. This stoichiometric complex is composed of the cofactor factor Va (fVa), the enzyme factor Xa (fXa) associated on a membrane surface in the presence of divalent metal ions. FV is activated by thrombin following three sequential cleavages at Arg709, Arg1018, and Arg1545 to generate the active cofactor (fVa) composed of heavy and light chain. It was previously reported that activation of FV following cleavage at Arg1545 by thrombin requires prior cleavage at Arg1018. To ascertain the role of thrombin mediated cleavage at Arg1018 during activation of fV , we used site directed mutagenesis to create several recombinant fV molecules with the activation sites mutated to Glutamine (RtoQ).Methods: We have also used a recombinant mutant factor V molecule with the region 1000-1008 from the B region deleted (fV∆B9). We have created recombinant fV molecules as follows: fVWT (wild type), fVQQR (only cleavage at Arg1545 is available), fVRQQ (only cleavage at Arg709 available), fVQRQ, (only cleavage at Arg1018 available), fVRQR (cleavages at Arg709 and Arg1545 available), fVQQQ (no cleavage available), fV∆B9/RQR, and fV∆B9/QRQ. The recombinant molecules were expressed in COS-7 cells, purifi ed to homogeneity and assayed for clotting activity as well as in prothrombinase assays using purifi ed reagents. Western blotting followed by staining with specifi c monoclonal antibodies to the heavy and light chain of the cofactor was used to evaluate the integrity of the recombinant fV/fVa molecules.Results:Two-stage clotting assays revealed that the clotting activities of fVaQQR, fVaRQQ, and fVaQRQ were reduced while fVQQQ was devoid of clotting activity. In addition, fVaRQR and fVaΔB9/RQR have similar clotting activities as fVaWT. In contrast, fVaQRQ, and fVaΔB9/QRQ are impaired in their clotting activities, similar to the activity expressed by fVQQQ. Kinetic analyses demonstrated that fVaRQR and fVaΔB9/RQR have similar affi nities for fXa, while fVaQRQ, and fVaΔB9/QRQ were impaired in their interaction with fXa. The kcat values for prothrombinase assembled with fVaRQR and fVaΔB9/RQR
were similar to the kcat obtained with prothrombinase assembled with fVaWT, while prothrombinase assembled with fVaQRQ and fVaΔB9/QRQ had 2-fold and 7-fold reduced catalytic effi ciency respectively, when compared to the kcat values obtained with prothrombinase assembled with fVaWT. Finally, the kcat value for prothrombinase assembled with fVaQQR was approximately 50% lower than the kcat obtained with prothrombinase assembled with fVaWT.Conclusion:Our data demonstrates that cleavage site Arg1018 is not a prerequisite for activation of factor V. We conclude that the data presented explains that Arg 1018 has no effect on heavy and light chain formation but only removes any steric hindrance present in the structure and improves the catalytic effi ciency of the prothrombinase complex.
A-507
Intra-assay precision, inter-assay precision, and reliability of fi ve platelet function methods used to monitor the effect of aspirin and clopidogrel on platelet function
C. D. Koch, A. M. Wockenfus, R. S. Miller, N. V. Tolan, D. Chen, R. K. Pruthi, A. S. Jaffe, B. S. Karon. Mayo Clinic, Rochester, MN
Introduction: Protocols for implantable cardiac devices often call for monitoring and titration of antiplatelet agents to avoid device thrombosis. We evaluated fi ve platelet function methods for precision and reliability in measuring platelet function in healthy volunteers and volunteers on daily aspirin or clopidogrel therapy.Methods: We studied TEG® 5000 PlateletMapping® (Haemonetics, Braintree MA), light transmission aggregometry (LTA) using a PAP-8E (Bio/Data Corporation, Horsham PA), PLT VASP/P2Y12 fl ow cytometry (Biocytex, Marseille France) using a FACSCalibur Cytometer (Becton Dickinson, Franklin Lakes NJ), whole blood impedance aggregometry using Multiplate 5.0 (DiaPharma Group, Westchester OH), and VerifyNow (Accumetrics, San Diego CA). Blood samples from forty healthy volunteers were obtained for duplicate testing by all methods. To assess platelet function variability from blood draws and sample processing, twenty four healthy volunteers had blood drawn again within 24 hours for repeat duplicate measurement. Thirteen volunteers on daily aspirin therapy, and ten volunteers on daily clopidogrel therapy, also had blood drawn twice within 24 hours for testing. Intra-assay precision (CV) was calculated from the standard deviation of all duplicate results; while inter-assay CV was calculated from the SD of all four (duplicate results from two blood draws) results among donors with repeat blood draws. Reliability index (R), the ratio of between person to total (within plus between person) variability was also calculated. R indices of 0.41-0.60 indicate moderate, 0.61-0.80 substantial, and 0.81-1.00 high test reliability.Results: Intra-assay CV was < 15% except for TEG PlateletMapping on healthy donors and Multiplate on aspirin-treated donors. Inter-assay precision and reliability (R) calculated from 9-13 repeat donors were:
ADP Inhibitor Effect Aspirin EffectHealthy Donors Clopidogrel-
Treated Donors Healthy Donors Aspirin-Treated Donors
Mean Inter-Assay CV (%)
RMean Inter-Assay CV (%)
RMean Inter-Assay CV (%)
RMean Inter-Assay CV (%)
R
VASP 4.7 0.64 26.3 0.83 - - - -VerifyNow 5.2 0.89 12.9 0.92 2.4 0.23 4.8 0.78Multiplate 8.3 0.61 14.2 0.89 9.7 0.48 24.7 0.68LTA 6.2 0.66 11.2 0.89 7.2 0.60 37.8 0.25TEG PM 50.1 0.35 17.2 0.93 92.2 0.06 5.0 0.26Conclusions: VASP, VerifyNow, Multiplate and LTA had substantial or high reliability for measuring the effect of ADP inhibitors; while only Multiplate had even moderate reliability for measuring aspirin effect. TEG PlateletMapping is not a reliable method to measure individual response to antiplatelet agents.
A-508
Detection of JAK2 V617F and JAK2 exon 12 mutations in chronic myeloid leukemia patients and their role in disease progression.
R. MIR1, I. Ahmad2, M. Zuberi2, J. Javid1, S. Farooq2, S. Guru2, P. Ray2, P. Yadav2, N. Gupta2, M. Masroor2, A. saxena2. 1University of Delhi, NEW DELHI, India, 2Maulana Azad Medical college, NEW DELHI, India
OBJECTIVE: The JAK2 V617 mutation in exon 14 and other novel JAK2 exon12 mutations (K539L, F537-K539delL, H538QK539L ) are acquired alterations that induce constitutive cytokine-independent activation of the JAK-STAT pathway in myeloproliferative disorders. The discovery of these mutations provides a novel mechanism for activation of signal transduction in hematopoietic malignancies. The aim of this study was to investigate the presence of V617F and other JAK2 mutations along with BCR-ABL translocation/Philadelphia chromosome in Indian patients of Chronic Myeloid Leukemia (CML)and to study their association with early disease progression to advanced stages (accelerated phase or blast crisis) and poor disease outcome.METHODOLOGY: 100 newly diagnosed BCR-ABL translocation or Philadelphia chromosome positive cases of CML in chronic phase/accelerated phase/blast crisis were tested for JAK2 mutations by ARMS-PCR and/or ASO-PCR. Demographic data, spleen size, hemoglobin level, white blood cell and platelet counts were recorded.

Hematology/Coagulation Tuesday, July 30, 9:30 am – 5:00 pm
CLINICAL CHEMISTRY, Vol. 59, No. 10, Supplement, 2013 A153
Independent sample t-test was used to study the correlation of JAK2 mutations with age, haemoglobin , blood counts and spleen size. Fisher’s exact test was applied to compare disease progression in mutation positive and negative cases.RESULTS: The JAK2 mutation was studied in 100 CML patients , 50 were in chronic phase(CP), 10 in accelerated phase(AP) and 15 in blast crisis(BC).Overall twenty one of hundred cases (21%) were carrying JAK2V617F mutation,,the break-up among the different stages was 13% of CP-CML , 40% of AP-CML and 46.66% blast crisis(BC) cases .It was seen that JAK2V617F mutation frequency is increased signifi cantly from early to advanced phase of CML. A higher frequency of JAK2V617F mutation was observed in haematologically resistant cases (35% ) and molecularly resistant cases (33%) to imatinib treatment than in the imatinib responders.A signifi cant proportion of patients carrying JAK2V617F mutation showed early disease progression. During a mean follow-up of 12 months, 5/10 CP-CML (JAK2+) cases underwent disease progression and out of fi ve ,3 patients transformed to blast crisis and 2 into accelerated phase. No statistically signifi cant difference was seen in relation to age, spleen size, haemoglobin level, white blood cells and platlet counts in JAK2V617F positive patients. Other JAK2 exon12 (K539L,H538QK539L,F537-K539delL) mutation screening is under process and the results will be reported.CONCLUSION: JAK2V617F mutation was detected in 21% cases of Chronic Myeloid Leukemia. A signifi cant proportion of these patients showed early disease progression.
A-510
Platelet, Mean platelet volume and r-glutamyl transferase: Changes in Platelet Index in Cholestatic conditions
S. Cho, E. You, J. Yang, Y. Jeon, M. Kim, M. Lee, H. Yang, H. Lee, T. Park, J. Suh. Kyung Hee University Medical Center, Seoul, Korea, Republic of
Background: Mean platelet volume (MPV) is the commonly measured platelet index for platelet size and surrogate marker of platelet function. Recently, MPV has been investigated various hepatic disease such as cirrhosis and viral hepatitis. We also had reported previous studies to analyze clinical meaning of MPV in patients with hepatocellular carcinoma and chronic hepatitis B. In this study, we planned to investigate the relationship between this platelet index and γ-glutamyltransferase (GGT) in various disease conditions. Materials and Method: The study included 671 results with increased GGT (1.5 times higher than upper reference limit) from 415 different patients in our hospital between August 2011 and April 2012. For the control group, 311 subjects for medical check-ups were enrolled and they were also used as control group in our previous study. Mean age of patient group was 54.91 (range 0-88) yr, and male to female ratio was 281:134. Platelet index were measured using EDTA blood in Advia 2120 (Siemens Healthcare Diagnostics Inc., Tarrytown, USA) within 2 hrs. GGT was tested using Toshiba chemical analyzer (Toshiba, Nasushiobara, Japan). Student t-test and Pearson correlation analysis were used to examine the relationships between variables. The statistical analyses were performed with MedCalc v11.6 (MedCalc Software, Mariakerke, Belgium). Results: Mean of MPV levels was the signifi cantly increased in patients group (P<0.001), which were 8.74 fl (range 6.6-16.9) in patients group and 8.02 fl in control group (range 6.7-11.0), respectively. Moreover, there was the signifi cant correlation between GGT and MPV/platelet ratio (P=0.0177). Conclusion: MPV has been previously suggested as a laboratory marker for fi brosis. We carefully suggest that platelet index could be changed in cholestatic conditions. The further study should be followed to investigate the reason of this change, relations with other hepatic enzyme to evaluate possibility of MPV/platelet ratio as a biomarker for cholestasis.
A-512
Method evaluation of Prothrombin time assay on Sysmex CA560
F. A. Berlitz, K. G. Muller. Grupo Ghanem, Joinville, Brazil
Background: The Prothrombin Time (PT) is functional determination of the extrinsic (tissue factor) pathway of coagulation and is extremely sensitive to the vitamin-K dependent clotting factors. Tissue factor is a transmembrane protein that is widely expressed on cells of non-vascular origin, which activates factor VII during the initiation of the extrinsic coagulation pathway. A cascade mechanism results in fi brin production and clot formation. The PT is a widely used laboratory assay for the detection of inherited or acquired coagulation defects related to the extrinsic pathway of coagulation. A method evaluation is an important step to introduce a new assay in the clinical laboratory routine. The aim of this study was to evaluate the analytical performance of Prothrombin time assay on Sysmex CA560 analyzer comparing its performance against our routine reference methodology, using Dreake Quick Timer equipment. The Sysmex CA560 is a compact and automated system featuring immunologic, coagulation, and chromogenic measurements in random-access.Methods: We evaluated the Prothrombin time assay on both equipments (Sysmex CA560 and Drake Quick Timer). The evaluation was made on the basis of randomic (RE) and systematic errors (SE), by between-run replication test and method comparison procedure, respectively. The imprecision tests were made according CLSI EP5 guideline with 20 samples analyzed in different batches for evaluated assay. The inaccuracy test was made according CLSI EP9 guideline, with 40 samples analyzed in both methods (test and reference) on a single run.Results: The precision (Between-run CV %) of the Sysmex CA560 Prothrombin Time assay was 1.51%. The comparison study yielded the following statistics (regression analysis, Deming): CA560 PT = (1.05 x Quick Timer PT) - 0.63.Determination coeffi cient (r2) was 0.983 and standard error of the estimate (S y/x) was 0.539. Systematic errors were calculated for a medical decision level of 13 seconds, using regression model obtained in comparison study. Systematic error of Sysmex CA560 Prothrombin Time assay was 0,21%. The total error of Sysmex CA560 Prothrombin Time assay was 1.72%. Comparing Sysmex CA560 PT obtained errors to analytical performance specifi cations (CLIA; 15%), sigma-metrics were calculated: 9.79, considering 13 seconds as medical decision level.Conclusion: In conclusion, we found that the Sysmex CA560 Prothrombin Time assay evaluated in this study presented an excellent performance when compared to the reference method in our routine and also against the international standards for PT assays. Therefore, the Sysmex CA560 Prothrombin Time assay is easy to perform, is accurate, precise and suitable for Prothrombin Time evaluation in routine clinical laboratory.
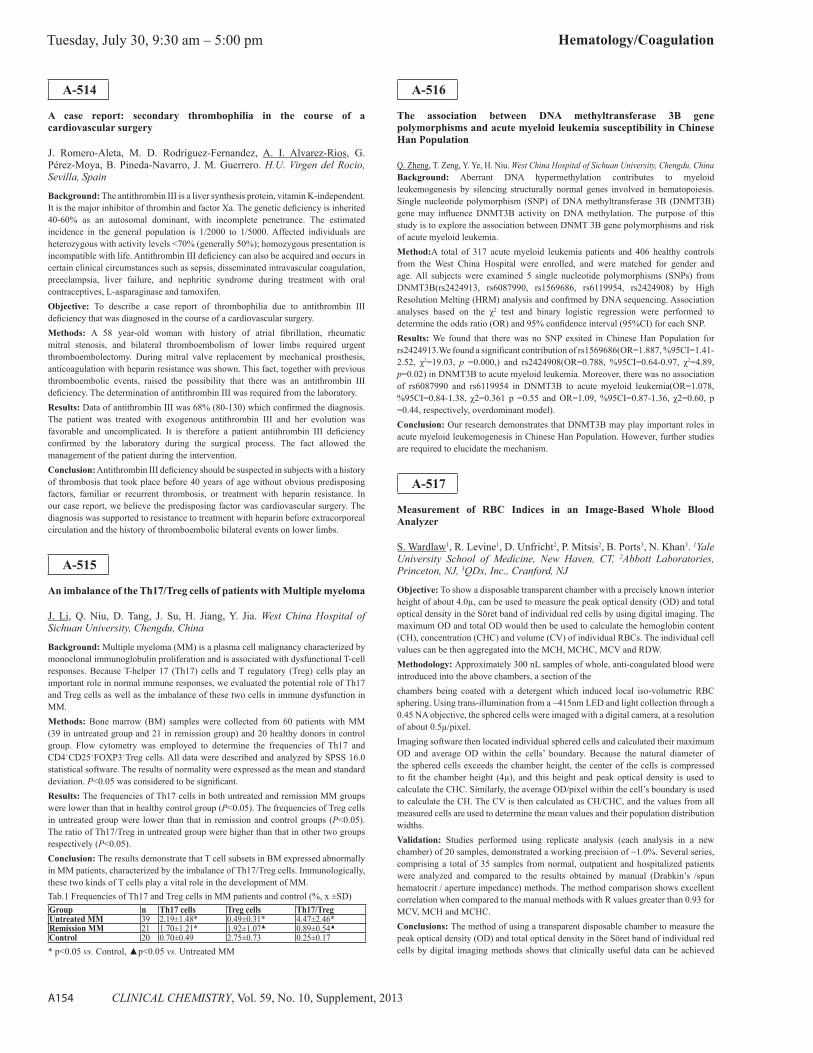
Tuesday, July 30, 9:30 am – 5:00 pm Hematology/Coagulation
A154 CLINICAL CHEMISTRY, Vol. 59, No. 10, Supplement, 2013
A-514
A case report: secondary thrombophilia in the course of a cardiovascular surgery
J. Romero-Aleta, M. D. Rodriguez-Fernandez, A. I. Alvarez-Rios, G. Pérez-Moya, B. Pineda-Navarro, J. M. Guerrero. H.U. Virgen del Rocio, Sevilla, Spain
Background: The antithrombin III is a liver synthesis protein, vitamin K-independent. It is the major inhibitor of thrombin and factor Xa. The genetic defi ciency is inherited 40-60% as an autosomal dominant, with incomplete penetrance. The estimated incidence in the general population is 1/2000 to 1/5000. Affected individuals are heterozygous with activity levels <70% (generally 50%); homozygous presentation is incompatible with life. Antithrombin III defi ciency can also be acquired and occurs in certain clinical circumstances such as sepsis, disseminated intravascular coagulation, preeclampsia, liver failure, and nephritic syndrome during treatment with oral contraceptives, L-asparaginase and tamoxifen. Objective: To describe a case report of thrombophilia due to antithrombin III defi ciency that was diagnosed in the course of a cardiovascular surgery.Methods: A 58 year-old woman with history of atrial fi brillation, rheumatic mitral stenosis, and bilateral thromboembolism of lower limbs required urgent thromboembolectomy. During mitral valve replacement by mechanical prosthesis, anticoagulation with heparin resistance was shown. This fact, together with previous thromboembolic events, raised the possibility that there was an antithrombin III defi ciency. The determination of antithrombin III was required from the laboratory.Results: Data of antithrombin III was 68% (80-130) which confi rmed the diagnosis. The patient was treated with exogenous antithrombin III and her evolution was favorable and uncomplicated. It is therefore a patient antithrombin III defi ciency confi rmed by the laboratory during the surgical process. The fact allowed the management of the patient during the intervention.Conclusion: Antithrombin III defi ciency should be suspected in subjects with a history of thrombosis that took place before 40 years of age without obvious predisposing factors, familiar or recurrent thrombosis, or treatment with heparin resistance. In our case report, we believe the predisposing factor was cardiovascular surgery. The diagnosis was supported to resistance to treatment with heparin before extracorporeal circulation and the history of thromboembolic bilateral events on lower limbs.
A-515
An imbalance of the Th17/Treg cells of patients with Multiple myeloma
J. Li, Q. Niu, D. Tang, J. Su, H. Jiang, Y. Jia. West China Hospital of Sichuan University, Chengdu, China
Background: Multiple myeloma (MM) is a plasma cell malignancy characterized by monoclonal immunoglobulin proliferation and is associated with dysfunctional T-cell responses. Because T-helper 17 (Th17) cells and T regulatory (Treg) cells play an important role in normal immune responses, we evaluated the potential role of Th17 and Treg cells as well as the imbalance of these two cells in immune dysfunction in MM.Methods: Bone marrow (BM) samples were collected from 60 patients with MM (39 in untreated group and 21 in remission group) and 20 healthy donors in control group. Flow cytometry was employed to determine the frequencies of Th17 and CD4+CD25+FOXP3+Treg cells. All data were described and analyzed by SPSS 16.0 statistical software. The results of normality were expressed as the mean and standard deviation. P<0.05 was considered to be signifi cant.Results: The frequencies of Th17 cells in both untreated and remission MM groups were lower than that in healthy control group (P<0.05). The frequencies of Treg cells in untreated group were lower than that in remission and control groups (P<0.05). The ratio of Th17/Treg in untreated group were higher than that in other two groups respectively (P<0.05).Conclusion: The results demonstrate that T cell subsets in BM expressed abnormally in MM patients, characterized by the imbalance of Th17/Treg cells. Immunologically, these two kinds of T cells play a vital role in the development of MM.Tab.1 Frequencies of Th17 and Treg cells in MM patients and control (%, x ±SD)Group n Th17 cells Treg cells Th17/TregUntreated MM 39 2.19±1.48* 0.49±0.31* 4.47±2.46*Remission MM 21 1.70±1.21* 1.92±1.07▲ 0.89±0.54▲
Control 20 0.70±0.49 2.75±0.73 0.25±0.17* p<0.05 vs. Control, ▲p<0.05 vs. Untreated MM
A-516
The association between DNA methyltransferase 3B gene polymorphisms and acute myeloid leukemia susceptibility in Chinese Han Population
Q. Zheng, T. Zeng, Y. Ye, H. Niu. West China Hospital of Sichuan University, Chengdu, ChinaBackground: Aberrant DNA hypermethylation contributes to myeloid leukemogenesis by silencing structurally normal genes involved in hematopoiesis.Single nucleotide polymorphism (SNP) of DNA methyltransferase 3B (DNMT3B) gene may infl uence DNMT3B activity on DNA methylation. The purpose of this study is to explore the association between DNMT 3B gene polymorphisms and risk of acute myeloid leukemia.Method:A total of 317 acute myeloid leukemia patients and 406 healthy controls from the West China Hospital were enrolled, and were matched for gender and age. All subjects were examined 5 single nucleotide polymorphisms (SNPs) from DNMT3B(rs2424913, rs6087990, rs1569686, rs6119954, rs2424908) by High Resolution Melting (HRM) analysis and confrmed by DNA sequencing. Association analyses based on the χ2 test and binary logistic regression were performed to determine the odds ratio (OR) and 95% confi dence interval (95%CI) for each SNP.Results: We found that there was no SNP exsited in Chinese Han Population for rs2424913.We found a signifi cant contribution of rs1569686(OR=1.887, %95CI=1.41-2.52, χ2=19.03, p =0.000,) and rs2424908(OR=0.788, %95CI=0.64-0.97, χ2=4.89, p=0.02) in DNMT3B to acute myeloid leukemia. Moreover, there was no association of rs6087990 and rs6119954 in DNMT3B to acute myeloid leukemia(OR=1.078, %95CI=0.84-1.38, χ2=0.361 p =0.55 and OR=1.09, %95CI=0.87-1.36, χ2=0.60, p =0.44, respectively, overdominant model).Conclusion: Our research demonstrates that DNMT3B may play important roles in acute myeloid leukemogenesis in Chinese Han Population. However, further studies are required to elucidate the mechanism.
A-517
Measurement of RBC Indices in an Image-Based Whole Blood Analyzer
S. Wardlaw1, R. Levine1, D. Unfricht2, P. Mitsis2, B. Ports3, N. Khan3. 1Yale University School of Medicine, New Haven, CT, 2Abbott Laboratories, Princeton, NJ, 3QDx, Inc., Cranford, NJ
Objective: To show a disposable transparent chamber with a precisely known interior height of about 4.0μ, can be used to measure the peak optical density (OD) and total optical density in the Söret band of individual red cells by using digital imaging. The maximum OD and total OD would then be used to calculate the hemoglobin content (CH), concentration (CHC) and volume (CV) of individual RBCs. The individual cell values can be then aggregated into the MCH, MCHC, MCV and RDW.Methodology: Approximately 300 nL samples of whole, anti-coagulated blood were introduced into the above chambers, a section of thechambers being coated with a detergent which induced local iso-volumetric RBC sphering. Using trans-illumination from a ~415nm LED and light collection through a 0.45 NA objective, the sphered cells were imaged with a digital camera, at a resolution of about 0.5μ/pixel.Imaging software then located individual sphered cells and calculated their maximum OD and average OD within the cells’ boundary. Because the natural diameter of the sphered cells exceeds the chamber height, the center of the cells is compressed to fi t the chamber height (4μ), and this height and peak optical density is used to calculate the CHC. Similarly, the average OD/pixel within the cell’s boundary is used to calculate the CH. The CV is then calculated as CH/CHC, and the values from all measured cells are used to determine the mean values and their population distribution widths.Validation: Studies performed using replicate analysis (each analysis in a new chamber) of 20 samples, demonstrated a working precision of ~1.0%. Several series, comprising a total of 35 samples from normal, outpatient and hospitalized patients were analyzed and compared to the results obtained by manual (Drabkin’s /spun hematocrit / aperture impedance) methods. The method comparison shows excellent correlation when compared to the manual methods with R values greater than 0.93 for MCV, MCH and MCHC.Conclusions: The method of using a transparent disposable chamber to measure the peak optical density (OD) and total optical density in the Söret band of individual red cells by digital imaging methods shows that clinically useful data can be achieved

Hematology/Coagulation Tuesday, July 30, 9:30 am – 5:00 pm
CLINICAL CHEMISTRY, Vol. 59, No. 10, Supplement, 2013 A155
when compared to manual methods of establishing red cell indices. Because the cells in our measurement are bathed in their native plasma, while those in a fl ow-cytometric or aperture impedance system are highly diluted in a fl uid whose osmolality may differ from that of the plasma, we found somewhat different MCV values when utilizing those automated methods. Based on this issue, we focused on comparison to manual reference methods for RBC, HGB and HCT. This issue will be investigated in future work.
A-518
The Use of Quantitative, Multi-Spectral Imaging to Measure Hematology Parameters in Whole Blood Preparations
D. Unfricht, D. Olson, M. Xie, R. Holt, D. Herzog, J. Verrant, C. Gonzalez. Abbott Laboratories, Princeton, NJ
Background: The rapid advancement of technology has made it increasingly possible to provide critical diagnostic tests at the point of patient care (POC). Instead of waiting for test results, clinicians can perform diagnostic tests in minutes while the patient is present. This is especially important in situations where rapid test turnaround is essential for positive patient outcomes. While POC tests are increasingly available,there are as yet no satisfactory complete blood count (CBC) and white blood cell (WBC) differential solutions for near patient testing. Various hematology solutions based on automated impedance and fl ow cytometry or other traditional technologies have been developed, but none of them fully satisfy demand for rapid, accurate sample analysis, fl uid-free processing, reliability, compactness, and ease of operation. All of these are important requirements for POC diagnostic systems. In this presentation, a novel, imaging-based POC hematology analyzer that performs a complete blood count (CBC) with 5 part differential comparable to conventional laboratory hematology instruments is described. The POC hematology analyzer processes a small volume of whole blood stored inside a disposable, companion cartridge with dry reagents. After the blood sample fi lls an imaging chamber of precisely-defi ned height, the POC analyzer acquires digital hematology images at multiple wavelengths of light (multi-spectral analysis) and quantitatively analyzes them.Methods: Fifty anti-coagulated, whole blood samples (either native or manipulated) were analyzed in duplicate on the Abbott, imaging-based, POC hematology analyzer, and a traditional multi-parameter hematology system. Linear regression was performed to compare the methods. Additionally, a precision study (n = 20) was performed to examine the repeatability of the imaging-based POC hematology analyzer.Results: For WBC and platelet (PLT) counts, the Abbott imaging-based POC hematology analyzer generated linear regression r2
values > 0.99 and 0.98, respectively, when compared to the traditional multi-parameter hematology system. Precision for WBCs and PLT was 3.6% and 3.1%, respectively.Conclusions: Although the art of acquiring digital hematology images has been practiced for decades, quantitative methods of measuring hematology parameters from these images is in its infancy. Digital image analysis has many advantages, including the visual confi rmation of identifi ed objects. Additionally, the design of the imaging chamber allows the same region of interest (ROI) to be analyzed with multiple wavelengths of light, providing a wealth of information from the same ROI. Multi-spectral analysis can be particularly useful when analyzing cellular objects containing nucleic acids, such as white blood cells, platelets, platelet clumps, and nucleated erythrocytes that can be stained with supravital fl uorescent dyes. Preliminary results, along with confi rmatory digital hematology images, suggest that the multi-spectral analytical methods compare favorably with traditional automated hematology analyzers.
A-519
Disposable Analysis Chamber for a Novel Imaging Based Hematology Instrument
B. Ports1, D. Unfricht2, P. Mitsis2, N. Khan1, S. Levine3, R. Levine3. 1QDx, Inc., Cranford, NJ, 2Abbott Laboratories, Princeton, NJ, 3Yale University School of Medicine, New Haven, CT
Objective: To show a disposable transparent chamber with a precisely known interior height of 4.0 μm, can be used to determine the concentration of white blood cells and platelets in whole blood when measured using automated digital imaging, such that instrument and chamber yield acceptable clinical correlations and precision for WBC and PLT with a commercially available hematology instrument.
Methodology: The imaging chamber is one component of a disposable cartridge which accepts 20-30 μL whole blood. Once inserted in the instrument, the cartridge automatically stains the blood sample with dried acridine orange and dispenses ~300 nL to the imaging chamber. The chamber design allows all components of blood to fi ll by capillarity, forming a monolayer of WBCs within the 4 μm space due to their deformability in the live state. Fluorescent digital images are then captured and analyzed by image processing algorithms to enumerate WBC and PLT, among other CBC parameters.Validation: Studies performed using replicate analysis (each analysis in a new chamber) of 20 samples, demonstrated a working precision for WBC and PLT of ~3.5% in the normal range. Separate studies comparing ~200 abnormal and normal samples with a comparative instrument in duplicate show excellent agreement, with correlations of R = 0.99 for WBC and PLT.Conclusions: Fluorescent imaging of acridine orange stained WBC and PLT in the novel 4 μm chamber allows for accurate and precise enumeration of these cells.
A-520
Validation of Buzzy® during blood specimens collection by venipuncture for hematology testing: a preliminary evaluation
G. Lima-Oliveira1, C. D. Valentim2, G. Salvagno3, G. Lippi4, M. D. R. Campelo2, C. A. Amaral-Valentim2, K. S. A. Tajra2, F. S. Gomes2, S. J. C. Romano2, G. Picheth1, G. Guidi3. 1Federal University of Parana, Curitiba, Brazil, 2Bioanalise, Teresina, Brazil, 3University of Verona, Verona, Italy, 4University of Parma, Parma, Italy
Background and objective: A new device called Buzzy® which combines ice pack and vibrating motor is proposed to relieve the venipuncture pain, thus increasing patient compliance during venipuncture. Aim of this study was to evaluate the impact of the device to validate it for blood collection by venipuncture for hematology tests.Methods: Blood was collected from 20 volunteers by a expert phlebotomist. A vein was located on the left forearm without applying tourniquet using a subcutaneous tissue transilluminator device, and blood samples were collected directly into vacuum tube with K2EDTA. In sequence, Buzzy® was applied on the right forearm, for one minute before venipuncture and maintained until the end of blood collection. The routine hematological tests were performed in the same instrument Sysmex® XE-2100D. The signifi cance of the differences between samples was assessed by using the paired Student t-test after verifying the normality. Because non-normal distribution was found for MCV, relevant results were assessed by using Wilcoxon ranked-pairs test. Statistical signifi cance was set at P < 0.05.Results: The main results of the present investigation are synthesized in the table I.Table 1. Impact of Buzzy® on routine hematology tests.
Discussion and conclusion: From a practical point of view, the cold-induced hemoconcentration promotes the exit of water, diffusible ions and low molecular weight substances from the vessel thereby increasing the concentration of various blood analytes at the punctured site thus potentially infl uencing the laboratory results interpretation (red blood cell, haemoglobin and haematocrit). In conclusion, the use of Buzzy® was not validated for diagnostic blood collection by venipuncture for routine hematology tests because the device could be affect the patient safety. Further study with more volunteers should be done to confi rm this preliminary result.

Tuesday, July 30, 9:30 am – 5:00 pm Hematology/Coagulation
A156 CLINICAL CHEMISTRY, Vol. 59, No. 10, Supplement, 2013
A-521
Risk index for the predictor of blood products transfusion in liver transplantation
A. I. Alvarez-Rios1, A. León-Justel1, J. A. Noval-Padillo1, P. Mellado2, M. A. Gomez-Bravo3, J. M. Alamo3, M. Porras4, F. Sanchez2, L. Barrero3, R. Hinojosa4, J. L. Lopez-Romero2, M. Carmona5, J. M. Guerrero1. 1Department of Clinical Laboratory Sciences, Virgen del Rocío University Hospital, Sevilla, Spain, 2Department of Anaesthesiology, Virgen del Rocío University Hospital, Sevilla, Spain, 3Department of Hepatobiliar Surgery, Virgen del Rocío University Hospital, Sevilla, Spain, 4Department of Intensive Care Medicine, Virgen del Rocío University Hospital, Sevilla, Spain, 5Department of Haematology and Haemotherapy, Virgen del Rocío University Hospital, Sevilla, Spain
Background:Liver transplantation (LT) is a surgical procedure that can lead to massive blood loss and consequently result in transfusion of blood products. Substantial evidence suggests that the use of blood products during OLT is associated with morbidity and mortality, and has been identifi ed as an independent risk factor for adverse postoperative outcomes. The early identifi cation of patients at risk of blood products transfusion may provide the opportunity to develop clinical pathways and test approaches to prevent blood loss during LT.The primary objectives of our study were to identify preoperative predictors of blood products transfusion in LT, and to develop a risk index to predict blood products transfusion in LT. Methods:We performed a retrospective, observational study of all LTs patients among those performed between October 15th, 2009 and December 31st, 2011. A hundred and twenty fi ve LTs were included during the study period. The following variables were recorded for each patient: age; thromboelastometry´s variables (CT (clotting time); A10 (amplitude clot after 10 minutes); CFT (clotting formation time); MCF (maximum clot of fi rmness); alpha); INR (international normalized ratio); aPTT (activated partial thromboplastin time); Fg (fi brinogen); RBC (red blood cells); Hb (hemoglobin) and platelets. Independent predictors of blood products transfusion were identifi ed by multivariable logistic regression analysis. We have developed a risk index of blood products transfusion with the quartile and the diagnostic performance was established by calculating area under the ROC curve, sensitivity, specifi city, and 95% confi dence intervals (CI). This risk index of blood products transfusion was internally validated with the following twenty LTs.Results:Multivariable logistic regression analysis revealed that CT (OR=1.036; IC 95%, 1.003-1.069; p=0.030); A10 (OR=0.765; IC 95%, 0.612-0.956; p=0.018); MCF (OR=1.275; IC 95%, 1.012-1.605; p=0.039); Hb (OR=0.942; IC 95%, 0.894-0.992; p=0.024) were associated with an overall risk of transfusion. We obtained an area under the ROC curve of 0.77, 95% IC (0.68-0.84; p<0.001) a sensitivity of 76.6%, 95% IC (66.7%- 84.7%) and a specifi city of 65.4%; 95% IC (44.3% - 82.8%). This index for blood products transfusion was internally validated afterwards, and we obtained an area under the ROC curve of 0.87, 95% IC (0.64-0.97; p<0.001) a sensitivity of 86.7%, 95% IC (59.5%- 98.0%) and a specifi city of 100.0%; 95% IC (48.0% - 100.0%).Conclusion:This index showed suffi cient sensitivity and specifi city to predict which patients would require a transfusion and, as a result, the use of index will enable optimization of hospital blood product resources.
A-522
Estimating %inhibition of platelet activity from VerifyNow P2Y12 assay results when %inhibition is no longer reported
P. Cotzia, F. R. Bordash, L. J. McCloskey, D. F. Stickle. Jefferson University Hospitals, Philadelphia, PA
Background: The VerifyNow P2Y12 assay (Accumetrics, San Diego, CA) measures adenosine diphosphate (ADP)-stimulated platelet aggregation, to verify inhibition of aggregation in the presence of the P2Y12 receptor anatagonist Plavix (Clopidogrel) by comparison of results to an assay reference range. In its current rendition, aggregation is reported as ADP-stimulated P2Y12 Reaction Units (PRU). Before September 2012, however, the assay reported two additional results: thrombin receptor-stimulated aggregation units (baseline, B, bypassing the P2Y12 receptor), and %INHIBITION ((1-PRU/B)*100). In the previous report format, B was essentially a control for platelet count, which information is no longer available. As our neurosurgeons
claimed reliance on %INHIBITION rather than on PRU for treatment decisions, we characterized the correlation between %INHIBITION and PRU among neurosurgery patients, to examine whether %INHIBITION could be reliably estimated from PRU alone.Methods: Assay results for 43 patients undergoing intraoperative neurosurgery measurement of P2Y12 activity under the previous assay format were obtained from instrument records (PRU, B, and %INHIBITION) and analyzed for correlation between %INHIBITION, B and PRU.Results: %INHIBITION vs. PRU was linear in aggregate (see Figure, points); r2 = 0.821). B (baseline) results were normally distributed (r2 > 0.99): B = 288 (average) ± 56.4 (sd) units, with no correlation to PRU (r2 = 0.133). Given this parametric characterization of B, predicted average ±1 sd ranges for %INHIBITION were calculated as a function of PRU (see Figure, lines). Predicted ±1 sd ranges for %INHIBITION (theoretical 68% inclusion) encompassed 72% of observed %INHIBITION. %INHIBITION was thus statistically predictable from PRU.Conclusions: There has been loss of information content with elimination of baseline (B) and %INHIBITION from P2Y12 assay results. However, there is a predictable probability distribution of %INHIBITION for a given PRU. This study allowed our neurosurgeons to utilize patient-derived estimates of %INHIBITION from PRU alone under the new assay format.
A-524
Is there a relationship between the size of the spleen and the pancytopenia in peripheral blood samples in patients with schistosomal portal hypertension?
L. d. Vasconcellos, J. R. Romeiro, V. Resende, A. Petroianu. Universidade Federal de Minas Gerais, Belo Horizonte, Brazil
Background: The spleen is the major organ of the reticuloendothelial system responsible for hemocatheresis process. Patients with schistosomal portal hypertension (SPH) often develop splenomegaly. The correlation between the size of the spleen and pancytopenia is not yet understood. Some authors found leucopenia, anemia and thrombocytopenia in all patients with SPH. Others found no correlation between the degree of splenomegaly and pancytopenia in peripheral blood. Others also observed pancytopenia in patients with small spleen. The aim of the study is to correlate the size of the spleen with the levels of peripheral blood cells in patients with SPH.Methods: SPH 80 patients were studied, from 2004 to 2011. After 12 hours of fasting, each patient were conducted clinical examinations and collected peripheral blood sample for haematological tests. The values of erythrocytes, hemoglobin, hematocrit, total leukocyte and platelets were performed by the Cell Dyn 3000 ® System (Abbott). The longitudinal size of the spleen was measured by ultrasound in all patients. Spleen size was correlated with results of hematological tests (Pearson correlation - p<0,05Results: Spleen size ranged from 13.6 cm to 28.4 cm (mean = 19.82 ± 3,87 cm) on ultrasound. The results of hematological tests are presented in Table 1. Thrombocytopenia was observed in 78 (97.5%) patients, leukopenia in 70 (87.5%), anemia in 56 (70%), prothrombin activity below 70% in 44 (55%) occurred at 34 and eosinophilia (42.5%). There was no signifi cant Pearson´s correlation between the results of hematological tests and the spleen size.

Hematology/Coagulation Tuesday, July 30, 9:30 am – 5:00 pm
CLINICAL CHEMISTRY, Vol. 59, No. 10, Supplement, 2013 A157
Conclusion: The pancytopenia was not correlated with the degree of splenomegaly in patients with schistosomal portal hypertension.
Results of hematological tests of 80 patients with SPH, since 2004 to 2011Exams Results
mean ± sd minimum maximumErythrocytes (céls/mm3) 3.98 ± 0,57 2.92 5.00 Hemoglobin (g/dL) 10.8 ± 1.9 7.7 14.2Hematocrit (%) 33.2 ± 4.8 24.2 41.0Total leukocytes (céls/mm3) 3040 ± 920 1400 5400Eosinophils (%) 6 ± 5 1 20Platelets (céls/mm3) 61000 ± 28000 12000 110000
A-525
Behavior of MCH and MCHC in iron-defi ciency anemia and thalassemia minor
S. F. Fonseca1, J. R. S. Oliveira2, A. T. Q. Lopes2, G. Azevedo2, L. F. A. Nery2, S. S. S. Costa2, R. H. Jacomo2. 1Brasilia University, Laboratorio Sabin, BRASILIA, Brazil, 2Laboratorio Sabin, BRASILIA, Brazil
The red cell indices are very important for the classifi cation and etiologic investigation of anemia. In general, anemia is classifi ed according to the mean corpuscular volume (MCV) as normocytic, microcytic or macrocytic, and, based on mean corpuscular hemoglobin (MCH) and mean corpuscular hemoglobin concentration (MCHC), as normochromic or hypochromic. Data in the literature are confl icting with regard to which of these indices best classifi es anemia. Objective: Considering that iron-defi ciency anemia and beta-thalassemia minor are frequent causes of hypochromic anemia, the authors analyzed the behavior of MCH and MCHC in these two pathologies. Methods: MCH and MCHC values were analyzed in 4,196 complete blood counts (CBC) from adults who presented serum ferritin concentration below 10ng/dl and showed hemoglobin (Hb) levels below reference values for age and sex (Group I); and in 116 CBC from adults with HbA2 above 3.5% and with ferritin and transferrin saturation within reference values (Group II). The CBC were carried out by an automated system (Sysmex XE2100), hemoglobin analysis by capillary electrophoresis (Capillarys 2, Sebia), and serum ferritin analysis by chemiluminescence (Advia Centaur XP). Statistical analysis was performed using the Student´s T test. Results and Conclusion: The average Hb values were 11.5 g/dl and 11.8 g/dl (p=0.049); MCH values were 25.8 pg and 21.7 pg (p<0.001); and MCHC values were 31.7 g/l and 32.3 g/l (p<0.001) for Groups I and II respectively. Interestingly, the iron defi cient group presented a lower MCHC value, whereas the thalassemia minor group presented a lower MCH value. It suggests that patients with markedly low MCH values have a greater probability of being diagnosed with thalassemia minor. Further studies and analysis with stratifi ed Hb values are needed for confi rmation of these observations.

Tuesday, July 30, 9:30 am – 5:00 pm Factors Affecting Test Results
A158 CLINICAL CHEMISTRY, Vol. 59, No. 10, Supplement, 2013
Tuesday, July 30, 2013
Poster Session: 9:30 AM - 5:00 PM
Factors Aff ecting Test Results
A-527
Interference in HbA1c Measurement by HPLC: Unusual Case Involving a poorly controlled Diabetic Patient with Hemoglobin D Trait
T. Brandler, M. Fenelus, L. K. Bjornson. North Shore University Hospital Laboratory, Manhasset, NY
Introduction: Hemoglobin A1c (HbA1c) is the universally accepted index of glycemic control in diabetes mellitus over the longevity of an erythrocyte, approximately 120 days. HPLC (high performance liquid chromatography) is one of the most common methodologies for measuring HbA1c. Hemoglobinopathies such as HbAE and HbAD are reported to interfere with some of the commercially available HPLC methods. Here, we present a case of a 66 year old female with unreportable HbA1c results using the Tosoh G8 HPLC system. Methods: The Core Laboratory received a blood sample from a 66 year old female. HbA1c and serum glucose measurements were performed initially. Subsequently, fructosamine measurement and hemoglobin identifi cation were performed. The two principle methods used to measure HbA1c in our laboratory system are HPLC and immunoassay. HbA1c was performed with the Tosoh HLC-723G8 using ion-exchange chromatography and by immunoassay with the Roche Cobas Integra 800 using a turbidimetric inhibition immunoassay (TINIA). Both manufacturers, Tosoh - HPLC and Roche - immunoassay, specify that HbA1c can be reliably measured for patients with HbAD or hemoglobin D trait. Hemoglobin identifi cation was performed using the Bio-Rad CDM System Variant V-II Instrument for hemoglobin HPLC and the Resolve Perkin Elmer System for isoelectric focusing. Results: Our patient had a glucose level of 330 mg/dL. The HbA1c measurement by HPLC was 12.7%, but could not be reported because of an error fl ag on the chromatogram indicating the presence of an unidentifi ed peak (P00 =8.6%) just before HbA0. An additional peak (H-VI = 35.5%) appeared just after HbA0. A second specimen was obtained from the patient and demonstrated the same HbA1c error fl ag indicating unreportable results. Since the HPLC analysis of HbA1c indicated the probable presence of an abnormal hemoglobin and/or other interfering substance, the patient’s blood was investigated for hemoglobinopathy. Examination of her hemoglobins by HPLC and isoelectric focusing demonstrated the presence of HbD at 39% and established that this patient had a hemoglobin D trait. HbA1c was subsequently measured by an alternate immunoassay method (TINIA) on the Roche Cobas Integra 800 and found to be 11.8% (as compared to the HPLC result of 12.7%). There were no error fl ags for the immunoassay and results were assumed to be valid. Serum fructosamine was measured at 535 umol/L (reference interval 205 - 285), which confi rmed this patient’s very high HbA1c levels and her poorly controlled diabetic state. Conclusion: HbA1c measurements could not be reported on a 66 year old female with poorly controlled diabetes and hemoglobin D trait using the Tosoh G8 HPLC system because of an unidentifi ed peak (8.6%) just before HbA0. This unidentifi ed peak was not HbD which eluted after HbA0 and may be an artifact of her poor glycemic control or possibly due to medications. The Roche Integra immunoassay (TINIA) produced a reliable result with no instrument fl ags that was consistent with all other laboratory data.
A-528
How Frequently does Hemolysis Mask Hypokalemia? A study from a Large Tertiary Hospital
J. R. Asirvatham, L. Bilello, R. Agostinello, L. K. Bjornson. North Shore University Hospital (NSLIJHS), Manhasset, NY
Introduction: Excluding a false elevation of potassium due to hemolysis is almost a refl ex reaction when faced with an elevated potassium concentration. However, hemolysis can underestimate the degree of hypokalemia or mask hypokalemia when the measured concentrations fall within the reference interval. Data on the frequency and clinical impact of masked hypokalemia is lacking.
Objective: To estimate the proportion of masked hypokalemia in a large set of hemolysed samples by applying a correction factor based on the hemolysis index (HI). For this purpose, masked hypokalemia is defi ned as a potassium concentration from a hemolyzed specimen that is within the reference interval originally (normokalemic), but is hypokalemic after correcting for hemolysis. Methods: The study was conducted in the laboratory of North Shore University Hospital which is a large tertiary hospital in central Long Island, NY. The potassium concentrations of samples with HI between 25 and 500 were retrieved from the laboratory information system over 17 days in January 2013. Samples were considered to have hemolysis if the hemolytic index (HI) was >25. Samples with HI > 500 were excluded as they are not reported. Potassium was measured using an indirect ion selective electrode method on the Roche Modular ISE 1800 System. Serum indices including HI were measured simultaneously on the Roche Modular P 800. For this study, a previously published correction formula [Corrected potassium = Measured potassium - (HI x 0.004) mmol/L] was used to estimate the actual plasma potassium (Corrected potassium results have not been validated for clinical use). The reference interval for potassium used in the laboratory (3.5-5.1 mmol/L) was used to compare and categorize the pre and post correction values as hypokalemic, normokalemic and hyperkalemic. Results:704 samples (9.2%) were found to be hemolysed out of the 7650 samples analyzed for potassium in this 17 day time period. 41 (5.7% ) hemolysed samples were hypokalemic pre and post correction. 10 of these 41 specimens were below or equal to the critical concentration of 2.9 mmol/L post correction. “Masked hypokalemia” (pre: normo, post:hypo) was found in 56 (7.8%) of the hemolysed samples ; one of which was below the critical level. The lowest HI associated with a “masked hypokalemia” was 30. Conclusion: This study estimated that masked hypokalemia occurred in 7.8% of all hemolyzed samples. A smaller subset of 1.2% involved potassium concentrations that were hypokalemic initially but were below the critical limit of 2.9 mmol/L after correction. Masked hypokalemia caused by hemolysis poses a risk to patients, especially, those who have only one blood sample drawn per encounter, e.g., physician offi ce, clinic or Emergency Room, and should be considered when potassium results are in the lower part of the reference interval even with mild hemolysis.
A-529
Thyroxine Binding Protein Dependence of Three Free Thyroxine Assays
X. Qin1, T. J. Pitcher2, J. J. Miller2. 1Peking Union Medical College Hospital, Beijing, China, 2University of Louisville, Louisville, KY
The Objective of this study was to test the effect of thyroxine (T4) binding protein concentration on 3 free T4 (FT4) assays used in our medical center by the effect of dilution on the measured FT4. Many of our patients are acutely ill with decreased concentrations of two T4 binding proteins, Albumin (Alb) and Prealbumin (PA). Pregnant patients have increased concentrations of the major T4 binding protein, Thyroxine-Binding Globulin (TBG). Accurate measurement of FT4 concentrations in these patients requires the assay to be minimally affected by the concentration of T4 binding proteins. A FT4 assay should give the same result on diluted samples as on the original serum if the assay is not affected by the concentrations of T4 binding proteins.Methods: We prepared serum pools from 1. ill patients, and 2. pregnant women. Concentrations in the patient and pregnancy pools (reference intervals) were: Alb, 4.1 & 3.5 g/dL (3.5-5.0); PA, 17.7 & 15.5 mg/dL (18-38); TBG, 16.7 & 25.7 μg/mL (13.5-30.9); FT4, 1.14 & 1.17 ng/dL (0.78-2.19). We made serial dilutions of each pool with 10 mmol/L HEPES buffer, pH 7.4. We assayed FT4 in the pools and dilutions on the Vitros® 5600, Elecsy® 2010, and UniCell® DxI 800. We expressed the results of dilutions as a percentage of the undiluted pools.Results: See table. A binding-protein independent assay will have 100% for all dilutions due to readjustment of the equilibrium. The DxI FT4 assay was least dependent on T4 binding protein concentrations, the Vitros assay was affected more than the DxI assay and the Elecsys assay was markedly affected. The dilution curves were similar for normal and pregnant pools.Conclusion: We conclude that the DxI FT4 assay is most accurate among these 3 assays for samples in which the T4 binding protein concentrations may be abnormal.
Percent recovery of initial FT4 after dilution.
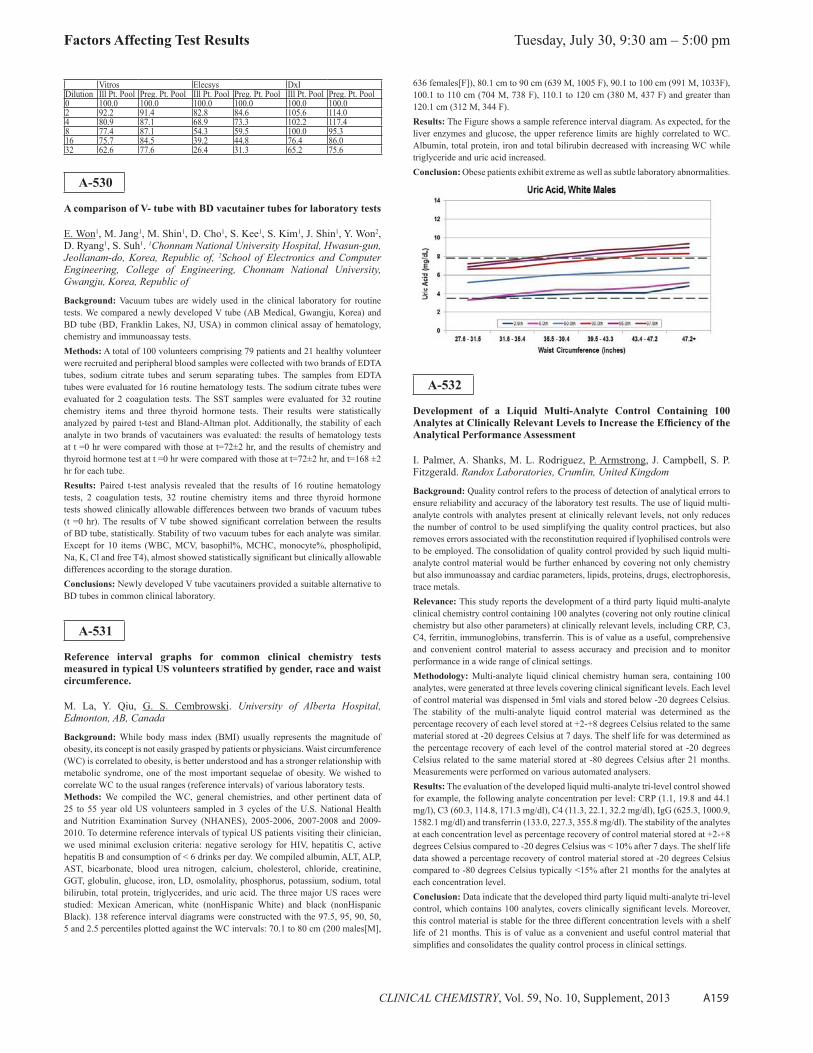
Factors Affecting Test Results Tuesday, July 30, 9:30 am – 5:00 pm
CLINICAL CHEMISTRY, Vol. 59, No. 10, Supplement, 2013 A159
Vitros Elecsys DxIDilution Ill Pt. Pool Preg. Pt. Pool Ill Pt. Pool Preg. Pt. Pool Ill Pt. Pool Preg. Pt. Pool0 100.0 100.0 100.0 100.0 100.0 100.02 92.2 91.4 82.8 84.6 105.6 114.04 80.9 87.1 68.9 73.3 102.2 117.48 77.4 87.1 54.3 59.5 100.0 95.316 75.7 84.5 39.2 44.8 76.4 86.032 62.6 77.6 26.4 31.3 65.2 75.6
A-530
A comparison of V- tube with BD vacutainer tubes for laboratory tests
E. Won1, M. Jang1, M. Shin1, D. Cho1, S. Kee1, S. Kim1, J. Shin1, Y. Won2, D. Ryang1, S. Suh1. 1Chonnam National University Hospital, Hwasun-gun, Jeollanam-do, Korea, Republic of, 2School of Electronics and Computer Engineering, College of Engineering, Chonnam National University, Gwangju, Korea, Republic of
Background: Vacuum tubes are widely used in the clinical laboratory for routine tests. We compared a newly developed V tube (AB Medical, Gwangju, Korea) and BD tube (BD, Franklin Lakes, NJ, USA) in common clinical assay of hematology, chemistry and immunoassay tests.Methods: A total of 100 volunteers comprising 79 patients and 21 healthy volunteer were recruited and peripheral blood samples were collected with two brands of EDTA tubes, sodium citrate tubes and serum separating tubes. The samples from EDTA tubes were evaluated for 16 routine hematology tests. The sodium citrate tubes were evaluated for 2 coagulation tests. The SST samples were evaluated for 32 routine chemistry items and three thyroid hormone tests. Their results were statistically analyzed by paired t-test and Bland-Altman plot. Additionally, the stability of each analyte in two brands of vacutainers was evaluated: the results of hematology tests at t =0 hr were compared with those at t=72±2 hr, and the results of chemistry and thyroid hormone test at t =0 hr were compared with those at t=72±2 hr, and t=168 ±2 hr for each tube.Results: Paired t-test analysis revealed that the results of 16 routine hematology tests, 2 coagulation tests, 32 routine chemistry items and three thyroid hormone tests showed clinically allowable differences between two brands of vacuum tubes (t =0 hr). The results of V tube showed signifi cant correlation between the results of BD tube, statistically. Stability of two vacuum tubes for each analyte was similar. Except for 10 items (WBC, MCV, basophil%, MCHC, monocyte%, phospholipid, Na, K, Cl and free T4), almost showed statistically signifi cant but clinically allowable differences according to the storage duration.Conclusions: Newly developed V tube vacutainers provided a suitable alternative to BD tubes in common clinical laboratory.
A-531
Reference interval graphs for common clinical chemistry tests measured in typical US volunteers stratifi ed by gender, race and waist circumference.
M. La, Y. Qiu, G. S. Cembrowski. University of Alberta Hospital, Edmonton, AB, Canada
Background: While body mass index (BMI) usually represents the magnitude of obesity, its concept is not easily grasped by patients or physicians. Waist circumference (WC) is correlated to obesity, is better understood and has a stronger relationship with metabolic syndrome, one of the most important sequelae of obesity. We wished to correlate WC to the usual ranges (reference intervals) of various laboratory tests.Methods: We compiled the WC, general chemistries, and other pertinent data of 25 to 55 year old US volunteers sampled in 3 cycles of the U.S. National Health and Nutrition Examination Survey (NHANES), 2005-2006, 2007-2008 and 2009-2010. To determine reference intervals of typical US patients visiting their clinician, we used minimal exclusion criteria: negative serology for HIV, hepatitis C, active hepatitis B and consumption of < 6 drinks per day. We compiled albumin, ALT, ALP, AST, bicarbonate, blood urea nitrogen, calcium, cholesterol, chloride, creatinine, GGT, globulin, glucose, iron, LD, osmolality, phosphorus, potassium, sodium, total bilirubin, total protein, triglycerides, and uric acid. The three major US races were studied: Mexican American, white (nonHispanic White) and black (nonHispanic Black). 138 reference interval diagrams were constructed with the 97.5, 95, 90, 50, 5 and 2.5 percentiles plotted against the WC intervals: 70.1 to 80 cm (200 males[M],
636 females[F]), 80.1 cm to 90 cm (639 M, 1005 F), 90.1 to 100 cm (991 M, 1033F), 100.1 to 110 cm (704 M, 738 F), 110.1 to 120 cm (380 M, 437 F) and greater than 120.1 cm (312 M, 344 F).Results: The Figure shows a sample reference interval diagram. As expected, for the liver enzymes and glucose, the upper reference limits are highly correlated to WC. Albumin, total protein, iron and total bilirubin decreased with increasing WC while triglyceride and uric acid increased.Conclusion: Obese patients exhibit extreme as well as subtle laboratory abnormalities.
A-532
Development of a Liquid Multi-Analyte Control Containing 100 Analytes at Clinically Relevant Levels to Increase the Effi ciency of the Analytical Performance Assessment
I. Palmer, A. Shanks, M. L. Rodriguez, P. Armstrong, J. Campbell, S. P. Fitzgerald. Randox Laboratories, Crumlin, United Kingdom
Background: Quality control refers to the process of detection of analytical errors to ensure reliability and accuracy of the laboratory test results. The use of liquid multi-analyte controls with analytes present at clinically relevant levels, not only reduces the number of control to be used simplifying the quality control practices, but also removes errors associated with the reconstitution required if lyophilised controls were to be employed. The consolidation of quality control provided by such liquid multi-analyte control material would be further enhanced by covering not only chemistry but also immunoassay and cardiac parameters, lipids, proteins, drugs, electrophoresis, trace metals.Relevance: This study reports the development of a third party liquid multi-analyte clinical chemistry control containing 100 analytes (covering not only routine clinical chemistry but also other parameters) at clinically relevant levels, including CRP, C3, C4, ferritin, immunoglobins, transferrin. This is of value as a useful, comprehensive and convenient control material to assess accuracy and precision and to monitor performance in a wide range of clinical settings.Methodology: Multi-analyte liquid clinical chemistry human sera, containing 100 analytes, were generated at three levels covering clinical signifi cant levels. Each level of control material was dispensed in 5ml vials and stored below -20 degrees Celsius. The stability of the multi-analyte liquid control material was determined as the percentage recovery of each level stored at +2-+8 degrees Celsius related to the same material stored at -20 degrees Celsius at 7 days. The shelf life for was determined as the percentage recovery of each level of the control material stored at -20 degrees Celsius related to the same material stored at -80 degrees Celsius after 21 months. Measurements were performed on various automated analysers.Results: The evaluation of the developed liquid multi-analyte tri-level control showed for example, the following analyte concentration per level: CRP (1.1, 19.8 and 44.1 mg/l), C3 (60.3, 114.8, 171.3 mg/dl), C4 (11.3, 22.1, 32.2 mg/dl), IgG (625.3, 1000.9, 1582.1 mg/dl) and transferrin (133.0, 227.3, 355.8 mg/dl). The stability of the analytes at each concentration level as percentage recovery of control material stored at +2-+8 degrees Celsius compared to -20 degres Celsius was < 10% after 7 days. The shelf life data showed a percentage recovery of control material stored at -20 degrees Celsius compared to -80 degrees Celsius typically <15% after 21 months for the analytes at each concentration level.Conclusion: Data indicate that the developed third party liquid multi-analyte tri-level control, which contains 100 analytes, covers clinically signifi cant levels. Moreover, this control material is stable for the three different concentration levels with a shelf life of 21 months. This is of value as a convenient and useful control material that simplifi es and consolidates the quality control process in clinical settings.

Tuesday, July 30, 9:30 am – 5:00 pm Factors Affecting Test Results
A160 CLINICAL CHEMISTRY, Vol. 59, No. 10, Supplement, 2013
A-533
Risk management: evaluating the effects of light in stability studies
L. Labay, S. Noel. NMS Labs, Willow Grove, PA
Background: Obtaining accurate results is a non-negotiable component of any laboratory test. It is, therefore, critical that specimens are protected from deleterious changes that compromise analyte concentration. This often means that collection containers are stored refrigerated or frozen prior to transport and analysis. However, processes no matter how well conceived are not infallible and at times laboratories are asked to test samples that were not appropriately stored. In the interest of mitigating this risk, individual quality control plans should address this circumstance.As part of our risk management strategy, we had cause to investigate our stability data for the antidepressant duloxetine. It was determined that light protecting serum samples stored at ambient temperature preserved duloxetine concentrations for at least 30-days. Having ready access to this type of information can be benefi cial in certain situations such as when environmental systems meant to safeguard specimens fail, or when specimens are improperly maintained. In the absence of this, test results and their interpretation may be weakened or a patient may not receive timely care.Methods: Two concentrations of test material (8.7 and 175 ng/mL) in blood and serum were prepared in bulk. Aliquots of 0.3 mL were transferred to 2 mL snap-cap tubes and placed in the storage conditions (ambient temperature, ambient temperature with light protection, 3C and -10C) until analysis on days 1, 2, 7, 14 and 30. Samples were tested by transferring 0.2 mL standards, controls and test material to appropriately labeled test tubes. Internal standard (D4-Duloxetine) was added and the test tubes vortexed. Zinc Sulfate (33% w/v) was then added followed by methanol. After each of these additions all test tubes were vortexed. Supernatants were transferred to autosampler vials and analyzed by HPLC separation with positive-ion electrospray tandem mass spectrometry (LC-MS/MS). The monitored ion transitions are 298>43.8; 298>154 for duloxetine and 302.1>46.9; 302.1>158 for D4-Duloxetine. The linearity of the assay is 3.0 to 300 ng/mL with precision and accuracy of <10%. All test samples were analyzed in duplicate. Stability was considered acceptable if the calculated result was within ± 20% of the target concentration.Results: Duloxetine was stable in blood across all temperatures for the duration of the experiment. In contrast, instability was noted in serum after 2-days at ambient temperature when subjected to light. By 30-days concentrations decreased 67% and 51% for the 8.7 and 175 ng/mL test material, respectively. When samples, however, were light protected duloxetine stability was maintained for 30-days.Conclusion: Light protecting samples extended the stability of duloxetine concentrations in serum from 2 to 30 days at ambient temperature. From a risk management perspective, laboratories when designing stability studies should include evaluating the effects of light protection. The major benefi t includes being able to appropriately respond to a patient need in a time sensitive manner when in-process procedures for maintaining sample integrity fail.
A-534
Evaluation of automated serum and plasma indices using MicroSensor technology on VITROS® 5600 system.
V. Ricchiuti, B. Karr, F. Lucas. University of Cincinnati Medical Center, Cincinnati, OH
Introduction: Hemolysis interferes with the performance of some assays and affects the reliability of the results affecting interpretation and patient management. MicroSensor Technology on VITROS® 5600 (Ortho-Clinical Diagnostics) detect and fl ag results affected by common interference indices: hemolysis, icterus and turbidity in serum, plasma and cerebrospinal fl uid (CSF). Automated sample quality indices minimize operator intervention and give more standardized assessment of sample integrity. Hemolysis is the most common reason for rejecting samples, while re-obtaining a new sample is an important problem. The aim of this study was to investigate the effects of hemolysis on common analyte parameters to prevent unnecessary rejections, and assess the indices cut-off for hemolysis index (H) to be used on VITROS® 5600.Method: Indices were activated on one VITROS® 5600 using manufacturer recommended indices cut-off values. During 30 days, sample indices were collected on specimens. Data was organized by tests and separated into four groups of hemolysis index (H): normal (Group A) H <124 (hemoglobin levels (Hb) <100 mg/dL); mild (group B) H=125-199 (Hb = 100-175 mg/dL); Moderate (Group C) H=200-550 (Hb = 175-500 mg/dL) and gross (Group D) H>550 (Hb >500 mg/dL).
Results. We collected 111,403 results. 89.4% were plasma specimens, 6.7% serum, and 0.3% CSF. Results with H values <15 (Hb <10 mg/dL) accounted for 72.8% of total results (74.1% of Group A). Group A represented 98.3% (n=109,484) of total results with H measured (n=111,403), Group B 0.9% (n=988), Group C 0.7% (n=845) and Group D 0.08% (n=86). We used a group of samples with H <15 as reference group (very low H index) and plotted concentrations of major analytes known to be sensitive to hemolysis versus increasing H values. The effect of H was evaluated according to the total allowable error (TAE) recommendations of CLIA’88. The cut-off value for H index was chosen as the maximum value that fell below CLIA recommended TAE when compared to reference group (H<15). Hemolysis affects the plasma concentration of several analytes. The most prominent effect of hemolysis was observed for MicroSlide™ assays, particularly for aspartate aminotransferase (AST), alanine aminotransferase (ALT), ammonia (AMON), iron (Fe), lactate dehydrogenase (LDH) and total-iron binding capacity (TIBC), therefore we kept manufacturer H index (H=51). Whereas, for blood urea nitrogen (BUN), alkaline phosphatase (ALKP), magnesium (Mg), phosphorous (PHOS) and potassium (K) we were able to increase the H index cut-off to H= 125 (instead of H=51 or 100 as suggested by manufacturer) as analyte differences were not signifi cant and remain within CLIA limits.Conclusion. This procedure is useful since it is more accurate than visual assessment of hemolysis and it avoids unnecessary retesting of samples.
A-535
Differences in serum and plasma enzyme levels due to pneumatic tube system transport.
L. V. Rao, J. Barron, C. Sears, T. Fontes, L. M. Snyder. Department of Hospital Labs, UMass Memorial Medical Center, Worcester, MA
Introduction: Pneumatic tube systems of various lengths are routinely used in many hospitals to transport blood collection tubes (serum, plasma, whole blood) to the testing laboratory. The present study evaluated the changes in the levels of enzymes in two different tube system transports within the hospital system.Methods: Two tubes of blood, one SST (Serum) tube and one Lithium Heparin (Plasma) tube, were collected from 27 (Site 1) and 22 (Site 2) volunteers. Both tubes were hand carried to the lab and levels of LDH, AST, ALT, ALK PHOS, GGT and K were measured. These tubes were then hand carried back to the site of collection and transported to the testing lab respective pneumatic tube systems (Swiss log Holding AG, Switzerland). The average carrier travel distance for Site 1 is 2911 feet and Site 2 is 1200 feet. Average travel sped of carriers at both locations is 28 feet per second. Both serum and plasma enzyme levels were measured using AU 680 analyzer (Beckman Coulter Inc, Brea CA).Results: Signifi cant differences between plasma levels of LDH are observed when comparing the results of untubed blood vs. blood transported through pneumatic tube system. The length of travel of the tube has signifi cant infl uence (Table: Percent Mean Bias). Percent bias is high for ALT and AST at Site 1, but these differences are not statistically signifi cant. On the other hand NO signifi cant differences are observed in serum levels of all enzymes. Hemolysis measured by Spectral index did not show any hemolysis of both serum and plasma tubes.
Analyte Tube System #1 Tube System #2Serum vs. PlasmaBias %
Serum vs. Serum Tubed: Bias %
Plasma vs. Plasma Tubed: Bias %
Serum vs. PlasmaBias %
Serum vs. Serum Tubed:Bias %
Plasma vs. Plasma Tubed: Bias %
Lactate Dehydrogenase (LDH)
9.8 5.9 58.6(p <0.01) -3.0 6.8 42.0
(p <0.01)Aspartate transaminase (AST) 3.1 2.4 24.6
(NS) -1.0 -0.2 8.9(NS)
Alanine Aminotransferase (ALT)
1.1 2.4 14.3(NS) -3.4 -0.3 2.2
(NS)Gamma-glutamyl Transferase (GGT) -1.1 -0.2 10.8 -1.7 0.0 10.2Alkaline Phosphatase (ALK PHOS)
-1.4 0.5 0.6 -2.4 0.1 2.3
Potassium (K) -5.5 0.5 0.7 -7.4 1.0 2.0NS: Not Signifi cantConclusion: LDH levels are signifi cantly elevated based on the length of tube travel in plasma and not in serum. Careful validation is needed when implementing plasma tubes for chemistry analytes, especially when transported through pneumatic tube systems.

Factors Affecting Test Results Tuesday, July 30, 9:30 am – 5:00 pm
CLINICAL CHEMISTRY, Vol. 59, No. 10, Supplement, 2013 A161
A-536
Diagnostic blood specimens collection for erytrocyte sedimentation rate: K2EDTA vs. 4NC sodium citrate
G. Lima-Oliveira1, G. Salvagno2, G. Lippi3, F. Dima2, G. Brocco2, M. Marcori2, L. Mainenti2, G. Picheth1, G. Guidi2. 1Federal University of Parana, Curitiba, Brazil, 2University of Verona, Verona, Italy, 3University of Parma, Parma, Italy
Background and objective: The method for the erythrocyte sedimentation rate (ESR) was fi rst described in 1921 by Dr R Fahraeus and Dr A Westergren, and rapidly became a common screening test worldwide for acute phase proteins and chronic diseases. Despite its limitations and the introduction of other more specifi c markers of infl ammation, the ESR remains a widely used test for the screening and monitoring of infectious, autoimmune, malignant and other disease processes that affect plasma proteins and the sedimentation rate. Recently the ESR determination has been automatized and vacuum tubes with 4NC sodium citrate are commercialized to replace K2EDTA, as an ESR dedicated vacuum tube. Nevertheless, no information is available on theinfl uence of this dedicated vacuum tube on Esr analysis. The aim of the present investigation is to compare ESR results obtained on blood specimens collected with these two different additives.Methods: Blood samples from 20 volunteers were collected by a single, expert phlebotomist. All subjects were maintained seated for 15 minutesto eliminate possible interferences of blood distribution. After this interval of time, a vein was located on the forearm using only a subcutaneous tissue transilluminator device (without tourniquet), and blood samples were collected using a 20-G straight needle (Terumo) directly into 2 different vacuum tubes: Tube I: 2 mL 4NC ESR Sodium Citrate Premium® (Greiner bio-one, GmbH,Kremsmunster, Austria) and Tube II: 3 mL Venosafe® 5.9 mg K2EDTA (Terumo, Europe, Leuven, Belgium). All samples were assayed for ESR on the TEST 1 YDL® (ALIFAX, Padova, Italy). Calibrations were performed according to the instructions provided by the manufacturer. Analytical imprecision, expressed as inter-assay coeffi cient of variation (CV) and calculated according to internal quality control was 0.8-2.2%. Data were analysed with the paired Student’s t-test after checking for normality.Results: The results, expressed as mean ± standard error of the mean (SEM), showed statistically signifi cant difference between Tube I (16 ± 2 mm/h) and Tube II (28 ± 3 mm/h), P < 0.001.Discussion and conclusion: This investigation clearly attests that the preanalytical variability might also affect ESR testing, since the type of additive (4NC sodium citrate or K2EDTA) inside the vacuum tube could infl uence test results. Further studies with more volunteers should be done to confi rm these preliminary results. Finally, laboratory personnel should validate reference ranges for this new kind of additive before introducing the new tubes in laboratory routine.
A-537
Assessment of the validity of Trinity Biotech ultra2 hemoglobin A1c results in the presence of HbE or HbD Punjab trait.
S. Connolly1, S. Hanson1, T. Higgins2, C. Rohlfi ng1, R. Little1. 1University of Missouri, Columbia, MO, 2DynaLIFEDx, Edmonton, AB, Canada
Hemoglobin A1c (HbA1c) is a well-established indicator of mean glycemia and risks for complications in patients with diabetes that is now also recommended for diabetes diagnosis. The presence of variant hemoglobins has been shown to affect the accuracy of some HbA1c assay methods, most notably those based on ion-exchange HPLC but also some immunoassay methods, depending upon the specifi c variant present. Boronate affi nity chromatography is often used as the comparative method for assessing the effects of variant hemoglobins on other assay methodologies due to the fact that it quantitates total glycated hemoglobin regardless of the hemoglobin species present. We have previously shown that HbA1c results for the Trinity Biotech ultra2 boronate affi nity HPLC are not affected by HbS or HbC trait. Here we validate the use of the ultra2 as a comparative method when evaluating interference from HbE or HbD Pujab trait via comparison to results obtained from the IFCC HbA1c reference method (IFCC RM). For the IFCC RM the proteolytic enzyme endoproteinase Glu-C was used to cleave the N-terminal hexapeptides from the hemoglobin beta chains, then the ratio of glycated to non-glycated hexapeptides was determined using HPLC-Capillary Electrophoresis. The amino acid sequence of the N-terminal hexapeptides for the HbE and HbD Punjab beta chains are identical to the sequence for HbA so
IFCC RM results are presumably not affected by the presence of these variants. Samples containing either HbE or HbD Punjab trait as verifi ed using a Bio-Rad Beta Thalassemia HPLC system and Sebia Hydrasys electrophoresis at both alkaline and acid pH, as well as non-variant (HbAA) specimens, were collected and analyzed by both the ultra2 and IFCC RM. An overall test of coincidence of least-squares regression lines was used to determine if the presence of HbE or HbD Punjab trait had a statistically signifi cant effect (P<0.05) on the relationship between ultra2 and IFCC RM results when compared to HbAA results. If a statistically signifi cant effect was observed, Deming regression was used to determine whether the effect of the variant was clinically signifi cant using limits of +/-7% at levels of 6 and 9% HbA1c. No statistically signifi cant effect was observed with HbD Punjab trait (P=0.90) but there was a signifi cant effect for HbE trait (P<0.01). As in previous studies, Deming regression was then used to determine if the difference in the relationships between the two methods for HbE trait vs. HbAA was clinically signifi cant, defi ned as a difference exceeding +/-7% at HbA1c concentrations of 6% and 9%; no clinically signifi cant difference was found. These data support the use of the Trinity ultra2 boronate affi nity method as the comparative method in studies of the effects of HbE and HbD Punjab traits on other HbA1c assay methods.
A-538
Falsely elevated vitamin B12 levels as a result of anti-intrinsic factor antibodies
M. M. Elfahal, C. Dunn, C. Flynn, M. Vytopil, G. Abel. Lahey Hospital and
Medical Center, Burlington, MA
Background: Most immunoassays for vitamin B12 are based on competitive binding of vitamin B12 and intrinsic factor for binding to anti-intrinsic factor antibodies. Failure to inactivate anti-intrinsic factor antibodies in the plasma of patients who are positive for these antibodies could lead to falsely elevated positive results. A patient with clinical symptoms of pernicious anemia and vitamin B12 defi ciency despite consistently high levels of vitamin B12 (>1200 pg/ml) was referred to our institution for consultation and was diagnosed based on the clinical symptoms as having a functional defi ciency of vitamin B12 and treated successfully.Objective: Our objective was to investigate whether the cause of the high vitamin B12 values were intrinsic factor antibodies (IFAB) present in this patient’s plasma.Methods: Vitamin B12, methylmalonic acid (MMA), homocysteine values, and anti-intrinsic factor antibodies were measured by routine methods. Plasma specimens from the patient and from controls with normal B12 levels were selected from remainders of diagnostic specimens in our laboratory in accordance with IRB guidelines. We used polyethylene glycol (PEG) 6000 at a fi nal concentration of 12.5% to precipitate immunoglobulins from the patient and control plasmas and compared B12 levels in PEG-treated versus saline-treated controls. All vitamin B12 measurements were performed on the Beckman Coulter DxC 800 analyzer using the Vitamin B12 Access Assay reagents (Beckman Coulter). The assay is a competitive binding immunoassay in which vitamin B12 from diagnostic specimens competes against an alkaline phosphatase-labeled porcine intrinsic factor for binding to magnetic beads coated with anti intrinsic factor antibodies.Results: Patient MMA and homocysteine levels were both elevated at 23.4 μmol/L, and 54.3 μmol/L, respectively. PEG precipitation resulted in signifi cantly higher reduction in measured B12 levels in the patient specimen (85%) than in saline-treated specimens (mean 42.5%). There was no signifi cant reduction in B12 values as a result of saline treatment only as compared to values measured according to the standard assay procedure.Conclusions: The standard practice guidelines for physicians indicate testing for MMA and homocysteine levels only if B12 levels are low or low-normal, and do not recommend routine measurement of MMA and homocysteine along with the serum B12 levels in order to minimize cost. This case underscores the importance of MMA and homocysteine measurements in establishing the correct diagnosis in patients who are positive for IFAB. Additionally, PEG precipitation could be used successfully in evaluating the role IFAB infl uence vitamin B12 measurements.

Tuesday, July 30, 9:30 am – 5:00 pm Factors Affecting Test Results
A162 CLINICAL CHEMISTRY, Vol. 59, No. 10, Supplement, 2013
A-539
Do We Need to Replicate ELISA (Microtiter Plate) Assays: Quantitative Case.
E. S. Pearlman1, L. King2, C. Hoang1, J. Parikh2. 1Veterans Affairs Medical Center, Memphis, TN, 2University of Tennessee Health Sciences Center, Memphis, TN
Background: Historically micro-titer plate assays have required mean values of duplicate calibrators and patient samples to be used/reported. The lab at the VAMC recently acquired a Triturus (Grifols; Los Angeles, CA) ELISA analyzer to bring our Vitamin D assay in-house. Current (approximately 2000 requests per month) and anticipated volumes make single versus duplicate testing signifi cant from both turn-around time and cost perspectives.Methods: Using the fi rst of two duplicate OD values for the seven standards, calibration curves were constructed using a four parameter logistic (4PL) function on two different runs using Table Curve 2D software (Systat, San Jose, CA). Recoveries on the standards were assessed using the new calibration curves. We also determined results on 39 patients using the fi rst of the two OD values and a single value calibration curve and compared these with Vitamin D concentrations determined from the mean of two OD determinations using EP Evaluator software [Data Innovations, South Burlington, VT].Results: Fitting the data from assigned concentrations and fi rst determination of OD to a 4PL function we obtain:Y = a + {b/ (1 + [x/c]d)}. On two separate runs where Y = OD, x = vitamin D concentration, a = (.27, .29), b = (1.88, 1.92), c = (12.09, 12.69), d = (1.76, 1.80) and r-sq = .99. Comparing concentrations of the standards obtained from the above equation to the designated concentrations we found that for the concentration range [5.9-132] ng/mL the ratios were [97.5-110%] and [98-105%]. The ratios dropped to 56 and 89% at an expected concentration of 2.7 ng/dL and the zero calibrator results were 1.3 and .78 ng/dL. Comparing results that used fi rst OD readings [F] versus those derived from duplicate testing [D} for 39 patients employed Deming regression (DR): F = 1.05 • D - 1.65 . The range of D was 6.6-55.6 ng/mL with 95% CIs on the slope and y-intercept of [1.03, 1.08] and [-2.38, -0.92] respectively and r-sq = .998. In comparing distribution of patient results among the classes <25, 25- 35 and >35 ng/mL., there was complete concordance between D and F results. A comparison of D and F to results from the reference lab suggested similar performance with 21 and 20 percent respectively of the patient specimens being misclassifi ed by one category. Between duplicate CVs on standards and patient sample ODs were <5% in 44/46 (95.7%) instances and all were <7.5%.Conclusion: Although small and relating to one analyte, the present study suggests that duplicate analyses for automated ELISA analyzers may not be required.
A-540
A Cautionary Tale
E. S. Pearlman1, N. Yadak2, I. Henderson3, D. Moore3. 1Vetarans Affairs Medical Center, Memphis, TN, 2University of Tennessee Health Sciences Center, Memphis, TN, 3Veterans Affairs Medical Center, Memphis, TN
Background: We relate an incident of a false positive critical value and its’ implications.Methods: A heparinized plasma (HP) specimen arrived in the main VAMC laboratory during the evening shift having been drawn in a community based outpatient clinic (CBOC). Among the tests requested was a digoxin concentration. All assays were done on a Vitros 5600 analyzer [OCD; Raritan, NJ] according to manufacturer’s directions. The initial digoxin result came back as 5.5 ng/mL (critical concentration in our lab >2.0 ng/mL) with a repeat value of 4.9 ng/dL. The patient an 84 year old male with a history of atrial fi brillations and several cerebral-vascular accidents had been prescribed digoxin in the past but his spouse claimed digoxin was discontinued 2 months prior to specimen acquisition and insisted that the patient had been subsequently abstinent. Review of the patient’s electronic medical record failed to fi nd an explanation for the test order.Results: When the 5600s were acquired, HP was indicated as acceptable for digoxin assay but OCD later informed us that HP generated falsely elevated digoxin concentrations and serum only was acceptable. This information was promptly communicated to users of laboratory services and also inserted in our computerized physician order entry [CPOE] system and HP was delisted as an acceptable specimen for digoxin in our written and on-line procedure manuals Although a separate accession number and label were generated at the time of order for a digoxin assay
using serum, CBOC personnel did not collect a serum tube. When the HP tube arrived at the main lab a tech noted the separate accession number on the pending list (which does not however list required specimen type) and added digoxin to the list of assays to be done from the HP specimen. The medical technologists in our lab can manually order any test on any specimen type. The HP specimen was subsequently sent to a reference lab (ARUP Laboratories; Salt Lake City, UT) and using a different method, the result was <.2 ng/dL. Repeat simultaneous serum and HP specimens drawn the following morning gave values of <.4 ng/mL and 3.8 ng/mL on the serum and HP specimens respectively. The communication from OCD reported a maximum positive bias of 1.3 ng/dL., considerably less than seen in the present incident.Conclusion: Although changed specimen requirements were promptly communicated to laboratory users, failure in respect to proper specimen acquisition, limitations in the LIS (a homegrown VA system) and the wide latitude given to technologists in respect to ordering assays combined to generate a false positive critical value with the possibility of patient hospitalization and un-necessary treatment. The present incident raises the diffi cult question of allowing medical technologists wide latitude to respond to spontaneously occurring situations and the possibility of increasing the incidence of human error by do doing.
A-541
Pre-analytical steps for ammonia measurements: impact on patients management
M. Chen, F. Parente, W. Al-Hertani, E. Delvin. The Montreal Children’s Hospital, Montreal, QC, Canada
Background: Plasma ammonia level plays an important role in screening and follow-up of various metabolic disorders. Measurement of ammonia is often burdened by its pre-analytical conditions leading to cancellation of tests by the laboratory. We wanted to evaluate the pre-analytical turn-around-time of plasma ammonia, the prevalence of cancelled plasma ammonia tests, and the clinical impact of plasma ammonia false positives in our institution.Methods: Over 8 consecutive months, all ammonia specimens collected at Montreal Children’s Hospital were retrospectively analyzed for its pre-analytical turn-around-time, and reasons for test cancellation. One clinical case with artifi cially elevated plasma ammonia results was reviewed for its negative outcomes.Results: A total of 392 plasma ammonia specimens were sent to the Laboratory. The pre-analytical turn-around-time had a median of 46 minutes, and a range of 1 minute to 4 hours 23 minutes. 20% of all specimens were cancelled by the Laboratory. “Sample haemolysis” is the most frequent cause followed by “Specimen not-on-ice” and “registration error”. Among inpatient wards, the Emergency Department had the largest test volume and most haemolysed specimens. The clinical case revealed that falsely elevated plasma ammonia results lead to a 48-hours delay in discharge, unnecessary protein restriction for the patient, and 4 additional blood sampling and laboratory testing.Conclusion: Pre-analytical conditions greatly infl uence plasma ammonia measurement. Lengthy pre-analytical turn-around-time and poor sample processing needs to be thoroughly addressed and optimized. Clinical consequences of false positives can be costly for both patients and the institution.
A-542
Impact of Urine Preservation on Accurate and Reliable Determination of
Emerging Biomarkers of Acute Kidney InjuryA. A. Sethi, D. B. Schranz, C. King, T. Aggoune, T. H. Carlson. Pacifi c Biomarkers,
Seattle, WA, Background: Acute kidney injury (AKI) is defi ned as abrupt reduction in kidney function. Incidence of AKI in hospitalized patients is up to 10% in ICU patients, often associated with multiorgan disease and sepsis. Despite advances in treatment strategies, AKI mortality is ≥50%; hence early, reliable detection of AKI is needed. This study was designed to evaluate the stability and non-specifi c loss of emerging urinary AKI-biomarkers (KIM-1, NGAL, clusterin, cystatin C (Cys-C), n-acetyl-beta-D-glucosaminidase (NAG), retinol-binding protein-4 (RBP4), beta-2 microglobulin (B2M), alpha-1 microglobulin (A1M)) after adding carrier protein (CP) or protease inhibitor (PI) to urine.Methods: Second-void urine from nine subjects (>50y) was collected and combined into three pools; each pool contained urine from three different individuals. The pools were then preserved in four different ways: neat (no additive), CP alone (CP-0), CP plus PI-type1, and CP plus PI-type2. Before freezing, aliquots were left at

Factors Affecting Test Results Tuesday, July 30, 9:30 am – 5:00 pm
CLINICAL CHEMISTRY, Vol. 59, No. 10, Supplement, 2013 A163
ambient temperature for ≤2h (baseline) or 4h, and other aliquots were stored at 2-8°C or incubated at 37°C overnight. Two days later this procedure was repeated with a second fresh collection of urine from the same subjects supplemented with recombinant proteins (2.9 ng/mL KIM-1, 0.56 ng/mL clusterin, 0.11 ng/mL Cys-C, or 0.56 ng/mL RBP4). Aliquots from each condition were thawed the day after collection and analyzed by ELISA or enzyme activity-assay.Results: Mean creatine-normalized biomarker concentrations in the various iterations of the three pools were determined and compared to those from urine that had been preserved with CP alone. At baseline, NGAL, A1M, Cys-C and clusterin showed <10% losses. Losses of 10-15% were observed with all other biomarkers except B2M, which decreased by ~20%. At ambient temperature, NGAL, A1M, Cys-C and clusterin loss was still <10% at 4h. However, KIM-1 and RBP-4 decreased 20-25% under these conditions. NAG and B2M were appreciably below the CP-0 result at baseline and did not decrease further after 4h ambient. Following overnight storage at 2-8°C, A1M, Cys-C and clusterin maintained a decrease of 15% below CP-0. KIM-1, RBP-4 and B2M were not appreciably lower than at 4 h ambient, but they had decreased 20-25% from CP-0. Overnight at 37°C did not further affect NGAL, A1M, Cys-C, KIM-1, RBP-4 (NAG and B2M were not determined) appreciably. Clusterin, however, was ≥80% below CP-0 regardless of the preservation strategy. Compared to CP, addition of either PI did not notably improve recovery of any biomarker.Changes of the biomarkers in recombinant-supplement pools suggested that the recombinant material more quickly disappeared from those pools compared to CP-0; those data were not further evaluated.Conclusion: Emerging biomarkers of AKI injury are most accurately determined when carrier protein is added to fresh urine. All of the biomarkers studied, except clusterin, seemed stable, with or without PI. Clusterin levels decreased by ≥80% on overnight incubation at 37°C in all stability iterations.
A-543
Biological Variability of Urine Neutrophil Gelatinase-Associated Lipocalin (NGAL) in Healthy Adults
J. Racek, D. Rajdl, M. Šolcová, L. Trefi l, V. M. Matějka, J. Fínek. Charles University Hospital, Pilsen, Czech Republic
Background: Neutrophil gelatinase-associated lipocalin (NGAL) is one of the emerging biomarkers for early detection of acute kidney injury. Rational clinical interpretation of any marker is impossible without thorough knowledge of biological variability and analytical precision. The aim of our study was to evaluate these characteristics for urine NGAL in 26 healthy middle-aged volunteers. Methods: We enrolled 26 healthy volunteers (58% of woman, median [IQR] age 36 [28.25-51] years). NGAL was measured with the automated immuno-assay from Abbott Laboratories (Abbott Park, Chicago, IL, USA) on the Architect I 2000 SR platform and expressed either as concentration in μg/L or as a ratio with urine creatinine (μg of NGAL/mmol of urine creatinine). Each participant served with 5 fresh urine samples collected within 1 day in the following times: 6 AM, 10 AM, 14 PM, 18 PM and 22 PM. One of the volunteers was excluded from further analysis because of outlaying results (according to Reed´s criterion). Biological variabilities were calculated according to Fraser using nested ANOVA.Results: Median [IQR] range of urinary NGAL in all samples was 4.3 [1.8-8.4] μg/L (0.52 [0.52-1.29] μg/mmol of urine creatinine. Day-to-day analytical precision expressed as coeffi cient of variation was 5.5%. Intraindividual and interindividual variabilities of urine NGAL accounted for 90% and 4% resp. Ratio of urine NGAL to urine creatinine signifi cantly decreased intra- and increased interindividual proportions of variabilities to 59.5% and 35%.Conclusion: Intraindividual variability is the major source of total urine NGAL variability. However, ratio of urine NGAL to urine creatinine can decrease proportion of this variability.Supported by the project of the Ministry of Health, Czech Republic for conceptual development of research organization 00669806 - Faculty Hospital in Pilsen, Czech Republic
A-544
Stability of Serum and Plasma Osmolality at Various Laboratory ConditionsA. Abbadi1, J. M. El-Khoury2, S. Wang2. 1Cleveland State University, Cleveland, OH, 2Cleveland Clinic, Cleveland, OH
Background: Serum or plasma osmolality is useful in the assessment of electrolyte and acid-base imbalance as shown in diabetes insipidus and the syndrome of inappropriate antidiuretic hormone. However, the stability data of various storage temperatures is scarce in the literature. Therefore, a few major reference laboratories required variable storage requirements for this test. Most recommended plasma or serum be removed from cells then refrigerated at 4-8 °C or frozen if there is a delay in analysis. The objective of this study was to assess the stability of osmolality in serum and plasma at various storage conditions including delay in whole blood centrifugation.Methods: The osmolality of freshly collected heparinized plasma and whole blood from 10 different patients was evaluated over 24 hours at ambient temperature. In the next step, the osmolality of 5 different leftover serum and plasma samples were assessed over a week at ambient temperature and for 4 weeks at 4°C. The criterion for signifi cant change was 3.4% which is two times the analytical variation of the osmometer. Results: The mean percent difference from baseline for osmolality of serum, heparinized plasma, and heparinized whole blood samples was within 2% for all conditions tested. Conclusions: This study demonstrated that no special care is required for measurement of osmolality using serum or plasma samples. Storage of unspun heparinized whole blood for up to 24 hours at ambient temperature, of serum and plasma at ambient temperature for up to 7 days or at 4 °C for up to 4 weeks are all acceptable.

Tuesday, July 30, 9:30 am – 5:00 pm Factors Affecting Test Results
A164 CLINICAL CHEMISTRY, Vol. 59, No. 10, Supplement, 2013
A-545
Effect of pH on the Stability of 5-Hydroxyindole-3-acetic Acid in Urine
A. Abbadi1, J. M. El-Khoury2, S. Wang2. 1Cleveland State University, Cleveland, OH, 2Cleveland Clinic, Cleveland, OH
Background: Measurement of 5-hydroxyindole-3-acetic acid (5-HIAA) in urine is important in detecting metastatic carcinoid tumors and in the study of neurological disorders. A few major reference laboratories recommend acidifi cation of urine samples to stabilize 5-HIAA, especially at ambient temperature. However, the pH effect on the stability of this analyte is poorly defi ned in the literature. The objective of this study was to evaluate the pH effect on the stability of 5-HIAA in urine at ambient temperature. Methods: A 24-hr urine sample was split into two batches which were spiked with 5-HIAA at concentrations of 5 mg/L and 15 mg/L, respectively. These batches were then aliquoted and the pH was adjusted to 2, 7, and 9, with the unadjusted pH of the urine sample being 5.73. Baseline samples (n=3) consisting of the unadjusted urine were frozen at -70°C immediately, while remaining aliquots were kept at ambient temperature then frozen at different time intervals (days 1, 4 and 7). All aliquots were thawed and analyzed in a single batch by a high performance liquid chromatography method. The criterion for signifi cant change was 10.2%, which was calculated based on the within subject biological variation (20.3%). The analytical variation of the method was 2.89%. Results: The percent difference from baseline of the urinary 5-HIAA measurements at all tested pH conditions was less than 2.89% for up to 24 hours. Beyond that, 5-HIAA started to break down. The largest change was less than 7%. Conclusions: Contrary to the common practice, this study demonstrated that acidifi cation of urine samples should not be required for stabilizing 5-HIAA in urine. Samples can be stored at ambient temperature non-acidifi ed for up to 7 days.
A-546
AST assay performed using VITROS® 5600 MicroSlide™ reagent is sensitive to platelet resuspension.
V. Ricchiuti, B. Karr, C. Cronin, F. Lucas. University of Cincinnati Medical
Center, Cincinnati, OH
Background: Resuspension of platelets into centrifuged plasma during transportation may lead to artifi cially elevated aspartate aminotransferase (AST) using VITROS® MicroSlide™ assay (VITROS® 5600, Ortho-Clinical Diagnostics, Inc., Rochester, NY). We performed a study to verify that a heparin plasma versus serum tube should be “kept upright” after centrifugation during transportation to avoid platelet contamination.Method: Heparin plasma (BD Vacutainer PST PLUS, Cat#367962) and serum (BD Vacutainer SST PLUS, Cat#367986) samples collected at same day and time were selected (n=50 each). Samples were transported upright to the VITROS® 5600 after reaching room temperature (RT), loaded onto the analyzer and tested for a panel of four tests: AST which will be affected by platelet resuspension and three other tests used as controls such as alanine aminotransferase (ALT), potassium (K) and thyroid-stimulating Hormone (TSH) (Group A). Samples were centrifuged to ensure platelet poor plasma (platelet counts (PLTC) <10,000/uL) (Hettich EBA 20S, Tuttlingen, Germany, 8000 rpm, 4,800g, 4min, RT) and transported upright to analyzer. Samples were tested again for the panel of tests (Group B). Samples were recapped and laid on the side for two hours at RT, inverted, and reran for the panel of tests (Group C). Finally, samples were centrifuged and transported upright to the VITROS® 5600 and tested again for panel of tests (Group D). Samples used in this study were not hemolyzed, icteric or lipidic. PLTC was performed on 10 paired serum/plasma samples on groups B, C and D using (Beckman Coulter, LH750, Miami, FL).Results: Levels of plasma AST were consistent in Groups A and B (34 ± 2 U/L and 33 ± 2 U/L, respectively). PLTC in group B plasma was 15,800 ± 4800/uL). AST levels doubled in Group C and PLTC increased as well (AST = 65 ± 5 U/L; PLTC = 75,400 ± 18,000/uL) when compared to baseline groups A and B. However, AST or PLTC did not return to baseline levels in group D (AST = 40 ± 3 U/L; PLTC 34,600 ± 9,000/uL). Serum did not show any difference in the four groups, however average serum AST at baseline compared to plasma was 24% lower (26 ± 2 U/L and 34 ± 2 U/L, respectively). 4 out 10 plasma specimens were above 10,000 PLTC /uL, with average 10,700 ± 4100/uL, while serum had lower PLTC (2,400 ± 400/uL). PLTC values ranges were 2-4,000/uL in serum and 3-31,000/uL in plasma. ALT, K and TSH did not show any changes as results among all groups were similar in plasma (average within all groups were in plasma 40 ± 3 U/L, 4.6 ± 0.15 mmol/L, 3.2 ± 0.90 mU/L, and serum 39 ± 4 U/L, 4.7 ± 0.16 mmol/L, 3.5 ± 0.98 mU/L, respectively.Conclusion: VITROS® MicroSlide™ AST assay showed higher levels in heparin plasma when compared to serum, however, none of ALT, K or TSH were affected. Assay is giving higher levels when platelet resuspension was happening therefore contaminating plasma with AST from platelet. Finally, following recommended spinning speed, and time using Hettich EBA 20S some plasma samples were not platelet poor.
A-547
Automated NMR Analyzer with Lab-temperature Normalization and Vibration Isolation: Environmental Effects on Measurement of Serum Lipoproteins
A. Sakhare, R. Haner, R. Keim, W. Knouse, D. Morgan. LipoScience, Raleigh, NC
Background: The performance of analytical instrumentation in medical laboratories can be affected by a variety of environmental factors. The Vantera® system is a fully automated clinical analyzer consisting of an integrated fl ow-through sample handler and 400 MHz NMR spectrometer capable of performing quantitative analysis of serum lipoproteins. To minimize the effect of environmental conditions, Vantera has been designed with vibration isolation and temperature dependent linear normalization. The aim of this study was to evaluate the residual effects of ambient air temperature, humidity, and vertical fl oor vibrations on the performance characteristics of lipoprotein assays performed on Vantera.Methods: A thermally insulated chamber (8’x8’x16’) was constructed and placed around Vantera for the purposes of temperature and humidity testing. The chamber featured thermostat control, air circulation capabilities, and provisions to allow for setting and monitoring a nominally uniform relative humidity. Standardized serum

Factors Affecting Test Results Tuesday, July 30, 9:30 am – 5:00 pm
CLINICAL CHEMISTRY, Vol. 59, No. 10, Supplement, 2013 A165
pool samples were quantitatively analyzed with Vantera at ambient air temperatures of 60, 65, 70, 75, 80, and 85 °F. Each of the six temperature points were tested at humidity levels of 15% and 80%. For vibration testing, the same standardized samples were quantitatively analyzed with Vantera while subjected to average vertical fl oor vibrations of approximately 60, 250, 280, and 335 micro-gravities at 3, 7, 12, and 30 Hz, respectively.Results: At 60 °F, low-density lipoprotein particle number (LDL-P) bias was slightly over 10% (10.3%) when calculated with respect to approximate maximum values obtained at 75 °F. Interpolation of the data at 60 and 65 °F showed that 61 °F was the temperature at which LDL-P bias was within 10%. At temperatures between 61 and 85 °F, LDL-P bias was less than 10%. LDL-P bias between the 15% and 80% humidity levels was less than 7% at all temperatures tested. LDL-P bias due to fl oor vibrations was less than 6% at all frequencies tested.Conclusion: Our experiments show that the measurement of LDL-P on Vantera can be affected by environmental conditions such as temperature, humidity, and the presence of fl oor vibrations even after temperature dependent linear normalization and vibration isolation is applied. However, while the amount of bias present at each environmental condition is statistically signifi cant, it is not clinically signifi cant as the variance in mean analyte value in each case is less than 10% which is acceptable in clinical laboratories. Furthermore, the humidity and vibration levels tested in this study represent extreme conditions and are not considered standard operating conditions in a clinical laboratory.
A-548
Inappropriate Gel Barrier Formation at Low and Normal Total Protein Concentrations
H. Li1, J. R. Healey2, M. Rapp1, L. E. Keczem1, A. S. Ptolemy1. 1Gamma-Dynacare Medical Laboratories, London, ON, Canada, 2Gamma-Dynacare Medical Laboratories, Brampton, ON, Canada
Background: Laboratories often perform routine chemical analyses with serum-based blood collection tubes containing separator gels. Following centrifugation, inappropriate gel barrier formation has previously been reported to occur in specimens with elevated densities and total protein concentrations. In these specimens the barrier gel may fl oat on or near the surface of the sample supernatant. Such an occurrence is of concern to laboratories with automated centrifugation and on-line sample transport systems linked to their chemical analyzers. Over an approximate six-month period we identifi ed fi fteen serum samples with anomalously fl oating separator gels. This study examined the relationship between total protein concentration and inappropriate gel formation. The presence and potential impact of serum protein abnormalities on gel barrier formation was also investigated by protein electrophoresis.Methods: In the fi fteen specimens visually identifi ed to have inappropriately formed gel barriers, following routine centrifugation at 2000g for 10 min, the serum total protein level was quantifi ed by a colorimetric assay on a Roche Modular system (Roche Diagnostics). Patient serum was also analyzed by serum protein electrophoresis (SPE) and immunofi xation electrophoresis (IFE) (Sebia Hydrasys 2) to detect serum abnormalities. All testing was performed according to manufacturer recommendations. The quantifi ed total protein levels (reference range: 60 to 80 g/L) and identifi ed serum abnormalities were systemically reviewed for the specimen cohort, which consisted of six male and nine female patients ranging from 39 to 95 years in age. The average patient age was 78 years. No clinical history, including any potential gammopathy diagnoses or previous SPE testing, was available for all patients. Results: The average (mean ± SD) total protein concentration for all specimens (N = 15) was 72 ± 19 g/L. The total protein levels of only two specimens exceeded the normal range. Their protein concentrations were 89 and 131 g/L, respectively. Five specimens had low total protein concentrations, which ranged from 50 to 58 g/L in these samples. The average concentration of protein in the remaining nine samples was 72 ± 19 g/L. Inappropriate gel barrier formation with low to normal total protein concentrations has not been previously reported. SPE revealed the gamma globulin fraction to be elevated (reference range: 6 to 14 g/L) in six of the fi fteen specimens (40%), including the two samples with elevated total protein. The presence of monoclonal protein, an IgG-κ and IgM-κ, was identifi ed in two patients, respectively.Conclusion: Serum-based blood collection tubes containing separator gels may experience inappropriate barrier formation at low to normal total protein concentrations. High solution density is likely responsible for the observed fl oating gel barriers. Laboratories should be aware that total protein concentration is not the sole variable governing inappropriate gel barrier formation.
A-549
Chart review and Statistical Analysis of Patient Values Demonstrating that Sample pH can Contribute to Discrepancies Between Total Carbon Dioxide Measurements and Calculated Bicarbonate Values
M. P. A. Henderson, J. L. Shaw, C. R. McCudden, S. L. Perkins. The Ottawa Hospital and The University of Ottawa, Ottawa, ON, Canada
Objectives: Bicarbonate concentration is commonly used in the assessment of acid-base status. In clinical practice, measured total carbon dioxide and calculated bicarbonate are often used interchangeably, however, discrepancies are observed. Historical patient data was used to examine the relationship between measured total carbon dioxide and calculated bicarbonate.Methods: Total carbon dioxide in serum or plasma was measured enzymatically on the Siemens Dimension Vista 1500. Whole blood pH and pCO2 were measured on the GEM 4000 blood gas analyzer by ion-selective electrodes. The blood gas analyzer calculated bicarbonate using the Henderson-Hasselbach equation which assumes a pKa of 6.1. Records from 8849 blood gas analyses performed at The Ottawa Hospital were linked to total carbon dioxide measured on the same patient within 2 hours. Deming regression examined the relationship between calculated bicarbonate and measured total carbon dioxide. Linear regression examined the effect of pH, sodium concentration (as a surrogate for ionic strength), time interval between measurements, and pCO2 on the difference between carbon dioxide and bicarbonate values.Results: The relationship between total carbon dioxide and calculated bicarbonate shows proportional and constant bias: Calculated Bicarbonate = 1.23 * Total CO2 − 5.43. The sample pH has a signifi cant effect on the difference between calculated bicarbonate and total carbon dioxide (Table 1). While other factors in the model are statistically signifi cant, they have inconsequential beta coeffi cients. Upon chart review, many of the patients with large discrepancies exhibited respiratory failure/distress.Conclusions: Calculated bicarbonate and total carbon dioxide agree well near the reference interval but exhibit proportional and constant bias at extremes of pH. Calculated bicarbonate and total carbon dioxide should not be used interchangeably in patients with acid-base disturbances. In these situations, measurement of total carbon dioxide is preferable.
Summary of Linear Regression Analysis of the Difference between Calculated Bicarbonate and MeasuredParemeter Estimate (β-coeffi cient) Std. Error t-value Pr (> t)Intercept 59.81 3.68 16.25 0.00pH -8.56 0.5 -17.06 0.00pCO2 -0.06 0.01 -12.64 0.00Sodium -0.02 0.01 -7.03 0.00Bicarbonate 0.35 0.01 36.87 0.00Time (min.) 0.00 0.01 4.27 0.00
A-550
Ethanol is unaffected by clearing of lipemic samples using an airfuge
A. A. Venner, A. Dennis, K. Carter, J. C. Wesenberg. Alberta Health Services, Red Deer, AB, Canada
Background: Ethanol is commonly assayed on chemistry analyzers, often along with other requested analytes. Lipemia interferes with a variety of tests on chemistry analyzers. This interference is commonly avoided by using an airfuge to clear samples prior to analysis. However as ethanol is volatile, there is concern that airfuging may negatively impact the result. This study evaluated the effect of airfuging serum/plasma samples tested for ethanol on a chemistry analyzer.Methods: Twenty-six serum/plasma patient samples with ethanol concentrations from 5-63 mmol/L (23-290 mg/dL) were tested on a Siemens Dimension Vista® 1500 analyzer before and after airfuging (Beckman Airfuge Ultracentrifuge for 10 minutes at 30 psi). Data analysis included summary statistics, paired two-sample t-test analysis, absolute and relative difference calculation, and agreement assessment by Bland-Altman.Results: For all twenty six samples, the mean ± 1SD was 33.9 ± 15.7 mmol/L (156 ± 72 mg/dL) pre-airfuge and 33.2 ± 15.6 mmol/L (153 ± 72 mg/dL) post-airfuge. As most results were marginally lower post-airfuge, the t-test showed a statistical difference (p-value = 0.004). As the range of differences was only -3.1 to 1.9 mmol/L (-14 to 9 mg/dL), the difference was not considered clinically signifi cant. The results were highly correlated (Pearson correlation = 0.9977). The Bland-Altman analysis

Tuesday, July 30, 9:30 am – 5:00 pm Factors Affecting Test Results
A166 CLINICAL CHEMISTRY, Vol. 59, No. 10, Supplement, 2013
(Figure) indicated that the 95% limits of agreement between the pre- and post-airfuge results were between a narrow range of -2.74 and 1.43 mmol/L (-13 and 7 mg/dL), supporting the lack of clinical signifi cance.Conclusion: The difference in ethanol results pre- and post-airfuge was not clinically signifi cant. The airfuge is benefi cial for ethanol assays affected by lipemia. Even if the ethanol assay is unaffected by lipemia, if there are requested tests that are affected, use of the airfuge and the ability to run all of the tests together improves workfl ow.
A-551
Sodium Azide Mediated Inhibition of LOCI® Assay Methods on the Siemens Dimension® ExL™
B. Fernández, M. Ghadessi, M. Ban. Quantimetrix, Redondo Beach, CA
Background: Sodium azide (NaN3) is an effective biocide in solutions that may otherwise support microbial growth. NaN3 is a common preservative in many reagent, control, and calibrator formulations. The Siemens Dimension® ExL™ is an integrated chemistry and immunoassay analyzer that supports the luminescent oxygen channeling (LOCI®) assay technology capable of the rapid determination of many analytes over a wide range of concentrations. Latex particle pairs, containing a photosensitizer and chemiluminescer, are formed through specifi c binding interactions with the sample. Illumination at 680nm generates the formation of singlet oxygen which triggers a luminescence emission used to determine the analyte concentration. Since NaN3 is potent scavenger of singlet oxygen, control and calibrator materials formulated with NaN3 may inhibit the signal on LOCI assay methods.Objective: To determine the effect of NaN3 on the Siemens Dimension ExL TNI and NTP LOCI assay methods.Methods: A NaN3-free human serum derived matrix was formulated with preparations of cardiac Troponin I (TNI) and N-terminal pro-natriuretic peptide (NTP) to clinically signifi cant levels. Aliquots were divided into 8 pools to which sodium azide was added at 0, 0.05, 0.1, 0.2, 0.24, 0.48, 0.95, and 1.9 mg/mL respectively then were assayed for TNI and NTP recovery on the Siemens Dimension ExL.Results:
Table 1: Effect of NaN3 on the Siemens Dimension ExL TNI and NTP LOCI Assays
NaN3 (mg/mL) % Recovery vs 0 NaN3LOCI TNI LOCI NTP
0 100% 100%0.05 94% 97%0.1 87% 91%0.2 83% 87%0.24 77% 86%0.48 62% 73%0.95 43% 59%1.9 25% 39%Conclusion: NaN3 is a potent inhibitor of the TNI and NTP LOCI assays on the Siemens Dimension ExL. The formulation in the commonly used 0.95 mg/mL NaN3 concentration resulted in a signifi cant suppression of results. While this study was limited to only TNI and NTP, it is likely that other LOCI methods would show similar results. Control and calibrator formulated with any amount of NaN3 should be avoided on LOCI methods prevent skewed control results, calibrator curves, and ultimately prevent patient misdiagnosis. The new Quantimetrix cardiac control formulation will be NaN3-free to avoid this issue.
A-552
Suggested specifi cation for Total Error of 5 different assays used in Neonatal screening, obtained by Aleatory and Systematic Error sum.
R. C. M. Barbi1, L. G. S. Carvalho1, F. D. Sandrini1, M. Molina2, C. F. A. Pereira2. 1DASA, Cascavel, Brazil, 2DASA, São Paulo, Brazil
Background: Screening means to identify, within a population considered “normal”, those individuals who are at risk of developing a specifi c disease and who would benefi t from further investigation (to confi rm or to exclude this risk) or preventive action. An assertive neonatal screening changes dramatically the prognosis of patients, and early treatment ensures continuous life quality of affected children, being the philosophical basis of neonatal screening programs worldwide. Screening tests should be simple, effi cient, applicable on a large scale and cheap, and it must be remembered that it is not a diagnostic test (and therefore it is acceptable to have false negatives, although not desirable) and must have high sensitivity and specifi city, although it may be associated with a large number of false positives. The Total Error or the Maximum Permissible Error are different for each laboratory test, and establishes test performance so that it fi ts the purpose of use. The Analytical Total Error can be calculated by different approaches, the most common form is the sum of Random Error with Systematic one. Total Error Limits defi nes how much results can vary and/or approach targets values aimed at clinically acceptable performance for these laboratory tests. Evaluate the total error for 5 newborn screening tests, calculated from sum of Systematic and Random Errors.Methods: The Total Error was calculated by the sum of Random and Systematic Errors of 5 different neonatal screening assays (PerkinElmer®): 17 alpha hydroxyprogesterone, total T4, immunoreactive trypsin, TSH and Phenylalanine, from January to December 2012. For the Random Error we used the coeffi cient of variation (CV) of each test multiplied to 1,65 for a desired confi dence level of 90%. For Systematic Error calculation, we used results from three Profi ciency Test providers: Control Lab® (Pesquisa Neonatal) , Centers for Disease Control and Prevention® - CDC - ( Newborn Screening Program) and Programa de Evaluación Externa de Calidad - PEEC - (Pesquisa Neonatal).Results: The medium CV of the period for each analyte was 8,27% for 17 alpha hydroxyprogesterone, 13,33%, for total T4, 8,78% for immunoreactive trypsin, 9,96% for TSH and 17,75% for Phenylalanine. The Total Error obtained was 22.57% for 17 alpha hydroxyprogesterone, 26.54%, for total T4, 22.39% for immunoreactive trypsin, 23.38% for TSH and 35.0% for Phenylalanine.Conclusion: Taking into account the medium CV of the period, for each analyte, compared to the CV reported by the manufacturer in the package insert, we realized that all our obtained CVs are smaller than the ones informed by PerkinElmer®. We also note that the results of the Profi ciency Testing are all suitable. Considering all these issues we can assume that the calculated Total Error for these assays are adequate for its proposed purposes.
A-553
Case Report: Molecular fetal sex determination and allogeneic immunization.
F. Oliveira1, P. trojano1, P. Macedo1, F. Monica2, N. Gaburo1. 1DASA, Sao
Paulo Brasil, Brazil, 2DASA, Rio de Janeiro Brasil, Brazil
Background: The immunization using paternal lymphocytes has been used as treatment in women who had consecutive miscarriages. In literature, there is a concern whether this treatment can interfere with the results of tests like identifi cation of fetal sex from maternal plasma and there are few data published about it. Fetal sex determination is an early and non-invasive method usually performed in the fi rst trimester of pregnancy with fetal genetic material amplifi ed from maternal plasma by a molecular method. This test targets the DSY14 region of Y chromosome and is routinely performed at DASA´s Molecular Diagnostics laboratory.Methods:A 33 years old woman, at week 8 of pregnancy was submitted to fetal sex determination by molecular method. The test was performed in duplicate, using two different DNA extractions from two different tubes, following the laboratory standard procedure.Results: Result was compatible with the presence of male fetus, with the target DSY14 amplifi cation cycle threshold in 33.21 and 33.85 (cycles bellow 35.62 are considered positive). At 18th gestational week ultrasound suggests a presence of female fetus, in disagreement with previous fetal sex determination results and a new blood sample was collected to repeat the test. The result was found female, with

Factors Affecting Test Results Tuesday, July 30, 9:30 am – 5:00 pm
CLINICAL CHEMISTRY, Vol. 59, No. 10, Supplement, 2013 A167
absence of DSY14 region amplifi cation. The test was also repeated using the original primary tube sample and the male result was confi rmed (excluding possible sample mixup). The contact with patient’s physician brought the information that she was submitted to an allogeneic immunization using paternal lymphocytes only one day prior to sample collection for fetal sex test.Conclusion: In this case, the immunization with male cells procedure one day prior to sample collection has interfered with results of fetal sex determination when the DSY14 is detected in plasma of pregnant women.
A-554
Validation of four vacuum tubes with different inhibitor of glycolysis
G. Lima-Oliveira1, G. Lippi2, G. Salvagno3, M. Montagnana3, G. Picheth1, G. Guidi3. 1Federal University of Parana, Curitiba, Brazil, 2University of Parma, Parma, Italy, 3University of Verona, Verona, Italy
Background and objective: Necessary improvements and potential sources of nonconformities, either technical or concerning the quality management system, shall be indentifi ed and all laboratory process shall be validated. The aim of this study was to validate four different kinds of sodium fl uoride vacuum tubes for glucose and lactate determinations.Methods: Blood specimens from 19 volunteers were collected by a single, expert phlebotomist. All were maintained seated for 15 minutes to eliminate possible interferences of blood distribution. After this interval oftime, a vein was located on the forearm using only a subcutaneous tissue transilluminator device (without tourniquet), and blood samples were collected using a 20-G straight needle (Terumo) directly into 4 different vacuum tubes: Tube I: Vacutainer® FX 5mg/4mg; Tube II: Vacuntainer® NaF 6mg Na2EDTA 12mg; Tube III: Venosafe® FX and Tube IV: Vacuo-Care® NaF/OxK). Glucose and lactate were performed on the same instrument cobas® 6000 <c501> module (Roche Diagnostics GmbH, Penzberg, Germany). The significance of the differences among samples (fl uoride vacuum tubes) was assessed by Friedman test and Wilcoxon ranked-pairs test after checking for normality, at P<0.05.Results: The median concentration and interquartile range (IQR) of glucose and lactate are respectively: Tube I 84.0 mg/dL [79.0-89.0 mg/dL] and 1.15 mg/dL [1.00-1.72 mg/dL]; Tube II 87.5 mg/dL [79.8-92.0 mg/dL]and 1.05 mg/dL [0.88-1.70 mg/dL]; Tube III 82.0 mg/dL [78.0-88.2 mg/dL] and 1.35 mg/dL [1.10-1.92 mg/dL], Tube IV 81.5 mg/dL [74.8-85.2 mg/dL]and1.65 mg/dL [1.45-2.20 mg/dL]. Significant differences were observed for all different tested tubes (p<0.05).Discussion and Conclusion: The results of the present validation do not allow the laboratory or hospital managers to choose indifferently among the above brands of sodium fl uoride vacuum tubes. Changes in vacuum tubes without validation can induce caring physicians, unaware of the real patient conditions, to abstain from appropriate treatments as a consequence of change in sodium fl uoride vacuum tubes brands. We suggest that every laboratory manager should both standardize the procedures and frequently evaluate the quality of in-vitro diagnostic devices to guarantee the patient safety as recommended by ISO 15189document.
A-555
Best Practices for the Use of Micropipettes
A. Carle, D. Rumery, A. Davis. ARTEL, Westbrook, ME
Mechanical action micropipettes are ubiquitous in laboratories and are used for many routine tasks, including the quantitative measurement and dispensing of analytical samples and reagents. Concentrations of biological and chemical components in the prepared samples for assays and tests are volume-dependent and incorrectly performed pipetting steps will directly impact the transferred volumes, and hence, the test results. The design and construction of these pipettes render their performance susceptible to the technique and skills used by the operator of such devices.This poster describes the basic principles related to an operator’s pipetting technique, and quantifi es the errors induced by using improper techniques. For example, not pre-wetting the pipette tip may induce up to 1.5% error in the dispensed volume, which may be added to another 1.5% variation induced by the length of the pause before removing the pipette tip from the sample solution. Adding to the cumulative error in pipetting are inconsistencies in aspiration and dispense speeds and applied pressure
on the plunger (up to 0.5%), heat transfer from the hands (up to 1.8%), improper immersion depth of the pipette tip into the sample (up to 1.3%), and the choice of the pipetting mode (up to 2.5%).For obtaining reliable laboratory test results it is imperative that all pipette operators are consistently using the proper pipetting technique. Training pipette operators on using the correct pipetting technique ensures confi dence in the test results on which a clinical diagnosis is based, and is equally critical in assay transfer situations or whenever results from different operators and laboratories need to be compared to each other.
A-556
Systematic Analysis of Leachables and Extractables in Clinical Polymeric Consumables
K. T. Harris, G. Mao, G. Li. Porex Corporation, Fairburn, GA
Advancements in ever-increasing sensitivity of analytical instrumentation coupled with demand for higher sensitivity in many life science applications have led to a critical need for signifi cant improvement in the cleanliness of plastic consumables. In light of recent technological advancements and market requirements, Porex has initiated a Certifi ed Pure Program to qualify porous polymeric materials via a stringent program of various analytical, clinical and life science testing procedures. Porex porous polymers were tested by means of PYMS, PIXE and LCMS for heavy metal contamination, polymeric components and other organic compounds. Additional testing for hemolysis and cytotoxicity was performed using ISO 10993-5 MRM and modifi ed ASTM F 756-08 GLP compliant methodologies. Porex Certifi ed Pure materials were found to have virtually no material additives, contaminants or heavy metals that cause interferences in clinical and laboratory testing. These materials were verifi ed to be non-cytotoxic and non-hemolytic via independent testing labs. Porex Certifi ed Pure materials have 99.9% Bacterial Aerosol Filtration Effi ciency (BFE) as tested by ASTM F21012 methodology. To our knowledge, this is the fi rst extensive qualifi cation program for porous polymeric materials that fi lls a critical gap in the progression of developing standardized methodologies in the analysis of leachables and extractables in plastic consumables.
A-558
Measuring the Impact of Analytical Error on Test Interpretation
M. H. Kroll, C. Garber, C. Bi, S. Suffi n. Quest Diagnostics, Madison, NJ
Background: Analytical error negatively impacts patient care quality by generating misclassifi cation. One can quantify misclassifi cation by evaluating the effect of bias and imprecision at a specifi ed test value. This study uses cholesterol as an example.Methods: We partition the Total Allowable Error (TE[a]) between bias and imprecision. Bias shifts the density distribution along the x-axis, while imprecision, measured as the standard deviation or coeffi cient of variation (CV), broadens the range of the distribution. Both the bias and imprecision must be applied at the same time to evaluate the fraction of the population misclassifi ed by analytical error. Assuming particular values for the test and the TE[a], one can calculate the fraction of the population at that test value that transverses a partition, the reference interval or cut-point, using the cumulative distribution. We take cholesterol as an example, with TE[a]=9%, one-third allowed for bias, two-thirds allowed for imprecision, average concentration of 195 and cut-point of 200 mg/dL. Assuming a normal distribution, we calculated the fraction of patients with an average concentration (not at risk) which would be considered at risk because their values would be reported above 200 mg/dL.Results: The graph shows the fraction of normal patients considered abnormal because their cholesterol values exceed the 200 mg/dL cutpoint for four levels of Total Allowable Error. The Bias Error Fraction represents the negative or positive bias. For Bias Error Fraction = 0.2 and TE[a]=9%, the bias = 1.8% and the CV=3.6%.Conclusion: The Fraction Considered Abnormal is greater than the TE[a] for positive bias. At a TE[a] of 9% and bias = 1/3 TE[a], the percentage considered abnormal exceeds 50%. Bias has a greater impact than imprecision for cholesterol. Misclassifi cation impact should be considered as a goal for setting the allowed TE[a] and bias.

Tuesday, July 30, 9:30 am – 5:00 pm Factors Affecting Test Results
A168 CLINICAL CHEMISTRY, Vol. 59, No. 10, Supplement, 2013
A-559
Risk Estimates for HbA1c Result Reliability Across Four Academic Medical Centers Using Analytical Performance Characteristics and Routine Quality Control Practice
A. Woodworth1, N. Korpi-Steiner2, J. J. Miller1, R. V. Lokinendi3, J. C. Yundt-Pacheco4, L. Kuchipudi4, J. M. Rhea5, C. A. Parvin4, R. Molinaro5. 1Vanderbilt University School of Medicine, Nashville, TN, 2University of North Carolina, Chapel Hill, NC, 3University of Massachusetts Memorial Medical Center, Worcester, MA, 4Bio-Rad Laboratories, Plano, TX, 5Emory University, Atlanta, GA
Background: Assay standardization has facilitated the utilization of HbA1c for the diagnosis of diabetes. Guidelines recommend maintenance of precise and accurate HbA1c assays with total allowable error (TEA) goals of <7%. This requires minimal assay imprecision and bias as well as implementation of a robust quality control (QC) monitoring program. Objective: To compare the infl uence of routine QC practices and analytical performance characteristics of 8 different HbA1c instruments (3 different methodologies) across 4 academic medical centers on risk of reporting erroneous results. Methods: Four sites using 8 different NGSP-certifi ed HbA1c instruments measured imprecision (using QC specimens) and bias (using pooled patient samples with values assigned by a level 1 NGSP-certifi ed laboratory) for method comparisons according to CLSI guidelines EP5 and EP9. Methods included ion-exchange chromatography (HPLC), immunoassay (point-of-care and automated analyzers), and capillary electrophoresis. Patient-weighted Sigma values ((TEA - %Bias)/CV) for each instrument were calculated at each HbA1c concentration and averaged over the observed HbA1c patient distribution. For these analyses, TEA was set to 7%, QC rules were set to 1-2s with 2 QC levels, and the average number of HbA1c examinations between QC events was set to 100. Results: Imprecision and bias calculations indicate a large range of patient-weighted Sigma values (Table) spanning 0.5 orders of magnitude (0.85 - 4.56). While imprecision for all instruments was less than 5%, bias impacted the majority of the Sigma changes observed. Risk estimates for reporting unreliable results based upon analytical performance alone varied almost 500 fold across the 8 HbA1c instruments. Conclusions: Considerable differences in the probability of reporting erroneous HbA1C results between 8 different platforms were observed using routine QC conditions. Risk estimates for individual laboratories’ HbA1c methods should be utilized to assess QC practices and residual risk of an unreliable HbA1c result.
Instrument
Level 1 QC Mean % HbA1c
% CV % Bias
Level 2 QC Mean % HbA1c
% CV % Bias
Patient-Weighted Sigma(TEA = 7%)
HPLC-1 5.18 2.97 -0.08 10.07 1.81 0.10 2.67HPLC-2 5.09 1.43 -4.99 9.74 1.33 2.00 2.30HPLC-3 5.75 1.28 3.99 9.60 0.80 4.98 2.27Capillary Electrophoresis 5.24 1.66 -0.33 7.93 1.33 -0.01 4.56Immunoassay POCT-1* 5.23 1.93 -0.37 10.49 1.81 1.73 3.36Immunoassay POCT-2* 5.31 1.88 -0.34 10.31 2.65 2.72 2.84Immunoassay Analyzer-1 5.57 4.44 -5.22 13.27 2.04 -4.45 1.06Immunoassay Analyzer-2 5.61 2.40 5.76 9.90 1.18 4.07 0.85
*Same method at different sites
A-560
PREANALYTICAL ERRORS IN CLINICAL LABORATORY DEPARTMENT OF A PERUVIAN NATIONAL GENERAL HOSPITAL
P. C. Donayre Medina1, H. M. Zeballos Conislla1, B. J. Sanchez Jacinto1, A. Palacios Ramirez2, S. M. Flores Toledo1, J. C. Jara Aguirre1. 1Universidad Peruana Cayetano Heredia, School of Medical Technology, Faculty of Medicine Alberto Hurtado, Lima, Peru, 2Hospital Nacional Cayetano Heredia, Lima, Peru
BACKGROUND: Clinical laboratory processing tests involves three stages: preanalytical, analytical and postanalytical. Most errors affecting laboratory test results occur in the preanalytical stage, the preanalytical errors have been reported to account for more than two thirds of all laboratory error. Quality improvement in the preanalytical stage helps laboratories to provide more accurate test results for clinician’s crucial factors in terms of clinical impact and patient outcome, so it’s necessary to determine the frequency of prenalytical errors of a clinical laboratory.METHODS: We evaluated the frequency and types of preanalytic errors in the Clinical Laboratory Department of a National General Hospital Cayetano Heredia, in Lima, Peru between November and December 2012; by monitoring and direct observation of outpatient’s blood samples from different clinical departments. A total of 434 blood representative specimens analyzed in Clinical Chemistry, Immunology and Hematology/Coagulation areas of the Central Clinical Laboratory were random collected followed from blood sample collection area through the processing areas and prenalytical errors were register, identifi ed using a validated check list and the frequency was calculated using spreadsheet MS Excel 2010 and data analysis/statistic software STATA version 9.RESULTS: A total of 1415 different preanalytical errors were found and the distribution was: patient identifi cation/preparation 5.93% (n=84), mismatch between order and sample 0% (n=0), specimen collection 57.52% (n=820), specimen sampling 70.24% (n=511), sample transportation 0% (n=0). About errors in patient identifi cation, 13.59% (n=59) were related to Patient preparation prior to sample collection, 29.76% (n=25) were related to incorrect identifi cation outpatient service/department. About errors in specimen collection, 41.83% (n=343) inadequate asepsis, 13.53% (n=111) incorrect order of draw, 44.63% (n=366) prolongate time of tourniquet. About errors in sample collection, 21.53% (n=110) inadequate volume, 0.20% (n=1) clotted sample, 78.28% (n=400) insuffi cient number of sample inversions/homogenization.CONCLUSION: The observed results demonstrate, the need of improvement of preanalytical specimen sampling and collection and the promotion of quality control in preanalytical stage as a prerequisite for an effective laboratory service, clinical useful of the lab results and patient outcome.
A-561
Increased frequency of quality controls compared to RiLIBAEK rules
A. Petersmann1, S. Keutmann1, M. Nauck1, A. Kallner2. 1University Medicine Greifswald, Greifswald, Germany, 2Karolinska University Hospital, Stockholm, Sweden
The required frequency of measuring internal quality control samples (QC) varies between local schemes and national regulations. The German RiLiBAEK rules a minimum of two QC measurements per analyte and measuring system if operated 24 hours a day. After a valid QC measurement hundreds or thousands of patient samples may be processed and reported. It is usually assumed that if QC measurements are within a stated interval, the quality of the following patient sample results are usually assumed adequate if no malfunction or other alarms occur but will not be checked until the next QC measurement. Temporary effects, caused by variations in work load, environment, day time or unforeseen incidents may be overlooked. To investigate the reliability of the instruments and the adequacy of the RiLiBAEK rules we measured QC hourly around the clock during 7 days. On an average, daily, 20 control samples were included for twelve frequently requested analytes. We determined the daily uncertainty profi les for each measuring system and analyte as well as the variation between instruments. QC samples were directly introduced to each of three Dimension Vista (Siemens). Also, a sample was randomly distributed to the three instruments by Streamlab (Siemens). For this abstract we have chosen to illustrate the results using cholesterol as an example and the poster will present all data. The variation between instruments and within days was calculated using one-factor ANOVA. The reproducibility and laboratory measurement uncertainty was calculated essentially

Factors Affecting Test Results Tuesday, July 30, 9:30 am – 5:00 pm
CLINICAL CHEMISTRY, Vol. 59, No. 10, Supplement, 2013 A169
according to CLSI EP15. The %CVs at the high, middle and low levels were 8.3, 6.8 and 5.5 %, respectively. The RiLiBAEK limits (target ±7 %) were not exceeded with cholesterol irrespective of the day time or workload.

Tuesday, July 30, 9:30 am – 5:00 pm Animal Clinical Chemistry
A170 CLINICAL CHEMISTRY, Vol. 59, No. 10, Supplement, 2013
Wednesday, July 31, 2013
Poster Session: 9:30 AM - 5:00 PM
Animal Clinical Chemistry
B-01
Method Modifi cation, Analytical Validation and Correlation of Alpha-2-Macroglobulin Assay for Use with Rat Serum on the Siemens Advia 1800 Automated Clinical Chemistry Analyzer
D. Carraher1, J. Stejskal1, M. Jesson1, S. Ramaiah1, P. Christensen2. 1Pfi zer, Inc, Andover, MA, 2Dako Denmark A/S, Glostrup, Denmark
Acute phase proteins (APP) are considered to be general biomarkers of systemic infl ammation, and there is strong correlation between their measured changes in blood and other infl ammatory end-points. C-reactive protein (CRP) is a well-established and widely used indicator of the acute phase response in humans, but has an altered temporal and dynamic response in rodents making it a poor biomarker for pre-clinical studies. In contrast, alpha-2-macroglobulin (A2M) and haptoglobin respond rapidly and achieve sustained levels following systemic infl ammation in rat, while serum amyloid A and serum amyloid P are better indicators in mouse. Since the underlying mechanisms of induction are similar for these proteins, they typically demonstrate good pre-clinical to clinical translatability, making them useful tools in the drug discovery setting when screening for compounds with better safety profi les or when measuring effi cacy in disease models.The objective of this study was to verify whether assay modifi cations made to an automated, human application of A2M (Dako) could be used to measure the acute phase protein (A2M) in rats with results comparable to a non-automated, rat-specifi c ELISA platform. The ultimate goal was to transfer the rat assay to the Siemens Advia 1800 and take advantage of the high throughput, rapid turnaround time, and ease-of-use of the automated platform. Modifi cations of the clinical A2M application included altering the dilution of the polyclonal antibody in the Dako reagent. Increasing the concentration of A2M antibody increased the binding capacity of the assay, thus imparting improved sensitivity to the rat platform. Also pivotal to the rat A2M method development was manipulation of the Advia 1800 to create a 6-point standard curve (0.00-11.00g/L) from a single standard, Life Diagnostic’s Rat A2M calibrator (1.33g/L). To correlate the automated method with the ELISA assay, experimental rat serum samples containing varying levels of A2M were generated. Briefl y, Lewis rats were immunized with 2.25 mg of Mycobacterium butyricum emulsifi ed in incomplete Freund’s adjuvant to induce adjuvant induced arthritis. Animals were divided into treatment groups which included a therapeutic known to inhibit infl ammation. Serum A2M was analyzed using both the rat-specifi c ELISA (Life Diagnostics, cat #2810-2) and the Advia 1800 automated platform. Correlation between the two platforms was acceptable (Deming slope, 1.889; regular slope, 1.868) and A2M measurements from both assays correlated with the degree of infl ammation observed for each group. Mean Advia assay values for the treatment groups were 3.29g/L (vehicle controls), 2.80g/L (low dose), 1.07g/L (high dose) and <0.3g/L (naïve animals). Precision (0.56g/L CV=2.7%, 3.55g/L CV=0.8%. 9.28g/L CV=0.6%) and linearity (0.26g/L-11.16g/L) successfully passed internal validation criteria. In summary, based on validation and correlation results, the automated Advia 1800 platform was deployed for analysis of rat serum A2M. Similar approaches will be followed for other species-specifi c APP.
B-02
Rat Lipid Comparison with Beckman DXC and AU Reagents
B. Robeson1, A. Khajuria1, B. Scheibe1, A. Petersen1, F. Moore2, A. Lobner2, K. Whipple2. 1Marshfi eld Labs/Marshfi eld Clinic, Marshfi eld, WI, 2Marshfi eld Veterinary Labs/Marshfi eld Clinic, Marshfi eld, WI
Background: Our reference laboratory currently performs several assays for our veterinary division. With the purchase of new instrumentation by our veterinary laboratory, it was determined more vet testing should be moved to that location. One such panel we currently perform is the rat lipid panel. We undertook this study to determine if the results were comparable across our Beckman Synchron analyzers and our veterinary labs new Beckman AU analyzers.Methods: Sixty rat serum samples were analyzed on Beckman Coulter UniCel® DxC 800 (DXC) and Beckman Coulter AU5800 (AU) analyzers for the following assays: Cholesterol, HDL, Triglycerides, LDL, calculated LDL [CHOL - HDL - (TRIG/5)].
Beckman instrument specifi c calibrators and reagents were used for all assays. We also analyzed all samples on the DXC for HDL following Mg/Dextran Sulfate (Mg/DS) precipitation (Pointe Scientifi c, cat.#H7507-25), with subsequent Cholesterol analysis. Triglyceride testing with the DXC assay utilized Glycerol Blanking, the AU did not. All results are in mg/dL.Results: The following statistics were achieved for AU(y) versus DXC(x). Linear regression was determined using Passing Bablock statistics. The majority of calculated LDL Cholesterols gave negative values using the standard human based calculation and were determined not useful for rat lipid testing.
Rat Lipid Comparison Summary Dataanalyte method average std.dev. bias %bias linear regress. r2CHOL AU(y) 71.0 10.5 14.6 22.5 1.62x - 20.4 0.80
DXC(x) 56.4 6.6TRIG AU(y) 204.0 81.2 8.2 7.5 0.90x + 28.2 0.98
DXC(x) 195.8 89.5LDL AU(y) 14.5 3.3 -0.4 -3.2 1.10x - 1.7 0.92
DXC(x) 14.9 3.0HDL AU(y) 35.3 4.1 -13.4 -31.7 0.64x + 4.5 0.78
DXC(x) 48.8 6.3HDL AU(y) 35.3 4.1 1.8 6.0 0.70x + 12.2 0.53
DXC(y) 48.8 6.3 15.2 37.5 1.11x + 11.7 0.78Mg/DS(x) 33.5 5.7
cLDL AU -5.2 18.8DXC -31.5 16.3
Conclusion: Assays on each analyzer utilize different reagents, parameters, and measuring systems which create signifi cant differences in results. Of particular note is the CHOL and HDL biases, which are in opposite directions and of approximately the same magnitude. LDL had the best comparability with regards to overall means, sd, bias, and linear regression analysis. Beckman’s AU HDL assay had better agreement with the Magnesium/Dextran Sulfate HDL precipitation assay, showing similar means of 33.5 and 35.3, however it did have signifi cant proportional and constant bias. Based on our study data, we determined rat lipid results obtained from Beckman DXC and AU platforms are not comparable.
B-03
Validation of an Automated Cystatin C Assay in Canine Serum, Plasma and Urine to Support Pre-Clinical Toxicology Studies
S. E. Wildeboer, R. P. Giovanelli, J. H. Bock, W. J. Reagan. Pfi zer Global Research and Development, Groton, CT
Background: Cystain C is a cysteine proteinase inhibitor formed at a constant rate and freely fi ltered by the healthy kidney, making it a desirable biomarker of renal function. Serum, plasma and urine concentrations of Cystatin C are dependent on the glomerular fi ltration rate (GFR) and a reduction in GFR causes a rise in the concentration of Cystatin C. Unlike creatinine, Cystain C has not been shown to be affected by factors such as muscle mass, age or nutrition. In addition, a rise in creatinine does not become evident until the GFR has fallen by approximately 50%, whereas Cystatin C is a more sensitive marker of kidney dysfunction. Here, we validated an automated human Cystatin C assay for use in pre-clinical canine studies.Methods: The DakoCytomation Cystatin C immunoparticles (LX002) is a purifi ed immunoglobulin fraction of rabbit antiserum directed against Cystatin C covalently coupled to uniform polystyrene particles. Immunoparticles are mixed with sample and a reaction buffer (S2361) and measured by turbidity on the Siemens Advia 1800 analyzer. Cystatin C concentration is extrapolated from a standard curve generated using DakoCytomation Cystatin C calibrator (X0974). DakoCytomation Cystatin C quality control (X0973) along with colony canine serum, sodium heparin plasma, EDTA plasma and urine with no additives were tested. Serum, plasma, and urine samples with varying levels of Cystatin C were created using Cystatin C canine E. Coli recombinant protein (BioVendor LLC, RD472009100) to test the dynamic range of the assay.Results: Limit of Blank was established by analyzing 10 replicates of 0.9% NaCl (w/v) diluent down to 0.1 mg/L. The lower limit of quantitation was verifi ed with canine urine performed in duplicate for 10 days at 0.3 mg/L, with an acceptable %CV of 16.2. Intra-assay precision was performed with 20 replicates of spiked (recombinant) sample and % CV was ≤ 5.6 for canine serum, plasma and urine. Acceptable inter-assay precision was established with three levels of quality control, all values falling within ± 2SD and %CV ≤ 5.9, similar to results obtained for intra-assay precision. Spiked recovery was established using each sample matrix spiked with 10% calibrator material, and all results were within 20% of the expected value. Sample frozen (-80°C) stability was performed on sample pools spiked with recombinant Cystatin C protein, at low, mid and high values within the assay calibration curve. Serum and plasma samples were considered stable out to 6 months and for three freeze-thaw cycles. The urine pools showed increased variability, and it was concluded that the recombinant

Animal Clinical Chemistry Tuesday, July 30, 9:30 am – 5:00 pm
CLINICAL CHEMISTRY, Vol. 59, No. 10, Supplement, 2013 A171
protein that was spiked in the urine matrix was contributing to the variability seen. To further test urine stability, all timepoints and freeze-thaw cycles were repeated with urine samples spiked with calibrator (10%). Follow-up testing confi rmed stability out to 3 months and three freeze-thaw cycles.Conclusion: The DakoCytomation Cystatin C assay met all outlined criteria for validation and is appropriate for use in canine serum, plasma and urine samples to support pre-clinical toxicology studies.
B-04
Optimization, Validation, and Implementation of Hematology Automation in a Multispecies Clinical Pathology Laboratory
S. E. Wildeboer, A. G. Bull, J. E. Graves, C. Phanthalansy, R. P. Giovanelli.
Pfi zer Global Research and Development, Groton, CT
Background: Hematology sample processing often requires time consuming preparation and handling of samples. In order to improve laboratory effi ciency, we validated two automation platforms, an automated slide maker and stainer and cell imaging and pre-classifi cation software in our multispecies laboratory. We selected the Sysmex SP-1000iTM automated slide preparation unit and CellaVisionTM DM96 automated cell imaging instrumentation based on predetermined requirements.Methods: The Sysmex SP-1000i was optimized for canine, non-human primate and rat peripheral blood smear preparation and staining using a May Grünwald-Geimsa stain after evaluation of multiple stain options. 10 samples per species were prepared and manual differentials were compared to automated results and an overall morphology review to ensure proper cell staining. Stain quality for additional species was evaluated including rabbits, mice, felines, cattle, and pigs to complete the validation of the instrument. To validate the CellaVision DM 96, stained smears were imaged from 100 slides of varying species including human, canine, non-human primate, mouse, rat and feline. Manual differential and morphology was performed microscopically and compared to those performed using the CellaVision software for correlation. Effort and use metrics were collected for a period of 3 months during the evaluation period to estimate time savings and project impact.Results: Optimization of the Sysmex SP-1000i allowed conservation of both slide angle and stain timing for all smears. The May Grünwald-Giemsa stain produced the most consistent stain quality and best cell identifi cation features across all species evaluated. Once implemented, the automation of the slide preparation process saved our laboratory 80 FTE hours per year. With the consistency gains obtained using the slide preparation and staining from the Sysmex SP-1000i, we acquired a CellaVision DM96 automated cell imaging unit. Differential and morphology review using the CellaVision software was consistent with microscopic review. Implementation of the cell imaging and review process reduced our overall result turnaround time. Additional identifi ed benefi ts gained with the implementation of cell imaging software include interfacing with our LIS, creation of reference databases, archival of cellular images, easy pathologist review, and implementation of a comprehensive cell morphology competency program.Conclusion: The incorporation of automated slide preparation, staining and cellular identifi cation allowed recognized effi ciency gains in our Clinical Pathology laboratory. By streamlining the peripheral blood smear process, we were able to consistently make peripheral blood smears which enabled the use of cellular identifi cation methodology to be incorporated. As a result of the implementation of hematology automation, we found a signifi cant reduction in time spent in the production and review of peripheral blood smears.
B-05
Determination of total serum cholesterol, HDL-C, and LDL-C in sera from humans and laboratory animals using 3 reagent systems and FPLC
N. Everds1, M. Zhou2, L. Ross3, S. Z. Ratia2, P. Fordstrom2, J. F. Schroeder3, A. D. Aulbach4. 1Amgen, Inc., Seattle, WA, 2Amgen, Inc., South San Francisco, CA, 3Amgen, Inc., Thousand Oaks, CA, 4MPI Research, Mattawan, MI
Background: This study evaluated the performance of Roche and Beckman-Coulter (B-C) clinical chemistry instruments and reagents for the determination of total serum cholesterol (TCHOL) and high-density and low-density lipoprotein cholesterol fractions (HDL-C and LDL-C) for humans and 5 laboratory animal species.
Methods: 10 serum samples from each species were prepared from whole blood collected under fasted conditions. For human, cynomolgus monkey, rabbit, rat, and hamsters, each tube was from an individual subject. For mice, each tube contained serum pooled from multiple animals. Aliquots were prepared from each of the 10 serum tubes/species, and frozen until analyzed. Aliquots were analyzed for TCHOL, HDL-C, and LDL-C using Roche or B-C instruments (Cobas Integra 400 and Olympus AU 400, 640, or 2700, respectively) and reagents as follows: TCHOL: Roche and B-C enzymatic assays; HDL-C: Roche dextran-based assay, Olympus detergent and antibody based assays; LDL: Roche cyclodextrin-based and B-C detergent-based assays. Aliquots were also fractionated by fast protein liquid chromatography (FPLC), from which HDL-C and LDL-C were calculated by determining TCHOL concentrations in each fraction using Roche reagents.Results: Results for TCHOL measured by Roche and B-C reagents were concordant for all species. Results for HDL-C measured by Roche reagents and HDL-C measured by B-C antibody-based reagents were also concordant for all species. However, results for HDL-C measured by B-C detergent-based reagents were concordant with Roche and B-C antibody-based reagents only for human, cynomolgus monkeys, rabbits, and hamsters. For rats and mice, HDL-C concentrations measured by B-C detergent based reagents were lower than those measured with the other 2 HDL-C assay systems. HDL-C concentration estimated by FPLC was similar to measurements using the Roche and B-C antibody based reagents for all species except rats and hamsters, which had higher HDL-C measured by FPLC. LDL-C particles for these two species do not elute separately from HDL-C particles, likely resulting in this overestimation by FPLC. LDL-C concentrations measured by Roche reagents and B-C detergent-based reagents were concordant for human, cynomolgus monkey, rabbit, and hamster, but not rats and mice. LDL-C concentrations for rats and mice were lower using the B-C detergent based assay compared to Roche reagents. Similarly, the sum of HDL-C plus LDL-C measured with B-C reagents was concordant with TCHOL for human, cynomolgus monkey, rabbit, and hamster, but lower than the TCHOL for rats and mice.Conclusion: Based on these results, Roche and B-C TCHOL reagents are appropriate for all species. HDL-C Roche and B-C antibody- and detergent-based reagents are appropriate for human, cynomolgus monkeys, rabbits, and hamsters. For mice and rats, HDL-C and LDL-C concentrations are underestimated by B-C detergent-based reagents. Taken together, the results suggest that Roche Diagnostics HDL-C and LDL-C reagents generate the most accurate results across the species evaluated. In animal research, the use of species-appropriate cholesterol assays is necessary for the generation of accurate data.
B-06
Development of immunoassays for quantifi cation of NT-proBNP in canine blood.
K. R. Seferian1, N. N. Tamm1, S. V. Kozlovsky1, F. N. Rozov1, V. K. Illarionova2, D. M. Filimonova3, A. N. Kara4, E. V. Beketova4, A. G. Katrukha1. 1HyTest LTD, Turku, Finland, 2Veterinary clinic “Biocontrol”, Blokhin Cancer Research Center, Moscow, Russian Federation, 3Veterinary Center “Zoovet”, Moscow, Russian Federation, 4Department of Biochemistry, School of Biology, Moscow State University, Moscow, Russian Federation
Background: B-type Natriuretic Peptide (BNP) is a cardiac hormone produced by myocardium in response to volume overload and increased fi lling pressure. Active BNP hormone is produced along with the N-terminal fragment NT-proBNP from a precursor molecule proBNP by the proteolytic cleavage. Both BNP and NT-proBNP are known to be powerful biomarkers of heart failure in humans. During the past 5 years species-specifi c NT-proBNP assays were also used to diagnose heart disease in veterinary. Rapid and accurate NT-proBNP measurements are essential for timely initiation of treatment. Thus, new generation of sensitive, precise and rapid canine NT-proBNP (cNT-proBNP) assays can contribute to better clinical outcomes in veterinary patients. Methods: A panel of monoclonal antibodies (MAbs) specifi c to cNT-proBNP was developed. Epitope specifi city of 65 newly raised MAbs was established with the help of synthetic peptides corresponding to different regions of cNT-proBNP. Antibody epitopes were distributed throughout cNT-proBNP molecule with the exception of fragments 1-13 and 50-64 amino acid residues. Regions 1-13 and 50-64 were not immunogenic; no antibodies were isolated when selected against these fragments. DELFIA technology (Dissociation-Enhanced Lanthanide Fluorescent Immunoassay) was used for development of two-site immunoassays. MAbs were tested as capture and detection antibodies in such assays. Detection MAbs were labeled with stable

Tuesday, July 30, 9:30 am – 5:00 pm Animal Clinical Chemistry
A172 CLINICAL CHEMISTRY, Vol. 59, No. 10, Supplement, 2013
europium chelate. Recombinant canine NT-proBNP expressed in E. coli (HyTest, Finland) was used as a calibrator in assays. EDTA plasma from dogs with heart disease was used as a source of endogenous cNT-proBNP.Results: Recent studies of human NT-proBNP revealed that the central region of NT-proBNP (28-60 amino acid residues) is hardly available for antibodies due to O-glycosylation. We found that, in contrast to human NT-proBNP, all regions of cNT-proBNP were accessible for antibodies (excluding regions 1-13 and 50-64 that were not examined). Among all tested combinations, fi fteen two-site MAb combinations demonstrated thehighest signal level with canine plasma samples and recombinant cNT-proBNP. Five combinations were selected for further evaluations (CaNT611 13-33-CaNT19 40-50, CaNT90 29-50-CaNT89 13-26, CaNT73 13-26
-CaNT46 40-50, CaNT73 13-26 -CaNT59 64-72, and CaNT53 64-80-CaNT930 13-26). The detection limit of these assays was 0.2 ng/mL or lower that was suffi cient for determination of cNT-proBNP concentration in healthy dogs. Assays had a linear range of 0.2-50 ng/mL. Wide linear range enabled toavoid a dilution step when testing plasma specimens with high cNT-proBNP concentrations. Kinetic studies revealed that selected MAb combinations could be used for the development of rapid (20 minutes) quantitative immunoassays. Preliminary clinical studies showed that selected assays were able to differentiate healthy dogs and dogs with cardiac disease.Conclusion: Several combinations of MAbs specifi c to different epitopes of cNT-proBNP were selected and utilized for development of rapid andsensitive immunoassays for measurement of cNT-proBNP in plasma samples.
B-07
The effects of N-acetylcysteine and ozone therapy on oxidative stress and infl ammation in acetaminophen-induced nephrotoxicity model
F. Ucar1, M. Y. Taslıpınar1, B. F. Alp2, I. Aydın3, F. N. Aydın3, M. Agıllı3, M. Toygar4, E. Ozkan5, E. Macit6, M. Oztosun7, T. Caycı3, A. Ozcan8. 1Diskapi Yildirim Beyazit Training and Research Hospital, Department of Clinical Biochemistry, Ankara, Turkey, 2Gulhane Military Medical Academy,Department of Urology, Ankara, Turkey, 3Gulhane Military Medical Academy, Department of Clinical Biochemistry, Ankara, Turkey, 4Gulhane Military Medical Academy, Department of Forensic Medicine, Ankara, Turkey, 5Ankara Occupational Diseases Hospital,Department of Clinical Biochemistry, Ankara, Turkey, 6Gulhane Military Medical Academy, Department of Pharmacology, Ankara, Turkey, 7Turkish Armed Forces, Health Services Command, Ankara, Turkey, 8Gulhane Military Medical Academy, Department of Pathology, Ankara, Turkey
Backgrounds:Acetaminophen (APAP) is an analgesic and antipyretic agent. In overdoses, it is associated with nephrotoxicity. It is important to improve new treatment approaches against APAP-induced nephrotoxicity. We examined the potential protective effects of N-Acetylcysteine (NAC) and NAC+ozone therapy (OT) combination against APAP-induced nephrotoxicity.Methods: Thirty-two male Sprague-Dawley rats were divided into four groups; sham, control (APAP treated only), NAC (APAP+NAC therapy) and NAC+OT (APAP+NAC+ozone therapy). In the APAP, NAC and NAC+OT groups, renal injury was induced by oral administration of 1 g/kg APAP. The NAC group received NAC (100 mg/kg/day). NAC+OT group received NAC (100 mg/kg/day) and ozone/oxygen mixture (0.7 mg/kg/day) intraperitoneally for fi ve days immediately after APAP administration. All animals were killed at 5 days after APAP administration. Renal tissues and blood samples were obtained for biochemical and histopathological analyses. Neopterin, tumor necrosis factor-α (TNF-α), interleukin (IL)-6 and IL-10 levels were measured in sera. Malondialdehyde (MDA) levels and glutathione peroxidase (GPx) activities were determined in renal homogenates.Results: NAC and NAC+OT signifi cantly decreased MDA and TNF-α levels, increased IL-10 levels and GPx activities. Serum neopterin and IL-6 levels were not different among all groups. APAP administration caused tubular necrosis in the renal. The degrees of renal necrosis of the APAP group were higher than the other groups. Renal injury in rats treated with combination of NAC and OT were found signifi cantly less than the other groups.Conclusions: Our results showed that the combination of NAC and OT prevented renal injury in rats and reduced infl ammation. These fi ndings suggest that combination of NAC and OT might improve renal damages due to both oxidative stress and infl ammation.
B-09
New Sensitive Anti-Müllerian Hormone (AMH) ELISA’s for Non-Human Primate, Rodent, Equine, Bovine, Canine and Other Species.
A. Kumar, B. Kalra, A. S. Patel, S. Shah. Ansh Labs, Webster, TX,
Objective: Development of specifi c and sensitive ELISA’s to quantify AMH in sera of different species.Relevance: Anti-Müllerian hormone (AMH) is a 140-kDa dimeric glycoprotein hormone belonging to the transforming growth factor-β (TGF-β) superfamily. Cleavage at the monobasic site generates 110-kDa N-terminal and 25-kDa C-terminal homodimers, which remain associated in a noncovalent complex. Recent studies have shown that the AMH C-terminal homodimer is much less active than the non-covalent complex, but almost full activity can be restored by associating the N-terminal pro-region, which re-forms a complex with the mature C-terminal dimer. The fi nding suggests that the AMH non-covalent complex is the active form of protein.Methods: We have developed two-step, sandwich-type enzymatic microplate assays to measure species specifi c AMH levels in small samples sizes from 10-50 μL of sera in less than 3.5 hours. Equine, bovine, rat, non-human primate assays utilize species specifi c AMH calibrators. The monoclonal antibody pairs used in the above AMH assays bind to the non-covalent AMH complex and do not detect other related members of TGF-β superfamily.Validation: Ansh Labs Rat/Mouse and Equine/Canine AMH ELISAs showed excellent clinical concordance between ovariectomized versus cycling rats, spayed and intact female dogs, castrated and intact male dogs, geldings, stallions, mare sera and granulosa cell tumor (GCT) cyst fl uid, respectively. The Rat/Mouse AMH ELISA also detects Golden and Siberian hamsters. Ultra-sensitive AMH ELISA detected AMH concentrations in the range of 0.1-12 ng/mL in Rhesus, Cynomolgus, Vervet, and Squirrel monkey sera. The enhanced specifi city and analytical sensitivity (0.011 ng/mL) of the Bovine AMH ELISA resulted in greater than 90% detection rate in various dairy and beef cattle breeds. Imprecision calculated on three pooled sera over twenty-four replicates was 2.92% at 0.61 ng/mL, 2.54% at 1.26 ng/mL and 3.65% at 2.56 ng/mL. Dilution and spiking studies confi rmed accuracy of AMH measurement and showed average recoveries between 90-110% for all assays.Conclusions: Specifi c, sensitive and reproducible AMH assays have been developed for the measurement of AMH in non-human primate, rodents, equine, bovine, canine and other species. The performance of these assays is ideal for investigation into the physiologic roles of AMH in different species.
Management Tuesday, July 30, 9:30 am – 5:00 pm
CLINICAL CHEMISTRY, Vol. 59, No. 10, Supplement, 2013 A173
Wednesday, July 31, 2013
Poster Session: 9:30 AM - 5:00 PM
Management
B-10
Review of ordering practices for procalcitonin from a critical care unit
J. P. Casey, L. J. McCloskey, D. F. Stickle. Jefferson University Hospitals, Philadelphia, PA
Background: Literature arguably supports a role for monitoring of procalcitonin (PCT) during sepsis to guide timing of cessation of antibiotics therapy. At our institution, PCT was brought in-house in February 2012 for this purpose at the request of a critical care unit (CCU). Because of large costs of PCT testing, we reviewed CCU ordering practices to assess effi ciency of PCT utilization relative to this intent. In particular, we examined ordering intervals relative to the minimum required to meet intended cutoffs for absolute and relative changes in PCT.Methods: CCU PCT results (Biomerieux Vidas Brahms assay) for an 8 month period (Feb-Sep 2012) were retrieved from electronic records. Excel spreadsheet software was used to assess counts, time intervals and differences between serial measurements. A review of literature indicated that the least restrictive cutoffs used to begin consideration of cessation of antibiotic therapy were either crossing to <0.5 ng/mL (5x upper limit of normal), or crossing to <35% of initial value. Given the physiological half-life of PCT (t1/2 = 24h), we compared intervals between serial measurements to the minimum t1/2-predicted interval needed to meet either of these two cutoff criteria.Results: Primary data were 202 measurements from among 54 CCU patients. The median for fi rst-or-only PCT among all patients was 2.4 ng/mL (range: <0.1-105 ng/mL; reference range: <0.1 ng/mL). 24 patients (44%) had only 1 PCT measurement; 30 patients (56%) had serial PCT comprised of 2 or more specimens across time (range: 2-18). Among serial measurement patients, only 70% were receiving antibiotic therapy at the time of the fi rst measurement. Serial measurements were over periods ranging from 0.6-63 days (median: 8.8 days). There were a total of 148 two-sample sequences of serial measurements; 75% showed decreasing PCT. Intervals between measurements progressed primarily by 1-day intervals (<1.5 day: 65%, 1.5-2.5 days: 12%; 2.5-3.5-days: 7%, >=3.5-days: 16%). Decreases between fi rst and second measurements were essentially bounded (96%) by the maximum decrease predicted a priori from PCT t1/2. Among all measurement pairs, 78% (n=116) had fi rst measurements that were greater than the action threshold of 0.5 ng/mL; among these, 74% (n=86) had measurement intervals less than that calculated, based on t1/2, to be the very least amount of time necessary for PCT to decrease to that threshold. For initial values of PCT >0.5 ng/mL (n=116), 65% of measurement pairs (n=75) had intervals that were too short to possibly meet criteria of either a decrease to <0.5 ng/mL or a decrease to <35% of initial value. Overall, then, at least 75 measurements (37%) from among the 202 measurements in the primary dataset were unwarranted with respect to even the least restrictive criteria that could be applied to PCT measurement intervals.Conclusions: Retrospective analysis of PCT orders indicated that ordering intervals were unconservative (>37% unwarranted orders) with respect to the intent of monitoring. In an era of intense focus on overutilization of expensive testing, these data form a strong starting point for discussion with clinicians regarding establishment of fi xed PCT ordering guidelines and/or restrictions.
B-11
A Prospective Tool For Risk Assessment of Send-Out Testing
B. Cole1, J. A. Dickerson1, M. Graber2, C. R. Fantz3, M. Laposata4, M. L. Astion1, P. Epner5. 1Seattle Children’s Hospital, Seattle, WA, 2RTI International, Chapel Hill, NC, 3Emory University, Atlanta, GA, 4Vanderbilt University, Nashville, TN, 5LLC, Evanston, IL
Background: Diagnostic erros in laboratory testing can cause signifi cant patient harm. These errors occur throughout the testing process, from pre-analytic errors in test ordering to post-analytic errors in retrieving and interpreting results. Send-out testing to referral laboratories is particularly risk-prone due to multiple hand-offs, longer turn around times, unfamiliarity with low volume tests, and manual result
entry. Many currently available tools for risk assessment focus on retrospective root cause analysis. Our goal was to develop and pilot a prospective risk self-assessment tool with the ability to highlight specifi c areas of potential risk associated with referral lab testing.Methods: Faculty from three academic hospitals partnered with RTI International to develop a 52 item self-assessment tool, called the Referral Laboratory Testing Process Risk Analysis Tool. This tool was intended to be used at separate sites by laboratory personnel involved in sending out referral lab tests. The 52 items covered seven categories: general, test selection, specimen processing, test utilization management, results reporting, results retrieval, and quality measures. Test utilization management referred to methods used to improve the likelihood that the appropriate test was ordered. The answers were color coded with red indicating problem areas, yellow indicating possible problems, and green indicating lower risk. The result of the assessment is a heat map displaying areas with greatest risk as clusters of red and yellow. The tool was edited iteratively after testing at three sites, and the refi ned tool was administered at 9 de novo sites along with a follow-up usability survey.Results: Nine separate sites were recruited to complete and evaluate the risk self-assessment tool. These sites ranged from county hospitals, to large academic medical centers, to reference laboratories, all of which result more than 500,000 tests annually. Of the 52 questions, only 6 were given a single rating by all 9 sites, 20 questions had two of the three color ratings, and 26 questions had all three colors included in the results. One demographic item was not color coded. The areas of most risk, where four or more sites rated red, included test utilization management, non-interfaced orders or results, and lack of quality measures. Results from the usability survey indicated that all participants agreed that the tool was educational and useful. Informal discussions indicated that the tool could be completed by groups of laboratory personnel in less than an hour.Conclusion: This prospective risk self-assessment tool is a novel instrument developed to evaluate risk of diagnostic errors in laboratory send-out testing. Signifi cant diversity in question responses between our 9 respondents indicates that there is considerable variation in practices between individual sites. This tool has the potential to help hospital laboratories proactively identify areas to focus their error prevention efforts.
B-12
Patient identifi cation error: The detective in the Laboratory.
M. Salinas1, M. Lopez Garrigos1, R. Lillo1, M. Gutierrez1, J. Lugo1, A. Santo-Quiles1, C. Leiva-Salinas2. 1Hospital Universitario San Juan, San Juan, Spain, 2Hospital Universitario y Politécnico La Fe, Valencia, Spain
Background: The eradication of errors regarding patients´ identifi cation is one of the main goals for safety improvement. As clinical laboratory intervenes in 70% of clinical decisions, laboratory safety is crucial in patient safety. We studied the number of errors regarding demographic data registration in our Laboratory Information System (LIS) during one year period.Methods: The laboratory attends a variety of inpatients and outpatients, Hospital outpatients are phlebotomized without prior appointment. Their demographic data are registered in the LIS, when the patient presents to the front desk. Inpatients are phlebotomized in the ward and their samples are transported sequentially to the laboratory, early in the morning. Patients from several origins (SOP) are phlebotomized abroad and their samples are transported, sequentially along the whole morning. Usually, requests for outpatients from the primary care centers (PCP) are made electronically. A manual step is always done to conciliate the patient identifi cation number in the electronic request with the one in the LIS. Manual register is done through hospital information system demographic data capture when patient medical record number is manually registered in LIS. Laboratory report is always sent out electronically to the patient’s electronic medical record. Daily, every demographic data in LIS is manually compared to the request form to detect potential errors.Results:Fewer errors were committed when electronic order was used, followed by manual LIS register in hospital outpatients, inpatients, SOPs and manually registered PCPs. There was great error variability between PCPs when using the electronic order (Figure).Conclusion:LIS demographic data manual registration errors depended on patient origin and centers. Scarce errors were committed when register in front of the outpatient. Even when electronic order was used, errors were still detected, emphasizing the fact that the number of errors is still dependent on the personnel in charge of the technology.

Tuesday, July 30, 9:30 am – 5:00 pm Management
A174 CLINICAL CHEMISTRY, Vol. 59, No. 10, Supplement, 2013
B-14
Practical Applications of Sigma Metrics to Evaluate Assay Quality
J. Litten, J. Householder. Winchester Medical Center, Winchester, VA
Background: When evaluating new instrumentation, there are numerous issues to consider, i.e., reliability of the instrument(s), cost, turnaround times, test menu and vendor support. One important factor that is too often overlooked is assay quality. Quality measures such as accuracy and reproducibility impact physician decisions, which in turn can impact patient outcomes. Assay quality also impacts the laboratory. Bias and imprecision will affect the number of quality control rules required to effectively monitor an assay. This translates into time and cost and may also impact profi ciency testing.Objective: The goal of this study was twofold: 1) to use Sigma Metrics to predict the quality of clinical chemistry assays from multiple vendors and 2) assess the real-world Sigma performance of assays on the Abbott ARCHITECT c8000.Methods: Sigma Metrics were estimated for 30 chemistry tests across six different vendor instruments using the equation: Sigma Metric = (TEa - Biasobserved) / CVobserved. There are several sources of bias and imprecision data that can be used during the instrument assessment phase to help predict the Sigma performance. These include profi ciency testing results, information from the vendor, literature sources and Quality Control (QC) programs. In this study, data were obtained from the 2009 and 2010 College of American Pathologists (CAP) Profi ciency Surveys. Bio-Rad QC data were also used to help support fi ndings. Clinical Laboratory Improvement Amendments (CLIA)/CAP performance standards were used for the total allowable error. Since the total error may vary across the analytical range, the total error at the medical decisions level(s) was used to determine the Sigma Metric for each assay. One year after the ARCHITECT c8000 had been in operation, the laboratory QC data was used to generate real-world Sigma performance metrics.Results: Using CAP Profi ciency Survey data to estimate Sigma Metrics, 22 of 30 ARCHITECT assays (73%) had quality ratings of good to excellent (5 Sigma or better) compared to 59% for the next highest vendor. None of the 30 assays evaluated on the ARCHITECT were of unacceptable quality (less than 3 Sigma). All other vendors had at least one test in this category with most having 4 to 5 methods that were of unacceptable quality. Using laboratory QC data generated on the ARCHITECT, 97% of the chemistry assays were 5 Sigma or better; 77% were 6 Sigma and 20% were 5 Sigma. None were 4 Sigma and only one, CO2 , was 3 Sigma. There were no tests that were less than 3 Sigma. Every chemistry assay performed as good as estimated or better. Twenty-nine of the 30 assays require only a simple Westgard Rule with two levels of QC samples per run. Only CO2 requires multiple Westgard Rules to be run.Conclusion: Sigma Metrics can be used to predict the quality of an instrument’s assays. Sigma Metric analysis allows for easy comparison of instrument quality and can predict which tests will require minimal QC. The Abbott ARCHITECT chemistry instrument provides high quality results for over 96% of chemistry assays studied.
B-15
Driving Transformation Change in the Laboratory: Comparison of a Centralized and Non-centralized Laboratory System at a 1,500- bed University Hospital in Thailand.
P. Kitpoka, M. Kunakorn, S. Vanavanan, K. Khupusup, S. Wongwaisayawan. Pathology Department, Faculty of Medicine, Ramathibodi Hospital, Bangkok, Thailand
Objective:To study whether the ACCELERATOR Automatic Processing System (APS) can improve laboratory operational effi ciencies in terms of Turn Around Time (TAT) accomplishment, reduced process steps, less personnel and consumables usage reduction in a university hospital laboratory.Relevance: The ACCELERATOR APS is an innovative system that has ability to consolidate pre-analytic, analytic and post-analytic processes together in one platform.Methodology: One week data of TAT achievement percentage and consumables usage of 42 chemistry and immunology tests, as well as the waiting time from phlebotomy room, were obtained from laboratory information system; whereas, the working steps, and personnel requirements were obtained by workfl ow observation. Data and information from a new laboratory designed using centralization concept and having the ACCELERATOR APS installed were compared with those from the old laboratory, in which tests were separated into multiple analytical sections.Validation: TAT was measured from the time patients registered at the phlebotomy room until their results were released, consumables usage and waiting time from phlebotomy was analyzed using LIS data. Working steps and personnel requirement came from workfl ow observations inside the laboratory.Results:
Metrics Old Laboratory (Non-centralized)
New Laboratory (APS implemented) % Change
No. of CC/IA tests 46,728 54,993 17.7%% Achieved TAT goal 90.5% 96% 10.6%Working steps 30 9 -70.0%Personnel 12 4 -66.7%Drawing sample tube usage 6,418 6,313 -1.6%Barcode usage 6,418 6,313 -1.6%Aliquot tip usage 5,548 0 -5,548%Aliquot cup usage 5.548 0 -5,548%Average waiting time from phlebotomy room (mins) 15 4 -73.3%
Conclusion: Implementation of the ACCELERATOR APS was able to make the Hospital Laboratory more effi cient. By adopting LEAN principles, the laboratory reduced wasteful and unnecessary steps by combining pre-analytical, analytical and post-analytical processes together in one platform. The study showed that even though the new laboratory performed 17.7% more tests than the old laboratory, it still performed better and more effi ciently in all the key metrics:• % Achievement of TAT goal increased 10.6%• Working step, personnel, waiting time from phlebotomy room and drawing sample tube were reduced by 70%, 66.7%, 73.3% and 1.6% respectively• Furthermore, aliquot tip and cup are not required due to the nature of the consolidated platform which has a huge impact in terms of cost saving for laboratory.
B-16
Prevalence of Folic Acid Defi ciency in Hospital-Population after National Mandatory Folic Acid Fortifi cation Program in Canada
K. Sohn, T. Feltis. Trillium Health Partners, Mississauga, ON, Canada
Objective: Folate defi ciency causes macrocytosis and in pregnant woman fetal neural tube defects. Red blood cell (RBC) folate is better indicator of tissue folate storage than serum folate, which is variable depending on recent ingestion. After the national mandatory folate fortifi cation (FF) in Canada in November, 1998, folate levels below the lower reference limit (LRL) became very rare. In order to evaluate the utility of routine RBC and serum folate measurements, the prevalence of folate defi ciency in a hospital-population was compared before and after the national folic acidfortifi cation program.Methods: A retrospective cross-sectional observational study was done using the database of the Credit Valley Hospital (CVH) site of Trillium Health Partners, Mississauga, Ontario, Canada. RBC and serum folate results were collected from the laboratory information system for the period between 1994 and 2012. Folate was measured using Quantaphase® B12/Folate Radioassay kit (Bio-Rad Laboratories, Hercules, CA) during 1994 through 2002 and Vitros ECi® Folate assay kit (Ortho-

Management Tuesday, July 30, 9:30 am – 5:00 pm
CLINICAL CHEMISTRY, Vol. 59, No. 10, Supplement, 2013 A175
Clinical Diagnostics, Rochester, NY) during 2003 through 2012. Lower reference limits (LRL),275 nmol/L(Quantaphase® assay)and 320 nmol/L(Vitros ECi® assay) for RBC folate and 5 nmol/L (both assays) for serum folate, were used as the cut-off for defi ciency. Prevalences of folate defi ciency werecompared for the period before (1994–1998) and after (1999-2012) FF. Data were analyzed using Med-Calc® Software (Mariakerke, Belgium).Results: The prevalences of folate defi ciency in female for both RBC (6.33%, 95% CI, 4.39, 8.27) and serum (4.85%, 95% CI, 2.74, 6.97) before the FF were signifi cantly (P < 0.0001) decreased after FF to 0.31% (95% CI, 0.22, 0.39) for RBC and 0.38% (95% CI, 0.26, 0.50) for serum; in male for both RBC (3.63%, 95% CI,2.28, 4.97) and serum (6.85%, 95% CI, 3.74, 9.42) before the FF were signifi cantly (P < 0.0001) decreased after FF to 0.36% (95% CI, 0.23, 0.50) for RBC and 0.38% (95% CI, 0.26, 0.50) for serum. There was no difference in prevalence between female and male for all comparison. Overall, the prevalence of RBC folate defi ciency was signifi cantly decreased (P < 0.0001) from 4.84% [95% confi dence interval (CI), 3.70, 5.99] before the FF to 0.28% (95% CI, 0.23, 0.34) after the FF. The prevalence of serum folate defi ciency was also signifi cantly decreased (P < 0.0001) from 5.58% (95% CI, 3.87, 7.30) to 0.37% (95% CI, 0.28, 0.46).Conclusions: Considering the very low prevalence of folate defi ciency, routine testing of folate is not warranted except for severe malnutrition, malabsorption and otherwise unexplained macrocytosis. Prior to ordering, the indications for ordering this test should be thoroughly assessed in order to increase pre-test probability and reduce unnecessary testing.
B-17
Tighter biological variation precision target required for lactate testing in patients with lactic acidosis
G. S. Cembrowski1, A. Kunst1, M. Rimkus1, D. Chin1, S. Redel1, D. Tran2. 1University of Alberta Hospital, Edmonton, AB, Canada, 2University of Calgary, Calgary, AB, Canada
Background: Allowable analytical errors are generally based on biologic variation in normal, healthy subjects. Some analytes like blood lactate have low concentrations in healthy individuals and the resultant allowable variation is large when expressed as a coeffi cient of variation (CV). In Ricos’ compendium of biologic variation, the relative within individual lactate variation (sb) averages 27% and with the desirable lactate imprecision becomes 13.5%. We have used a unique methodology to derive biologic variability (sb) from consecutive patient data and demonstrate that sb of lactate is signifi cantly lower.Methods: A data repository provided all of the lactate results measured over a 1.5 year period in the General Systems Intensive Care Unit in University of Alberta Hospital in Edmonton. These measurements were made on either of two point of care Radiometer 800 blood gas systems operated by Respiratory Therapy. A total of 54,000 lactates were measured. We tabulated the pairs of intra-patient lactates that were separated by 0- 1, 1 to 2, 2 to 3, . . . up to 16 hr. The standard deviations of duplicates (SDD) of the paired lactates were calculated for each time interval. The graphs of SDD vs. time interval were approximately linear; the y intercept provided by the linear regression equation represents the sum of the biologic variation, sb and short term analytic variation (sa): y0=( sa
2 +sb2)1/2. The short term analytic variation (sa) was determined
from the short term imprecisions provided by Radiometer and confi rmed with onsite control analysis. The derivation of biologic variation was performed for multiple patient ranges of lactate.Results: The Table summarizes the biologic variations for lactate for various patient lactate ranges.Conclusion: The relative desirable lactate imprecision for patients with lactic acidosis is about half of that of normal individuals. As such, evaluations of lactate measurements must incorporate lower allowable error.
Range, MeanPatient lactates Lactate sa y0 sb sb (%)0 to 4 mmol/L 1.43 0.04 0.28 0.28 19.660 to 10 mmol/L 1.67 0.05 0.39 0.39 23.280 to 15 mmol/L 1.82 0.05 0.41 0.41 22.454 to 10 mmol/L 6.01 0.15 0.64 0.62 10.394 to 15 mmol/L 7.31 0.22 0.75 0.72 9.84
B-18
Establishing a Clinical Laboratory Quality Assurance System in Bhutan
R. -. Jamtsho. Jigme Dorji Wangchuk National Referral Hopital, Thimphu, Bhutan
Introduction: Quality Assurance (QA) plays a vital role in ensuring reliable results for patients. However, QA systems are not well established or effective in many developing countries due to various reasons [1]. A prior review of the laboratory system in Bhutan reported that these included the high cost of commercial quality control (QC) material; poor Internal Quality Control (IQC) system; shortage of laboratory expertise; erratic supply of reagents; and poor maintenance of laboratory equipments [2-4]. In order to address the problems of poor quality in the laboratories, the Ministry of Health in Bhutan collaborated with Pathologist Overseas, a non-profi t USA based organization, established a QA pilot program in Bhutan.Methods: Thirteen laboratories were selected for the pilot study. The QA team conducted extensive training on basic QA for the laboratory staff and initiated SOP development. The training was both on the bench and in didactic sessions. The QA team also distributed frozen IQC material provided by Pathologists Overseas. Similar brands of reagents and IQC material were used for testing in most laboratories, and standardization of equipments was also implemented. The impact of this training and implementation of the QA activities were monitored using EQA and IQC performance criteria as well as a 10-category Quality survey. The EQA and IQC results were monitored remotely with active feedback including monthly reports, phone calls, and visits by members of the QA team. Two rounds of survey were conducted on quality of laboratory services at the regional and district laboratories. The survey involve collecting data containing the mean, CV and the control range used during the last three months prior to the date of survey, so the two rounds represent 6 months of quality measurements.Results: Overall laboratory performance and quality assurance system showed improvement in the second round of survey. In the fi rst survey, the maximum score was 47% and minimum was 23%. The second survey showed dramatic improvement with maximum sore of 91% and minimum of 36%. The performance on IQC showed remarkable improvement following the establishment of IQC system. Unacceptable results in the fi rst survey ranged from 12% to 46% and in from 0% to 32% in the second round. The percentage results in peer range in the beginning of RCPA cycle ranged from 22% to 62% improved to 56% to 96% towards the last cycle.Discussion: The QA team with support from the Ministry of Health and Pathologist Overseas, made considerable progress in improving the quality of laboratory services in Bhutan. However, four laboratories out of 13 could not be improved probably due to poor equipment functioning and pipetting technique. We conclude that extending the system of strengthened IQC, EQA and instrument standardization; can further improve the quality of results generated by district laboratories in Bhutan.
B-19
QC Rules for Low Sigma Clinical Diagnostic Processes
C. A. Parvin, L. S. Kuchipudi, J. C. Yundt-Pacheco. Bio-Rad Laboratories, Hercules, CA
Objective: Traditional QC rules have poor error detection ability for low sigma processes even with a large number of QCs. We sought more powerful QC rules for low sigma processes.Relevance: QC rules with improved power characteristics for low sigma processes can reduce the risk of unreliable patient results.Methods: Recommended QC multi-rules for low sigma processes were compared to a new family of QC rules based on a Z2 statistic. A Z2 QC rule with N1 QCs and rejection limit L1 computes Z = (X - T)/SD for each QC result, where X = QC result, T = QC target value, and SD = QC standard deviation. The Z2 rule sums the N1 Z
2 values and rejects if the sum exceeds L1. A single repeat sample Z2 rule fi rst tests N1 QCs. If the sum of the N1 Z
2 values is <L1 the rule is accepted, otherwise a second sample of N2 QC results is evaluated. If the sum of the N1+N2 Z
2 values exceeds L2 the QC rule is rejected, otherwise the rule is accepted. Probabilities of false rejection, Pfr, and critical systematic error detection, Ped(SEc), were computed by simulation for the multi-rules and derived mathematically for the Z2 rules.Validation: Mathematically derived probabilities were validated by computer simulation.

Tuesday, July 30, 9:30 am – 5:00 pm Management
A176 CLINICAL CHEMISTRY, Vol. 59, No. 10, Supplement, 2013
Results: Let Sigma = 3 and SEc = 3 - 1.65 = 1.35.
Power of QC Rules for a 3.0 Sigma ProcessQC Rule N1 L1 N2 L2 NQ Pfr Ped(SEc)13s/22s/R4s/41s 4 - - - 4 0.03 0.3613s/2of32s/R4s/31s 6 - - - 6 0.08 0.63Z2(L1) 4 9.49 - - 4 0.05 0.56Z2(L1) 6 12.59 - - 6 0.05 0.69RZ2(L1,L2) 2 3.60 2 8.46 2.30 0.05 0.50RZ2(L1,L2) 2 2.80 4 11.32 2.97 0.05 0.60RZ2(L1,L2) 2 1.96 6 14.39 4.25 0.05 0.70RZ2(L1,L2) 4 4.89 6 17.36 5.78 0.05 0.80Conclusions: A single sample Z2 rule is more powerful than the multi-rules, but still has <70% chance of detecting SEc with 6 QCs and 5% false rejection rate. A single repeat sample Z2 rule can provide 50 - 80% power to detect SEc with Pfr = 0.05 and average number of QCs evaluated (NQ) ranging between 2.30 and 5.78. The family of Z2 QC rules provides superior error detection ability with fewer QC samples for low sigma processes.
B-20
Implementing Laboratory Quality Management Systems in Resource-limited Settings
P. Mateta1, K. McClure1, M. Mwasekaga2, C. Massambu3, V. Y. Mgaya3, G. Fine1. 1Clinical and Laboratory Standards Institute, Wayne, PA, 2Centers for Disease Control and Prevention, Dar es Salaam, Tanzania, United Republic of, 3Ministry of Health and Social Welfare, Dar es Salaam, Tanzania, United Republic of
Background: The vision of Clinical and Laboratory Standards Institute (CLSI) is to improve the quality of medical care throughout the world with the development and implementation of best practices in clinical and laboratory testing using a proven consensus-driven process that balances the viewpoints of industry, government and health care professions. CLSI’s Global Health Partnerships program works with health offi cials in more than 14 resource limited countries Africa, Asia and South America to establish standardized laboratory practices that enable labs to deliver the timely, accurate test results needed for rapid diagnosis and effective treatment of infectious diseases. Laboratory testing is an integral element in the clinical diagnosis, infectious disease surveillance, and the formulation of public health policy as related to disease. To ensure accurate diagnosis the laboratory must be able to produce high quality test results. Since 2005, CLSI has been working collaboratively with CDC Tanzania and the Tanzania Ministry of Health and Social Welfare (MOHSW) to improve the quality of laboratory testing in Tanzania. Through the synergies within the partnership, the team managed to build the basic foundation for improving quality at sixlaboratories. All the laboratories have developed and implemented quality manuals, standard operating procedures (SOPs), monitor the competency of staff, participate in external quality assurance programs (EQA), and conduct regular internal audits to check the performance of the quality systems.Methods: Tanzania’s MOHSW has partnered with CDC and CLSI to implement QMS in fi ve zonal hospital laboratories and the National Health Laboratory and Quality Assurance Training Center up to the level of international accreditation. Working with local and international partners, CLSI through its Global Health Partnerships, provide assessments; training; mentoring; self-assessments; continual improvement activities; and follow-up gap analysis to improve the operational quality of the laboratory. In addition, CLSI has shared documents that haveimplementation guides, or “tool kits,” which help laboratorians make improvements in their specifi c setting.Results: All six laboratories showed increased compliance to the ISO 15189 standard from the baseline gap analysis scores in 2007 and the last assessment in 2011: Lab A 23% to 88%, Lab B 15% to 77%, Lab C 28% to 68%, Lab D 33% to 73%, Lab E 43% to 72%, Lab F 56% to 80%. Improvements in implementing quality at the six laboratories has varied depending on the level of management commitment and involvement, staff adequacy, staff turnover, availability of resources, and consistent partner support. While all laboratories made signifi cant progress towards compliance with the requirements in the areas of policies, procedures, personnel, and facilities and safety all seemed to struggle with continual improvement requirements.Conclusion: Progress in implementing laboratory QMS requires management commitment, buy-in from all staff, staff adequacy, on-going mentoring, consistent follow-up, and availability of resources. With continued support and funding, it is anticipated that the six laboratories can achieve levels of high quality up to attaining accreditation aligned with the ISO 15189 standards by end of 2013.
B-21
Effectiveness enhancement of critical value communication by a computerized system
H. Ning, Y. Chang, P. Chang, S. Yo. Chang-Gung Memorial Hospital, Taoyuan Guaw-Shan, Taiwan
Background: Rapid and accurate transmission of critical values to the appropriate caregiver is an important phase of clinical laboratory testing process concerning to patient safety. The strategies focus on improvement of critical laboratory test results communication in Chang Gung Memorial Hospital, a 4000-bed university-affi liated hospital, and the effi cacies were monitored and reported herein. Methods: A self-developing computer critical notifi cation system was implemented in the inpatient setting since August 1 2006. When the critical results were verifi ed, this computerized system automatically sent the critical values alert on the display screens of computers in patient-specifi c ward. Failure to obtain the receiver log-in information within 15 minutes, the LIS system will indicated with red color coding. In this case, critical value communication is made by telephone and recorded in the LIS system. The computer system will stop to send a short text message to physician on call every one hour until the response were completed in the patient’s electronic medical records (EMR).Results:A total of 46928 critical values reported in 2012, representing 0.45% of reported results. Average of 96.6% of critical values received within 30 minutes in 2012. In Chang Gung Memorial Hospital, all critical values were communicated to caregivers. Form the 2012 EMR data, about 87% of physicians will act on the critical results, the other 13% will still wait for more information.Conclusion: Automated computerized communication improves the timeliness of notifi cation and saves a lot of workload. In order to reach the goal of patient safety, computerized communication is one of the best practices.
B-24
Improving turn-around-times for immunosuppressant drug monitoring at a university hospital through process optimization.
V. E. Barakauskas1, C. Wright2, T. B. Hammerstrom2, T. A. Bradshaw2, K. L. Johnson-Davis1, C. M. Lehman1. 1University of Utah, Department of
Pathology, Salt Lake City, UT, 2ARUP Laboratories, Salt Lake City, UT
Background: Immunosuppressant drugs (ISPs) are measured in patient blood to ensure effective drug dosing while minimizing toxicity. In the in-patient setting, accurate and timely results are needed each day to direct patient care. At our institution ISP monitoring is performed by liquid-chromatography tandem-mass spectrometry methods at a facility located approximately 1.5 miles away. Recent changes in physician-requested turn-around-time (TAT) posed challenges to the lab. This study sought to better characterize the existing process for collection, transport, analysis and reporting of in-patient ISP results, and to evaluate the effect of implementing process changes to improve TAT.Methods: Retrospective and prospective searches of the laboratory database were performed to obtain time-stamp data for samples submitted for ISP analysis from four in-patient units at the University of Utah hospital between August and December 2012, which included orders for tacrolimus and cyclosporin A concentrations (N=539). Date and time of sample collection, receipt in-lab, transit to reference lab, and result reporting were extracted from the LIS, as well as the type of collection (laboratory phlebotomist or fl oor nursing staff). Elapsed time between various steps was calculated and the distributions evaluated graphically. The number of samples reported by the desired time (2:00 pm) was determined for each day and week. A value stream map was constructed to summarize the major steps and times of the process. For samples that failed to meet the TAT goal, the most proximal cause of the delay was noted. Pareto charts were used to determine predominant cause(s) of TAT delays. The effect of implementing process changes was evaluated using a process control chart and re-evaluation by Pareto chart. Process changes included: identifi cation of specimen bags containing ISP samples, direct courier service between the two sites, dedicated laboratory staff to handle ISP samples, and re-optimizing ISP assay run schedule. Analyses were also stratifi ed by collection personnel (phlebotomist and fl oor nurse) and by TAT to determine which process characteristics impacted TAT the most. Summary statistics were generated using Microsoft Excel and data was plotted using GraphPad Prism.

Management Tuesday, July 30, 9:30 am – 5:00 pm
CLINICAL CHEMISTRY, Vol. 59, No. 10, Supplement, 2013 A177
Results: Seven weeks of data was used to determine baseline performance of the existing ISP process (N=272 samples), and indicated that only 25% of samples met the new TAT goal of 2 pm. Implementation of changes resulted in an increased number of samples meeting the TAT goal (N=235 samples; 80% reported by 2:00 pm over 8 weeks). Initially, the majority of delays were attributable to suboptimal analysis schedules (50%) and samples collected too late in the day (30%). After implementation of changes, special causes associated with TAT delays were dominated by late collections (50%) and delays in getting specimens to the lab (28%).Conclusions: Adjusting ISP collection and analysis processes improved the laboratory’s ability to meet physician-requested TAT of 2:00 pm each day. Process improvement efforts required involvement from two laboratory sites, transportation services, phlebotomy, pharmacy and nursing staff. To further improve TAT, efforts should focus on collection and transit time, which likely requires phlebotomist and nurse education.
B-26
Improving patient care through test-utilization strategies for NT-ProBNP ordering practices in the inpatient setting
E. Kaleta1, K. Scheele2, J. Patel2, A. Roy Hughes2, L. Pearson2, J. Hernandez2, C. Snozek2. 1Mayo Clinic, Rochester, MN, 2Mayo Clinic, Scottsdale, AZ
Background: In the environment of changing cost structure and a trend toward more conservative ordering strategies, particularly for Medicare patients with reimbursement based on capitation, test-utilization is gaining greater focus. This study concentrated on test-utilization and ordering practices of NT-ProBNP as a marker for congestive heart failure (CHF). Studies on the clinical utility of NT-ProBNP demonstrate that a single measurement is appropriate for identifying and staging patients with CHF, but signifi cant intra-individual variation limits the utility of serial measurements for monitoring trending of CHF. Literature reveals that a reference change value of >27% for day-to-day variability is required for a signifi cant decrease in NT-ProBNP concentration to show clinical improvement, and a >54%, for an increase to show clinical progression of CHF. This study assessed inpatient ordering practices of our institution to determine the frequency and appropriateness of NT-ProBNP orders; the results were used to guide clinical services toward appropriate test-utilization with evidence-based medicine.Objective: To assess the ordering practices of NT-ProBNP and guide test-utilization within the inpatient setting.Methods: Orders for NT-ProBNP and BNP at Mayo Clinic in Arizona (MCA) were extracted from the electronic medical record and entered into a test-utilization database. This database included all inpatient orders from 2011 and included area of admission, reason for hospital stay, length of stay, ordering physician, laboratory results and ordering date. This database was queried to determine the frequency of NT-ProBNP/BNP orders per hospital stay for each patient, stratifi ed by admission department and ordering physician to provide a report card of ordering habits to each hospital area. Ordering date was used to determine if the NT-ProBNP/BNP order was placed on a recurring (e.g., daily) basis. Of those patients for whom multiple NT-ProBNP/BNP tests were performed, an evaluation was done to assess whether a statistically signifi cant change in result was found, using literature values of >27% decrease or > 54% increase to indicate “appropriate” utilization.Results: In 2011, 2630 NT-ProBNP/BNP tests were performed, the majority of which were ordered by the Emergency Department (30.2%) and Hospital Internal Medicine (29.6%); the remaining 40% were divided amongst all other hospital areas. As anticipated, the reasons for ordering were predominantly dyspnea, CHF and pneumonia, followed by other pulmonary and cardiac concerns. Of the 644 tests that were placed on recurrent order sets, only 37.6% had clinically signifi cant changes. Of the 1617 tests ordered on the same patient more than once per hospital stay, including those on recurrent order sets, 48.3% had clinically signifi cant changes. Any test that did not have a signifi cant change, for this study, was deemed an “unnecessary” test, and using the list price of $163.00 for NT-ProBNP, resulted in $95,355.00 in over-ordered tests.Conclusion: Over-utilization of NT-ProBNP/BNP was recognized in the practice at MCA, likely resulting in loss of revenue due to lack of DRG reimbursement in the inpatient setting. This study evaluated the extent of this over-utilization, and provided evidence-based data to practicing physicians in high-use clinical areas to modify ordering strategies. This study serves as the model for future test-utilization studies within MCA.
B-29
Strategies to improve Clinical Laboratory outcomes: Ten year experience through Balanced Scorecard Management System.
M. Salinas1, M. Lopez Garrigos1, M. Gutierrez1, J. Lugo1, R. Lillo1, A. Santo-Quiles1, C. Leiva-Salinas2. 1Hospital Universitario San Juan, San Juan, Spain, 2Hospital Universitario y Politécnico La Fe, Valencia, Spain
Background: Balanced scorecard (BSC) is a management system conceived to give managers and executives of private business a more ‘balanced’ view of the organizational performance. The aim of the study was to show how designing strategies through the BSC use, might improve the performance of clinical laboratory.Methods: We established key performance indicators (KPIs) regarding each of the 3 BSC perspectives objectives: customer, internal business processes, and learning and growth of the members of the organization. Those were, respectively, the turn-around time (TAT) improvement for certain laboratory tests analysed in our personalized unit (PU), the maintenance or improvement of PU individualized attention and the number of work groups meetings and visits to the laboratory intranet. To check individualized attention in the PU, we measured the laboratory test modifi cations: tests added to the physician’s request, requested tests that were cancelled, or replaced by a more appropriate one. We set target objectives for each KPI and monitored those over ten years to check the strategies success.Results: The TAT KPIs improved dramatically after strategies implantation. The number of tests that were individualized in PU was maintained over time until primary care electronic order establishment in 2010. The number of work groups meetings to discuss about the laboratory organization and the number of visits to the laboratory intranet increased signifi cantly over the years (Figure). What still remains problematic was to measure the fi nancial consequences, the fourth BSC perspective. Hospital stay has shortened over time. It would be interesting to ascertain if a shorter laboratory TAT had a real contribution in a shorter hospital stay.Conclusions: Laboratory performance can be enhanced, through a KPI strategy using BSC as a management system. It keeps the organization’s members focused on strategy, aligned towards the same goal through the integration of the strategic process in the operation.

Tuesday, July 30, 9:30 am – 5:00 pm Management
A178 CLINICAL CHEMISTRY, Vol. 59, No. 10, Supplement, 2013
B-30
Continuous Improvements Decrease Cardiac Troponin Turnaround Time (TAT) to Meet Cardiac Critical Care Standards
L. Roquero, W. Kelly, J. Carey, J. Zajechowski, E. Herberholz, V. I. Luzzi, C. Feldkamp. Henry Ford Hospital, Detroit, MI
Background and Aim: To meet 2000 American College of Cardiology/American Hospital Association Guidelines for the management of patients in the Emergency Department (ED), our Core/STAT Laboratory continued practicing Lean techniques to achieve the new clinical target for Troponin I (TnI) TAT (reporting 90% of negative TnI results within 30 minutes of receipt in the laboratory). Prior pre-analytical and analytical improvements did not meet the new goal. We applied new technology for more effective communication and to maintain focus on these critical samples.Methods: Microsoft Access-based electronic pending log (ePending log) was used to track sample receipt-to-testing-to-report within the laboratory. A color monitor displays specimen status in three different colors: gray = samples in lab, yellow = TAT nearing target, and red = TAT exceeded. We compared within-lab TnI TAT (5 representative days) before and after implementation of ePending log. The target is to report >90% of negative (<0.2ng/mL) TnI results in <30 minutes and >95% of all TnI in <35 minutes. Results: Before introducing the ePending log, negative TnI daily results reported in <30 minutes were < 90% (75%, 82%, 65%, 78% and 81%) and < 95% of all ED TnI results were reported in <35 minutes (88%, 91%, 81%, 89% and 93%). After employing the ePending log, we approached the goal of reporting >90% of negative Tni results in <30 minutes (88%, 89%, 91%, 89% and 88%) and achieved greater than 95% of all ED TnI negative results reported in <35 minutes (95%, 90%, 92%, 96%, 95 %). Conclusion: Introduction of the ePending log, and continuing implementation of the PDCA cycle helped us achieve the new aggressive TnI TAT goals in support of cardiology guidelines.
B-33
Panic/critical values: Experiences from a large laboratory
A. L. de Aquino Daher, O. Fernandes, M. Tonetti, M. A. P. Junior, E. G. Labes. DASA, Sao Paulo, Brazil
Introduction: Panic/critical values are of paramount importance at the laboratory routine because they represent a high risk to the patient, and must be treated as high priority accordingly. Workers are trained for a faster response to these events in order to provide accurate and immediate treatment whenever necessary.Objective: This study aims to present our panic/critic values statistics, showing their distribution throughout the different departments of the laboratory, and specifi c tests.Method: A retrospective analysis to review the values considered to be of critic/panic in our Laboratory information system from August 2012 to January 2013, dividing them into three main areas of the laboratory: hematology, biochemistry, and microbiology. Other areas that do not present critical/panic values were not included here. The following table depicts the panic/critical values we took as reference in our laboratory, according to the areas mentioned above.
Valores de Pânico DASA
Biochemistry Hematology Microbiology LCR
Total Bilirubin
>20 mg/dL Hemoglobin < 6,0 g/dLBlood Culture
any sample Global count >4 μL
Total Calcium
<7,0 or >12,0mg/dL
Hematocrit < 8,5g/dL Agglutination test
Positive
Ionic Calcium
<3,5 or> 6,2 mg/dL
Platelets < 20.000 μL Bacterioscopy Positive
Phosphorus<1,0 or> 9,0 mg/dL
Neutrophils < 500/μL Fungi Positive
Glucose< 40 or> 400 mg/dL
Total Leukocytes< 500 or >400.000 μL
Potassium< 2,5 or > 6,5 mmol/dL
LMA M3 myelogram
Sodium< 120 or > 160 mmol/dL
Prothrombin time RNI
> 5,0
Partial thromboplastin time
R > 4,0
Fibrinogen < 100 mg/dL Blasts First sample
Result: Our laboratory performed a total of 61.071.219 tests from August to January , and 6.253 represented panic value results. The area of biochemistry was largely responsible for these results, with 54.92% (3,434), followed by hematology, with 44,09% of the total (2,756), and microbiology 0.99% (62). Regarding hematology testing, neutrophil counts were the most frequent panic value detected (46%, n=1,265), followed by INR measurements (31%, n=855) and platelet count (12%, n=335). As for biochemistry testing, potassium (38%, n=1310) was the most frequent one, followed by glucose (26,5%, n=912) and total calcium score (12,5%, n=427).Conclusion : We can conclude that only 0.010% of our outpatient examinations generate panic values , hematology was largely responsible for the numbers and costs related to urgently inform patients and physicians of the results, primarily regarding examining neutrophil counts. Therefore, reviewing these data enables us to better manage samples, optimizing the process with the doctors and consequently diminishing costs and waste in health systems.
B-34
Laboratory-initiated follow up of TSH values that are markedly elevated and where serial levels do not indicate appropriate response.
I. A. Hashim1, S. Hirany2, J. Ulloor1, S. S. Hathiramani1, M. J. McPhaul1. 1University of Texas Southwestern Medical Center, Dallas, TX, 2Parkland Memorial Hospital, Dallas, TX
Introduction: Availability as well as analytical performance of Thyroid Stimulating Hormone (TSH) assays is acceptable and meets expectation in most cases with the exception of some analytical interference. However, the role of the clinical laboratory is likely to expand beyond reporting results on the specimen received. Here we report our experience and outcome of a periodic notifi cation and follow up of TSH values that remain elevated or continue to increase.Methodology: A report of TSH values greater than 40 mIU/L and associated patients medical numbers is generated every two months. The report is sent to the respective physician for review and clinical follow up. Twelve months of data were used for the purpose of this study.Results: A total of 769 TSH values above 40 mIU/L belonging to 389 patients over a 12 months period were obtained. TSH values greater than 40 mIU/L represented 1.0% of all TSH samples analysed by our laboratory during the study period.TSH values above the selected threshold of 40 mIU/L were as high as 957 mIU/L with a median of 75 mIU/L. Only 41.1% of patients (n=160) had subsequent TSH measurements. Review of clinical charts indicated that replacement therapy had been prescribed to most. Of the patients with repeat TSH measurements, 64.4% had subsequent decline in TSH values over time suggesting therapeutic compliance and appropriate follow up with a mean percentage TSH decline of 36%. Few patients (n=5) representing 3.1 % of those with subsequent TSH samples showed no change in TSH value during the study period, whereas the remaining 32.5 % of patients (n=52) showed unabated increase in TSH values.Conclusion: The role of the laboratory is likely to extend beyond that of ensuring a timely and accurate reporting of a test result. In this report we describe an example of laboratory-initiated follow up of reported TSH results and active participation in continued patient care. Elevated TSH values that either did not decline to normal limits, remained elevated or continued to increase triggered follow up communication with appropriate physicians and may represent a noncompliant, high risk population.

Management Tuesday, July 30, 9:30 am – 5:00 pm
CLINICAL CHEMISTRY, Vol. 59, No. 10, Supplement, 2013 A179
B-35
Evaluation of Temperature Stability during Specimen Transport
M. J. Shashack, J. R. Petersen, A. O. Okorodudu. University of Texas Medical Branch, Galveston, TX
Background: Core testing laboratories are commonly utilized as a primary testing center for numerous satellite clinics. Proper specimen temperature must be maintained when transporting samples from satellite clinics. Pre-analytical variables including specimen transport have been reported to account for approximately 70% of diagnostic laboratory errors. The objective of the study is to evaluate transportation temperature as a variable in the pre-analytical phase of diagnostic service.Methods: The core testing facility in this study serves 80+ clinics where specimens are collected for transport via a net work of six courier routes. Each courier carries a minimum of one Igloo cooler for each temperature range [room temperature (17-28°C), refrigerated (2-8°C), and frozen (<-20°C)]. The coolers, containing appropriate coolants (ice pack or dry ice) are packed according to the core facility’s “Courier Packing and Transportation of Laboratory Specimens” policy. A Track-It Data Logger placed in the cooler recorded the temperature every three minutes during transit. Upon arrival at the core facility, the temperature was recorded using a Milwaukee Laser Temp Gun infrared thermometer and compared to the temperature recorded during transit. In an attempt to improve temperature stability during transport, a new policy with revised packaging requirements for amount of coolant was enacted during the study.Results: During the fi rst phase of the study, temperature during transport was monitored in all three transport conditions for 27 days. All coolers were in the correct temperature range on 10 of 27 (37%) days monitored. Fifty-six of 81 (69%) coolers monitored were in the acceptable temperature range during the study. Although 69% of all coolers monitored were in the acceptable range during transport, 96% of the coolers were identifi ed as in acceptable temperature range upon arrival to the core facility. The second phase of the study began after implementing a new policy, and temperature in all three transport conditions were monitored for 11 days. All coolers were in the correct temperature range on 3 of 11 (27%) days, with a total of 20 of 28 coolers (71%) in acceptable range.Conclusions: The results of this study demonstrate the need for review and standardization of specimen transport temperature requirements relative to impact on patient test results.
B-37
The Challenge of Implementing an Instrument Management Software in a Large Brazilian Laboratory
F. T. C. Sakamoto, R. C. Ferreira, L. G. Pereira, J. Okonski, C. F. A. Pereira. DASA, Barueri, Brazil
Background: The equipment management involves all the steps related to the placement of equipment in a laboratory routine, from installation to removal, and it is an important activity to support the laboratory operation.It is imperative that the equipment is in excellent working order and control, especially in a company with the size and representativeness of DASA, currently processing 200 million tests per year, with 10 central laboratories, over 150 hospital laboratories, 800 patient service centers and operations in 13 Brazilian States and the Federal District. The company has grown quickly, organically and through acquisitions, which resulted in different control processes and procedures of equipment maintenance and management. The company decided to implement an enterprise system to improve the equipment management, in search of better effi ciency and standardization of procedures.Objectives: To enumerate the main features and benefi ts of a robust equipment management software, including:- Submission of maintenance records in audit processes as PALC, CAP, ISO;- Standardization of equipment inventory and maintenance control;- Creation of a single channel for service orders;- Consolidation of the information relating to all company equipment;- Defi nition of management reports and performance indicators.Methodology: Customizations were developed to meet the needs of the company, as the analysis of the useful fi elds for registration to defi ne calculations for services in metrology instruments such as centrifuges, thermometers, scales, etc.
It was taken into consideration, choosing a software that meets legal requirements based on the standard of FDA, Chapter 21, Part 11. In the company’s intranet it was provided a channel for service requests, increasing the answer agility, and also some guide materials related to the use of the system.For the consolidation of information were developed management reports and indicators for evaluating activities, being the most important: planned versus performed maintenance preventive and corrective and number of service orders closed.Results: After 6 months of training people in various laboratories of the company and a restless work registration, in December 2012, we got an overview of the installed equipment:• Equipment: 14,200• Users: ≈ 2,500• Maintenance Plans: ≈ 500• Branches of services: ≈ 800
• Service Orders generated in the 1st month of operation: 12,800Conclusion: The equipment inventory was audited, obtaining a homogeneous registration and facilitating the consolidation of information.There was the standardization of maintenance plans that were different for the same equipment through alignment with suppliers, service providers and operating team.There is now a single channel to request services, which streamlines the service and provides fast analysis of equipment performance by identifying the most frequent occurrences.In addition to registration, the system will be very important to measure the performance of equipment from different suppliers through the use of statistical tools.However, only the implementation of the system will not result in effi cient management, but from now it is required to maintain a correct record of all information, including the planned versus executed controls, monitoring results and to implement a constant search for improvement in the work processes.
B-38
Implementation of a new Laboratory Information System in a small regional clinical laboratory in Brazil - a case report
G. Carlotto, R. J. Marani, C. F. A. Pereira. DASA, Cuiabá, Brazil
Objective: To present the gains in traceability, productivity and overall performance after the roll out of a new Laboratory Information System (LIS) in a regional lab -
Cuiabá, Mato Grosso, Brazil, 2012.Introduction: In recent decades factors such as cost, time and safety motivated companies to invest in laboratory medicine automation in both production and information systems, from pre analytical to post analytical phases. DASA fi rst implemented a new proprietary LIS in April 2006 in the São Paulo Lab. This LIS is already installed in others DASA regional labs and there is a schedule that considers the roll out of this system to the labs that were acquired in the last years. The focus of this work is to report the gains that were obtained after the deployment of the system in the regional lab of Mato Grosso. This lab produces 800.000 tests a year and is the smallest regional Lab in DASA (DASA has 10 outpatients regional or central labs processing from 800.000 tests to 50 million tests/ year). Materials and methods: Multidisciplinary team involving areas of production, information technology, logistics, customer relationship and sales was in charge of the rollout. The new LIS System features are compared to the previous one and key performance indicators are shown. The system installed was MotionTM, manufactured in JAVA platform, developed by Touch Technology in partnership with DASA. Discussion: The implementation of the new system allowed the management team to have access to many regular time reports that show the laboratory productivity, the precise TAT of each phase of thelaboratory cycle, the number of repetitions, and other important data relating to production. Among the major changes obtained with the introduction of the new LIS, the samples traceability showed great improvement, making the quest and monitoring of the in process materials more quick and effi cient. Regarding the results validation and report, it was introduced the concept of validation levels by analyzing a set of algorithms that take into account delta check analysis, patient clinical data and correlate test evaluation, increasing the quality, speed and safety of this process. Since this is a corporate system it was possible also to integrate this regional lab with the other production units of the company, promoting greater platform standardization, global effi ciency and allowing the consolidation of specialized tests in the DASA lab network. Some of the KPI obtained after the rollout are: reduction in total production

Tuesday, July 30, 9:30 am – 5:00 pm Management
A180 CLINICAL CHEMISTRY, Vol. 59, No. 10, Supplement, 2013
cost in 24,%, increase in FTE productivity in 7%, TAT < 24h in 94,5% of the tests, conformity with the service level agreement in 99,1% and a repetition index of 1,6%.Conclusion: The rollout of the DASA corporate LIS brought to the Mato Grosso Laboratory signifi cant improvements across the whole chain of processes, showing us the importance of having a robust andintegrated LIS even in a regional lab that can be classifi ed as a small one. The data showed some dramatic improvements in productivity, effi ciency, traceability, speed, integration and patient safety, allowing the management team to better measure and control the overall operational performance.
B-39
Infection control software HEPIC integrated to the Microbiology Laboratory for identifi cation of colonyzed or infected patients with multiresistant microorganisms admitted to a Hospital
A. L. Destra, A. Sola, R. Tranchesi, L. B. Faro, L. Almeida, A. C. C. Pignatari, O. V. P. Denardin. DASA, SÃO PAULO, Brazil
Background: Nosocomial infections are responsible for high patient morbidity and mortality, with eleveted hospitalization costs, particularly for those infected by antimicrobial multiresistant microorganisms. Effective infection control measures include early identifi cation of colonized or infected patients with these bacteria admitted to a hospital, particularly for patients readmitted after hospitalizations, that could be carriers of microorganisms acquired in previous hospitalization.
Methods: All readmitted patients with previous antimicrobial multiresistant bacteria isolated from surveillance or clinical samples were identifi ed at presentation to a large general hospital at Sao Paulo, Brazil, by an integrated computer network including the laboratory information system, the Hospital management system and the epidemiological surveillance and infection control software HEPIC . The Hospital`s nosocomial infection control service guideline defi ned the most important antimicrobial multiresistant microrganisms for precaution and isolation of patients as follows: Acinetobacter baumannii resistant to carbapenems (MRAb), Pseudomonas aeruginosa resistant to carbapenems (MRPa), Klebsiella pneumonia resistant to carbapenems (KPC), Enterococci resistant to vancomycin (VRE).Results: From January to December 2012, 144 admission alerts (at the from the admission of) of 79 patients previously admitted to the hospital were provided to the respective wards and the infection control team. Patients were readmitted to the hospital more than once during the year and could be carrier of more than one multiresitant bacteria. The following microorganisms were include in these alerts, 59 for MRPa, 52 for KPC, 50 for MRAb, 21 for VRE, and 4 for Enterobacter spp resistant to carbapenems. These alerts allowed the health assistance team to implement the recommended infection control measures including precaution and isolation immediately after the readmission of the patient.Conclusion: The HEPIC software integrates the microbiology laboratory, the infection control data bank and the administrative admission hospital system, allowing an early identifi cation of previously colonized or infected by multiresistant bacteria patients, and contributes for an effective nosocomial infection control program.
B-40
Use of Quality Metrics for Assessment and Prevention of Chemistry Laboratory Errors
B. Chung, L. Filson, C. Brana-Mulero, A. Patel, G. Salas, M. Jin. University of Illinois Hospital and Health Sciences System, Chicago, IL
Background: Patient safety initiatives have focused on reducing preventable medical errors, especially those resulting in longer hospital length of stay or additional treatment. Laboratory errors often translate to signifi cant patient morbidity and mortality and considerable increased cost to health care systems. Therefore, it is imperative in the clinical laboratory to have a comprehensive quality assessment program with metrics in place to demonstrate improvements. In this study, we analyzed data from a large teaching medical center to identify the leading causes of errors in the clinical chemistry laboratory setting for targeted error prevention efforts. An additional objective was to evaluate the impact of the error prevention policies and interventions on quality improvement.Methods: Retrospective review and analysis of error frequencies from 14,573,539 tests were performed to evaluate pre-analytical, analytical, and post-analytical phase errors that occurred in the clinical chemistry laboratory during 2010-2012.
Results:
2010 2011 2012 Error Type Error Freq. Freq. Error Freq. Freq. Error Freq. Freq. No. (%) (ppm) No. (%) (ppm) No. (%) (ppm)Pre-analytical 135 52% 28.3 119 55% 24.1 86 49% 17.7Phlebotomy 7 3% 1.5 7 3% 1.4 6 3% 1.2Ordering 39 15% 8.2 21 10% 4.3 24 14% 4.9Processing 39 15% 8.2 12 6% 2.4 24 14% 4.9Sample integrity 47 18% 9.8 76 35% 15.4 31 18% 6.4Miscellaneous 3 1% 0.6 3 1% 0.6 1 1% 0.2Analytical 105 40% 22.0 64 30% 13.0 50 28% 10.3Result 19 7% 4.0 15 7% 3.0 11 6% 2.3Instrument 79 30% 16.5 34 16% 6.9 26 15% 5.4Dilution 3 1% 0.6 11 5% 2.2 8 5% 1.6Miscellaneous 4 2% 0.8 4 2% 0.8 5 3% 1.0Post-analytical 22 8% 4.6 32 15% 6.5 41 23% 8.4Transcription 21 8% 4.4 25 12% 5.1 40 23% 8.2Miscellaneous 1 0.4% 0.2 7 3% 1.4 1 1% 0.2Total 262 100% 54.8 215 100% 43.5 177 100% 36.4* Freq. (%) = frequency (percentage, errors), Freq. (ppm) = frequency (parts per million, tests) Conclusions: During 2010-2012, errors from the pre-analytical phase (52%) were the most common source of laboratory error followed by analytical (33%) and post-analytical (15%). Sample integrity (10.5 ppm), instrument error (9.6 ppm), and transcription error (5.9 ppm) were the most frequent errors in each phase, respectively. During this period, a decreasing trend in the number of pre-analytical and analytical errors per million tests was noted. We concluded that lab staff re-training, regular biweekly quality assurance review and discussion of observed errors, weekly monitoring and review of instrument fl ags and quality control outliers, and monthly technical issue discussions with vendors, contributed to the reduction of these errors. Post-analytical errors exhibited an increasing trend and additional efforts will focus on improving technologist education and LIS reporting to address this issue.
B-41
Description of Notifi cation of Panic Values in Laboratory of 34 hospitals in Brazil in 2012
C. Rodrigues, M. L. N. Figueiredo, L. B. Faro, P. A. J. Augusto, M. L. Garcia, N. Silva, S. A. Malaman, O. Fernandes. DASA, SÃO PAULO, Brazil
Background:Critical value is defi ned as a result suggesting that the patient was in an imminent danger unless appropriate therapy was initiated promptly. It can be called panic value. Initially values were defi ned by Clinical Laboratory Improvement Amendments (CLIA) in 1988, but the recent focus in patient safety, has brought increasing attention to the issue of laboratory critical value reporting, and is part of the requirements for accreditation by The Joint Commission International (JCI) and the College of American Pathologists (CAP). The laboratory panic value must be reported immediately, because of the imminent risk of patient’s life. Such notifi cation must be immediate, effective and using the read-back technique.Methods: Were evaluated 145,832 panic value reports in 34 Hospitals in Brazil including São Paulo, Bahia, Porto Alegre, from January to December 2012. The epidemiological data were obtained from reports generated from the Laboratory information system named Motion®, system TOUCH. Data were analyzed and we calculated the difference between the panic values reported and communicated to the healthcare team (nurses and physicians). The panic values were appointed by Motion® system and they were reported by a telephone call to the physician responsible.Results: From January to December 2012, we identifi ed 145,832 panic values reported by Motion® in 34 Brazilian hospitals, and 144,567 (99.1%) of them were adequately communicated to the healthcare team. It shows a high effectively communication the Laboratory with the health care team, and the attention to the safety patients, using the read-back technique.Conclusion: This work demonstrates an adequate percentage of panic values communication (above 95%), which shows a high effective communication strategy between the clinical laboratory and the hospitals. These parameters may be considered an important laboratory outcome measurement because they refl ect clinical effectiveness, patient safety and operational effi ciency. And fundamental requirement in Accreditation Quality.

Point-of-Care Testing Tuesday, July 30, 9:30 am – 5:00 pm
CLINICAL CHEMISTRY, Vol. 59, No. 10, Supplement, 2013 A181
Wednesday, July 31, 2013
Poster Session: 9:30 AM - 5:00 PM
Point-of-Care Testing
B-42
On-Site Colorimetric Detection of Sweat Chloride Ion for Diagnosing Cystic Fibrosis
X. Mu1, X. Tian2, K. Xu2, Z. Zheng1. 1Institute of Basic Medical Sciences, School of Basic Medicine, Chinese Academy of Medical Sciences and Peking Union Medical College, Beijing, China, 2Department of Respiration, Peking Union Medical College Hospital, Beijing, China
Background: The detection of chloride ion in sweat is the gold standard to diagnose Cystic Fibrosis (CF). Most of conventional methods involve two independent steps: sweat collection and instrumental detection. However, such paradigm suffers from variations due to sweat evaporation during the collection, transfer and storage, and requires specialized expensive equipments, making it diffi cult to detect on-site.Methods: Here, we developed a “Band-Aid like” microfl uidic paper-based analytical device (μPAD) for on-skin detection of sweat chloride ion (Figure A). The device can exchange chloride ion with hydroxide ion by the ion exchanging (IE) paper (DE81). The increase of OH- can turn the color of pH paper from yellow to green. The intensity of changed color is recorded with a cell phone camera and measured in cyan channel in CMYK color spaces (Figure B). The device also inherently controls the color of pH paper, the pH of sweat as well as the amount of detected sweet. When a certain amount of sweet is absorbed, the volumeter would turn purple (Figure C). A transparent and adhesive Tegaderm fi lm fi rmly attaches the whole device to the skin (of forearm).Results: The required minimal volume for detection was 2 μl of sweat, and linear dynamic range was from 0 to at least 100 mM chloride ion (Figure D). The correlation coeffi cient was 0.9945, while within-run CV was below 5%. Since the chloride ion is the dominating anion in the sweat, other anions (sulfate and nitrate ions) show little interference. The device can distinguish healthy people (green triangle) and a mock sample of CF (red diamond), using the reference value of 40-60 mM chloride ion. Test results with CF patients will be presented.Conclusion: Our method integrated the separated steps of sweat analysis and provided a convenient and cost-effective way of colorimetric quantitative detection, demonstrating new opportunities in the diagnosis of CF.
B-43
Evaluation of platelet inhibition effi cacy for patients undergoing coronary intervention. Clinical application of Point of Care Testing
A. I. Alvarez-Ríos, G. Pérez-Moya, J. Romero-Aleta, A. León-Justel, J. M. Guerrero. H.U. Virgen del Rocio, Sevilla, Spain
Background: Guidelines recommend that antiplatelet therapy using aspirin and clopidogrel should be administered to the majority of patients with acute coronary syndromes, including those undergoing coronaryintervention. Clopidogrel inhibits platelet P2Y12 ADP receptors, while ADP, as an inductor of aggregation, stimulates both P2Y12 and P2Y1 platelet receptors.Objective: To evaluate the platelet inhibition effi cacy in patients under regular maintenance dose of aspirin or clopidogrel by VerifyNow-P2Y12® assay.Methods: The assay VerifyNow-P2Y12 is a turbidimetric immunoassay devised to measure platelet function according to the ability of activated platelets to bind fi brinogen. The VerifyNow-P2Y12 is a rapid assay that test platelet activity over 3 min and uses of the combination of ADP and prostaglandin E1 (PGE1) to directly measure the effects of clopidogrel on the P2Y12 receptor. ADP is used to maximally activate the platelets by binding to the P2Y1 and P2Y12 platelet receptors, while PGE1 is used to suppress the ADP-induced P2Y1-mediated increase in intracellular calcium levels. A total of 30 patients undergoing coronary intervention procedure and receiving anti-platelet drugs in regular maintenance dose for at least 1 week were enrolled. 10 patients treated with Aspirin, 10 not treated with Aspirin, and 10 with Clopidogrel after 5 days of suspensionbefore intervention. None of our patients were treated with low molecular weight heparin.Results from the VerifyNow-P2Y12 assay are reported in Aspirin Reaction Units (ARU) and in P2Y12 Reaction Units (PRU), as platelet reactivity (including baseline) as platelet inhibition rate. The dosage of anti-platelet drugs, combination with any other drugs, and clinical characters in baseline of all enrolled patients were analyzed. ARU ≥ 550 was used as cut-off to identify an absence of effect of aspirin and values < 550 refl ects platelet dysfunction. The results for the clopidogrel were calculated as degree of inhibition (%), the reference range is 194-418 PRU.Results: In this study, the patients who were not under prophylactic aspirin had an ARU of 620 ±20 (range 563-677), while those that followed an antiplatelet therapy with aspirin had an ARU of 496 ±48 (range 421-540), while the degree of inhibition for the group taking clopidogrel was <10%. According to our results, the use other drugs as Atorvastatin or Non-Steroid Anti-Infl ammatory did not show signifi cant correlation with baseline and platelet inhibition. The accuracy we get is high, the distribution of ARU or PRU values for the VerifyNow-P2Y12 assay showed a separation from antiaggregant or non-antiaggregant patients, due to AUC for ROC was equal to 1.Conclusions: The use of prophylactic antiplatelet therapy prior to surgery have various effects on platelet function and VerifyNow-P2Y12 is a reliable, fast and sensitive device suitable for monitoring of platelet inhibition during aspirin or clopidogrel therapy. This assay of Point of Care Testing could be very useful for monitoring response individual antiplatelet therapy and evaluate a possible reversal of inhibition before anesthesia and avoid suspension of surgery against the risk of perioperative bleeding.
B-44
Development of Point-of-Care Hemoglobin A1c Assay based on Enzyme Method
D. Shen, J. Cho, H. Kim, J. Kim, K. Park, D. Sung, J. Ha, H. Nam. i-SENS, Incheon, Korea, Republic of
Background: With the increasing number of patients with diabetes mellitus, the management and control of their blood glucose levels has been the utmost goal over the years. Detection of glycated hemoglobin has drawn much interest from both academia and industry since the completion of two important studies, DCCTand UKPDS. The glycation ratio of the hemoglobin molecules has been the most important long-term treatment index for diabetic patients, which suggests the average blood glucose level over the past two to three months. Methods: A rotational cartridge assay system has been developed. It employs enzymatic degradation of hemoglobin followed by oxidation-reduction reactions of the cleaved peptides with fructosyl peptide oxidase. The generated hydrogen peroxides are then quantifi ed with the reaction of a peroxidase-dye system. The intensity of color generated is correlated with the activity of enzymes and thus the amount of glycated hemoglobin. The linearity of the assay was evaluated in the range of 6-20g/dL of

Tuesday, July 30, 9:30 am – 5:00 pm Point-of-Care Testing
A182 CLINICAL CHEMISTRY, Vol. 59, No. 10, Supplement, 2013
total hemoglobin concentrations. The assay was also run in the presence of various potential interfering agents, including labile HbA1c, glucose, bilirubin, ascorbic acid, modifi ed hemoglobins. Finally, using 30 samples of individual patient, a comparison study of the assay was performed against a DCCT traceable HPLC system (Bio-Rad Variant II).Results: The HbA1c cartridge assay takes about 4 minutes with only 1.5 μL of whole blood. The intra laboratory precision was confi rmed to be 2.7%(4.6% HbA1c, n=20), 1.9%(6.0% HbA1c, n=20), and 1.6%(8.5% HbA1c, n=20). No major interference has been identifi ed for common interfering substances found in other methods. The comparison test with HPLC system showed a linear correlation across the normal and elevated range of %HbA1c (y=1.05x-0.3, n=30, P<0.001, r=0.99).Conclusion: A rapid and accurate point-of-care cartridge assay for HbA1c has been demonstrated. It proved the usability of such a system for clinical applications.
B-45
Analytical Performance of Home Pregnancy test that estimates time since ovulation based on hCG threshold concentration at week boundaries
S. R. Johnson1, P. Perry1, T. Alonzo2, M. Zinaman3. 1SPD Development Company Ltd, Bedford, United Kingdom, 2University of Southern California, Monrovia, CA, 3Tuft’s University School of Medicine, Boston, MA
Background: A new urine pregnancy test is available in the USA, which consists of two immunoassay strips (one low and one high sensitivity), optical detection system and microprocessor which enables determination of pregnancy status and also estimates the number of weeks since ovulation based on hCG threshold levels. Results are displayed on an LCD as 1-2, 2-3 and 3+ weeks if a “Pregnant” result is returned. Studies have been conducted with the objective of investigating the analytical performance of this device. This is the fi rst device available that equates urinary hCG levels to time since ovulation. Therefore it is of clinical relevance to understand performance of the device with regard to accuracy, specifi city, precision, batch variation and comparison to time since ovulation by a reference method.Methods: Quantitative measurement of hCG was conducted on all clinical samples by AutoDELFIA (Perkin Elmer) for comparative purposes. Laboratory testing of urine samples from pregnant (n=107) and non-pregnant volunteers (n=187) was conducted to determine accuracy of the pregnancy test (Clearblue pregnancy test with weeks estimator). Test specifi city was investigated using samples from pre-, peri- and post- menopausal non-pregnant women (n=301). Precision was examined by testing 3 batches, across days and operators on 38 standards (0-10807mIU/ml) (n=90 per standard). Comparison to time since ovulation was accomplished by recruitment of women pre-conception and collection of daily urine samples to detect the lutenizing hormone (AutoDELFIA, with ovulation defi ned as surge+1day). Urine sample collection continued through early pregnancy to enable laboratory comparison of device results to time since ovulation (n= 153 women). A similar sample collection protocol also enabled pregnancy detection rate to be calculated with respect to day of the expected period (n=135 pregnancy cycles).Results: The device was >99% accurate in detecting pregnancy and no “Pregnant” results were seen following testing of urine samples from non-pregnant Pre, Peri and
Post-menopausal women. Pregnancy detection rate was 99% for day of expected period, 98% for day -1, 97% for day -2, 90% for day -3 and 65% for day -4. The precision study showed that the threshold for determining pregnancy was 10.2mIU/ml, the 1-2/2-3 boundary was 153mIU/ml, and the 2-3/3+ boundary was 2750mIU/ml. An ANOVA mixed effects model found batch was a minor source of variance and operator and day were very minor sources. In this study, agreement between Weeks Estimator results and time since ovulation was 93%.Conclusion: The analytical performance of this device demonstrates it has the necessary performance to provide accurate pregnancy results (>99% accurate) and provide a robust estimate of time since ovulation (93% agreement with LH surge reference).
B-47
Evaluation of Point of Care (POC) Prehospital Testing for Troponin I (cTnI) while in Hospital Transit via the Scottish Ambulance Service (SAS)- a Preliminary Study using the Samsung LABGEOIB10 Analyzer
S. Scotland1, P. Lunts2, G. Nicoll2, K. Barclay3, C. Baxter3, I. Archibald3, G. Miller3, B. I. Bluestein4, E. Brennan4, D. Kim5, J. Grant6, K. Dean6. 1Scottish Centre for Telehealth and Telecare/NHS24, Edinburgh, United Kingdom, 2NHS Borders General Hospital, Melrose, United Kingdom, 3Scottish Ambulance Service, Galashiels, United Kingdom, 4Nexus-DX, San Diego, CA, 5Samsung Electronics Co.,Ltd., Suwon, Korea, Republic of, 6Cisco-IBSG, San Jose, CA
Background: The Scottish Borders is a large sparsely populated area with a population of 108,000. Within its immediate geographic confi nes, there is no major medical center with capability of interventional cardiology and its largest town has a population of 16,000. While patients presenting with chest pain are rapidly confi rmed as having myocardial infarction (MI) if their electrocardiogram (ECG) demonstrates an ST-segment elevation (STEMI), diagnosis of non-ST segment elevation (NSTEMI) require more information and time to confi rm a positive diagnosis. In addition to clinical symptoms, NSTEMI diagnoses are dependent on assessment of both clinical symptoms and biochemical evaluation of cTnI cardiac marker elevations. The purpose of this pilot study was to demonstrate the feasibility of testing NSTEMI chest pain patients by measurement of cTnI in the ambulance during transit. Patients excluded from the study were all STEMI patients who were immediately transferred directly to the Catheter Lab at Edinburgh Royal Infi rmary.Principle and Methods: All ambulances were equipped with Samsung LABGEOIB10 Analyzers, small portable lightweight (2.4 kg) immunochemistry systems capable of measuring from 1 to 3 cardiac biomarkers on a single 500 μL whole blood aliquot in approximately 20 minutes. Test devices are similar in confi guration to a compact disc. 57 paramedics were trained to operate the LABGEO Analyzers and perform the cTnI tests. For this pilot study results were reported in print but the Analyzer may also be confi gured to transmit data electronically. The main objective of this fi rst phase was to assess the feasibility of performing such testing accurately and precisely in a moving vehicle. Secondary objectives were to investigate the potential impact of pre-hospital cTnI testing on subsequent patient pathways based on determinations of clinical sensitivity and specifi city.Results: For profi ciency and training, external QC was run daily for this phase of the study and was within manufacturer specifi cation. Initiation of cTnI testing in the ambulance reduced the average time to fi rst cTnI result by a mean of 2.5 h compared to waiting until arrival at Borders General Hospital (BGH). Of 41 measurements taken in the ambulance, 38 were negative when repeated at the hospital (92.7% specifi city).The other 4 were positive by both the LABGEO cTnI method and the BGH Lab cTnI method. Conclusions: While preliminary in nature, these fi ndings suggest that early measurement of cTnI in NSTEMI patients, when defi nitively elevated, can aid in disposition triage decisions in a fashion similar to STEMI ECG fi ndings. If negative on initial measurement, standard of care protocols require serial measurements of cTnI over 2 to 3 different time intervals. Based on this preliminary study, ambulance measurement provides a documented Time 0 presentation greater than 2 h earlier than waiting for hospital testing which leads to a reduction in actual time between a fi rst and 2nd serial measurement.

Point-of-Care Testing Tuesday, July 30, 9:30 am – 5:00 pm
CLINICAL CHEMISTRY, Vol. 59, No. 10, Supplement, 2013 A183
B-48
Evaluation of the Gem Premier 3000 hematocrit and hemoglobin parameters: a comparison between a POCT device and a CBC analyzer in critically ill patients
E. Goedert1, T. Souza1, C. Silva1, C. F. A. Pereira2, P. Melo3, L. B. Faro2. 1DASA, Recife, Brazil, 2DASA, São Paulo, Brazil, 3H. Jayme da Fonte, Recife, Brazil
Background: Point of care testing (POCT) is defi ned as medical testing at or near the site of patient care. This increases the likelihood that the patient, physician, and care team will receive the results quicker, which allows for immediate clinical management decisions to be made. The intensive care unit scenario offers one of the best opportunities for these emergent technologies to fl ourish. The Diagnostic companies are developing year over year more integrated, portable and affordable instruments. Red blood cells (RBC) parameters, as hematocrit and hemoglobin levels, provide indirect data about the oxygenation and blood volume in critically ill patients. In certain emergency circumstances, these results allow a quick decision on clinical intervention, thereby increasing the chances of survival in these patients. These parameters are traditionally evaluated by robust, dedicated and specialized analyzers. We decided to evaluate the performance of one POCT device for the RBC parameters comparing it with a regular bench top Complete Blood Cells (CBC) Analyzer.Methods: Laboratory instruments from companies Instrumentation Laboratory® (Gem Premier 3000) and Sysmex ® (XT 1800i) were used for the measurement of erythrocyte parameters in 70 adult patients from intensive care unit of Jayme da Fonte Hospital, Recife, Brazil. The Gem Premier (GP) 3000 uses the direct conductivity methodology for hematocrit (Ht) and hemoglobin (Hb) determinations. The Sysmex XT (XT) 1800i uses the spectrophotometry for Hb dosage and electrical impedance for the Ht determination. The mean values and standard deviation were analyzed for both parameters and methodologies, as well as the coeffi cient of determination (R2).Results: The medium Hb measurement obtained in GP and XT instruments were respectively 9.3g/dL ± 1.9 and 9,5g/dL ± 1.8. The medium Ht estimate in GP was 30% ± 6.3; in the XT we obtained a score of 29.8% ± 5.1. There was no statistically signifi cant difference when analyzing the variance of the different hemoglobin levels (p = 0.59) and hematocrit (p = 0.78). The determination coeffi cient was calculated at approximately 85% for both parameters.Conclusion: Physicians in intensive care units need to obtain accurate and reliable results in a very short period of time to manage appropriately critical care patients. Therefore, the availability and use of a POCT device that provides trustful results of hematological parameters can be cost-effective. The Gem 3000 instrument HT and Hb results were evaluated and considered in agreement with the same tests provided by XT 1800i, and are now offered regularly in this diagnostic scenario.
B-49
Evaluation of three whole blood point of care lactate methods by comparison to plasma lactate and a laboratory developed whole blood fl ow-injection MS/MS method.
N. V. Tolan1, A. M. Wockenfus1, C. D. Koch1, D. J. Dietzen2, B. S. Karon1. 1Mayo Clinic, Rochester, MN, 2St. Louis Children’s Hospital and Washington University School of Medicine, St. Louis, MO
Introduction: Compliance with international sepsis resuscitation guidelines, including point of care (POC) whole blood lactate testing, contributes to decreased ICU mortality from sepsis. This study evaluated three whole blood POC lactate methods against two plasma lactate methods and a fl ow-injection MS/MS method testing ZnSO4 precipitated whole blood.Methods: The Nova StatStrip (Nova Biomedical), i-STAT CG4+(Abbott Point of Care) and Radiometer ABL90 (Radiometer Medical ApS) lactate methods were evaluated. The mean of plasma lactate measured on the Cobas Integra 400 Plus (Roche Diagnostics) and Vitros 350 (Ortho Clinical Diagnostics) provided a plasma reference. Additionally, methods were compared to a fl ow-injection MS/MS assay measuring lactate in whole blood extracts. Intra- (n=20) and inter-assay (n=20) coeffi cients of variation (CV) were determined for the POC methods using QC material covering the ranges between 0.3-1.3, 1.5-2.5 (except Nova) and 5.4-9.6 mmol/L lactate. Method comparison was performed by collecting specimens from normal donors at rest (n=15), exerted (n=41) and with lactic acid-spiked samples (n=25). Due to rare outliners observed during Nova precision studies, samples were run in duplicate on two separate meters, whereas all other methods involved only duplicate testing. For the MS/MS method, whole blood aliquots were immediately precipitated with 0.1M
ZnSO4. This method incorporated 13C3-lactate IS and lactate measurement by fl ow-injection tandem mass spectrometry (AB Sciex API 3200 QTrap) in negative MRM mode. POC results were compared to the plasma values and MS/MS concentrations by mean bias, Bland-Altman plots, and through clinical concordance.Results: Intra-assay precision was <5% while inter-assay precision was <8% CV for the Nova, i-STAT, and ABL90 methods. Total imprecision of the MS/MS assay across the dynamic range was less than 5% CV. For concentrations <10 mmol/L, the mean (SD) of bias between whole blood and plasma lactate for Nova (n=248), i-STAT (n=124), ABL90 (n=121) were -0.06±0.95, 0.12±0.61 and 0.18±0.53 mmol/L respectively. Among plasma values within the normal range (0-2.3 mmol/L), Nova was found to be clinically discordant in 3/72 (4%) measurements, while all i-STAT and ABL90 values were concordant (n=36). Of plasma values within the elevated range (2.4-3.9 mmol/L), 11/60 (18%), 8/30 (27%) and 6/30 (20%) measurements were discordant for Nova, i-STAT and ABL90 methods, respectively. For samples above the cut-off for sepsis recognition (≥4.0 mmol/L), 8/192 (4%) measurements were discordant by Nova, while all i-STAT and ABL90 values were concordant (n=96). Due to strip errors, 7/324 (2%) of Nova measurements were outliers, as duplicate results corrected to concordant values. Overall, clinical concordance with plasma values was 93%, 95% and 96% for Nova, i-STAT, and ABL90 methods. POC methods demonstrated increased bias and variability when compared to the MS/MS method. For concentrations <10 mmol/L, the mean (SD) of bias between POC lactate and the MS/MS method for Nova (n=256), i-STAT (n=128), ABL90 (n=125) were 0.74±1.44, 0.92±1.34 and 0.98±1.24 respectively.Conclusions: All POC methods demonstrated acceptable precision, accuracy (<10 mmol/L lactate) and clinical concordance for detection of sepsis, compared to plasma values. Signifi cant differences between whole blood POC methods and ZnSO4 precipitated whole blood lactate by MS/MS method were observed.
B-50
False-Positive Results in Point-of-Care Ovulation Prediction Devices Due to Human Chorionic Gonadotropin
B. O. Crews, K. H. Moley, A. M. Gronowski. Washington University School of Medicine, Saint Louis, MO
Background:Recently, a women undergoing fertility treatment at our institution detected a positive Luteinizing hormone (LH) surge using an over the counter (OTC) LH device despite the fact that she was later found to be pregnant. The aim of this study was to determine if human chorionic gonadotropin (hCG) causes false positive results in OTC LH devices.Methods: Purifi ed hCG or LH was added to normal saline and diluted to concentrations of 10, 50, 100, 1000, 5000, or 10,000 mIU/mL. The cross-reactivity of hCG was tested using three home ovulation prediction devices: Clear Blue® (Swiss Precision Diagnostics, Geneva, Switzerland), First Response® (Church & Dwight, Princeton, NJ), and Walgreens® (Walgreens Co., Deerfi eld, IL). Results from each device were judged by an individual who was blinded to the antigen and concentration, and to the brand of device. All measurements were performed in duplicate.Results: All devices showed cross-reactivity with hCG. The concentration of hCG that produced a false positive result varied by brand of device and is summarized in Table 1.Table 1. Effect of different hCG and LH concentrations on three different ovulation prediction devices
Final hCG concentration (mIU/mL)Device 0 10 50 100 1,000 5,000 10,000First Response - - - - - - +Clear Blue - + + + + ND +Walgreens - - +/- + + ND ND
Final LH concentration (mIU/mL)Device 0 10 50 100First Response - - +/- +Clear Blue - + + +Walgreens - - - ++ 2/2 devices were judged as positive- 2/2 devices were judged as negative+/- devices were judged as not defi nitively positive or negativeConclusion: Ovulation prediction devices cross-react with hCG to produce false positive results. Fertility clinics and physicians that rely on OTC LH devices to detect an LH surge for the timing of intrauterine insemination should be aware that early pregnancy may cause false positive results on LH devices. In fertility clinics in particular, physicians should instruct their patients to use OTC LH devices with minimal hCG cross-reactivity.

Tuesday, July 30, 9:30 am – 5:00 pm Point-of-Care Testing
A184 CLINICAL CHEMISTRY, Vol. 59, No. 10, Supplement, 2013
B-51
Novel Cellular Hemoglobin A1c Control Linearity Set - Correlation between Analyzers, Linearity and Stability
K. Das, S. M. Wigginton, J. M. Lechner, W. L. Ryan. Streck, Inc., La Vista, NE
Background: Over 347 million of the world population and over 25 million of the US population are affected by diabetes, causing increasing threat to our healthcare and economy. Effective diabetes management includes routine monitoring and maintenance of a healthy lifestyle. Measuring hemoglobin A1c offers several advantages over measuring blood glucose. American Diabetic Association (ADA) criteria for diabetes diagnosis include an A1c ≥6.5%. Although the A1c values vary from 5±0.5% to around 12±0.5%, in rare occasions extremely low (≤4.5%) or high (≥16%) A1c values are reported.1,2 These inaccuracies are attributed to various causes such as the low concentration of hemoglobin, or interference by hemoglobin variants and medications. To reliably report any abnormal results it is important to validate a wide range of A1c values. Additionally it is critical to assure that the entire instrumental analytical process, including lysing step, are functioning correctly. A1c-Cellular® Linearity set is a fi ve level calibration set that encompasses 3%-20% A1c range. A1c-Cellular Linearity is the only cellular linearity/calibration verifi cation material with intact RBC. Therefore, it can test the entire assay procedure, including the lysing step. Herein, we report the cross-instrument correlation of A1c values, linearity of A1c values within each instrument assay range, and the stability of A1c-Cellular Linearity. We also present a comparison of cross-instrument correlation between the A1c values of A1c-Cellular Linearity and whole blood sample.Methods: A1c-Cellular Linearity material is obtained from Streck, Inc (Omaha, NE). Blood samples were collected from donors with informed consent. The A1c values of these samples were correlated across several major A1c platforms including but not limited to Tosoh G8, Siemens Dimension, Bio-Rad D10. Methods and calculations were performed based on CLSI guidelines.Results: The mean A1c values of the A1c-Cellular Linearity levels are ~3.6±0.5%, ~6.7±0.4%, ~10.1±0.6%, ~13.7±0.8% and ~18.0±0.2% respectively. The R2 values are ~0.995 within the assay range for each instrument. The SDvalues for 10 successive runs on a single platform are in the range of 0.2-0.8%. The stability of all 5 levels was monitored on Tosoh G8, for 100 days, yielding the SD values of 0.1, 0.2, 0.4, 0.6 and 0.7 for Level 1 - Level 5 respectively. The ready-to-use liquid A1c-Cellular Linearity controls have intact red cells and resemble a whole blood sample.Conclusion: The A1c values of A1c-Cellular Linearity are linear within each instrument ranges. The A1c values of A1c-Cellular Linearity arecorrelated between the major A1c analyzers across the entire reportable ranges of the instruments. The linearity set is stable for 3 months at 6 °C in a closed vial and 7 days at 6 °C in open vial. Furthermore,Streck A1c-Cellular control is the only cellular assay calibration kit withintact human RBC.Reference:1. Gross BN et. al. Falsely low hemoglobin A1c levels in a patient receiving Ribavirin and Peginterferon alfa-2b for hepatitis C. Parmacotherapy 2009; 29: 121.2. Zhu Y et. al. Falsely elevated hemoglobin A1c due to S-β+-thalassemia interference in Bio-Rad Variant II Turbo HbA1c assay. Clin Chim Acta 2009; 409:18
B-52
Multivariable Regression Analysis Techniques for Comparing Two Point of Care Devices with the Laboratory Method for Blood Glucose. A Practical Example Using Patient Specimens.
V. M. Genta1, D. Graubner1, S. S. Church2, L. Wyer2, S. Spingarn3, Y. Shen1. 1Sentara Virginia Beach General Hospital, Virginia Beach, VA, 2Sentara Healthcare, Norfolk, VA, 3Sentara Norfolk General Hospital, Norfolk, VA
Background: In our Hospital patient’s blood glucose values are determined routinely with a laboratory method (LM) and, when a rapid response is required, with two point of care devices (POCD). The relationship between the performance of the POCD and that of the LM was evaluated by comparing patient blood glucose values obtained with the POCDs with those as obtained with the LM, using multivariable least squares regression analysis techniques.
Methods: Cobas 6000® (Roche), SureStep Flexx® (Lifescan, Johnson and Johnson), i-STAT® cartridges (CG8+ ®, Chem8+ ®, Abbott Laboratories). After verifying that the methods were in statistical control, 168 patient specimens obtained by venipuncture were assayed in parallel and within 15 minutes with the three methods by one of us (D. G.). The observed glucose values were in the interval 40-500 mg/dL. The observations were collected electronically and transferred to Minitab® (Version 16, Minitab Inc.) statistical software. Since the plot of the differences between the values obtained with the POCD by those as obtained with the LM showed increased variability for increasing blood glucose values, the observations were analyzed with multivariable weighted least squares regression analysis techniques (MWLSR), their diagnostics for adequacy of the model and their graphic representations. Results:The MWLSR equation was : POCD = 3 + 1.00 LM - 1.95 coded POCD, (code: 1 if SureStep Flexx, 2 if i-STAT cartridge), Sy/x=0.8, R^2=99.2, Variance infl ation factor (VIF) for LM=1.039, VIF for coded POCD=1.039, PRESS=104.6. The test for lack-of-fi t by data subsetting did not show statistically signifi cant lack of fi t (P>=0.1).The plots of the standardized deleted residuals (sdr) showed a quasi-normal distribution, with no appreciable pattens (Darbin-Watson test=1.88), and one possible outlier (sdr= -4.53). The leverage (Hi<0.1), the COOK’s distance (<0.2) and DIFTTS (<I0.5I) did not show any infl uential observation. For the coded POCD the coeffi cient beta was = -1.95, std.error of beta= 1.3, t= -1.51, P= 0.13. This indicated that there were no statistically signifi cant differences between the regression lines of the two POCDs. For both POCDs the absolute difference (bias) was less than +/-10 mg/dL for glucose values <75 mg/dL and the relative difference (relative bias) was less than =/-20% for all glucose values =/>75mg/dL and +/-10% for 90% of glucose values =/>75mg/dL. Conclusions:The results of the MWLSR analysis indicated that the relationship between POCDs and the LM was linear in the interval 40 - 500 mg/dL, that there were no statistically signifi cant differences between the regression lines of the two POCDs and that the differences between the glucose values obtained with the POCDs and those as obtained with the laboratory method were acceptable for the intended clinical applications, namely rapid estimate of patient blood glucose values and patient response to insulin therapy. Multivariable regression analysis techniques are appropiate for evaluating the performance of multiple methods to that of a comparative method. The harmonization of methods promotes seamless evaluation of sequential patient values for individual analytes. Finally, to support the implemention of multivariable statistical analysis techniques appropiate statistical software and electronic transfer of observations should be available to the Laboratorian.
B-53
Multi-center performance evaluation of the Cobas® b 101 Point-of-Care system
J. Ordonez-Llanos1, S. Martinez-Couselo1, M. Fischler2, P. Koch2, J. Muser3. 1Hospital de Sant Pau, Barcelona, Spain, 2Stadtspital Waid, Zürich, Switzerland, 3Kantonsspital Liestal, Liestal, Switzerland
Background: The cobas b 101 (Roche Diagnostics) is a new point-of-care (POC) system for the quantitative measurement of HbA1c, total cholesterol (TC) and triglycerides (TG) and high density lipoprotein cholesterol (HDL) by single use discs.Aim: To evaluate the analytical performance and practicability of the cobas b 101 in three hospitals both at clinical sites and at clinical laboratories.Methods: The study was performed by healthcare professionals (doctor’s assistants, nurses) at two clinical POC sites (Barcelona, Zürich) and by laboratory professionals at a central laboratory (Liestal). The assessment included experiments for precision (repeatability and intermediate precision) evaluated according to CLSI guidelines, method comparison with a certifi ed laboratory method (cobas c 501, Roche Diagnostics) ‒evaluating total error for lipids according National Cholesterol Education Program criteria‒ and with similar POC devices (Siemens DCA Vantage, Cholestech LDX), lot-to-lot assessment, and confi rmation for usage of different sample matrices accepting a maximal deviation of 10% against the reference matrix (K2-EDTA). The practicability of the cobas b 101 for usage by healthcare professionals was evaluated utilizing a detailed questionnaire. Reliability and robustness were assessed during the complete evaluation phase.Results: Daily measurements of controls with concentrations within or exceeding reference ranges confi rmed the stability and accuracy of the analyzer by always providing results within defi ned ranges. The median bias ranged from -1.9 to 3.7% for HbA1c, from -6.4 to -0.7% for TC, from -1.2 to 6.8% for HDL, and from -5.4 to 0.9% for TG. Results from used reference materials (IFCC, NIST) also confi rmed the accuracy (Bias between -2.07 and 2.52% for HbA1c, -2.8 and 3.8% for TC and -6.5 and 5.1% for TG) of the analyzer. Parallel performed measurements on the reference system cobas c 501 yielded similar results. Obtained CV’s for controls and human

Point-of-Care Testing Tuesday, July 30, 9:30 am – 5:00 pm
CLINICAL CHEMISTRY, Vol. 59, No. 10, Supplement, 2013 A185
samples, comprising different concentration levels, ranged 0.4 to 2.5% for HbA1c and 0.6 to 4.4% for lipids and demonstrating good precision. Method comparisons versus Roche cobas c 501 demonstrated close and highly signifi cant agreement. Total error over the combined sites was less than 7% for HbA1c, 3% for TC, 8% for HDL and 11% for TG. Results of performed lot-to-lot assessment and sample matrix assessment (capillary and venous whole blood, plasma) also showed good agreement. The quality of experimental data was comparable among the evaluation sites emphasizing reproducibility and accuracy of the cobas b 101 analyzer. A total of 78 errors (0.96%) existed in 8162 cobas b 101 measurements. Practicability was rated as easy to use by healthcare professionals; the design of system and disc, the low sample volume, and the routine workfl ow requiring no calibration activities were positively rated.Conclusions: The analytical performance of the cobas b 101 analyzer was fully suitable for its clinical use. Main advantages of the instrument are ease of use and convenience of handling, small sample volumes, usability of various sample types and calibration free system. Accordingly, the analyzer is a useful tool for monitoring HbA1c and the main lipid constituents in POC settings.
B-54
Development of a handheld multiplex point of care diagnostic for differentiation of Lassa fever, Dengue fever and Ebola Hemorrhagic Fever
A. Jones1, M. Boisen1, R. Radkey2, R. Blidner2, A. Goba3, K. Pitts1. 1Corgenix, Inc., Broomfi eld, CO, 2Nanomix, Inc, Emeryville, CA, 3Lassa Fever Program Kenema Government Hospital, Kenema, Sierra Leone
Background: Lassa virus is a zoonotic virus causing severe disease and hemorrhagic fever (HF), infecting hundreds of thousands of people each year. Dengue virus is a pandemic mosquito born virus causing 50-100 million infections and several hundred thousand cases of HF each year. Ebola virus infection is rare but severe and a cause of HF with sporadic outbreaks in Central Africa. The symptoms and causes of HF can be diffi cult to distinguish but necessitate different treatment, isolation and epidemiological responses. There is a clear need for diagnosis of viral HF in endemic and austere environments, in military zones or biothreat scenarios. We have developed the Nanomix POC IVD Panel, a handheld electronic, carbon nanotube biosensor multiplex assay for the detection of Lassa, Dengue and Ebola virus hemorrhagic fevers.Methods: The POC IVD Panel assay consists of a reader/processor and sealed, disposable assay cartridges containing the necessary biological and chemical reagents. Cartridges were prepared with reaction pads coated with capture antibodies specifi c for Lassa, Dengue and Ebola. Low volume samples were mixed with a reporter pellet containing lyophilized HRP-conjugated antibodies and injected into the cartridge. The reader/processor performed the assay and wash steps and reported nano-voltage results in ten minutes. Lassa positive samples were also assayed with the ReLASVTM Lassa antigen detection ELISA. Samples included non-infectious recombinant proteins (Lassa, Ebola), inactivated viral culture supernatants (Dengue) and infectious human samples collected at Kenema Government Hospital, Sierra Leone.Results: Lassa, Dengue and Ebola antigens were successfully detected with the assay with no cross reactivity. The mean voltage of Dengue antigen positive samples was 1417 compared to mean voltages less than 50 for LASV negative and malaria positive samples, p<0.0001. The mean of Ebola antigen positive samples was 3208 compared to means below 100 for negative control, Lassa negative and Malaria positive samples, p<0.0001. Lassa fever patient serum and plasma samples show strong specifi c Lassa signals. The mean of Lassa positive clinical samples was 5267 as opposed to means of 163 and 58 for negative and malaria positive samples, p<0.0001. The optical density results from the ReLASVTM ELISA correlated well with voltage results on the POC assay. Multiple antigens can be detected in single spiked patient samples. When Lassa and Dengue antigens are co-detected, the mean voltages are 8838 and 1167 respectively. When Ebola and Lassa antigens are co-detected, the mean voltages are 3092 and 3350. No interference or cross reactivity was observed in patient samples positive for Malaria antigen, or Chickungunya and Dengue antibodies or patients treated with ribavirin.Conclusion: We successfully detected hemorrhagic fever viruses in a rapid, multiplexed point of care assay. Lassa, Dengue and Ebola antigens were specifi cally detected singly or mixed in a variety of human samples. Operation of the assay was not affected by antigen and antibodies specifi c for other infectious diseases or treatment with antivirals. Further development of the device will entail defi nition of normal and cut-off levels, optimization of antibody pairs and cartridge assembly, optimization of sensitivity and further testing on authentic infectious human samples.
B-55
Evaluation of the analytical performance of the EPOC blood gas and electrolyte analyzer in a Pediatric Hospital
R. Shafi 1, R. Edwards2, J. Thomas2, L. Collymore2, T. Hill2, S. Devaraj3. 1Baylor College of Medicine, Houston, TX, 2Texas Children’s Hospital, Houston, TX, 3Baylor College of Medicine and Texas Childrens Hospital, Houston, TX
Background: The EPOC system is a new point of care blood gas and electrolyte analyzer. We evaluated the analytical performance of this new system with respect to precision and accuracy and compared our EPOC analyzer results to those obtained using the point of care i-STAT method and the gold-standard Radiometer ABL blood gas analyzer.Methods: Evaluation studies were performed as per the NCCLS guidelines and included intra and inter assay precision and accuracy, linearity and comparison with i-STAT and Radiometer ABL-635. Analytical and concordance analyses were performed as well as regression analyses using the methods comparison data.Results: Intra and inter assay coeffi cient of variation (CV) for each analyte was calculated and was less than 6% for all analytes in the ranges tested including pH (Range: 7.027- 7.661), pO2(Range: 61.6-193.8 mmHg), pCO2 (Range: 19.9-75.8 mmHg), Na+ (Range: 112-164 mmol/L), K+( Range: 2.0-6.0 mmol/L), Ca++( Range: 0.65-1.49 mmol/L), glucose (Range: 40-251 mg/dL), lactate (Range: 0.87- 6.24 mmol/L) and Hct(Range: 19-47 %PCV). All of the analytes were linear across the reportable range.For the methods comparison of EPOC system with the i-STAT method, the correlation coeffi cients were r>0.94 for all analytes with the exception of Ca++ (r=0.61). The latter may be attributed to the very narrow range of values tested.For the methods comparison of EPOC system with the gold standard ABL-635, the correlation coeffi cients were >0.97 for all analytes with the exception of Hct and hemoglobin (Hb) (r= 0.8). This fi nding may be attributed to the different principles used by the EPOC and ABL systems.Conclusion: Thus, in our pediatric hospital setting, the EPOC system showed excellent precision and accuracy and its assay results compared favorably with the i-STAT and Radiometer ABL-635 assay results. These fi ndings, together with the low cost, room temperature storage of test cards, availability of metabolites like lactate and glucose and the wireless connectivity of the EPOC system provides an operational advantage over other point-of-care blood gas analyzers currently available.
B-56
The importance of evidenced second dosage of CK-MB activity and cardiac troponin I in emergency departments
M. C. Feres, P. Bizon, G. Libanori, M. C. De Martino, P. G. Campana, S. Tufi k, D. Poyares. Associacao Fundo de Incentivo a Pesquisa, Sao Paulo, Brazil
Background: There is a constant concern for the performance of biochemistry cardiac markers and prognostic values especially when there are not changes in the ST segment on the electrocardiogram (ECG), used in the diagnosis of acute myocardial infarction (AMI) and other cardiac events in emergency departments.The aim of this study was to evaluate the performance of serial measurements of CK-MB activity is still used in protocols of hospitals with fewer resources, and comparison with cardiac Troponin I (cTp I) in the diagnosis of AMI in emergency departments.Methods: 2504 results were analyzed from 1493 patients retrospectively with requests dose of CK-MB activity with cardiac troponin I (cTp I) combined, originating from 30 units of public emergency of our city, and which were quantifi ed in a single laboratory, the one year period (July 2010 to July 2011). Patients had a mean age of 63.24 years and was composed of 42.65% (n = 637) of women and 57.34 (n = 856) of men. All samples were collected on admission of the patient to the emergency department. Statistical analysis was performed on the basis of pre-established cut-off for comparison between methods, we used the t test for independent samples, relative risk ratios for dependent samples (Friedman and McNemar) and the index of signifi cance was of less than 5%.Results: The data showed that the 2504 results analyzed of 1493 patients, 1006 cases (68%) had only one measurement of CK-MB activity and cTp I, while 487 cases (32%) had serial measurements. The average concentration of CK-MB activity and cTp I were signifi cantly higher in men compared with women (p <0.001) for both

Tuesday, July 30, 9:30 am – 5:00 pm Point-of-Care Testing
A186 CLINICAL CHEMISTRY, Vol. 59, No. 10, Supplement, 2013
markers. The ROC curve shows confi dence interval of 95%: 0.62 to 0.68 of the CK-MB activity to diagnostic in function of cTp I and confi dence interval of 95%: 0.65 to 0.72 of the cTpI on CK-MB activity. The data showed that among patients possessed only the fi rst test for markers in hospitals analyzed, 516 cases had CK-MB activity, with normal cTp I, 104 with changes in both markers, 20 cases with values within the normal range for both and others remaining within the limits of risk. For those who had serial measurements, the data showed that 69.6% of patients with CK-MB activity, normal in the fi rst test, had positive results in the second measure. The adjusted residual analysis shows that, among patients with cTp I changed in the fi rst test, 62.1% had CK-MB activity within the normal range.Conclusion: More than half of patients admitted with AMI were positive in the second dose of CK-MB activity. The cTp I signifi cantly higher positivity for diagnosis compared with serial measurements of CK-MB activity. Positive results were predominant in males. For emergency services that utilize the strengths of CK-MB activity, emphasizes the importance of serial measurements necessarily to increase the detection of the method, especially in women. And the more worrying that 68% of patients seen had only one measurement of cardiac markers. Would they have been released or transferred to other hospitals...
B-57
Thromboelastometry analysis and management of life-threatening hemorrhage in multifocal bleeding: a case report
A. I. Alvarez-Rios, J. Romero-Aleta, B. Pineda-Navarro, J. A. Noval-Padillo, J. M. Guerrero. H.U. Virgen del Rocio, Sevilla, Spain
Background:The thromboelastometry (TEM) is a diagnostic method whose purpose is the detection, within a few minutes, of the hemostasis alterations that may have an impact on coagulation. A TEM equipment has been introduced to the surgical area of our hospital. It is a device that measures the viscoelastic properties of blood dynamical and globally. It is based on measuring the elasticity of the blood by charting the consistency of a clot during its formation and later fi brinolysis. It is also the “gold standard” for studying the fi brinolysis. TEM has been used in different clinical areas where implementation has caused a major change in the attitude of anesthesiologists and intensivists, who have daily contact with bleeding disorders. Shore-Lesserson et al. showed that the routine use of TEM, implies a reduction in the transfusion of blood products compared to standard care, based on routine laboratory testing in patients undergoing major cardiovascular surgery. This implies a reduction in costs and unnecessary exposure of the patient to blood and its derivatives. Objective: To describe a case report of multifocal hemorrhage after fi brinolytic therapy for acute myocardial infarction (AMI) which was fi nally treated as directed by a TEM study.Methods:A 55 year-old man with a history of ischemic heart disease with expression of AMI and peripheral artery disease that presented spontaneous intracerebral hemorrhage with moderate intraventricular component, acute hydrocephalus and subarachnoid hemorrhage in the context of previous AMI which was treated with fi brinolysis, triple antiplatelet and anticoagulation rescue percutaneous angioplasty. The patient, during his evolution, presented multifocal bleeding with hematemesis, hematuria, gingival bleeding, and hemodynamic instability. The intensivists contacted to our laboratory and asked for a TEM study to discard fi brinolysis as the fi rst cause of bleeding.Results:After the study, data discarded persistent fi brinolysis (continuous graphical recording of the consistency of a clot during coagulation did not show that the maximum fi rmness of the clot did not decrease) and defi cit of fi brinogen (FIBTEM was normal) as causes of bleeding. We did not observe the lengthening of coagulation time nor maximum fi rmness of clot. The cause of the bleeding was primarily due to platelet dysfunction. In view of these data, the patient was treated with platelet transfusions presenting a favorable clinical course.Conclusion: The knowledge of the function of patient coagulation is essential for the proper management of bleeding. The study by TEM facilitates, within a few minutes, data that allow us to manage and treat major hemostatic alterations, avoiding patient exposure to blood products unnecessarily and reducing economic costs.
B-58
Affect of format on ability to conduct and interpret home pregnancy tests by untrained users
J. Pike, S. R. Johnson. SPD Development Company Ltd., Bedford, United Kingdom
Background: Clinical analytical tests are now often being marketed to untrained people, in formats normally only used in the laboratory environment. For example, although many home pregnancy tests are designed to be used by women with no training, direct copies of laboratory tests in strip and cassette formats are also available. The objective of this randomised study was to determine whether these types of tests could be used accurately by a lay-person, in comparison to tests specifi cally designed for home use. It is important to challenge the assumption that tests formatted to be simple to use by trained individuals in a clinical environment, such as simple strips or cassette styles which require pippetting of sample, can also be used by lay people in the home environment. Therefore it is of relevance to investigate how the affect of environment and training can infl uence test accuracy.Methods: Pregnancy tests of different formats (digitally read midstream test, visually read midstream test, budget visual midstream test, strip test and cassette test) that are available to purchase from pharmacies, were tested by lay women (n=112) in their own homes. The women completed questionnaires regarding their ability to conduct the test. The same women then attended a study centre where they conducted the same tests on standards (0, 25, 50mIU/ml hCG) and were observed by a trained technician. Technicians also performed the same testing on standards. Accuracy of test results was determined for each format. Additional questionnaires were completed regarding study conduct. All testing was randomised.Results: Despite strip and cassette tests only being suitable for use with collected urine samples, women still tried to use these tests in-stream when testing at home (n=9 for strips and n=1 for cassette). With midstream tests, where there is an option for in-stream testing, most women chose to test in-stream (80-86% for the different midstream formats). When women used the tests at the study centre observed by a technician, many mistakes in testing were observed, for example, not dipping for the required amount of time. Accuracy of women reading the correct result was 99% for digital midstream, 97% for visually read midstream, 75% for budget midstream, 69% for cassette and 59% for strip test. Women reported the midstream tests as being easier to use and read.Conclusion: Laboratory format pregnancy tests are not suitable for at home use because women can not use the tests correctly, nor interpret the results. This is likely to be due to lower ease of use of these formats and also problems with interpretation of instructions for use. These types of tests should only be used by laboratory professionals. Only tests formatted to facilitate use by untrained people, with simple to understand instructions, should be available for home use.
B-59
Point-of-Care Testing (PoCT) for decentralised testing of lipids: independent evaluation protocol of a PoCT device
L. Rossi1, L. Della Bartola2, O. Giampietro2, E. Matteucci2. 1Azienda Ospedaliera Pisana, Laboratorio Patologia Clinica, AOUP, Italy, 2Pisa University, Dept Clinical and Experimental Medicine, Pisa, Italy
Background: PoCT decentralised laboratory testing is performed at sites of immediate patient care and its results are used for clinical decision-making. Quality control is required to ensure that PoCT laboratory testing is high quality and cost effective, in order to contribute to optimal patient care. Few studies have assessed the clinical agreement between lipid PoCT results compared to laboratory results. The aim of this study is to evaluate the accuracy and precision of PoCT devises for lipid screening compared with laboratory lipid test results in healthy subjects and patients with dyslipidaemia.Methods: 2 CardioChek PA Analysers (CCA) (PTS, Indianapolis, USA), which employ light refl ectance to measure enzymatic chemical reactions using PTS PANELS Lipid Panel test strips to measure total cholesterol, HDL cholesterol and triglycerides in whole blood, were evaluated on 20 consecutive days by designed quality control kit (ChekMate) and PTS Panel Quality Control materials. Fasting venous samples from 50 subjects were analysed on both CCA whose results were compared with the routine clinical laboratory assay of plasma lipids (COBAS 6000, Roche Diagnostics, Milano, Italy). Fasting fi nger-stick samples of 25 subjects were analysed on one CCA device and compared with laboratory venous results.

Point-of-Care Testing Tuesday, July 30, 9:30 am – 5:00 pm
CLINICAL CHEMISTRY, Vol. 59, No. 10, Supplement, 2013 A187
Results: There was no statistically signifi cant difference between portable measurements of total cholesterol, HDL cholesterol, and triglycerides vs. clinical laboratory results using paired Student t test. Capillary values of total cholesterol, HDL cholesterol, and triglycerides well correlated with laboratory results on venous blood (r from 0.96 to 1.0, p<0.001). Within-run variation coeffi cient was 1.8 and 0.8% (total cholesterol 146±3 and 275±2 mg/dl, respectively), 8.3 and 3.8% (HDL cholesterol 29±2 and 78±3 mg/dl), 2.3 and 1.1% (triglycerides 153±3 and 126±1 mg/dl).Conclusion: Preliminary results suggest that CCA provides suffi ciently high-quality results. At it completion, in order to validate lipid measurements with the PoCT analyser, the quality evaluation protocol intends to recruit 200 subjects (venous blood) and 80 subjects (capillary blood) in addition to determining repeatability (within-run precision) of portable measurements at multiple plasma lipid levels.
B-60
Evaluation of the NOVA StatStrip Glucometer in a Pediatric Hospital Setting
M. G. Lockyer1, K. Fu1, R. M. Edwards2, L. Collymore2, J. Thomas2, T. Hill2, S. Devaraj1. 1Baylor College of Medicine, Houston, TX, 2Texas Children’s Hospital, Houston, TX
Background: Routine point-of-care (POC) glucose monitoring in the pediatric setting has become increasingly important, both for assessing hypoglycemia as well as hyperglycemia. In addition, a reliable and precise system is required to monitor pediatric patients, whose blood volumes are much less than adults, and require close monitoring. The aim of this study was to evaluate the Nova Biomedical StatStrip POC glucometer against the Roche ACCU-CHEK Inform in lieu of ourcurrently used LifeScan SureStep Flexx POC glucose analyzer, since the latter was being pulled out of hospitals. Also, we compared POC glucose using these analyzers with the central laboratory analysis of glucose using the Vitros 5600.Methods: Inter-assay and intra-assay precision, linearity, interference and concordance studies were perfromed as per the NCCLS criteria. The NOVA StatStrip glucometer demonstrated an excellent coeffi cient of variation for glucose across the entire analytical measurement range (<5%) and linearity. An analysis of 40 pediatric samples across the linearity ranges of all the meters was used to assess concordance between the systems.Results: The Nova StatStrip platform had the best overall performance and showed excellent concordnace with the Vitros system (r=0.99), while glucose levels were signifi cantly different between the Roche POC system and the Vitros. In addition, we evaluated the effect of hematocrit (20-60%)and maltose (0.25-5.5mM) on the glucose results, anddiscovered that the Nova StatStrip system performed the best with little to no interference by either.Conclusion: The Nova StatStrip system gave the best performance with acceptable imprecision, good agreement with the central lab, and minimal to no interference from hematocrit levels or maltose. The Nova StatStrip is a satisfactory replacement for our point-of-care glucometer system. It additionally provides results in less time (just 6 seconds), utilizes a lower amount of blood, and has the advantage of being immediately interfaced to our laboratory information systems.
B-61
The effect of maternal blood on the performance of the AmniSure ROM Test (PAMG-1) and the ROM Plus Test (AFP & IGFBP-1) for the diagnosis of premature rupture of the fetal membranes (PROM)
E. Sabio. Citrus Valley Health Partners, West Covina, CA
OBJECTIVE: To determine at what percentage admixture of maternal blood plasma in a saline solution-based sample, 50% of the AmniSure ROM Tests, read at 5 and 10 minutes, and 50% of the ROM Plus Tests performed will turn positive.INTRODUCTION: Vaginal bleeding may occur in over one third of patients presenting with signs and symptoms of PROM. This can pose a threat for obtaining an accurate PROM diagnosis using biomarker tests because the concentrations of PAMG-1, AFP and IGFBP-1 in maternal blood can be above the thresholds of the respective tests. The AmniSure ROM Test and the ROM Plus Test have comparable FDA cleared sensitivities (98.9% and 99%, respectively); however, a signifi cant difference lies between their FDA cleared specifi cities (98.1% and 75%, respectively).
Methods: Human blood was obtained from pregnant patients who had a gestational age greater than 34 weeks. The blood samples were centrifuged to remove the red blood cells from the sample, and the plasma was collected for testing. Two 0.5 ml samples were made for each patient by mixing the plasma with 0.9% normal saline to give the following percentages of plasma: 5%, 10%, 15%, 20%, 25%, 30%, 40%. The samples from each patient were tested using the AmniSure ROM Test and the ROM Plus Test in accordance with their respective package inserts. Results were interpreted at 5 minutes and at 10 minutes for the AmniSure ROM Test and between 5-20 minutes for the ROM Plus Test as follows: a score of 0 was recorded if no line was present (invalid), 1 was recorded if one line was present (negative), and a 2 was recorded if 2 lines were present (positive).Results: In total, 113 AmniSure ROM Tests and 98 ROM Plus Tests were performed on 19 different donors. At the 15% level, the ROM Plus test turned positive in 50% of cases, while at the 30% dilution level 50% of the AmniSure ROM Tests (read at 10 minutes) turned positive and at the 60% dilution level 50% of the AmniSure ROM Tests (read at 5 minutes) turned positive.Conclusion: The ROM Plus Test is more likely than the AmniSure ROM Test to provide a false positive result in the presence of blood. This fi nding further reinforces the FDA warning on the labeling of the ROM Plus Test regarding the test’s specifi city. In samples with only a 15% admixture of maternal blood plasma (a likely concentration in the clinical setting), the ROM Plus Test has a 50% chance of giving a positive result while the AmniSure ROM Test has only a 7% chance when read at 10 minutes, and a 0% chance when read at 5 minutes.
B-63
Correlation of hemoglobin and hematocrit on Abbott i-STAT and Beckman Coulter LH500 on patients undergoing cardiopulmonary bypass
T. W. Kieffer1, M. Oliver2, M. K. Zimmerman1. 1Indiana University School of Medicine, Indianapolis, IN, 2Indiana University Health, Indianapolis, IN
Background: To response to comments from our cardiovascular surgeons and blood bankers that hemoglobin/hematocrit (Hb/Hct) performed on the Abbott i-STAT generally trended lower than those performed on the laboratory analyzer (Beckman Coulter LH500), we undertook this study to correlate Hb/Hct results on patients undergoing cardiopulmonary bypass (CPB).Methods: Whole blood samples from thirty patients were collected at the following stages: Pre-pump, On-pump#1, On-pump#2, Post-pump. The on-pump samples were collected at two different time intervals. All samples were fi rst run on the CPB operating room i-STAT. Pre-pump and post-pump samples were then transferred to lithium heparin tubes; on-pump samples were transferred to red-top tubes because of the heparin content already present in the specimen. Samples were then immediately sent via pneumatic tube to the stat laboratory for analysis. Deming regression and a paired t-test were performed using EP Evaluator® software (Build 10.0.0.517, Data Innovations, LLC).Results: 24 Pre-pump, 29 On-pump#1, 28 On-pump#2, and 27 Post-pump specimens were received.Pre-pump: LH500 Hb range was 7.7-13.9 g/dL; Hb mean+standard deviation (SD), 11.42+1.74 g/dL; Hct range, 23.0-42.3%; Hct mean+SD, 34.06+5.33%. i-STAT Hb range was 7.8-14.6 g/dL; Hb mean+SD 11.23+1.83 g/dL; Hct range, 23.0-43.0%; Hct mean+SD, 33.04+5.43%.On-pump #1: LH500 Hb range was 5.3-11.5 g/dL; Hb mean+SD, 8.56+1.92 g/dL; Hct range,15.6-34.8%; Hct mean+SD was 25.06+5.54. i-STAT Hb range was 5.4-11.9 g/dL; Hb mean+SD, 8.54+1.81 g/dL; Hct range, 16.0-35.0%; Hct mean+SD, 25.17+5.35.On-pump #2: LH500 Hb range was 5.5-11.7 g/dL; Hb mean+SD, 8.91+1.51 g/dL; Hct range, 16.3-34.3%; Hct mean+SD, 26.04+4.44%. i-STAT Hb range was 5.8-11.9 g/dL; Hb mean+SD, 8.76+1.39 g/dL, Hct range,17.0-35.0%; Hct mean+SD, 25.79+4.11%.Post-pump: LH500 Hb range was 7.5-11.5 g/dL, Hb mean+SD was 9.36+1.24 g/dL; Hct range, 21.3-33.9%; Hct mean+SD, 27.01+3.60%. i-STAT Hb range was 7.5-12.6 g/dL; Hb mean+SD, 9.53+1.24 g/dL; Hct range, 22.0-37.0%; Hct mean+SD, 28.00+3.63%.Regression analysis: On both the LH500 and i-STAT, Hb/Hct slopes ranged between 0.9-1.1 with intercepts, between -1.6 to 1.8. Correlation coeffi cients were >0.9500 except for Post-pump Hb/Hct, which were 0.8502 and 0.8982, respectively. The bias was negative for Pre-pump Hb (-0.19g/dL), On-pump#1 Hb (-0.01g/dL), On-pump#2 Hb (-0.15g/dL), Pre-pump Hct (-1.02%), and On-pump#2 Hct (-0.25%). The bias was positive for Post-pump Hb (0.16g/dL), On-pump#1 Hct (0.11%), and Post-pump Hct (0.99%).

Wednesday, July 31, 9:30 am – 5:00 pm Point-of-Care Testing
A188 CLINICAL CHEMISTRY, Vol. 59, No. 10, Supplement, 2013
Paired t-test: The p value was <0.01 on pre-pump Hct (p <0.001) and post-pump Hct (p 0.004) only.Conclusion: This study is limited by small sample size and by the mean Hb/Hct concentrations being above the transfusion trigger limit of 7g/dL or 21%. There appears to be a statistical difference between i-STAT and LH500 Hct results in during some stages of CPB surgery. The clinician’s and blood bankers concern that the i-STAT Hb/Hct has a negative bias is indeed generally correct, though the clinical signifi cance or impact on whether or not to transfuse appears to be minor during surgery. Of more concern is the Post-pump Hb/Hct result. The positive bias could falsely reassure clinicians into thinking that the patient’s oxygen carrying capacity is greater than what is truly present.
B-64
Analytical Evaluation of the Quantum Blue High Range Point of Care Rapid Test for Fecal Calprotectin
J. E. Raizman, T. Teodoro-Morrison, B. R. Hoffman. Mount Sinai Hospital, Toronto, ON, Canada
Objective: To evaluate calprotectin distribution in stool, calprotectin stability in stool and stool extracts, and analytical performance of the Quantum Blue® high range fecal calprotectin rapid test (Buhlmann) marketed for the management of established infl ammatory bowel disease (IBD). Methods: Fecal calprotectin was processed and measured in a 30-minute 2-step incubation protocol according to manufacturer’s instructions using the Smart-Prep device (Roche) to collect a consistent amount of stool for testing. The effect of varying incubation duration and temperature was evaluated, as was sample stability to freeze-thaw and storage of the extract at 4°C. Linearity was assessed by serially diluting an elevated fecal extract. Imprecision was determined both with purchased liquid QC material directly applied to the test device and with multiple frozen specimens of stool obtained from a single bowel movement of an individual with IBD. This same stool was sampled in triplicate at 6 different sites to assess the homogeneity of calprotectin distribution by one way ANOVA. Results: The assay result was unaffected by extended incubation of fecal extract for 3 hours in extraction buffer at room temperature or by an extra 10 minute incubation on the lateral fl ow test device prior to measurement. However, extending the incubation in chase buffer beyond an extra 5 minutes from the 10 minute target increased the measured result by more than 50% indicating the need to tightly adhere to manufacturer’s protocol. Results tended to be higher when the procedure was carried out using buffers and lateral fl ow devices just taken from 4°C storage as opposed to being fi rst warmed to room temperature, but the increase did not reach statistical signifi cance (p=0.059 low QC, p=0.28 high QC). Calprotectin was stable to 2 days storage in extraction buffer at 4°C but continued to increase when the stool sample was repeatedly frozen and thawed. One way ANOVA generated from multiple samplings at different sites indicated that calprotectin was homogeneously distributed throughout the stool (F statistic 2.1 vs critical limit of 3.1; p=0.13; total CV 25%). Longitudinal testing over 11 days (2 kit lots) with ready to use QC (360 and 800 microgram calprotectin per gram stool) yielded CVs of 25% with a number of the values lying outside the target range provided by the manufacturer. Twelve discrete frozen stool specimens tested over 5 days yielded a CV of 20% at 900 μg/g. The method was reasonably linear (8 different dilutions, r-squared 0.9) when tested from 200 to 1650 μg/g [claimed dynamic range 100-1800]. Conclusions: Precision is of the order of 25% meaning that the test on occasion will be unable to differentiate a 100% concentration change. Against this backdrop, the distribution of calprotectin in stool from one bowel movement was homogeneous, thereby enabling the use of multiple frozen aliquots of the stool as a homemade “realistic” QC material. Overall, we found analytical performance of the Quantum Blue fecal calprotectin Rapid Test was acceptable for its intended use in the clinic to manage IBD.
B-65
Precision Performance and Error Types observed in the Point-of-Care Glucose Testing: An External Quality Assessment Program Perspective
B. Aslan1, J. Stemp1, P. Yip2, J. Gun-Munro1. 1Ontario Medical Association, Quality Management Program - Laboratory Services, Toronto, ON, Canada, 2University of Toronto and University Health Network, Dept of Laboratory Medicine and Pathobiology, Toronto, ON, Canada
Background: Point of care (POC) glucose tests offer opportunities for decreased test turnaround times and sample volumes. However, quality assurance of POC testing is challenging for many institutions and little data is available on associated errors. This study is aimed to describe precision performance and error rates and causes that occurred in Quality Management Program - Laboratory Services (QMP-LS) POC glucose profi ciency testing (PT) data in comparison with laboratory glucose surveys.Methods: Data from Ontario hospitals were assessed on 51379 POC glucose results from 194 institutions in 12 PT samples and laboratory glucose data on 2661 results from 179 institutions in 16 PT samples over 21 months during September 2009 and June 2011. Commercially prepared bovine plasma products and fresh human serum samples were used as PT material in POC and laboratory glucose surveys respectively. Peer group means and CVs were estimated using the ISO recommended robust algorithm. Allowable performance limits (APLs) for POC glucose were ±1.0 mmol/L if ≤5 mmol/L or 20% if >5 mmol/L, and for laboratory glucose ±9% if ≤4 mmol/L or ±7.5% if > 4 mmol/L. Laboratories with recurrent fl ags and large deviations from the assigned value were required to submit investigations to report the causes of the fl ags.Results: The median of the POC glucose peer group CVs (4.5%; range 0.8%-14.5%) was higher than the median CV obtained in laboratory glucose peer groups (1.6%; range 0.6%-3.2%) at glucose concentrations of 4.6 - 17.9 mmol/L based on a total of 166 and 179 assessments by peer group in the POC and laboratory glucose surveys, respectively. The median of the number of participants in the POC and laboratory glucose peer groups were 54 and 9, respectively. All reported laboratory glucose results were within the acceptable limits and no fl ags occurred despite the tighter APLs used. However, 305 (0.6%) results exceeded APLs in the POC glucose surveys. Investigations from 277 (0.5%) results reported pre- and post-analytical errors that accounted for 77% of the discordant fi ndings. Using wrong PT items, sample mix-up on the bench, reporting results for wrong samples were the most frequent reasons, while 20% of discordant fi ndings identifi ed manufacturer issues, and 3% were of unknown origin. If laboratory glucose APLs had been applied to POCT glucose results, 6888 results (13%) would have been fl agged.Conclusions: POC glucose errors vastly outnumbered any errors associated with laboratory glucose measurements. Additionally, the high imprecision refl ects the looser performance criteria permitted for POC glucose testing (±20% compared to laboratory reference values). Although this study is based on PT samples and inter-laboratory data, the fi ndings could approximate the various errors encountered within hospitals when testing patients. In order to decrease pre- and post-analytical errors that are frequent in POC testing, greater attention is needed in the training of personnel and taking precautions to prevent transcription errors. Lastly, tighter analytical requirements for glucose meters are needed to serve hospital patients especially when POC results are used interchangeably with laboratory values.
B-66
Evaluation of Dialysate Fluid* on the Siemens RAPIDPoint 500 Blood Gas System
N. Greeley, C. Savignano. Siemens Healthcare Diagnostics, Norwood, MA
Introduction: Dialysis is a treatment for patients who exhibit later-stage kidney failure or chronic renal insuffi ciency. This treatment is used to clean the blood by removing wastes, such as urea and creatinine, as well as excess fl uid from the body.Dialysate fl uid* is a concentrated aqueous solution that is used in hemodialysis to fi lter the blood. In healthy patients, the kidneys maintain the body’s internal equilibrium of water and minerals, including sodium (Na+), potassium (K+), chloride (Cl-), and calcium (Ca++), which can be measured by the Siemens RAPIDPoint® 500 Blood Gas System.Methods: Test methods were adapted from the Clinical Laboratory Standards Institution Method Comparison and Bias Estimation Using Patient Samples (CLSI EP09-A2). Dialysate fl uid samples (altered and unaltered) that spanned the analytical range for each analyte were evaluated on RAPIDPoint 500 systems, RAPIDLab® 348 systems, the Roche Diagnostics AVL® 9180 Series Electrolyte Analyzer, and the Nelson Jameson 926S® Chloride Meter.

Point-of-Care Testing Wednesday, July 31, 9:30 am – 5:00 pm
CLINICAL CHEMISTRY, Vol. 59, No. 10, Supplement, 2013 A189
Results: Deming regression analysis comparing the RAPIDPoint 500 system to the predicate devices for the analyte(s) of interest passed acceptance (see Table 1).Conclusions: Method comparison testing showed that Na+, K+, Ca++, and Cl- results on the RAPIDPoint 500 system operated in dialysate fl uid mode were substantially equivalent to those on the predicate devices.Table 1: Method Comparison Results for Na+, K+, Ca++, and Cl-
RP500 vs. RL348n Slope R2 Sy.x
Na+ 137 1.010 0.9988 -1.21K+ 131 1.005 0.9994 -0.020RP500 vs. AVL9180Na+ 132 0.980 0.9976 1.77K+ 125 1.030 0.9983 -0.115Ca++ 135 0.970 0.9976 -0.051RP500 vs. 926SCl- 263 1.010 0.9975 -0.60Footnotes1 Not available for sale in the US. Product availability varies by country.
B-67
Clinical and Analytical Evaluation of Three POCT Glucose Meters
J. L. Shaw1, M. P. A. Henderson1, L. Oliveras2, C. Seguin2, T. Moran2, S. L. Perkins1. 1The Ottawa Hospital and The University of Ottawa, Ottawa, ON, Canada, 2The Ottawa Hospital, Ottawa, ON, Canada
Objective: To evaluate the clinical usability and analytical performance of three POCT glucose meters. Input from clinical end users is rarely collected as part of instrument evaluation. Here, a novel approach to collection and analysis of these data is presented as well as the results of an in-depth analytical evaluation.Methods: Three commercial glucose meters, the Abbott Precision Xceed, Nova StatStrip and Roche Accu-Check Inform II, were evaluated by end users including nurses and nurse educators (n=82) from nine clinical areas across three campuses, including infection control. Respondents were given a demonstration of and the opportunity to operate each meter. Users were asked to numerically score the meters on the following criteria: meter size, shape and weight, screen size and readability, ease of operation, battery life, docking requirements, ease of cleaning, login screen, electronic entry, ease of performing quality control (QC), strip opening and insertion, sample application and time to result.The analytical performance of each meter was assessed according to CLSI guidelines (EP5, 6 and 9) including: imprecision, linearity, interferences (β-hydroxybutyrate, ascorbic acid, bilirubin, galactose, hematocrit and maltose) and relative bias, as compared to measurements made by the Siemens Vista 1500 chemistry analyzer.Results: End users reported the Abbott meter as the most ergonomic. Nova scored well on screen size and readability and time to result. Roche scored highest in the majority of categories, with the exception of ergonomics. Roche received particularly high scores in the categories of battery life, docking requirements and ease of cleaning.Analytically, β-hydroxybutyrate did not interfere with glucose measurements made by any of the meters. Bilirubin (200 mmol/L) caused negative interference with the Abbott and Nova meters at low glucose concentrations (10-15% at 2 mmol/L). Galactose produced a signifi cant, positive interference on the Roche meter (100% at 2 mmol/L). Elevated hematocrit caused negative interference with the Nova and Roche meters (25% at 2 mmol/L). Maltose showed no interference with any of the meters. All meters demonstrated acceptable linearity and precision. The Abbott meter showed a constant negative bias, of approximately 1 mmol/L, compared to the Siemens Vista glucose method. Minimal bias was noted for the other two meters.Discussion: Interference studies demonstrated signifi cant positive interference of galactose with glucose measurements made by the Roche meter. This could be an issue in neonates with hypoglycaemia and galactosemia. Additionally, hematocrit interference can pose a risk in neonates where elevated hematocrit is relatively prevalent. Maltose did not interfere with any of the glucose meters. This had been an issue previously with some commercial glucose meters and was of particular concern in patients on peritoneal dialysis.The current study outlines an extensive evaluation of three POCT glucose meters both analytically and clinically. It can be diffi cult to capture input from Clinical Stakeholders and the approach here outlines a unique approach and model for collecting and analyzing these data in a large tertiary care setting. Overall, the Roche meter scored highest on both analytical and clinical criteria and was deemed the most suitable meter from an infection control perspective.
B-68
Integrated QC System in Point-of-Care Analyzer
S. Mansouri, J. Cervera, N. Raymond. Instrumentation Laboratory, Bedford, MA
Use of clinical analyzers in point-of-care (POC) environment by nonlaboratory personnel necessitates an integrated quality control (QC) system with ability to evaluate the complete analytical process automatically. A key requirement in developing such an integrated QC system is the capability to detect errors during each stage of the testing process, that is, pre-analytical, analytical and post analytical. Intelligent Quality Management (iQM) is an example of such an integrated QC system incorporated in the GEM analyzers for measurement of blood gases, electrolytes, metabolites and Co-oximetry at the point-of-care. The primary method of error detection in iQM is based on monitoring sensor baseline drift and using drift limit as a control parameter for detecting errors caused by patient blood samples containing interfering substances, blood clots, etc. The source of error is detected through identifying specifi c pattern in the sensor baseline drift that is indicative of a known failure mode.In this paper, we describe utilization of sensor response pattern check during sample measurement for further enhancing and expediting error detection capabilities of iQM. The methodology is based on fi tting the sensor response to a logarithmic polynomial function for determining the fi t coeffi cients. The magnitude of the fi t coeffi cients is being used to determine normality of the response shape and detecting analyte errors by identifying abnormality in their response pattern.MATERIALS AND METHODS: Sensor outputs during sample exposure in the GEM® Premier 4000 analyzer (Instrumentation Laboratory, Bedford, MA) were collected at one second intervals and the response from 15 to 30 seconds was fi t to a second degree logarithmic polynomial. A linear logarithmic fi t was used for the electrolytes. For calculating the fi t coeffi cients, outliers in the sensor response data were identifi ed by studentized residual technique and removed.RESULTS: A total of about 1,000 samples from six GEM Premier 4000 analyzers covering the reportable range of the analytes were used to calculate the mean and standard deviations (SD) of the fi t coeffi cients. A preliminary analyte response normality check was established based on the fi t coeffi cient being within the mean ± 5SD range. Analyte results with abnormal fi t coeffi cient were found to be signifi cantly deviated from their target values. Those included samples contaminated with sodium thiopental which reported erroneous pCO2 results and samples contaminated with thiocyanate reporting erroneous chloride results. In case of the thiopental contamination, there were a few marginally erroneous results that were not detected by the response pattern check but were fl agged for interference by the existing iQM check. Ability for detecting analyte errors in sample result due to air bubble hang-up over sensors was investigated by purposely creating stream of air bubbles in the sample. There were few erroneous results for the sodium and chloride that were detected by the sample normality pattern check but were not detected by the existing iQM check of baseline monitoring.CONCLUSION: This study demonstrated utility of the sample normality pattern check in complementing and enhancing iQM error detection in the GEM system. The new checks could expedite detection of certain errors to the time of measuring sample result.
B-69
Demonstration of the MBio CD4 System for T-cell counting at the point-of-care
M. Lochhead1, M. Givens1, A. Weaver1, Y. Yu1, S. Bickman1, J. Ives1, E. Noormahomed2, C. Logan3, C. Benson3, R. Schooley3. 1MBio Diagnostics, Inc., Boulder, CO, 2Universidade Eduardo Mondlane, Maputo, Mozambique, 3University of California, San Diego, San Diego, CA
Background: Destruction of CD4 helper T cells is the hallmark of HIV infection. Worldwide, the CD4 T cell count is used for disease staging and management of HIV-infected individuals. Flow cytometry providesaccurate measurements of CD4 T cells and is the current standard-of-care in most settings. Unfortunately, fl ow cytometry is typically performed in centralized laboratories, rendering access to CD4 count as a challenge in high disease burden, resource-limited settings. Results are presented here demonstrating performance of a simple, robust, point-of-care CD4 counting system.
Wednesday, July 31, 9:30 am – 5:00 pm Point-of-Care Testing
A190 CLINICAL CHEMISTRY, Vol. 59, No. 10, Supplement, 2013
Methods: The MBio CD4 System consists of single use disposable cartridges and a simple reader. For this performance evaluation, single-use lyophilized reagent tubes were also prepared as part of a heat-stable reagent development program. A total of 49 HIV-infected blood donors in San Diego, CA and Maputo, Mozambique provided venous blood tube specimens under IRB-approved protocols. Specimens were run intriplicate on the MBio System. Reference testing was by fl ow cytometry. The MBio protocol was as follows. Ten microliter whole blood samples were added to the dried reagent tube and then were immediately transferred to the MBio cartridge. After a 20 minute incubation, cartridges were analyzed on the MBio CD4 Reader which provides an absolute CD4 T cell count in cells per microliter whole blood.Results: A total 49 samples were run in triplicate. Median cell count for the collection based on fl ow cytometry was 291 cells/uL, and specimens ranged from 0 cells/uL to 1206 cells/uL. There was one cartridge failure so a total of 146 results were reported. The Bland-Altman method was used to compare the MBio results to reference fl ow cytometry. B-A parameters were as follows: mean bias: -11 cells/uL (95% CI = -22.1to -0.6 cells/uL); upper limit of agreement: 118 cells/uL (95%CI = +99.8 to +127.0 cells/uL); and lower limit of agreement: -141 cells/uL (95% CI = -159.7 to -122.5 cells/uL). Results accuracy in this demonstration is within a clinically useful range.Conclusion: The point-of-care system presented here has been successfully demonstrated to deliver absolute CD4 counts over a clinically useful range. The system has particular utility for resource-limited settings.
B-70
Performance evaluation of a new one-step quantitative prostate-specifi c antigen assay, the FRENDTM PSA test
H. Park1, S. LEE2, D. Jekarl1, Y. Kim1, C. Lee3, S. Han3, C. Chung3, J. Chang3. 1Catholic University of Korea, Seoul, Korea, Seoul, Korea, Republic of, 2Incheon St. Mray’s Hospital, Catholic University of Korea, Seoul, Korea, Incheon, Korea, Republic of, 3NanoEnTek, Inc., Seoul, Korea, Republic of
Background: The aim of this study was to evaluate a new one-step quantitative prostate- specifi c antigen (PSA) assay, the FRENDTM PSA test (NanoEnTek Inc, Seoul, Korea) that has been developed for point-of-care testing. It is a lateral-fl ow fl uorescence immunoassay for determining PSA level on a chip card by measuring laser-induced fl uorescence on a test device.Methods: The imprecision, linearity, hook effect and detection limit (LoD) of the FREND PSA test were evaluated according to Clinical and Laboratory Standard Institute (CLSI) guidelines. For methods comparison, aliquots of 61 clinical samples over the analytical measuring range claimed by manufacturer’s instruction (0.1-25.0 ng/mL) were measured in duplicate during 5 days with FREND PSA test and other three comparative PSA assays as follows: Access Hybritech® PSA assay (Beckman Coulter, Inc.) using UniCel DxI 800 Access Immunoassay System; Architect® Total PSA assay (Abbott Diagnostics Division) using Architect i2000 SR; cobas® total PSA assay (Roche Diagnostics) using cobas e 601 analyzer. Data were analyzed using StatisProTM version 2.00.00 (Analyses-it® software Ltd. and CLSI®).Results: Total CVs of the imprecision for low (0.19 ng/mL), medium (2.76 ng/mL), and high PSA levels (16.63 ng/mL) were 14.7%, 9.9%, and 8.9%, respectively. Linearity was observed from 1.10 to 18.87 ng/mL and hook phenomenon did not appear up to 171.48 ng/mL. The calculated LoD value was 0.094 ng/mL. In the comparison study, the regression equations of the FREND PSA test (y) with Access Hybritech, Architect, and cobas PSA (y) were obtained as follows: y = -0.0169 + 1.243*x (r=0.959), y = 0.4141 + 0.941*x (r=0.947), y = 0.0889 + 1.019*x (r=0.954), respectively. At a medical decision point of 4.0 ng/mL, the differences between FREND PSA and Architect PSA, and between FREND PSA and cobas PSA were 0.592 ng/mL and 0.609 ng/mL, respectively, which were less than desirable (18.7%) specifi cation for bias, while the FREND PSA was higher than Access Hybritech PSA by 1.50 ng/mL.Conclusions: The FREND PSA test showed a reliable performance and results overall comparable to those of 3 other widely accepted PSA assays. The test was a simple and rapid method for measuring PSA, suggesting that it has clinical benefi t for point-of-care testing.
B-71
Development of an easy-to-use C-reactive protein (CRP) point-of-care test (POCT) for analysis from easily accessible capillary whole blood samples
D. Schwanzar, J. Baumgaertner, M. Grimmler, T. Hektor. DiaSys GmbH, Holzheim, Germany
Background: C-reactive protein (CRP) has been extensively studied and compared for its effi cacy as a marker of infl ammation and bacterial infection. In a point-of-care setting, a serial monitoring of patients’ CRP-values is vital to patient outcomes. The optionally battery-assisted DiaSys InnovaStar® CRP IS® setup allows access to this information through a convenient and minimally-invasive capillary puncture even in remote rural settings. Assisting in antibiotic treatment decisions by ensuring easy access to a patient’s CRP value, InnovaStar CRP IS point-of-care-test (POCT) will help to protect against the mounting global problem of antibiotic resistance. The detection of untreated bacterial infections remains the primary cause of death of children below the age of 5. More than 90 % of these deaths occur in the poorest countries of Asia and Africa.Objective: Development of a CRP POCT that additionally detects the hemoglobin concentration to calculate plasma corrected values, thus allowing the measurement of CRP from easily accessible capillary whole blood samples.Methods: We developed a latex-enhanced immunoturbidimetric assay on the DiaSys InnovaStar POC analyzer and evaluated the results of whole-blood and plasma pairs. These were correlated to CRP plasma values from an automated clinical Hitachi 917 analyzer. The performance characteristics were evaluated according to the CLSI guidelines which included analytical sensitivity, linearity, precision and accuracy.Results: For whole blood and plasma pairs we acquired the following results for the CRP IS POCT:CRP IS showed a Limit of Blank (LoB) of 1.27 mg/L (CLSI EP17-A) and a Limit of Quantitation (LoQ) of 2.76 mg/L (CLSI EP17-A). The upper limit of linearity was 400 mg/L (R2=0.99) (CLSI EP06-A). At a plasma concentration of 5 (30) mg/L we established for whole blood a CV of 3.7 (3.1) % for repeatability and between-run and between-day CVs of below 2 % (CLSI EP05-A2). No prozone effect was observed for CRP concentrations of up to 1800 mg/L. A preliminary method comparison using Passing-Bablok regression (n=47) with a competing CRP POCT resulted in a slope of 1.0754 with an intercept of -2.24 (R2=0.98).Conclusions: Our results clearly demonstrated that the DiaSys InnovaStar CRP IS POC analyzer’s performance characteristics are comparable to a fully-automated clinical chemistry analyzer. The CRP IS is an easy-to-use POCT. Utilized in a point-of-care setting, the emergency room, in rural and remote areas or for serial monitoring of patients it provides a substantial benefi t for treatment decisions.
B-72
Enzymatic assays on whole blood for lysosomal storage diseases using a digital microfl uidic platform
R. Sista1, T. Wang1, C. Graham1, N. Wu1, A. Eckhardt1, D. Millington2, D. Bali2, V. Pamula1. 1Advanced Liquid Logic, Research Triangle Park, NC, 2Duke University, Durham, NC
Background: Lysosomal storage diseases (LSD) can benefi t from early detection through newborn screening (NBS), and some states in the U.S. have started to screen newborns for LSDs. Current confi rmatory diagnostic testing is performed using dried blood spots, skin fi broblasts or leukocytes prepared from whole blood. Performance of assays using leukocytes involves several manual steps, including centrifugation. We previously developed a fl uorometric, multiplex enzymatic assay platform using digital microfl uidic technology to rapidly perform assays for Pompe, Fabry, Hunter, Gaucher, and Hurler diseases using a single DBS punch. In this work, we present performance of these assays directly using whole blood, thus fully automating the assays.Methods: Whole blood samples were prepared in-house under cGMP conditions by mixing different ratios of leukocyte reduced blood, unprocessed cord blood and heat-inactivated, charcoal-stripped serum. Quality control samples included base (BP), low (L), medium (M) and high pools (H) with 0%, 5%, 50%, and 100% leukocytes respectively. These activity levels span affected, carrier and normal enzyme activity ranges for acid-α-glucosidase (GAA; Pompe), α-galactosidase (GLA; Fabry), glucocerebrosidase (GBA; Gaucher) and α-iduronidase (IDU; Hurler). Thirty-two samples for each level were analyzed for the aforementioned enzymes on the digital

Point-of-Care Testing Wednesday, July 31, 9:30 am – 5:00 pm
CLINICAL CHEMISTRY, Vol. 59, No. 10, Supplement, 2013 A191
microfl uidic platform with an incubation time of 1 hour. Once samples were loaded onto a cartridge, all subsequent assay steps including mixing, incubation, reaction quenching, and detection were performed within the digital microfl uidic cartridge.Results and Conclusion: Figure 1 illustrates the enzymatic activities for each level for GAA, GBA, GLA, and IDU. Enzymatic activities are reported in μmol/L/h; error bars represent standard deviation.
There was good separation between each level for all enzymes. The ratio of enzymatic activity between different levels was in good agreement with the amount of leukocytes. These results demonstrate feasibility of determining enzymatic activity for LSDs using whole blood and the digital microfl uidic platform.
B-73
Preclinical development of a disposable, instrument free device for measuring hematocrit
S. P. Tyrrell, D. Kingston, B. Vant-Hull, S. Webb. IntraMed Diagnostics, LLC, Blue Earth, MN
AnemiaCheck™ is a new disposable, instrument free device for measuring hematocrit (Packed Cell Volume) from capillary or venous blood. The hematocrit test result is easily determined by the user, and is similar to reading a thermometer. The device combines precise geometries and tight fl uidic control to magnify the lateral separation of blood cells from plasma using traditional glass fi ber fi lters. The WHO estimates that anemia affects 1.6 billion people worldwide. Early diagnosis and treatment of anemia holds the promise of preventing or reducing the incidence of a variety of serious medical complications.Methods: The shape of the indicator strip, comprised of a narrow central resolving region and wider ends provides for analytical resolution. The resolution is proportional to the ratio of the total area of the strip to the width of the indicator region. The analytical range is determined by the length and width of the resolving region and the relative areas of the two ends of the strip. The test strip also includes a dye at the distal end that changes color when saturated with blood plasma, thus indicating the test endpoint. The indicator strip is contained in a laminated assembly that precisely controls blood movement within the device. This assembly ensures that the test only begins when suffi cient blood has been added and is insensitive to additional blood making sample volume control unnecessary. Test timing is not needed. Once the indicator strip is saturated by blood, approximately 15 minutes in the current design, further fl ow stops. This produces a stable endpoint permitting the test result to be read anytime thereafter. Manufacturing methods utilize automated, high throughput servo controlled converting presses enabling high precision with low manufacturing costs.Results: The current design shows an analytical range of 15% - 41% hematocrit (Hct.). A developmental assessment of accuracy, comparing the AnemiaCheck to spun hematocrit test results using 34 EDTA venous blood samples yielded a slope = 0.97, y intercept = 0.62, R2 = 0.96 and a 95% CI of (+/-) 4.2% Hct. This assessment used two devices per sample to estimate precision; the average %CV was 3.4%. Two samples, 18% Hct. and 35% Hct. were measured on 10 devices each to assess within-run precision, results were %CV = 4.1% and %CV = 2.1% respectively. A temperature study (range 10°C - 45°C) was performed to assess the impact of ambient temperature on results. Two Hct. levels, 18% and 35% were evaluated. Results were within (+/-) 3% Hct. between 18°C - 45° C with a clear bias towards under estimation at temperatures 15°C and below.Conclusions: The AnemiaCheck device only requires the user to place approximately two drops of blood in the area indicated; the remainder of the process is automatic and will be a valuable tool for detecting and monitoring anemia in the developing world, in low resource settings and for patient self-testing.
B-74
An Optimal Approach to Selecting the Appropriate Cutoff for Platelet Function Tests
J. R. Dahlen1, S. S. Brar2. 1Accumetrics, Inc., San Diego, CA, 2Kaiser Permanente, Los Angeles, CA
Background: Various platelet function tests (PFT) have been described for their ability to identify patients at increased risk for future cardiovascular events. The association between on-treatment platelet reactivity and incidence of cardiovascular events is largely attributed to the level of pharmacodynamic effect of the antiplatelet medication. The optimal cutoff for describing the prognostic utility of PFT has been frequently determined through ROC analysis and selection of the cutoff with the highest J statistic. This approach has resulted in variability in the reported “optimal” cutoff. The objective of this study was to evaluate the variability in “optimal” cutoff selection based on ROC curve analysis of a prognostic evaluation (Px) dataset compared to a diagnostic evaluation (Dx) dataset.Methods: A dataset comprised of naïve and on-treatment PRU measurements from 147 subjects was used for the Dx dataset. ROCanalysis was used to characterize the ability of the PRU result to distinguish on-treatment samples from naïve samples after pooling the naïve and on-treatment PRU results. A dataset comprised of on-treatment PRU measurements form 3059 subjects was used for the Px dataset. ROC analysis was used to characterize the ability of the PRU result to distinguish subjects that had a future cardiovascular event from those that remained event-free during long-term followup. The J statistic was determined for each cutoff according to the formula J = sensitivity+specifi city-1, and the standard deviation (SD) of the J statistic was calculated for each cutoff. A 2xSD range was used to describe the bounds of the J statistic. Uncertainty in cutoff selection for each dataset was described by determining the range of PRU cutoffs where the upper bound of the J statistic was greater than the J statistic for the optimal cutoff. To neutralize the effect of differences in sample size and the associated differences in average SD, the uncertainty analyses was repeated using a fi xed variability of 0.05 in the J statistic at the optimal cutoff, representing a 5% absolute difference in the combination of sensitivity and specifi city. Results:The J statistic range for the Px dataset was 0-0.192, compared to a 0-0.769 range for the Dx dataset. The range of PRU cutoffs with a J statistic upper bound greater than the “optimal” cutoff J statistic was 160-271 for the Px dataset compared to 182-266 for the Dx dataset. When imposing a fi xed variability of 0.05 units to the J statistic, the range of PRU cutoffs with a J statistic upper bound greater than the “optimal” cutoff J statistic was 167-261 for the Px dataset compared to 196-260 for the Dx dataset.Conclusion: The use of datasets evaluating prognostic performance introduces greater uncertainty in optimal cutoff selection compared to datasets evaluating diagnostic performance. This uncertainty is largely attributed to differences in the range of the J statistic, which is typically much lower for datasets evaluating prognostic performance. Cutoff selection for PFT should be performed based on diagnostic performance for detecting the drug effect and the diagnostic cutoff should be validated on the basis of prognostic performance.
B-75
Neonatal Blood Measurement using the i-STAT Portable Clinical Analyzer
S. Kittanakom1, N. Squires2, C. M. Balion1. 1Department of Pathology and Molecular Medicine, McMaster University, Hamilton, ON, Canada, 2St. Joseph’s Healthcare Hamilton, Hamilton, ON, Canada
Background: Neonatal transport is responsible for the care and transport of critically ill infants. The need for blood gas analysis and electrolyte measurements by point of care testing is important for neonatal patients during transport. The objective of this study was to compare the analytical performance of the i-STAT CG4 and CG8 cartridges to the GEM Premier 4000 blood gas analyzer using neonatal blood.Methods: Eighty neonatal blood samples were collected from patients in the neonatal intensive care unit. Two capillary samples (125 uL) were drawn to obtain suffi cient sample to analyze on the i-STAT (Abbott Point of Care) and the GEM 4000 (Instrument Laboratory). The CG4 cartridge measures pH, pCO2, pO2, lactate, and the CG8 cartridge measures pH, pCO2, pO2, Na, K, iCa, glucose, and hematocrit (Hct). To evaluate Hct, we obtained the results from EDTA blood that were analyzed

Wednesday, July 31, 9:30 am – 5:00 pm Point-of-Care Testing
A192 CLINICAL CHEMISTRY, Vol. 59, No. 10, Supplement, 2013
by the Beckman Coulter LH750 hematology analyzer. The total allowable error (TEa) was obtained from Ontario’s Quality Management Program-Laboratory Services (QMP-LS). Data were analyzed using the Method Validation software Analyze-it.Results: Comparative results between the i-STAT and GEM 4000 are summarized in the Table. Although the biases were small is most cases, the overall spread of data indicated by the 95% limits of agreement exceeded the performance goals for all tests (CG4 and CG8).
Test n Range Bias, % 95% Limits of Agreement TEa Goal MetCG4pH 41 7.23 to 7.49 0.007* -0.06 to 0.0771 0.03* NopCO2 41 25.0 to 84.0 -0.30% -42.80 to 42.1 9 NopO2 42 28.0 to 88.0 -1.60% -32.00 to 28.9 15 NoLactate 40 0.6 to 2.60 1.30% -37.30 to 39.8 10 NoCG8pH 39 7.22 to 7.47 0.0127* -0.03 to 0.0598 0.03* NopCO2 39 25.0 to 67.0 3.80% -9.50 to 17.1 9 NopO2 39 27.0 to 86.0 -2.20% -41.70 to 37.2 15 NoNa 30 125.0 to 143.0 3.4* -1.00 to 7.8 4* NoK 29 2.6 to 9.10 0.70% -26.10 to 27.5 6 NoiCa 38 0.99 to 1.43 0.10% -10.50 to 4.5 7 NoGlucose 39 1.9 to 7.5 0.01 -7.30 to 9.2 7.5 NoHct 39 0.224 to 0.683 1.20% -9.00 to 11.4 7* No* Absolute valueConclusions: The accuracy of the i-STAT CG4 and CG8 cartridges using neonatal blood was higher than our preset performance goals. Despite this limitation they were considered fi t for purpose for the needs of neonatal transport.
B-76
First European Performance Evaluation of the VerifyNow II Syste
T. Godschalk1, T. O. Bergmeijer1, J. R. Dahlen2, M. Kühbauch2, C. M. Hackeng1, J. M. ten Berg1. 1St. Antonius Hospital, Nieuwegein, Netherlands, 2Accumetrics, Inc., San Diego, CA
Background: The VerifyNow System has been well-characterized for its ability to provide accurate and rapid information about the antiplatelet effect of aspirin and P2Y12 inhibitors such as clopidogrel, prasugrel and ticagrelor. The results from the VerifyNow Aspirin Test and VerifyNow P2Y12 Test have been clinically validated to identify patients at increased risk for thrombosis and bleeding on the basis of their platelet reactivity. The VerifyNow II System is a next-generation test system that uses the same reagents as the VerifyNow System, but incorporates several new features to improve the user experience, including the ability to use various commonly-used blood collection tubes and a reduced sample wait time prior to performing measurements of response to aspirin therapy. The objectives for this study were 1) to show equivalence between the VerifyNow II System results and the VerifyNow System results, 2) to demonstrate the suitability of alternative blood collection tubes, and 3) to evaluate the blood sample wait time prior to performing the VerifyNow II Aspirin Test. Methods: A total of 23 subjects receiving treatment with a P2Y12 inhibitor and aspirin were enrolled. All testing was performed according to the manufacturer’s instructions. Results obtained from the VerifyNow II Aspirin and P2Y12 Tests were compared to results from the same samples tested with the VerifyNow Aspirin and P2Y12 Tests. Evaluation of alternative blood collection tubes was performed using the VerifyNow System-recommended Greiner Bio-One partial fi ll Vacuette tube compared to the standard BD Vacutainer blood collection tube with 1.8 cc and 4.5 cc fi ll volume. All blood collection tubes contained 3.2% sodium citrate. The sample wait time prior to VerifyNow II Aspirin testing was evaluated by comparing VerifyNow II Aspirin measurements performed after a 30 minute waiting period (as required with the VerifyNow Aspirin Test) to measurements performed after a 10-15 minute waiting period. Data were analyzed using linear regression and Lin’s concordance correlation coeffi cient. Results: PRU, % inhibition, and ARU results obtained with the VerifyNow II System were equivalent to the VerifyNow P2Y12 System, with Lin’s concordance correlation coeffi cients of 0.98, 0.96, and 0.96, respectively. VerifyNow II System PRU, % inhibition, and ARU results obtained with standard blood collection tubes were equivalent to partial-fi ll blood collection tubes, with Lin’s concordance correlation coeffi cients of 0.97, 0.94, and 0.98, respectively. There was no difference between 1.8 cc and 4.5 cc fi ll volumes for the standard blood collection tubes. VerifyNow II Aspirin results obtained after a 10-15 minute sample wait time were equivalent to results obtained after a 30 minute wait time (Lin’s r = 0.95). Conclusion: The results of this investigation confi rm that the VerifyNow II System produces results that are equivalent to the original VerifyNow System, with the added benefi ts of allowing use of standard blood collection tubes and a reduced sample wait time prior to VerifyNow II Aspirin testing.
B-77
Comparison of whole blood and serum creatinine and estimated glomerular fi ltration rate for screening of at-risk patients prior to radiographic procedures
C. Botz, L. Sorenson, B. Karon. Mayo Clinic - Rochester, Rochester, MN
Background: To prevent contrast-induced renal damage, serum or whole blood creatinine and estimated glomerular fi ltration rate (eGFR) are commonly measured prior to contrast enhanced radiologic examinations. In this study we measured correlation in creatinine values and concordance in eGFR between two whole blood creatinine methods and a serum enzymatic creatinine assay, used as the reference method.Methods: In our practice both iSTAT1™ (Abbott Point of Care, Princeton NJ) and Radiometer 827™ (Radiometer, Bronshoj Denmark) whole blood creatinine methods are used to screen at-risk patients for renal disease prior to radiological examinations. We retrospectively obtained all iSTAT1 and Radiometer 827 whole blood creatinine results performed on the same day of service as a serum creatinine for the period January 1- December 31, 2011. All serum creatinine measurements were performed with the Roche enzymatic creatinine assay on a Roche Cobas C-501analyzer (Roche Diagnostics, Indianapolis IN). Creatinine value, patient age and gender were utilized to calculate eGFR via the Modifi cation of Diet in Renal Disease (MDRD) formula. Whole blood creatinine/eGFR was compared to reference serum values by mean (SD) bias, percent of whole blood creatinine values within 0.2 mg/dL of serum value, and concordance of eGFR around cut-offs of < 60 and < 30 mL/min/1.73m2 used for radiology screening.Results: Mean bias (SD) between Radiometer whole blood and Roche enzymatic serum creatinine was of -0.06 ± 0.13 mg/dL among the 3244 patients (1400 female, 1844 male) with values on the same day of service. Mean (SD) bias between iSTAT whole blood and Roche enzymatic creatinine was 0.03 ± 0.13 mg/dL for the 2042 patients (1013 female, 1028 male) with same day measurement. 3039 of 3244 (94%) Radiometer whole blood creatinine values were within 0.2 mg/dL of the serum enzymatic value; while 96% (1960/2042) of iSTAT creatinine values were within 0.2 mg/dL of serum values. Sensitivity of the Radiometer for detection of serum eGFR < 30 mL/min/1.73 m2 was 90% (26/29); while the iSTAT detected 86% (12/14) of patients with serum eGFR < 30 mL/min/1.73 m2. The sensitivity of Radiometer eGFR for detection of serum eGFR < 60 mL/min/1.73m2 was 74% (520/703). The specifi city of Radiometer eGFR for prediction of serum enzymatic eGFR ≥ 60 ml/min/1.73m2 was 99% (2517/2541). Overall concordance of Radiometer to serum eGFR around a cut-off of 60 mL/min/1.73m2 was 94% (3037/3244). Both the sensitivity and specifi city of the iSTAT for prediction of serum eGFR < 60 and ≥ 60 were 93%. Overall concordance of iSTAT whole blood eGFR classifi cation around a cut-off of 60 mL/min/1.73m2 was 94% (1915/2042).Conclusion: Both Radiometer and iSTAT whole blood creatinine methods correlate well with Roche serum enzymatic creatinine. Concordance of whole blood to serum eGFR is good (94%) with both methods when the common screening cut-off of 60 mL/min/1.73m2 is used. The iSTAT demonstrated better sensitivity, and the Radiometer better specifi city, for prediction of abnormal Roche serum eGFR.
B-78
Optical Slide for Metabolic Snapshot using a Drop of blood at the Point-of-Care
P. Ahuja1, M. Peshkova2, M. Gratzl1. 1Case Western Reserve University, Cleveland, OH, 2St. Petersburg State University, St. Petersburg, Russian Federation
Background: The metabolic status of critically ill patients in the intensive care unit (ICU) is of critical importance and requires frequent monitoring. Tests done outside of the ICU with slow turnaround may cause undesirable patient outcomes. Numerous disposable test strips required for patient care increase already high costs of care in the ICU. We have developed a low-cost, reusable optical slide to provide a metabolic snapshot of multiple parameters at the point-of-care from a single drop of blood. The slide incorporates optode-based sensing zones that change color according to the concentrations of the respective analytes. Results can be read by the naked eye, or digitally with an inexpensive reader.Methods: pH sensors: pH-sensitive optode membranes were prepared by mixing PVC:DOS (mass ratio 1:2) and adding 25mmol chromoionophore (L), 100 mmol sodium ionophore (NaIV), and 27.5 mmol HFPB, and fi nally dissolving them in THF. 0.3μL of this solution was cast into designated sensing wells. Glucose sensors:

Point-of-Care Testing Wednesday, July 31, 9:30 am – 5:00 pm
CLINICAL CHEMISTRY, Vol. 59, No. 10, Supplement, 2013 A193
0.3μL pH-sensitive membranes were cast into designated sensing wells. To introduce glucose oxidase, GOX, to the sensing layer, GOX was immobilized above the pH optodes. Reference spots: Reference wells were fi lled with Titanium dioxide: PVC fi lms to provide a uniform white color. Protective membrane and sample holder: HEMA membranes, 7 μm thick, were polymerized using UV exposure and placed on the substrate, covering the sensing wells. PMMA slabs with holes were placed on top, attached to the substrate. pH and glucose calibrations: sensors were exposed to solutions of various pH and glucose concentration to determine the color response and response time of the slide. Sodium interference studies: pH-sensitive optodes were tested to determine pH response with different sodium concentrations in PBS. Image acquisition and analysis: Images of the slide were acquired using a low-cost monochrome camera with Red, Green, and Blue LED light sources. ImageJ software was used to measure RGB spectral components of the individual sensing and reference wells. Each sensing capsule was then normalized to the reference capsule, followed by Pythagorean normalization.Results: Red and blue intensity color response of pH sensing wells in PBS, serum, and blood, with resolution of 0.08 pH units were achieved. Response times for pH changes ranged from 4 to 12 minutes, varying with the different pH change measured. Reversibility of sensors to pH changes showed minimal hysteresis. Glucose response in PBS and blood was shown to be linear between 0 – 200 mg/dl using two sensing wells with different chromoionophore:NaIV ratios of the pH-sensitive optode layer. Examining ratios of Red/Blue intensities increased the dynamic range. Sodium interference studies showed that there is minimal sodium interference of pH-sensitive optode in the pH range of 5.5-8.0.Conclusion: Utilizing a single reusable slide for multiple screenings for the same patient makes the device more cost-effective than commercial devices, and improves compliance for disease management. The device is ideally suited for both developed and developing economies. In a pilot clinical trial in the ICU, the performance of the proposed tester compared favorably with parallel results obtained in the central clinical lab.
B-79
A SPE-HPLC-MS/MS Method for Measuring Steroids in Human Plasma
X. Zang, I. Gavin, A. Oroskar, A. Oroskar. Orochem Technologies Inc., Lombard, IL
Background: Steroid hormones are produced by human body, and they play key roles in the development of reproductive tissues (like testosterone, progesterone, and estradiol), or in the regulation of ions /water absorption (aldosterone). Plasma or serum levels of these steroids are measured in the clinical laboratory to detect disorders associated with steroid hormone imbalance.Steroids are used as drugs to cure certain disorders, and they are also used by some athletes as performance enhancement drugs, such as prednisolone and testosterone. Regular testing of these types of steroids is also required in the clinical laboratory.HPLC-MS/MS is replacing immunoassays for detecting steroids in patient samples. It requires a selective sample preparation method. In this study, we developed a solid phase extraction (SPE)-HPLC-MS/MS method for detecting six steroids (Aldosterone, Prednisolone, Corticosterone, Progesterone, Testosterone, and Estradiol) in human plasma.Methods: We chose six steroids with different polarity range to develop a selective and sensitive assay. We tested several different extraction methods.Initially we used liquid-liquid extraction (LLE) method with hexane or dichloromethane as extraction solvents. One hundred microliters of plasma samples were extracted with 300 μL of organic solvents, after vortexing and centrifuging, the organic solvent layer was extracted and evaporated.We also tested SPE methods with two different types of polymer SPE cartridges, different types of wash solvents and elute solvents. The goal of our test is to fi nd a relative easy procedure with high recovery and precision. 100 μL of plasma samples were used for SPE. Samples were loaded directly to SPE cartridges (Celerity Deluxe or Sagacity HL ), and washed with 10-30% acetonitrile. Analytes were eluted from cartridges either by acetonitrile, methanol, hexane, or dichloromethane.We developed a HPLC-MS/MS method to separate and detect six steroids in plasma extract. Extracted sample was separated by Reliasil C18 HPLC column, with gradient mobile phase starting from 25% to 75% acetonitrile in 0.1% formic acid. Total run time was 8 minutes. Analytes were detected by multiple reaction monitoring using API3000 mass spectrometer equipped with the Turbo Ionspary ion source. Every analyte was detected with both quantifi er ions and qualifi er ions.
Results: Currently, many labs use LLE method (either using hexane or dichloromethane ) to extract steroids. We compared our SPE method with LLE method. SPE method gave better recovery.In LLE experiments, hexane extract gave less matrix effect than dichloromethane, however, dichloromethane extract gave better recovery, recoveries of all six steroids were in the range of 56-81%.Between two types of SPE cartridges, Celerity Deluxe SPE cartridges gave better recovery. Aldosterone couldn’t retain on the cartridge with 30% acetonitrile as wash solvent. So, we chose 20% ACN as wash solvent. Regarding elute solvents, acetonitrile gave the best overall recovery. Using Celerity Deluxe SPE cartridges, recoveries for fi ve steroids (excluding aldosterone) were in the range of 99% to 106%, with the precision range from 7-9%. Recovery for aldosterone is 87% with 17% variation (without internal standard).Conclusion: We developed a SPE-HPLC-MS/MS to analyze six steroids in human plasma, which gave better recovery and precision than traditionally used LLE method.
B-80
The Real World Relationship Between VerifyNow PRU and Device-Reported Percent Inhibition: Analysis from the GRAVITAS Trial
J. R. Dahlen1, M. J. Price2. 1Accumetrics, Inc., San Diego, CA, 2Scripps Clinic, San Diego, CA
Background: The VerifyNow P2Y12 Test is a rapid, point-of-care platelet function test that has been extensively validated as a tool for measuring the antiplatelet effect of P2Y12 receptor inhibitors. The VN P2Y12 Test reports results as P2Y12 Reaction Units (PRU) and device-reported percent inhibition of platelet reactivity (%I), based on using thrombin receptor-induced platelet aggregation as a substitute for a baseline, P2Y12 inhibitor naïve PRU result. The PRU result is highly specifi c for P2Y12 receptor blockade due to the effect of a P2Y12 inhibitor and is an absolute measure of the drug effect. The %I result is a relative measure of the drug effect because the absolute effect is normalized using baseline, thrombin-receptor induced platelet aggregation. PRU results have been clinically validated to identify patients at increased risk for thrombosis and bleeding due to the presence of a P2Y12 inhibitor antiplatelet effect. %I results have been clinically validated to correlate to a return to baseline platelet function following P2Y12 inhibitor cessation. The relationship between these two results has not been extensively described. The objectives for this study were to 1) compare the actual relationship of PRU and %I results to a model based on true baseline platelet reactivity and 2) determine the agreement of PRU and &I results at published clinical decision points.Methods: Matched PRU and %I results were evaluated using measurements obtained from the GRAVITAS trial. A total of 10,375 VerifyNow P2Y12 Test measurements from 5,429 subjects were used for the analysis. The manufacturer-reported 95% confi dence interval PRU reference range of baseline platelet reactivity (194-418) represents the range of PRU results when the “true” %I is 0%. A PRU result of 0 is the expected result when “true” %I is 100%. Taken together, a model for the relationship of PRU and %I was constructed using an inferred range of PRU results at each level of “true” %I. Because the reference range is the 95% confi dence interval of baseline PRU results, the model is therefore a prediction of the relationship between PRU and %I for at least 95% of the observations. The percent of actual measurements that were in agreement with the model was determined, and the agreement of results using PRU < 208 and %I > 20% cutoffs also was determined.Results: 96.8% of the matched PRU and %I results were within the theoretical model, which was within the expected >95% of results. The PRU > 208 cutoff reported to defi ne high on-treatment platelet reactivity was 95% specifi c for the %I < 20% reported to defi ne a baseline platelet function. Conclusion: The results of this investigation confi rm there the PRU and device-reported %I results from the VerifyNow P2Y12 Test are highly correlated and are consistent with a prediction model of their relationship. These observations suggest that device-reported %I is an acceptable surrogate for true percent inhibition calculated from a pre-drug and on treatment PRU result. In addition, the results indicate that there is consistency between the clinically validated PRU and device-reported %I decision points.

Wednesday, July 31, 9:30 am – 5:00 pm Point-of-Care Testing
A194 CLINICAL CHEMISTRY, Vol. 59, No. 10, Supplement, 2013
B-81
An Implementation of the Quality Control Assessment Program of Point of Care Glucose Testing at Primary Care Units by Using Whole Blood Control Samples
W. Treebuphachatsakul1, W. Theansun2, R. Maneemaroj2. 1Point of Care Testing Unit for Training, Research, and Technology Development, Faculty of Allied Health Sciences, Naresuan University, Phitsanulok, Thailand, Phitsanulok, Thailand, 2Department of Medical Technology, Faculty of Allied Health Sciences, Naresuan University, Phitsanulok, Thailand, Phitsanulok, Thailand
Background: Point of care (POC) glucose testing was used the most at primary care unit (PCU) in Thailand. However, the policy of quality control (QC) for point of care testing (POCT) in Thailand has not been unclear. This study was fi rst to introduce the Quality Assessment Program (QAP) for POC glucose testing at PCU by using whole blood samples as control samples.Methods: QC whole blood samples was treated with glyceraldehydes and prepared for low, medium, and high glucose concentrations at Point of Care Testing Unit for Training, Research, Technology Development, Faculty of Allied Health Sciences, Naresuan University, Thailand. All samples were aliquot 0.5 mL into microtubes and kept in refrigerator until used. All QC whole blood samples were sent out to our health care members including District Health Promoting Hospitals and primary care units. The QC samples were tested for blood glucose within 12 hours after preparations. All participants performed QC once per month from August to October. The statistical standard deviation index (SDI) of blood glucose was calculated. Mean of glucose of each participant was compared to mean of group by using t-test. Data of POC glucose, glucose meter, and QC were survey at beginning. Satisfaction of QAP was evaluated at the end of the program.Results: All participants used the same brand of glucose meters (n=33) in the QAP and blood glucose was performed approximately 120 tests per day. Assessed time to test blood glucose was 4 ± 1.5 hours and there was no signifi cantly different among participants (P>0.05). SDI of blood glucose testing was ranged from 0 to 2.5. There were three meters (10.3%) those SDIs were exceeded 2.0 at the fi rst month, but decreased to less than 2.0 at the second and third months. All participants were satisfi ed of QAP with satisfaction score equal to 5.0.Conclusions: This is the fi rst study of the QAP for POC glucose testing at primary care settings in Thailand by using whole blood samples. This study provides an evidence for continuous improvement of quality of blood glucose testing at PCUs and also can motivate the users to consider and avoid quality of their glucose meters.
B-82
Rapid Blood Gas Testing Decreases Ventilator Time of the Post Isolated Coronary Artery Bypass Patient
L. Vitry, S. Clark, M. Hammel. Centura Health, Denver, CO
Background: Fast, accurate blood gas testing is a critical component to managing the post Isolated Coronary Artery Bypass (iso-CAB) patient in the Intensive Care Unit/Coronary Care Unit (ICU/CCU). These patients come to the ICU/CCU on a ventilator. Evidence Based Medicine supports weaning these patients as soon as possible, after admission to ICU/CCU. The national goal, per the Society of Thoracic Surgeons (STS), is to wean these patients from the ventilator in less than six hours.Methods: This study will compare 2 different blood gas testing methods used to manage the post iso- CAB patient and post iso-CAB patient ventilator time in the ICU.Results: ICU was sending blood gas samples on post iso-CAB patients to the main laboratory for analysis. Average turnaround time (TAT) for this analysis was 30 minutes. Average ventilator time was 12.1 hours. After the installation of rapid blood gas testing in the ICU, the average blood gas TAT was 2 minutes, and the average ventilator time was 8.8 hours.Conclusion: Having blood gas test results faster accelerated the patients’ treatment and weaning process. This leads to decreased time on a ventilator, decreased length of stay, decreases risk factors of adverse outcomes as a result of prolonged ventilator time, such as ventilator acquired pneumonia and a decrease the overall cost of treating the iso-CAB patient.
B-83
Evaluation of the Bayer Ketostix® for Detection of Ketone Bodies in Blood
M. Bagheri, K. Kelly, A. Butch, L. Song. UCLA, Los Angeles, CA
Background: The blood ketone test is used as an adjunct for the diagnosis of ketoacidosis. The Bayer Acetest® is an approved test for measuring ketones in serum/plasma and has recently been commercially unavailable. The Ketostix® reagent strip (Bayer) is approved only for detection of ketones in urine. In this study we evaluated the performance of the Ketostix reagent strip for detecting serum ketones.Methods: Serum pools negative for ketones were spiked with either lithium acetoacetate or acetone to obtain samples containing 5 - 100 mg/dL of acetoacetic acid or samples containing 5 - 30 mg/dL of acetone, respectively. The serum samples were tested in triplicate by the Acetest and Ketostix tests to determine accuracy. Sensitivity was determined by analysis of samples containing 0 and 5 mg/dL of acetoacetic acid 20 times each. Forty three serum samples were tested for ketones using Ketostix strips and the results were compared with those obtained by the Acetest.Results: Both the Ketostix and Acetest correctly classifi ed samples spiked with varying concentrations of acetoacetic acid. Both tests also produced negative and trace ketone results (20 times) for samples spiked with 0 and 5 mg/dL of acetoacetic acid, respectively. Therefore, the sensitivity for Ketostix to detect acetoacetic acid in serum is 5 mg/dL. The Acetest correctly detected trace amounts of acetone whereas, as expected, the Ketostix test failed to detect acetone. Agreement between tests for the 43 serum samples is shown below.Conclusion: Ketostix has similar sensitivity to Acetest for detecting acetoacetic acid. Ketostix does not detect acetone, however, acetone only accounts for 2% of the serum ketones. There was 88% concordance between the two test methods and discordant results differed by only 1 grade. These data indicate that the Ketostix reagent strips can be used as a replacement for the Acetest for detecting serum ketones.
Comparison of Serum Ketone Results by Ketostix and Acetest
AcetestKetostixNegative Trace
(5 mg/dL)Small(15 mg/dL)
Moderate(30-40 mg/dL)
Large(>80 mg/dL)
Negative( 24 0 0 0 0Trace(10 mg/dL) 0 3 2 0 0Small (15 mg/dL) 0 2 7 0 0Moderate(40 mg/dL) 0 0 0 4 1Large (>80 mg/dL) 0 0 0 0 0
B-84
Performance Characteristics of Cardiac Biomarkers on the Samsung LABGEOIB10 Immunoassay Analyzer for use in Point of Care (POC) and Near Patient Settings*
E. Shin1, C. Jin1, C. Ku1, A. Ramos-Chavez1, S. Patel1, B. I. Bluestein1, A. Belenky1, D. Park2, C. Kim2, B. Lee2, J. Kim2, Y. Lee2. 1Nexus-DX, San Diego, CA, 2Samsung Electronics Co., Ltd, Suwon, Korea, Republic of
Background: Multiple studies have shown that POC systems reduce turnaround time (TAT) due to elimination of preanalytical issues such as sample transport, specimen centrifugation and secondary laboratory processing. The Samsung LABGEOIB10
Analyzer is a portable, light weight (2.4 kg) immunochemistry system capable of quantitatively measuring up to 3 biomarkers simultaneously on a single whole blood aliquot in approximately 20 minutes. Test devices are similar in confi guration to a compact disc.Principle and Methods: Discs are confi gured to combine solid phase sandwich immunochemistry with microfl uidics and centrifugal fl ow to prepare plasma from whole blood that can then be moved through channel(s) to rehydrate, solubilize and mix with lyophilized reagents. Using a combination of active fl ow and capillary action, specifi c single or multiple analytes are quantitatively measured. Results are reported in print and by electronic transmission.Results: Analyte discs have been developed and validated for cardiac Troponin I, alone and in combination with CK-MB, and myoglobin . NT-proBNP and D-dimer are also available individually or as a panel with TnI. Measurements of these analytes are well accepted for the rapid evaluation of patients with symptoms of acute coronary syndrome (ACS) and/or congestive heart failure (CHF). Test methods were evaluated according to CLSI protocols for sensitivity, endogenous/exogenous interferences, precision and accuracy compared to 510(k) cleared predicate devices. The VITROS ®

Point-of-Care Testing Wednesday, July 31, 9:30 am – 5:00 pm
CLINICAL CHEMISTRY, Vol. 59, No. 10, Supplement, 2013 A195
immunodiagnostic products were used for comparison of all analytes except D-dimer which was measured on the Cobas Integra®. Performance characteristics for each analyte are shown in the table below.Conclusion: The Samsung LABGEOIB10 Analyzer is a POC instrument suitable for use in hospital and alternate care settings such as emergency departments, critical care units, and other sites where near patient testing is practiced and rapid answers are required in order to make informed decisions. *U.S. Export Only
Analyte Range -units Ref cut off Slope ρ %CV Total
cTnI 0.05-30 ng/mL 0.10 ng/mL99% ile 0.80 0.92 10-14
CKMB 2.0-60 ng/mL 8.6 ng/mL95% ile 1.29 0.88 10-15
MYO 30-500 ng/mL 99.8 ng/mL95%ile 1.0 0.90 12-13
NT- proBNP 30-5000 pg/mL 125pg/mL <75 y.o.450pg/mL >75 y.o. 0.91 0.96 9-14
D-dimer 100-4000FEU ng/mL 447 FEU ng/mL 95%ile 1.21 0.87 6-9
B-85
Audit of Quality Error Rates in Blood Gas Analysis in the Central Laboratory and Point of Care Setting
M. Chong, L. Ong, S. Saw, S. Sethi. National University Health System, Singapore, Singapore
Background: Arterial blood gas (ABG) analysis is thought to be more vulnerable to pre-analytical errors, especially in the point of care (POC) setting. We evaluated the number of pre-analytical errors reported in POC versus central lab ABG analysis, and identify common areas for future quality improvement. Such information is helpful in risk-benefi t analysis especially in the area of training and education of POCT users and clinicians requesting for ABG testing.Methods: We collated information for all ABG analyses done in our hospital in 2012, including all requesting locations and quality errors. ABG errors in the central laboratory were tracked using lab comment codes entered into the laboratory information system (LIS) by the laboratory staff, while POC ABG errors fl agged in the POC middleware were keyed in by laboratory POC staff into the LIS.Results: POC ABG testing made up of 87.4% of the 69775 total ABG requests. Of this, the error rate was 0.13%, compared to 4.98% at the central laboratory. Majority of the POC ABG pre-analytical errors were associated with patient identifi cation errors (86% of POC ABG errors; 0.11% of all POC ABG requests) whereas errors in the central laboratory stemmed from specimen quality issues such as clotted samples (78% of all central laboratory ABG errors; 3.87% of all central lab requests). This variability in error types between POC and lab blood gas may due to underreporting of errors such as clotted or insuffi cient samples at the POC site, as these were usually repeated immediately and might not be highlighted to the laboratory POC staff.Conclusions: The central lab ABG testing error rate is unacceptably high and suggests need for further training and education of ABG testing personnel in proper specimen requisition and handling prior to transportation to the laboratory.
B-86
Assessment of pH in Pleural Fluid on Siemens RAPIDPoint Systems to Aid Clinicians in Diagnosis of Common Diseases
B. M. Carney, K. LaRock, D. Tagliaferro. Siemens Healthcare Diagnostics, Norwood, MA
Introduction: Pleural fl uid is found in the pleura, the double-layered serous membrane that surrounds the lungs. Pleural fl uid enables the walls between the lungs and the chest to mechanically couple while preventing friction when the lung and chest walls slide with respect to each other. Common diseases including heart failure, pneumonia, esophageal rupture, tuberculosis, rheumatoid disease, and malignant cancers can cause excess fl uid to develop in the walls surrounding the lungs. It is estimated that 1 million pleural effusions are diagnosed in the United States each year¹ to diagnose common diseases and conditions such as heart failure, pneumonia, esophageal rupture, tuberculosis, rheumatoid disease, and malignant cancers1. Point of care testing provides an accurate pleural fl uid pH measurement. The RAPIDPoint® Series blood gas systems provide a method for the measurement of pleural fl uid pH in a maintenance-free cartridge2. An internal validation of pleural fl uid pH measurement is presented on the Siemens RAPIDPoint®400, 405, and 500 blood gas analyzers.Method: The test method was adopted from CLSI guideline Evaluation of Precision Performance of Quantitative Measurement Methods (CLSI EP05-A2). A total of 80 prepared pleural fl uid samples at three levels of diagnostic interest (7.0 - 7.5 pH Units) were analyzed in a precision study on each Siemens RAPIDPoint® model.Results: Precision analysis was performed for pleural fl uid samples prepared at three clinically relevant pH levels. Mean pH (Units) within-laboratory standard deviation and repeatability were calculated for each level, as illustrated in Table 1.Conclusions: The RAPIDPoint® point of care instruments meet the pooled Total SD (Within Lab) and pooled Within Run SD (Repeatability) acceptance criteria for pleural fl uid pH analysis.Table 1. pH Precision Results of Prepared Pleural Fluid Samples.RAPIDPointSystem Level Mean
(pH Units) n Within Laboratory (pH Units) Repeatability (pH Units)
400Low 7.102 80 0.011 0.010Mid 7.286 80 0.011 0.010High 7.471 80 0.008 0.007
405Low 7.102 80 0.011 0.009Mid 7.286 80 0.012 0.012High 7.471 80 0.007 0.007
500Low 7.102 80 0.016 0.006Mid 7.286 80 0.018 0.011High 7.471 80 0.019 0.011
Footnotes1 ‘Pleural Effusion’, by J. Rubins, MD, eMedicine, Feb. 15, 20072 Pleural Fluid analysis is pending FDA approval for clearance in the United States.
B-87
Concordance between successive Troponin I by point of care and TroponinT by central laboratory in patients presenting to Emergency Department.
I. A. Hashim, W. Wells, D. Pillow, J. A. de Lemos. University of Texas Southwestern Medical Center, Dallas, TX
Introduction: Bedside measurement of Troponin level is becoming widely adopted. Because only Troponin I is currently available as point of care use in the United States, institutions using Troponin T assays in their central laboratory typically perform Troponin I by point of care testing in the emergency room and subsequent measurements are usually performed in the laboratory using Troponin T. In this study we reviewed consecutive Troponin I and T measurements on patients presenting to our Emergency Department.Methods: Troponin I level obtained by point of care testing (POCT) (iSTAT analyzer, Abbott Diagnostics, USA) and Troponin T level by laboratory-based instrumentation (Cobas, Roche Diagnostics, USA) were measured at the time of presentation in consecutive patients evaluated for chest pain over a one month period. A positive test for Troponin I was >0.1 ng/mL and for Troponin T was >0.01 ng/mL (99th percentile values). Concordance for both troponin levels was determined.Results: A total of 105 patients presented to the emergency department during the study period. Troponin I values ranged from below detection <0.1 ng/mL (considered negative) to 3.61 ng/mL (median 0.16) compared with <0.01 (considered negative)
Wednesday, July 31, 9:30 am – 5:00 pm Point-of-Care Testing
A196 CLINICAL CHEMISTRY, Vol. 59, No. 10, Supplement, 2013
to 3.40 ng/ml (median 0.08) for Troponin T. Troponin I was negative in 86 patients (81.9 %), whereas Troponin T was negative in 79 patients (75.2%). Concordance for negative troponin results was 68.6 % whereas concordance for positive tests was only 10.5 %. Percentage of positive Troponin I with a negative Troponin T was 6.7%, compared with 13.3 % for those with negative Troponin I and a positive Troponin T results.Conclusion: Concordance between Troponin I by POCT and Troponin T by laboratory-based methodology was only moderate. False negative and false positive results were seen. This may results in patients being erroneously admitted or more seriously discharged. POCT Troponin I may identify individuals for additional investigation, but reliance on a single value for rule out may result in false negative evaluations for MI and inappropriate discharge. A specifi c rule out protocol is required when using POCT.
B-88
A novel electrochemical immunoassay point of care system
R. A. Porter, E. Hutchinson, M. Chard, W. Paul. AgPlus Diagnostics, Sharnbrook, United Kingdom
Background: ELISA and Clinical Lab Analyzers are routinely used for immunoassays where robust, reliable results are required for clinical decisions to be made. However, with the changing landscape in healthcare provision, the need for a more mobile, rapid and responsive diagnostic tool that can be used in a range of environments has become much greater.Objective: The aim of AgPlus Diagnostics research is to develop a diagnostic platform that would meet all the needs of the Point of Care (PoC) diagnostics market for a rapid, portable system, giving results comparable to the gold-standards of central laboratory analysers, to ensure it can deliver a measurable benefi t to users where clinical confi dence in the diagnostic result is required.AgPlus with the National Physical Laboratory have developed an electrochemical metalloimmunoassay based on silver nanoparticles, in a disposable microfl uidic device, with a portable reader to deliver clinical results in 10 minutes or less.Assay methodology: The system employs silver nanoparticles as an electrochemical label and magnetic particles as the solid phase. The assay is run on a fl uidic device, which contains all required reagents dried on the chip and solutions in to fl uid fi lled blisters, which are deployed by an actuator. This means the assay can be carried out in a single step format controlled by the reading device.For the prototype system, TroponinI was developed. Once a sample has been added to the microfl uidic chip, the sample incubates in the measurement chamber and is mixed with the antibody-coated particles. If the analyte is present a complex is formed with the magnetic and silver particles. After incubation, magnets are activated, which holds the silver-magnetic complexes down in the measurement zone so the wash solution can clear away any unwanted materials. Once this occurs, the reading solution of ammonium thiocyanate is released and cleaves the silver nanoparticles from the complex and forms a negatively charged monolayer around the silver nanoparticle, which can be drawn down to the sensor under a positive potential. The nanoparticle are electrochemically converted to electro-active metal ions, for each 40nM nanoparticle it can be converted to 1x10¹² ions thus allowing for signal amplifi cation. The amount of silver particles is directly proportional to the amount of analyte in the sample.Results: The system is showing results in un-optimised assay formats with TnI having a current dynamic range of 1pg/ml-50pg/ml with CV<20% in serum samples.We have shown that using the combination of anodic stripping voltammetry with silver coated nanoparticles, clinically relevant results are being achieved.Conclusion: The electrochemical detection system is compact, only requiring low power consumption. The system has been developed as a platform technology and has wide applications in a range of settings, where rapid, accurate diagnostics can allow for quicker clinical decision to be made on lower sample volumes. The platform also shows promise for single chip multiplexing with other metallic particles, such as gold and copper. The technology also has potential applications in molecular diagnostics given its sensitivity of detection.

Infectious Disease Wednesday, July 31, 9:30 am – 5:00 pm
CLINICAL CHEMISTRY, Vol. 59, No. 10, Supplement, 2013 A197
Wednesday, July 31, 2013
Poster Session: 9:30 AM - 5:00 PM
Infectious Disease
B-89
Identifi cation of Models to Predict Sepsis in Emergency Department Patients
F. Cate, J. Colón-Franco, S. Litt, T. Rice, A. Wheeler, D. Plummer, W. Dupont, A. Woodworth. Vanderbilt Univeristy Medical Center, Nashville, TN
Background: Initiation of early, goal directed therapy reduces sepsis related mortality. No single predictor accurately identifi es sepsis in emergency department (ED) patients. Objective: To identify sepsis prediction models for ED patients with systemic infl ammatory response syndrome (SIRS) and/or other sepsis risk factors. Methods: This retrospective cohort study utilized 128 ED patients with SIRS and/or another sepsis risk factor (hypotension (SBP<100), altered mental status, immunodefi ciency, , advanced age, or hyperglycemia without diabetes) who were admitted to the Medical ICU. Residual plasma specimens, collected at ED admission, were utilized. Baseline demographics, routine lab values, and vital signs were obtained by review of electronic medical records. Infl ammatory biomarkers (TNFα, IL-6, IL-10, CRP and LBP) were quantitated using the Siemens Immulite 1000 (Siemens Healthcare Diagnostics, Inc.). Diagnoses were blindly adjudicated by 2 ICU physicians as follows: No-sepsis (n=78) and Sepsis (n=50; severity: sepsis n=6; severe sepsis n=13 and septic shock n=31). ROC analysis was used to generate an area under the curve (AUC) for each predictor. Models to predict all sepsis or severe sepsis/shock were generated using multivariable logistical regression analysis. Results: Concentrations of all 5 biomarkers were signifi cantly different between septic and non-septic patients and between patients who developed severe sepsis or shock compared to Early/No-sepsis (Table). A regression model consisting of demographics, laboratory values and vital signs (Model A) showed moderate ability to predict sepsis at ED presentation (AUC=0.78, P=0.0006). Addition of infl ammatory markers to the regression model (Model AB) signifi cantly improved the model’s diagnostic strength to predict sepsis (AUC=0.90, P<0.0001, ΔAUC=0.12, P=0.0009) or severe sepsis and septic shock (AUC=0.92, p<0.0001, ΔAUC=0.16, P=0.0003) Conclusions: Multivariable regression models consisting of infl ammatory biomarkers, demographics, and lab values accurately predict those who have or will develop sepsis, severe sepsis and shock among ED patients presenting with SIRS or another sepsis risk factor.
Sepsis vs. No Sepsis Early/No Sepsis vs.Severe Sepsis and Shock
Predictor AUC 95% CI P value AUC 95% CI P valueTNFα 0.80 [0.72-0.87] <0.001 0.81 [0.74-0.89] <0.001LBP 0.80 [0.72-0.87] <0.001 0.81 [0.74-0.88] <0.001CRP 0.69 [0.60-0.78] <0.001 0.71 [0.62-0.8] <0.001IL-6 0.83 [0.76-0.9] <0.001 0.84 [0.77-0.91] <0.001IL-10 0.72 [0.63-0.81] <0.001 0.74 [0.65-0.83] <0.001WBC 0.63 [0.52-0.73] 0.01 0.62 [0.51-0.73] 0.2Temp 0.74 [0.65-0.84] <0.001 0.75 [0.65-0.85] <0.001Resp Rate 0.62 [0.51-0.72] 0.02 0.65 [0.54-0.75] 0.01Glucose 0.50 [0.38-0.6] 0.99 0.53 [0.43-0.64] 0.47Platelet Ct 0.59 [0.49-0.7] 0.07 0.57 [0.46-0.68] 0.17BMI² 0.56 [0.46-0.66] 0.22 0.57 [0.46-0.67] 0.22Model A 0.78 [0.70-0.86] <0.001 0.77 [0.68-0.86] 0.002Model AB 0.90 [0.85-0.95] <0.001 0.92 [0.87-0.97] <0.001
B-90
An Evaluation of An Improved Formulation, Human Immunodifi ciency Virus Combi PT, In a Nationalised Testing Process
J. B. Godfroy, B. Y. Lee, A. Omar, M. S. Wong. Khoo Teck Puat Hospital, Singapore, Singapore
Background: With the fi rst clinical observation of AIDS in 1981, the entire medical landscape pertaining to the diagnosis, treatment and monitoring of an infection by the Human Immunodefi ciency Virus, has progressed continuously. The Roche Diagnostics HIV Combi PT (Roche Diagnostics, Switzerland) is one such advance, with an improved formulation that has increased sensitivity by the addition of a pre-
analytical incubation step that facilitates liberation of p24 antigen. We evaluated the current formulation against the Combi PT in a nationalized HIV workfl ow, with a focus on samples that returned values close to and higher than the manufacturers’ cut-off value. Repeatedly positive samples were then sent for confi rmation by Western Blot.Methods: A total of 116 anonymised samples were tested using the current immunoassay formulation by Roche Diagnostics, the HIV Combi as well as the new HIV Combi PT. Sixty-three samples were determined to be at the greyzone cut-off index of 0.9 or greater on either of the formulations. These samples were subsequently sent for western blot analysis at the National Reference HIV Laboratory. A regression analysis and a Bland-Altman plot were performed to elucidate a comparison between formulations. A binary classifi cation test was applied to both formulations with respect to the fi ndings of the western blot.Results: Regression analysis returned a fi nding of y=1.021x-7.681 with a correlation coeffi cient of 0.7848. If western blot results of ‘Inconclusive’ and ‘Indeterminate’ are interpreted as HIV-negative using the Centres for Disease Control and World Health Organisation western blot criteria, both formulations were equally sensitive at 100% when compared against the western blot but the specifi cities were 34% and 4% for the Combi PT and Combi respectively. Samples which tested positive with Combi but negative with Combi PT and Western blot had a mean cut-off index of 1.88 versus 0.584 on the Combi PT (n=10). The average and median cut-off indices for western blot ‘Indeterminate’ samples were 63.3 and 11.9 for the Combi while the new formulation returned values of 39.1 and 46.3 respectively. For samples confi rmed positive by western blot, the average and median cut-off index for Combi and Combi PT were 332 and 289 versus 509 and 380, respectively.Conclusion: Despite the inclusion of a detergent incubation pre-analytical step that is designed to facilitate p24 liberation, the Combi PT demonstrates sensitivity equivalent to the previous formulation. The value of the new formula lies in the much improved specifi city. When using the Combi PT, 10 fewer patients required confi rmation testing by western blot, translating into faster turnaround times, lower operating costs and less anxiety for the patient.
B-92
Improved detection of Acid Fast Bacilli (AFB) in urine samples by the Bleach concentration method
P. Pingle, P. Apte, R. Trivedi. Medicare Hospital and Research Center, Indore, India
During the last two decades, the resurgence of tuberculosis (TB) has been documented in both developing and developed countries and much of the increase in TB burden coincided with human immunodefi ciency virus (HIV) epidemics. Since then the disease pattern has changed with a higher incidence of Extra Pulmonary Tuberculosis (EPTB) as well as disseminated TB. EPTB comprises 15% of the total Tuberculosis cases. Diagnosis of EPTB at times can be diffi cult and baffl ing, compelling a high index of suspicion due to paucibacillary load in the biological specimens. The Bleach concentration method for detection of Acid Fast Bacilli (AFB) has been described for sputum. The aim of this study was to apply this method for detection of AFB in 5-day morning urine samples obtained from the suspects of urinary tuberculosis and to correlate the results with conventional Zeihl Neelsen (ZN) staining, TB culture and TB-PCR. A total of 46 samples were studied from clinically suspected cases of urinary tuberculosis. All the samples were processed for conventional ZN staining, Bleach concentration followed by ZN staining, TB culture on LJ media and TB-PCR (IS 6110) by standard protocols. Out of the 46 samples evaluated all were negative (0%) by conventional ZN staining, while the positivity increased to 7(15.22%) by bleach concentration method, the gold standard i.e. TB culture had 9(19.56%) positive and the TB-PCR gave 4(8.69%) positive. Bleach solution is safe as it decontaminates the sample, is inexpensive and readily available in hospitals and its application has been proved in pulmonary Tuberculosis. This is possibly the fi rst type of comprehensive study applied to the urinary samples for the diagnosis of EPTB. The results clearly showed an improved positivity by applying the Bleach concentration prior to ZN staining and are quite close to the TB culture results.

Wednesday, July 31, 9:30 am – 5:00 pm Infectious Disease
A198 CLINICAL CHEMISTRY, Vol. 59, No. 10, Supplement, 2013
B-94
Development and Validation of a Novel IFN-gamma ELISPOT Assay for Sensitive and Specifi c Detection of Antigen-Specifi c T Cell Response to Borrelia burgdorferi
C. Jin1, D. Roen1, M. Kellermann1, G. Kellermann2. 1Pharmasan Labs, Inc., Osceola, WI, 2NeuroScience, Osceola, WI
Background: Lyme disease, caused by infection of Borrelia burgdorferi, is an emerging infectious disease in the United States. However, the limitation of the conventional antibody-based immunoassays is that they have low sensitivity and specifi city, causing signifi cant false negative and false positive results. In contrast, Borrelia-specifi c T cell-based immune assays have not yet been well developed. The enzyme-linked immunospot (ELISPOT) technology has proven to be extremely sensitive in detecting low frequency of antigen specifi c reactive T cells and has been approved by FDA for use in the diagnosis of tuberculosis.Objective: The aim of this study is to develop and validate a novel T cell-based assay for diagnosis of Lyme disease using an ELISPOT technology.Methods: To develop the novel T cell-based diagnostic assay for Lyme disease, we detected the Borrelia antigen-specifi c memory T cells that were activated ex vivo by recombinant Borrelia-specifi c antigens, using Th1 cytokine Interferon-γ ELISPOT at the single cell level. The human PBMC were stimulated with single or a combination of recombinant Borrelia-specifi c antigens, DbpA, OspC, p100 and VlsE. In addition, we added cytokine IL-7 into the culture to increase the detection of T memory cells. The results of ELISPOT were analyzed and reported as IFN-γ Spot Forming Units (SFU). To validate this assay, 25 diagnosed Lyme patients and 80 control subjects were studied and the results were compared with Western Blot test. The performance of the Lyme ELISPOT assay, including clinical sensitivity, clinical specifi city, accuracy and precision, is also evaluated.Results: The frequency of Borrelia-specifi c T memory cells can be detected by Interferon-γ ELISPOT and therefore can be used as a biomarker for Borrelia infection. The detection of antigen specifi c T cells was signifi cantly increased by a combination of recombinant Borrelia antigens and addition of IL-7. The signal enhancing effect of IL-7 was observed even at saturating antigen concentration in terms of frequency, but IL-7 did not increase the amount of IFN-γ secreted by individual cells. The ELISPOT assay cut-off value was determined using Receiver Operating Characteristic (ROC) curve analysis. A cut-off value of >25 SFU maximized assay sensitivity and specifi city. The ELISPOT has a signifi cantly higher specifi city (94%) and sensitivity (84%) compared with Western Blot (Sensitivity 24%). It has a positive predictive value of 81% and a negative predictive value of 95%. The Area Under the ROC Curve (AUC) is 0.943, demonstrating that Lyme ELISPOT Assay has an excellent diagnostic accuracy. The results also demonstrated a dissociation between B cell response and T cell response during Borrelia infection, suggesting that a comprehensive immunological diagnostic panel should include both B cell and T cell diagnostics.Conclusion: A novel T cell-based assay for diagnosis of Lyme disease -Lyme ELISPOT was developed and validated. This novel ELISPOT assay may be a helpful laboratory diagnostic test for Lyme disease, especially for seronegative Lyme patients and in monitoring treatment. A comprehensive evaluation of both antibody response and T cell response to Borrelia infection will provide new insights into the pathogenesis, diagnosis, treatment and monitoring the progress of Lyme disease.
B-95
IGRA, TST, and Mycobacterium tuberculosis PCR assay in combination with high-resolution computed tomography for rapid diagnosis of smear-negative pulmonary tuberculosis in Korea
S. P. Suh1, O. Lee1, S. Lee1, H. Choi1, S. Kee1, M. Shin1, J. Shin1, B. Park2, D. Ryang1. 1Department of Laboratory Medicine, Chonnam University Medical School, Gwangju, Korea, Republic of, 2Mokpo National University, Muan, Korea, Republic of
Background: It is challenging to early detect pulmonary tuberculosis (PTB), especially in smear-negative PTB cases. There are several assays for rapid diagnosis of PTB, including whole-blood interferon-γ release assay (IGRA), tuberculin skin test (TST), polymerase chain reaction (PCR), and high-resolution computed tomography (HRCT). However, little is known about the diagnostic performance of such methods. The purpose of this study is to compare whole-blood IGRA, TST, sputum PCR, and HRCT in the diagnosis of smear-negative PTB.
Methods: Retrospective comparison of the performance of whole-blood IGRA (QuantiFERON-TB Gold-In Tube; Cellestis, Australia), TST, sputum PCR using Roche Cobas Amplicor Mycobacterium tuberculosis assay (Roche Diagnostics, Switzerland), and HRCT in the rapid diagnosis of PTB was conducted at a university hospital in Korea.Results: Of 319 patients available for all the rapid assay results in the study, 237 were smear-negative, including 78 patients with PTB and 159 with non-TB. The sensitivities and specifi cities were 79.5% and 59.4% for IGRA, 60.3% and 77.4% for TST, 39.7% and 96.9% for PCR, and 71.8% and 90.6% for HRCT, respectively. The positive and negative predictive values were 50.9% and 84.5% for IGRA, 56.6% and 79.9% for TST, 86.1% and 76.6% for PCR, and 78.9% and 86.8% for HRCT, respectively. Among 62 patients suspected of having PTB based on HRCT, 42 patients showed positive IGRA results, 41 (97.6%) of which were culture-confi rmed. Among 149 patients suspected not to have PTB based on HRCT, 77 patients showed negative IGRA results, 72 (93.5%) of which were diagnosed as non-TB. Among 71 patients suspected of having PTB based on HRCT, 36 patients showed positive TST results, 34 (94.4%) of which were culture-confi rmed. Among 166 patients suspected not to have PTB based on HRCT, 119 patients showed negative TST results, 110 (92.4%) of which were diagnosed as non-TB. Among 71 patients suspected of having PTB based on HRCT, 25 patients showed positive PCR results, 24 (96%) of which were culture-confi rmed. Among 166 patients suspected not to have PTB based on HRCT, 155 patients showed negative PCR results, 140 (90.3%) of which were diagnosed as non-TB.Conclusion: In smear-negative PTB patients, IGRA in combination with HRCT could help fi nding more TB cases than PCR or TST in combination with HRCT. However, PCR in combination with HRCT could be helpful to rule out more non-TB cases than IGRA or TST in combination with HRCT.
B-96
Evaluation of Klebsiella pneumoniae carbapenemase (KPC) production in Enterobacteriaceae with decreased susceptibility to carbapenems
N. B. Alves, J. S. Viana, P. H. N. Bicalho, F. M. D. Neves, G. F. Souza, C. A. Araújo, A. L. Rocha, M. A. B. Sousa. Instituto Hermes Pardini, Belo Horizonte, Brazil
Background: Bacterial resistance has increased indexes mortality, morbidity and costs of treating infectious diseases, especially those caused by Gram-negative bacteria against which the carbapenems represent important alternative treatment. The emergence of carbapenemases KPC types limits the therapeutic options in case of infection caused by Enterobacteriaceae, becose these enzymes are capable of inactivating carbapenems, penicillins, cephalosporins and monobactams. This study aimed to identify the gene blaKPC in Enterobacteriaceae with decreased susceptibility to carbapenems, isolated from clinical specimens from hospitalized patients, and the profi le’s evaluation of antimicrobial susceptibility of these microorganisms.Methods: In 541 strains of Enterobacteriaceae, isolates were found 48 (8.87%) that were resistant or intermediately resistant to imipenem and / or meropenem, identifi ed by MicroScan ® system. For phenotypic analysis of the production of carbapenemase KPC type of test was performed Hodge, and the confi rming was done by PCR for gene blakpc. The susceptibility test tigecycline and Ertapenem was performed by disk diffusion method, and to test the susceptibility Polymyxin B, determination of minimum inhibitory concentration (MIC) was determined by E-test ® strips on Mueller-Hinton agar according to the manufacturer’s recommendations. The results were interpreted according to Brazil’s National Agency for Sanitary Vigilance Technical Note 01/2010.Results: Among the 48 isolates, the most frequent was Klebsiella pneumoniae (50%), followed by Providencia stuartii (22.9%), Enterobacter aerogenes (8.3%), Enterobacter cloacae (8.3%), Escherichia coli (6.3%), Proteus penneri (2.1%) and Serratia marcescens (2.1%). Detection of gene blaKPC was positive in 81.3% of the samples. The Hodge test was positive for 85.4% of the strains. In 95.1% of positive cases in the Hodge test, the presence of production of carbapenemase KPC type by detecting blaKPC gene by PCR was confi rmed. Results showed that the Hodge test had a sensitivity of 100% and specifi city of 81.8%. The positive and negative predictive values were, respectively, 95.1% and 100%.We observed a high resistance pattern to the most part of antibiotics. Tigecycline and Polymyxin B proved to be the best treatment options for the majority of isolates, and this indicates the need for automation panels which contain these antimicrobials to achieve faster test results. Nevertheless, 01 strain of Enterobacter aerogenes and 05 strains of Klebsiella pneumoniae were resistants to Polymyxin B.

Infectious Disease Wednesday, July 31, 9:30 am – 5:00 pm
CLINICAL CHEMISTRY, Vol. 59, No. 10, Supplement, 2013 A199
Conclusion: The results demonstrate the need for constant surveillance, so that containment effective measures against of bacteria producing KPC carbapenemase type can be taken as soon as possible. Thereby, it is possible to prevent the avoiding the spread of this resistance mechanism. Furthermore, it is crucial to progress the technological development of new more effi cient drugs for the treatment of infections caused by multidrug-resistant Gram-negative bacteria.The results surprisingly showed an accelerated growth of the resistance gene transmission to various bacterial specimens in Belo Horizonte (Brazil). It’s an worrisome informations, because the fi rst report of a Enterobacteriaceae strain resistant to carbapenems in our institution was in January 2009.
B-97
Total lymphocytes count (TCL) as predictor of imunossupression in people living with hiv. Is CD4 count still needed?
G. F. Souza1, W. Pedrosa1, B. Alves2, C. Quadros2, I. Pereira2, J. Heimann2, L. Damião2. 1Instituto Hermes Pardini, Belo Horizonte, Brazil, 2Faculdade de Saúde e Ecologia Humana, Vespasiano, Brazil
Introduction: HIV infection results in qualitative changes and leukocyte depletion, mainly the lymphocyte T CD4+. Counting the lymphocyte subpopulation allows predicting the disease progression and defi nes when to start treatment in naive patients. There are few dedicated laboratories for CD4 count in developing world and the sample presents very low stability when transport for long distances are needed. The total lymphocyte count (TLC) is cheaper and available in small laboratories and in special situations could be used to predict severe immunosuppression (CD4 <200 cells / ml). Objective: Determine the discriminative capacity of leukocyte, lymphocyte count, hemoglobin rate and viral load to count lymphocytes T CD4+ under 200 cells/ml.Materials and methods: The present study was performed in a primary setting in Vespasiano, Brazil. The sample consisted of 73 HIV infected patients, evaluated between 2007 and 2011 and selected according criteria previously determined. The clinic and laboratorial data were collected from medical records. The variables studied were: sex, age, opportunist infection, antiretroviral treatment and lymphocytes T CD4+. Results: The TLC (regardless hemoglobin levels) had a sensitivity of 73.7% and specifi city of 76% (AUC = 0.892, CI 0.81 to 0.97, p <0.0001, cut off = 1,130 cells / mL). The TLC has shown good performance to predict severe immunosuppression on patients with hemoglobin level under 12g/dl (AUC = 0,982; IC = 0,943 to 1,000, p < 0,001, cut off = 1.482 cells/ml), with sensibility of 100% and specifi city of 58%.Conclusion: The immunosuppression may be predicted by TLC in patients with asymptomatic HIV infection if the hemoglobin level were lower than 12.0 g / dL. Considering the global trend in treat early HIV infection, the viral load and a simple blood cell count could be suffi cient for treatment decision and therapeutic follow-up.
B-98
Comparison of the syphilis screening algorithms in very low-prevalence population
S. Chae, J. Chung, H. Huh. Dongguk Univ Medical Center, Goyang, Korea, Republic of
Background: Traditionally, Centers for disease control and prevention (CDC) has recommended a nontreponemal test such as Rapid Plasma Reagin (RPR) for syphilis serologic screening. Recently, however, CDC recommended a reverse algorithm, in which treponemal test such as enzyme immunoassay or chemiluminescence immunoassay is performed fi rst as a screening test, followed by a nontreponemal test as a second step. Automated Treponema pallidum Latex Agglutination (TPLA, Sekisui Chemical Co., Ltd, Osaka, Japan) and RPR (Sekisui Chemical Co., Ltd, Japan) have been used by many laboratories in Korea and Japan. We tried to evaluate the usefulness of TPLA on reverse screening test by comparing the results of traditional test and reverse algorithm test in patients who had health checkups using automated RPR or TPLA.Methods: Sera from 24,688 persons who had health checkups between July 2007 and December 2012 were included. We routinely performed RPR and TPLA simultaneously. Sera showing positivity on one or both of these tests were stored. Among the 24,688 samples, 254 samples showed positive results by TPLA or RPR. Sera with discordant results on the reverse algorithm (e.g., positive TPLA and negative RPR) were tested using Treponema pallidum particle agglutination (TPPA) according
to the recommendations of the reverse algorithm. Among those with discordant results, 8 could not be tested with TPPA because there were not enough sera to be tested. The IgG immunoblot was performed as a supplementary confi rmatory test in cases of discrepant TPLA and TPPA results.Results: Among the 24,688 samples, 30 (0.1%) were positive by traditional screening, and 244 (1.0%) were positive by reverse screening. Twenty RPR positive cases were confi rmed as positive by TPLA. 216 of the 224 discordant cases (91.8% of 244 TPLA positive cases) by reverse algorithm were tested with TPPA, of which 76 (35.2%) were negative, suggesting false-positive TPLA results. In addition to 20 RPR positive sera, the results of reverse algorithm were positive in 140 sera that were not detected by RPR. Among 76 sera showing different results for TPLA and TPPA, 13 were confi rmed as positive by IgG immunoblot.Conclusion: Despite the increased false-positive results in populations with low-prevalence of syphilis, the reverse algorithm detected 140 cases with treponemal antibody that went undetected by traditional algorithm. Therefore, reverse algorithm using TPLA screening test may enhance sensitivity for detection of early or latent syphilis. Moreover, since TPLA uses automated methods, it has several advantages such as quantitative detection, reduced testing time, low infection risk and no infl uence by human handling.
B-99
Serum procalcitonin, interleukin-6, C-reactive protein and serum amyloid A measurement in ICU department for diagnostic evaluation and risk-analysis of prolonged ICU stay patients with sepsis
Y. Fu, J. Chen, B. Cai, J. Zhang, L. Li, L. Wang. West China Hospital of Sichuan University, Chengdu, China
Background: To study the contribution of serum procalcitonin (PCT), interleukin-6(IL-6), C-reactive protein(CRP) and serum amyloid A(SAA) measurements for diagnositic evaluation and the risk-analysis of prolonged ICU stay patients with sepsis diagnosed by blood cultures presenting to the ICU department.Methods: A total of 199 critically ill patients were included in the study provided they were hospitalized in the ICU for > 7 days. Clinical characteristics, serum PCT, IL-6, CRP and SAA measurements, and blood cultures results were concurrently requested for detecting sepsis.Results: One hundred and thirty-four out of 199 patients were diagnosed with sepsis. Serum median value of PCT, IL-6 and CRP were markedly greater in the sepsis group than those in the group of non-infection (P< 0.05). In contrast, the SAA values in the two groups were similar. The areas under the ROC curve for PCT was 0.925(95%CI 0.890-0.960), for CRP 0.699(95%CI 0.622-0.777) and for IL-6 0.739 (95%CI 0.665-0.812). PCT elevation was independently associated with the risk of sepsis (Odds ratio= 2.120, 95% CI, 1.308-3.424, P=0.002)Conclusion: In critically ill patients with sepsis, PCT may be a valuable diagnostic marker, regardless of liver/renal function and prolonged ICU stay.
B-100
The Correlational Exploration between Single Nucleotide Polymorphisms in IL-21-JAK/STAT Signaling Pathway and HBV Infection Pathogenesis
S. Li, R. Lv, J. Zhou, X. Lu, B. Ying, L. Wang. West China Hospital of Sichuan University, Chengdu, China
Background: Our study paid attention to the key genes of IL-21 and JAK/STAT signaling pathway and investigated the relation between HBV infection and single nucleotide polymorphisms (SNPs) in IL-21-JAK/STAT signaling pathway to provide data for molecular diagnosis and clinical practices.Methods: 546 unrelated HBV infection patients and 353 healthy subjects were enrolled. 5 SNPs (rs2221903 and rs4833837 in IL-21 gene; rs2285452 in IL-21 gene; rs3008 in JAK3 gene; rs1053023 in STAT3 gene) of IL-21-JAK/STAT signaling pathway were genotyped by high resolution melting (HRM) method.Results: There was no signifi cant difference in the comparison of genotypes and allele distribution of 5 SNPs between case and control group. According to serological marker models, the control group was divided into negative and anti-HBs positive subgroup. The frequency of allele A of loci rs2221903, rs4833837 and rs1053023 were higher in negative subgroup than that in anti-HBs positive subgroup (P: 0.03,0.05,0.02;OR: 1.65,1.59,1.48;95% CI: 1.04-2.64,1.00-2.52,1.05-2.09 respectively). The case group

Wednesday, July 31, 9:30 am – 5:00 pm Infectious Disease
A200 CLINICAL CHEMISTRY, Vol. 59, No. 10, Supplement, 2013
was divided into three subgroups: patients with chronic hepatitis B (CHB), cirrhosis, and hepatocellular carcinoma (HCC). Subjects with genotype AG of rs2285452 were signifi cantly less susceptible to HCC than those with AA genotype (P=0.04,OR=0.25,95%CI=0.07-0.95). Serological marker model of “HBsAg+, HBeAg+, HBcAb+” was predominate among patients with HBV infection. However, there was no association between genotype distribution of 5 SNPs and serological marker models(P>0.05). Conclusions: Our findings suggest that allele A of rs2221903, rs4833837 in IL-21 and rs1053023 in STAT3 may infl uence the production of anti-HBs. Furthermore, genotype AG of rs2285452 in IL-21R could reduce the risk of HCC, when compared with genotype AA. However, further research needed to prove that host genetics is likely to influence the outcome of HBV infection.
B-101
Detection of human papilloma viruses using PANArrayTM HPV kit in microarray technology.
S. Kim, G. Joe, S. Ha, S. Ha, I. Wo, M. Kil, S. Cho, E. Kim, H. Park. PANAGENE.Inc, Daejeon, Korea, Republic of
Background: Human papilloma viruses (HPV) are the major cause of cervical cancer. Hence, HPV genotype detection is a helpful preventive measure to combat cervical cancer. HPV type is associated with different risks for the development of cervical cancer. So, detecting and genotyping HPV has increasingly become an integral part of cervical cancer control. Recently, several HPV detection methods have been developed, and each has different sensitivities and specifi cities. To detect HPV infection, HPV DNA testing is necessary. HPV DNA testing is required as a primary genotyping tool for HPV vaccination. In these days, HPV DNA testing is recommended for cervical cancer since it is more sensitive and specifi c than Pap smear method which has much possibility to have false negative result. We have developed PANArray™ HPV Genotyping Chip using peptide nucleic acid (PNA) as probes instead of DNA probes. PNA, DNA analogue, has a strong binding affi nity to its complementary DNA sequences and results in fast hybridization rather than DNA. Methods: PANArray™ HPV Genotyping Chip is made by immobilizing 33 HPV type-specifi c PNA probes on PNA chip. On one well, 33 probes are positioned; 19 HPV genotypes with high risk (16, 18, 26, 31, 33, 35, 39, 45, 51, 52, 53, 56, 58, 59, 66, 68, 69, 70, and 73) and 13 HPV genotypes with low risk (6, 11, 32, 34, 40, 42, 43, 44, 54, 55, 62, 81, and 83). In addition, PNA probes for beta-globin gene for PCR confi rmation and position markers are also immobilized on the same well.We have comparatively analyzed the value of PANArray™ HPV Genotyping Chip and DNA sequencing with 197 clinical samples.Results: We analyzed a total of 197 clinical samples by PANArray assay and validated its usefulness by comparing results to those of the sequencing method. The PANArray results show positive with 66 samples (including 9 samples of multiple infections), negative with 131samples. The PANArray results have 97% high concordance (192 out of 197) with DNA sequencing in detecting genotype. The PANArray HPV chip was highly accurate, suitable for detection of single and multiple infections, rapid in detection, less time-consuming, and easier to perform comparing to the other methods. It is concluded that for clinical and epidemiological studies, all genotyping methods are perfectly suitable, and provide comparable results.
B-102
The Tm Mapping Method: A novel rapid, easy, and cost-effective method that identifi es unknown pathogenic microorganisms within three hours of sample collection
H. NIIMI1, T. Ueno1, S. Hayashi1, A. Abe2, T. Tsurue2, M. Mori3, H. Tabata4, H. Minami4, M. Goto5, S. Saito1, I. Kitajima1. 1Toyama University Hospital, Toyama, Japan, 2Kitami Information Technology Co., Ltd., Hokkaido, Japan, 3Ishikawa Prefectural University, Ishikawa, Japan, 4Hokkaido Mitsui Chemicals, Inc., Hokkaido, Japan, 5University of Iowa Carver College of Medicine, Iowa, IA
BACKGROUND: The earliest possible identifi cation of pathogenic microorganisms is critical for selecting an appropriate antimicrobial therapy and for obtaining a favorable outcome for infected patients. However, as the current pathogen-identifi cation methods using microbial culture require several days, empirically selected antimicrobial agents are administered until the pathogenic microorganisms are identifi ed. Though mass spectrometry is can be utilized as a rapid identifi cation method of pathogens, it requires the blood culture process, so it takes more than 10
hours after sample collection. We developed a novel rapid, easy, and cost-effective method that identifi es the dominant bacteria in a sample within three hours of sample collection. Using only seven primer sets, more than 100 bacterial species can be identifi ed, and the number of identifi able bacterial species is easily expandable. We named this method the “Tm mapping method”.METHODS: To detect pathogenic bacteria by PCR with high sensitivity, we developed a novel “eukaryote-made” Taq polymerase, which is free from bacterial DNA contamination (J Clin Microbiol. 2011 Sep; 49(9):3316-20). We also developed the Tm mapping method for the rapid identifi cation of a broad range of pathogenic microorganisms. We developed this system, and already obtained international patents in Japan (2010), in the U.S. (2012), and in Europe (2013), which proves it is unique and original. The method identifi es pathogenic microorganisms by mapping the unique shape of seven melting temperature (Tm) values in two dimensions. This unique shape refl ects the different DNA base sequences present among bacterial species. Comparing the shape of the mapped Tm values to the shapes in the database, the pathogenic bacteria is identifi ed. To use this method from anywhere easily, we also developed identifi cation software program that is available on the Web. The Tm mapping method does not need to use either bacterial cultures or a sequencing analysis, and therefore rapid, easy, and less expensive identifi cation of pathogens is possible.RESULTS: To evaluate the accuracy of the Tm mapping method, we fi rst performed blind tests using the 107 kinds of bacterial DNA registered in the database. In the 107 trials, 106 Tm mapping results matched with the pre-sequenced bacterial DNA. Next, using 140 bacterial colonies (51bacterial species), we evaluated the accuracy of the Tm mapping method compared with the sequencing method. As a result, the identifi cation rate was 97%. Finally, using 42 patient samples (22 from whole blood, 11 of amniotic fl uid, nine of cerebrospinal fl uid), we evaluated the accuracy of the Tm mapping method compared with the sequencing method. Excluding the eight samples not suitable for the Tm mapping method because the Difference Values were greater than 0.5 (our judgment criteria), 97% (33/34) of the Tm mapping results matched with the sequencing results.CONCLUSION: The Tm mapping method would be especially useful for infectious diseases that require prompt treatment, such as sepsis and bacterial meningitis, and would contribute to the rescue of patients with severe infections, as well as a decrease in the development of antibiotic resistance.
B-103
Potential Utility of a Novel Automated Point-of-Care Image Based Hematology Analyzer for the Diagnosis of Malaria as Part of a Routine CBC
M. B. Jorgensen, R. A. Levine, S. C. Wardlaw. QDx, Inc., Branford, CT
Background: Prompt and accurate malaria diagnosis permits effective treatment, decreases drug resistance development, and directs epidemiologic responses. When malaria is diagnosed, its treatment is based, in part, upon the patient’s hematologic state, including the hemoglobin concentration, platelet count, and degree of parasitemia; the latter is important in determining the severity of the infection and monitoring the patient’s response to therapy. The objective of this study was to determine the ability of a new image-based hematology analyzer to detect intraerythrocytic infection with Plasmodium falciparum in whole blood samples.Methods: 300 nL blood samples were placed in a novel transparent four micron high chamber containing acridine orange and an isovolumetric sphering agent in a localized area. The sample was digitally imaged with sequential transillumination at 413 nm and epi-illumination at 470 nm. Images were captured showing the optical density (OD) of the monolayer of red blood cells (RBCs) and fl uorescent emission due to the nucleic-acid selective fl uorophore. P. falciparum infected blood cultures and human specimen were analyzed with available results within ten minutes, also reporting a full complete blood count (CBC).Results: Uninfected sphered RBCs exhibited homogenous optical density (A, dashed arrows), whereas infected RBCs exhibited localized areas of decreased optical density due to the displacement of hemoglobin by the parasite (A, solid arrows). The concomitant fl uorescent images revealed no fl uorescent emission in uninfected RBCs (B, dashed arrows) and the presence of fl uorescent falciparum merozoites (B, solid arrows) in the areas of OD decrements. When combined, these two measurements provided a sensitive and specifi c (100% sensitivity and 97.7% specifi city at 0.025% parasitemia) method for the detection of P. falciparum in sub-microliter blood samples.

Infectious Disease Wednesday, July 31, 9:30 am – 5:00 pm
CLINICAL CHEMISTRY, Vol. 59, No. 10, Supplement, 2013 A201
Conclusion: The detection, confi rmation, and quantifi cation of malaria infection as part of the performance of an automated CBC is feasible. Preliminary observations also indicate potential utility in diagnosing Babesia.
B-104
Signifi cant Increase of Sensitivity on Rapid Infl uenza Antigen Assays Using Silver Amplifi cation Immunochromatography Method.
S. C. Kimura, H. OHTO, H. YAMAGUCHI, S. FUKUOKA, E. NAKAMA, Y. UMEDA. Showa University Northern Yokohama Hospital, Yokohama City, Japan
Background: Rapid diagnosis of infl uenza is commonly performed with immunochromatography method (IC) using specimens taken from upper respiratory tract. Although IC is easy and relatively cheap, its sensitivity is not perfect especially in early stage of disease because of low concentration of viral antigens. Applying a newly developed “silver amplifi cation” principle, we generated a new assay method to increase sensitivity. The aim of this study is if our method has higher sensitivity and specifi city than conventional IC assays.Materials and Methods: One hundred and twenty cases of infl uenza-like symptoms; fever, rhinorrhea, cough, and/or general fatigue who visited pediatrics department of our hospital from November 2011 to April 2012 were entitled. Cotton swab specimens were applied to Fuji Drychem IMMUNO AG1TM (FUJIFILM Medical, Tokyo, Japan). Simultaneously, a conventional IC method was performed with Quick Chaser FLU A/BTM by Mizuho Medy (Tosu, Japan). A real time PCR with TaqMan probe was also done for gold standard. This study was authorized by local ethic committee.Results: With silver amplifi cation method, 23, 15 cases were infl uenza A, B positive, respectively. On the other hand, 23, 8 cases were A, B, positive with conventional assays. PCR results were positive in all the cases which showed positive in new method, negative in conventional assays. Their virus concentration ranged 105 to 109
copies/ml.Discussion: Though statistically not signifi cant, the silver amplifi cation method showed higher sensitivity for infl uenza B. Because of photo-developing principle, its sensitivity was reported to increase 8 to 16 times. This analyzer is small (18x20x11cm) and light (1.8kg), it is suitable for bedside testing. Since number of cases is limited, more data are required to confi rm the result.Conclusion: Our novel assay method using silver amplifi cation has high potentiality to increase sensitivity of rapid bedside testing.
B-105
The Use of Procalcitonin in the Clinical Practice
U. Ray, M. Smillie, N. Jordan, J. Houston. Royal Hobart Hospital University of Tasmania, Hobart, Australia
Aim: To study the role of Procalcitonin (PCT) in the diagnosis of systemic bacterial infection in the clinical practice at the Royal Hobart Hospital.Introduction: The diagnosis of systemic bacterial infection poses still a problem in the clinical setting throughout the globe. Both the clinicians and the laboratorians face the diffi cult task of deriving the appropriate diagnosis so that appropriate antibiotic can be instituted in time. The infl ammatory conditions are monitored by measuring of C-reactive protein (CRP), white blood cells(WCC),erythrocyte sedimentation rate(ESR) in the initial work-up and the tissues and the fl uids are sent for culture and antimicrobial sensitivity. The antimicrobial culture and sensitivity take 48 to 72 hours. Until the arrival of PCT, there was no laboratory test available for the earliest diagnosis of systemic bacterial infection. Procalcitonin (PCT) is a 13kd polypeptide, transcribed by Calci-1 gene which also codes for thyroid medullary hormone-Calcitonin is synthesized by trigger of bacterial capsular antigen. PCT can be synthesized by most of the body cells but predominant synthesis takes place during the systemic bacterial infection. Within initial 3-6hours of the systemic invasion of bacteria the synthesis of PCT starts and in the local bacterial as well as viral infection PCT synthesis does not take place, although in many systemic fungal infection PCT levels have been found to be elevated.PCT level more than 0.5ng/ml is diagnostic of systemic bacterial infection and the degree of elevation varies with the severity of systemic bacterial infection. With the institution of appropriate antimicrobials therapy PCT levels start coming down.Methods: We measured CRP, WCC,PCT and culture and sensitivity of urine and blood for patients admitted to ICU and medical wards at the Royal Hobart Hospital. CRP assay was done by Architect ci 8200, PCT assay by BRAHMS PCT-Q (rapid assay),WCC by Sysmex Cell Counter and blood/urine cultures were done by conventional petri dish culture -sensitivity plates.Results: CRP and WCC are raised universally in all the clinical cases with infl ammation. PCT >0.5ng/ml was elevated only in the systemic bacterial infections and not in any viral infection and autoimmune infl ammatory conditions(p<0.05). The earliest elevation in PCT level was noted within 10 hours of the systemic signs and symptoms of the infection (i.e. fever and other prodromal signs). The failure of PCT levels decrease was noted in 10 patients in ICU on daily monitoring signifying the ineffi cacy of the antimicrobial therapy and that prompted the change in the antimicrobial regime. The non-elevation in the PCT levels in serum stopped the use of antimicrobial therapy in 25 patients.Conclusion: The procalcitonin(PCT) level measure helps signifi cantly in the diagnosis of systemic bacterial infection. The daily monitoring of serum PCT levels helps to judge the effi cacy of antimicrobial therapy in the clinical setting and thus prevents the abuse of antimicrobial medications which eventually would help in the prevention of evolution of antibacterial resistance in the clinical setting.
B-106
Performance evaluation of all small particle count in urinalysis to justify urine bacterial culture
J. Lin, S. Kuo, H. Lin. Changhua Christian Hospital, Changhua, Taiwan
Background: Use of chemistry dipstick tests in screening urine samples to justify urine bacterial culture in patients suspected of urinary tract infection (UTI) is recommended in current clinical practice. A parameter, all small particle count (ASP), is generated by a fl ow cytometry system on the iChem VELOCITY urine chemistry system (IRIS Diagnostics, Chatsworth, CA, USA) which quantifi es urine particles associated with UTI. Whether ASP benefi ts the traditional urinalysis to justify urine culture remains unknown and is investigated in this study.Methods: An observational study was conducted by reviewing laboratory results of patients with clinically suspicious UTI. Only those urine bacterial culture and urinalysis submitted at the same day were recruited for analysis. The urinalysis performed on iChem VELOCITY system included leukocyte count (LC; cutoff, > 5 /μL), leukocyte esterase (LE), leukocyte nitrite (LN) and ASP (cutoff, >10,000/mL). A positive urine bacterial culture was defi ned as growth of one or two uropathogens at a concentration higher than 104 CFU/mL. Results of these three routine tests with or

Wednesday, July 31, 9:30 am – 5:00 pm Infectious Disease
A202 CLINICAL CHEMISTRY, Vol. 59, No. 10, Supplement, 2013
without ASP were compared against corresponding urine culture (reference method). The performance of these tests in association with culture was expressed in sensitivity (SN), specifi city (SP) and negative predictive value (NPV).Results:Laboratory results of 480 patients were collected at random. The demographic performance (SN, SP, NPV) of individual test was 89.7%, 55.1% and 82.8% for LC, 85.5%, 58.6% and 78.7% for LE, 36.8%, 92.1% and 56.6% for NIT, and 46.6%, 83.8% and 58.3% for ASP, respectively. When LC, LE and NIT were combined, SN, SP and NPV were 92.5%, 49.3% and 85.5%, respectively When ASP was added to this combined panel, SN, SP and NPV were 94.4%, 46.7% and 88.3%, respectively.Conclusion: Whenusing alone, ASP is not superior to traditional urinalysis as a screening test for justify urine culture. However, the performance increases by including ASP in the traditional urinalysis, implicating that ASP may be potential and benefi t traditional panel of urinalysis in terms of SN and NPV.
B-108
False positive rate of a 4th generation HIV-1 antigen/antibody combo test relative to gender and pregnancy state
V. L. Ng, F. Saechao. Alameda Health System/Highland General Hospital, Oakland, CA
Background: In late 2010 we implemented a combination HIV-1 antigen and antibody test (HIV-1 Ag/Ab; Abbott Diagnostics Division, Abbott Park, IL, USA). A few false positive results from pregnant non-HIV-1 infected women at delivery prompted us to review our overall false positive rate relative to gender and pregnancy state. Methods: All HIV-1 Ag/Ab testing and interpretation was performed in accordance with manufacturer’s recommendations. All specimens yielding a “reactive” HIV-1 Ag/Ab result were sent for confi rmatory testing by Western Blot (WB) and often HIV load (HIVL) quantifi cation. For an HIV-1 Ag/Ab “reactive” result, a true positive was defi ned as the same specimen yielding a positive Western Blot (WB), a false positive yielding a negative or indeterminate WB and undetectable HIVL, and an indeterminate yielding an indeterminate WB with no HIVL determined. Results: From December 2011 through January 2013 we performed 9489 HIV-1 Ag/Ab tests. 153 specimens from 122 patients were reactive for an overall 1.6% positivity rate (95% confi dence interval, CI, of 1.4 - 1.8%). Of these 122 patients, 14 (11.5%, 95% CI 6.7 - 18.8%) had false positive and 4 (3.2%; 95% CI 1.3 - 8%) indeterminate results. Gender specifi c analysis revealed:
Females % (95% CI) of Females Males % (95% CI) of MalesTotal 35 87# true positives 23 65.7% (49-79%)* 81 93.1% (85-97%)*# false positives 8 22.9% (12-39%) 6 6.9% (3-14%)# indeterminate 4 11.4% (4.5-26%) 0 0.0% (0-4%)*positive predictive value (PPV)The false positive rates between females and males were not statistically different but the true positive rates were. Twelve of the 35 (34%) females with “reactive” HIV-1 Ag/Ab results were pregnant. Of these 12, seven (59%; 95% CI 32-81%) had true positive results, four (25%, 95% CI 14 - 61%) false positive and 1 an indeterminate result. Conclusion: Our overall ~11.5% false positive rate, lower 65.7% PPV for women and even lower 59% PPV for pregnant women allows us to individualize our interpretation of HIV-1 Ag/Ab reactive results while awaiting confi rmatory testing results.
B-109
Maximising Cost Effectiveness of Infectious Disease Serology Controls Through Consolidation of Analytical Parameters
S. Doherty, S. Picton, A. Veerasekaran, P. Armstrong, M. L. Rodriguez, J. Campbell, S. P. Fitzgerald. Randox Laboratories Limited, Crumlin, United Kingdom
Introduction: Currently to meet the infectious disease serology quality control requirements of laboratories, a multitude of controls/programmes are needed due to the limited number of analytical parameters in each of the controls encountered. These represent both a time and fi nancial burden in the assessment of laboratory performance.Consolidating parameters in a minimal amount of controls maximises cost effectiveness (i.e. reducing time, shipping costs, different suppliers, participation costs) simplifying participation in the required external quality assessment schemes.Relevance This study reports on the evaluation of the applicability of a new series
of consolidated control material for the simplifi ed assessment of infectious disease serology on a range of analytical systems for use in internal and external quality control applications.Methodology: As two thousand fi ve hundred serology laboratories participated in this study, it was considered that suffi cient levels of data would be returned. Lists of parameters of interest, methods, instruments and reagents were established accordingly and grouped into the following related panels, HIV/Hepatitis (anti-HIV-1, anti-HIV-2, anti-HIV-1&2 Combi, anti-HCV, Anti-HBc, anti-HTLV-I, anti HTLV-II, anti HTLV-1 and 2 Combi, anti-CMV, HBsAg), ToRCH (anti-toxoplasma IgG, anti-toxoplasma IgM, anti-rubella IgM, anti-rubella IgG, anti-CMV IgG, anti-CMV IgM, anti-HSV1 IgG, anti-HSV 2 IgG, anti-HSV-1&2 IgG Combi), Epstein Barr Virus (anti-EBNA IgG, anti-EBV VCA IgG, anti EBV VCA IgM) and Syphilis (1 parameter categorised by method). Each participant was sent a set of blind control materials to be assayed (including one positive and one negative control). Positive controls: all the parameters for the different panels were included at suffi ciently high levels in a single corresponding control in order to elicit a strong reactive response for all the various in house and commercially available reagent materials. Negative controls: material with non reactive response to the parameters of interest.Results: The assessment of the positive control samples showed positive reported responses with an overall percentage agreement >85% for the majority of the parameters in each panel: HIV/Hepatitis (85.7% to100 %), Epstein Barr Virus (96.8% to 97.2%), syphilis (92.3% to 100%), ToRCH panel (93.0-99.2% for 8 out of 9 parameters, anti-HSV2 IgG was method dependent). The negative control samples exhibited non reactive response with an overall percentage agreement >88.6% for all the parameters.Conclusion: This study indicates that the serology control material in which the positive samples contain all parameters pertaining to the different panels, elicits a positive response with a favourable overall percentage agreement for all the panels tested. The ToRCH panel also exhibited good agreement for the majority of the parameters, the levels of anti-HSV 2 IgG were insuffi cient to elicit positive response in the sample provided for some methods. All the panels evaluated presented good consensus for the negative control samples. Consolidating parameters in a minimal amount of controls is benefi cial as this not only minimises the number of controls to be used but also maximises cost-effectiveness. This is applicable as it minimises the time required for the preparation of control materials, reducing potential errors, storage requirements when these controls are used for both internal and external quality control applications.
B-110
HLA-DP/DQ polymorphisms associate with the susceptibility of HBV infection in Chinese Uygur population
Y. Liao, Y. Li, B. Cai, S. Shang, L. Wang. West China Hospital, Sichuan University, Chengdu, China
Background: Chronic Hepatitis B is one of the most prevalent infectious diseases in the world. Several studies have revealed that human leukemia antigen (HLA) DP, DQ polymorphisms (rs3077, rs9277535, rs7453920) associate with the susceptibility of hepatitis b virus (HBV) infection in the Asian population including Janpanese, Korean and Chinese Han. Few studies involved ethnicities living in west China, such as the Uygur population, which has a remarkably different living habit from the Chinese Han. Besides, they are more predisposed to infection of genotype D HBV which is seldom observed in the Han population. Thus our study aims to investigate the correlation between HLA-DP, DQ polymorphisms and the susceptibility of HBV infection in the Uygur population.Methods: HLA-DP/DQ rs3077, rs9277535, rs7453920 genotypes were determined by High Resolution Melting Curve, and the results were validated through sequencing of the PCR product.Results: In total, we included 390 Uygur subjects from the west part of China, including 192 Uygur patients and 188 Uygur healthy controls, 234 male and 152 female subjects. Results showed that rs3077 (P=0.005), rs7453920 (P=0.005) and rs9277535 (P=0.008) independently correlated with the susceptibility of HBV infection. Logistic regression analysis with adjustment for covariates including age, sex and the three single nucleotide polymorphisms (SNPs) revealed that rs9277535 was signifi cantly related to the increased risk of HBV persistent infection (P=0.022, OR=1.64,95% Confi dence Interval [CI]=1.08 - 2.49), while rs7453920 correlated with a reduced risk of HBV infection (P=0.009, OR=0.56, 95%CI= 0.37 - 0.87). Detailed results were shown in Table 1.Conclusion: Our study confi rmed that HLA-DP, DQ polymorphisms correlated with the susceptibility of HBV infection in the Uygur population, especially HLA-DQ rs7453920, which has remarkable effect on the HBV infection.

Infectious Disease Wednesday, July 31, 9:30 am – 5:00 pm
CLINICAL CHEMISTRY, Vol. 59, No. 10, Supplement, 2013 A203
Genotype distributions of the three SNPs between Uygur HBV group and the healthy groupGenotype HBV Healthy Control OR 95%CI Prs3077AA 75(39.1) 98(55.7) 1.00AG 84(43.8) 59(33.5) 1.86 1.19-2.91 0.006GG 33(17.2) 19(10.8) 2.27 1.20-4.30 0.011rs9277535AA 89(46.6) 113(60.1) 1.00AG 70(36.6) 61(32.4) 1.46 0.94-2.27 0.094GG 32(16.8) 14(7.4) 2.90 1.46-5.77 0.002rs7453920GG 128(67.4) 103(53.9) 1.00AG 58(30.5) 75(39.3) 0.62 0.41-0.96 0.03AA 4(2.1) 13(6.8) 0.25 0.08-0.78 0.011
B-111
Comparison of four commercial assays for human papillomavirus detection in consecutive clinical laboratory samples including men and women.
T. Santa Rita1, M. Caixeta2, C. Chianca1, L. Velasco2, L. Abdalla2, S. Costa2, G. Barra2. 1Universidade de Brasília, Brasília, Brazil, 2Laboratorio Sabin, Brasília, Brazil
Background: Currently, there are several commercial assays for Human Papillomavirus (HPV) detection. However, there are substantial differences between their proposals, such as genotypes detected, methodology, and viral genomic target region that confer unique analytical performances for each one. Here, we compare four commercial HPV assays in consecutive samples from our HPV detection routine that’s include 1/3 of men and 2/3 women.Methods: The assays were Hybrid Capture (HC2-Qiagen), Papillocheck (Greiner-bio-one), Clart-HPV2 (Biomerieux), and Real-Time High-Risk HPV (Abbott-PCR). Ninety two (61 women and 31 men) consecutive genital samples were included. Requesting physician performed the samples collections in Specimen Transport Medium (Qiagen). Results were shown as HPV positivity (any HPV detected) and High-Risk HPV positivity (at least one HR-HPV detected). Statistical analysis were chi-square test and Cohen’ Kappa agreement coeffi cient. In divergence investigation, fail was characterized by a negative result in a sample classifi ed positive in any other method, except if the genotype was not detected by the method.Results: The overall concordance was 78.7% for women and 45.2% for men. HPV positivity was 19.7, 24.6, 27.9 and 27.9% (P=0.69) in women and 29.0, 58.1, 67.7 and 32.3% in men (P=0.0035) for HC2, Papillocheck, Clart-HPV2 and Abbott-PCR, respectively. HR-HPV positivity was 18.0, 19.7, 24.6 and 27.9% (P=0.58) in women and 22.6, 38.7, 48.4 and 32.3% in men (P=0.18) for HC2, Papillocheck, Clart-HPV2 and Abbott-PCR, respectively. The concordance and kappa between each method are shown in Table 1. HC2, Papillocheck, Clart-HPV2 and Abbott-PCR fail in 13.1, 9.8, 8.2 and 0% of the samples in women and in 35.5, 12.9, 3.2, and 12.9% in men, respectively. Not detected genotype account for 8.2% and 19.3% of the divergence in women and men, respectively.Conclusion: For women, HC2, Papillocheck, Clart-HPV2 and Abbott-PCR shown similar analytic performances. For men, Papillocheck and Clart-HPV2 shows better analytic performance than HC2 and Abbott-PCR.The concordance (%) and kappa between each HPV assay
HPV Detection HR HPV Detection
Women
Method 1 Method 2 Concordance Kappa Agreement Concordance Kappa AgreementHC2 Papillocheck 91.80 0.763 Good 93.44 0.778 GoodHC2 Clart-HPV2 91.80 0.776 Good 93.44 0.806 Very goodHC2 Abbott-PCR 85.25 0.597 Moderate 90.16 0.726 GoodPapillocheck Clart-HPV2 86.89 0.662 Good 90.16 0.709 GoodPapillocheck Abbott-PCR 83.61 0.577 Moderate 88.52 0.686 GoodClart-HPV2 Abbott-PCR 90.16 0.755 Good 93.44 0.831 Very good
Men
Method 1 Method 2 Concordance Kappa Agreement Concordance Kappa AgreementHC2 Papillocheck 70.97 0.456 Moderada 83.87 0.632 GoodHC2 Clart-HPV2 48.39 0.101 Poor 67.74 0.343 FairHC2 Abbott-PCR 77.42 0.469 Moderate 83.87 0.599 ModeratePapillocheck Clart-HPV2 77.42 0.521 Moderate 83.87 0.668 GoodPapillocheck Abbott-PCR 74.19 0.512 Moderate 90.32 0.786 GoodClart-HPV2 Abbott-PCR 64.52 0.370 Fair 80.87 0.674 Good
B-112
Comparison of Disk Diffusion and Vitek 2 for Antimicrobial Susceptibility Test in Clinical Strains of Pseudomonas aeruginosa.
A. Chebabo, R. G. Pereira, L. Honorio, V. Martins, D. Thielmann, O. Fernandes. DASA, Rio de Janeiro, Brazil
Background: Numerous studies have reported errors involving antimicrobial susceptibility tests (AST) for Pseudomonas aeruginosa, especially against β-lactams antimicrobial agents1. Because of those data, most of laboratories still use agar disk diffusion (DD) for AST of P. aeruginosa. Vitek 2 Advanced Expert System (AES) has improved ability to identify resistance, but discrepancies still occur1.Objective: We compared Vitek 2 AES to agar disk diffusion for testing susceptibility of P. aeruginosa isolates to amikacin, aztreonam, cefepime, ceftazidime, ciprofl oxacin, colistin, imipenem, meropenem and piperacillin-tazobactam.Methods: DD AST was performed according to CLSI criteria2 and was compared to Vitek 2 for category agreement (CA). AST-N105 card was used for Vitek 2 AST. Discrepancies were categorized as very major errors (VME) when Vitek 2 indicated susceptibility and DD indicated resistance, major errors (ME) when Vitek 2 indicated resistance and DD indicated susceptibility and minor errors (mE) when Vitek 2 indicated intermediate susceptibility and DD indicated susceptibility or resistance or when Vitek 2 indicated susceptibility or resistance and DD indicated intermediate susceptibility3.Results: We tested 99 clinical strains of P. aeruginosa from blood culture (n=27), bronchoalveolar lavage (n=35), catheter tip (n=16) and surgical secretions (n=9). The overall CA for all 9 antimicrobials was 90%. Discrepancies were classifi ed as mE in 9.2% of tests, ME were found in 0,3% of cases and VME in 0,4%. One VME disagreement was noted for each of the following antimicrobials: amikacin (1.0%), aztreonam (1.0%), ciprofl oxacin (1.0%) and meropenem (1.0%). One ME disagreement was noted for ceftazidime (1.0%), colistin (1.0%) and imipenem (1.0%). With the exception to colistin, mE disagreements were detected in all antimicrobials tested, with 23.2% for aztreonam, 15.2% for piperacillin-tazobactan, 11.1% for cefepime, 10.1% for amikacin and ceftazidime, 6.1% for imipenem, 5.1% for ciprofl oxacin and 2.0% for meropenem.Conclusions: Although DD is not the reference method, other studies showed that DD is more accurate than automated methods1. FDA minimal performance guidelines for TSA indicates that CA should be > 90%, ME should be < 3% and VME should be 90%. Although most of the disagreements were mE, Vitek 2 is not accurate for most β-lactams and should not be used for AST in P. aeruginosa isolates in the clinical microbiology lab.References:1. Sapino B, Mazzucato S, Solinas M, Gion M, Grandesso S. 2009. Comparison of different methods for determining beta-lactam susceptibility in Pseudomonas aeruginosa. New Microbiol;35:491-94.2. Clinical and Laboratory Standards Institute . Performance standards for antimicrobial susceptibility testing, 15th informational supplement, M100-S22, 2012.3. Ligozzi M, Bernini C, Bonora MG, de Fatima M, Zuliane J, Fontana R. 2002. Evaluation of VITEK 2 System for identifi cation and antimicrobial susceptibility testing of medically relevant Gram-positive cocci. J Clin Microbiol;40(5):1681-86.
B-113
Performance Evaluation of a Monoclonal Based Fecal Calprotectin ELISA and Comparison with an Established Assay
J. A. Erickson1, T. L. Van De Walle2, D. G. Grenache3. 1ARUP Institute for Clinical and Experimental Pathology, ARUP Laboratories, Salt Lake City, UT, 2Parasitology and Fecal Testing Technical Section, ARUP Laboratories, Salt Lake City, UT, 3University of Utah School of Medicine, Department of Pathology, Salt Lake City, UT
Background: Calprotectin is a calcium and zinc binding protein that accounts for approximately 60% of the neutrophil cytosolic protein content. Calprotectin is a member of the S100 protein family and has anti-microbial activities. Fecal calprotectin has clinical utility as a marker of intestinal infl ammation and can help distinguish between functional symptoms and organic bowel diseases. It is also useful for monitoring mucosal healing and identifying disease relapse. The objectives of this study were to assess the performance characteristics of the monoclonal antibody based Bühlmann Calprotectin ELISA and to complete a method comparison study relative to the polyclonal Calpro PhiCal™ ELISA.

Wednesday, July 31, 9:30 am – 5:00 pm Infectious Disease
A204 CLINICAL CHEMISTRY, Vol. 59, No. 10, Supplement, 2013
Methods: Fecal calprotectin was measured according to each assay manufacturer’s instructions. Samples included deidentifi ed, residual random stool specimens sent to ARUP Laboratories and provided by Alpco Diagnostics. The performance characteristics evaluated were analytical sensitivity, linearity, precision including the extraction step and not the ELISA exclusively, analyte stability and verifi cation of the recommended reference interval. Accuracy was investigated by means of a method comparison study against the PhiCal assay. The project was approved by the University of Utah’s Internal Review Board.Results: The limit of blank was <1 μg/g (24 determinations of assay buffer, mean + 3SD). Linearity was evaluated using diluted stool extracts with elevated calprotectin concentrations. Linear regression produced results of y = 1.03x + 33.6 (r2 = 0.970) and y = 1.39x + 31.4 (r2 = 0.986) for a lower (10 to 600 μg/g) and an extended (30 to 1,800 μg/g) range procedure, respectively. Imprecision studies of the lower-range procedure produced repeatability CVs of 6.8 and 3.3% and within-laboratory CVs of 16.1 and 13.0% at mean concentrations of 50 and 207 μg/g, respectively. For the extended-range procedure, repeatability CVs of 4.0 and 3.5% and within-laboratory CVs of 12.7 and 11.4% were calculated at mean concentrations of 191 and 1,008 μg/g, respectively. (One run per day for ten days, eight replicates per run per concentration level.) Calprotectin was stable in stool for a minimum of 24 hours, 7 days, and 14 days at ambient, refrigerated, and -20 °C, respectively. Calprotectin measured in samples provided by 20 healthy volunteers ranged from <10 to 89 μg/g, with only one individual measuring greater than the suggested <50 μg/g reference limit. Method comparison studies against the PhiCal assay resulted in a Deming regression of y = 1.07x + 58.5 and a Spearman correlation of 0.808 (n = 56) for the lower-range procedure and y = 1.08x + 184 with a Spearman correlation of 0.863 (n = 78) for the extended-range procedure.Conclusions: The Bühlmann Calprotectin ELISA demonstrates acceptable performance for quantifying calprotectin in stool. The upper reference limit of <50 μg/g was verifi ed.
B-114
Evaluation of commercially available histoplasma antigen reagents/assay for the diagnosis and monitoring of histoplasmosis in immunocompromised patients
X. Zhang, B. Gibson, B. Yen-Lieberman, T. M. Daly. Cleveland Clinic, Pathology and Laboratory Medicine, Cleveland, OH
Background: Urinary antigen detection is a useful method for the diagnosis of histoplasmosis, especially in immunocompromised patients. Recently, the fi rst FDA-cleared in vitro diagnostic (IVD) assay (Alpha Histoplasma Antigen EIA) and monoclonal antibody reagents became commercially available. We evaluated the analytical characteristics of the IVD assay versus an EIA based on the monoclonal antibody, and correlated both assays to a well-established laboratory-developed test (LDT) performed at a reference laboratory (MiraVista Diagnostics). Method: The IVD kits, monoclonal antibody coated plates and purifi ed histoplasma galactomannan were purchased from Immuno Mycologics, Inc (Norman, OK). Analytical performance was evaluated following the Clinical and Laboratory Standards Institute guidelines. Residual patient urine samples, healthy donors and donors with abnormal UA results (proteinuria, hematuria, glucosuria) were used in the evaluation. Evidence of histoplasmosis infection was evaluated by reviewing clinical information.Results: Analytical characteristics and clinical evaluation results are summarized in Table 1. The monoclonal LDT showed slightly improved performance in terms of precision and LLOQ when compared to the IVD. Both assays showed signifi cant quantitative variation when compared to the reference LDT. Correlation coeffi cient and mean bias was 0.6709, -7.31 for the IVD and 0.6827, 9.68 for the monoclonal method when compared to the reference laboratory. Qualitative agreement with the reference laboratory method was 75.7% (IVD) and 95.1% (monoclonal LDT). The monoclonal LDT is more sensitive and specifi c than the IVD assay, with an area under curve (AUC) by ROC analysis of 0.73 for the IVD and 0.96 for the monoclonal assay. Conclusion: The monoclonal LDT appears to provide improved performance for the diagnosis and management of histoplasmosis in immunocompromised patients.
Table 1. Assay performance characteristics and clinical evaluation
Analytical Polyclonal IVD Mean /intra-/ inter- CV
Monoclonal LDTMean/ intra-/ inter- CV
Precision (n=20) Spiked specimenPatient specimen
11.2U/mL /6.0%/4.1%2.3U/mL /5.4%/15.8%
11.9ng/mL /2.3%/4.4%13.8ng/mL/2.5%/10.0%
Reference range <2U/mL <1.3ng/mLLLOQ Spiked specimen 1.47U/mL 0.53ng/mLClinical N Polyclonal IVD
(% positive)Monoclonal LDT(% positive)
Patients: Acute stagePatients: Follow up
912
88.9%41.6%
100%83.3%
Sensitivity 21 61.9% 90.5%Healthy donor 50 24% 0%Abnormal UA 28 7.1% 10.7%Negative by MiraVista 82 20.7% 3.7%Specifi city 160 80.6% 96.3%
B-115
Serum Protein Electrophoresis (SPEP) and Immunofi xation Electrophoresis (IFE) in HIV Infected Patients: Experience in a Single Urban Tertiary Teaching Hospital
M. Zhang, B. M. Goldsmith. Temple University Hospital, Philadelphia, PA
Background: An increased rate of monoclonal paraproteins and abnormal immunoglobulin patterns have been associated with an increased risk of plasma cell/B cell lymphoma. While the availability of Anti- Retroviral Therapy (ART) has dramatically increased and changed HIV associated disorders, racial and ethnic minority populations continue to have a higher proportion of untreated cases. Different serum protein profi les among racial and ethnic populations have not been studied, making the interpretation of abnormal SPEP patterns diffi cult. The objective of this study is to investigate the difference and prevalence of abnormal SPEP and monoclonal gammopathy in an ethnically diverse population of HIV-infected patients in a large urban setting.Methods: A retrospective chart review (2011-2012, IRB approved protocol) was performed to evaluate SPEP and immunofi xation electrophoresis (IFE) results in patients with HIV infection. Demographic and clinical information (gender, age, ethnicity, ART status, CD4 count, comorbidities) and laboratory test results (serum protein levels, SPEP patterns and IFE results) were collected. The SPEP and IFE results of randomly selected patient samples during the same time period were evaluated as the control group. The percentage of paraproteins was also calculated from all SPEP results from Temple University Hospital in 2011. The HIV patients were separated into three groups: Hispanic, African American and Caucasian. The differences of immunoglobulin concentrations between HIV patients and control groups were analyzed by student’s t test. SPEP and IFE were performed using agarose gel reagents (SPIFE ®SPE Gel, SPIFE® ImmunoFix-6 Gel, Helena Laboratories, Beaumont TX ) and read on the Helena SPIFE 3000 (Helena Laboratories, Beaumont TX).Results: 31 HIV positive patients with clinical history and SPEP/IFE test results were studied: 17 African Americans (54.8%); 9 Hispanics (29%) and 5 Caucasians (16.2%). ART treatment was highest in Caucasians (88.8%) and lowest in African Americans (64%). Compared to the control group, HIV patients showed a higher gamma concentration (2.25+/-0.23 g/dL vs 1.62+/-0.12 g/dL, p<0.05), total protein (7.07+/-0.21 g/dL vs 6.4+/-0.23 g/dL, p<0.05) and a higher percentage of serum monoclonal paraproteins (25.8% vs 12%). HIV infected Caucasian patients showed similar SPEP profi les and an equal proportion of monoclonal paraproteins. HIV infected Hispanic patients showed either abnormal SPEP profi le (66.6% with distinct bands) or monoclonal paraproteins (33.3%). In addition, our data also showed that HIV patients with Hepatitis B or C infection showed an increased risk (statistically insignifi cant) of monoclonal paraproteins (37%) compared to the patients without Hepatitis B or C (13.3%) (p=0.13 by chi-square test).Conclusion: Our study indicated that HIV patients had higher gamma concentrations and an increased risk for monoclonal paraproteins. Although the ART coverage is highest in Hispanic patients, a higher percentage of abnormal SPEP profi les and monoclonal paraproteins were found when compared to the other two groups. A possible explanation includes genetic variability in response to HIV infection among different ethnic groups but the underlying mechanism needs further investigation.

Infectious Disease Wednesday, July 31, 9:30 am – 5:00 pm
CLINICAL CHEMISTRY, Vol. 59, No. 10, Supplement, 2013 A205
B-116
Amplifi cation and Detection of the BD MAX™ ExK™ TNA-2 Specimen Processing Control Target for Diagnostic Purposes in a Wide Range of Reverse Transcription (RT)/Annealing Temperatures
P. Larouche, D. Dugourd, I. Bourque, R. Labourdette, C. Lippé, B. Leclerc, V. Jean, S. Champetier, D. Beaulieu, J. Pinard-Lachapelle, J. Cormier, C. Ménard, C. Roger-Dalbert. BD Diagnostics, Quebec, QC, Canada
Background: The BD MAX™ System is a next generation sample-to-answer molecular testing platform. The new BD MAX™ TNA (for Total Nucleic Acid) suite, part of the Open System Reagent (OSR) series, combines specimen-specifi c extraction reagents (ExK™) with universal PCR reagents (MMK) allowing users to extract, purify and amplify multiple RNA and DNA targets from a single biological specimen with their own user defi ned protocols. A Specimen Processing Control (SPC), consisting of an armored RNA incorporated into the extraction reagents controls for extraction effi ciency, reagent integrity and PCR inhibition by the sample. The objective of this study was to demonstrate the amplifi cation of the SPC over RT/annealing temperatures ranging from 55 ºC to 65 ºC, temperatures which accommodate most designs of target-specifi c primers and probes.Methods: Total nucleic acid extraction and amplifi cation were performed without clinical sample, using the BD MAX System with BD MAX ExK TNA-2*, specifi c for stool and cerebrospinal fl uid specimens, and BD MAX TNA MMK(SPC)*, a universal master mix incorporating SPC primers and probe. The amplifi cation thermal profi le consisted of an activation step, reverse transcription (55, 60 or 65 ºC), and 45 cycles of a 2-step PCR with annealing performed at 55, 60 or 65 ºC. A threshold of 100 units in endpoint fl uorescence values (Quasar-705) was set to consider positive amplifi cation.Results: A positive amplifi cation signal was obtained for all conditions (n=48). A mean cycle threshold (Ct) of 25.99 and a mean Quasar-705 endpoint fl uorescence of 3143 were achieved. There was no statistical difference observed between tested RT/annealing temperatures for Ct (p=0.659) or endpoint fl uorescence (p=0.167).Conclusion: The BD MAX ExK TNA-2 Specimen Processing Control target is consistently amplifi ed over an RT/annealing temperature range of 55 to 65 ºC, which gives users fl exibility to design compatible primers and probes solutions for the detection of their RNA/DNA targets over a wide temperature range.*The BD MAX™ ExK™ TNA-2 and BD MAX™ TNA MMK(SPC) are not available for sale or use.
B-117
The prevalence of intestinal parasites in patients from Public Hospital in Belo Horizonte - Brazil: from 2000 to 2012
L. d. Vasconcellos, L. F. Vieira, D. H. Bücker. Universidade Federal de Minas Gerais, Belo Horizonte, Brazil
Background: In Brazil, intestinal parasites are a relevant problem in public health service. The insuffi cient basic sanitation resources associated to absence of personal hygienic habits favors the prevalence of the parasites among the population. The parasitological stool test is a relevant exam to diagnosis and treatment orientation. Is important to know the prevalence of intestinal parasites in your population. The objective of the study is to assess the prevalence of intestinal parasites in patients from Public Hospital in Belo Horizonte - Brazil, comparing two periods: from 2000 to 2004 and 2011 to 2012.Methods: In the periods of May 2000 to March 2004 and January 2011 to December 2012, 24425 and 5409 stool samples were performed, respectively. All the samples were processed by standard techniques, according to the clinical hypotheses, such as Kato-Katz, Hoffman-Pons-Janer and Baermann-Moraes techniques.Results: Over the period of 2000 to 2004, 17,877 samples were negative (73.2%) and 6575 positive (26.8%). In 2011-12, 4,251 samples were negative (78.5%) and 1,158 positive (21.5%). In the both periods, the male patients were more affected (53%). Among the positive population, 31.7% were from under 20 years old, 56.6% were from 21-70 years, and 11.7% were from over 71 years old. One single parasite was observed in 57% samples, two were found in 29.9%, three in 9.6%, four in 3.1% and fi ve different parasites were found in 0.4% stool samples. The prevalences of the parasites are set out in table 1.Conclusions: In the last decade, there were a few changes in the profi le of intestinal parasites in patients from Public Hospital of Belo Horizonte - Brazil. E.coli remains the most prevalent parasite in stool sample test. The reduction of prevalence of some parasites (Ascaris lumbricoides, Trichuris trichiura and Ancylostoma) may be related to improvement of public sanitation.
Table 1: Prevalence (%) of intestinal parasites in patients from Belo Horizonte, BrazilParasites 2000-2004 2011-2012Entamoeba coli 8.3 8.4Blastocystis hominis 6.6 7.4Entamoeba histolytica 4.3 5.9Endolimax nana 4.1 5.1Giardia lamblia 3.0 3.5Strongyloides stercoralis 1.3 1.5Ascaris lumbricoides 1.1 0.2Schistosoma mansoni 1.0 1.5Trichuris trichiura 0.6 0.2Ancylostoma 0.6 0.2Hymenolepis nana 0.3 0.2Enterobius vermicularis 0.2 0.1Isospora belli 0.1 0.1Taenia sp 0.1 0.1
B-118
Geographical HPV genotype distribution among men and women in Brazil’s Federal District
M. Caixeta1, M. Franco1, L. Velasco1, L. Abdalla1, S. Costa1, V. Schimitt2, G. Barra1. 1Laboratorio Sabin, Brasília, Brazil, 2Pontifícia Universidade Católica do Rio Grande do Sul - PUCRS, Porto Alegre, Brazil
Background: The prevalence of HPV genotypes varies geographically, and HPV infection in men is relatively less described and understood. The aim of this study was to describe the geographical distribution of HPV genotypes and infection parameters in men and women from Federal District’s administrative regions (AR) by assessing our clinical laboratory results database. In 2010, the Federal District population is comprised of 2.562.963 inhabitants and it’s territory is divided in 31 ARs.Methods: Through retrospective analysis of our HPV genotyping database, we assessed the samples results between February 2009 and May 2011. 4,251 samples were included all from HPV genotyping test of anogenital region. Samples were grouped by AR and only regions with more than 150 positive cases were included in the analysis (n=3,126). The HPV positivity, type of infection (single or multiple) and genotype distribution were identifi ed and presented by gender and by region. HPV genotyping was performed using PapilloCheck (Greiner Bio-One), which evaluates 24 different HPV genotypes (18 high-risk and 6 low risk). PUC-RS ethic committee approved this study.Results: The ARs included in the study were: Aguas Claras, Asa Norte, Asa Sul, Guara, Lago Norte, Lago Sul, Sobradinho, Sudoeste, and Taguatinga. Positivity was different among ARs considering all samples (P=0.0068) and in men (P=0.025), but not in women (P=0.14). Multiple and single infection were similar among all ARs considering all samples (P=0.68), men (P=0.72) and women (P=0.33). Genotypes distributions are shown in Figure 1 and, in the majority of ARs, the genotype more prevalent in men was HPV-6 and in women was HPV-16.Conclusion: There are geographical differences in HPV genotype distribution and in positivity among men and women in the studied ARs of Brazil’s Federal District. In all ARs, multiple infection has high prevalence and HPV-6 is more prevalent in men and HPV-16 in women.

Wednesday, July 31, 9:30 am – 5:00 pm Infectious Disease
A206 CLINICAL CHEMISTRY, Vol. 59, No. 10, Supplement, 2013
B-119
Seroprevalence of HTLV-1/2 infection and its association with HCV and HIV infection among population attended in a commercial laboratory in Rio de Janeiro, Brazil.
I. Bendet1, T. S. P. Souza1, L. Zanella2, A. C. P. Vicente2, O. Fernandes1. 1Immunology Division - DASA, Rio de Janeiro, Brazil, 2Instituto Oswaldo Cruz, Rio de Janeiro, Brazil
Background: Human T-lymphotropic virus (HTLV) infects around 20 million people worldwide, with endemic areas in South America, Caribbean and Africa. This virus infection is endemic in Brazil, where around 2 million people can be infected. Screening potential blood donors for HTLV is mandatory in Brazil. The mean prevalence rate of HTLV infection in this group, in the Brazilian geographic regions, is quite distinct from 0.04% in Florianópolis, South region, to 1.0% in São Luis, Northeast region. In Rio de Janeiro, Southeast region, the seroprevalence is 0.47%. However, the prevalence of this infection in general population is largely unknown. The aim of this study was to evaluate the seroprevalence of HTLV-1/2 infection in Rio de Janeiro population and the association with the presence of antibodies to HCV and HIV virus, all of them transmitted by sexual or blood contact.Methods: We analyzed 27.308 samples from the laboratory routine with medical request for HTLV serology from Jun 2010 to Jun 2012. It was also evaluated the presence of anti-HCV in 23.118 samples and anti-HIV antibodies in 23.939 samples. The mean age of individuals was 37 years (2-97 years).19.897 (72.90%) and 7.395 (27.10%) of individuals were female and male respectively. The antibodies detections were performed using the immunoassays: Abbott Architect rHTLV-I/II, Abbott Architect anti-HCV, Johnson Vitros anti-HCV, Roche Modular anti-HCV, Abbott Architect HIV Ag/Ab Combo and Roche Modular anti-HIV Combi.Results: 243 (0.89%) individuals were positive for HTLV antibody, 174 (0.87%) female and 69 (0.93%). There was no signifi cant difference related to gender (p=0.66) and the positivity increase according to age as has been pointed in the literature. Anti-HCV was positive in 163 (0.71%) samples and anti-HIV in 421 (1.75%) in this population. 11 (6.75%) samples were positive for both, anti-HTLV and anti-HCV (p<0.01), and one (0.27%) positive for anti-HTLV and anti-HIV (p=0.48). No association was found between HTLV and HIV infection.Conclusion: Interestingly, the HTLV seroprevalence among this population was higher than previously determined among blood donors from the same region. This prevalence was almost twice higher and one consequence can be an increase in the absolute number of infected individuals in the country than what had been estimated based on the prevalence in blood donors. The association found with HCV, and no association with HIV, corroborate previous fi ndings in blood donors.
B-120
Performance Evaluation of a Prototype Quantitative HBsII Assay on the ADVIA Centaur System
S. Shin, S. Chowdhury, P. Cusack, S. Patibandla. Siemens Healthcare Diagnostics, Tarrytown, NY
Background: The ADVIA Centaur® Quantitative HBsII assay (QHBsII)* provides quantitative detection of hepatitis B surface antigen in human serum and plasma when run on the ADVIA Centaur Immunoassay System. The QHBsII assay is standardized against the NIBSC standard (00/588 WHO 2nd Standard for HBsAg).Methods: For optimum performance, initial 1:500 onboard dilution is mandatory for every sample. If a result is found within the measuring range (0.02-250 IU/mL) for 500-fold diluted sample, no further dilution is necessary. If result is found below the lower range, the sample must be run neat. If a result is >250 IU/mL, a 1:2500 onboard dilution must be performed. In sample with high concentration of HBsAg, further off-line manual dilution of the prediluted sample may be needed to achieve results within the measuring range.In this study, the limit of blank (LOB; analytical sensitivity), limit of detection (LOD), and limit of quantitation (LOQ) were determined as described in the CLSI EP17-A guideline. Linearity was evaluated by diluting HBsAg-positive pool spiked samples into negative pool. Precision was determined according to the CLSI EP5-A2 protocol: two runs/day for 20 days. The WHO 2nd International Standard 00/588 was diluted from 66 IU/mL to 0.010 IU/mL and assayed to verify the standardization of the QHBsII assay. Expected values were established by testing 472 HBsAg patient samples on the ADVIA Centaur systems. Mutant HBsAg samples were diluted to low concentration and evaluated for quantitation. Samples from potential cross-reactive and therapeutic drug interference were evaluated.
Results: The QHBsII assay gave LOB and LOD values of 0.008 IU/mL and 0.020 IU/mL, respectively. The % total analytical error (TAE) was determined to be 27.7%, thereby allowing the test concentration of 0.050 IU/mL to be the LOQ. On the ADVIA Centaur system, the QHBsII assay is linear from 0.020-250 IU/mL, with R value of 0.9995. In a 20-day precision study, the QHBsII assay had within-run and total % CVs of less than 9.1% and 14%, respectively, over the assay range. The QHBsII assay is standardized to WHO 2nd International Standard 00/588. A comparison over the range of 0-66 IUI/mL gave the following correlation:ADVIA Centaur Quantitative HBsII = 1.0257 (WHO) + 0.0697 IU/mL; r = 1For the HBsAg-positive samples, the observed concentration ranged from 10 to <1000 IU/mL in 21.6% and 1000 to <100,000 IU/mL in 62.5% of the samples. Twenty-six mutant HBsAg samples were quantitated, and observed concentrations ranged from 0.282-4.698 IU/mL. This assay was evaluated for potential cross-reactivity with other viral infections, disease-state specimens, and therapeutic drugs, and no change in clinical interpretation was observed.Conclusions: The results of this study show that the prototype ADVIA Centaur Quantitative HBsII assay is a rapid, precise, highly specifi c immunoassay capable of measuring HBsAg quantitatively in human serum or plasma.*Under development. Not available for sale. Product availability will vary by country.Keywords: Quantitative HBsAg, Centaur
B-121
Robustness studies and ease of use of a new fully automated molecular Assay for the detection of Staphylococcus aureus, the BD MAX™ StaphSR Assay*.
D. Roy, V. Blanchette, M. Guillot, A. Charbonneau, F. Hamel, N. Dionne, S. Matte, E. Kadiric, M. Boutin, C. Roger-Dalbert. BD Diagnostics,
Quebec city, QC, Canada
Background: Healthcare-associated infections (HAI) is a growing problem in most of the industrialized world. Methicillin-resistant Staphylococcus aureus (MRSA) is one of the leading causes for these infections in the US as well as in some European countries. Indeed, even though the rate of infection has generally decreased over the past decades, it remains high and is still a major risk for the health care system and its patient population. The objective of this study was to evaluate a novel assay developed on the BD MAX™ System for the detection of S. aureus and MRSA and mainly focus on its robustness, hands on time (HOT) and overall turnaround time (TAT). Methods: The robustness studies performed on the BD MAX™ StaphSR Assay focused on inadequate use of the assay and the system. Potential failure modes were identifi ed and tested to evaluate the effect on the assay performance. MRSA negative specimens and MRSA positive specimens at 2-3 x LoD95% (Limit of Detection) were tested in the presence of simulated nasal matrix. The effect analysis was based on status analysis of positive and negative specimens as well as equivalency study on one selected PCR metric. In a clinical laboratory environment, time is of the essence. HOT and TAT were measured as an average of three independent runs performed by three technologists. Finally, carry-over and cross-contamination studies were performed. Results: The robustness tests revealed that the assay performances can be impacted by inadequate vortexing (no vortex or lowest vortex speed). Otherwise, all expected results were obtained and no statistical difference between conditions were observed for cycle threshold values. Minimal carry-over contamination was observed (1%), HOT was about 30 seconds per sample and overall TAT, including sample preparation and complete PCR, was under 155 minutes. Conclusion: The present study confi rms that the BD MAX™ StaphSR Assay is a robust diagnostic test. Its ease of use and automation reduces technician time and ensures fast and reliable results for use by clinicians and health professionals.*The BD MAX™ StaphSR Assay is not available for sale or use in the U.S.

Infectious Disease Wednesday, July 31, 9:30 am – 5:00 pm
CLINICAL CHEMISTRY, Vol. 59, No. 10, Supplement, 2013 A207
B-123
First Report on identifi cation of plasmid mediated quinolone resistance genes in E. coli and K. pneumoniae strains from Pakistan
M. Faiz1, S. Rafi que2, H. Batool2, A. Younis2, F. Anwar3, T. Bashir1, A. Shahid1. 1Institute of Nuclear Medicine and Oncology, Lahore, Pakistan, 2Kinnaird college for Women, Lahore, Pakistan, 3University of Lahore, Lahore, Pakistan
Background: Multidrug resistance in Enterobacteriaceae including resistance to quinolones is rising worldwide and complicating the treatment of serious nosocomial infections. Resistance to quinolones in Enterobacteriaceae is classically chromosomally mediated. However, most commonly it arises stepwise as a result of mutation usually accumulating in the genes encoding primarily DNA gyrase or changes in the expression of outer membrane and effl ux pumps. Several recent studies have indicated that plasmid-mediated resistance mechanisms also play a signifi cant role in fl uoroquinolone resistance, and its prevalence is increasing worldwide . Now quinolone resistance determinants (qnrA, qnrB, qnrC and qnrS) have been identifi ed in a series of enterobacterial species from the United States, Europe, Japan and Near and Far East. In Pakistan, the presence of the qnr gene in the clinical isolates of Enterobacteriaceae has not been reported. Objectives: This study, therefore aimed to investigate the presence of the qnr gene in clinical isolates of E. coli and K. pneumoniae from Pakistan. Methods: A total of one hundred fi fty, non-repetitive, ciprofl oxacin resistant E. coli (n=110) and K. pneumoniae strains (n=40) were isolated from urinary specimens of patients from January 2010 to October 2010 using standard microbiological techniques. Minimal inhibitory concentrations (MICs) of the antibiotics were determined according to the Clinical and Laboratory Standards Institute (CLSI). Screening of qnrA, qnrB, and qnrS by was performed by polymerase chain reaction (PCR) amplifi cation. Results: PCR amplifi cation of Qnr gene in 110 E. coli isolates and 40 K. pneumonia isolates was performed. qnr gene was detected in 11% (17 out of 150) strains tested. In E.coli, qnrB gene was detected in 6 out of 110 strains (6%). No qnrA, qnrS or both were identifi ed in any of the strains. Similarly 11 out of 40 (28%) Klebsiella isolates had qnr genes where 7 (64%) samples showed qnrB, 3 (27%) qnrS and 1 (9%) showed both qnrS and qnrB while none showed qnrA (Figure). In both E.coli and Klebsiella sp, none of the strains showed qnrA or qnrA and qnrB both. Plasmid transfer was achieved in Klebsiella K-1 strain. MICs of ciprofl oxacin for qnrB positive transformants range from 8-16μg/ml than recipient strains. Conclusion: In conclusion, this study constitutes the fi rst report on the identifi cation of qnr-like determinants in Enterobacteriaceae from Pakistan. Further studies are needed to document the prevalence of qnr in larger number of samples as well as role of chromosomally-mediated or/ other mechanisms of resistance towards quinolone resistance.
B-124
Molecular characterization of clinical isolates of Carbapenemase producer Klebsiella pneumoniae (KPC) resistant to polimyxin in a Hospital in São Paulo, Brazil
E. K. Gumpl1, R. C. M. Cabral1, J. Monteiro2, C. R. L. Fonsceca3, O. V. P. Denardin3, A. C. C. Pignatari3. 1UNIFESP, SÃO PAULO, Brazil, 2Unifesp, SÃO PAULO, Brazil, 3DASA, SÃO PAULO, Brazil
Background: Polimyxin is one of the few remaining options for treatment of KPC, a multiresistant opportunistic pathogen, responsible for nosocomial infections with high morbidity and mortality. Recently, isolates of KPC resistant to polimyxin have been described in the course of treatment with this antibiotic. The aim of the study was to molecular characterize isolates resistant to polimyxin from patients admitted to a hospital of São Paulo, Brazil.Methods: From July 2011 to March 2012, 21 clinical isolates of Klebsiella pneumoniae resistant to the carbapenem ertapenem , were identifi ed by the automated system Vitek2 (BioMerieux) in the clinical microbiology laboratory of a 300-beds general private hospital. The isolates were tried for carbapenem resistance by the Hodge modifi ed test and for the presence of the blaKPC gene by polimerase chain reaction (PCR). Resistance to polimixin was confi rmed by broth microdilution. The isolates were molecular typed by Pulsed Field Gel Electrophoresis (PFGE) and Multilocus Sequence Typing (MLST).
Results: All 21 ertapenem resistant isolates were positive by the modifi ed Hodge Test and for blaKPC. Nine out of these 21 isolates were resistant to polimyxin (42%). The PFGE analysis revealed 6 different clonal profi les. The clone “A” was observed in 76.2% (16) of the isolates, and the clones “B”, “C”, “D”, “E” e “F” were found in only one isolate each. Eight of the 9 isolates resistant to polimixin were classifi ed in the clone “A”. The MLST was done only for clone “A” isolates showing sequence type 11 e 437 (only one allele difference).Conclusion: The molecular techniques were useful to identify the persistence of the same clonal profi le of KPC in a period of 9 months in clinical isolates obtained from patients admitted to the hospital, and also the emergence of polimixin resistant strains. These data are important to better understand and to control the dissemination of these multiresistant microorganism in hospitalized patients.
B-125
Metabolic Disorders Associated to HIV/AIDS Infection and Treatment in Ceará, Brazil
C. M. M. PONTE1, M. G. CASTELO1, G. A. PONTE2, R. M. MONTENEGRO JR3, P. M. PONTE3, M. O. GOMES4, T. J. P. G. BANDEIRA4, I. V. ROCHA4, O. FERNANDES5. 1UFC; DASA, FORTALEZA, Brazil, 2HSJ-SESA, FORTALEZA, Brazil, 3UFC, FORTALEZA, Brazil, 4DASA, FORTALEZA, Brazil, 5DASA, SÃO PAULO, Brazil
Background: After the advent of antiretroviral therapy (ART), HIV/AIDS patients have been observed to develop a chronic-degenerative profi le characterized by the presence of several endocrine and metabolic disorders such as metabolic syndrome, type 2 diabetes mellitus (DM2), dyslipidemia and lipodystrophy, conditions known to be associated with increased cardiovascular risk. Moreover, it is recognized that HIV itself plays a signifi cant role in the emergence of these changes. The aim of this study was to determine the prevalence of metabolic disorders in patients with HIV / AIDS followed at Hospital São José, considered a reference center for the treatment of this condition.Methods: We conducted a cross-sectional study which included 144 patients treated in outpatient program for HIV / AIDS among the months from January to May 2010, selected sequentially. For the control group were randomly selected 95 patients without HIV infection. Patients underwent medical evaluation, physical examination, meansurement of waist circumference (WC) and collection of blood samples fasting in the morning, for determination of glucose, insulin, total cholesterol, high density lipoprotein (HDL), triglycerides, lymphocyte count CD4 and viral load HIV. We calculated the HOMA-IR to infer the insulin resistance and cardiovascular risk was estimated by the Framingham Risk Score. Data were subjected to statistical analysis, being used for this purpose, the program StataTM, version 9.1. In data analysis, we used the Student t test, Mann-Whitney, Spearman’s linear correlation, chi-square test, Fisher exact test and Mantel-Haenszel X2, with statistical signifi cance level of 5% (p <0.05).Results: We observed a high prevalence of DM2 (7.3% vs. 1.1%, p <0.05), low HDL (70.3% vs. 46.1%, p <0.05) and hypertriglyceridemia (54 3% vs. 32.6%, p <0.05) in patients with HIV / AIDS compared to the control group. DM2 (9.5% vs. 2.5%, p <0.05) and hypertriglyceridemia (68.4% vs. 41.0%, p <0.05) were more frequent among patients on ART vs. without ART, while low HDL was found in the same proportion among subjects exposed and not exposed to ART (68.4% vs. 75.0%, p> 0.05). There was a lower proportion of patients with measurement of WC increased in the group with HIV infection using ART versus control (18.6% vs. 42.1%, p <0.05). We observed increase in the proportion of individuals at risk greater than 20% in 10 years (high risk) in patients with on ART versus control (16.7% vs. 3.2%, p <0 , 2005). There was no difference in the prevalence of metabolic syndrome among patients with and without HIV infection (26.4% vs. 31.9%, p> 0.05). Lipoatrophy of subcutaneous tissue was observed in 28.8% of patients infected with HIV, only among those in treatment. Lipohypertrophy was detected in 14.6% of patients on ART. HIV-associated lipodystrophy was observed in 39.4% of patients with HIV infection on ART.Conclusion: In conclusion, these data indicate the high prevalence of metabolic abnormalities among patients with HIV infection in our country and guide it in the context of public health, we must consider the need to develop strategies that promote the reduction of metabolic complications and cardiovascular disease in this susceptible group.

Wednesday, July 31, 9:30 am – 5:00 pm Infectious Disease
A208 CLINICAL CHEMISTRY, Vol. 59, No. 10, Supplement, 2013
B-126
Phenotypic (VITEK2 System) and genotypic characterization of Burkholderia pseudomallei strains isolated in Brazil.
T. J. P. G. BANDEIRA1, M. G. CASTELO2, C. M. M. PONTE2, L. M. O. PONTE1, E. T. OLIVEIRA1, F. P. VENTURA1, L. G. A. VALENTE1, V. P. G. WIRTZBIKI3, F. B. SAMPAIO3, C. S. P. ARAUJO3, T. T. LEITE4, G. P. G. WIRTZBIKI3, O. FERNANDES5. 1DASA, FORTALEZA, Brazil, 2UFC; DASA, FORTALEZA, Brazil, 3FACULDADE DE MEDICINA CHRISTUS, FORTALEZA, Brazil, 4SESA, FORTALEZA, Brazil, 5DASA, SAO PAULO, Brazil
Melioidosis is a serious infectious disease caused by Burkholderia pseudomallei. The disease is endemic in Southeastern Asia and hyperendemic in Northern Australia. In Brazil, it is considered an emerging disease, since April 2003, when it was fi rst diagnosed in Ceara, Northeastern Brazil. In the last eight years, thirteen cases were reported. Considering the occurrence of melioidosis in Ceara, this work aimed at studying these clinical and environmental strains of Burkholderia pseudomallei isolated from Ceara from 2003 to 2011, focusing on phenotypic and molecular identifi cation.Genotyping was performed through Random Amplifi ed Polymorphic DNA (RAPD).The primers used were: OPQ-16 (AGTGCAGCCA), OPQ-4(AGTGCGCTGA) and OPQ-2 (TCTGCTGGTC). RAPD-PCR showed a genetic relatedness of 63% among the B. pseudomallei strains from the State of Ceará, which were grouped in two different clusters. The environmental strains isolated in Tejuçuoca were grouped in a single cluster along with the clinical strains isolated from the same municipality. Six of our clinical strains were isolated from fatal cases of melioidosis, of which four were grouped in cluster II. Leelayuwat et al. (2000) observed a signifi cant association of determined RAPD patterns of B. pseudomallei strains with the occurrence of septicemic melioidosis without an association with lethality. In the present study, we observed an association of determined RAPD patterns with the septicemic form of melioidosis (cases in cluster II) and with fatal outcomes [17]. All 20 strains from B. pseudomallei were accurately identifi ed by both VITEK2 ® and sequencing of the 16S DNA with 100% of agreement. The assimilation of L-arabinose was also used whose negative result had confi rmed the identifi cation of strains as B. pseudomallei.This study will contribute to the clinical-epidemiological characterization of melioidosis in the State of Ceara and to the awareness of the competent health departments to include the state as an endemic zone for the disease.
B-127
Respiratory virus frequency in Brazilian samples in 2012.
M. Gimenez, C. Ceabra, A. Alfi eri, L. Scarpelli, O. Denardin, N. Gaburo. DASA, Sao Paulo Brasil, Brazil
Background: The Respiratory virus infection is one of the most important causes of childhood respiratory diseases. Data describing the most common agents among the Brazilian population using molecular biology techniques for a large variety of agents is scarce.Objective: The aim of this study was to determine the frequency of respiratory virus in Brazilian samples collected from January to December 2012 using CLART ® Pneumovir (Genomica, Madri, Spain), method that simultaneously detects 18 different respiratory viruses (RV) using microarray technology.
Methods: We processed 510 samples of nasopharyngeal, secretions from children and adult population at DASA’s Department of Molecular Biology. Viral RNA and DNA was isolated and processed with CLART Pneumovir This test is based on RT-PCR reaction follow by detection through a low density microarray platform, and detects the following agents: Adenovirus, Bocavirus, Coronavirus, Enterovirus, Infl uenza virus A (human H3N2 and H1N1 2009), B, and C, Metapneumovirus A and B, Parainfl uenza virus 1, 2, 3, and 4, Rhinovirus, Respiratory Syncitial Virus A and B.Results: Frequency of single or multiple infections are described on Table 1 according with age group).
Age group(years)
N. of patients
Not detected(%)
Single infection(%)
Multiple infection(%)
Virus more frequent
1) less than 1 169 29 54 17 Parainfl uenza virus 3
2) 1 to 14 251 26 43 31 Adenovirus3) older than 14 90 68 30 2 RhinonvírusTotal 510 34 45 21Conclusion: Using technologies that allows simultaneous detection of many agents lead to better understanding of the most common agents. Infection by two or more agents was quite common and represented 30% of all samples with detectable results. Multiple infections were more common among children.
B-129
Diagnostic value of procalcitonin and follow-up treatment in septic patients in Vietnam.
L. X. Truong1, B. T. H. Chau2, N. T. B. Suong2. 1Chief of Biochemistry Department, University of Medicine and Pharmacy, Hochiminh City, Viet Nam, 2Biochemistry Department, University of Medicine and Pharmacy, Hochiminh City, Viet Nam
Background: Sepsis is serious illness, and its prevalence is still increasing during 30 years.Objective: To confi rm diagnostic value of procalcitonin (PCT) and follow-up treatment in sepsis by the kinetic of PCT with white blood cell (WBC) and CRP test.Method: Estimate similarity of WBC and CRP with serum PCT concentration on four groups, group 1 include 30 healthy volunteers (n=30), group 2 have 40 dengue fever patients (n=40), group 3 have 70 patients have illness with is similar to infection but non sepsis (n=70), group 4 include 100 septic patients with positive blood cultures (n=100).Results: Mean value of serum PCT in group 1 was 0.08ng/ml (0.06-0.27), group 2 was 0.19ng/ml (0.07-1.87), group 3 was 0.20ng/ml (0.11-6.34) and group 4 was 7.94ng/ml (0.10-488.00). The best cut-off point to distinguish between septic patients (group 4) and patients had infection but not sepsis (group 3) for PCT was 1.91ng/ml, CRP was 33mg/L, WBC was 13475/mm3. At patients of group 4 who responded well to treatment, mean value of PCT before antibiotic treatment was 7.13ng/ml (0.20-122.50), after 2 days of antibiotic treatment was 1.23 ng/ml (0.12-50.00), and after 6 days of antibiotic treatment was 0.35ng/ml (0.07-13.47). So, there are differences in PCT levels between groups (p<0.001).At patients of group 4 who didn’t respond to therapy, mean value of PCT before antibiotic treatment was 19.36ng/ml (1.97-488.00), after 2 days of antibiotic treatment, mean value of PCT was 22.74ng/ml (0.55-54.27), after 6 days of antibiotic treatment, PCT was 17.23ng/ml, after 8 days of antibiotic treatment, mean value of PCT was 52 ng/ml. Serum PCT concentrations raised highly when antibiotic treatment was not suitable. CRP also increased like PCT but slowly. WBC changed unsuitably.Conclusion: Serum PCT concentration in septic patients was higher than patients who have illness similar to infection but non sepsis. The kinetic of PCT could follow-up treatment in sepsis. Serum PCT concentration was better than serum CRP concentration and white blood cell count in terms of early diagnosis of sepsis, in detecting the severity of the illness, and in evaluation of the response to antibiotic treatment.

Infectious Disease Wednesday, July 31, 9:30 am – 5:00 pm
CLINICAL CHEMISTRY, Vol. 59, No. 10, Supplement, 2013 A209
B-133
Ideal fl ow suggestion on determination of anti - T. cruzi IgG class antibodies (Chagas disease) among CMIA and ELISA methods in laboratorial context
M. F. Mantovani1, L. G. S. Carvalho1, E. A. Pante2, N. L. R. Junior1, C. F. A. Pereira3. 1Álvaro Center for Analysis and Clinical Research – Diagnósticos da América (DASA), Cascavel, Brazil, 2Faculdade Assis Gurgacz - FAG, Cascavel, Brazil, 3Diagnósticos da América (DASA), São Paulo, Brazil
Background: Chagas is an infecto-contagious disease that affects America from the southern United States to Chile and Argentina, this infection made by the haemoprotozoan Trypanosoma cruzi, in its chronic phase has essentially serological diagnosis and should be tested using a high sensitivity test, and, positives samples, confi rmed by another methodology with high specifi city for determining the diagnostic. Currently the methodologies used for this research are enzyme immunoassays (ELISA), indirect immunofl uorescence (IIF), indirect hemagglutination (IHA) and chemiluminescence microparticle immunoassay (CMIA).Objective: In a random study CMIA and ELISA serological assay methods were applied, for determining, inside lab routine, which fl ow is the best between both methods on diagnostic determination of IgG antibodies on Chagas disease.Methods: During one month, 8,520 random samples from Laboratory Alvaro – Center of Analysis and Clinical Research were tested with CMIA (Chagas Architect ®, Abbott) and ELISA (Gold ELISA Chagas® REM Industry and Trade LTDA). Tests were performed following the manufacturer’s instructions and evaluated together with internal control for each kit used.Results: When tested by CMIA the 8,520 samples showed 7,288 no reactive results, 12 inconclusive and 1,220 reactive. In the same samples, when tested by ELISA, 7,314 no reactive results were observed, 07 inconclusive and 1,199 reactive.In the result analysis from CMIA/ELISA methods 35 (0.41%) results were discrepant with, respectively, 01 result inconclusive/reactive, 11 results inconclusive/nonreactive, 06 results reactive/inconclusive, 16 results reactive/nonreactive and 01 result nonreactive/inconclusive.The fl ow CMIA as initial test and confi rmatory screening by ELISA, for the non-reactive results, eliminates the need to retest because the fl ow showed a CMIA confi rmation of 99.99%. We also observed 99.92% sensitivity for reactive samples, with this fl ow. Regarding the reverse fl ow, the ELISA assay showed 99.44% of assertiveness for non-reactive results and sensitivity of 97.81%.Conclusion: Thus, we conclude that using the CMIA test in the initial screening we have the best process fl ow, because if they get greater sensitivity in detecting reactive samples and reduced to 0.013% chance of releasing a false negative result when confi rmed by ELISA.
B-135
Expression of Cosignal Molecules in Different Stages of Patients with Hepatitis B Infection
J. Chen, Y. Fu, Y. Li, Z. Su, L. Luo, Y. Liao, L. wang. Department of Clinical Immunological Laboratory, West China Hospital, Sichuan University, chengdu, China
Objective: Chronic hepatitis B(CHB) affects 400 million people and is the most common cause of liver cirrhosis(LC) and hepatocellular carcinoma(HCC) worldwide. Cellular immune regulation plays an important role in determining the infection outcome. Cosignal molecules were studied to explore their association with progress of HBV infection and to fi nd new treatment strategy. Methods: 94 patients of HBV infection were categorized into three groups: 31 LC caused by CHB, 30 HCC caused by CHB, and 33 CHB. Patients who were positive for anti-HCV or anti-HIV or alcohol abuse ones were excluded. Three kinds of costimulatory molecules and three kinds of coinhibitory molecules were analyzed by fl owcytometer.Results: CHB patients who progress to LC or HCC showed a signifi cant higher level of coinhibitory molecules such as BTLA,PD-1, While there was no signifi cant difference of costimulatory molecules between LC,HCC and CHB.Conclusion: Coinhibitory molecules play more important role than costimulatory molecules. HVEM serves as a molecular switch activating both stimulatory and inhibitory pathways. LIGHT-HVEM signal initiates costimulatory signal promoting infl ammation and enhancing immune responses, by initiating activation of NF-KB through a TRAF-dependent serine kinase cascade. By contrast, HVEM engagement of BTLA and CD160 activates inhibitory signaling in lymphoid cells through recruitment
of SHP-1 and SHP-2 phosphatases, which attenuate tyrosine kinases activated by TCR-Ag recognition. Blockage of coinhibitory molecules BTLA/HVEM pathway seems to be new ideas in preventing worse progress of HBV infection.
Expression of Cosignal Molecules in different stages of patients with hepatitis B infectionn CD28 ICOS LIGHT HVEM BTLA CD160 PD-1
control 34 14(8,17) 10(7,17) 52(41,59) 40(18,74) 30(14,42) 6(3,9) 6(5,8)CHB 33 15(9,18) 10(8,16) 48(30,59) 31(9,62) 22(11,32) 7(4,11) 4(2,6)LC 31 12(7,16) 12(5,18) 50(47,59) 94(46,99)* 57(18,66)* 3(2,6)* 9(4,9)*HCC 30 13(7,18) 11(6,18) 54(41,62) 75(30,87)# 52(16,63)# 6(3,9) 8(5,10)#* LC vs CHB: P<0.05# HCC vs CHB: P<0.05
B-136
Procalcitonin as a useful marker to guide antibiotic treatment in patients with acute dyspnea
J. Searle, A. Slagman, C. Müller, J. von Recum, M. Stockburger, F. Holert, J. O. Vollert, M. Möckel. Charité, Berlin, Germany
Background: Acute dyspnea is a leading symptom in acute Cardiology and is associated with high in-hospital mortality. Early and adequate treatment strategies are of utmost importance. This study evaluates the prognostic value of Procalcitonin (PCT) in patients with acute dyspnoea in the ED, and the infl uence of adequate antibiotic therapy on patient outcome.Methods: Consecutive patients with acute dyspnea (n=305) were enrolled in the ED. Blood samples were drawn at admission. Outcome was assessed after 3 months. Initiation of antibiotic therapy before discharge from the ED was documented.Results: Of all patients with acute dyspnea, 18.7% had a fi nal diagnosis of acute heart failure (AHF), 10.2% were diagnosed with pneumonia. Patients with pneumonia had the highest PCT-values at admission (median 0.14 (0.10/0.64) ng/ml). Median PCT in patients with AHF was 0.11 (0.08/0.21) ng/ml.Mortality after 3 months for all patients was 6.6% (n=20), 6.6% for patients with pneumonia and 8.8% for patients with AHF. Non-survivors had signifi cantly higher PCT-values than survivors (0.15 (0.08/0.70) vs.0.08 (0.06/0.12) ng/ml (p=0,006).A total of 18 patients received antibiotic treatment in the ED, of which 11 were diagnosed with pneumonia. Of 31 patients with PCT values above the defi ned cut-off for bacterial pneumonia (0.25 ng/ml), only 3 received antibiotics. Of the 20 non-survivors, 6 had PCT values above 0.25 ng/ml. All six did not receive antibiotic treatment. Of the 14 non-survivors with low PCT-values, 2 still received antibiotics (fi gure 1).Conclusion: A signifi cant number of patients with acute dyspnea did not receive PCT-adequate antibiotic therapy. PCT might be a useful marker to guide antibiotic treatment and thus improve patient outcome.

Wednesday, July 31, 9:30 am – 5:00 pm Infectious Disease
A210 CLINICAL CHEMISTRY, Vol. 59, No. 10, Supplement, 2013
B-137
Frequency of Mycoplasma pneumoniae Complement Fixation IgM in a Healthy, Adult Population
B. Kiehl1, S. Jeansson2. 1GenBio, San Diego, CA, 2Oslo University Hospital, Oslo, Norway
Mycoplasma pneumoniae is the causative agent of atypical pneumonia. Serological diagnosis detecting antibodies to either an immunodominant membrane protein or the complement fi xing lipid antigen is often used. These Mycoplasma antibodies are cross-reactive with other Mycoplasma species, so clinical interpretation is made using a clinical cutoff. The clinical cutoff of ImmunoWELL™ Mycoplasma Pneumoniae IgM Test, using a purifi ed CF antigen, is evaluated using presumptively healthy U.S. blood donors.Materials and Methods: Fourteen hundred twenty-six (1426) sera collected from potential U.S. blood donors collected at centers located thirteen states is tested. Tests are performed using ImmunoWELL Mycoplasma Pneumoniae IgM Test following package insert instructions.Results: Figure 1 illustrates specifi c antibody distribution in a U.S. healthy, adult population.Summary: The 95th percentile (736 to 917 units/mL) is consistent with ImmunoWELL’s 950 units/mL clinical cutoff. The 75th percentile is 295-319 units/mL.Figure 1
B-138
Optimization Scheme of a Multiplex Reaction for RNA/DNA Targets on a Microfl uidic-based Real-time PCR Platform
C. Lippé, D. Dugourd, P. Larouche, B. Leclerc, V. Jean, S. Champetier, D. Beaulieu, J. Pinard-Lachapelle, J. Cormier, S. Morasse, C. Ménard, C. Roger-Dalbert. BD Diagnostics, Quebec, QC, Canada
Background: The BD MAX™ System is a next generation sample-to-answer molecular testing platform. The new BD MAX™ TNA (for Total Nucleic Acid) suite, part of the Open System Reagent (OSR) series, combines specimen-specifi c extraction kits (ExK™ for swabs in Universal Transport Medium (UTM), stool or cerebrospinal fl uid (CSF)) and universal PCR reagents (MMK*). The TNA suite allows users to extract, purify and amplify multiple RNA and DNA targets from a single biological specimen with their own user defi ned protocols. Users can select specimen volume, and individually program thermocycling and analysis parameters. The objective of this study was to demonstrate the process and possibilities of optimization for multiplex thermocycling conditions based on a Design of Experiment (DOE).
Methods: This study used a response surface design (central composite - two-level full factorial) to optimize annealing temperature (55 to 65°C), denaturation time (3 to 15s) and Reverse Transcription (RT) time (900 to 1800s) for a RT-PCR reaction used to detect RNA/DNA targets isolated from clinical specimens. A pool of negative nasopharyngeal (NP) swabs in UTM, spiked with all targets of the assay, was processed on the BD MAX System with the BD MAX™ ExK™ TNA-3* reagents. The model assay consisted of an RNA target (chimeric virus containing a Hepatitis C virus [HCV] sequence) and a DNA target (Adenovirus [AdV]). A Specimen Processing Control (SPC) consisting of an armored RNA sequence incorporated into the extraction reagents, was co-processed to control for extraction effi ciency, reagent integrity and PCR inhibition by the sample.Results: Results indicated that the annealing temperature was the most critical factor for optimizing both the Cycle Threshold (Ct) and the End Point fl uorescence (EP) of all targets in this particular assay. Its effect was the same on the SPC, AdV and HCV, so the selection of the temperature was based on a tradeoff between optimizing Ct and/or EP, and on the potential impact on the test sensitivity. RT time infl uenced DNA and RNA targets differently. With a longer RT, SPC and HCV showed earlier Ct values while the EP for HCV and AdV decreased. The optimizer tool suggested an optimum for all targets. Denaturation time appeared to be slightly infl uential on the SPC Ct values.Conclusions: This study demonstrates that it is possible to precisely optimize multiple factors at a time for at least 3 targets at once on the BD MAX™ System. This type of DOE analysis can allow users to determine optimal conditions for any specifi c user defi ned protocol on the BD MAX™ System, and for a variety of factors including primers and probes concentrations, lysis temperature and enzyme concentration, among others.*The BD MAX™ ExK™ TNA-3 and BD MAX™ TNA MMK are not available for sale or use.
B-139
Evaluation of the Risk of RNase Contamination During Total Nucleic Acid Extraction from Clinical Samples using the BD MAX™ System
D. Dugourd1, D. Beaulieu1, J. Cormier1, P. Larouche1, B. Leclerc1, J. A. Price2, D. Fox2, V. Jean1, S. Champetier1, J. Pinard-Lachapelle1, C. Lippé1, C. Ménard1, C. Roger-Dalbert1. 1BD Diagnostics, Quebec, QC, Canada, 2BD Diagnostics, Baltimore, MD
Background: The BD MAX™ System is a next generation sample-to-answer molecular testing platform. The new BD MAX™ TNA (for Total Nucleic Acid) suite, part of the Open System Reagent (OSR) series, combines specimen-specifi c extraction reagents (ExK™) and universal PCR reagents (MMK) allowing users to extract, purify and amplify multiple RNA and DNA targets from a single biological specimen with their own user defi ned protocols. The objective of this study was to evaluate the risk of RNase carryover during major steps of TNA extraction, and also during the processing of the MMK reagents, where a RNase inhibitor is integrated.Methods: Sample processing of nasal or nasopharyngeal swabs in UTM was performed in the BD MAX™ system using BD MAX™ ExK™ TNA-2 or ExK™ TNA-3 and ExK™ DNase reagents*. RNase activity was measured at each major step of sample preparation (i.e. addition of sample to TNA sample buffer, lysis, wash, DNAse treatment and elution/neutralization) using the RNaseAlert® QC Systems reagent. Solutions of RNase A at concentrations ranging from 0.1 ng to 1 ng per sample were included as positive controls. Endpoint fl uorescence values (Tecan) were used to determine the presence of RNase in samples tested.Results: All clinical specimens tested, especially nasopharyngeal swabs in UTM, showed high levels of RNase prior to sample processing. When these samples were initially mixed with the BD MAX™ ExK™ TNA-3 and ExK™ TNA-2 sample buffers, no RNase activity was detected. Similarly, no RNase activity was detected at the lysis, DNase, or wash steps. Finally, minimal to no activity was detected in the eluted sample when mixed with the TNA primer and probe diluent. Data further demonstrate that the MMK reagents, containing a RNase inhibitor, can inactivate/inhibit at least 0.5 ng of RNase A.Conclusion: The BD MAX™ ExK™ TNA-3 and ExK™ TNA-2 reagents enrich TNA while removing/neutralizing RNases found in clinical samples during lysis, DNase, wash, and elution steps as well as control for RNases that might reach the MMK reagents by the use of a RNase inhibitor.*The BD MAX™ ExK™ TNA-3, ExK™ TNA-2, ExK™ DNase, and TNA MMK are not available for sale or use.

Infectious Disease Wednesday, July 31, 9:30 am – 5:00 pm
CLINICAL CHEMISTRY, Vol. 59, No. 10, Supplement, 2013 A211
B-140
Detection of rs12979860 polymorphism in the Interleukin-28B gene by a 5’Nuclease Real Time PCR assay
C. G. Rasuck, F. S. Malta, V. C. Oliveira, F. d. Caxito. Hermes Pardini, Vespasinao, Brazil
Background: The chronic Hepatitis C virus infection affects 170 million people all over the world and it is the main cause of cirrhosis and liver cancer. The treatment indicated for the genotype 1 (the most frequent) can last 48 weeks. The sustained virological response is achieved by 40 to 50% of the treated patients. Since the recommended treatment (interferon and ribavirin) presents potentially serious side effects, and the success rate is not high, researches are being conducted in predictors of drug response for a medical decision. The C/C genotype of rs12979860 polymorphism has been associated to higher rates of sustained virological response and spontaneous viral clearance following acute infection caused by genotype 1. Therefore the knowledge of the polymorphism can help the decision to initiate or postpone the treatment. Our objective was to develop a real time PCR based method to identify rs12979860 polymorphism in the Interleukin-28B gene.Methods: A 5’Nuclease PCR assay (probes and primers) have been designed using the Primer Express 3.0 software. The assay was tested comparing 40 control samples with the sequencing method. All of the possible genotypes were tested and analyzed by the software clustering algorithm.Results: The 5’Nuclease PCR assay was 100% concordant with the sequencing method. All of the genotypes presented a caracteristic pattern which could be recognized by the software clustering algorithm.Conclusion: The 5’Nuclease PCR assay is a fast and effi cient method to identify the rs12979860 polymorphism on IL28B gene and can be used to help doctor’s decision regarding treatment of Hepatitis C virus infection.
B-141
Comparison between an in-house method and the commercial Entherpex® kit for herpes virus detection
V. Niewiadonski, F. Oliveira, P. Macedo, P. Trojano, N. Gaburo. DASA, Sao Paulo, Brazil
Background: The diagnosis of opportunistic infections is extremely important in immunosuppressed patients. The herpes virus infection can take a life threatening course in this group of individuals. In healthy population the herpes virus can cause meningitis, among other disorders.Objective: Compare the results agreement of two methods for herpes virus.Method: A total of 313 samples of DNA and RNA from blood, plasma, cerebrospinal fl uid and bronchoalveolar washing fl uid were tested in the in-house method and in the Entherpex commercial kit (Genomica, Madrid, Spain) for cytomegalovirus, Epstein-Barr virus, herpes simplex 1 and 2, herpes 6, varicella zoster and enterovirus. The real time PCR takes one reaction for each virus tested using Taqman as detection system. The tests were performed at ABI SDS 7500 Real Time PCR System platform. The Entherpex kit detects 8 viruses simultaneously by RT-PCR followed by low density microarray. The results of both methods were analyzed as qualitative results (detected/not detected).Results: The results found are described in Table 1.Table 1. Results of herpes virus detection in Entherpex and in-house methodology
Virus Total of sample tested
Positive Test (in house method)
Positive Test (commercial method)
% concordant results
Cytomegalovirus 136 27 32 92,65Enterovirus 23 1 0 95,65Herpes 1 and 2 72 6 4 97,22Epstein-Barr virus 56 19 22 85,71Herpes 6 17 3 3 100,00Varicella zoster 9 0 0 100,00The disagreements may occur due degraded DNA/RNA, differences between the detection limits of methods compared or, regarding to the commercial kit, due competition when more than one virus was present.Conclusion: The study showed a good agreement between both methods tested; whereas the in-house method detects the individual target and the commercial method simultaneously detects multiple targets.
B-142
Prevalence of Clostridium diffi cile by enzyme immunoassay for the detection of toxin A and B or by polymerase chain reaction in patients admitted to private hospitals in Brazil
M. L. N. Figuieredo, C. Rodrigues, L. B. Faro, O. V. P. Denardin, A. C. C. Pignatari. DASA, SÃO PAULO, Brazil
Background: Clostridium diffi cile infection is the most important cause of antimicrobial-associated diarrhea and is a common health care-associated pathogen. Clinical symptoms vary widely, from asymptomatic colonization to pseudomembranous colitis with bloody diarrhea, fever, and severe abdominal pain. Patients who have been treated with broad spectrum antibiotics, the elderly and those with serious underlying disease are at major risk to develop the infection by this anaerobic bacterium. The laboratory diagnosis is usually provided by the detection of Clostridium diffi cile toxin A and B in stool.Methods: 5119 samples of anal swabs were collected at 38 private Brazilian hospitals and submitted to enzyme immunoassay (EIA- Prospect- Remel®) for the detection of toxin A and B or polymerase chain reaction (Xpert-Cepheid®) to investigate infection by Clostridium diffi cile. The epidemiological data were collected by the laboratory system Motion ®.Results: EIA and PCR for Clostridium diffi cile were positive on 249 samples (4.86%). Among the positive anal swabs, 154 (61.84%) were obtained from female and 95 (38.15%) from male patients. The majority of positive samples (n=117) were from patients over 70 years old (46.98%). From the pediatric population, 1-4 years old infants showed the largest positivity, 7 samples (2.81%). 302 samples were tested by PCR, 29 (9.6%) were positive and 4 (1.32%) were inconclusive. 4817 samples were tested by EIA and only 220 (4.56%) were positive for toxin A and B.Conclusion: Our data show that Clostridium diffi cile infection was present in 4.86% of all patients admitted to private Brazilian hospitals. PCR methodology present a higher sensitivity comparing with EIA test (9.6% and 4.56%, respectively), as described in literature. This data is important for encouraging physicians to use PCR instead of EIA although its cost difference. Cost/ benefi t studies utilizing the PCR test are warranted.
B-143
Prevalence of Respiratory Viral Infection Detected by Molecular Test in a Children’s Hospital in São Paulo, Brazil
L. Almeida, L. B. Faro, A. C. C. Pignatari, O. Fernandes, H. Ionemoto, A. Lopes, A. Bousso, R. B. Ruivo, M. L. Garcia, N. Gaburo. DASA, SÃO PAULO, Brazil
Background: Respiratory tract infection is the leading cause of hospitalization of infants and young children. Viruses are recognized as the major cause of these infections and are usually suspected in clinical practice. However, the etiologic diagnosis depends on the laboratory tests to detect a specifi c virus. Respiratory diseases due virus are traditionally diagnosed by Direct Immunofl uorescense (DIF) and cell culture, that are time consuming and are routinely available only for the more prevalent virus. Emerging pathogens are not detected by these techniques. Molecular biology techniques for diagnosis of respiratory viral infection have been recently applied with high sensitivity and specifi city allowing the detection of a panel of virus simultaneously, including genetic diversity of the same virus.Methods: From october to december 2012 a new molecular virus respiratory panel (RT-PCR Microarray: CLART® Pneumovir), that simultaneously detect different respiratory virus, was introduced in the diagnosis routine at a Children´s Hospital in the city of São Paulo, Brazil. The molecular biology panel detects Infl uenza A, Infl uenza A H1N1 strain 2009, Infl uenza B, Parainfl uenza1, 2 and 3, Syncytial Respiratory Virus (RSV), Adenovirus, Bocavirus, Metapneumovirus, Coronavirus, Enterovirus and Rhinovirus. We evaluated the virus prevalence in 282 tests performed.Results: 282 respiratory samples, only one for each patient, were submitted to virus detection by the molecular panel. The prevalence observed was 18% for Parainfl uenza 3, 17% Adenovirus, 16% Bocavirus, 15% Rhinovirus, 8% Enterovirus, 1,4% Infl uenza C, 1,4% Parainfl uenza 1, 1% RSV, 0,7% Infl uenza A, and 0,30% for CoronavirusConclusion: The molecular panel detected a wide range of respiratory virus, including Bocavirus, Metapneumovirus, Enterovirus and Coronavirus that are not included in the DIF test . The early and precise identifi cation of these virus is of paramount relevance on clinical practice and on nosocomial infection control measures at the hospital. This prevalence should be reevaluated at different seasons and in occasional outbreaks.

Wednesday, July 31, 9:30 am – 5:00 pm Infectious Disease
A212 CLINICAL CHEMISTRY, Vol. 59, No. 10, Supplement, 2013
B-144
Frequency of mycobacterial species in Brazilian samples
P. Trojano, F. Oliveira, F. Gandufe, O. Denardin, N. Gaburo. DASA, Sao Paulo Brasil, Brazil
Background: Many mycobacterial species are pathogenic to humans, with infections occurring worldwide, such as Mycobacterium tuberculosis, the main specie responsible for causing tuberculosis. Other mycobacterial species are increasingly shown to be the cause of pulmonary and extra-pulmonary infection and are managed differently from M. tuberculosis infection. Rapid and accurate differentiation of mycobacterial species is, therefore, critical to guide timely and appropriate therapeutic and public health management.Objective: The aim of this study is to describe the frequency of mycobacterial species in Brazilian samples from January 2011 to December 2012.Methods: We evaluated 89 samples from patients with clinical suspect of mycobacterium infection. The samples had mycobacteria isolated by culture. The DNA was isolated by heating the sample at 100ºC for 30 minutes in order to break the cell wall and release the genetic material. A polymerase chain reaction was performed and followed by a direct sequencing reaction. The result sequence was submitted to an internal database and a comparison with reference sequences was made through an alignment searching tool online (blast.ncbi.nlm.nih.gov/Em cache) in order to confi rm the result found.Results: We found that M. tuberculosis was present in 36 (40,5%) samples and M. fortuitum in 11 samples (12,4%). Other Mycobacterium species were identifi ed in minor frequency such as M. massiliense - 7 samples (7,9%); M. kansasii - 6 samples (6,8%); M .intracellulare - 4 samples (4,5%); M. mucogenicum, M. chelonae, M. gordonae, - 3 samples (3,4%); M. neoaurum, Nocardia sp - 2 samples (2,3%) and Kitasatospora setae, M. avium, M. colombiense, M. senegalense, M.marinum, M.smegmatis, Propionibacterium acnes, Tsukamurella tyrosinosolvens - 1 sample (1,12%). Two samples showed co infection with different species: M. fortuitum/ M.smegmatis - 1 sample (1,12%) and M. lentifl avum/M. genavense - 1 sample (1,12%). Two samples had undetermined results due PCR inhibition.Conclusion: The most frequent mycobacterium specie found was M. tuberculosis in 36 (40,5%) of the samples followed by M. fortuitum in 11 samples (12,4%).
B-145
Epidemiologic study of patients with confi rmed positive result for HIV between the years of 2008 to 2012
P. S. Osorio1, M. F. Mantovani1, L. G. S. Carvalho1, M. Freire2, F. Sandrini1. 1DASA, CASCAVEL, Brazil, 2DASA, Rio de Janeiro, Brazil
Background:AIDS (acquired immunodefi ciency syndrome) is a relatively new disease, caused by HIV, a virus that attacks the immune system, incurable, and that induce to prejudice, stigma and discrimination. In Brazil, since 1980, we have recorded 608,320 cases of AIDS. The number of patients with HIV remained at average of 30,000 new cases per year between 2008 and 2011, with a considerable decrease in 2012 to 17,819 cases.Our objective was to assess the population characteristics and the results of patients in a large database of a clinical laboratory to which tests of detection of HIV were requested.Methods:Using the laboratory database we accessed the epidemiological characteristics of patients with confi rmed positive result for HIV from 2008 to 2012. For the analysis we considered as a child (0-10 years), young (11-20 years), adult (21-50 years) and elderly (51-90 years). Results:We had a total of 52,920 registered exams, from all regions of the country, where 19,370 were positive for HIV. Through data analysis we can see an increased time trend to the number of test ordering, but there was a sudden decrease in the rate of positivity of these requests, and an increasing of cases of HIV disease in males, compared to females between 2011 and 2012. We also noted a decrease of HIV positive cases in children, and in turn, an increase of positive cases in young and adults (Table 1).Conclusion:Our data are consistent with national data, showing that the prevention program is being done properly, with a large investment in prevention and awareness about this disease in Brazilian population.
B-146
Microbiological aspects of confi rmed cases of peritonitis: improving culture results in peritoneal dialysis associated peritonitis along 3 years.
M. P. Campagnoli1, F. F. Tuon2, M. D. C. Freire1, J. L. Rocha1. 1DASA, CURITIBA, Brazil, 2Infectious and Parasitic Diseases, Hosp. Universitário Evangélico, CURITIBA, Brazil
Background: Peritonitis is one of the most serious complications of peritoneal dialysis. Pathogenic bacteria cause the majority of cases of peritonitis. A broad spectrum of gram-positive, gram-negative microorganisms and fungi, are involved in this complication. In addition, a signifi cant percentage of episodes involve polymicrobial and culture-negative infection. Fungal infection is rare but it is associated with high morbidity, the inability to continue on the dialysis program and important mortality. Despite improvements in connectology, peritoneal dialysis (PD)-associated peritonitis contributes signifi cantly to failure in patients maintained on PD.Methods: The aim of this research is to evaluate the microbiological aspects of confi rmed cases of peritonitis in a large central reference laboratory responsible to perform culture for 4 different PD centers. All positive results in the last 3 years where included for analysis.Results: From January 2010 to March 2012, the total number of samples submitted for laboratorial analysis was 197 and 60 showed to be positive cultures (30.5%). A large volume culture and precisely sediment culturing of 50 mL effl uent was the current technique at the beginning of the study and we found 25.5% of positivity (n=37 of 145). Such technique was replaced after April 2012 to bedside inoculation of 5-10 mL effl uent in two blood culture bottles, presenting 44% of positivity (n=23 of 52). In both scenarios, the specimens should arrive within 6 h at the laboratory. There was a signifi cant improvent in culture positivivity (p=0,019) Comparison of these 2 particular momments is presented on fi gure 1. Candida non-albicans was the microorganism with the highest prevalence if considering all Coagulase-negative Staphycocci as contaminants. In such scenario, false positives rates were 18,9% and 21,7% in the different periods respectively.Conclusion: Specimen collection and culture techniques remain important issues that PD centers have to face. We identifi ed better positivity results with bedside inoculation into blood culture bottles.

Infectious Disease Wednesday, July 31, 9:30 am – 5:00 pm
CLINICAL CHEMISTRY, Vol. 59, No. 10, Supplement, 2013 A213
B-147
Increased antimicrobial resistance with time in uropathogens from over 5,000 samples from the pediatric community of a large city as a function of age and sex.
J. L. Rocha1, F. F. Tuon2, M. P. Campagnoli1, O. Fernandes1. 1DASA, CURITIBA, Brazil, 2Infectious and Parasitic Diseases, Hosp. Universitário Evangélico, CURITIBA, Brazil
Background: Empirical therapy of urinary tract infection requires accurate knowledge of susceptibility. There is a hypothesis that increasing bacterial resistance to most commonly used drugs in the pediatric population is ongoing.Methods:Along 5 years, all samples from 35 collecting units, processed by single central laboratory were analysed. Exclusion criteria: fungus, mixed cultures, age below 12 years old, coagulase-negative Staphylococcus, hospital and urine cultures with counts lower than 105 CFU/mL. For ESBL-positive germs, manual confi rmation with disk approximation in addition Vitek 2® was performed.Results: 371,972 urocultures were processed by the laboratory. 72,949 were positive (19.6%). 6,347 (8.7%) were included for analysis, 76.5% of them from girls. Girls were older than boys (4,3 versus 3,0 years old) (p 1% of the total sample. The data collected reveal E. coli with critically low but stable percentages of sensitivity to fi rst generation cephalosporins and trimethoprim-sulfamethoxazole. Although the total resistance against quinolones is lower than 5%, there is a signifi cant increment along the period (97,0% sensitivity in 2005 and 94,2% in 2010, p=0.02). There are better resistance profi les in children under 2 years old when compared with older children (p<0,001). Klebsiella spp., Proteus spp. and Enterobacter spp. appear with low sensitivity to nitrofurantoin. Klebsiella spp.shows an increase of resistance to cephalothin (p=0.02). Enterobacter sp. shows only 75.7% sensitivity 3rd generation cephalosporins.Conclusion: This huge historic series points serious problems of bacterial resistance in the pediatric population with signifi cant increase in the prevalence of quinolone resistant in E. coli over the last 5 years in urines collected in the community. A prospective study is planned to identify patients risk factors and for molecular studies.
Antibiotic susceptibility profi le of main uropathogens
1 ª CefalosporinSulfametoxazol - Trimetoprim
Quinolones Gentamicin 3 ª CefalosporinsNitro-furantoin
E.coli 63,11% 55,93% 95,74% 94,77% 98,61% 91,44%Proteus spp. 88,75% 69,93% 98,28% 94,81% 98,85% -Klebsiella spp. 88,08% 89,16% 97,86% 98,21% 97,62% 61,58%Enterobacter spp.
- 89,63% 88,53% 94,02% 75,66% 46,84%
Enterococcus spp.
- - 75,16% - - 86,17%
B-148
Identifi cation of selective sulfonamide tubulin inhibitors as anti-proliferative agents in African Trypanosomiasis
R. Lama, B. Li, B. Su. Cleveland State University, Cleveland, OH
Background: Tryapanosoma brucei are parasitic protozoan that causes Human African Trypanosomiasis (HAT) or sleeping sickness, a life-threatening disease endemic in sub-Saharan regions of Africa. Current drugs available for the treatment of HAT exhibit drawbacks such as high toxicity to the hosts due to their poor parasitic cell selectivity, diffi cult routes of drug administration and high costs of hospitalization. There is a need for potent drugs with effi cient bioavailability and the ability to cross the blood-brain-barrier for treating complex stages of the disease. Tubulin plays a central role in parasitic cell growth due to their rapid rate of cell proliferation. In addition, microtubule within the fl agellum of the parasite allows for locomotion via oscillations, which is vital for their survival thereby suggesting the potential advantages of tubulin inhibitors for the treatment of Trypanosomiasis. Based on the differences between the parasitic and mammalian tubulins, we evaluated a class of sulfonamide tubulin inhibitors previously developed as anti-cancer agents, on T. brucei for the identifi cation of candidates selective for parasitic cells over mammalian cells.Methods: Well-defi ned tubulin inhibitors: Paclitaxel, Indibulin, ABT 751, Colchicine, Vinblastine and Nocodazole in addition to a library of sulfonamide tubulin inhibitors were tested on SKBR-3 mammalian breast cancer cells with MTT assay and T. brucei parasitic cells with MTS assay. Bovine tubulin and T. brucei tubulin were analyzed and a predicated structure of T.brucei tubulin was generated based on the crystal structure of bovine tubulin with SWISSMODEL repository program.
Results: Tubulin inhibitors, Vinblastine and Colchicine domain binders exhibited strong inhibition to SKBR-3 cells than T. brucei suggesting signifi cant differences in the colchicine-binding domains between the parasitic and mammalian cells. The amino acid sequence comparison between bovine and T. brucei tubulins indicated 85% similarity. In addition, it showed that Leucine 316 of Beta tubulin, which is critical for colchicine activity against bovine tubulin polymerization, is changed to Valine in Beta tubulin of T. brucei. This explains the weak inhibitory activity of colchicine on the growth of T. brucei cells. The predicated T. brucei tubulin structure revealed that several Beta sheets of the bovine and parasitic tubulin do not overlap in the colchicine domain supporting the difference in the specifi c binding domains that leads to selectivity of tubulin inhibitors. Several compounds from sulfonamide tubulin inhibitors library showed specifi c inhibitory effect on T. brucei growth. The pharmacophore of tubulin inhibitors with better activity on mammalian cell growth were different to those promoting T. brucei cell growth inhibition.Conclusion: Several lead compounds from the sulfonamide tubulin inhibitors library (colchicine domain binders) selectively inhibited T.brucei cell growth. The selectivity of the compounds was validated based on the difference in the colchicine-binding domains of the parasitic and mammalian tubulins. Our study provides with a unique molecular scaffold that selectively targets T. brucei tubulin and has elucidated efforts for development of new lead compounds targeting tubulin for the treatment of sleeping sickness.
B-149
Prevalence of Streptococcus agalactiae in pregnant women in pre-natal.
M. R. B. Araújo, M. A. B. Sousa, N. B. Alves, G. F. Souza, P. H. N. Bicalho, C. A. Lima. Instituto Hermes Pardini, Belo Horizonte, Brazil
Background: The Streptococcus agalactiae (Group B Streptococcus Lancefi eld - GBS) is a microorganism which is part of the normal fl ora of the mucous membranes of humans, being the leading cause of neonatal pneumonia, sepsis and meningitis, as well as the agent which causes serious disease in adults, and contributes to morbidity and mortality in this group of individuals. The CDC recommends using penicillin or ampicillin as drugs of choice for prophylaxis intrapartum. Cefazolin is recommended when the pregnant woman is allergic to penicillin and presents low risk of anaphylaxis. If the risk of anaphylaxis is high, the use of erythromycin and / or clindamycin is recommended. Given the growing number of bouts in newborns by SGB, the study evaluated the prevalence of this organism in samples of pregnant women, and it also evaluated the profi le of antimicrobial susceptibility of isolated microorganisms.Methods: The study was carried out on samples of vaginal and rectal secretion of 2,500 pregnant women between the 35th and 37th week of pregnancy who underwent examination in laboratory culture for GBS during the month of January, 2010. In order to identify GBS, methods were used to detect antigens of Lancefi eld through the wall SLIDEX Strepto Plus® kit. Macroscopic observations of colonies were also used. Tests for sensitivity to antibiotics (for Disk diffusion method) were performed for all isolates found in the study.Results: Among the collected samples, the GBS was recovered from 303 (12%). The total number of positive samples consisted of 263 (87%) vaginal swabs and 40 (13%) from rectal ones. This may be due to low sensitivity of the anal culture, since this site shows a high biological diversity of microorganisms. Analysis of antibiograms showed resistance to tetracycline in 65% of all cases. All isolated included in the study were sensitive to penicillin, other beta-lactams and fl uoroquinolones. The rate of resistance to erythromycin and clindamycin was 5%.Conclusion: The profi le of resistance to erythromycin and clindamycin was lower than the comparative studies carried out in other countries, although there are reports of increased resistance in recent years. The data obtained in our country showed that the knowledge of the sensitivity profi le of the SGB may be waived in clinical practice, although the monitoring of the susceptibility profi le in reference laboratories should be constant.

Wednesday, July 31, 9:30 am – 5:00 pm Infectious Disease
A214 CLINICAL CHEMISTRY, Vol. 59, No. 10, Supplement, 2013
B-150
Comparison between Indirect Immunofl uorescence Antibody (IFA) and dotblot enzyme immunoassay (EIA) methods to detect Coxiella burnetii (Q Fever) Phase I and II antibodies.
C. M. Farris1, B. Kiehl2, J. Samuel3. 1Viral and Rickettsial Diseases Department, Naval Medical Research Center, Silver Spring, MD, 2GenBio, San Diego, CA, 3Department of Microbial and Molecular Pathogenesis, College of Medicine, Texas A&M, Bryan, TX
Coxiella burnetii is the causative agent of Q Fever, a world-wide zoonotic disease. Diagnosis of human disease is typically made using serology. Comparison between the indirect immunofl uorescence antibody (IFA) and dot blot enzyme immunoassay (EIA) methods is reported.Materials and Methods: A commercial dotblot immunoassay, ImmunoDOT™ Coxiella Burnetii, was developed using a cell-free culture method to prepare purifi ed phase I and II Coxiella burnetii antigens. IgG and IgM commercial IFA kits (Focus Diagnostics™) and in-house prepared IFA tests are compared to the dotblot kit. Paired sera collected from thirty-eight (38) patients with symptomatology and laboratory results consistent with C. burnetii are tested. These serum pairs are part of a C. burnetii reference serum panel maintained by the university laboratory. Each of the 76 specimens (38 serum pairs) is tested using the IFA tests detecting Phase I and II IgG or IgM. The 76 specimens are also tested using the ImmunoDOT Coxiella Burnetii test.Results: Sensitivity, based on paired serum interpretation is shown in Table 1. There is no signifi cant difference (p=0.05, Chi-square, confi dence limits based on Gart and Nam’s score method with skewness correction) between assay methods.Table 1: SensitivityMethod Phase 1 Phase 2 CombinedEIA 67-91% 67-91% 67-91%Commercial IFA 61-87% 67-91% 70-93%In-house IFA 55-83% 55-83% 67-91%Summary: No signifi cant difference between IFA and the dotblot is detected. In several cases, a second convalescent specimen is required for IFA sero-diagnosis while EIA reports a positive result using only a single, acute specimen. Presumably, phase I antigen purity improvement contributes to the added diagnostic utility.

Proteins/Enzymes Wednesday, July 31, 9:30 am – 5:00 pm
CLINICAL CHEMISTRY, Vol. 59, No. 10, Supplement, 2013 A215
Wednesday, July 31, 2013
Poster Session: 9:30 AM - 5:00 PM
Proteins/Enzymes
B-151
Identifi cation of Novel Infl ammatory Biomarkers in the Early Diagnosis of Chronic Kidney Disease
M. Summers, M. Browne, C. Ledgerwood, C. Richardson, R. I. McConnell, S. P. Fitzgerald. Randox Laboratories Limited, Crumlin, United Kingdom
Introduction: Chronic Kidney Disease (CKD) can go undiagnosed due to its asymptomatic nature and is described as a progressive loss in renal function leading to end-stage renal failure and death. In order to classify patients with early CKD (Stage 1), Modifi cation of Diet in Renal Disease (MDRD) guidelines suggest an eGFR ≥ 90 ml/min/1.73m2 (based on the measurement of serum creatinine), with other evidence of kidney disease (proteinuria, haematuria, kidney infl ammation). The complexity in diagnosing a patient with CKD at an early stage of disease has led to most patients not receiving a diagnosis until the disease has progressed to an advanced stage.Relevance: There currently are no accepted methods for easily determining kidney disease at early stages. Infl ammation plays a key role in the development and progression of CKD and identifi cation of infl ammatory markers in patients suspected of having CKD may play a useful role in the diagnosis of disease. Infl ammation can be monitored through the presence of signalling molecules, such as cytokines, and their soluble receptors. This study aimed to identify soluble cytokine receptors; soluble tumor necrosis factor 1 (sTNFRI) and 2 (sTNFRII) as potential novel markers to aid diagnosis of CKD at early stages following a multi-analytical approach.Methodology: Serum samples were taken from 327 patients with CKD (137 Stage 1, 109 Stage 2 and 81 Stage 3) and 139 healthy controls. Concentrations of sTNFRI and sTNFRII in samples were determined using a cytokine biochip array applied to the Evidence Investigator analyser. Serum creatinine was also measured to determine eGFR using the MDRD method. Statistical analysis was performed using SPSS v20 (IBM), all data represented as Median [Range].Results: Differences in concentration of each analyte across the disease groups were initially assessed using the non-parametric Krukal-Wallis testing: both analytes were shown to have signifi cantly different levels across the different stages of disease (signifi cance determined as p<0.05). Post hoc analysis was performed comparing CKD groups with controls, using Mann-Whitney (with Bonferroni correction): both analytes demonstrated a signifi cantly higher median concentration of the respective analyte at all stages of CKD (Stage 1-3) compared to control. sTNFRI was shown to be signifi cantly increased at all CKD stages (0.6 [0.03-2.17], 0.73 [0.23-1.76],1.2 [0.51-3.88] ng/ml respectively; p<0.0001 for all) compared to control (0.44 [0.13-0.79]ng/ml). sTNFRII was also shown to be signifi cantly increased at all CKD stages (0.64 [0-3.21], 0.77 [0.17-3.23],1.44[0-10.09] ng/ml respectively; p<0.0001 for all) compared to control (0.33 [0-0.92] ng/ml). Furthermore, the concentrations of both markers were signifi cantly increased at Stage 3 compared with Stages 1 and 2 (p<0.0001). This was confi rmed by correlation analysis between sTNFRI/II with disease stage (as clinically determined) and eGFR. Both markers signifi cantly correlated (p<0.0001) with disease stage and eGFR.Conclusions: This investigative study found elevated levels of sTNFRI and sTNFRII in the serum of CKD (stages 1-3) patients compared to controls. Both markers presented a signifi cant correlation with disease stage and eGFR. These fi ndings indicate the potential utility of these infl ammatory markers in diagnosing CKD at an earlier stage as well as potential disease stratifi cation markers.
B-152
Plasma Levels of D-Dimer as an Indicator of Severity and Mortality in Acute Stroke: Application of a Biochip Array Kit
C. McKeever1, K. Makris2, C. Ledgerwood1, K. Kenwell1, C. Richardson1, J. V. Lamont1, R. I. McConnell1, S. P. Fitzgerald1. 1Randox Laboratories Limited, Crumlin, United Kingdom, 2Clinical Biochemistry Department, KAT General Hospital, Athens, Greece
Background: Blood clots play a pivotal role in the pathogenesis of acute stroke. Ischaemic stroke (IS) is characterised mainly by a thrombosis occluding the cerebral arteries leading to ischaemia in the occluded region, consequently thrombolytic
treatment is required. In contrast, intracerebral haemorrhagic stroke (ICH) is characterised by cerebral blood vessel haemorrhage leading to bleeding in to the cerebrum resulting in damage. D-dimer is a fi brin degradation product and due to the important role that fi brin plays in the clotting process during stroke, levels of D-dimer may be important in identifying patients with stroke and predicting their outcome. This study reports the correlations between plasma levels of D-dimer and stroke severity and mortality in acute stroke patients, measured using Randox biochip array technology.Methodology: In a prospective study 98 patients with acute stroke were included (73 IS and 25 ICH). The mean age (SD) of the patients was 75.2 (9.4) years. Stroke severity was measured at the time of admission with the Scandanavian Stroke Scale (SSS). Functional outcome was measured with the modifi ed Rankin scale (mRS) on day 7 and acute stroke patients were categorised into three severity groups (mild, moderate and severe) according to their mRS-score: mild (mRS-score:0-2), moderate (mRS-score:3-4) and severe (mRS-score:5-6). Blood samples were taken at the time of admission and at 24, 48 and 72 hours thereafter. A fi nal measurement was performed on day 7. Forty-two patients (42%) died during a follow-up period of 1 year. The mean time (SD) between the onset of neurological symptoms and hospital admission was 3.22 (1.58) hours. Sixty healthy subjects served as controls. D-dimer levels were quantifi ed in EDTA plasma samples employing a biochip array kit on the Evidence Investigator analyser.Results: At admission, mean D-dimer levels were signifi cantly elevated in both IS (343.4ng/ml) and ICH (540.8ng/ml) when compared to healthy controls (110.1ng/ml) (p<0.0001 anova test). The diagnostic accuracy of a single D-dimer measurement upon hospital admission for diagnosis of stroke was high [AUC=0.87 (95%CI 0.81-0.93), P<0.0001]. Mean D-dimer levels increased with severity and this biomarker pattern was apparent upon admission (mild=256ng/ml, moderate=415ng/ml, severe=555ng/ml) (p=0.011 anova-test). Plasma levels increased during follow-up peaking at 7 days for both stroke subtypes (1059ng/ml for ICH and 363ng/ml for IS). Mean D-dimer levels were signifi cantly increased among non-survivors (317ng/ml) compared to survivors (213ng/ml) (p<0.0001) at 24 hours. This difference was also observed for 48 and 72 hour time-points.Conclusions: The presented data suggest that the determination of plasma levels of D-dimer upon admission can facilitate stroke diagnosis and serve as a predictor of severity and mortality. These results indicate that there is an association between low levels of D-dimer and better outcome among acute stroke patients.
B-153
Identifi cation of novel biomarkers of hemorrhagic stroke by integrating bioinformatic and mass spectrometry-based approaches
E. Martínez-Morillo1, P. García Hernández2, I. Begcevic1, H. Kosanam1, B. Prieto García2, F. V. Álvarez Menéndez2, E. P. Diamandis3. 1Samuel Lunenfeld Research Institute, Joseph and Wolf Lebovic Health Centre, Mount Sinai Hospital, Toronto, ON, Canada, 2Department of Clinical Biochemistry, Laboratory of Medicine, Hospital Universitario Central de Asturias, Oviedo, Spain, 3Department of Pathology and Laboratory Medicine, Mount Sinai Hospital, Toronto, ON, Canada
Background: Hemorrhagic stroke (HS) is a signifi cant cause of morbidity and mortality worldwide. Deterioration of patients is common in the fi rst few hours after symptoms onset so it requires rapid diagnosis and prompt medical attention. Moreover, differentiating between hemorrhagic and ischemic stroke (IS) is critical to determine treatment options. Computed tomography (CT) scan remains the cornerstone for diagnosis of HS. However, it requires hospital admittance of patients. A blood-based diagnostic test to identify patients that should be referred for a CT scan would be of great value. In the present study, we hypothesized that proteins specifi cally expressed in the brain at high levels may be released and detected in the cerebrospinal fl uid (CSF) of patients with HS. The aims were: (a) select “brain-specifi c” proteins using a bioinformatic approach; (b) develop selected reaction monitoring (SRM) assays for candidate proteins; (c) quantify these proteins in CSF samples from patients with HS, IS and controls.Methods: Towards the fi rst aim, the Human Protein Atlas (www.proteinatlas.org) was used to select proteins (n=390) with high expression in brain cell types and low or absent expression in other body cell types (referred as “brain-specifi c”). Based on the Peptide Atlas (www.peptideatlas.org) and to avoid high-abundance plasma proteins, only “brain-specifi c” candidates with high number of observations in the “Brain proteome” and low or zero observations in the “Plasma proteome” were selected (n=76). For SRM assay development, protein extract from brain tissue samples was used to identify “proteotypic” peptides for candidate proteins. Peptide identifi cation was confi rmed in three ways: 1) prediction of retention times using SRRCalc 3.0

Wednesday, July 31, 9:30 am – 5:00 pm Proteins/Enzymes
A216 CLINICAL CHEMISTRY, Vol. 59, No. 10, Supplement, 2013
(Skyline software), 2) co-elution of at least 6 transitions per peptide, 3) comparison of the observed fragmentation pattern with the fragmentation pattern displayed in publicly available databases (SRM atlas and GPM database). Based on SRM collider (www.srmcollider.org), three transitions per peptide were selected to generate unique ion signatures (127 peptides corresponding to 68 out of 76 candidate proteins). An EASY-nLC 1000 pump coupled to a TSQ Vantage (Thermo Fisher) were utilized for analysis. For protein quantifi cation, twenty-one age-matched CSF samples were selected, including patients with HS (n=7), IS (n=7) and healthy controls (n=7). Samples were collected within 96 hours of symptoms onset and S100B protein was measured using a fully-automated electrochemoluminometric immunoassay (Roche Diagnostics).Results: S100B was signifi cantly elevated (p<0.05) in the HS group, especially in those patients with intraventricular hemorrhage and poor outcome (Glasgow Outcome Score ≤3). Thirty-three out of 68 “brain-specifi c” proteins were not detected in any of the CSF samples analyzed. For remaining 35 proteins the coeffi cients of variation from duplicates were <20%. Eight of these proteins (ENO2, GFAP, INA, MBP, MT3, NEFM, SNCB, SNCG) were found to be highly elevated in samples from HS patients (severe cases), with no elevations in the patients with IS and controls.Conclusions: Nine proteins, including some known biomarkers (ENO2, GFAP, S100B), were found to be elevated in a subset of CSF samples from patients with HS. Further verifi cation and validation of these biomarkers of HS will be performed in CSF and blood samples.
B-154
Amino acid sequence 473-487 of prothrombin is essential to inherent coagulant activity
J. Wiencek1, J. Hirbawi2, M. Kalafatis1. 1Cleveland State University, Cleveland, OH, 2Cleveland Clinic-Lerner Research Institute, Cleveland, OH
The prothrombinase complex is the signifi cant enzymatic complex that activates prothrombin (Pro) to thrombin with rates compatible with survival. Prothrombinase is composed of the enzyme factor Xa (fXa), and the cofactor factor Va (fVa) associated on a procoagulant membrane surface in the presence of calcium ions. Suitable prothrombinase formation results in the timely generation of a fi brin clot and the arrest of bleeding due to the interaction of fVa with the members of prothrombinase and a subsequent fi ve-fold increase in the catalytic effi ciency of fXa as compared to the activity of fXa alone. Prothrombinase produces thrombin following two sequential cleavages of Pro (at Arg320 followed by cleavage at Arg271) with formation of an enzymatically active intermediate called meizothrombin. Although membrane-bound fXa is capable of activating Pro, the overall rate of thrombin formation is not compatible with survival, and catalysis proceeds through the opposite pathway (cleavage at Arg271 followed by cleavage at Arg320) with formation of prethombin-2. fXa is known to exhibit a strong interaction with Pro in the presence and absence of fVa. Previous studies have suggested that fXa interacts with Pro within amino acid region 473-487 in a fVa-dependent manner. Thus we investigated the functional importance of amino acid region 473-487 of Pro. We used site-directed mutagenesis to construct a recombinant Pro molecule with the region 473-487 deleted (rProΔ473-487). The deletion and wild type Pro (rProWT) were stably transfected in BHK-21 cells. The two recombinant molecules were purifi ed according to a well-established protocol and during the last step Fast Performance Liquid Chromatography (FPLC) was used equipped with a strong anionic Mono-Q 5/50 column and a calcium gradient was used to isolate properly carboxylated rProΔ473-487 and rProWT. Both recombinant molecules were assessed using gel electrophoresis to examine their ability to become activated into enzymatic thrombin by fully assembled prothrombinase or fXa alone. The recombinant molecules were also investigated for clotting and chromogenic activity. Gel electrophoresis revealed that consumption of rProΔ473-487 by prothrombinase and subsequent thrombin formation was considerably impeded when compared with thrombin formation following cleavage of rProWT by prothrombinase. In contrast, membrane-bound fXa alone, in the absence of fVa, exhibited a marked increase in the rate of cleavage at Arg271 and activation of rProΔ473-487 as compared to cleavage at Arg271 and activation of rProWT. Both recombinant proteins displayed a similar cleavage pattern, implying that no major structural alterations took place in rProΔ473-487 following the mutation. Additionally, clotting assays revealed rProΔ473-487 was devoid of clotting activity and severely impaired in its amidolytic activity while rProWT had clotting and chromogenic activities comparable to human plasma-derived Pro. Our data demonstrate that amino acid sequence 473-487 of Pro is necessary for optimal rates of activation by prothrombinase. Also this investigation suggests that amino acid region 473-487 is required for innate thrombin activity in coagulation. These data are
providing a rationale to the fact that to date there is no natural mutation within this region of Pro reported since any changes within this crucial amino acid region would lead to dire clinical circumstances and are not compatible with survival.
B-155
Electrophoretic Identifi cation and Isotyping of an Immunoglobulin-bound Alkaline Phosphatase Macroenzyme Complex in a Patient Serum
B. Jolly, S. M. Truscott. Beaumont Health System, Royal Oak, MI
Background. Macroenzymes, or enzymes in the circulation bound in a high-molecular weight complex, can cause long-term elevation in the measured serum activity of clinically relevant enzymes, such as creatine kinase or alkaline phosphatase (AP). Most often, macroenzymes consist of enzyme bound to immunoglobulins (type I), but may also form by binding to other proteins or cellular membrane fragments (type II). While weak disease associations (e.g., autoimmune) have been described, it is generally believed that detection of a macroenzyme should not be of clinical concern. Macroenzymes are uncommon but important to recognize so that expensive or harmful diagnostic testing can be avoided. The objective of our study was to characterize in a patient serum a potential type I AP macroenzyme using the same electrophoresis-based platform currently in service for AP isoenzyme quantitation.Case. A 73-year old male was evaluated by his primary care physician, who ordered a liver function test panel. AP was elevated (137 U/L; RI: 30-110 U/L), but all other liver enzyme concentrations were within reference intervals. AP isoenzyme analysis revealed an atypical isoenzyme pattern – weak staining of bone and liver isoenzymes with unusually intense and diffuse staining in the region of the gel where intestinal AP bands normally migrate. In order to distinguish an innocuous AP macroenzyme from a possible true elevation of intestinal AP, which would suggest a more serious condition, we considered possible approaches with the available technology.Methods. AP isoenzyme quantitation was performed using Sebia® ISO-PAL agarose gels and reagents with the Sebia Hydrasys electrophoresis system. The method quantifi es bone, liver, and intestinal AP isoenzymes after electrophoresis under alkaline conditions. Bands are visualized using a chromogenic substrate. Patient sera are applied to the gel in duplicate. In the fi rst lane, bone and one of the liver isoenzymes co-migrate, but are separated in the second lane by direct gel application of a lectin that binds preferentially to the highly sialated bone isoenzyme and prevents its migration. We hypothesized that an immunoglobulin-bound macroenzyme might be detected if we replaced the lectin with antiserum to human immunoglobulin. The index patient and a control patient were electrophoresed again by the ISO-PAL method, but with and without antisera to human IgG, IgA, IgM, Ig-kappa, or Ig-lambda (Sebia Immunofi xation reagents).Results. The antisera did not change the migration of any AP isoenzymes in the control patient. In the index patient, antisera to IgA, IgM, and Ig-kappa did not change the migration pattern of the putative macroenzyme. The electrophoretic pattern was unchanged compared to untreated lanes in the same gel. However, application of either IgG or Ig-lambda antisera inhibited the migration of the questionable band, which also became narrower and less diffuse, indicating that the antisera bound to the macroenzyme.Conclusions. Replacing the lectin with antisera to human immunoglobulin in the ISO-PAL method effectively confi rmed the presence of a type I macroenzyme and also allowed for isotype determination. This approach is more specifi c than protein precipitation with polyethylene glycol and does not require size-exclusion chromatograpy to characterize high-molecular weight complexes.
B-156
Evaluation of Dried Blood Spots for Use in Isoelectric Focusing Electrophoresis for Alpha-1-Antitrypsin Phenotype Interpretation
M. M. Duran. Geonostics, Lincolnshire, IL
Background: Laboratory diagnostics contribute signifi cantly in the diagnosis of Alpha-1-Antitrypsin (AAT) defi ciency, utilizing AAT serum concentration, AAT phenotype determination by isoelectric focusing (IEF) electrophoresis, and genotyping. Dried blood spots (DBS) is a potentially attractive sample type for IEF phenotype analysis on the Sebia Hydrasys because of the ease of sample collection. Here we present a novel methodology for AAT phenotype determination from DBS.Methods: Eighteen whole blood samples from known phenotypes of MM, MS, and MZ were spotted on fi lter paper using 50 uL of sample. The blood spots dried overnight

Proteins/Enzymes Wednesday, July 31, 9:30 am – 5:00 pm
CLINICAL CHEMISTRY, Vol. 59, No. 10, Supplement, 2013 A217
and then the 50 uL dried blood samples were punched and rehydrated with a buffer/deionized water solution. Ten uL of each extracted DBS sample was applied to the IEF comb. Eighteen serum samples of the corresponding DBS phenotypes were also placed on a comb for comparison. IEF was performed on the Sebia Hydrasys using standard protocol and the resultant gel was stained, washed, and digitally scanned.Results: In Figure 1, phenotype MM is on the left, phenotype MS is in the center, and phenotype MZ is on the right. For each phenotype, the DBS sample is on the left and the corresponding serum sample is on the right. All 18 DBS phenotype samples displayed the unique identifi able banding patterns present in the serum samples.Conclusion: IEF of DBS samples adequately reveal the M, S, and Z alleles on the Sebia Hydrasys. Work is underway to validate the 100+ additional rare alleles and to establish AAT protein stability on the fi lter paper.
B-157
High Sensitive C-reactive Protein in Patients With Acute injuries
S. E. Idogun, E. Ayinbuomwan, P. E. Irhibhogbe, S. Ayinbuomwan. University of Benin Teaching Hospital, BENIN, Nigeria
Background: For many years, C - reactive protein is known as a highly sensitive but non-specifi c marker for acute infl ammation.Aim and Objectives: The aim of the study was to determine the serial serum level of high sensitive C-reactive protein (h-sCRP) in patients with trauma. Subjects and Methods: Subjects were patients who were involved in vehicle crashes, burns, falls or other traumatic cases. A structured questionnaire was administered to all subjects to document their ages, sex, occupation, date and time of trauma, date of admission, duration of hospital stay and complications. Samples were collected from participants for estimation of h-sCRP on days 1, 3, and 8. Samples were taken from control subjects for one time estimation of CRP by photometric method.Results: A total of 120 patients were studied, males were 98 (81.7%) and 22(18.3%) females. The most frequent cause of trauma amongst the patients was vehicular crashes 82(68.3%) followed by gunshot injuries 21(17.5%). The mean serum h-sCRP of the patients on the fi rst day was (165.8 ± 104.2mg/L) but it peaked on the third day post trauma (378.8 ± 133.0mg/L) and declined on the eight day to 300.0 ± 156.5mg/L,
P = 0.01. The mean serum h-sCRP on the third day for patients with fractures(but without surgery) was higher (381.6 ± 122.7mg/L) than for those with soft tissue injuries 376.1 ± 143.3mg/ L, and for controls 69.4 ± 68.1mg/L, P = 0.01.Conclusion: C - reactive protein levels increase in the blood of trauma patients as a result of tissue damage but decreases after the third day following trauma. However, in the presence of infection, the increase was sustained. We therefore recommend that serial quantitative c - reactive protein measurements be done as an adjunct to surgical care in patients with acute injuries.
B-158
A Novel Immunoassay for the Determination of the Chemokine RANTES
M. F. Kelly, V. Toner, I. Vintila, C. Ledgerwood, R. I. McConnell, S. P. Fitzgerald. Randox Laboratories Limited, Crumlin, United Kingdom
Introduction: RANTES (CCL5/regulated on activation, normal T cell expressed and secreted) is a member of the CC subfamily of chemokines. RANTES mediates the traffi cking and homing of classical lymphoid cells such as T cells and monocytes, but also acts on a range of other cells, including basophils, eosinophils, natural killer cells, dendritic cells and mast cells. A wide range of infl ammatory disorders and pathologies have been associated with increased RANTES expression, including: asthma, allogeneic transplant rejection, atherosclerosis, arthritis, atopic dermatitis, delayed-type hypersensitivity reactions, glomerulonephritis, endometriosis, some neurological disorders such as Alzheimer’s disease and certain malignancies. It also plays a key role in the immune response to viral infection. Current available immuno-analytical methods for the determination of this chemokine require sample dilution prior to assessment, which could lead to inaccuracy in the pre-analytical steps as high dilutions and small sample volumes are involved. This would be detrimental for the fi nal outcome of the analysis.Relevance: This study reports the development of a biochip based immunoassay for the determination of RANTES in neat samples, thereby eliminating the need of sample dilution, which not only simplifi es the analytical process but also contributes to a more accurate determination.Methodology: A chemiluminescent biochip based immunoassay was employed: a TAG -specifi c monoclonal antibody was immobilised and stabilised on the biochip surface. Reagent containing the RANTES specifi c antibody coupled to the TAG and calibrator/sample were added to the biochip, which is also the vessel of the immunoreaction. After incubation of 1 hour at 37°C and a washing step, a detector antibody was added. After incubation of 1 hour at 37°C and a washing step, the signal substrate was added. The chemiluminescent signal was detected by digital imaging technology in the Evidence Investigator analyser. The system incorporates dedicated software for data processing and archiving. The signal is directly proportional to the concentration of the analyte in the calibrator/sample. Six matched serum, EDTA plasma and platelet poor plasma samples from apparent healthy subjects were analysed.Results: Initial evaluation showed that the immunoassay generated a calibration curve for RANTES spanning the range of 0-2000ng/ml. The functional sensitivity of the assay was determined to be 9.2ng/ml with intra-assay (n=20) precision < 6%. The average RANTES concentration in serum was 332ng/ml while the concentrations in EDTA and platelet poor plasma samples were 104 and 124ng/ml respectively.

Wednesday, July 31, 9:30 am – 5:00 pm Proteins/Enzymes
A218 CLINICAL CHEMISTRY, Vol. 59, No. 10, Supplement, 2013
Conclusions: These results demonstrate a new immunoassay method for the quantifi cation of RANTES in serum, EDTA plasma and platelet poor plasma without sample dilution. This will improve the performance of the assay and increase the ease of use by the end user. In addition, the assay is suitable for multiplexing technology for which most immunoassays do not require sample dilution.
B-159
Development of Highly Specifi c Monoclonal Antibodies to FABP1
A. Gribben, P. Ratcliffe, P. Stewart, S. Savage, P. Lowry, R. I. McConnell, S. P. Fitzgerald. Randox Laboratories Limited, Crumlin, United Kingdom
Introduction: Fatty acid binding proteins (FABP) are small cytoplasmic lipid binding proteins that are expressed in a tissue specifi c manner. FABPs bind free fatty acids, cholesterol, and retinoids; and are involved in intracellular lipid transport. Circulating FABP levels are used as indicators of tissue damage. Some FABP polymorphisms have been associated with disorders of lipid metabolism and the development of atherosclerosis. Liver-type FABP (L-FABP/FABP1) was one of the fi rst FABPs to be identifi ed. FABP1 is a ~14kDa member of the fatty acid binding family of proteins and it is mainly expressed in hepatocytes of the liver, but is also found in proximal tubular cells of the kidney and in colonocytes and enterocytes (jejunal and ileal) of the gastrointestinal tract. FABP1 is a sensitive biomarker for abdominal disease/injury, kidney disease and liver disease due to its high tissue concentration and low plasma concentration along with its relatively small size that results in its early release after tissue damage.Relevance: The aim of this work was to develop two highly specifi c monoclonal antibodies to work as a sandwich pair for FABP1, which will be used as a tool in the development of effi cient immunoassays for application in clinical settings.Methodology: The nine members of the FABP family were expressed as full length recombinant proteins in E. coli. Sheep were immunized with the sequence for FABP1. Lymphocytes were collected and fused with heteromyeloma cells. Supernatants from the resulting hybridomas were screened for the presence of FABP1 specifi c antibodies using the other eight members of the FABP family in negative selection ELISA based assays. Positive hybridomas were cloned to produce stable monoclonal hybridomas. The antibodies were purifi ed and evaluated by direct binding ELISA to determine their specifi city for FABP1.Epitope mapping of capture and detector/tracer antibodies was also completed using overlapping peptides derived from FABP1. Biochip based immunoassays were employed to evaluate the analytical performance of the antibody pair, the assay was applied to the Evidence Investigator analyser.Results: Analytical evaluation indicated that the monoclonal antibodies generated were specifi c for FABP1, exhibiting <0.1% cross-reactivity for FABP2, FABP3, FABP4, FABP5, FABP6, FABP7, FABP8, FABP9 and myoglobin. Epitope mapping established that the capture and detector/tracer antibodies bind to N- and C-terminal regions of FABP1 respectively. On a biochip platform, the FABP1 assay showed a sensitivity value of 0.66ng/ml with an assay range of 0 - 400ng/ml.Conclusion: The data shows that the developed monoclonal antibodies are highly specifi c for FABP1 and do not cross-react with other members of the FABP family. This creates a new analytical tool for the determination of FABP1 in clinical settings.
B-160
Development of Biochip Based Immunoassays as Multi-Analytical Tools for Application to the Diagnosis of Ischaemic Stroke
J. Preece, C. Ledgerwood, S. Brockbank, P. Lowry, R. I. McConnell, S. P. Fitzgerald. Randox Laboratories Limited, Crumlin, United Kingdom
Introduction: Currently stroke is the third leading cause of death worldwide. In cases of acute ischaemic stroke tissue plasminogen activator (tPA) therapy can be administered for thrombolysis if diagnosed within 3 hours of symptom onset. Inappropriate administration of tPA can cause serious adverse effects including intracranial haemorrhage leading to death. The availability of rapid and highly sensitive assays that can complement existing CT scanning procedures to provide a defi nitive diagnosis of ischaemic stroke and rule out patients who have not suffered an ischaemic stroke is relevant for the administration of the appropriate treatment. Glutathione S-transferases (GSTs) are a family of enzymes that play an important role in detoxifi cation and are categorized into four main classes (alpha, mu, pi, and theta). Studies comparing the performance of glutathione S- transferase pi (GSTP1) to that of 28 biomarkers relevant to stroke detection indicated that this protein presented
better sensitivity and specifi city for ischaemic stroke. Nucleoside diphosphate kinase (NDKA) was originally identifi ed because of its reduced mRNA transcript levels in highly metastatic cells. NDKA was identifi ed as having potential utility for stroke detection.Relevance: The purpose of this study was to develop simultaneous biochip based immunoassays for the multi-analytical determination of GSTP1 and NDKA. The analytical performance of the biochip immunoassays was evaluated. This is relevant as a new analytical tool to facilitate an improved diagnosis and treatment.Methodology: The simultaneous chemiluminescent sandwich immunoassays defi ned discrete test sites on the biochip surface. The chemiluminscent signal was detected by digital imaging technology on the Evidence Investigator analyser.The intensity of the signal is proportional to the analyte concentration in the original sample. Serum samples from stroke patients (n=20) and from age and sex matched controls (n=20) were analysed. Equal variance t-test was used for statistical analysis.Results: Evaluation of the analytical performance of the simultaneous immunoassays showed that the immunoassays were target specifi c for both GSTP1 (assay range 0-400ng/ml) and NDKA (assay range 0-300 ng/ml).The assessment of serum samples from stroke patients and age and sex matched controls showed signifi cantly increased values of both biomarkers in stroke patients when compared to controls (3.05 ng/ml versus 0.88 ng/ml, p<0.007 for GSTP1 and 16.15 ng/ml versus 4.12 ng/ml, p<0.001 for NDKA).Conclusion: The data indicates that the developed biochip based immunoassays are applicable to the simultaneous determination of GSTP1 and NDKA. In this study a signifi cant increase in the levels of both proteins was observed in stroke patients when compared to age and sex matched controls. This represents a useful analytical tool for research and clinical applications related to the diagnosis of acute stroke.
B-161
Protein S100B in serum and urine may predict mortality after severe traumatic brain injury
A. Rodríguez-Rodríguez1, J. Egea-Guerrero2, A. León-Justel1, J. Enamorado-Enamorado2, E. Gordillo-Escobar2, Z. Ruíz de Azúa-López2, J. Revuelto-Rey2, Á. Vilches-Arenas3, F. Murillo-Cabezas2, J. Guerrero1. 1Department of Clinical Biochemistry, Virgen del Rocio University Hospital, IBIS/CSIC/University of Seville, Seville, Spain, 2NeuroCritical Care Unit. Virgen del Rocío University Hospital, IBIS/CSIC/University of Seville, Seville, Spain, 3Department Preventive Medicine and Public Health. University of Seville, Seville, Spain
Background: Many researchers have highlighted the correlation between S100B protein serum levels and the severity of intracranial lesions and patient outcome. But there is not much information about the value of S100B protein in urine. The aim of this study was to evaluate the role of S100B levels in serum and urine as an early predictor of mortality after severe traumatic brain injury (TBI).Methods: During 12 month, 55 severe head injury patients were included. Clinical variables collected were: sex, age, score on the Glasgow after resuscitation, CT results, extracranial lesions, score on the Injury Severity Score, and the fi nal diagnosis of death / survival a month post-trauma. Samples of blood and urine were collected at the time of admission, 24, 48, 72 and 96 hours after the trauma.Results: 18.2% of patients died a within a month of the trauma. S100B levels (both serum and urine) were signifi cantly higher in those who died than in survivors. ROC analysis showed that S100B protein determination at 24 hours after a severe TBI can predict mortality (AUC: 0.958 to serum AUC: 0.778 for urine). The following set points were established: 0.461 mg / L for serum, 0.025 mg / L for urine, with a sensitivity of 90% in both cases and a specifi city of 88.4% in the case of serum, 62.8% in the case of urine.Conclusion: S100B serum levels, as well as S100B urine levels, act as a sensitive and specifi c biomarker for the early detection of mortality after severe TBI.

Proteins/Enzymes Wednesday, July 31, 9:30 am – 5:00 pm
CLINICAL CHEMISTRY, Vol. 59, No. 10, Supplement, 2013 A219
B-162
Can CSF indices predict the presence of oligoclonal bands in isoelectric focusing gels ?
I. A. Hashim1, S. Hirany2, P. Kutscher2, J. Balko1. 1University of Texas Southwestern Medical Center, Dallas, TX, 2Parkland Memorial Hospital, Dallas, TX
Introduction: Analysis of cerebrospinal fl uid Immunoglobulin G (IgG) indices and oligoclonal bands (OCBs) is essential in the investigation of multiple sclerosis and other central nervous system disorders. We examined the utility of CSF indices in predicting the presence of oligoclonal bands. CSF indices predictive of and associated with positive OCBs in gels are not known. Knowing the indices values associated with presence of OCBs may be helpful when examining isoelectric focusing gels.Method: Paired CSF and serum IgG and albumin levels as well as associated oligoclonal bands results were collected over a two-year period. CSF IgG index, synthesis rate, as well as localized synthesis were calculated. Values obtained were correlated with fi ndings of OCBs by isoelectric focusing electrophoresis. IgG and albumin levels were measured using BN-II-Nephelometer (Siemens, USA) and OCBs by isoelectric focusing (Sebia, USA). Analysis was performed according to manufacturers’ instructions.Results: 376-matched sets of results were obtained. IgG index ranged from 0.26 to 3.48 (median 0.53), IgG local synthesis ranged from -14.67 to 38.02 (median -0.72), IgG synthesis rate ranged from -24.61 to 223.96 (median -1.99), and albumin index ranged from 1.5 to 54.3 (median 5.0). 79 samples exhibited blood brain barrier impairment as indicated by an albumin index > 9 and were excluded from the analysis. 26.3 % of patients were positive for the presence of OCBs by isoelectric focusing. There was good correlation between IgG index and IgG local synthesis, and IgG synthesis rate (r= 0.71 and 0.68), respectively. In patients with intact blood brain barrier, an IgG index greater than 0.7 predicted the presence of OCBs at 91 %, whereas, IgG index levels below 0.7 predicted absence of OCBs at 92.7%. In patients with blood brain barrier impairment, IgG local synthesis had a better correlation with the presence of OCBs.Conclusion: This study suggests that CSF Indices can be used to predict the presence of oligoclonal bands in isoelectric focusing gels. In patients with an intact blood brain barrier, IgG index >0.7 is predictive of a positive OCB in gels. Those with impaired blood brain barrier, IgG local synthesis is a better predictor than IgG index.
B-163
Optimization of gradient chromatofocusing HPLC and comparison with reversed-phase HPLC in the chromatography of proteins
D. J. Anderson, H. Jogiraju, K. K. Pedada. Cleveland State University, Cleveland, OH
Background and Objective: Gradient chromatofocusing (GCf) is a HPLC technique that generates linear pH gradients on weak anion-exchange columns (in the present study) with low-molecular weight buffer components. The advantages of GCf are its fl exibility in generating pH gradients compared to conventional chromatofocusing, higher resolution and narrower peaks compared to ion-exchange HPLC, and separation based on the protein’s pI. The objective of the present study is optimizing and evaluating GCf in protein analysis by: 1) developing a new approach in generating smooth linear pH gradients (problematic in GCf techniques); 2) studying the effect of the number of buffer components on peak width and resolution; and 3) comparing performance of GCf with reversed-phase HPLC.Methods: The innovation in linear pH gradient generation (pH 6.50 to 3.50 in 40 min, 1 ml/min on Waters DEAE 8HR, 1000Å, 4.6 x 100mm, 8μ) was accomplished by adding a “bridging buffer” into both the aqueous basic application buffer [consisting of 10 mM each of bis-tris methane (6.46) and 3-methyl pyridine (5.68), and 5 mM acetic acid (4.76), in 5% methanol adjusted to pH 6.50 with ammonium hydroxide] and the aqueous acidic elution buffer [consisting of 5 mM 3-methyl pyridine (5.68), 10 mM acetic acid (4.76) and 10 mM lactic acid (3.81)] (buffer component pKa given in the parentheses). The bridging buffers were acetic acid (a normal component of the elution buffer) in the application buffer and 3-methyl pyridine (a normal component of the application buffer) in the elution buffer Proteins were separated according to pI with this four-component buffer system and the results compared with that obtained by a seven-component buffer system, which had more narrowly spaced pKa buffer components. Additional components in the seven-component buffer system were 10 mM 4-methyl pyridine (6.02) and 10 mM pyridine (5.25) in the application buffer and 10 mM 4-chlorophenyl acetic acid (4.19) in the elution buffer. Bridging buffers were
5 mM acetic acid and 5 mM pyridine. Reversed-phase HPLC used a C4, Nest Group, 250mm × 0.3mm, 5u, 300Ǻ column, employing a 50 min linear gradient from 2% to 81% acetonitrile in 50 min at a fl ow rate of 7 uL/min.Results: Addition of the bridging buffer components smoothed the irregularity that usually occurs in the middle portion of the pH gradient. Half-height peak widths in the seven-component buffer system were less for the proteins studied than the four-component buffer system: β-lactoglobulin A (0.94 vs. 1.24 min), β-lactoglobulin B (0.5 vs. 1.11 min), bovine serum albumin (0.7 vs. 2.69 min), conalbumin (1.4 vs. 1.78 min) and ovalbumin (0.46 vs. 0.71 min). Resolution increased by an average of 59% for the greater component buffer system. GCf performed better compared to reversed-phase HPLC, with an average decrease of peak width and average increase in resolution by factors of 2.7 and 6.9, respectively.Conclusion: The fundamental studies presented here advance the technique of ion-exchange HPLC in protein analysis. Potential clinical applications of GCf include hemoglobin analysis and discovery of disease markers in 2D-HPLC proteomic techniques.
B-164
A new method for immuno-turbidimetric measurement of Calprotectin in feces, plasma and other body-fl uids.
L. A. Hansson1, A. M. Havelka2, C. B. Johansson3. 1Department of Molecular Medicine and Surgery, Stockholm, Sweden, 2Department of Molecular Medicine and Surgery Karolinska Institute, Stockholm, Sweden, 3Department of Molecular Medicine and Surgery Karolinska Insitute, Stockholm, Sweden
Background: The interest in calprotectin has been increasing during last few years due to its potential as a non-invasive, cheap and sensitive marker for infl ammation, particularly for intestinal infl ammation. Fecal Calprotectin might in the future be used as a screening tool to exclude unnecessary colon investigations.Currently, calprotectin is measured with commercially available enzyme-linked immunosorbent assays (ELISA) and EliA (Fluoroenzyme immunoassay), which are marketed by several manufacturers. At present, these methods are time-consuming and used only in clinical laboratories. Moreover, determination of calprotectin in feces requires often manual and long pre-analytical processing of the fecal samples, which may lead to very long turn-a-round time for the calprotectin results.We have validated a new immune-turbidimetric assay for determination of calprotectin in combination with a fully automatic system for pre-analytical processing of fecal samples in order to improve effi ciency and generate shorter turn-a-round time for the Calprotectin results.Methods: A new particle-enhanced immune-turbidimetric assay (Gentian, Moss, Norway) for determination of Calprotectin was validated. Fecal Calprotectin was assayed on a Cobas c111 system (Roche AG, Basel Schweiz) .Pre-analytical processing of fecal samples was performed with a fully automated robotic system (SoniC, S2G Scandinavia) and turn-around time for reporting of results was well within a working-day.Results: Linearity was proven throughout the measuring range from 1 to 50 mg/L for plasma samples and 50 to 2500 mg/kg for fecal samples. Within-run CVs for fecal Calprotectin ranged from 2,2 - 9,6 %, for concentration range 50 - 700 mg/kg. Good agreement was achieved in the comparisons between the Gentian-Calprotectin assay and the commercially available ELISAs (Calpro AS and BÜHLMANN Laboratories AG: slope range 1,08 - 1,38, R2 = 0,89-0,92).Conclusions: The immune-turbidimetric Calprotectin assay was shown to be precise and accurate with proven linearity over the measuring range. Good comparability was obtained with other commercially available ELISAs. The automatization of both pre-analytical processing of fecal samples and measurement of Calprotectin concentration resulted in improved effi ciency and signifi cantly shorter turn-around-time for reporting the Calprotectin results.

Wednesday, July 31, 9:30 am – 5:00 pm Proteins/Enzymes
A220 CLINICAL CHEMISTRY, Vol. 59, No. 10, Supplement, 2013
B-166
Use of correlation equations with the reference method to harmonize Alkaline Phosphatase results of routine methods
X. Qin1, C. Qian1, S. Xie1, Z. Qi1, X. Cheng1, L. Qiu1, J. Miller2. 1Department of Laboratory Medicine, Peking Union Medical College Hospital, Beijing, China, 2Department of Pathology and Laboratory Medicine,University of Louisville Hospital, louisville, KY
Background: Some large health care systems have multiple instruments and methods for the same analyte. The results of these disparate methods often vary. Patients may have analyses performed by more than one method and it is desirable for those results to be comparable. Alkaline phosphatase (ALP) is an important enzyme for evaluating hepatic, biliary tract, and bone diseases. However, ALP results vary among the methods in our system. We hypothesized that we could adjust each routine method based on its correlation with the reference method to make all methods equivalent and comparable to the reference method.Methods: We set up the International Federation of Clinical Chemistry (IFCC) reference method for ALP at 37oC (Clin Chem Lab Med. 2011;49:1439). The accuracy of this method was confi rmed by acceptable results on samples from the 2011 external quality assessment scheme for reference laboratories in laboratory medicine (RELA-IFCC) and imprecision was less than 1%. ALP was measured in duplicate on 10 patient specimens on each of 4 days (n=40) by the Roche Modular, Olympus AU5400, and Siemens Dimension methods, and compared with the reference method. ALP activities covered the analytical range (10-741 U/L). Correlation between methods was evaluated using the least squares regression analysis, and Pearson correlation coeffi cients were determined. Routine method results were adjusted using the correlation equation. The predicted bias and 95% confi dence interval (CI) were calculated according to CLSI EP9-A2.Results: All three routine methods correlated well to the reference method (r2>0.99). The regression equations of the Roche, Olympus, and Dimension methods (y) vs. the reference method (x) were, respectively, y=0.923x+2.996; y=1.084x-2.806; and, y=1.084x+2.286. The extreme value of the 95% CI of the predicted bias at the 400 U/L Medical Decision Level of ALP is -35.1 U/L (-8.8%), +34.3 (+8.6%), and +43.1 U/L (+10.8%), for the Roche, Olympus, and Dimension methods, respectively. These all exceed the desirable bias of 6.4% based on biological variation. The corresponding adjustment equations (solving the equations for x) were, respectively, x=1.083y-3.246; x=0.9225y+1.919; and, x=0.922y-2.109. These adjustment equations were used to convert the routine method raw ALP activity (y) to the equivalent reference method result (x). After making these adjustments, the regression equations of the Roche, Olympus, and Dimension methods (y) vs. the reference method (x) were, respectively, y=0.9994x-0.008; y=0.9998x-0.666; and, y=0.99996x+0.005. The extreme value of the 95% CI of the predicted bias at the 400 U/L decision level, after adjustment, were -3.6 U/L (-0.9%), -7.3 U/L (-1.8%), and -2.8 U/L (-0.7%), respectively. The bias of all three methods was within the desirable bias of 6.4%. The adjusted routine method ALP results match the reference method results extremely well.Conclusion: By making these adjustments to the three routine ALP methods they all agree much more closely to the reference method results and to each other. This strategy for harmonizing the ALP results produced by our routine methods allows individual patient’s results to be more consistent when different methods are used at different times.
B-167
Development of a new homogeneous immunoassay for Ferritin with ultra-sensitivity
M. Kano, R. Tachibana, Y. Sato, Y. Ito. Research and Development Department, Denka Seiken Co., Ltd., Niigata, Japan
Background: Because of wide variety of clinical signifi cances of Ferritin in both low such as iron defi ciency anemia and high serum levels (a lower threshold is 12 μg/L or below and an upper threshold is 300 μg/L or greater), assays for serum Ferritin level are required to have a wide assay range with high sensitivity. In addition, serum Ferritin levels may increase very high in some disorders such as hemochromatosis, hemosiderosis, etc. Thus it is also important for assays for serum Ferritin to have good prozone (high dose hook effect) tolerance for accurate and reliable measurements. We developed a new latex particle-enhanced turbidimetric immunoassay for serum and plasma Ferritin with ultra-sensitivity and excellent prozone tolerance. We compared our new assay to other Ferritin assays already marketed including the one currently available from Denka Seiken.
Methods: We carried out a performance verifi cation study and a method comparison study against fi ve other Ferritin reagents on a Hitachi 917 analyzer.Results: The new assay showed the correlation coeffi cient over 0.99 against the current assay from Denka Seiken even on the unique clinical samples such as EBV IgG positive samples, Rheumatoid factor high positive samples, etc. It showed prozone tolerance that is at least equivalent to the other reagents or even better. The new assay showed the best performance in terms of the sensitivity and showed the lowest detection limit and smallest CVs from within-run imprecision with samples around the lower threshold (5 - 15 μg/L).Conclusion: The new Ferritin assay from Denka Seiken showed the best performance compared to the other Ferritin assays already marketed. The new assay showed excellent precision, sensitivity and prozone for diagnosis of various disorders where Ferritin level is either abnormally low or high without nonspecifi c reaction. This new assay can give laboratories a more economical and fl exible approach for Ferritin determination.
B-168
An Evaluation of Specifi c Protein Assays on Mindray’s BS-2000M1 Clinical Chemistry System*
Y. Li, J. Zhuang, C. Chen, X. Zhang, J. Liu. Department of Laboratory Medicine, Guangdong Provincial Hospital of Traditional Chinese Medicine, Guangzhou, China
Background: Specifi c proteins are useful markers in the clinical laboratory for the diagnosis of immunologic disorders and monitoring changes in the normal polyclonal mixture of serum immunoglobulins. Mindray’s BS-2000M1 (Shenzhen Mindray Bio-Medical Electronics CO., LTD., P.R. China) is a high throughput clinical chemistry system of 2200 tests/hour with ISE, and has a broad test menu including specifi c proteins (Calibrators are traceable to ERM-DA470k).Objective: The purpose of this study was to evaluate the performance of specifi c protein immunoturbidimetric assays on the new Mindray’s BS-2000M1 clinical chemistry system in comparison to the Cobas® 8000 clinical chemistry system (Roche Diagnostics, Germany) using patient specimens received into the laboratory for routine testing.Methods: Five of the currently available BS-2000M1 serum protein immunoturbidimetric assays were evaluated as part of this study. Evaluation protocols for precision were based on CLSI EP-5A2 methods. Linearity protocol was based on CLSI guideline EP6-A. Method comparison was evaluated using samples spanning the dynamic range based on CLSI guideline EP9-A2.Results: Total precision targets were met for all specifi c proteins, as well as within-run targets. Total %CV’s ranged from 1.34-3.15%. Linearity met the Mindray claimed dynamic range in all cases. Linear regression results from the method comparison studies between the BS-2000M1 and the Cobas 8000 are presented in the table.
Method Comparison Results Between BS-2000M1 and Cobas 8000Assay Range (g/L) N Slope Intercept RC3 0.19-1.54 62 0.96 -0.07 0.998C4 0.010-0.480 62 0.96 0.00 0.997IG-A 0.18-6.26 64 1.03 -0.16 0.997IG-G 5.82-22.89 65 1.06 0.30 0.992IG-M 0.19-3.69 65 1.08 -0.02 0.998

Proteins/Enzymes Wednesday, July 31, 9:30 am – 5:00 pm
CLINICAL CHEMISTRY, Vol. 59, No. 10, Supplement, 2013 A221
Conclusions: With respect to precision, linearity, and accuracy of serum protein assays tested, Mindray’s BS-2000M1 clinical chemistry system produces results that were consistent with Cobas 8000 clinical chemistry system.* not yet available for in vitro diagnostic use in the US.
B-169
Development of candidate reference material SRM 2924 C-reactive Protein Solution
E. L. Kilpatrick. National Institute of Standards and Technology, Gaithersburg, MD
The goal of the current research is to produce a pure compound certifi ed reference material for C-reactive protein (CRP) to be used in the standardization of clinical laboratory assays. The Joint Committee for Traceability in Laboratory Medicine (JCTLM) maintains a database of higher-order reference materials for laboratory medicine and in vitro diagnostics. Currently, there is no JCTLM-approved material for pure CRP. The National Institute of Standards and Technology (NIST) has procured candidate material to generate SRM 2924, C-reactive Protein Solution. The material was prepared as a solution of approximately 0.5 mg of recombinant CRP in a volume of 1 mL aqueous buffer (concentration = 0.5 mg/mL) and will be analyzed for protein concentration as well as structural conformation and related attributes. Preliminary analysis of molar mass was performed using two methods: matrix-assisted laser desorption ionization time of fl ight mass spectrometry (MALDI-MS) and electrospray ionization mass spectrometry (LC/MS) with deconvolution. The molar mass determined by each method was in close agreement (MALDI-MS (-313 ppm, n=10); LC/MS - (21 ppm, n=8) with the sequence calculated mass of 23029 Dalton including known post-translational modifi cations. Initial purity assessment was performed using sodium dodecyl sulfate polyacrylamide gel electrophoresis (SDS-PAGE, n=10) indicating that only a single band was evident upon Coomassie blue staining. Further analysis will include amino acid analysis by isotope-dilution mass spectrometry for concentration assignment and density measurements by the Lang-Levy method. Issuance of SRM 2924 will enable the generation of secondary reference materials using higher order methods leading to advances in standardization of CRP clinical measurements.
B-170
Alpha-defensin in synovial fl uid as a new biomarker for the diagnosis of periprosthetic joint infection
C. Deirmengian1, K. Kardos1, P. Kilmartin1, A. Cameron1, D. Chung1, K. Schiller1, K. Birkmeyer1, G. Kazarian1, J. Parvizi2. 1CD Diagnostics, Inc, Wynnewood, PA, 2Rothman Institute of Orthopedics, Thomas Jefferson University Hospital, Philadelphia, PA
Background: Prosthetic joint infection (PJI) occurs after primary joint replacements at a rate of 1.0-2.5% and increases to 2.0-5.8% in revision surgeries. When treating a painful joint replacement, the ability to distinguish between septic and aseptic failure of the prosthesis is critical, as the treatment for PJI necessitates unique surgical strategies that aim to eradicate the organism. Currently, surgeons utilize a wide spectrum of tests in the attempt to diagnose PJI, including local measures of synovial infl ammation (synovial fl uid white blood cell count and differential, synovial tissue white blood cell count), systemic measures of infl ammation (serum C-reactive protein level, erythrocyte sedimentation rate), radiologic tests (radiographs, bone scan), and bacterial isolation techniques (Gram stain, culture). Each of these methods individually has limitations for either sensitivity or specifi city. It has been reported that 10-20% of all confi rmed infections cannot be confi rmed via culture methods. The failure of these tools to reliably diagnose infection, and the resulting clinician disparity in practice, recently led the Musculoskeletal Infection Society (MSIS) to publish a consensus defi nition of PJI, utilizing a combination of clinical data and six of the above tests. Methods: We assessed the ability of alpha-defensin to distinguish prosthetic joint infection from aseptic infl ammation utilizing a series of well-characterized samples that were clearly defi ned by the MSIS criteria utilizing an alpha-defensin ELISA (Hycult) modifi ed for use with synovial fl uid. The study included 23 aseptic samples and 22 septic samples that were provided by the Rothman Institute. Receiver Operating Characteristics (ROC) analysis was conducted to select the optimal cutoff for the assay and its performance was established verses the MSIS criteria. Additionally, the performance of each of the individual methods utilized in the MSIS criteria was evaluated utilizing the recommended criteria.
Results: A total of 45 well-defi ned samples were used to establish the optimal cutoff (7.7μg/mL) for the alpha-defensins using a ROC analysis that yielded an area under the curve (AUC) of 1.0. The sensitivity (and 95% confi dence interval) for alpha-defensin, ESR, CRP, WBC count, PMN% and culture were 100% (84.6-100%), 95.5% (77.2-99.9%), 95.5% (77.2-99.9%), 95.5% (77.2-99.9%), 95.5% (77.2-99.9%) and 90.9% (70.8-98.9%) respectively. The specifi city performances were 100% (85.2-100.0), 78.3% (56.3-92.5%), 87.0% (66.4-97.2%), 95.7% (78.1-99.9%), 95.7% (78.1-99.9%) and 95.7% (78.1-99.9%) respectively. There was signifi cant separation between the positive and negative populations for alpha defensin where the concentration of the lowest positive sample was 2.44 fold higher than the highest negative sample.Conclusion: The measurement of alpha-defensin levels provides a highly sensitive and specifi c method to aid the diagnosis of PJI with improved performance compared to the traditional methods utilized for the analysis of synovial fl uid.
B-171
Performance characteristics of The NGAL Test™ using the Roche cobas c501 analyzer
S. L. La’ulu1, B. B. Suh-Lailam2, K. W. Davis3, A. E. Tebo2, J. A. Straseski2. 1ARUP Institute for Clinical and Experimental Pathology, Salt Lake City, UT, 2Department of Pathology, University of Utah, Salt Lake City, UT, 3ARUP Laboratories, Salt Lake City, UT
Background: Neutrophil gelatinase-associated lipocalin (NGAL) is a biomarker that may aid in diagnosis of acute kidney injury and shows promise as a biomarker for lupus nephritis. The objective of this study was to evaluate the analytical performance of The NGAL Test™ (BioPorto Diagnostics) clinical chemistry application using the Roche cobas c501.Methods: Imprecision was tested using manufacturer’s quality control material, 3 serum pools, and 2 urine pools. Two runs of duplicate testing were conducted daily for 5 days. Interference studies and limit of detection were performed for both serum and urine matrices. Dilution linearity was assessed using manufacturer’s high and blank calibrators. Method comparison testing was performed using the NGAL ELISA kit as the comparator method. Samples used for testing were paired urine and serum specimens from patients suspected of systemic lupus erythematosus.Results: Imprecision studies had total CV’s ≤ 5.2%. Hemoglobin concentrations up to 1335 mg/dL, bilirubin concentrations up to 7.25 mg/dL, and triglyceride concentrations (serum only) up to 2350 mg/dL had no effect on results within the precision of the assay for both serum and urine samples. The limit of detection was 10.7 ng/mL for serum and 4.6 ng/mL for urine. The assay was linear over a measured range of 2.3 to 4934 ng/mL with maximum deviations from target recovery ≤ 8.4% and slope of 1.02. Method comparison of the c501 to the ELISA by Deming regression and Bland-Altman plots are summarized (Table 1).Conclusions: The NGAL Test™, performed with the Roche c501, had favorable precision and linearity. No interferences were observed for hemolysis, icterus, or lipemia. A negative bias was observed between the 2 methodologies with the bias being more prominent in urine samples. Overall, The NGAL Test™ performed well on the Roche c501 and provides an alternative to the laborious ELISA method.
Sample Type N Equation r BiasSerum 110 c501 = 0.89 x ELISA + 5.94 0.682 -33.6Urine 109 c501 = 0.75 x ELISA - 27.16 0.745 -107.8
B-172
Development and evaluation of the performance characteristics of a new microfl uidic immunoassay for Haptoglobin on FRENDTM System
S. Lee, E. Choi, C. Lee, J. K. Chang, S. Han. NanoEnTek, Seoul, Korea, Republic of
Background: The FRENDTM System is a portable, automated FRENDTM cartridge reader which is based on quantitative immunoassay technology capable of quantifying single or multiple analytes in 6 minutes by measuring laser-induced fl uorescence in a single-use disposable reagent cartridge. Haptoglobin (HP) is an acute phase protein whose serum concentration rises signifi cantly during acute infl ammation due to causes including surgery, myocardial infarction, infections and tumors.Objective: The objective performance of this study was to evaluate a Haptoglobin immunoassay on a micro-fl uidic platform (FRENDTM cartridge-system).Method: Human serum samples were diluted off-line with provided kit 10,000 fold prior to analysis. Serum HP concentration was determined by immuno-
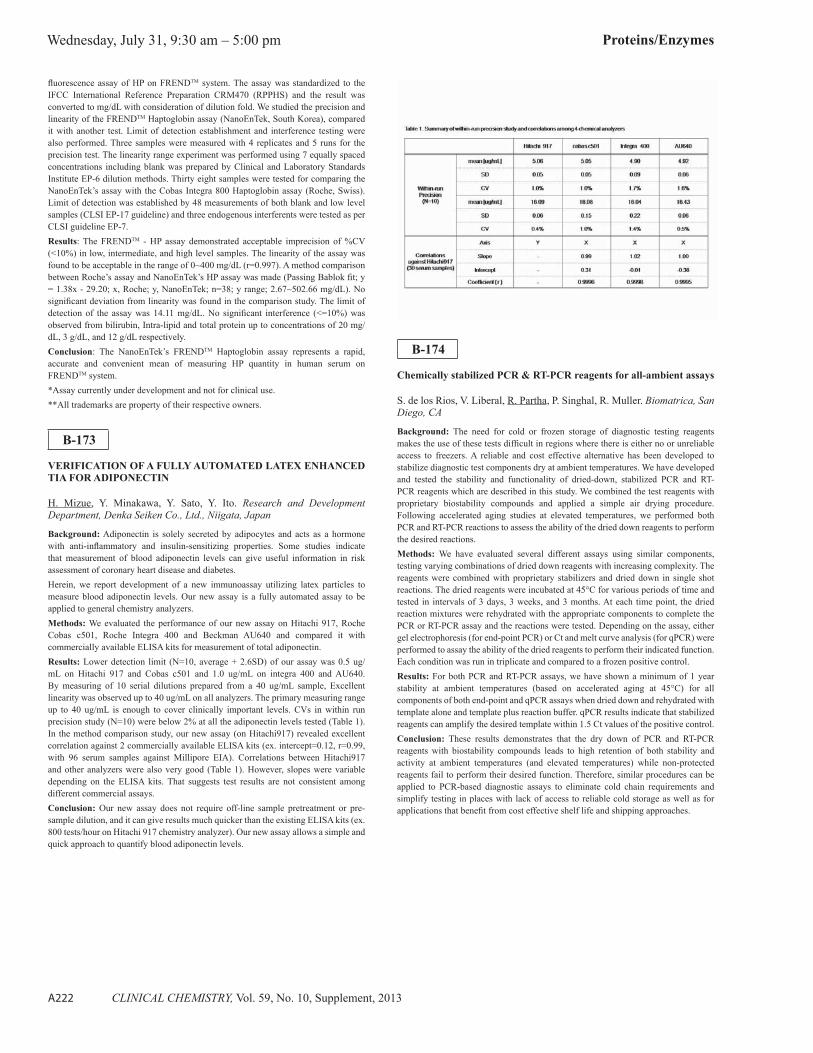
Wednesday, July 31, 9:30 am – 5:00 pm Proteins/Enzymes
A222 CLINICAL CHEMISTRY, Vol. 59, No. 10, Supplement, 2013
fl uorescence assay of HP on FRENDTM system. The assay was standardized to the IFCC International Reference Preparation CRM470 (RPPHS) and the result was converted to mg/dL with consideration of dilution fold. We studied the precision and linearity of the FRENDTM Haptoglobin assay (NanoEnTek, South Korea), compared it with another test. Limit of detection establishment and interference testing were also performed. Three samples were measured with 4 replicates and 5 runs for the precision test. The linearity range experiment was performed using 7 equally spaced concentrations including blank was prepared by Clinical and Laboratory Standards Institute EP-6 dilution methods. Thirty eight samples were tested for comparing the NanoEnTek’s assay with the Cobas Integra 800 Haptoglobin assay (Roche, Swiss). Limit of detection was established by 48 measurements of both blank and low level samples (CLSI EP-17 guideline) and three endogenous interferents were tested as per CLSI guideline EP-7.Results: The FRENDTM - HP assay demonstrated acceptable imprecision of %CV (<10%) in low, intermediate, and high level samples. The linearity of the assay was found to be acceptable in the range of 0~400 mg/dL (r=0.997). A method comparison between Roche’s assay and NanoEnTek’s HP assay was made (Passing Bablok fi t; y = 1.38x - 29.20; x, Roche; y, NanoEnTek; n=38; y range; 2.67~502.66 mg/dL). No signifi cant deviation from linearity was found in the comparison study. The limit of detection of the assay was 14.11 mg/dL. No signifi cant interference (<=10%) was observed from bilirubin, Intra-lipid and total protein up to concentrations of 20 mg/dL, 3 g/dL, and 12 g/dL respectively.Conclusion: The NanoEnTek’s FRENDTM Haptoglobin assay represents a rapid, accurate and convenient mean of measuring HP quantity in human serum on FRENDTM system.*Assay currently under development and not for clinical use.**All trademarks are property of their respective owners.
B-173
VERIFICATION OF A FULLY AUTOMATED LATEX ENHANCED TIA FOR ADIPONECTIN
H. Mizue, Y. Minakawa, Y. Sato, Y. Ito. Research and Development Department, Denka Seiken Co., Ltd., Niigata, Japan
Background: Adiponectin is solely secreted by adipocytes and acts as a hormone with anti-infl ammatory and insulin-sensitizing properties. Some studies indicate that measurement of blood adiponectin levels can give useful information in risk assessment of coronary heart disease and diabetes.Herein, we report development of a new immunoassay utilizing latex particles to measure blood adiponectin levels. Our new assay is a fully automated assay to be applied to general chemistry analyzers.Methods: We evaluated the performance of our new assay on Hitachi 917, Roche Cobas c501, Roche Integra 400 and Beckman AU640 and compared it with commercially available ELISA kits for measurement of total adiponectin.Results: Lower detection limit (N=10, average + 2.6SD) of our assay was 0.5 ug/mL on Hitachi 917 and Cobas c501 and 1.0 ug/mL on integra 400 and AU640. By measuring of 10 serial dilutions prepared from a 40 ug/mL sample, Excellent linearity was observed up to 40 ug/mL on all analyzers. The primary measuring range up to 40 ug/mL is enough to cover clinically important levels. CVs in within run precision study (N=10) were below 2% at all the adiponectin levels tested (Table 1). In the method comparison study, our new assay (on Hitachi917) revealed excellent correlation against 2 commercially available ELISA kits (ex. intercept=0.12, r=0.99, with 96 serum samples against Millipore EIA). Correlations between Hitachi917 and other analyzers were also very good (Table 1). However, slopes were variable depending on the ELISA kits. That suggests test results are not consistent among different commercial assays.Conclusion: Our new assay does not require off-line sample pretreatment or pre-sample dilution, and it can give results much quicker than the existing ELISA kits (ex. 800 tests/hour on Hitachi 917 chemistry analyzer). Our new assay allows a simple and quick approach to quantify blood adiponectin levels.
B-174
Chemically stabilized PCR & RT-PCR reagents for all-ambient assays
S. de los Rios, V. Liberal, R. Partha, P. Singhal, R. Muller. Biomatrica, San Diego, CA
Background: The need for cold or frozen storage of diagnostic testing reagents makes the use of these tests diffi cult in regions where there is either no or unreliable access to freezers. A reliable and cost effective alternative has been developed to stabilize diagnostic test components dry at ambient temperatures. We have developed and tested the stability and functionality of dried-down, stabilized PCR and RT-PCR reagents which are described in this study. We combined the test reagents with proprietary biostability compounds and applied a simple air drying procedure. Following accelerated aging studies at elevated temperatures, we performed both PCR and RT-PCR reactions to assess the ability of the dried down reagents to perform the desired reactions.Methods: We have evaluated several different assays using similar components, testing varying combinations of dried down reagents with increasing complexity. The reagents were combined with proprietary stabilizers and dried down in single shot reactions. The dried reagents were incubated at 45°C for various periods of time and tested in intervals of 3 days, 3 weeks, and 3 months. At each time point, the dried reaction mixtures were rehydrated with the appropriate components to complete the PCR or RT-PCR assay and the reactions were tested. Depending on the assay, either gel electrophoresis (for end-point PCR) or Ct and melt curve analysis (for qPCR) were performed to assay the ability of the dried reagents to perform their indicated function. Each condition was run in triplicate and compared to a frozen positive control.Results: For both PCR and RT-PCR assays, we have shown a minimum of 1 year stability at ambient temperatures (based on accelerated aging at 45°C) for all components of both end-point and qPCR assays when dried down and rehydrated with template alone and template plus reaction buffer. qPCR results indicate that stabilized reagents can amplify the desired template within 1.5 Ct values of the positive control.Conclusion: These results demonstrates that the dry down of PCR and RT-PCR reagents with biostability compounds leads to high retention of both stability and activity at ambient temperatures (and elevated temperatures) while non-protected reagents fail to perform their desired function. Therefore, similar procedures can be applied to PCR-based diagnostic assays to eliminate cold chain requirements and simplify testing in places with lack of access to reliable cold storage as well as for applications that benefi t from cost effective shelf life and shipping approaches.
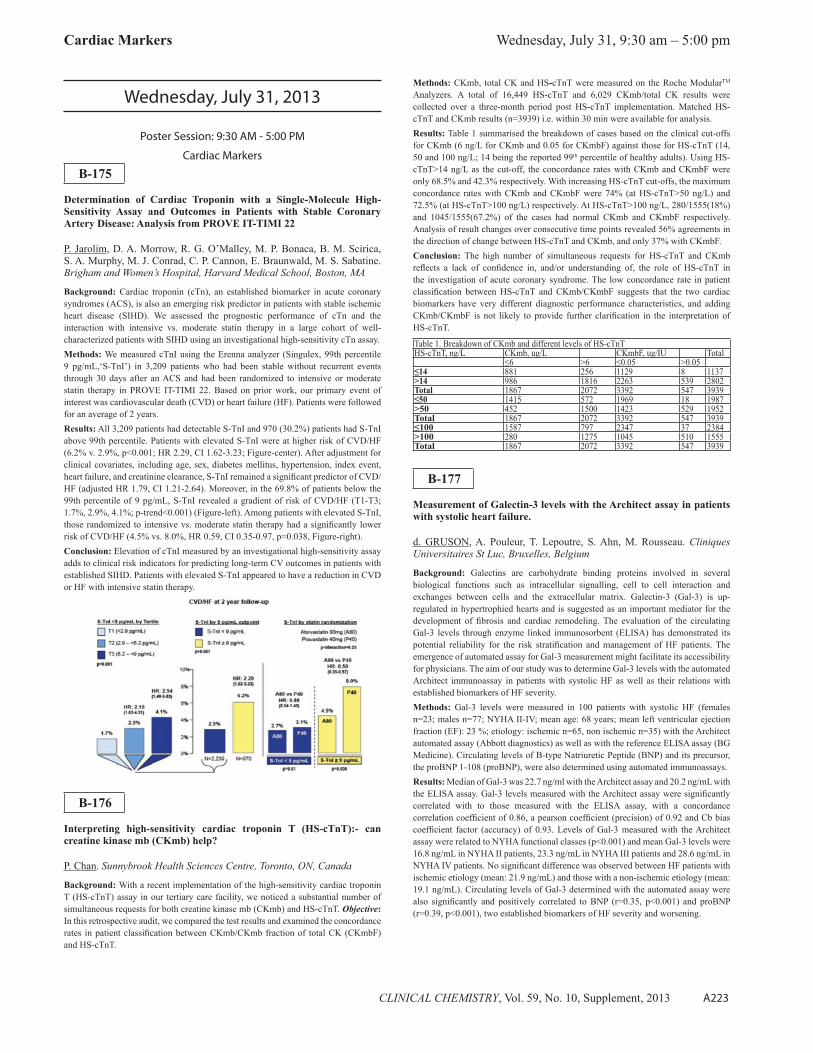
Cardiac Markers Wednesday, July 31, 9:30 am – 5:00 pm
CLINICAL CHEMISTRY, Vol. 59, No. 10, Supplement, 2013 A223
Wednesday, July 31, 2013
Poster Session: 9:30 AM - 5:00 PM
Cardiac Markers
B-175
Determination of Cardiac Troponin with a Single-Molecule High-Sensitivity Assay and Outcomes in Patients with Stable Coronary Artery Disease: Analysis from PROVE IT-TIMI 22
P. Jarolim, D. A. Morrow, R. G. O’Malley, M. P. Bonaca, B. M. Scirica, S. A. Murphy, M. J. Conrad, C. P. Cannon, E. Braunwald, M. S. Sabatine. Brigham and Women’s Hospital, Harvard Medical School, Boston, MA
Background: Cardiac troponin (cTn), an established biomarker in acute coronary syndromes (ACS), is also an emerging risk predictor in patients with stable ischemic heart disease (SIHD). We assessed the prognostic performance of cTn and the interaction with intensive vs. moderate statin therapy in a large cohort of well-characterized patients with SIHD using an investigational high-sensitivity cTn assay.Methods: We measured cTnI using the Erenna analyzer (Singulex, 99th percentile 9 pg/mL,‘S-TnI’) in 3,209 patients who had been stable without recurrent events through 30 days after an ACS and had been randomized to intensive or moderate statin therapy in PROVE IT-TIMI 22. Based on prior work, our primary event of interest was cardiovascular death (CVD) or heart failure (HF). Patients were followed for an average of 2 years.Results: All 3,209 patients had detectable S-TnI and 970 (30.2%) patients had S-TnI above 99th percentile. Patients with elevated S-TnI were at higher risk of CVD/HF (6.2% v. 2.9%, p<0.001; HR 2.29, CI 1.62-3.23; Figure-center). After adjustment for clinical covariates, including age, sex, diabetes mellitus, hypertension, index event, heart failure, and creatinine clearance, S-TnI remained a signifi cant predictor of CVD/HF (adjusted HR 1.79, CI 1.21-2.64). Moreover, in the 69.8% of patients below the 99th percentile of 9 pg/mL, S-TnI revealed a gradient of risk of CVD/HF (T1-T3; 1.7%, 2.9%, 4.1%; p-trend<0.001) (Figure-left). Among patients with elevated S-TnI, those randomized to intensive vs. moderate statin therapy had a signifi cantly lower risk of CVD/HF (4.5% vs. 8.0%, HR 0.59, CI 0.35-0.97, p=0.038, Figure-right).Conclusion: Elevation of cTnI measured by an investigational high-sensitivity assay adds to clinical risk indicators for predicting long-term CV outcomes in patients with established SIHD. Patients with elevated S-TnI appeared to have a reduction in CVD or HF with intensive statin therapy.
B-176
Interpreting high-sensitivity cardiac troponin T (HS-cTnT):- can creatine kinase mb (CKmb) help?
P. Chan. Sunnybrook Health Sciences Centre, Toronto, ON, Canada
Background: With a recent implementation of the high-sensitivity cardiac troponin T (HS-cTnT) assay in our tertiary care facility, we noticed a substantial number of simultaneous requests for both creatine kinase mb (CKmb) and HS-cTnT. Objective: In this retrospective audit, we compared the test results and examined the concordance rates in patient classifi cation between CKmb/CKmb fraction of total CK (CKmbF) and HS-cTnT.
Methods: CKmb, total CK and HS-cTnT were measured on the Roche ModularTM Analyzers. A total of 16,449 HS-cTnT and 6,029 CKmb/total CK results were collected over a three-month period post HS-cTnT implementation. Matched HS-cTnT and CKmb results (n=3939) i.e. within 30 min were available for analysis.Results: Table 1 summarised the breakdown of cases based on the clinical cut-offs for CKmb (6 ng/L for CKmb and 0.05 for CKmbF) against those for HS-cTnT (14, 50 and 100 ng/L; 14 being the reported 99th percentile of healthy adults). Using HS-cTnT>14 ng/L as the cut-off, the concordance rates with CKmb and CKmbF were only 68.5% and 42.3% respectively. With increasing HS-cTnT cut-offs, the maximum concordance rates with CKmb and CKmbF were 74% (at HS-cTnT>50 ng/L) and 72.5% (at HS-cTnT>100 ng/L) respectively. At HS-cTnT>100 ng/L, 280/1555(18%) and 1045/1555(67.2%) of the cases had normal CKmb and CKmbF respectively. Analysis of result changes over consecutive time points revealed 56% agreements in the direction of change between HS-cTnT and CKmb, and only 37% with CKmbF.Conclusion: The high number of simultaneous requests for HS-cTnT and CKmb refl ects a lack of confi dence in, and/or understanding of, the role of HS-cTnT in the investigation of acute coronary syndrome. The low concordance rate in patient classifi cation between HS-cTnT and CKmb/CKmbF suggests that the two cardiac biomarkers have very different diagnostic performance characteristics, and adding CKmb/CKmbF is not likely to provide further clarifi cation in the interpretation of HS-cTnT.
Table 1. Breakdown of CKmb and different levels of HS-cTnTHS-cTnT, ng/L CKmb, ug/L CKmbF, ug/IU Total
≤6 >6 ≤0.05 >0.05≤14 881 256 1129 8 1137>14 986 1816 2263 539 2802Total 1867 2072 3392 547 3939≤50 1415 572 1969 18 1987>50 452 1500 1423 529 1952Total 1867 2072 3392 547 3939≤100 1587 797 2347 37 2384>100 280 1275 1045 510 1555Total 1867 2072 3392 547 3939
B-177
Measurement of Galectin-3 levels with the Architect assay in patients with systolic heart failure.
d. GRUSON, A. Pouleur, T. Lepoutre, S. Ahn, M. Rousseau. Cliniques Universitaires St Luc, Bruxelles, Belgium
Background: Galectins are carbohydrate binding proteins involved in several biological functions such as intracellular signalling, cell to cell interaction and exchanges between cells and the extracellular matrix. Galectin-3 (Gal-3) is up-regulated in hypertrophied hearts and is suggested as an important mediator for the development of fibrosis and cardiac remodeling. The evaluation of the circulating Gal-3 levels through enzyme linked immunosorbent (ELISA) has demonstrated its potential reliability for the risk stratifi cation and management of HF patients. The emergence of automated assay for Gal-3 measurement might facilitate its accessibility for physicians. The aim of our study was to determine Gal-3 levels with the automated Architect immunoassay in patients with systolic HF as well as their relations with established biomarkers of HF severity.Methods: Gal-3 levels were measured in 100 patients with systolic HF (females n=23; males n=77; NYHA II-IV; mean age: 68 years; mean left ventricular ejection fraction (EF): 23 %; etiology: ischemic n=65, non ischemic n=35) with the Architect automated assay (Abbott diagnostics) as well as with the reference ELISA assay (BG Medicine). Circulating levels of B-type Natriuretic Peptide (BNP) and its precursor, the proBNP 1-108 (proBNP), were also determined using automated immunoassays.Results: Median of Gal-3 was 22.7 ng/ml with the Architect assay and 20.2 ng/mL with the ELISA assay. Gal-3 levels measured with the Architect assay were signifi cantly correlated with to those measured with the ELISA assay, with a concordance correlation coeffi cient of 0.86, a pearson coeffi cient (precision) of 0.92 and Cb bias coeffi cient factor (accuracy) of 0.93. Levels of Gal-3 measured with the Architect assay were related to NYHA functional classes (p<0.001) and mean Gal-3 levels were 16.8 ng/mL in NYHA II patients, 23.3 ng/mL in NYHA III patients and 28.6 ng/mL in NYHA IV patients. No signifi cant difference was observed between HF patients with ischemic etiology (mean: 21.9 ng/mL) and those with a non-ischemic etiology (mean: 19.1 ng/mL). Circulating levels of Gal-3 determined with the automated assay were also signifi cantly and positively correlated to BNP (r=0.35, p<0.001) and proBNP (r=0.39, p<0.001), two established biomarkers of HF severity and worsening.

Wednesday, July 31, 9:30 am – 5:00 pm Cardiac Markers
A224 CLINICAL CHEMISTRY, Vol. 59, No. 10, Supplement, 2013
Conclusions: Our results show that Gal-3 levels measured with the recently developed Architect automated immunoassay are related to the severity of systolic heart failure and are associated to established biomarkers of HF worsening. Measurement of Gal-3 with such automated assay might therefore be relevant for the risk stratifi cation and treatment selection of patients with systolic HF.
B-178
Performance of a high sensitivity cardiac troponin I assay in patients with non-ST elevation acute coronary syndrome
P. Jarolim, M. P. Bonaca, M. J. Conrad, S. A. Murphy, D. A. Morrow. Brigham and Women’s Hospital, Harvard Medical School, Boston, MA
Background: Newer high-sensitivity assays for cardiac troponin (hsTn) enable more precise measurement of very low troponin concentrations and improved diagnostic accuracy. However, their prognostic value, particularly at low concentrations, is less well defi ned. We asked whether newly detectable troponin concentrations are associated with increased risk of recurrent cardiovascular events.Methods: We compared the prognostic performance of a new hsTnI assay (Abbott ARCHITECT) with performance of the commercial 4th generation troponin T assay (TnT, Roche) in 4,695 patients with non-ST elevation acute coronary syndromes (NSTE-ACS) from the TIMI Clinical Trials Database. The primary endpoint was cardiovascular death (CVD) or new or recurrent myocardial infarction (MI) at 30 days. Baseline troponin was categorized at the published 99th percentile reference limit (26 pg/mL for hsTnI; 10 pg/mL for TnT), and at gender-specifi c 99th percentiles for hsTnI.Results: 100% of patients had detectable hsTnI concentrations compared with 94.5% patients using TnT. Patients with hsTnI ≥99th percentile (85%) had a 3.7-fold higher adjusted risk of cardovascular death or MI at 30 days relative to patients with hsTnI <99th percentile (9.7% vs. 3.0%, p<0.001) after accounting for all other elements of the TIMI Risk Score. Use of gender-specifi c 99th percentile cut-points did not improve prognostic performance. Patients with a negative 4th generation TnT result but hsTnI>26 ng/L (N=87) were at higher risk of CVD/MI than those with negative hsTnI (9.2% vs. 2.1%, p<0.001, N=629). Among patients below the overall 99th percentile reference limit, all of whom had detectable troponin (>1.5 ng/L) and constituted 14.3% (N=703) of the total population, stratifi cation into tertiles identifi ed an apparent gradient of risk (p-trend=0.068) that was signifi cant (p-trend <0.001) when considered across the entire range of troponin values (Figure).Conclusion: Application of the hsTnI assay identifi ed a clinically relevant higher risk of recurrent cardiovascular events in patients with NSTE-ACS, even at very low troponin concentrations.
B-179
A comparison of a sensitive and two high-sensitivity cardiac troponin assays for diagnosing myocardial infarction after 90 minutes in the emergency setting
P. Kavsak1, J. J. You1, S. Hill1, M. Oremus1, P. J. Devereaux1, A. S. Jaffe2, A. Worster1. 1McMaster University, Hamilton, ON, Canada, 2Mayo Clinic,
Rochester, MN
BACKGROUND: Recent studies have investigated measuring cardiac troponin (cTn) earlier than the recommended 3-6h after emergency department (ED) presentation in patients with symptoms suggestive of acute coronary syndrome (ACS) to aid in the diagnosis of myocardial infarction (MI). The object of this pilot study was to assess the diagnostic performance of a sensitive cTnI assay (ARCHITECT STAT cTnI) and two high-sensitivity assays (hs-cTnT[Roche], hs-cTnI[Abbott]) at presentation and 90 minutes, as well as the absolute change in concentrations between these two time-points for the diagnosis of MI.METHODS: This prospective observational study was approved by research ethics. Inclusion criteria were ED patients (≥18y) with suspected ACS who presented within 6h after pain-onset; whereas patients were excluded if they were referred to surgery; those with an MI diagnosis prior to the fi rst cTn result (e.g., STEMI); or declined participation. Blood (EDTA plasma) was obtained at presentation and 90 minutes, and stored below -80C prior to testing with the ARCHITECT STAT cTnI and pre-commercial hs-cTnI assays, and the Roche hs-cTnT assay. The outcome was a diagnosis of MI within 72h after presentation. Adjudication was performed by an ED physician and an Internal Medicine physician blinded to the 3 cTn assays data. Sensitivity, specifi city, likelihood ratios, and ROC were determined (Analyze-it software).RESULTS: The study included 149 patients with a median age of 60 years, 64% were male, and 9 were adjudicated as having an MI. At presentation or at 90 minutes using the 99th percentile cutoffs the sensitivity was equivalent for the assays; however the specifi city was signifi cantly higher for hs-cTnI as compared to hs-cTnT (Table). By ROC analysis the most optimal change was determined and when applied signifi cantly improved the specifi city for the cTnI and hs-cTnT assays.
Criteria ARCHITECT STAT cTnI hs-cTnT hs-cTnI
Presentation >99th >0.03 ug/L ≥ 14 ng/L ≥ 26 ng/LSensitivity(95%CI) Specifi city(95%CI)
89% (52-100)86% (79-91)
89% (52-100)73% (65-80)
89% (52-100)89% (83-94)
Likelihood ratio (+)Likelihood ratio (-)
6.180.13
3.270.15
8.300.12
AUC (95%CI) 0.91 (0.77-1.00) 0.94 (0.88-1.00) 0.96 (0.91-1.00)90 min >99th >0.03 ug/L ≥ 14 ng/L ≥ 26 ng/LSensitivity(95%CI) Specifi city(95%CI)
100% (66-100)78% (70-84)
100% (66-100)73% (65-80)
100% (66-100)89% (83-94)
Likelihood ratio (+)Likelihood ratio (-)
4.480.00
3.660.00
9.270.00
AUC (95%CI) 0.99 (0.97-1.00) 0.98 (0.95-1.00) 0.98 (0.95-1.00)Delta > 0.02 ug/L change > 7 ng/L
change> 15 ng/L change
Sensitivity(95%CI) Specifi city(95%CI)
89% (52-100)92% (86-96)
89% (52-100)96% (91-98)
89% (52-100)95% (90-98)
Likelihood ratio (+)Likelihood ratio (-)
11.150.12
20.590.12
17.780.12
AUC (95%CI) 0.97 (0.92-1.00) 0.89 (0.68-1.00) 0.97 (0.93-1.00)CONCLUSIONS: Larger studies assessing the earlier timeframe performance vs. the recommended 3-6 hours are required.
B-180
Evaluation of the method of measurement of platelet catecholamines in patients with OSA with and without treatment for one year of CPAP.
M. C. fFeres, L. Mello-Fujita, C. F. Rizzi, F. D. Cintra, S. Tufi k, D. Poyares. Universidade Federal de Sao Paulo- Brasil- UNIFESP, Sao Paulo, Brazil
Background: Many published studies showed that the assay method of platelet catecholamines are more stable because they do not suffer interference from abrupt changes. The platelets accumulate catecholamine concentration dependent of plasmatic and there is evidence to be more effi cient evaluation of the sympathetic nervous system (SNS) as compared with methods of evaluation plasmatic and urinary catecholamines. Thus we use this methodology to evaluate the SNS in obstructive

Cardiac Markers Wednesday, July 31, 9:30 am – 5:00 pm
CLINICAL CHEMISTRY, Vol. 59, No. 10, Supplement, 2013 A225
sleep apnea (OSA) with or without arterial hypertension (HYP) and in this study we tested the performance of platelet catecholamines method in patients with OSA before and after one year of effective continuos positive air pression (CPAP) treatment.Methods: One-hundred and fi fty-four OSA patients were selected from the clinic of Sleep Institute of São Paulo city, Brazil. Patients were randomly allocated into 4 groups: G1 (OSA + HYP, n=64), G2 (OSA, n=50), G3 (HYP, n=16) and G4 (non-OSA controls, n= 24). Nine patients were treated with CPAP in one-year period. These patients underwent to 24-h urine (U), plasmatic (PL) and platelets (PT) catecholamines (adrenaline-ADR and noradrenalin-NOR) dosages (radioimmunoassay method). The descriptive analysis was based on the comparison between the four groups performed by ANCOVA with age, abdominal circumference and BMI as covariates. Spearman correlation test was used. We also tested whether the standardized cutoff values of the tests were associated with clinical diagnoses of HYP, moderate or severe OSA (with or without HYP) using ROC curves. Based on the new cutoff points found for each diagnostic category, binary logistic regressions were carried out to test these new measurements. To compare patients before and after treatment, Wilcoxon test was used.Results: Urinary, plasma and platelet catecholamines concentrations were higher in OSA+HYP, OSA and HYP groups compared with controls but presented high variability. Signifi cant correlation (r=0.64 p=0.02) was found between urinary (UAD) and platelet adrenaline (PTAD) and between urinary (UNA) and platelet noradrenaline (PTNA) (r = 0.60, p=0.01). A Logistic regression model, controlled for age and BMI, showed that UAD (OR=1.55[1.35-1.85]) and UNA (OR=1.00[1.00-1.04]) as risk factors for OSA+HYP group; Higher levels of UAD (OR=1.63[1.43-1.92]) and UNA (OR=1.00[1.03-1.07]) were risk factors for HYP and Higher levels of UNA (OR=1.00[1.01-1.04]). After 1-year CPAP treatment, a smaller sample (N=9) showed smaller levels of UNA (p=0.04) and PTNA (p=0.05).Conclusion: In conclusion, we found that urinary noradrenaline levels were able to detect the condition of hypertension with and without OSA, whereas platelet noradrenaline was superior in detecting OSA without comorbidity. This fi nding is consistent with our hypothesis that in OSA, nocturnal sympathetic activation may be reliably detected by a technique that increases catecholamines availability, such as platelet dosage. Despite being small (n) data showed a decrease in urinary norepinephrine and platelet noradrenaline after effective treatment with CPAP
B-182
Clinical Diagnostic and Prognostic Results for the ARCHITECT® STAT High Sensitive Immunoassay for Troponin-I
K. B. Grasso1, K. A. Galvani1, S. Du1, J. L. Rogers1, J. L. Yen1, J. Huang1, F. S. Apple2, W. J. Castellani3, M. T. Petruso4, D. Wiesner1, R. F. Workman1. 1Abbott Laboratories, Abbott Park, IL, 2Hennepin County Medical Center and Minneapolis Medical Research Foundation, Minneapolis, MN, 3Hershey Medical Center, Hershey, PA, 4Nationwide Laboratory Services, Fort Lauderdale, FL
Background: The ARCHITECT STAT High Sensitive Troponin-I assay* is a chemiluminescent microparticle immunoassay (CMIA) for the quantitative determination of cardiac troponin I (cTnI) in human plasma and serum. The cTnI values are used as an aid in the diagnosis of myocardial infarction (MI) and to aid in the assessment of 30-day and 90-day prognosis relative to all-cause mortality (ACM) and major adverse cardiac events (MACE) consisting of myocardial infarction, revascularization, and cardiac death in patients who present with symptoms suggestive of acute coronary syndrome (ACS). The purpose of the study was to evaluate within-laboratory imprecision, diagnostic and prognostic performance.Methods: Within-laboratory imprecision (%CV, fi ve day precision across three sites using three reagent lots) was assessed using 9 panel/control members with cTnI target concentrations ranging from 10 to 45,000 pg/mL (ng/L). The receiver operator characteristic area under the curve (AUC) was utilized to evaluate the combined clinical utility of sensitivity and specifi city for an intended use population (n=1,101 subjects, including 130 adjudicated MIs per universal MI guidelines; prevalence of MI 11.8%). Three serial collections (0-2, 2-4, and 4-9 hours post Emergency Department presentation) were made in serum separator, lithium heparin plasma separator, and K2 EDTA tubes and analyzed. The 99th percentile cutoffs previously determined and used in this study were: overall, 26.2 pg/mL; gender specifi c, 15.6 pg/mL (female), 34.2 pg/mL (male). The sensitivity, specifi city, positive predictive value (PPV), and negative predictive value (NPV) were calculated. The absolute percent change (|δ|) in cTnI concentration was evaluated at various cutpoints (20%-250%). Kaplan-Meier and Cox regression analyses were performed between the elevated cTnI and non-elevated cTnI groups (defi ned by 99th percentile) at 30-day and 90-day follow-up timepoints of MACE and ACM using overall and gender specifi c cutoffs.
Results: Imprecision (%CV) ranged from 2.7% (for the panel targeted to 45,000 pg/mL) to 5.6% (for the panel targeted to 10 pg/mL). The AUC results [95% confi dence interval] ranged from 0.9197 [0.8914, 0.9480] to 0.9503 [0.9149, 0.9857]. The sensitivity, specifi city, PPV and NPV with overall and gender specifi c 99th percentile cutoffs, respectively, ranged, for sensitivity: 84.44% to 94.95%, 81.05% to 93.94%; for specifi city: 80.72% to 86.35%, 79.98% to 85.85%; for PPV: 35.05% to 38.78%, 32.38% to 38.38%; for NPV: 98.08% to 99.25%, 97.53% to 99.24%. A |δ| cutoff of 250% with at least one timepoint greater than the 99th percentile resulted in a specifi city up to 98.83%. All log-rank p-values were signifi cant at 0.05 level for each tube type at each follow-up time point between elevated and non-elevated cTnI groups. The unadjusted hazard ratios (Cox regression) with overall and gender specifi c 99th percentile cutoffs, respectively, ranged, for 30 day: 2.95 to 3.54 and 3.28 to 3.53; for 90 day: 3.55 to 3.68 and 3.91 to 4.17; for the elevated relative to non-elevated cTnI group.Conclusion: The results demonstrate the ARCHITECT STAT High Sensitive Troponin-I assay offers precise results as a diagnostic tool for the detection of cTnI, and as an aid in the assessment of 30-day and 90-day prognosis.* under development in U.S.The study was funded by Abbott Laboratories.
B-183
Determination of a 99th Percentile for the ARCHITECT® STAT High Sensitive Troponin-I Immunoassay using a Robust Statistical Method
J. L. Rogers, S. Du, J. L. Yen, D. Wiesner, R. F. Workman, J. C. Badciong. Abbott Laboratories, Abbott Park, IL
Background: Clinical and Laboratory Standards Institute (CLSI) document C28-A3c focuses on three different statistical methods for calculating a reference interval. When the data are not normally distributed or cannot easily be made to be normally distributed, a nonparametric method or a robust method should be used. The guideline promotes the use of the nonparametric method due to its simple and straightforward calculations, while recommending the more complex robust method for situations where the larger sample size requirement of the nonparametric method cannot be met. Regardless of sample size, the robust method exhibits some desirable characteristics relative to the nonparametric method. As software capable of performing the robust method becomes more readily available to clinicians, the method could become more widely used.Methods: A reference range study was conducted based on guidance from CLSI document C28-A3c. Specimens were collected in 3 tube types (serum separator, lithium heparin separator, K2 EDTA) from 1,531 apparently healthy individuals in a US population with normal levels of BNP, HbA1c, and estimated GFR values. Each specimen was evaluated using the ARCHITECT STAT High Sensitive Troponin-I assay* on two ARCHITECT instrument systems (i 2000SR and i 1000SR). The 4,593 specimen results were used to establish the appropriate 99th percentiles and their respective 90% confi dence intervals (CI). The robust and nonparametric methods were used with Dixon and Tukey outlier methods being applied to the data. Partitioning analysis was performed to determine if separate 99th percentiles were necessary for subgroups.Results: The overall robust and nonparametric 99th percentiles for the ARCHITECT i 2000SR were 26.2 pg/mL (ng/L) (with 90% CI of 23.3 - 29.7) and 39.1 pg/mL (with 90% CI of 33.1 - 47.9), respectively. The overall robust and nonparametric 99th percentiles for the ARCHITECT i 1000SR were 26.3 pg/mL (with 90% CI of 23.0 - 29.2) and 37.0 pg/mL (with 90% CI of 32.1 - 44.5), respectively. The gender-specifi c robust and nonparametric 99th percentiles for the ARCHITECT i 2000SR were 34.2 pg/mL (with 90% CI of 28.9 - 39.2) and 54.4 pg/mL (with 90% CI of 44.1 - 69.7), respectively, for males and 15.6 pg/mL (with 90% CI of 13.8 - 17.5) and 26.0 pg/mL (with 90% CI of 21.0 - 32.8), respectively for females. Partitioning analysis was performed and concluded that it is not necessary to establish different 99th percentiles between the ARCHITECT i 2000SR and ARCHITECT i 1000SR systems, and it is not necessary to establish different 99th percentiles for the individual tube types (serum separator, lithium heparin separator, and K2 EDTA).Conclusion: The robust method is a valid method for determining reference intervals. Compared to the nonparametric method, it allows for smaller sample sizes, provides smaller confi dence intervals around reference values, and provides stable estimates of the reference values.*under development in U.S.

Wednesday, July 31, 9:30 am – 5:00 pm Cardiac Markers
A226 CLINICAL CHEMISTRY, Vol. 59, No. 10, Supplement, 2013
B-184
Prognostic Utility of Combination of High-Sensitivity Troponin T and N-Terminal Pro-B-Type Natriuretic Peptide in Patients with Unstable Angina and Non-ST-Segment Elevation Myocardial Infarction
F. Kitagawa, A. Kuno, J. Takeda, M. Saito, T. Hashimoto, S. Matsui, T. Ishikawa, H. Naruse, Y. Ozaki, J. Ishii. Fujita Health University, Toyoake, Japan
We prospectively evaluated the prognostic value of a combined use of high-sensitivity troponin T (hsTnT) and N-terminal pro-B-type natriuretic peptide (NT-proBNP) in patients with unstable angina and non-ST-segment elevation myocardial infarction (UA/NSTEMI). We measured serum concentrations of hsTnT, heart-type fatty-acid binding protein (H-FABP) and NT-proBNP in 248 patients admitted to our coronary care unit for UA/NSTEMI within 6 hours after the onset of chest symptom, and followed for 12months after admission. Result: There was a higher positive rate for hsTnT (>14 pg/mL) than that for H-FABP (≥6.2 ng/mL) in 69 NSTEMI patients (82.9% and 54.3%, P =0.0005). During a 12-month follow-up period, there were 20 (8.1%) cardiac events (4 cardiac deaths, 6 readmissions for acute coronary syndrome and 10 readmissions for worsening heart failure). In a stepwise Cox proportional hazard analysis including 15 clinical and biochemical variables, both hsTnT (relative risk per 10-fold increment = 1.98, P = 0.04) and NT-proBNP (4.00 per 10-fold increment, P = 0.001), but not H-FABP, were independently associated with cardiac events. HsTnT > median value of 13 pg/mL and/or NT-proBNP > median value of 192 pg/mL were associated with increased cardiac mortality and morbidity rates (Table). Conclusions: HsTnT may have a higher sensitivity than H-FABP for diagnosing NSEMI within 6 hours after the onset. The combination of hsTnT and NT-proBNP measurements may effectively stratify patients with UA/NSTEMI with 6 hours after the onset.
Cardiac mortality and morbidity rates according to hsTnT and/or NT-proBNPHsTnT >13pg/mLNT-proBNP >192pg/mL
-- n = 86
-+n = 42
+-n = 38
++n = 82
P value
Cardiac mortality rate (%) 0 0 0 4.9 0.02Cardiac event rate (%) 0 0 7.9 20.7 <0.00001
B-185
Coronary myostatin secretion in middle-aged hypertensive patients without left ventricular hypertrophy
T. Dschietzig1, I. Diaz2, K. Wintgens1, M. Hofmann2, F. Armbruster3. 1Immundiagnostik AG, Berlin, Germany, 2Charité Berlin, Department of Cardiology, Berlin, Germany, 3Immundiagnostik AG, Bensheim, Germany
Background: Apart from representing an established negative regulator of skeletal muscle mass myostatin is increasingly recognized as player in myocardial hypertrophy, heart failure, and cardiac cachexia. Experiments in rodents indicate that myocardial myostatin may counter-act left ventricular hypertrophy but clinical data are scarce.Methods: In this pilot study, we determined myostatin levels from aorta, coronary sinus, femoral artery, and femoral vein in 20 middle-aged patients (45-75 years) with hypertension and preserved ejection fraction undergoing catheter ablation for atrial fi brillation. These patients did not have left ventricular hypertrophy as assessed by computed tomography. Myostatin was measured by our competitive ELISA using rabbit polyclonal antiserum raised against full-length pro-myostatin and recognizing both the N-terminal and the C-terminal part of the peptide.Results: In the described patient cohort, there were signifi cantly higher coronary sinus than aortic levels of myostatin indicating net secretion of the peptide across the coronary vascular bed (median [IQR], 33.3 [24.9-43.2] versus 27.9 [14.1-37.50] ng/ml) (Friedman ANOVA on ranks). In contrast, no differences were found between arterial and venous femoral myostatin levels. Immunohistochemistry using the anti-myostatin serum revealed increased myocardial myostatin staining in left ventricular specimens from hypertensive patients as compared with samples from age-matched normotensive patients (n = 4 each).Conclusion: These fi ndings generate the hypothesis that in patients with preserved systolic function and hypertension, myocardial myostatin may contribute to anti-hypertrophic signaling cascades.
B-186
Should we use the same cut off value in women and men for cardiac troponins in diagnosing myocardial infarction?
S. I. Hansen1, J. Thode1, M. M. Schoos2, M. Schønemann-Lund3, K. Iversen3, P. Clemmensen2, R. Steffensen3. 1Department of Clinical Biochemistry,Nordsjællands Hospital-Hillerød,University Hospital Copenhagen, Hillerød, Denmark, 2Department of Cardiology, Rigshospitalet, University Hospital Copenhagen, Copenhagen, Denmark, 3Department of Cardiology, Nordsjællands Hospital-Hillerød,University Hospital Copenhagen, Hillerød, Denmark
Background: The cardiac troponins are used for the diagnosis of myocardial infarction (MI) with the same recommended cut off value for women and men, whereas for creatine kinase MB it is recommended to use sex dependent cut off values. Whether a sex dependent cut off value exists for the troponins is not clear.Methods: In 545 consecutive unselected chest pain patients (306 males and 239 females) with 59 (11%) AMI , we investigated the diagnostic accuracy for peak troponin I (CTNI, Dimension Vista, Siemens) and peak Troponin T (hsTNT, Elecsys, Roche) assays, using the same cut off values for women and men as recommended by the Danish Society of Cardiology ( CTNI 45 ng/L, hsTNT 50 ng /L).Results: The diagnostic accuracy of peak CTNI and peak hsTNT did not differ signifi cantly with respect to sex for the Area Under Curve (AUC) , Specifi city and PV Neg.
Assay Sex AUC Sens. Spec. PV Neg(95% CI) (95% CI) (95% CI) (95% CI)
CTNI F 0.96 0.96 0.85 1.00(0.93-1.00) (0.92-0.98) (0.80-0.89) (0.98-1.00)
CTNI M 0.95 0.92 0.83 0.99(0.92-0.98) (0.88-0.94) (0.78-0.86) (0.97-1.00)
hsTNT F 0.97 1.00 0.86 1.00(0.95-0.99) (0.98-1.00) (0.81-0.90) (0.98-1.00)
hsTNT M 0.94 0.92 0.83 0.99(0.90-0.98) (0,88-0,94) (0.78-0.87) (0.97-1.00)
Sensitivity for peak value showed a small sex dependence for hsTNT , but not for CTNI.Conclusion: For both high-sensitivity and contemporary sensitivity troponins, we confi rm the use of a common cut off value in women and men for the diagnosis of myocardial infarction.
B-188
Detection of Myocardial Ischemia by Measurement of high sensitivity Cardiac Troponin T (hscTnT)
X. Yi1, R. S. Foote2, R. P. Ward1, E. K. Leung1, T. Karrison1, K. T. J. Yeo1. 1The University of Chicago, Chicago, IL, 2Dartmouth Hitchcock Medical Center, Lebanon, NH
Background: In current clinical practice, detecting cardiac ischemia in the absence of myocardial infarction remains a diffi cult, time-and-resource-consuming dilemma. Thus the establishment of an ischemic biomarker would be a major clinical advance.Methods: Using the Roche hscTnT assay, we investigated if cTnT is detectable in the cohort of coronary artery disease (CAD) patients who showed reversible cardiac ischemia. As part of a prior study on biomarkers of ischemia, we have plasma samples (-80°C) from 75 CAD subjects who underwent symptom-limited maximal exercise stress tests with myocardial perfusion imaging. Samples were drawn immediately prior to, 1, 10, 30, and 60 minutes post exercise stress. In 41 subjects, ischemia was induced during the exercise stress. We also included 21 healthy volunteers. Roche hscTnT assay on Elecsys 2010 was used to determine cTnT concentrations and the result showed cTnT ranged from below limit of detection (LOD 3.00 pg/ml) to 38.65 pg/ml.Results: Comparison of volunteers vs nonischemic vs ischemic patients was statistically different among the 3 groups (p=0.0012, Kruskall-Wallis test). Pairwise comparisons (Dunn’s test) indicated signifi cantly higher concentration in ischemic group than in volunteer group (p<0.05), and nonischemic group (p<0.05). Such a difference was not observed between volunteer and nonischemic group. However, there were no statistically signifi cant changes in cTnT post-stress in all 3 groups. A majority (60%) of subjects with reversible ischemia showed detectable cTnT. Even though 40% had values below the LOD, this could be due to degradation of cTnT in samples stored over 8 years.

Cardiac Markers Wednesday, July 31, 9:30 am – 5:00 pm
CLINICAL CHEMISTRY, Vol. 59, No. 10, Supplement, 2013 A227
Conclusion: We conclude that hscTnT assay had increased sensitivity to detect small amounts of circulating cTnT in a substantial fraction of patients with exercise-induced cardiac ischemia. Further prospective studies using fresh patient samples are needed to determine whether hscTnT can be a useful diagnostic and/or prognostic biomarker for cardiac ischemia.
B-189
Novel Insights and Reference Intervals of Cardiac Troponin I in a Healthy Neonatal and Pediatric Population
S. R. Delaney1, J. A. Simpson2, M. Allwood2, A. H. Cohen3, D. A. Colantonio1, K. Adeli1. 1Hospital for Sick Children, Toronto, ON, Canada, 2University of Guelph, Guelph, ON, Canada, 3University of Toronto, Toronto, ON, Canada
Objectives: Cardiac Troponin I (cTnI) is routinely used to access cardiac injury, with the recommended use of a decision limit at the 99th percentile. As the sensitivity of cTnI assays increase, interpretation of marginally elevated levels becomes increasingly diffi cult. Establishing accurate baseline cTnI levels in a pediatric population is essential for appropriate clinical management. The aim of this study was to determine the 99th percentile using a healthy pediatric population, as well as to elucidate the forms of cTnI observed in the neonatal period. Methods: Blood samples, medical history and current health status measures were collected from 772 healthy and ethnically diverse children, ages birth to 18 years. cTnI was measured on the Abbott ARCHITECT i2000 system; the LoD was 10 ng/L. Non-parametric methods were used to establish the 99th percentile for the decision limit. Western blot analysis was performed to determine if high levels of cTnI observed in the neonatal period was intact cTnI, an interferant, a cross reaction against skeletal troponin, or cTnI complexes. Results: Three age partitions were determined and statistically verifi ed; no difference in cTnI concentration between sexes was observed (Figure 1). The 99th percentile decision limits are: 968 ng/L (birth - 15 days); 59 (15 days - 3 months); 21 ng/L (3 months - 19 years). Western blot analysis demonstrated that intact cTnI was present in neonatal samples; the presence of other forms of troponin were also determined. Conclusions: This study is the fi rst to demonstrate cTnI trends in a healthy neonatal and pediatric population. We observed that cTnI levels are signifi cantly higher from birth to < 15 days and gradually taper off to adult levels after 3 months of age. Biochemical explanations for high cTnI levels in the neonatal population were explored. These results have important clinical implications when assessing neonatal and pediatric patients with cardiac abnormalities.
B-190
Survey of cardiac troponin concentrations in a hospital and community environment
G. Koerbin, J. M. Potter, J. Kerrigan, E. Southcott, A. Simpson, P. E. Hickman. ACT Pathology, Canberra, Australia
INTRODUCTION: Troponin is a core element of the diagnosis of MI. However, high-sensitivity assays have shown that most normal persons have detectable troponin present in their blood, indicating that troponin is not always an index of myocardial necrosis. Data is available on troponin concentrations in healthy persons, but none on troponin concentration in persons who are ill with non-cardiac illnesses.MATERIALS AND METHIODS: In an ethics approved study for a 24h period we collected all blood samples submitted to ACT Pathology from The Canberra Hospital and community collection centres and measured TnI using the pre commercial Abbott ARCHITECT STAT hs-cTnI assay and hsTnT using the Roche Elecsys e411 instrumentation. Of the 1076 patient samples (552 female, 524 male) deemed appropriate for testing, 844 (431 female, 413 male) were analysed for TnI and TnT. Of those 844, 818 hsTnI and 805 hsTnT results were obtainedRESULTS: The range and median TnI concentrations were 0.6 - 2615 ng/L, 29.2 ng/L ( 31 CCU patients); 1.5 - 29500 ng/L, 17.9 ng/L (39 ICU patients); <0.5 - 25560 ng/L, 3.4 ng/L (97 ED patients) and <0.5 - 49 ng/L, 1.6 ng/L (299 Outpatient and Community). 81% of all persons tested, 67% of community and 100% of seriously ill intensive care patients had TnI concentrations above the LOD (1.0 ng/L). 51% of ICU, 58% of CCU, 27% of ED and 37% of medical patients had TnI concentrations above the hsTnI 99th percentile URL for a healthy population, 13.6 ng/L [Koerbin CCLM 2012], but only 4% of community and outpatients had concentrations above this level.Similar results were seen with hsTnT. The range and median TnI concentrations were <3 - 746 ng/L, 32.4 ng/L ( 31 CCU patients); <3 - 4580 ng/L, 20 ng/L (39 ICU patients); <3 - 10000 ng/L, 7.5 ng/L (95 ED patients) and <3 - 65 ng/L, 3.1 ng/L (294 Outpatient and Community). 70% of all persons tested, 52% of community and 95% of ICU patients had TnT concentrations above the LOD (3 ng/L). 8% of community patients had TnT concentrations > 99th percentile URL, 13.5 ng/L, [Giannitsis Clin Chem 2010].DISCUSSION: These data indicate that troponin raised to a concentration above that corresponding to the 99th percentile of a healthy population is common in persons with non-cardiac illness, though certainly some of these may have unsuspected cardiac disease as well. Careful clinical assessment of patients is now essential for the interpretation of troponin concentrations.
B-191
Development of Highly Sensitive and Specifi c Monoclonal Antibodies for the Detection of Heart-Type Fatty Acid Binding Protein and Cardiac Troponin I
P. Ratcliffe, S. Savage, P. Lowry, P. McClintock, R. I. McConnell, S. P. Fitzgerald. Randox Laboratories Limited, Crumlin, United Kingdom
Introduction: Heart-type fatty acid binding protein (H-FABP) is a low molecular weight protein (15kDa), which is expressed in cardiac myocytes. Due to the low

Wednesday, July 31, 9:30 am – 5:00 pm Cardiac Markers
A228 CLINICAL CHEMISTRY, Vol. 59, No. 10, Supplement, 2013
molecular weight and cytoplasmic location, H-FABP is released quickly into the circulation after myocardial injury. This protein is an early indicator of acute myocardial infarction in man. Cardiac Troponin I (cTnI), a late onset biomarker, is the current gold standard marker for myocardial infarction. It is released from cardiac myocytes during necrosis, causing an increase in circulating levels from 5-6 hours after the event. During release of cTnI from the sarcomere into the bloodstream, the protein undergoes proteolytic digestion; therefore antibodies developed to determine the circulating concentration of cTnI must bind to certain key epitopes. It has been reported that the assessment of H-FABP in combination with cTnI is a reliable diagnostic tool for the early diagnosis of myocardial infarction/acute coronary syndrome and also a valuable rule-out test for patients presenting at 3 to 6 hours after chest pain onset.Relevance: The aim of this study was to develop highly sensitive and specifi c monoclonal antibodies for H-FABP and relevant cTnI epitopes respectively. This is of value for the development of immunoassays applicable to the study of these cardiac biomarkers in clinical settings.Methodology: Sheep were immunized with the appropriate immunogen, either 1) recombinant HFABP produced in E.Coli, or 2) native cTnI. Lymphocytes were collected and fused with heteromyeloma cells. Supernatants from the resulting anti-HFABP hybridomas were screened for the presence of H-FABP specifi c antibodies using the other eight members of the FABP family in negative selection ELISA based assays. Supernatants from the resulting anti-cTnI hybridomas were screened for the presence of cTnI specifi c antibody using whole molecule, native cTnI. Positive hybridomas were cloned to produce stable monoclonal hybridomas. Antibody was extracted from supernatants via Protein A purifi cation. In addition, epitope mapping was carried out for all cTnI purifi ed antibodies using non-overlapping 20-mer fragments of the cTnI primary amino acid sequence to elucidate the region accessed by each clone.Results: From the monoclonal antibodies developed for the detection of H-FABP, a sandwich pair has been identifi ed which was H-FABP specifi c presenting cross reactivity <1% for the other FABP types. The sensitivity value obtained in this application was <1.37ng/ml. For cTnI, cell lines were developed which produced antibodies showing specifi city for 5 separate epitopes of cTnI (1-20, 21-39, 80-89,170-189 and 190-208). From the monoclonal antibodies developed for the detection of cTnI, a sandwich pair has been identifi ed which was used to create a sandwich assay achieving sensitivity <0.004ng/ml.Conclusion: The results indicate that the developed monoclonal antibodies to H-FABP and cTnI are highly sensitive and specifi c for these proteins. They are suitable for the development of effi cient immunoassays for the detection of these cardiac biomarkers and application in clinical settings.
B-192
Investigation of immunochemical and biochemical properties of circulating IGFBP-4 fragments - novel biomarkers for cardiac risk assessment
A. A. Konev1, A. B. Postnikov1, T. I. Smolyanova1, N. N. Tamm1, A. V. Kharitonov1, D. V. Serebryanaya1, S. V. Kozlovsky2, A. N. Kara2, A. G. Katrukha1. 1HyTest Ltd, Turku, Finland, 2School of Biology, Moscow State University, Moscow, Russian Federation
Background: Recent fi ndings show that N- and C-terminal fragments of IGF-binding protein-4 (NT- and CT-IGFBP-4) can be utilized as biomarkers for the prediction of major adverse cardiac events in patients with suspected acute coronary syndrome (ACS). It was suggested that increased NT- and CT-IGFBP-4 level in patients’ blood is associated with increased expression and proteolytic activity of the dimeric form of the Pregnancy Associated Plasma Protein A (dPAPP-A). dPAPP-A is overexpressed in vulnerable atherosclerotic plaques and is considered to be responsible for the plaque destabilization. Previously we have reported the method of IGFBP-4 fragments measurements. However, immunochemical and biochemical properties of circulating NT- and CT-IGFBP-4 have not been investigated yet.Methods: Monoclonal antibodies (MAb) IBP180 and MAb IBP185 (HyTest, Finland) specifi c to core region of NT- and CT-IGFBP-4, respectively, were used for affi nity purifi cation of endogenous fragments from pooled plasma collected from ACS patients. For NT- and CT-IGFBP-4 quantifi cation two immunoassays described by Postnikov et al. (2012) were utilized. Each assay has one antibody that is fragment-specifi c and recognizes neo-epitope formed after IGFBP-4 cleavage by dPAPP-A. Such antibody has no cross-reaction with full-length IGFBP-4 and recognizes only corresponding fragment. Assays were calibrated using recombinant
NT- and CT-IGFBP-4 expressed in HEK293 cells (HyTest, Finland). Size-exclusion chromatography on Superdex 75 column was used for characterization of IGFBP-4 fragments in patients’ plasma.Results: Endogenous IGFBP-4 fragments were purifi ed from patients’ plasma at the quantities corresponding to 80 - 100% of initial immunochemical activity. In SDS-PAGE studies it was shown that purifi ed NT- and CT-IGFBP-4 had apparent molecular masses equal to molecular masses of corresponding recombinant proteins. Identity of IGFBP-4 fragments purifi ed from human plasma and recombinant proteins was confi rmed by Western blotting studies with several fragment-specifi c MAbs as well as by mass spectrometry analysis. Analysis of purifi ed fragments by specifi c MAbs showed that the most part of both endogenous NT- and CT-IGFBP-4 molecules contained intact, non-truncated neo-epitopes. Thus, the assays utilizing antibodies specifi c to the neo-epitopes could be used for the NT- and CT-IGFBP-4 quantifi cation in patients’ blood. Size-exclusion chromatography analysis of individual plasma samples of ACS patients revealed the single peak of CT-IGFBP-4 immunochemical activity with the apparent molecular mass very close to that of corresponding recombinant fragment (19.5 and 20.2 kDa, respectively). For NT-IGFBP-4 several peaks of immunochemical activity were identifi ed. The main peak (23.6 - 26.3 kDa, 70 - 80% of immunochemical activity) corresponded to the position of recombinant NT-IGFBP-4 (23.6 kDa). Several additional minor peaks (11, 57, and >300 kDa) of NT-IGFBP-4 immunochemical activity were also identifi ed. Immunochemical activity in these peaks varied signifi cantly (up to 30%) in individual samples. The presence of these NT-IGFBP-4 forms could refl ect degradation as well as formation of higher molecular weight complexes with other proteins in human plasma.Conclusions: Here we for the fi rst time describe endogenous NT-IGFBP-4 and CT-IGFBP-4 from ACS patients’ plasma. Both proteins display the biochemical and immunochemical features similar to the proteins expressed in mammalian cell lines.
B-193
Development of a Highly Sensitive Immunoassay for Cardiac Troponin I for the ARCHITECT® i2000SR and i1000SR Analyzers and Performance in Three Different Tube Types
C. A. Lipowsky, J. Badciong, R. Workman, M. Rosales, S. St. John, J. Brady, S. Dembowski, B. Sanchez, D. Wiesner, A. Wynn, P. Lai, S. Du, J. Rogers, R. El Kouhen. Abbott Laboratories, Abbott Park, IL
Background:Troponin I is a 24 Kd modulatory protein measured in the blood as an indication of cardiac or microvascular damage. The ARCHITECT STAT High Sensitive Troponin-I (hsTnI) assay is a two-step, double-monoclonal CMIA immunoassay in development that can detect the presence of cTnI in human serum and plasma. Signifi cant differences between serum and plasma troponin I concentrations have been observed in some analytical systems due to heparin binding to some cardiac troponin proteins and separation of calcium-dependent ITC and IT complexes due to calcium chelation from EDTA plasma. Therefore, these anti-coagulants were evaluated as well as serum to ensure the ARCHITECT STAT hsTnI assay performs the same with each sample type.Objective: In the development phase, factory performance of a number of key performance measurements in 3 different sample types (serum, lithium heparin plasma, and K2 EDTA plasma) was confi rmed and a 99th percentile cutoff was established from a healthy population.Methods:The sample types used for all studies were serum, lithium heparin, and K2 EDTA. Within-laboratory precision, limit of blank (LoB), limit of detection (LoD) and limit of quantitation (LoQ), linearity, cross-reactivity (analytical specifi city) and interference from potentially interfering drugs, endogenous substances (protein testing by concentration of protein in a sample, spiking purifi ed gamma globulin, and by spiking human serum albumin), HAMA and RF were determined following recommendations from CLSI documents EP5-A2, EP17-A, EP6-A, and EP7-A2. A 99th percentile cutoff was established from a healthy population (n = 1,531). The AUC value for the diagnosis of myocardial infarction was determined using specimens from a minimum of 71 acute myocardial infarction (AMI) and 780 non-AMI patients serially collected at 3 time points.Results:Within-laboratory precision %CVs ranged from 1.6 to 8.0, the LoQ ranged from 4.0 to 10.0 pg/mL and the LoD ranged from 0.5 to 1.9 pg/mL. The calculated 10 %CV is at 4.7 pg/mL. The range of linearity was <10.0 to >50,000 pg/mL. Cross-reactivity with skeletal troponin I was <0.1% and was <1% with both troponin C and troponin T. Over 50 potentially interfering drugs have shown less than 10% interference. Interference from total protein was variable from the methods used. Overall 99th percentile cutoff was 26.2 pg/mL across the 3 tube types used. The 99th percentile for males was 34.2 pg/mL and 15.6 pg/mL for females. The AUC values
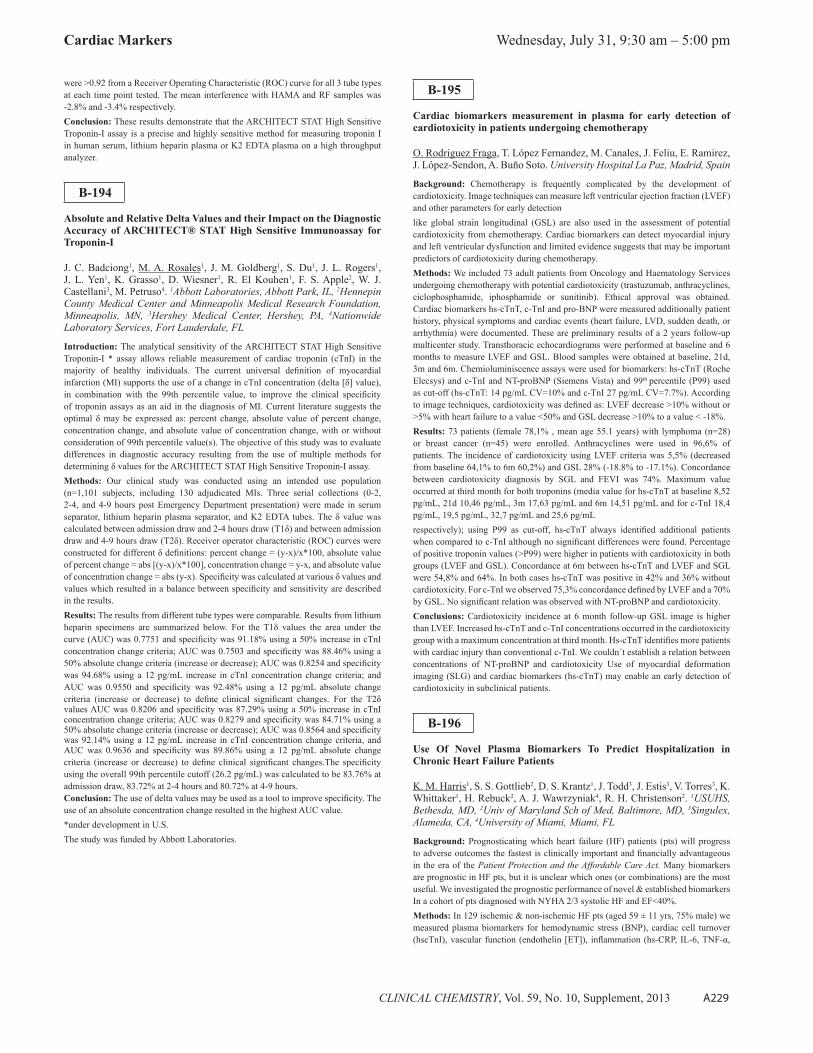
Cardiac Markers Wednesday, July 31, 9:30 am – 5:00 pm
CLINICAL CHEMISTRY, Vol. 59, No. 10, Supplement, 2013 A229
were >0.92 from a Receiver Operating Characteristic (ROC) curve for all 3 tube types at each time point tested. The mean interference with HAMA and RF samples was -2.8% and -3.4% respectively.Conclusion: These results demonstrate that the ARCHITECT STAT High Sensitive Troponin-I assay is a precise and highly sensitive method for measuring troponin I in human serum, lithium heparin plasma or K2 EDTA plasma on a high throughput analyzer.
B-194
Absolute and Relative Delta Values and their Impact on the Diagnostic Accuracy of ARCHITECT® STAT High Sensitive Immunoassay for Troponin-I
J. C. Badciong1, M. A. Rosales1, J. M. Goldberg1, S. Du1, J. L. Rogers1, J. L. Yen1, K. Grasso1, D. Wiesner1, R. El Kouhen1, F. S. Apple2, W. J. Castellani3, M. Petruso4. 1Abbott Laboratories, Abbott Park, IL, 2Hennepin County Medical Center and Minneapolis Medical Research Foundation, Minneapolis, MN, 3Hershey Medical Center, Hershey, PA, 4Nationwide Laboratory Services, Fort Lauderdale, FL
Introduction: The analytical sensitivity of the ARCHITECT STAT High Sensitive Troponin-I * assay allows reliable measurement of cardiac troponin (cTnI) in the majority of healthy individuals. The current universal defi nition of myocardial infarction (MI) supports the use of a change in cTnI concentration (delta [δ] value), in combination with the 99th percentile value, to improve the clinical specifi city of troponin assays as an aid in the diagnosis of MI. Current literature suggests the optimal δ may be expressed as: percent change, absolute value of percent change, concentration change, and absolute value of concentration change, with or without consideration of 99th percentile value(s). The objective of this study was to evaluate differences in diagnostic accuracy resulting from the use of multiple methods for determining δ values for the ARCHITECT STAT High Sensitive Troponin-I assay.Methods: Our clinical study was conducted using an intended use population (n=1,101 subjects, including 130 adjudicated MIs. Three serial collections (0-2, 2-4, and 4-9 hours post Emergency Department presentation) were made in serum separator, lithium heparin plasma separator, and K2 EDTA tubes. The δ value was calculated between admission draw and 2-4 hours draw (T1δ) and between admission draw and 4-9 hours draw (T2δ). Receiver operator characteristic (ROC) curves were constructed for different δ defi nitions: percent change = (y-x)/x*100, absolute value of percent change = abs [(y-x)/x*100], concentration change = y-x, and absolute value of concentration change = abs (y-x). Specifi city was calculated at various δ values and values which resulted in a balance between specifi city and sensitivity are described in the results.Results: The results from different tube types were comparable. Results from lithium heparin specimens are summarized below. For the T1δ values the area under the curve (AUC) was 0.7751 and specifi city was 91.18% using a 50% increase in cTnI concentration change criteria; AUC was 0.7503 and specifi city was 88.46% using a 50% absolute change criteria (increase or decrease); AUC was 0.8254 and specifi city was 94.68% using a 12 pg/mL increase in cTnI concentration change criteria; and AUC was 0.9550 and specifi city was 92.48% using a 12 pg/mL absolute change criteria (increase or decrease) to defi ne clinical signifi cant changes. For the T2δ values AUC was 0.8206 and specifi city was 87.29% using a 50% increase in cTnI concentration change criteria; AUC was 0.8279 and specifi city was 84.71% using a 50% absolute change criteria (increase or decrease); AUC was 0.8564 and specifi city was 92.14% using a 12 pg/mL increase in cTnI concentration change criteria, and AUC was 0.9636 and specifi city was 89.86% using a 12 pg/mL absolute change criteria (increase or decrease) to defi ne clinical signifi cant changes.The specifi city using the overall 99th percentile cutoff (26.2 pg/mL) was calculated to be 83.76% at admission draw, 83.72% at 2-4 hours and 80.72% at 4-9 hours.Conclusion: The use of delta values may be used as a tool to improve specifi city. The use of an absolute concentration change resulted in the highest AUC value.*under development in U.S.The study was funded by Abbott Laboratories.
B-195
Cardiac biomarkers measurement in plasma for early detection of cardiotoxicity in patients undergoing chemotherapy
O. Rodriguez Fraga, T. López Fernandez, M. Canales, J. Feliu, E. Ramirez, J. López-Sendon, A. Buño Soto. University Hospital La Paz, Madrid, Spain
Background: Chemotherapy is frequently complicated by the development of cardiotoxicity. Image techniques can measure left ventricular ejection fraction (LVEF) and other parameters for early detectionlike global strain longitudinal (GSL) are also used in the assessment of potential cardiotoxicity from chemotherapy. Cardiac biomarkers can detect myocardial injury and left ventricular dysfunction and limited evidence suggests that may be important predictors of cardiotoxicity during chemotherapy.Methods: We included 73 adult patients from Oncology and Haematology Services undergoing chemotherapy with potential cardiotoxicity (trastuzumab, anthracyclines, ciclophosphamide, iphosphamide or sunitinib). Ethical approval was obtained. Cardiac biomarkers hs-cTnT, c-TnI and pro-BNP were measured additionally patient history, physical symptoms and cardiac events (heart failure, LVD, sudden death, or arrhythmia) were documented. These are preliminary results of a 2 years follow-up multicenter study. Transthoracic echocardiograms were performed at baseline and 6 months to measure LVEF and GSL. Blood samples were obtained at baseline, 21d, 3m and 6m. Chemioluminiscence assays were used for biomarkers: hs-cTnT (Roche Elecsys) and c-TnI and NT-proBNP (Siemens Vista) and 99th percentile (P99) used as cut-off (hs-cTnT: 14 pg/mL CV=10% and c-TnI 27 pg/mL CV=7.7%). According to image techniques, cardiotoxicity was defi ned as: LVEF decrease >10% without or >5% with heart failure to a value <50% and GSL decrease >10% to a value < -18%.Results: 73 patients (female 78,1% , mean age 55.1 years) with lymphoma (n=28) or breast cancer (n=45) were enrolled. Anthracyclines were used in 96,6% of patients. The incidence of cardiotoxicity using LVEF criteria was 5,5% (decreased from baseline 64,1% to 6m 60,2%) and GSL 28% (-18.8% to -17.1%). Concordance between cardiotoxicity diagnosis by SGL and FEVI was 74%. Maximum value occurred at third month for both troponins (media value for hs-cTnT at baseline 8,52 pg/mL, 21d 10,46 pg/mL, 3m 17,63 pg/mL and 6m 14,51 pg/mL and for c-TnI 18,4 pg/mL, 19,5 pg/mL, 32,7 pg/mL and 25,6 pg/mLrespectively); using P99 as cut-off, hs-cTnT always identifi ed additional patients when compared to c-TnI although no signifi cant differences were found. Percentage of positive troponin values (>P99) were higher in patients with cardiotoxicity in both groups (LVEF and GSL). Concordance at 6m between hs-cTnT and LVEF and SGL were 54,8% and 64%. In both cases hs-cTnT was positive in 42% and 36% without cardiotoxicity. For c-TnI we observed 75,3% concordance defi ned by LVEF and a 70% by GSL. No signifi cant relation was observed with NT-proBNP and cardiotoxicity.Conclusions: Cardiotoxicity incidence at 6 month follow-up GSL image is higher than LVEF. Increased hs-cTnT and c-TnI concentrations occurred in the cardiotoxicity group with a maximum concentration at third month. Hs-cTnT identifi es more patients with cardiac injury than conventional c-TnI. We couldn´t establish a relation between concentrations of NT-proBNP and cardiotoxicity Use of myocardial deformation imaging (SLG) and cardiac biomarkers (hs-cTnT) may enable an early detection of cardiotoxicity in subclinical patients.
B-196
Use Of Novel Plasma Biomarkers To Predict Hospitalization in Chronic Heart Failure Patients
K. M. Harris1, S. S. Gottlieb2, D. S. Krantz1, J. Todd3, J. Estis3, V. Torres3, K. Whittaker1, H. Rebuck2, A. J. Wawrzyniak4, R. H. Christenson2. 1USUHS, Bethesda, MD, 2Univ of Maryland Sch of Med, Baltimore, MD, 3Singulex, Alameda, CA, 4University of Miami, Miami, FL
Background: Prognosticating which heart failure (HF) patients (pts) will progress to adverse outcomes the fastest is clinically important and fi nancially advantageous in the era of the Patient Protection and the Affordable Care Act. Many biomarkers are prognostic in HF pts, but it is unclear which ones (or combinations) are the most useful. We investigated the prognostic performance of novel & established biomarkers In a cohort of pts diagnosed with NYHA 2/3 systolic HF and EF<40%.Methods: In 129 ischemic & non-ischemic HF pts (aged 59 ± 11 yrs, 75% male) we measured plasma biomarkers for hemodynamic stress (BNP), cardiac cell turnover (hscTnI), vascular function (endothelin [ET]), infl ammation (hs-CRP, IL-6, TNF-α,

Wednesday, July 31, 9:30 am – 5:00 pm Cardiac Markers
A230 CLINICAL CHEMISTRY, Vol. 59, No. 10, Supplement, 2013
IL-17A, IL-1B, IL-10, MMP9) and VEGF. BNP and hs-CRP where measured with the Alere and Siemens Vista assays, respectively. The other biomarkers utilized the high sensitivity Erenna System (Singulex).Results: Over 2.4±1.0 yrs follow-up, 66 pts (51%) died or were hospitalized for any cause and 33 (26%) were hospitalized for HF. Using ROC area and OR calculations (by median), ET, hs-cTnI, BNP, TNF-α and VEGF predicted HF hospitalization (table); after adjusting for age, sex and other statistically signifi cant biomarkers, ET, hsTnI and TNF-α remained signifi cant (table *OR). Separate analysis showed that ET, BNP and TNF-α all predicted all cause hospitalization/death (ROC areas 0.63, 0.62, 0.61, respectively [all p<0.05]). Elevated hs-CRP was not associated with either endpoint.Conclusion: Elevations in biomarkers of hemodynamic & cardiac stress, infl ammation, & vascular function were associated with deteriorating clinical status in HF pts, but the traditional indicator of systemic infl ammation (hs-CRP) and several cytokines were not. ET and hscTnI were the strongest predictors, even after adjustment for other variables. These fi ndings suggest that both physiologic stress & vascular dysfunction are potent mechanisms associated with prognosis in HF pts.
B-198
Lipoprotein Associated Phospholipase A2 (LpPLA2) as a better marker than highly sensitive C Reactive protein (hs-CRP) and Lipoprotein(a) in Indians with Coronary Artery Disease
S. Das1, G. MP2, P. Ray1, S. Gupta1. 1Maulana Azad Medical College, New Delhi, India, 2G B Pant Hospital, New Delhi, India
Background: Lipoprotein-associated phospholipase A2 (Lp-PLA2) enzyme, mainly associated with LDL, hydrolyzes its phospholipids producing proinfl ammatory compounds like lysophosphatidylcholine and oxidized non-esterifi ed fatty acids. Accumulating evidence suggests Lp-PLA2 to be very good marker of coronary artery disease (CAD) and predictor of an acute event. However its role has not been documented clearly in Indians. The aim of this study was to explore the association of LpPLA2 with CAD and compare it with other established markers like hs-CRP and Lipoprotein (a) [Lp(a)] in Indians.Methods: 100 adult patients, above 19 years of age ,with angiographically proven CAD of which 50 patients were of stable angina(Group I), 50 patients with acute coronary syndrome [Group II - 35 patients with unstable angina +15 patients with acute MI] and 50 age and sex matched healthy controls were studied in a tertiary health care center, New Delhi, India, over a period of 1 year. The serum levels of LpPLA2, hs-CRP and Lipoprotein(a) were measured by ELISA and routine lipid profi le was measured by automated analyzer. Angiographic clinical vessel scoring was also done for all the patients. Data is presented as Mean±S.D. and relationships were determined by Pearson correlations and Receiver Operating Characteristic Curve (ROC) analysis.Results: The mean age of the patients was 49±8.8 years (84% men, 16%women). The mean serum LpPLA2 levels [274.30±33.16 ng/ml] for stable angina (Group I), and acute coronary syndrome (Group II) [287.39±35.61 ng/ml] were signifi cantly higher than in controls [196.64±21.4 ng/ml] [p<0.001]. Within Group -II, LpPLA2 levels were signifi cantly higher in acute MI patients than in unstable angina patients. High LpPLA2 values correlated with higher angiographic clinical vessel scores indicating a more severe CAD both in stable angina patients[r=0.384, p<0.001] and unstable angina patients[r=0.459, p<0.001]. LpPLA2 [AUC=0.995] was found to be better marker than LDL-C [AUC=0.780], total cholesterol [AUC=0.759], hs-CRP [AUC=0.970], Lp(a) [AUC=0.969] by ROC analysis.Conclusion: Lipoprotein associated phospholipase A2 is a better marker of CAD than LDL-C, hs-CRP and Lp(a). Our results also suggest that LpPLA2 is an emerging marker of Coronary Artery Disease and its severity.
B-200
Quantitatively Assessing Fibrin Interference with Troponin I Measurement
K. Sobhani, M. Miller, O. Tchiernianchouk, S. Torbati. Cedars-Sinai Medical Center, Los Angeles, CA
Background: It has been repeatedly hypothesized in literature that fi brin can potentially interfere with troponin measurement by causing false positives. However, this potential has not previously been quantitatively assessed. We set out to quantitatively determine whether fi brin has a measurable potential to interfere with a sensitive and commonly used cardiac troponin I (TnI) assay.Methods: Quantitative fi brin-monomer (FM) reagents (research use only, U.S.) were obtained from Diagnostica STAGO in order to measure actual concentrations of fi brin in samples where TnI was also measured. TnI was measured using the Siemens TnI-Ultra assay run on a Centaur XP. Potential fi brin interference was assessed in two ways: 1) In order to induce moderate FM formation, human thrombin (1.5 NIH unit/mL) was added in a 1:1 ratio to two separate heparinized plasma patient pools with the following TnI concentrations: Pool A ≤ 0.01 ng/mL, and Pool B = 0.03 ng/mL. TnI and FM were then measured 3x at 10, 30, 60, and 120min post thrombin addition. 2) Heparinized plasma samples (n=53) with natural elevations in TnI (≥ 0.04 ng/mL) were also assessed for preexisting FM content and the results were stratifi ed based on FM > 6.0 mcrg/mL (general population: FM<6.0 mcrg/mL). The STAGO FM assay had only been validated on citrated plasma, so a correlation of citrated to heparinized plasma was performed with 30 specimens to account for bias.Results: Over 24 TnI measurements (12 measurements/Pool) conducted over four timepoints spanning 2 hrs there were no statistically increased TnI measurements observed post thrombin addition (t-statistic=0.59). The average FM concentrations 23.2 mcrg/mL in both pools. As for when TnI was clinically elevated (≥0.04 ng/mL), FM was >6.0 mcrg/mL 49% of the time (n=53). In correlating FM in heparinized vs. citrated plasma, the following equation was obtained: HEP-PLASMA = CIT-PLASMA(0.93)-0.26, r2=0.95.Conclusion: Bias between heparinized vs. citrated plasma was demonstrated to be negligible, as both specimen types were highly correlated and therefore essentially interchangeable. Moderate induced fi brin formation was not observed by itself to interfere with troponin measurement as there was no TnI elevation measured in an originally negative pool over 24 separate measurements at two concentrations of TnI (≤0.01 ng/mL and 0.03 ng/mL) in a 2hr period. However, in clinically elevated TnI samples fi brin is often correspondingly elevated (as is anticipated) because in true MI, artery/vein rupture followed by coagulation and other infl ammatory processes is certainly taking place. Upcoming experiments include continuing to induce FM formation in weakly positive TnI sample pools followed by extending the timeframe and number of measurements made in order to increase the robustness of statistical observations.
B-201
Analytical Evaluation of the Abbott Diagnostics Architect i2000SR Galectin-3
Routine and Short Turn-Around-Time Assays.D. C. Gaze, P. O. Collinson. St George’s Healthcare NHS Trust, London, United
Kingdom, BACKGROUND: Galectin-3 (30kDa, LGALS3, Chr 14,q21-a22) is a beta-galactoside-binding lectin secreted from macrophages. Galectin-3 is involved in infl ammation. Elevated Galectin-3 is associated with infl ammation; biding to and activating fi broblasts forming collagen and scaring. Tissue fi brosis is the fi nal common pathway central to the progression of chronic heart failure (CHF). We evaluated the analytical performance of the two-step routine and Short Turn-Around-Time (STAT) Galectin-3 immunoassays on the Architect i2000SR (Abbott Diagnostics). METHODS: The assay precision, limits of blank (LoB), detection (LoD), quantifi cation (LoQ) and linearity were derived for both routine and STAT assays. Serum samples with concentrations of Galectin-3 across the measuring range were compared between the routine and STAT assay and a Galectin-3 ELISA (BG Medicine Inc.), LoB= 0.86ng/mL; LoD= 1.13ng/mL; LoQ= 1.32ng/mL, total %CV 4.2-12.0% at 6.1-72.2ng/mL; range 1.32-96.6ng/mL. The reference interval was investigated using 120 serum samples from apparently healthy individuals (60 male, 60 female) with no evidence of cardiac disease. RESULTS: The between day coeffi cient of variation (CV%) was 2.26-5.46% in the range 9.89-74.54ng/mL and 1.88-5.35% in the range 9.81-74.52ng/mL for the routine and STAT assays respectively. The LoB, LoD and LoQ were 0.26, 0.67, 4.2ng/mL and 0.04, 0.45, 4.3ng/mL for the routine and STAT assays respectively. Both assays were linear up to 105ng/mL. There was excellent correlation between the routine and stat assays (n=225, bias -0.62, 95%CI -4.51-3.27ng/mL) in

Cardiac Markers Wednesday, July 31, 9:30 am – 5:00 pm
CLINICAL CHEMISTRY, Vol. 59, No. 10, Supplement, 2013 A231
the range 6.9-107ng/mL. Both the routine (n=225, bias -1.93, 95%CI -2.28 to -1.57ng/mL) and STAT (n=225 bias -2.552, 95%CI -2.959 to -2.145ng/mL) assays correlated well with the Galectin-3 ELISA. 120 samples were obtained from apparently healthy individuals. The median age was 42 years, (interquartile range 18-69) years and no difference in age between gender groups (p=0.6163). The upper 97.5th percentile was 34.42ng/mL and 33.46ng/mL for the routine and STAT assays respectively. The 97.5th percentile increased There was no signifi cant difference in concentrations between males and females for either the routine (p=0.772) or STAT (p=0.835) assay. CONCLUSIONS: Both the Galectin-3 Routine and STAT assays determined on the Abbott Architect i2000SR demonstrate excellent analytical performance for the determination of Galectin-3. Further clinical studies are required to demonstrate the prognostic potential of this novel marker in patients with accelerated fi brotic CHF.
B-202
The performance characteristics of the new high sensitivity Abbott cardiac troponin I assay.
P. O. Collinson1, D. Gaze1, G. Wilson2. 1St George’s Hospital, London, United Kingdom, 2St Mary’s Hospital, London, United Kingdom
Objectives. To determine the imprecision profi le, 99th percentile and diagnostic effi ciency of a new high sensitivity cardiac troponin I (cTnI) assay.Methods: Total imprecision was assessed by following CLSI protocol EP15-A.14 serum pools prepared from sera of known high cardiac troponin concentrations were adjusted by dilution with serum considered to be troponin free. Determination of the 99th-percentile reference value examined a fully characterized population that had undergone non-invasive cardiac imaging. Subjects >45 years old were randomly selected from seven representative local community practices. Details were collected by questionnaires plus blood pressure measurement, spirometry, electrocardiography (ECG) and echocardiography. They were venesected for fasting serum glucose, and creatinine. Diagnostic accuracy utilised samples from the point of care arm of the RATPAC trial (Randomised Assessment of Treatment using Panel Assay of Cardiac markers), set in the emergency departments of six hospitals. Prospective admissions with chest pain and a non-diagnostic electrocardiogram were randomised to point of care assessment or conventional management. Blood samples were taken on admission and 90 minutes from admission. An additional blood sample was taken at admission and 90 minutes from admission, separated and the serum stored frozen until subsequent analysis. Samples were analysed for cTnI by 4 methods, the Architect hsTnI (A) (Abbott Diagnostics), range 1.1-50,000 ng/L 10% CV 4.7ng/L; the Stratus CS (CS) (Siemens Healthcare Diagnostics), range 30-50,000 ng/L 10% CV 60ng/L; the Beckman AccuTnI enhanced (B) (Access 2 , Beckman-Coulter) range 1 - 100,000 ng/L, 10% CV 30 ng/L, the Siemens Ultra (S) (ADVIA Centaur, Siemens Healthcare Diagnostics), range.6 - 50,000 ng/L, 10% CV 30 ng/L. and cardiac troponin T (cTnT) by the Roche high sensitivity cardiac troponin T assay hs-cTnT (Elecsys 2010, Roche diagnostics), range 3 - 10,000ng/L, 10% CV 13ng/L. Diagnosis was based on the universal defi nition of myocardial infarction utilising laboratory measurements of cardiac troponin performed at the participating sites together with measurements performed in a core laboratory. Diagnostic accuracy was compared by construction of receiver operator characteristic curves against the universal defi nition of myocardial infarction (MI) utilising laboratory measurements of cardiac troponin performed at the participating sites and measurements performed in a core laboratory.Results: Total imprecision was from 4% (1262 ng/L) to 12.1% (4.4 ng/L) with within run imprecision <3% and repeatability 3.5-8.5% across the range. The 10% CV was 7 ng/L and 20% CV was 1 ng/L. 601/1132 samples were available for the reference interval study (296 male). Troponin was measureable in 100% of the samples. Troponin values were infl uenced by gender but not by age. The 99th percentile was 14.8 ng/L (18.1 males, 8.6 females). Progressive fi ltering of the population reduced the 99th percentile to 7.1 ng/L (questionnaire) and 5.5 ng/L (imaging) but the numbers became too small for more detailed analysis. 342 patient samples were available for diagnostic accuracy comparison. For the diagnosis of MI on admission the area under the curve was 0.92, statistically indistinguishable from the other four assays studied (0.90-0.94).Conclusion: The analytical performance of the new assay meets the criteria for a high sensitivity troponin assay.
B-203
Analyzers for point of care testing of troponin I: direct comparison of the AQT90 FLEX with the i-STAT
D. GRUSON, T. Lepoutre, A. Godfraind, F. Thys. Cliniques Universitaires St Luc, bruxelles, Belgium
Background: Troponin testing is pivotal for the diagnosis of acute myocardial infarction. Several point of care assays are now available for troponin testing and might therefore allow a faster delivery of results. The AQT90 FLEX is a point of care testing (POCT) analyzer allowing the measurement of several cardiac markers. Our study was devoted to the comparison of the AQT90 FLEX troponin I (TnI) POCT assay with the i-STAT TnI assay. Methods: Imprecision of the AQT90 FLEX analyzer (Radiometer Medical) was determined with quality control materials. Method comparison was performed with the i-STAT assay (Abbott diagnostics) in 176 specimen of patients (65 women, 103 men; mean age: 62 years) suspected of acute myocardial infarction. Results: Between-run coeffi cients of variation were 5.6% at 0.036 ng/mL (n=9), 3.4% at 0.321 ng/mL and 2.6% at 1.543 ng/mL with the AQT90 assay. For samples with TnI concentrations below 0.023 ng/mL (n=106) on AQT90, TnI values were higher with the i-STAT with a mean difference observed on Bland and Altman plot of 0.013 ng/mL. For samples with TnI concentrations higher than 0.023 ng/mL (n=70), a positive correlation was observed between the two methods (r = 0.92, p<0.0001). Passing and Bablock regression analysis provides a slope of 0.27 and an intercept of 0.018, without signifi cant deviation of linearity. TnI values were higher with the i-STAT with a mean difference observed on Bland an Altman plot of 5.5 ng/mL. With the whole specimen cohort, the concordance correlation coeffi cient was 0.91 and the weighted kappa coeffi cient was 0.83, demonstrating very good concordance and agreement between the AQT90 and the i-STAT. However, for twelve patients the results were discrepant between the two POCT methods. In 6 patients, the results were negative with the AQT90 and positive with the i-STAT, and the fi nal diagnosis were cardiac valve disorders in 3 patients, heart failure for 2 patients and pulmonary embolism for one patient. For the 6 other patients, the results were positive with the AQT90
and negative with the i-STAT and the fi nal diagnosis were coronary artery diseases in 2 patients, cardiac valve disorders for 2 patients, cardio-respiratory failure for one patient and atypical thoracic pain for one patient.Conclusions: Our results showed satisfactory imprecision for the AQT90 FLEX TnI assay and a very good concordance with the i-STAT assay. The differences between the two assays observed in our study might be related to the different assay formats used by the manufacturers.
B-204
Comparison between heart-type fatty acid-binding protein and other cardiac biomarkers after cardiac operation
Y. Kim, S. Kim, Y. Kim, H. Kwon, H. Lee, M. Jo, J. Lee. The Catholic University of Korea, Seoul, Korea, Republic of
Background: Heart-type fatty acid-binding protein (H-FABP) is 2 to 10 times more expressed in cardiac muscle than in skeletal muscle and is rapidly released into the circulation following myocardial injury. H-FABP appears and disappears more quickly than creatine kinase MB isoenzyme (CK-MB) and cardiac troponins, so that the amount of H-FABP released for a certain period after cardiac operation might be more useful for the estimation of the amount of myocardial injury than CK-MB and cardiac troponins. Thus, the aim of this study was to assess if there was any difference in the pattern of the release of H-FABP, CK-MB and cardiac troponin T between the patients with different types of cardiac operation.Methods: A total of 69 patients who had cardiac operations with cardiopulmonary bypass (CBP) and aortic cross-clamping (ACC) at the Department of Thoracic & Cardiovascular Surgery of St. Vincent’s Hospital in Suwon, Korea, between December 2008 and November 2009 were examined in this study. Thirty two of the patients underwent coronary artery bypass graft (CABG), 27 of these underwent valve surgery, and the remaining 10 patients underwent septal defect surgery. Blood concentrations of the cardiac biomarkers were measured just before cardiac operation, just after, 3 h, 6 h, 12 h, 18 h, 1 d, 2 d, 3 d, 4 d, 5 d, 6 d, and 7 d after cardiac operation was completed. The amounts of the biomarkers released from injured myocardium were calculated by using the area under the concentration-time curve (AUC) just after the operation to a certain time. The data are presented as the mean ± SD, if not otherwise stated. Student’s t test and Mann-Whitney U test were used when comparing continuous variables.

Wednesday, July 31, 9:30 am – 5:00 pm Cardiac Markers
A232 CLINICAL CHEMISTRY, Vol. 59, No. 10, Supplement, 2013
Results: The mean amount (AUC0-96h) of CK-MB and cTnT released for 96 h in the patients with valve operation were 2621.8 h·ng/mL and 119.2 h·pg/mL which were signifi cantly larger than those in the patients with CABG or septal operation (P<0.05), respectively. In addition, there is no signifi cant difference in the amount of CK-MB and cTnT between the patients with CABG and septal operation. In contrast, the mean amount (AUC0-96h) of H-FABP released for 96 h in the patients with CABG was 3110.2 h·ng/mL which was similar to that in the patients with valve operation (2959.4 h·ng/mL) but was signifantly larger than that in the patient with septal operation (709.5 h·ng/mL)(P<0.05).Conclusion: H-FABP had different release kinetic pattern from CK-MB and cTnT after cardiac operation. Valve operation produced larger amount of CK-MB and cTnT than CABG, while there was no difference in the amount of H-FABP between valve operation and CABG.
B-205
CK-MB mass assay of RADIOMETER AQT90 FLEX immunoassay analyser
M. Yamashita1, M. Takiwaki1, Y. Uji2, I. Kitajima1. 1Clinical Laboratory Center, Toyama University Hospital, Toyama, Japan, 2Department of Medical Technology and Sciences, School of Health Sciences at Fukuoka, International University of Health and Welfare, Fukuoka, Japan
Background: Creatine kinase-MB (CK-MB) mass assay is used as a biomarker for the diagnosis of acute myocardial infarction (AMI). In this study, we evaluated CK-MB mass assay of the AQT90FLEX immunoassay analyzer (Radiometer Medical ApS, Denmark).Methods: Samples were obtained from Toyama University Hospital after receiving patients had given their informed consent for this study. The comparison study for CK-MB mass kevels were determined by ARCHITECT 2000i SR automatic immunoassay analyzer and ARCHITECT CK-MB ST reagent (Abbott Laboratories, IL, USA).Mitochondrial CK (MtCK) activities and CK-MB activities were measured by Accuras auto CK-MB MtO reagent (Shino Test Co. Ltd., Tokyo, Japan). Electrophoresis were used for investigate the cross-reaction of CK-BB and immunoglobulin-bounding CK (Ig-CK).Results: Analytical performance of the AQT90FLEX immunoassay analyzer showed as follows: Within-run and day to day precisions (CVs) were 2.3 to 4.8% (12.6 - 418.6μg/L, n=10). Linearity of the assay confi rmed at 8.25 to 295.5 μg/L . No signifi cant interference were observed from bilirubin, hemolysate, chyle, rheumatoid factor and ascorbic acid. Correlation between AQT90FLEX CK-MB mass levels (Y) and ARCHITECT CK-MB mass levels (X) were well (y=0.53x-3.17, r=0.99, n=48). However, three discrepant samples were recognized between CK-MB mass levels and CK-MB activities. Those samples were confi rmed CK-BB or Ig-CK presence in serum by immunofi xation electrophoresis. CK-MB mass assays of the AQT90FLEX immunoassay analyzer demonstrate no signifi cant cross-reaction with CK-BB, Ig-CK and MtCK. CK-MB mass levels of the AQT90FLEX immunoassay analyzer in serum, plasma and whole blood were very similar. When whole blood were used for sample, turn-around time were less than 20min.Conclusion: We conclude CK-MB mass assay of the RADIOMETER AQT90FLEX were rapid, sensitive and precise which meet the requirements for measuring CK-MB mass levels in whole blood, plasma and serum.
B-206
Prognostic Value of Plasma Concentration of D-Dimer in Patients Undergoing Elective Coronary Angiography for Suspected Coronary Artery Disease
F. Kitagawa, A. Kuno, J. Takeda, M. Saito, T. Hashimoto, S. Matsui, T. Ishikawa, H. Naruse, Y. Ozaki, J. Ishii. Fujita Health University, Toyoake, Japan
D-dimer can be considered as a global marker of the turnover of cross-linked fi brin and of activation of the hemostatic system. We prospectively investigated whether modest increases of plasma D-dimer levels might be relevant to prognosis in 1650 patients (median age, 66 years; 1246 males) who underwent elective coronary angiography for evaluating coronary artery disease (CAD). Blood samples for measurements of D-dimer, total plasminogen activator inhibitor-1 (tPAI-1) and high-sensitive C-reactive protein (hsCRP) were obtained before coronary angiography. Among these patients, 40% had a history of old myocardial infarction, 31% had diabetes, 71% had signifi cant stenosis (>75%) of the coronary artery, and 41% had multi-vessel disease.
Results: During a mean follow-up period of 40 months, there were 92 (5.6%) overall deaths and 264 (16%) cardiovascular events. On stepwise Cox regression analyses including 9 clinical and angiographic variables, quartiles of D-dimer were independently associated with overall mortality (relative risk 1.51, p = 0.0002) and cardiovascular events (relative risk 1.26, p = 0.0001). Clinical characteristics and adverse outcome according to quartiles of D-dimer were shown in Table. Conclusions: Modest increases of D-dimer may be independently associated with overall mortality and cardiovascular events in patients with suspected CAD. Measurements of D-dimer may be useful for the risk stratifi cation of adverse outcomes in this population.
Clinical characteristics and adverse outcome according to quartiles of D-dimerQuartiles of D-dimer (μg/mL)1st(n=413)<0.26
2nd(n=430)0.26-0.45
3rd(n=396)0.46-0.86
4th(n=411)>0.86 P value
Age (years) 61 65 68 72 <0.0001High-sensitivity CRP (mg/L) 0.56 0.68 0.72 1.3 <0.0001Estimated GFR (mL/min/1.73m2) 75 70 67 62 <0.0001Total PAI-1 (ng/mL) 13.7 14.6 13.6 13.3 Not signifi cantMulti-vessel disease 34% 43% 42% 47% 0.0004Overall mortality 2.2% 3.5% 5.6% 11.2% <0.0001Cardiovascular event 9.2% 14.5% 15.4% 25.1% <0.0001
B-207
Diagnostic Accuracy of the Mitsubishi PATHFAST Cardiac Troponin I Point of Care Assay
M. M. Murakami1, S. W. Smith1, L. A. Pearce2, F. S. Apple1. 1Hennepin County Medical Center, Minneapolis, MN, 2Biostatistical Consulting, Minot, ND
Background: The diagnosis of acute myocardial infarction (MI) is based on clinical factors and an increased cardiac troponin (cTn), with a rising and/or falling cTn pattern required. In addition, utilizing point-of-care technology to measure cTn may assist in a more rapid management of patients presenting to rule in or rule out MI. The goal of this study was to validate the diagnostic accuracy of the Mitsubishi PATHFAST point-of-care (POC) cTnI assay based on the 99th percentile cutoff.Methods: 523 Patients presenting with symptoms suggestive of ischemia presenting to Hennepin County Medical Center’s emergency department with serial cTnI concentrations were evaluated. Plasma (heparin) was obtained at 0 to 2h, >2 to 6h, and >6 to 12h after presentation. cTnI was measured by the Mitsubishi PATHFAST cTnI-II assay (LoD, 19 ng/L; 99th percentile URL 29 ng/L, with a 10%CV). All charts were adjudicated for MI, predicated on the Universal Defi nition of Myocardial Infarction guidelines based on the 99th percentile of the Siemens Stratus CS cTnI assay used routinely in the hospital. .Results: MI was diagnosed in 20.8% (n=109) patients. The table demonstrates the diagnostic accuracy fi ndings. Clinical sensitivity improved over the time of serial testing, improving from 67% at 0-2h to 94% at >2 to 12h. Specifi city was 93% at presentation (0h). and remained at 92 to 93% over the next 12 hours. At presentation (0-2h) the PATHFAST was diagnostically more accurate compared to the predicate Stratus CS (AUC 0.89 vs. 0.82, p = 0.0025). Sensitivity and specifi city at URL of 0.10 for Stratus CS were 53% and 93% respectively.Conclusions: Our fi ndings confi rm that the Mitsubishi PATHFAST point-of-care cTnI assay is an important diagnostic aid in ruling in and ruling out acute MI using the 99th percentile value.
PATHFAST cTnI - Sensitivity, Specifi city & ROC AUCTime Sensitivity %, (95%CI) Specifi city %, (95%CI) ROC AUC (95%CI)0-2h 67 (57, 76) 93 (90, 96) 0.89 (0.86, 0.92)>2-6h 94 (87, 97) 93 (90, 95) 0.97 (0.95, 0.98)>6-12h 94 (87, 97) 92 (89, 94) 0.97 (0.96, 0.99)

Cardiac Markers Wednesday, July 31, 9:30 am – 5:00 pm
CLINICAL CHEMISTRY, Vol. 59, No. 10, Supplement, 2013 A233
B-208
Diagnostic Accuracy of the Ortho-Clinical Diagnostics VITROS ES cTnI Assay
M. M. Murakami1, S. E. Nelson1, Y. Sandoval1, S. W. Smith1, K. M. Schulz1, L. A. Pearce2, F. S. Apple1. 1Hennepin County Medical Center, Minneapolis, MN, 2Biostatistical Consulting, Minot, ND
Background: The diagnosis of acute myocardial infarction (MI) is based on clinical factors and an increased cardiac troponin (cTn), with a rising and /or falling cTn pattern required. The use of a delta (change) value may play a role in optimizing diagnostic specifi city. The goal of this study was to validate the diagnostic accuracy of the Ortho-Clinical Diagnostics (OCD) Vitros ES cTnI assay based on a) 99th percentile and b) the delta values (absolute concentration differences) between 0-3h and 0-6h serial blood draws.Methods: We reviewed 1271 patients presenting with symptoms suggestive of ischemia presenting to the emergency department with serial cTnI concentrations. Plasma (heparin) was obtained at presentation and 3 (n=628), 6 (n =958) and/or 9 (n=951) h. cTnI was measured by the OCD assay (LoD, 12 ng/L; 99th percentile 34 ng/L, 10%CV). Charts with any increased cTnI were adjudicated for MI, predicated on the Universal Defi nition of MI guidelines.Results: Type 1 MI was diagnosed in 8% (n=33 STEMI; n=69 NSTEMI) and type 2 MI in 17% (total MI rate 25%). At 0h, similar proportions of type 1 STEMI (45%), NSTEMI (55%) and type 2 MI (42%) were increased above the 99th percentile (p=0.2). The table demonstrates diagnostic accuracy fi ndings. Clinical sensitivity improved over serial testing, from 46% at 0h to 96% at 6h. Specifi city was 93% at presentation (0h), and the delta change values at 3 and 6h did not improve diagnostic accuracy (specifi city 90-91%) compared to the individual timed cTnI fi nding at baseline.Conclusions: We confi rm that the contemporary OCD Vitros ES cTnI assay is an important diagnostic aid in ruling in/out acute MI for both type 1 and 2 MIs using the 99th percentile. The delta change value did not improve diagnostic utility to the assay which already provided a high clinical specifi city at baseline.
Diagnostic Accuracy - VITROS ES cTnITime %Sensitivity
(95%CI)% Specifi city (95%CI)
LR+ (95%CI)
LR- (95%CI)
ROC AUC (95%CI)
0h (>34 ng/L) 46 (40, 52) 93 (91, 94) 6.3 (4.9, 8.1
0.58 (0.5, 0.6)
0.73 (0.70, 0.75)
3h (>34 ng/L) 89 (83, 93) 86 (83, 89) 6.5 (5.1, 8.3)
0.13 0.08, 0.2)
0.91 (0.89, 0.93)
6h (>34 ng/L) 96 (93, 98) 88 (85, 90) 7.9 (6.5, 9.6)
0.05 (0.02, 0.09)
0.94 (0.93, 0.96)
0-3h (30 ng/L) abs conc delta -- 91 (88, 93) -- -- 0.92 (0.90,
0.94)0-6h (20 ng/L) abs conc delta -- 90 (88, 92) -- -- 0.94 (0.92,
0.95)
B-209
The biological characteristics of IL-6, IL-17A and TNF-α for monitoring patients at risk for developing cardiovascular disease.
A. H. Wu1, J. Estis2, V. Torres2, J. Todd2. 1University of California, San Francisco, San Francisco, CA, 2Singulex, Inc., Alameda, CA
Background: Atherosclerosis research has proven that chronic infl ammation of the blood vessels plays a major role in the initiation and progression of the disease and plasma cytokine concentrations can risk stratify both primary and secondary prevention patients for future cardiovascular. Their use in clinical practice requires documentation of analytical and biological characteristics. We determined preliminary reference ranges, biological variability, and magnitude of elevation of plasma IL-6, IL-17A and TNF-α in heart failure (HF) and patients.Methods: Reference range (120 healthy subjects), biological variability (25 healthy subjects, 6 weekly samples and 17 at risk CVD patients, 3 samples over 9 mos), HF (30 NYHA class I-III subjects & 30 age/sex matched controls). Assays- IL-6, IL-17A, TNF-α, and cTnI (high-sensitivity lab developed tests run on the ERENNA System in a CLIA licensed lab) hsCRP & NT-proBNP, Roche. Biological variability (or reference change values, RCVs) was determined using nested ANOVA. The protocol was approved by a local ethics committee.Results: The fi ndings of this study are presented in the table. The IL-6, IL-17A and TNF-α biomarkers were quantifi able in all healthy volunteers and we were able to establish 95/99%tile reference range cutpoints. The short- and long-term biological
variability of these biomarkers in both healthy and CVD at risk patients was low and similar to values previously published for cTnI and hs-CRP; indicating that serial monitoring may be more appropriate than the use of reference ranges. These biomarkers (as well as hsCRP & NT-proBNP; p<0.001) were increased in HF patients compared to controls, supporting their previously published potential to risk stratify for CVD.Conclusion:These fi ndings provide evidence that IL-6, IL-17A & TNF-α provide biological characteristics suitable for monitoring patients for CVD risk.
Reference range and biological variation for cytokinesReference range Biomarker Average* Upper 95%tile Upper 99%tile
IL-6 1.89 4.45 7.22IL-17A 0.61 1.93 3.34TNF-α 1.51 2.53 3.3
Biological variability Biomarker RCV% weekly RCV% monthlyIL-6 120 162IL-17A 93 102TNF-α 75 62hs-CRP 110 Not donecTnI Not done 88
CVD (HF) Biomarker HF mean Control mean pIL-6 6.16 1.0 <.001IL-17A 0.22 0.11 .007TNF-α 5.49 4.72 .08
*in pg/mL
B-210
New blood drawing tube (RST) successfully mitigates unacceptably high rates of falsely positive Beckman Access plasma troponins
G. S. Cembrowski, W. Skoropadyk, J. Choy. University of Alberta Hospital, Edmonton, AB, Canada
Background: The Beckman Access troponin assay is susceptible to false positives when blood specimens are inadequately mixed after being drawn into plasma separator tubes (PST). At the University of Alberta Hospital core chemistry laboratory, any new patient with a presumptively positive plasma troponin (>0.10 ug/L) has their troponin specimen recentrifuged and reanalyzed. As a fi rst step towards reporting lower levels of troponin as positive, i.e., >0.06 ug/L, we elected to measure our false positive rates of troponins using the usual Becton Dickinson (Franklin Lakes, NJ) PST and the Becton Dickinson rapid serum tube (RST).Materials and Methods: All troponin testing was performed on either of two Beckman DxI analyzers (Beckman Coulter, Fullerton, CA) . For Nov 26-Dec 24 2012, RST tubes were made available for clinical usage in our emergency department, cardiology and cardiovascular units. No special instructions were provided to the nursing staff who drew many of the specimens. As there was ready access to the PST, we also obtained plasma specimens for troponin analysis. On a daily basis, previously analyzed PST and RST specimens were gathered as specifi ed in the Table’s initial troponin levels. These specimens were recentrifuged and reanalyzed. Any specimen with a subsequent troponin <0.06ug/L was classifi ed as false positive.Results: The Table summarizes our fi ndings. The proportions of falsely positive PST troponins are unacceptably high. The differences between the RST and PST false positives are statistically signifi cant (p = 0.027, Chi-square = 4.89).Conclusions: Without recentrifugation, we do not recommend a 0.06 ug/L troponin cutoff for analyzing plasma specimens in clinical environments similar to ours in which many specimens for troponin testing are drawn by nonlaboratory personnel. Further analysis needs to be undertaken to determine the clinical implications and potential downstream unnecessary/harmful investigations and therapies that can result from these false positive tests.
Tube Initial Troponin Specimens False Positives False Positive RatePST 0.056 to 0.104 ug/L 20 4 20%RST 0.056 to 0.104 ug/L 20 1 5%PST 0.105 to 0.154 ug/L 20 3 15%RST 0.105 to 0.154 ug/L 20 0 0%PST 0.155 to 0.204 ug/L 10 0 0%RST 0.155 to 0.204 ug/L 10 0 0%
B-211
Analytical performance of high-sensitivity troponins T & I compared
T. Aw, S. Phua, S. Tan. Changi General Hospital, Singapore, Singapore
Introduction: As improved cardiac troponin (cTn) methods are introduced, it is important to determine how they compare with existing assays.
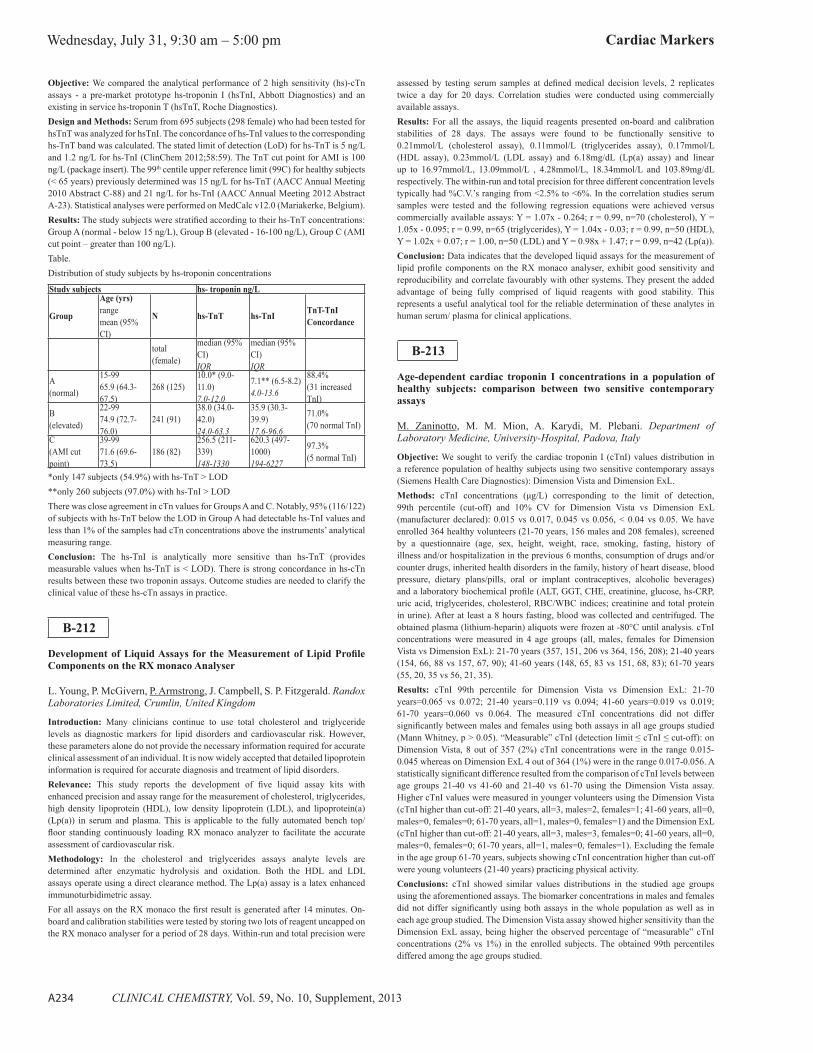
Wednesday, July 31, 9:30 am – 5:00 pm Cardiac Markers
A234 CLINICAL CHEMISTRY, Vol. 59, No. 10, Supplement, 2013
Objective: We compared the analytical performance of 2 high sensitivity (hs)-cTn assays - a pre-market prototype hs-troponin I (hsTnI, Abbott Diagnostics) and an existing in service hs-troponin T (hsTnT, Roche Diagnostics).Design and Methods: Serum from 695 subjects (298 female) who had been tested for hsTnT was analyzed for hsTnI. The concordance of hs-TnI values to the corresponding hs-TnT band was calculated. The stated limit of detection (LoD) for hs-TnT is 5 ng/L and 1.2 ng/L for hs-TnI (ClinChem 2012;58:59). The TnT cut point for AMI is 100 ng/L (package insert). The 99th centile upper reference limit (99C) for healthy subjects (< 65 years) previously determined was 15 ng/L for hs-TnT (AACC Annual Meeting 2010 Abstract C-88) and 21 ng/L for hs-TnI (AACC Annual Meeting 2012 Abstract A-23). Statistical analyses were performed on MedCalc v12.0 (Mariakerke, Belgium).Results: The study subjects were stratifi ed according to their hs-TnT concentrations: Group A (normal - below 15 ng/L), Group B (elevated - 16-100 ng/L), Group C (AMI cut point – greater than 100 ng/L).Table.Distribution of study subjects by hs-troponin concentrations
Study subjects hs- troponin ng/L
Group
Age (yrs)rangemean (95% CI)
N hs-TnT hs-TnI TnT-TnIConcordance
total (female)
median (95% CI)IQR
median (95% CI)IQR
A(normal)
15-9965.9 (64.3-67.5)
268 (125)10.0* (9.0-11.0)7.0-12.0
7.1** (6.5-8.2)4.0-13.6
88.4%(31 increased TnI)
B(elevated)
22-9974.9 (72.7-76.0)
241 (91)38.0 (34.0-42.0)24.0-63.3
35.9 (30.3-39.9)17.6-96.6
71.0%(70 normal TnI)
C(AMI cut point)
39-9971.6 (69.6-73.5)
186 (82)256.5 (211-339)148-1330
620.3 (497-1000)194-6227
97.3%(5 normal TnI)
*only 147 subjects (54.9%) with hs-TnT > LOD**only 260 subjects (97.0%) with hs-TnI > LODThere was close agreement in cTn values for Groups A and C. Notably, 95% (116/122) of subjects with hs-TnT below the LOD in Group A had detectable hs-TnI values and less than 1% of the samples had cTn concentrations above the instruments’ analytical measuring range.Conclusion: The hs-TnI is analytically more sensitive than hs-TnT (provides measurable values when hs-TnT is < LOD). There is strong concordance in hs-cTn results between these two troponin assays. Outcome studies are needed to clarify the clinical value of these hs-cTn assays in practice.
B-212
Development of Liquid Assays for the Measurement of Lipid Profi le Components on the RX monaco Analyser
L. Young, P. McGivern, P. Armstrong, J. Campbell, S. P. Fitzgerald. Randox Laboratories Limited, Crumlin, United Kingdom
Introduction: Many clinicians continue to use total cholesterol and triglyceride levels as diagnostic markers for lipid disorders and cardiovascular risk. However, these parameters alone do not provide the necessary information required for accurate clinical assessment of an individual. It is now widely accepted that detailed lipoprotein information is required for accurate diagnosis and treatment of lipid disorders.Relevance: This study reports the development of fi ve liquid assay kits with enhanced precision and assay range for the measurement of cholesterol, triglycerides, high density lipoprotein (HDL), low density lipoprotein (LDL), and lipoprotein(a) (Lp(a)) in serum and plasma. This is applicable to the fully automated bench top/fl oor standing continuously loading RX monaco analyzer to facilitate the accurate assessment of cardiovascular risk.Methodology: In the cholesterol and triglycerides assays analyte levels are determined after enzymatic hydrolysis and oxidation. Both the HDL and LDL assays operate using a direct clearance method. The Lp(a) assay is a latex enhanced immunoturbidimetric assay.For all assays on the RX monaco the fi rst result is generated after 14 minutes. On-board and calibration stabilities were tested by storing two lots of reagent uncapped on the RX monaco analyser for a period of 28 days. Within-run and total precision were
assessed by testing serum samples at defi ned medical decision levels, 2 replicates twice a day for 20 days. Correlation studies were conducted using commercially available assays.Results: For all the assays, the liquid reagents presented on-board and calibration stabilities of 28 days. The assays were found to be functionally sensitive to 0.21mmol/L (cholesterol assay), 0.11mmol/L (triglycerides assay), 0.17mmol/L (HDL assay), 0.23mmol/L (LDL assay) and 6.18mg/dL (Lp(a) assay) and linear up to 16.97mmol/L, 13.09mmol/L , 4.28mmol/L, 18.34mmol/L and 103.89mg/dL respectively. The within-run and total precision for three different concentration levels typically had %C.V.’s ranging from <2.5% to <6%. In the correlation studies serum samples were tested and the following regression equations were achieved versus commercially available assays: Y = 1.07x - 0.264; r = 0.99, n=70 (cholesterol), Y = 1.05x - 0.095; r = 0.99, n=65 (triglycerides), Y = 1.04x - 0.03; r = 0.99, n=50 (HDL), Y = 1.02x + 0.07; r = 1.00, n=50 (LDL) and Y = 0.98x + 1.47; r = 0.99, n=42 (Lp(a)).Conclusion: Data indicates that the developed liquid assays for the measurement of lipid profi le components on the RX monaco analyser, exhibit good sensitivity and reproducibility and correlate favourably with other systems. They present the added advantage of being fully comprised of liquid reagents with good stability. This represents a useful analytical tool for the reliable determination of these analytes in human serum/ plasma for clinical applications.
B-213
Age-dependent cardiac troponin I concentrations in a population of healthy subjects: comparison between two sensitive contemporary assays
M. Zaninotto, M. M. Mion, A. Karydi, M. Plebani. Department of Laboratory Medicine, University-Hospital, Padova, Italy
Objective: We sought to verify the cardiac troponin I (cTnI) values distribution in a reference population of healthy subjects using two sensitive contemporary assays (Siemens Health Care Diagnostics): Dimension Vista and Dimension ExL.Methods: cTnI concentrations (μg/L) corresponding to the limit of detection, 99th percentile (cut-off) and 10% CV for Dimension Vista vs Dimension ExL (manufacturer declared): 0.015 vs 0.017, 0.045 vs 0.056, < 0.04 vs 0.05. We have enrolled 364 healthy volunteers (21-70 years, 156 males and 208 females), screened by a questionnaire (age, sex, height, weight, race, smoking, fasting, history of illness and/or hospitalization in the previous 6 months, consumption of drugs and/or counter drugs, inherited health disorders in the family, history of heart disease, blood pressure, dietary plans/pills, oral or implant contraceptives, alcoholic beverages) and a laboratory biochemical profi le (ALT, GGT, CHE, creatinine, glucose, hs-CRP, uric acid, triglycerides, cholesterol, RBC/WBC indices; creatinine and total protein in urine). After at least a 8 hours fasting, blood was collected and centrifuged. The obtained plasma (lithium-heparin) aliquots were frozen at -80°C until analysis. cTnI concentrations were measured in 4 age groups (all, males, females for Dimension Vista vs Dimension ExL): 21-70 years (357, 151, 206 vs 364, 156, 208); 21-40 years (154, 66, 88 vs 157, 67, 90); 41-60 years (148, 65, 83 vs 151, 68, 83); 61-70 years (55, 20, 35 vs 56, 21, 35).Results: cTnI 99th percentile for Dimension Vista vs Dimension ExL: 21-70 years=0.065 vs 0.072; 21-40 years=0.119 vs 0.094; 41-60 years=0.019 vs 0.019; 61-70 years=0.060 vs 0.064. The measured cTnI concentrations did not differ signifi cantly between males and females using both assays in all age groups studied (Mann Whitney, p > 0.05). “Measurable” cTnI (detection limit ≤ cTnI ≤ cut-off): on Dimension Vista, 8 out of 357 (2%) cTnI concentrations were in the range 0.015-0.045 whereas on Dimension ExL 4 out of 364 (1%) were in the range 0.017-0.056. A statistically signifi cant difference resulted from the comparison of cTnI levels between age groups 21-40 vs 41-60 and 21-40 vs 61-70 using the Dimension Vista assay. Higher cTnI values were measured in younger volunteers using the Dimension Vista (cTnI higher than cut-off: 21-40 years, all=3, males=2, females=1; 41-60 years, all=0, males=0, females=0; 61-70 years, all=1, males=0, females=1) and the Dimension ExL (cTnI higher than cut-off: 21-40 years, all=3, males=3, females=0; 41-60 years, all=0, males=0, females=0; 61-70 years, all=1, males=0, females=1). Excluding the female in the age group 61-70 years, subjects showing cTnI concentration higher than cut-off were young volunteers (21-40 years) practicing physical activity.Conclusions: cTnI showed similar values distributions in the studied age groups using the aforementioned assays. The biomarker concentrations in males and females did not differ signifi cantly using both assays in the whole population as well as in each age group studied. The Dimension Vista assay showed higher sensitivity than the Dimension ExL assay, being higher the observed percentage of “measurable” cTnI concentrations (2% vs 1%) in the enrolled subjects. The obtained 99th percentiles differed among the age groups studied.

Cardiac Markers Wednesday, July 31, 9:30 am – 5:00 pm
CLINICAL CHEMISTRY, Vol. 59, No. 10, Supplement, 2013 A235
B-214
Performance of a New Liquid Cardiac Markers Control with Extended 2-8ºC Stability in a Dropper Vial Format for Utility in Both the Central Laboratory and at the Point-Of-Care
B. Fernández, J. Starobin, P. Lenichek, S. Musngi, M. Ghadessi, M. Ban. Quantimetrix, Redondo Beach, CA
Background: It is critical when measuring patient samples for indicators of disease that stable controls are used to validate instrument performance. Cardiac markers are used to diagnose and risk-stratify patients with acute coronary syndromes and other cardiovascular-related issues. Cardiac Troponin I (cTnI), N-terminal pro-natriuretic peptide (NT-ProBNP), B-type natriuretic peptide (BNP), and D-Dimer have been notoriously diffi cult to stabilize in a human serum based control format, requiring that the materials be lyophilized or frozen to provide adequate shelf-life and may only offer very limited 2-8ºC stability.Objective: To formulate an improved human serum derived cardiac markers control that exhibits extended 2-8ºC stability of at least 6 months for cTnI, NT-ProBNP, BNP and D-Dimer while allowing for the inclusion of other less-labile cardiac markers.Methods: A human serum derived matrix was formulated with preparations of cTnI, NT-ProBNP, BNP, and D-Dimer to clinically signifi cant levels. Aliquots in plastic dropper vials and were stressed at 25 ºC and 37ºC for 6 days while remaining samples were maintained at -20 ºC and 2-8ºC for real-time analysis. The assays for cTnI, NT-ProBNP, and D-Dimer were performed on the Siemens Dimension® ExL™, using the Kamiya K-assay® reagent for D-Dimer. The assays for BNP were performed on the Beckman Access® 2 using the Alere Triage® BNP reagent. The data was used to create an Arrhenius model allowing for the prediction of long-term stability.Results:
Table 1: Stability Results
Analyte Units
Average Real-Time and Accelerated Stress Data Arrhenius Modeling (±20% Cutoff)
Fresh Value
3 months @ 4ºC
7 months @ 4ºC
6 days @ 25ºC
6 days @ 37ºC
Calculated Ea (cal/mol)
Predicted 4ºC Stability
Predicted -20ºC Stability
cTnI ng/mL 0.9841.024 (+4%)
1.078 (+10%)
0.82 (-17%)
0.68 (-31%)
25,495 12 months >> 10 years
NT-ProBNP
pg/mL 43854017 (-8%)
3795 (-13%)
4179 (-5%)
3712 (-15%)
19,121 10 months >> 10 years
BNP pg/mL 26072618 (0%)
2272 (-13%)
2650 (+2%)
2531 (-3%)
10,838 10 months 5.8 years
D-Dimer μg/mL 2.762.93 (+6%)
NA2.67 (-3%)
2.61 (-5%)
14,349 10 months 10 years
Conclusion: This liquid cardiac markers control formulation exhibits excellent 2-8ºC stability of up to 10 months when evaluated at a ±20% failure cutoff. The Arrhenius prediction is corroborated by the on-going real-time testing. The extended stability and dropper vial format is of particular convenience to the point-of-care testing format where samples can be thawed and ready to use without the need to use pipettes to deliver the sample.
B-215
Evaluation of a new STAT High Sensitive Troponin-I assay on the ARCHITECT i2000SR Instrument
V. Juvent1, L. Lebeau1, J. Shih2, L. Lennartz3, P. Boudry1. 1Centre Hospitalier Regional Boussu, Boussu, Belgium, 2Abbott Laboratories, Abbott Park, IL, 3Abbott, Wiesbaden, Germany
Introduction: A new ARCHITECT high sensitive troponin-I assay has been developed that fulfi lls the requirements of the third universal defi nition of myocardial infarction (MI), which calls for rise and/or fall of Troponin levels with at least on value above the cut-off. Troponin is the preferred biomarker to be used in the diagnosis of MI and the cutoff should be the 99th percentile of the upper reference limit of normal (ULN) with a precision at this cutoff of less the 10% total CV. The objective of this study was to evaluate the performance of the ARCHITECT STAT high sensitive Troponin-I (hsTnI) assay on the i2000SR instrument in a routine laboratory and compare clinical samples to the routinely used ARCHITECT TnI assay.Methods: The ARCHITECT STAT High Sensitive Troponin-I is a double monoclonal antibody sandwich assay utilizing CMIA technology. Five day precision and verifi cation of the LoB, LoD and LoQ were performed with guidance from CLSI guidelines EP5-A2 and AP17-A. The preliminary 99th percentile URL was determined
with 70 lithium heparin samples from a healthy population tested also for BNP, HbA1c and eGFR. One hundred ninety three lithium heparin samples from patients presenting with chest pain suspicious of acute coronary syndrome were used for a correlation study, comparing the previous ARCHITECT STAT Troponin-I assay with the new ARCHITECT STAT High Sensitive Troponin-I assay.Results. The total %CV from the 5-day precision protocol ranged from 2.6 to 3.9 with sample concentrations ranging from19 pg/mL to 14032 pg/mL. The LoB, LoD and LoQ were verifi ed to be 0.11 pg/mL, 0.5 pg/mL and 7.7 pg/mL, respectively. The %CV at 7.7 pg/mL was 10.6%. Using the ULN from the respective package inserts as the threshold, agreement between the routine ARCHITECT TnI and the high sensitive ARCHITECT assay was 94% with samples ranging from 0.5 to 20425 pg/mL. Passing-Bablok analysis indicated a slope of 0.98. Altman Bland test showed an average % bias of -18%.In 71 samples from apparently healthy blood donors the mean (minimum, maximum) concentration for the hs TnI assay were 1.54 pg/mL, (0.1 to 26.5 pg/mL) with %HbA1c average at 5.3% (4.7 to 6.5%), BNP average of 26 pg/mL (10-4 to 114.3) and average MDRD eGFR of 93 ml/min/1.73 (36 to 169 ml/min/1.73). 66% of the 71 healthy individuals had hs TnI values above the LoD of 0.5 pg/mL.Conclusion: The new ARCHITECT STAT High Sensitive Troponin-I assay fulfi lls the criteria for a high sensitive assay in regard to precision at 99th percentile ULN. In apparently healthy individuals 66% had TnI levels over the limit of detection. The diagnosis of myocardial infarction as defi ned by the third universal defi nition of myocardial infarction is supported by the ARCHITECT hs TnI assay with improved precision at lower concentrations.
B-216
Analytical Evaluation of the ARCHITECT STAT High Sensitive Troponin-I Assay
J. Lotz1, R. Lott1, L. Lennartz2, J. Shih3, K. Lackner4. 1Institute for Clinical Chemistry and Laboratory Medicine, University Medical Center of the Johannes Gutenberg University Mainz, Mainz, Germany, 2Abbott, Wiesbaden, Germany, 3Abbott Laboratories, Abbott Park, IL, 4Institute for Clinical Chemistry and Laboratory Medicine, University Medical Center of the Johannes Gutenberg University of Mainz, Mainz, Germany
Introduction: The third universal defi nition of myocardial infarction (MI) calls for a risíng and/or falling pattern of Troponin (Tn) with at least one Tn measurement above the 99th percentile upper limit of normal (ULN) for the confi rmation of the diagnosis of myocardial infarction in a symptomatic chest pain population. High sensitive Troponin assays are now available with improved capability to support this defi nition.The objective of this study was to evaluate the analytical performance of the ARCHITECT STAT High Sensitive Troponin-I assay and to compare clinical sample results with the contemporary ARCHITECT STAT Troponin-I assay.Methods: The ARCHITCT STAT high sensitive Troponin-I assay is a double monoclonal antibody sandwich assay using CMIA technology on the ARCHITECT instrument. Five day precision, verifi cation of LoB, LoD, LoQ, linearity and interference testing were performed with guidance from CLSI guideline EP5-A2, AP17-A, EP6-A and EP7-A. The 99th percentile upper reference limit was determined using lithium heparin plasma from an apparently healthy population. Participants were further defi ned by medical history and BNP concentration. Comparison to the routine ARCHITECT method was performed by running 475 lithium heparin samples from patients being evaluated for myocardial infarction in parallel on the ARCHITECT systems connected to the automated laboratory solutions.Results: The performance of the assay was in agreement with the package insert data. Total %CVs from the 5 day precision study were <5% with control sample concentrations ranging from 20 to 14,936 pg/mL. Control samples were also tested each day from January 11 to February 1, 2013 with between day CV% of 2.1%, 1.7% and 1.9 %. LoB, LoD and LoQ were verifi ed at 0.25, 0.62 and 4.64 pg/mL, respectively. The %CV at 4.64 pg/mL was 6.84%. Dilution of samples with TnI concentrations between 304 and 44800 pg/mL was linear. Results from the interference testing for bilirubin, hemoglobin and triglyerides were in agreement with the package insert. Using the package insert ULN of the respective assays, overall correlation between the two troponin assays was 94%. Passing-Bablok fi t of the data showed a slope of 0.93 with intercept of 10 pg/mL. In 38 samples from apparently healthy persons, 82% had hs TnI level above the LoD of 0.62 pg/mL. Mean, median, min and max hs TnI levels were 3.2, 1.9, 0.1 and 16.8 pg/ml respectively.Conclusion: The new ARCHITECT STAT High Sensitive Troponin-I assay performed according to package insert specifi cations and meets the criteria for a high sensitive Troponin assay for precision and detectibility in normal samples greater
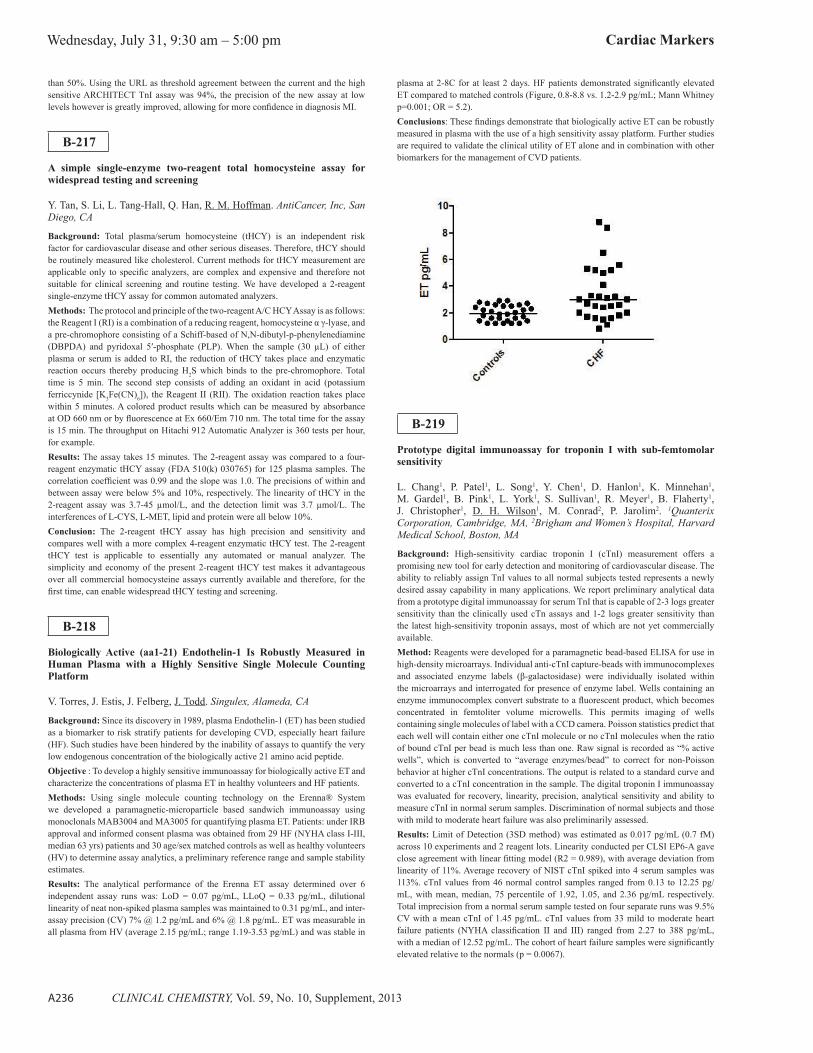
Wednesday, July 31, 9:30 am – 5:00 pm Cardiac Markers
A236 CLINICAL CHEMISTRY, Vol. 59, No. 10, Supplement, 2013
than 50%. Using the URL as threshold agreement between the current and the high sensitive ARCHITECT TnI assay was 94%, the precision of the new assay at low levels however is greatly improved, allowing for more confi dence in diagnosis MI.
B-217
A simple single-enzyme two-reagent total homocysteine assay for widespread testing and screening
Y. Tan, S. Li, L. Tang-Hall, Q. Han, R. M. Hoffman. AntiCancer, Inc, San Diego, CA
Background: Total plasma/serum homocysteine (tHCY) is an independent risk factor for cardiovascular disease and other serious diseases. Therefore, tHCY should be routinely measured like cholesterol. Current methods for tHCY measurement are applicable only to specifi c analyzers, are complex and expensive and therefore not suitable for clinical screening and routine testing. We have developed a 2-reagent single-enzyme tHCY assay for common automated analyzers.Methods: The protocol and principle of the two-reagent A/C HCY Assay is as follows: the Reagent I (RI) is a combination of a reducing reagent, homocysteine α γ-lyase, and a pre-chromophore consisting of a Schiff-based of N,N-dibutyl-p-phenylenediamine (DBPDA) and pyridoxal 5′-phosphate (PLP). When the sample (30 μL) of either plasma or serum is added to RI, the reduction of tHCY takes place and enzymatic reaction occurs thereby producing H2S which binds to the pre-chromophore. Total time is 5 min. The second step consists of adding an oxidant in acid (potassium ferriccynide [K3Fe(CN)6]), the Reagent II (RII). The oxidation reaction takes place within 5 minutes. A colored product results which can be measured by absorbance at OD 660 nm or by fl uorescence at Ex 660/Em 710 nm. The total time for the assay is 15 min. The throughput on Hitachi 912 Automatic Analyzer is 360 tests per hour, for example.Results: The assay takes 15 minutes. The 2-reagent assay was compared to a four-reagent enzymatic tHCY assay (FDA 510(k) 030765) for 125 plasma samples. The correlation coeffi cient was 0.99 and the slope was 1.0. The precisions of within and between assay were below 5% and 10%, respectively. The linearity of tHCY in the 2-reagent assay was 3.7-45 μmol/L, and the detection limit was 3.7 μmol/L. The interferences of L-CYS, L-MET, lipid and protein were all below 10%.Conclusion: The 2-reagent tHCY assay has high precision and sensitivity and compares well with a more complex 4-reagent enzymatic tHCY test. The 2-reagent tHCY test is applicable to essentially any automated or manual analyzer. The simplicity and economy of the present 2-reagent tHCY test makes it advantageous over all commercial homocysteine assays currently available and therefore, for the fi rst time, can enable widespread tHCY testing and screening.
B-218
Biologically Active (aa1-21) Endothelin-1 Is Robustly Measured in Human Plasma with a Highly Sensitive Single Molecule Counting Platform
V. Torres, J. Estis, J. Felberg, J. Todd. Singulex, Alameda, CA
Background: Since its discovery in 1989, plasma Endothelin-1 (ET) has been studied as a biomarker to risk stratify patients for developing CVD, especially heart failure (HF). Such studies have been hindered by the inability of assays to quantify the very low endogenous concentration of the biologically active 21 amino acid peptide.Objective : To develop a highly sensitive immunoassay for biologically active ET and characterize the concentrations of plasma ET in healthy volunteers and HF patients.Methods: Using single molecule counting technology on the Erenna® System we developed a paramagnetic-microparticle based sandwich immunoassay using monoclonals MAB3004 and MA3005 for quantifying plasma ET. Patients: under IRB approval and informed consent plasma was obtained from 29 HF (NYHA class I-III, median 63 yrs) patients and 30 age/sex matched controls as well as healthy volunteers (HV) to determine assay analytics, a preliminary reference range and sample stability estimates.Results: The analytical performance of the Erenna ET assay determined over 6 independent assay runs was: LoD = 0.07 pg/mL, LLoQ = 0.33 pg/mL, dilutional linearity of neat non-spiked plasma samples was maintained to 0.31 pg/mL, and inter-assay precision (CV) 7% @ 1.2 pg/mL and 6% @ 1.8 pg/mL. ET was measurable in all plasma from HV (average 2.15 pg/mL; range 1.19-3.53 pg/mL) and was stable in
plasma at 2-8C for at least 2 days. HF patients demonstrated signifi cantly elevated ET compared to matched controls (Figure, 0.8-8.8 vs. 1.2-2.9 pg/mL; Mann Whitney p=0.001; OR = 5.2).Conclusions: These fi ndings demonstrate that biologically active ET can be robustly measured in plasma with the use of a high sensitivity assay platform. Further studies are required to validate the clinical utility of ET alone and in combination with other biomarkers for the management of CVD patients.
B-219
Prototype digital immunoassay for troponin I with sub-femtomolar sensitivity
L. Chang1, P. Patel1, L. Song1, Y. Chen1, D. Hanlon1, K. Minnehan1, M. Gardel1, B. Pink1, L. York1, S. Sullivan1, R. Meyer1, B. Flaherty1, J. Christopher1, D. H. Wilson1, M. Conrad2, P. Jarolim2. 1Quanterix Corporation, Cambridge, MA, 2Brigham and Women’s Hospital, Harvard Medical School, Boston, MA
Background: High-sensitivity cardiac troponin I (cTnI) measurement offers a promising new tool for early detection and monitoring of cardiovascular disease. The ability to reliably assign TnI values to all normal subjects tested represents a newly desired assay capability in many applications. We report preliminary analytical data from a prototype digital immunoassay for serum TnI that is capable of 2-3 logs greater sensitivity than the clinically used cTn assays and 1-2 logs greater sensitivity than the latest high-sensitivity troponin assays, most of which are not yet commercially available.Method: Reagents were developed for a paramagnetic bead-based ELISA for use in high-density microarrays. Individual anti-cTnI capture-beads with immunocomplexes and associated enzyme labels (β-galactosidase) were individually isolated within the microarrays and interrogated for presence of enzyme label. Wells containing an enzyme immunocomplex convert substrate to a fl uorescent product, which becomes concentrated in femtoliter volume microwells. This permits imaging of wells containing single molecules of label with a CCD camera. Poisson statistics predict that each well will contain either one cTnI molecule or no cTnI molecules when the ratio of bound cTnI per bead is much less than one. Raw signal is recorded as “% active wells”, which is converted to “average enzymes/bead” to correct for non-Poisson behavior at higher cTnI concentrations. The output is related to a standard curve and converted to a cTnI concentration in the sample. The digital troponin I immunoassay was evaluated for recovery, linearity, precision, analytical sensitivity and ability to measure cTnI in normal serum samples. Discrimination of normal subjects and those with mild to moderate heart failure was also preliminarily assessed.Results: Limit of Detection (3SD method) was estimated as 0.017 pg/mL (0.7 fM) across 10 experiments and 2 reagent lots. Linearity conducted per CLSI EP6-A gave close agreement with linear fi tting model (R2 = 0.989), with average deviation from linearity of 11%. Average recovery of NIST cTnI spiked into 4 serum samples was 113%. cTnI values from 46 normal control samples ranged from 0.13 to 12.25 pg/mL, with mean, median, 75 percentile of 1.92, 1.05, and 2.36 pg/mL respectively. Total imprecision from a normal serum sample tested on four separate runs was 9.5% CV with a mean cTnI of 1.45 pg/mL. cTnI values from 33 mild to moderate heart failure patients (NYHA classifi cation II and III) ranged from 2.27 to 388 pg/mL, with a median of 12.52 pg/mL. The cohort of heart failure samples were signifi cantly elevated relative to the normals (p = 0.0067).

Cardiac Markers Wednesday, July 31, 9:30 am – 5:00 pm
CLINICAL CHEMISTRY, Vol. 59, No. 10, Supplement, 2013 A237
Conclusion: The assay demonstrated the capability of reliably quantifying cTnI in normal individuals, with a LoD well below the lowest normal sample tested. These data suggest the assay could represent an advance in sensitivity relative to current high-sensitivity cTnI methods, and could be a new enabling tool for high defi nition cTnI measurement.
B-220
Multicentre analytical comparison between Abbott ARCHITECT STAT cTnI and hsTnI assays
P. Kavsak1, L. Clark1, R. Pickersgill2, J. Beattie3, E. Millar1, M. Napoleone2, N. Caruso3, A. Don-Wauchope1. 1Juravinski Hospital and Cancer Centre, Hamilton, ON, Canada, 2St. Joseph’s Healthcare, Hamilton, ON, Canada, 3Hamilton General Hospital, Hamilton, ON, Canada
BACKGROUND: An important aspect for laboratories considering switching to a high-sensitivity cardiac troponin (hs-cTn) assay is the analytical agreement between the same manufacturer’s contemporary cTn assay and the new hs-cTn assay across different platforms and sites. We assessed agreement and imprecision between the Abbott ARCHITECT STAT cTnI (contemporary) and the hsTnI assays in a multicentre setting.METHODS: Method comparison between cTnI and hsTnI assays was performed on 20 different pooled EDTA plasma samples analyzed at 3 different hospitals (A,B,C) on 4 instruments (A-site:2x16200; B-site:1x8200, C-site:1x8200). The agreement amongst platforms was assessed by averaging the results obtained for each sample and subtracting each instrument result from the average and then dividing the absolute difference by the average result to obtain a %difference. The average cTnI and hsTnI concentrations from the 20 samples were also subjected to Passing&Bablok regression analysis. The analytical imprecision (over 2-months) was determined using an in-house manufactured low cTnI pooled material for both assays as well as Abbott’s low QC material for the hsTnI assay.RESULTS: The average %difference in concentrations of the 20 samples across the 4 platforms (80 results; range=5-162ng/L) was 3.1% (%difference range=0.0-8.7%) for hsTnI as compared to 30.4% (%difference range=0-300%) for the contemporary cTnI assay (80 results; range=0-122ng/L). The hsTnI concentrations were approximately 1/3rd higher than cTnI (see Figure). The in-house low QC material weighted average concentration (n=574) for cTnI was 32ng/L with the CV(pooled)=15.1%. The same material weighted average concentration (n=289) for hsTnI was 42ng/L with the CV(pooled)=4.89%. Over the same time period we also assessed 3 different low QC lots manufactured by Abbott with the hsTnI and obtained a CV(pooled)=4.91% on the weighted average concentration of 19ng/L (n=267).CONCLUSIONS: The Abbott hsTnI assay is more analytically sensitive, precise and comparable at concentrations near the 99th percentile when compared to the cTnI assay.
B-221
Clinical Evaluation of a New Point-of-Care Device for Rapid and Accurate Measurement of Troponin I and NT-proBNP in Whole Blood or Plasma: The Samsung LABGEO IB10
S. C. Kazmierczak, D. E. Kazmierczak, B. Heaphy. Oregon Health & Science University, Portland, OR
Background: Rapid and accurate measurement of troponin and BNP in patients presenting with chest pain is critical for ensuring that the appropriate diagnosis, triage and treatment of patients can be implemented as soon as possible. It has now become the standard of care to perform these measurements in the point-of-care (POC) setting due to the extended test turnaround times often associated with measurements performed in the central laboratory.Methods: We performed a pilot evaluation of the LABGEO IB10 by Samsung using samples obtained from patients presenting to the emergency department with signs and symptoms suggestive of acute myocardial infarction. We obtained remainder whole blood samples from patients that had been originally collected for measurement of troponin I using the Abbott i-STAT®. Immediately after measurement using the i-STAT, whole blood was used to measure troponin I and NT-proBNP using the LABGEO IB10. Next, the whole blood sample was processed to obtain plasma and the plasma was used to measure troponin I and NT-proBNP on the LABGEO IB10and the Siemens Vista® analyzer. All whole blood and plasma measurements were completed within 90 minutes following collection.Results: Troponin I was measured in whole blood using the i-STAT and LABGEO IB10and plasma troponin I was measured using the LABGEO IB10and Siemens Vista analyzers. LABGEO values < 0.05 ng/mL and Vista values < 0.015 were plotted as 0.00. Whole blood troponin measured using the i-STAT and LABGEO IB10 showed slope, intercept and r2 values of 1.722, 0.1796 and 0.6245, respectively. Better correlation for troponin I was observed between the Siemens Vista and the LABGEO IB10using plasma where slope, intercept and r2 values of 1.3643, -0.4052 and 0.8846, respectively, were obtained. Correlation of plasma NT-proBNP measured using the Siemens Vista and NT-proBNP using the LABGEO IB10showed slope, intercept and r2 values of 0.8486, 192.55 and 0.667, respectively. Measurement of troponin and NT-proBNP in whole blood and plasma using the LABGEO IB10showed excellent agreement with r2 values of 0.9744 and 0.963, respectivelyConclusions: We found that the the LABGEO IB10POC analyzer produced rapid and accurate measurement of troponin I and NT-proBNP in whole blood and plasma in a POC setting. Troponin showed better correlation with the central laboratory compared with the i-STAT analyzer.
B-222
Differentiation of urinary thromboxane metabolites using LC-MS/MS explains the discordance with the AspirinWorks ELISA: implications for monitoring aspirin response.
N. V. Tolan, A. J. Lueke, C. K. Koch, A. V. Gray, A. S. Jaffe, B. S. Karon, A. K. Saenger. Mayo Clinic, Rochester, MN
Introduction: Measurement of urinary 11-dehydro-thromboxane B2 (11D-TXB2), the putative stabile metabolite of thromboxane A2, allows for assessment of aspirin responsiveness. Elevated 11D-TXB2 concentrations for patients on daily aspirin therapy is potentially indicative of persistent platelet activation and increased cardiovascular risk. However, clinical outcome differences have been observed across trials utilizing various urinary thromboxane assays. We developed a LC-MS/MS method to quantitate multiple thromboxane metabolites to determine whether additional metabolites beyond 11D-TXB2 are detected by the FDA approved ELISA method for monitoring aspirin response.Methods: We modifi ed our clinical urine 11D-TXB2 LC-MS/MS method to include quantitation of two additionally relevant metabolites of thromboxane A2: 11-dehydro-2,3-dinor-thromboxane B2 (11D-2,3D-TXB2) and 2,3-dinor-thromboxane B2 (2,3D-TXB2). In this method, acidifi ed urine samples (pH 2.0±0.2) are spiked with d4-TXB2 IS (Cayman Chemical) and ACN is added prior to on-line SPE (Cyclone MAX TurboFlow, Thermo Scientifi c) and LC separation (C-18 XBridge, Waters Corp.). Metabolites were monitored by tandem mass spectrometry (AB Sciex API 5000 MS/MS) in negative MRM mode using the following transitions: m/z 371.2/165.1 (d4-11D-TXB2), 367.2/161.2,305.2 (11D-TXB2), 339.2/137.1,115.1 (11D-2,3D-TXB2) and 341.2/141.0,167.0 (2,3D-TXB2). Measurement of urinary thromboxane was also performed by manual competitive monoclonal ELISA (AspirinWorks, Corgenix). Final thromboxane concentrations were normalized to creatinine (pg/mg

Wednesday, July 31, 9:30 am – 5:00 pm Cardiac Markers
A238 CLINICAL CHEMISTRY, Vol. 59, No. 10, Supplement, 2013
cr). Analytical performance characteristics were established and included precision, analytical sensitivity, analytical specifi city, linearity and recovery/accuracy. Urinary thromboxane was measured by ELISA and each metabolite was differentially quantitated by LC-MS/MS for 40 healthy volunteers not on aspirin therapy and 16 donors taking daily aspirin. Results were evaluated using Bland-Altman plots and linear regression analysis.Results: LC-MS/MS intra-assay precision (n=20) was <11% for 11D-TXB2 (1200-3000 pg/mL), <17% for 11D-2,3D-TXB2 (600-2000 pg/mL) and <17% CV for 2,3D-TXB2 (800-3600 pg/mL). Inter-assay precision (n=5) was <15% for 11D-TXB2 (400-3200 pg/mL), <20% for 11D-2,3D-TXB2 (300-900 pg/mL) and <9% CV for 2,3D-TXB2 (95-125 pg/mL). Linearity for each metabolite using LC-MS/MS was 50-5000 pg/mL; analytical sensitivity at 50 pg/mL (n=20) was <27% CV. ELISA intra-assay precision was <19% CV (n=18) (3000-4000 pg/mL), while inter-assay precision was determined to be <19% CV (303-4000 pg/mL). The ELISA yielded signifi cantly greater thromboxane concentrations on average for all 56 donors when compared to specifi c metabolites measured by LC-MS/MS: 11D-TXB2 (+64%), 11D-2,3D-TXB2 (+66%) and 2,3D-TXB2 (+86%). The average bias of the ELISA was reduced to +15% after combining the metabolite concentrations. However, on average a positive bias of 200 pg/mg cr persisted with the ELISA (y=0.011x+187.34 pg/mg cr, R2=0.0009). Method comparison between combined metabolite LC-MS/MS concentrations and ELISA demonstrated highly correlated results with minimal bias (slope=1.0119 and R2=0.9).Conclusions: Differences between the ELISA and LC-MS/MS thromboxane results are reduced when the thromboxane metabolites were quantitated and combined, confi rming that the AsprinWorks ELISA for 11D-TXB2 is, at minimum, a collective measure of all three metabolites. This fi nding clarifi es the signifi cant bias that exists between ELISA and LC-MS/MS methods targeting 11D-TXB2 alone in normal and aspirin-treatment populations. Further studies are warranted to investigate the correlation of these individual thromboxane metabolites with aspirin response in the context of vascular outcomes.
B-223
cadherin 5 and annexin V as circulating endothelial microparticles: prognostic markers for atherosclerotic vascular lesions in patients with chronic renal disease.
F. M. El Shanawani, A. Abdel Hadi. Theodor Bilharz Research Institute, Cairo, Egypt
Background: Endothelial dysfunction has been regarded to as an early stage in the atherosclerotic process andAim of the work: This study tries to identify circulating endothelial MPs ( such as Cadherin 5 and Annexin V ) as potential new risk factors in the occurance of cardiovascular events in patients with chronic renal diseases.Subjects and Methods: Cadherin 5 and Annexin V were measured in 20 healthy control, 25 patients of chronic renal disease without ischemic cardiovascular complications ( Group I ) and 35 patients of renal kidney disease with ischemic cardiovascular complications ( Group II ) by quantitative sandwich ELISA technique.Results: Serum Cadherin 5 was 31.69 ± 11.23 ng/ml in group I and 86.99 ± 21.51 in group II with highly statistical signifi cant difference to control group (2.63 ± 1.47) {p < 0.01}.Also group II showed highly statistical signifi cant difference when compared to group I { p < 0.01 } . Cadherin 5 recorded a high specifi city (99.96%) and sensitivity (97% ) at cut off 46.8 and area under the curve was 0.998. Serum Annexin V was 27.26 ± 11.87 ng/ml in group I and 83.73 ± 22.64 in group II with highly statistical signifi cant difference to control group (0.47 ± 0.36) {p < 0.01}. Also group II showed highly statistical signifi cant difference when compared to group I { p < 0.01 } . Annexin V recorded a high specifi city (99.88%) and sensitivity (could be evaluated by invasive methods ( e.g. catheterization ) and or non invasive methods ( e.g. circulating endothelial microparticles concentration measurement ). 94.3 % ) at cut off 39.15 and area under the curve was 0.993. Cadherin 5 and Annexin V are more sensitive than C-reactive protein ( at cut off 36.0 sensetivity was 71.4 and specifi city was 99.6 ) . A signifi cant direct correlation was found between levels of Cadherin 5 and Annexin V .An inverse correlation was found between Cadherin 5 and Annexin V in one hand and ejection fraction in the other hand in patient group. A signifi cant direct correlation was found between levels of Cadherin 5 and Annexin V in one hand and CRP & ESR in the other hand .Conclusion: Serum Cadherin 5 and Annexin V is elevated in patients with chronic kidney disease and is considered nontraditional risk factors for prediction of cardiovascular complications especially atherosclerotic ischemic heart disease thus permitting a new therapeutic strategies of cardiovascular complications in patients with chronic kidney disease .
B-227
Evaluation of the Mitsubishi Chemical Medience Corporation PATHFAST Troponin I and CKMB Assays
J. Dohnal, R. Rosecrans. NorthShore University HealthSystem, Evanston, IL
Background: The aim of this study was to evaluate the performance of the Troponin I and CKMB assays on the Mitsubishi Chemical Medience Corporation PATHFAST immunoassay analyzer.Methods: Split sample comparisons were performed over a 4-week time period using a Beckman Coulter Access2 as the comparator. Over the same time period two levels of commercially available control material were run on each day that sample analysis was performed. Additionally, aliquots of a patient sample with a value near the 99th percentile level of normal range were repeatedly analyzer over the study period.Results: The correlations between the Beckman Access2 and the PATHFAST analyzer were for Troponin I: PATHFAST = 1.27(Access2) - 0.03 R2 = 0.9628 N=71; CKMB: PATHFAST = 0.69(Access2) + 0.62 R2 = 0.9892 N = 48. The CV obtained on 12 determinations, performed over a 15-day time period, on aliquots of a patient sample with a value of 0.033 was 5.2%. CVs obtained on control material ranged from 6.9 - 10.3% for Troponin I and from 4.0 - 4.2% for CKMB. For the CKMB assay, the clinical interpretation of patient results was identical for all patients. A similar situation was seen for the Troponin I assay, except for a major discrepancy on a single patient. On this patient the Beckman Access2 result was in the low end of the reference range, while the PATHFAST result was signifi cantly elevated. This situation was seen on two separate samples from the patient over a 4-hour time period. Review of the patient chart was negative for any active cardiac disease. No explanation for the discrepancy was found. Overall, the instrument performed acceptably with no mechanical problems seen and the barcode reader being particularly robust. However, the processing speed of the on-board computer system is slow, and the response of the touch screen is poor. Additionally, the software has limited capabilities in terms of QC display and editing. The packaging for the reagents needs to be improved. All reagent cartridges are the same color, with the test names in small letters and with poor contrast between the lettering and the background.Conclusions: The analytical performance of the PATHFAST analyzer was acceptable, with CVs at least as good as those listed in the package insert. Mechanically the instrument performed acceptably, although improvement in the computer performance and in the reagent packaging would be welcome. The clinical performance of the methods appears acceptable, although additional study of the frequency of false positives with the Troponin I method is required.
B-228
Post-interventional myocardial infarction: New defi nition versus old defi nition
A. Slagman1, J. Searle1, S. Gwosc1, J. Vollert2, T. Ziera2, J. Struck2, M. Möckel1. 1Charité, Berlin, Germany, 2Brahms Thermofi sher Scientifi c, Berlin, Germany
Background: Post-interventional myocardial infarction (MI4a) was defi ned as an increase of troponin above the 3-fold 99th percentile of a healthy population (Thygesen, 2007). In the 3rd universal defi nition of MI, MI4a is defi ned as an elevated troponin above the 5-fold 99th-percentile in combination with other symptoms or signs of MI (ECG-changes, imaging-evidence; Thygesen, 2012). In this study, we applied both defi nitions of MI4a in a cohort of PCI-patients and investigated the course of copeptin values.Methods: All elective PCI-patients (n=106) were initially tested troponin-negative. Blood samples were drawn at admission, directly before and after PCI from the arterial sheath and again after 6-10h and 12-20h after PCI. A follow-up was performed after 3 months.Results:Of all patients, 22.6% (n=24) developed MI4a-2007 and 17% (n=18) MI4a-2012. Patients with MI4a (both defi nitions) had higher copeptin-values, especially after PCI. All patients who were classifi ed as MI4a-2007, but who were not defi ned as MI4a-2012 (n=6), had slightly higher median copeptin-values at all fi ve sample time-points as compared to patients with MI4a-2012 (fi gure 1). Rehospitalization during the FU period was necessary in 50% of all MI4a-patients (2007) and 33.3% of all MI4a-patients (2012).