abstractionform
DESCRIPTION
TRANSCRIPT
September 1999
Data Abstraction FormIntroduction
This data abstraction form is a standard instrument used to systematically collect data from scientific reports in development of theGuide to Community Preventive Services (the Guide). You and one other abstractor will review each paper by using this form. After members of the chapter development team reconcile any differing responses, the data from these forms will be used inevidence databases and tables. Recommendations in the Guide will be based on this evidence. The data required to fill in the formwill provide information on the intervention under study, evaluation setting and study population, outcomes, results, and studyquality.
The three sections of the form consist of Part I. Classification Information, which is filled out by the chapter development teamand reviewed and edited by the abstractors; Part II. Descriptive Information about the intervention, evaluation studycharacteristics, measurement of outcomes, and results; and Part III. Study Quality about the execution of the study. On average, itshould take you 1½ to 2 hours to read a paper and fill out the form. A note on formatting: Some of the questions are included intables or text boxes. These boxes are included to ease readability of the form, NOT to limit the amount of information you canprovide. If you need additional space, feel free to use the margins, other available space, or additional pages to write your answers.Also note that only the numbered pages (data sheets) are to be completed; the unnumbered pages (instructions) provide detailsand examples to help you respond to questions on the facing pages.
We have provided examples and commentary in italics throughout the instructions to help you do consistent reviews. However, ifany questions arise during your reviews, feel free to contact the chapter development team to clarify any issues that are confusing. .
To return the form to the Guide Development Activity, remove the staples and fax this cover sheet and the numbered pages (theright-hand pages) ONLY to the attention of the appropriate Guide staff member at 770-488-8462. Note: If you elect to mail ratherthan FAX your forms to us, copy the cover page and the numbered pages and mail those to us; retain the original form in your filesuntil the chapter development team has contacted you to review the evidence tables and reconcile any differences from those ofthe second abstractor.
Notes:1. For all multiple-choice questions, checking more than one response is acceptable and appropriate.2. Indicate page or table numbers where data are located in the paper to aid checking the information.
Tracking Information:
Topic:
Subtopic:
Intervention title:
Reviewer Name:
Tracking Number:
Citation:
Study type:G Published articleG Technical reportG Unpublished dissertation/thesis
G Abstract/presentationG Book/book chapterG Other Specify:
Part I. Classification Information DATA SHEET
September 19991
INSTRUCTIONS Part I. Classification Information
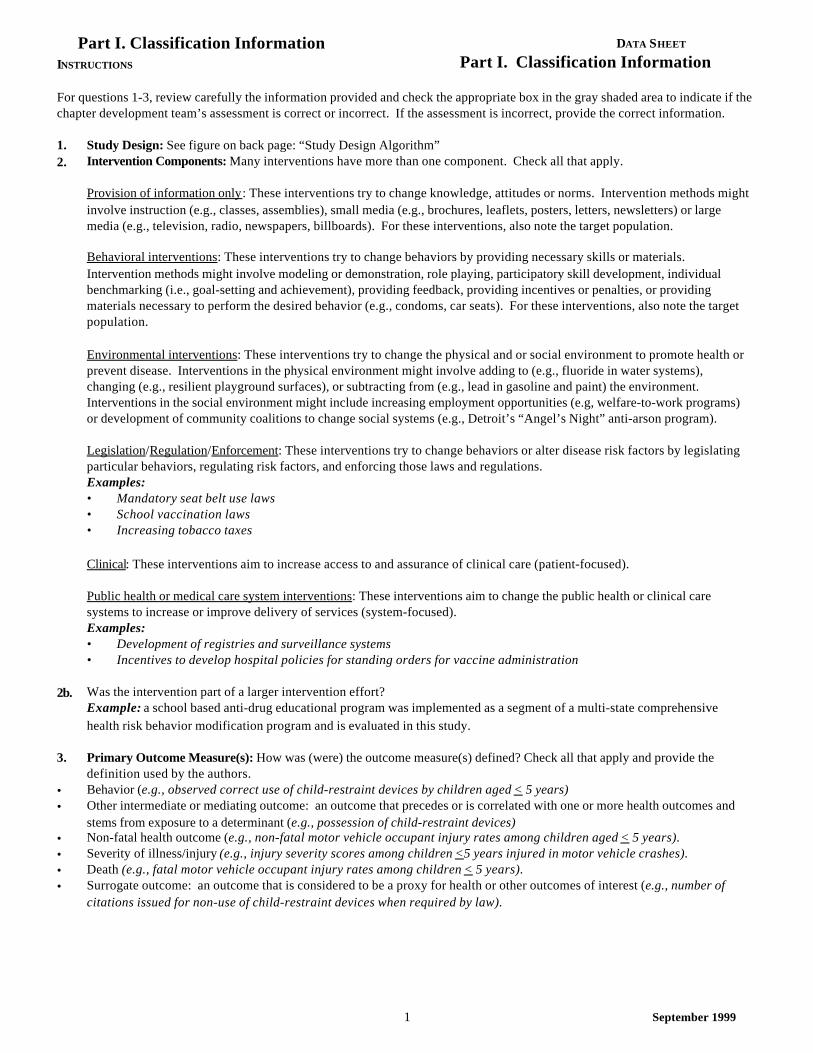
For questions 1-3, review carefully the information provided and check the appropriate box in the gray shaded area to indicate if thechapter development team’s assessment is correct or incorrect. If the assessment is incorrect, provide the correct information.
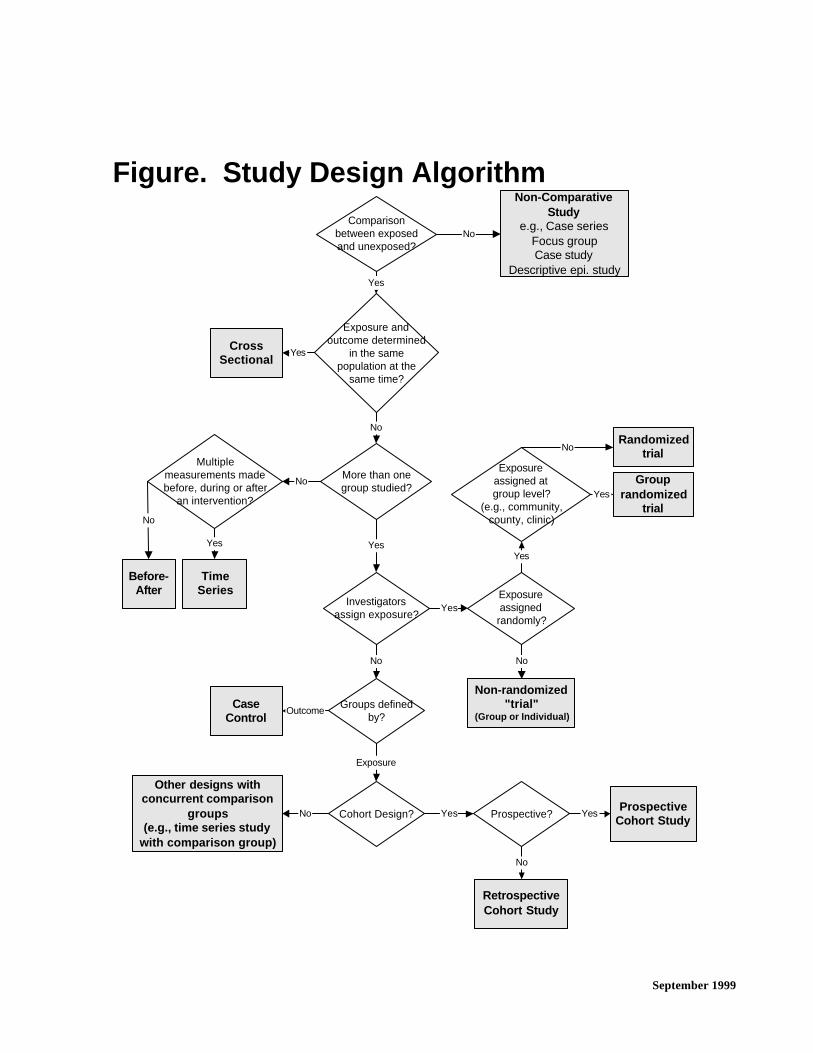
1. Study Design: See figure on back page: “Study Design Algorithm”2. Intervention Components: Many interventions have more than one component. Check all that apply.
Provision of information only: These interventions try to change knowledge, attitudes or norms. Intervention methods mightinvolve instruction (e.g., classes, assemblies), small media (e.g., brochures, leaflets, posters, letters, newsletters) or largemedia (e.g., television, radio, newspapers, billboards). For these interventions, also note the target population.
Behavioral interventions: These interventions try to change behaviors by providing necessary skills or materials. Intervention methods might involve modeling or demonstration, role playing, participatory skill development, individualbenchmarking (i.e., goal-setting and achievement), providing feedback, providing incentives or penalties, or providingmaterials necessary to perform the desired behavior (e.g., condoms, car seats). For these interventions, also note the targetpopulation.
Environmental interventions: These interventions try to change the physical and or social environment to promote health orprevent disease. Interventions in the physical environment might involve adding to (e.g., fluoride in water systems),changing (e.g., resilient playground surfaces), or subtracting from (e.g., lead in gasoline and paint) the environment. Interventions in the social environment might include increasing employment opportunities (e.g, welfare-to-work programs)or development of community coalitions to change social systems (e.g., Detroit’s “Angel’s Night” anti-arson program).
Legislation/Regulation/Enforcement: These interventions try to change behaviors or alter disease risk factors by legislatingparticular behaviors, regulating risk factors, and enforcing those laws and regulations. Examples: • Mandatory seat belt use laws• School vaccination laws• Increasing tobacco taxes
Clinical: These interventions aim to increase access to and assurance of clinical care (patient-focused).
Public health or medical care system interventions: These interventions aim to change the public health or clinical caresystems to increase or improve delivery of services (system-focused).Examples: • Development of registries and surveillance systems• Incentives to develop hospital policies for standing orders for vaccine administration
2b. Was the intervention part of a larger intervention effort? Example: a school based anti-drug educational program was implemented as a segment of a multi-state comprehensivehealth risk behavior modification program and is evaluated in this study.
3. Primary Outcome Measure(s): How was (were) the outcome measure(s) defined? Check all that apply and provide thedefinition used by the authors.
• Behavior (e.g., observed correct use of child-restraint devices by children aged < 5 years)• Other intermediate or mediating outcome: an outcome that precedes or is correlated with one or more health outcomes and
stems from exposure to a determinant (e.g., possession of child-restraint devices)• Non-fatal health outcome (e.g., non-fatal motor vehicle occupant injury rates among children aged < 5 years).• Severity of illness/injury (e.g., injury severity scores among children <5 years injured in motor vehicle crashes).• Death (e.g., fatal motor vehicle occupant injury rates among children < 5 years).• Surrogate outcome: an outcome that is considered to be a proxy for health or other outcomes of interest (e.g., number of
citations issued for non-use of child-restraint devices when required by law).
September 19992
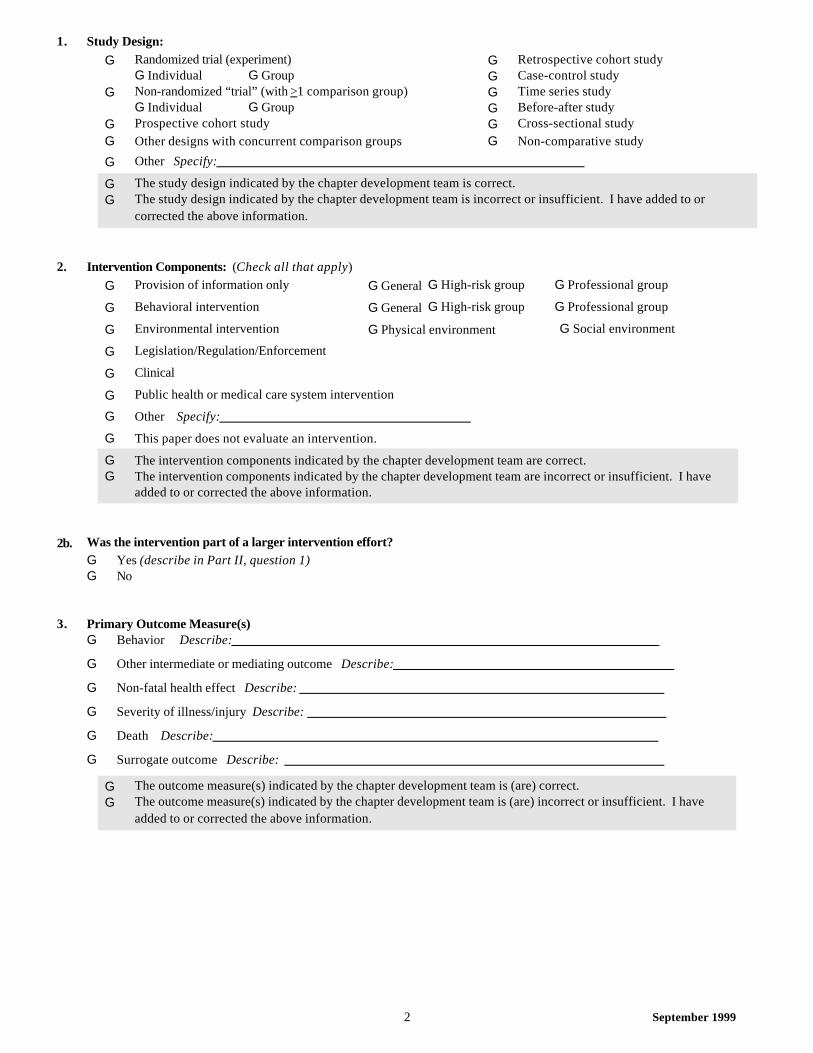
1. Study Design:G Randomized trial (experiment)
G Individual G GroupG Non-randomized “trial” (with >1 comparison group)
G Individual G GroupG Prospective cohort study G Other designs with concurrent comparison groups
G Retrospective cohort studyG Case-control studyG Time series studyG Before-after studyG Cross-sectional studyG Non-comparative study
G Other Specify:
G The study design indicated by the chapter development team is correct.G The study design indicated by the chapter development team is incorrect or insufficient. I have added to or
corrected the above information.
2. Intervention Components: (Check all that apply)G Provision of information only G General G High-risk group G Professional group
G Behavioral intervention G General G High-risk group G Professional group
G Environmental intervention G Physical environment G Social environment
G Legislation/Regulation/Enforcement
G Clinical
G Public health or medical care system intervention
G Other Specify:
G This paper does not evaluate an intervention.
G The intervention components indicated by the chapter development team are correct.G The intervention components indicated by the chapter development team are incorrect or insufficient. I have
added to or corrected the above information.
2b. Was the intervention part of a larger intervention effort?G Yes (describe in Part II, question 1)G No
3. Primary Outcome Measure(s)G Behavior Describe:
G Other intermediate or mediating outcome Describe:
G Non-fatal health effect Describe:
G Severity of illness/injury Describe:
G Death Describe:
G Surrogate outcome Describe:
G The outcome measure(s) indicated by the chapter development team is (are) correct.G The outcome measure(s) indicated by the chapter development team is (are) incorrect or insufficient. I have
added to or corrected the above information.

September 1999
INSTRUCTIONS Part II. Descriptive InformationA. Description of the Intervention1. Use the following parameters to describe the intervention. The requested information might not be reported in the paper; if
so indicate whether it is “Not available” or “Not applicable.” Provide as much of this information as possible, and includeother relevant aspects of the intervention as necessary.• What is the proposed intervention? Describe the level or scale of focus (i.e., individual, family, group, community, or
general public). Describe the services, materials, and other information that were delivered, or the policy or law that wasenacted (include information about enactment, implementation, and enforcement).
• How is the intervention being delivered? Describe who delivered the intervention (e.g., health professional, volunteer,peer), how they were trained, and how they were assigned. Describe how the target population learned about theintervention. Describe the time period, frequency, and duration of the intervention. Describe the scope of theintervention (i.e., how many members of the target group(s) were reached by the intervention). Describe the extent ofcoordination with other agencies/organizations and the target community.
• Who is being targeted? Again, this might be broader than the population that was studied in the evaluation; brieflydescribe the characteristics of the target population.
• Where is the intervention being delivered? The intervention might be delivered in a particular type of setting orcommunity-wide. This parameter should be described for the intervention as it was implemented, which might be in asetting broader than that which was studied in the evaluation.
Examples: • What: Individual parents received 1 or 2 personalized postcard reminders signed by their pediatrician to remind
them their children were due for MMR vaccination and to present the adverse health consequences of beingunvaccinated. If no response was made to postcard reminders, a public health nurse made up to 3 attempts to visitthe family at their home to provide vaccination; How: pediatricians and other office staff, monthly from 1986-88, allpatients in 4 practices; Who: parents of children aged 0-2 years; Where: 4 pediatricians’ offices in southernCalifornia and patient homes.
• What: Community-level (county) policy for surfaces of intervention playgrounds to be covered with pine straw to adepth of 6" in a radius of 9' from every piece of climbing equipment; How: county school board policy instituted on7/1/83; Who: children aged 3-9 years; Where: all pre-K through elementary schools in 1 county.
• What: Community-level (state) requirement that families provide documentation signed by physician that childrenreceived at least 5 doses of DTP vaccine, 4 doses of OPV vaccine, and 1 dose of MMR vaccine prior to kindergartenentry. Children without such documentation were prohibited from attending school; How: state law enacted 4/1/82;enforcement began 8/1/82; Who: parents of children entering kindergarten; Where: Ohio.
• What: Community-level (school)10-hour education program for resistance to drug use. Curriculum includedinformation about consequences of drug use, correction of beliefs about the prevalence of drug use, counteraction ofcommunity norms promoting drug use, practice of pressure resistance, and a public commitment to avoid drug use. Teaching methods included peer teaching, modeling and role playing, and feedback and peer involvement. Coursecontent approved by local PTA and police; How: peers (12th grade students with 4 hours of training) andprofessional health teachers, required class offered each of 3 terms, 1994-95 school year; Who: 12th grade students;Where: John Doe High School, Peoria, Illinois. Other: program implemented as part of a multi-state, multi-component health risk behavior modification program.
2. Did the authors describe the formative research, theoretical basis(es), or construct(s) upon which the intervention wasdeveloped? If so, provide as much information as necessary to identify the relevant theory.
3. What type of organization implemented the intervention (i.e., directly interacted with the population under study, notorganizations that might have provided scientific or financial support)? Check all that apply.
4. Describe any intervention(s) deliberately or inadvertently applied to the comparison or control group(s). Indicate the pagewhere this information is found. If the study did not have a comparison or control group, or had a comparison group towhich no intervention was applied, skip to question 5.
Examples:• Families in the comparison group received usual care, which involved a 1-page handout written in English or Spanish
describing the potential hazards of deteriorating lead-based paint.• Families attending the comparison clinic did not receive an intervention as part of the study; however, in Minneapolis and
unrelated to the study, during the study period weekly 30-second televised public service announcements were airedencouraging women aged 40 years and over to have annual mammography.

September 19992
Part II. Descriptive Information DATA SHEET
A. Description of the Intervention1. What:
How:
Who:
Where:
Other:
2. Theory described?G Yes Describe: G No
3. Type of organization (Check all that apply)
G Managed care organizationG Other clinical organization G Academic organizationG Community-based organization
G Public health agency: G Federal G State G Local Specify:
G Other governmental agency: G Federal G State G Local Specify:
G Other Specify:
G Unknown G Does not apply
4. Interventions for a comparison or control group(s):G No comparison groupG No intervention for comparison group (purposefully or inadvertently)G Intervention applied to comparison group Describe:

September 1999
INSTRUCTIONS Part II. Descriptive Information
B. Evaluation Study Characteristics (These questions refer specifically to the setting and population that were studied in the evaluation of the intervention.) Place and Time5. Location: Where was the study done? Specify the city, state, region, etc.
6. Population density: Was the study done in an urban, suburban, or rural setting?• Check the appropriate box AS DESIGNATED BY THE AUTHORS.• Check "Mixed" ONLY if the intervention was applied to the entire population of a large geographic area that likely
covers urban, suburban, and rural settings.• If the authors do not state the population density but do provide ancillary information that allows you to make that
determination (e.g., population size, description of the setting, and other community characteristics), use your bestjudgment to check one of the boxes.
• If you are unsure about the population density, but the authors report the population size or other information, includethat information in the margin without checking one of the boxes.
• Check "Not reported" if the authors do not provide sufficient information about the community to determine thepopulation density.
7. What was the setting in which the intervention was implemented for the purposes of conducting the study? Check all thatapply. This might be the same as or a subset of the settings in which the intervention was implemented as described inquestion 1.
Examples: • Legislation was implemented state-wide. Check “community-wide” and write in “state.”• An intervention was implemented in schools, shopping malls, and worksites throughout a county. The evaluation of its
effectiveness, however, was limited to the schools. Check “schools.”
8. How were outcome and other independent (or predictor) variables measured? Check all that apply. See Part I/ Question 3 forrelevant outcome measures. Provide information on observer or interviewer training and blinding, as well as inter-observeragreement as appropriate.
Response Option Examples or Definitions
Resource utilization Hours of media exposure or number of reminders distributed
Observation Self-explanatory
Interview Telephone or in-person interview
Self-administered questionnaire Any written questionnaire that is completed by study participants
Laboratory test Serum or urine drug levels to assess compliance with drug therapy
Record review Self-explanatory
Other
Not reported/Did not assess Self-explanatory
Example: The study reported observed correct use of child-restraint devices, using trained but unblinded observers. Inter-observer agreement was performed. Check the response option “Observation” and provide the following: “Correct usedefined as child-restraint device tethered to automobile seat with child appropriately harnessed. Observers trained, notblinded. Inter-observer agreement for use = 93% and for estimated age of the child = 83%,k = .76, and .64, respectively.”
9. Where were outcomes and other variables assessed? If this was the same as the intervention setting, check “same.” Ifdifferent, describe using the same categories as in question 7.
Example: The intervention was implemented in clinics, but measured at observation sites throughout the community. Check “Different from the intervention setting” and write in “community-wide.”
10. Over what time period (include dates) and at what intervals were outcomes and other variables measured?Example: The study measured self-reported smoking behavior at 3-month intervals for 2 years after the intervention fromJanuary 1986 to December 1987.

September 19994
Part II. Descriptive Information DATA SHEET
B. Evaluation Study Characteristics
Place/Time5. Location:
G USA G Otherindustrialized country G Developing country
6. Population density (Check all that apply)G Urban G Suburban G Rural G Mixed G Not Reported
7. Setting (Check all that apply)
G HospitalG Clinic or health-care provider officeG Nursing homeG Child day care centerG Drug treatment facility
G Mental health settingG Community-based organizationG SchoolG WorkplaceG Religious institution
G HomeG PrisonG StreetG ShelterG Community-wideDescribe: __________
G Other setting Specify: G Does not apply
8. How were outcomes and other independent (or predictor) variables measured?
G Resource utilization Describe:
G Observation Describe:
G Interview Describe:
G Self-administered questionnaire
Describe:
G Laboratory test Describe:
G Record review Describe:
G Other Describe:
G Not reported/Did not assess
9. Where were outcomes measured?[ ] Same as intervention setting[ ] Different from intervention setting Describe:
10. Time period and intervals outcome(s) measured?

INSTRUCTIONS Part II. Descriptive Information
Person (Study Population) (i.e., intervention and comparison populations) See instructions for question 14 to differentiate the study population from other groups for whom demographic information orresults might be reported in the paper.
11a. Describe the eligibility criteria required to enter into the study population.
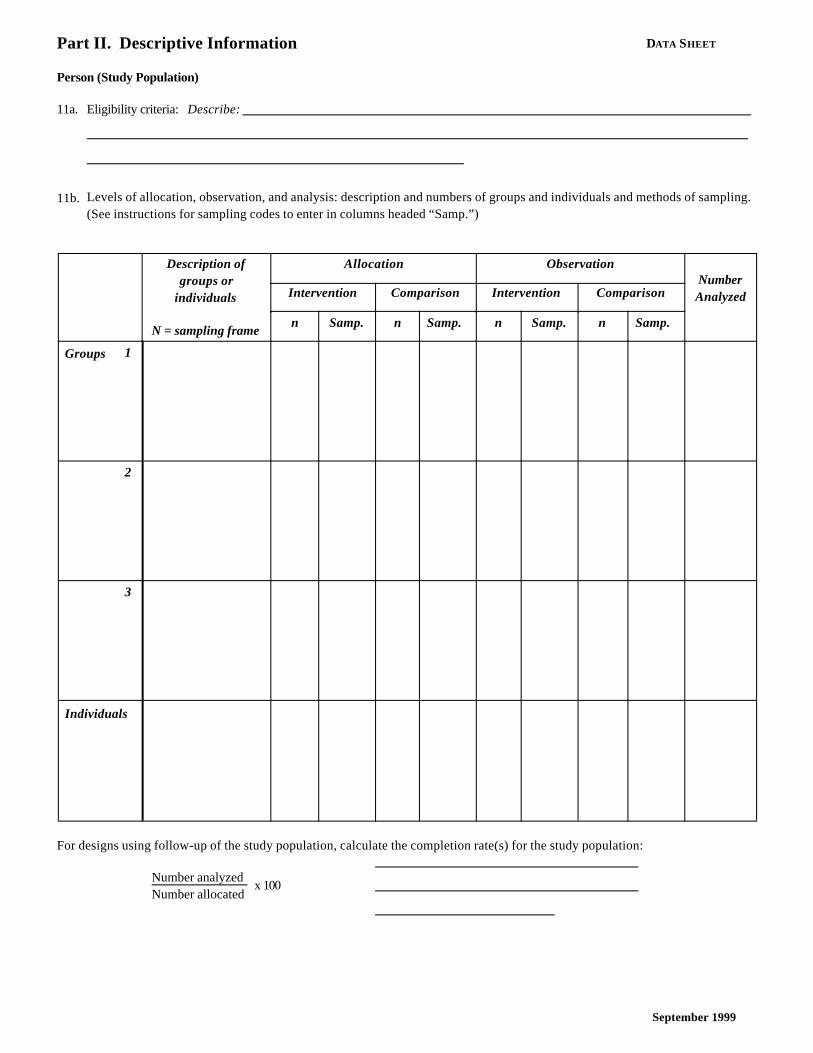
11b. For studies in which the investigator allocated subjects to intervention/comparison groups, describe the groups orindividuals who were allocated and the total number eligible for inclusion in the study (N = sampling frame). Of thoseeligible, provide the numbers of groups/or individuals who were allocated. Also provide descriptions of the groups orindividuals who were observed and included in analyses and provide the numbers of groups or individuals who wereobserved and included in analyses. For observational studies in which the investigators did not allocate intervention andcontrol conditions, describe the groups or individuals who were observed and included in the analysis; enter NA in theallocation columns for these studies. Many study designs have samples selected or make measurements at multiple points intime; include this information if it is provided. (See first example, below.)
Use the following sampling codes in the columns headed “Samp.” under Allocation and Observation:
E = Entire eligible populationP = Probability sampleC = Convenience/self-selected sample
NR = Not reportedNA = Not applicable
Example: One community received a child-restraint-device distribution program through the community clinic. Neighboring community: nointervention. Mothers of all eligible children in each community interviewed regarding child-restraint-device use when children 3 and 13 monthsold; all individuals with complete data were included in analysis of the 2 groups.
Description of groupsor individuals
N = sampling frame
Allocation ObservationNumberAnalyzed
Intervention Comparison Intervention Comparison
n Samp. n Samp. n Samp. n Samp.
Groups 1 CommunitiesN = undefined
1 C 1 C 1 E 1 E 2
2
3
Individuals Child MV occupants 3 mo. N = 635 13 mo. N = 510
336276
EE
214182
EE
Example: Investigators conducted a time series analysis on all reports of child motor vehicle crash injuries from a state-wide accident reportingsystem from 1979 through 1986; a mandatory child-restraint-use law was enacted in 1983. Data were analyzed for all children identified in thedatabase with complete information about injuries and restraint use.
Description of groupsor individuals
N = sampling frame
Allocation ObservationNumberAnalyzed
Intervention Comparison Intervention Comparison
n Samp. n Samp. n Samp. n Samp.
Groups 1 NA NA
2
3
Individuals Injured childrenN = 10,132
5,021 E 5,111 E 10,132
Example: Investigators randomly allocated all 50 clinics serving high-risk populations in a community (of 150 total clinics serving allpopulations) to either intervention or comparison groups. Intervention clinic physicians were provided with an educational intervention designedto improve vaccination rates. Because of resource constraints, 5 randomly selected clinics in each group were observed for results and analysis. Vaccine coverage was collected from individual patient charts; coverage rates were calculated for the two groups overall (intervention vs.comparison) and grouped by clinic and attending physician.
Description of groupsor individuals
N = sampling frame
Allocation ObservationNumberAnalyzed
Intervention Comparison Intervention Comparison
n Samp. n Samp. n Samp. n Samp.
Groups 1 Clinics, N = 50 25 E 25 E 5 P 5 P 2 Int v Com10 clinics
2 Physicians, N = 22 10 E 12 E 22
3
Individuals
September 1999
Part II. Descriptive Information DATA SHEET
Person (Study Population)
11a. Eligibility criteria: Describe:
11b. Levels of allocation, observation, and analysis: description and numbers of groups and individuals and methods of sampling.(See instructions for sampling codes to enter in columns headed “Samp.”)
Description ofgroups or
individuals
N = sampling frame
Allocation ObservationNumberAnalyzedIntervention Comparison Intervention Comparison
n Samp. n Samp. n Samp. n Samp.
Groups 1
2
3
Individuals
For designs using follow-up of the study population, calculate the completion rate(s) for the study population:
Number analyzedNumber allocated
x 100
September 19995
INSTRUCTIONS Part II. Descriptive Information
12. How did the investigators assess whether exposure to the intervention actually occurred? See question 8 for additionalexamples of terms. Provide the definition of the exposure variable(s) as described by the authors and the level of exposure tothe intervention. If exposure was different in different subgroups, report the exposure for each group separately. Check allthat apply.
Example: Exposure of mothers to a prenatal or postpartum intervention was assessed by resource utilization: 20% ofmothers in the community attend prenatal classes at a clinic; 95% of mothers receive a postpartum home visit.
13. Provide all of the requested demographic and risk factor information for the intervention and comparison segments of thestudy population; baseline data are preferred. Provide page/table numbers for this question. Provide information for thestudy population as a whole only if the authors do not report the data for the intervention and comparison groups separately. In this situation, calculate the proportions for the intervention and comparison populations if sufficient information isprovided by the authors. If the authors provide only descriptive information about the reference population (i.e., thepopulation from which the study population was drawn) instead of the study population, provide that data (see thirdexample, below). If the authors report demographic and risk factor information for more than four groups, duplicate this pagefor additional space. For each variable, provide the p value or confidence interval for the difference between groups ifavailable in the last column (enter “NS” if not significant, “NR” if not reported, or “NA” if not applicable).
At the top of each column, describe the group for which you are providing the demographic information.
Examples:• The authors implemented an intervention in one school (n = 300 students) and used a second school as a comparison (n =
295); they provided separate demographic information for the intervention and comparison schools. Enter “Interventionschool” and “Comparison school” at the tops of the two columns and fill in the appropriate data.
• The authors implemented an intervention in one school (n = 300 students) and used a second school as a comparison (n =295), but only provided demographic information for the two groups as a whole (n = 595). Enter “Entire studypopulation, n = 595" at the top of the column.
• The authors implemented an intervention in one school (n = 300 students) and used a second school as a comparison (n =295), but did not provide demographic information for the students participating in the study. Instead, the authorsdescribe the demographics of the community in which the schools are located. Enter “Reference population only” and anydescriptive information about the community for which data are provided.
Age: Provide median/range, mean/standard deviation, other measure of central tendency or “not reported.” Ifcategories are used, provide the categories and the percent of the study population in each category. Ifa proxy for age such as school grade is presented, indicate the range and the units.
Sex: Provide the percent male, female, and/or unknown; or “not reported”
Race/Ethnicity: Provide the percentage for each race/ethnic group or check “not reported” if the authors do not providethis information. If information is provided for part of the population, but not reported for someproportion, check all that apply including the “Other/Unknown” category and specify the proportionunknown. If information is unknown, circle “Unknown”; if the response is other, circle “Other” andspecify.
Socioeconomicstatus: Check “low,” or “middle/upper,” as reported by the authors or “not reported.” Use reasonable
judgement to select a category if the authors provide ancillary information (e.g., educational attainment).
Other: Provide any other demographic or risk factor information reported by the authors.
Examples: migrant status, educational attainment, occupation, risk behavior categories (e.g., men who have sex with men,drivers with criminal convictions for alcohol-impaired driving), and other potential confounding factors.
September 19996
Part II. Descriptive Information DATA SHEET
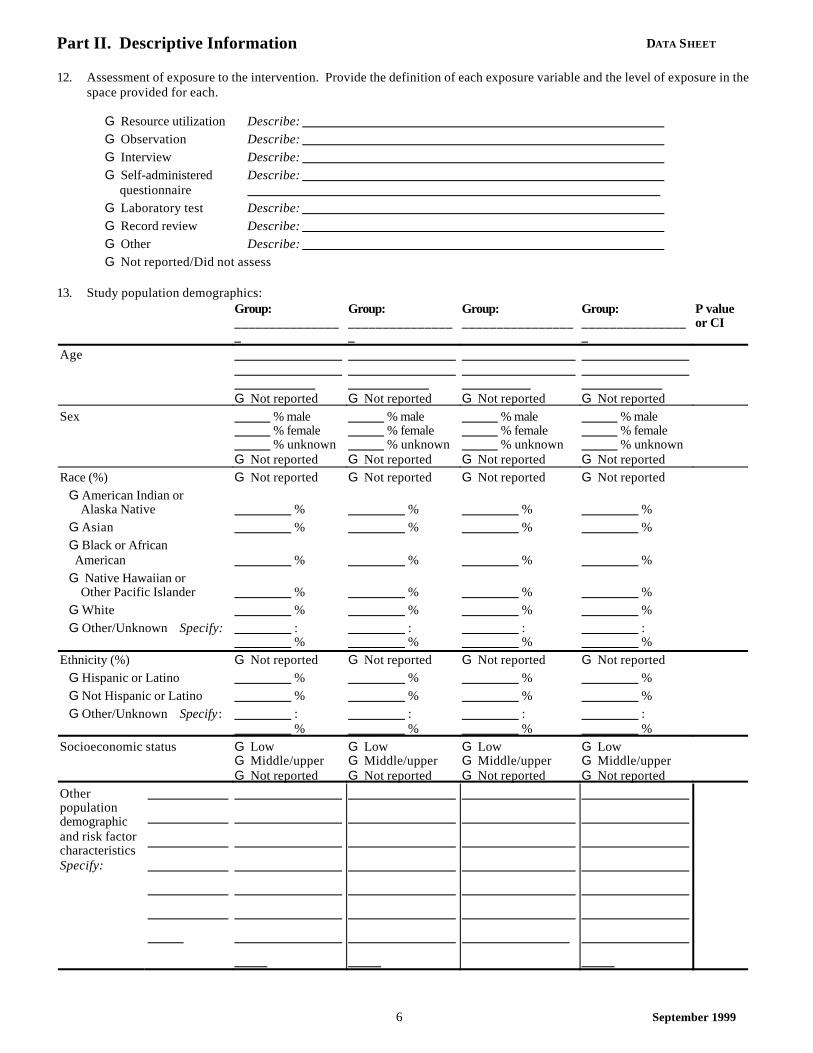
12. Assessment of exposure to the intervention. Provide the definition of each exposure variable and the level of exposure in thespace provided for each.
G Resource utilization Describe: G Observation Describe: G Interview Describe: G Self-administered questionnaire
Describe:
G Laboratory test Describe: G Record review Describe: G Other Describe: G Not reported/Did not assess
13. Study population demographics:Group:________________
Group:________________
Group:________________
Group:________________
P value or CI
Age G Not reported
G Not reported
G Not reported
G Not reported
Sex % male % female % unknownG Not reported
% male % female % unknownG Not reported
% male % female % unknownG Not reported
% male % female % unknownG Not reported
Race (%) G Not reported G Not reported G Not reported G Not reported G American Indian or Alaska Native % % % % G Asian % % % % G Black or African American % % % % G Native Hawaiian or Other Pacific Islander % % % % G White % % % % G Other/Unknown Specify: :
% : %
: %
: %
Ethnicity (%) G Not reported G Not reported G Not reported G Not reported G Hispanic or Latino % % % % G Not Hispanic or Latino % % % % G Other/Unknown Specify: :
% : %
: %
: %
Socioeconomic status G LowG Middle/upperG Not reported
G LowG Middle/upperG Not reported
G LowG Middle/upperG Not reported
G LowG Middle/upperG Not reported
Otherpopulationdemographicand risk factorcharacteristicsSpecify:

September 1999
INSTRUCTIONS Part II. Descriptive Information
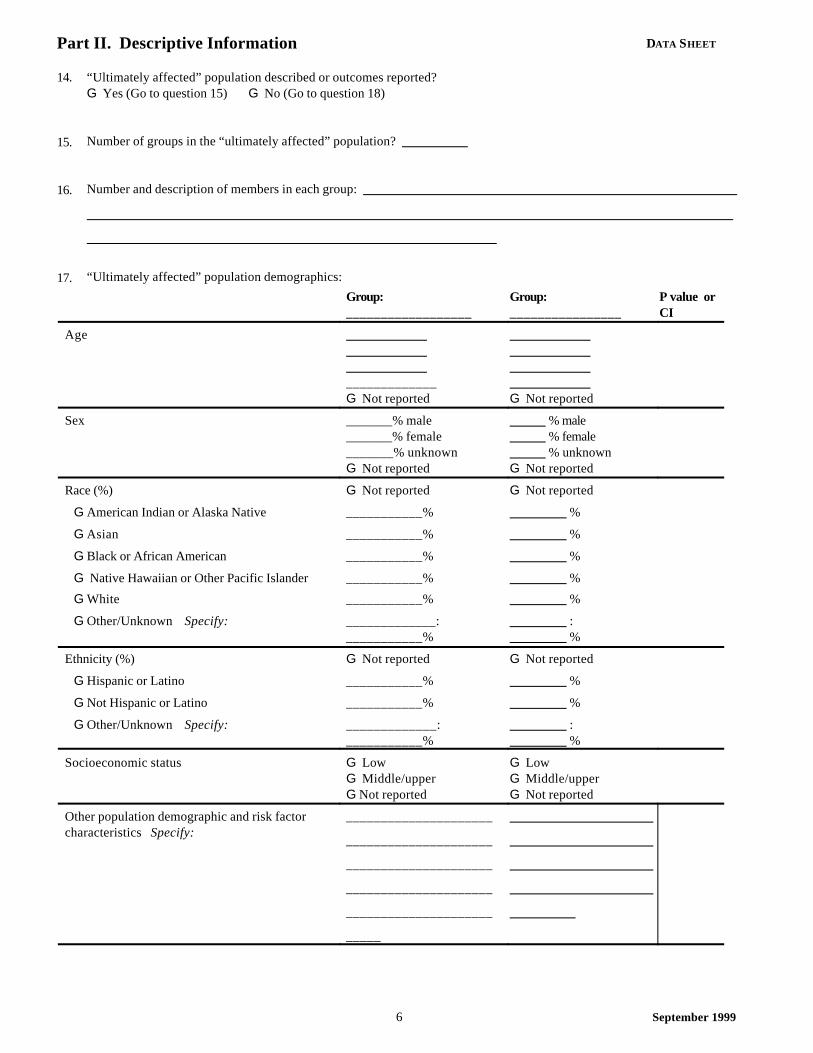
14. Some interventions are directed at a specific study population, but ultimately affect health or other related outcomes (e.g.,behaviors) that are measured in a different population. For example, a provider education intervention is directed at healthcare providers (the “study population”), but the health outcome occurs in their patients (the “ultimately affected”population). Another example is when an educational intervention directed at parents (the “study population”) ultimatelyaffects their children (the “ultimately affected” population). Does this study report demographic information for ormeasure an outcome in a population of persons who were ultimately affected by the intervention applied to the studypopulation? If no, skip to question 18.
Examples: • A professional education intervention about the indications and contraindications for childhood immunizations was
administered to half of the physicians in a group practice (the other half served as controls). The researchers measuredvaccine coverage rates in the children served by the practice. The researchers presented demographic information forthe physicians (i.e., the study population) AND for the children (i.e., the ultimately affected population). Report thedemographic information for the physicians in question 13 and for the children in questions 14-17.
• If the intervention was implemented in and the effects measured in the same group of people, the answer to this questionis “no.”
15. How many groups were in the “ultimately affected” population?
16. Indicate the number of members in each of the “ultimately affected” population groups, and describe those members.
17. Provide all of the requested demographic information for the “ultimately affected” population. See instructions forquestion 13 for details.
September 19996
Part II. Descriptive Information DATA SHEET
14. “Ultimately affected” population described or outcomes reported?G Yes (Go to question 15) G No (Go to question 18)
15. Number of groups in the “ultimately affected” population?
16. Number and description of members in each group:
17. “Ultimately affected” population demographics:
Group:__________________
Group:________________
P value orCI
Age _____________ G Not reported
G Not reported
Sex _______% male_______% female_______% unknownG Not reported
% male % female % unknownG Not reported
Race (%) G Not reported G Not reported
G American Indian or Alaska Native ___________% %
G Asian ___________% %
G Black or African American ___________% %
G Native Hawaiian or Other Pacific Islander ___________% %
G White ___________% %
G Other/Unknown Specify: _____________: ___________%
: %
Ethnicity (%) G Not reported G Not reported
G Hispanic or Latino ___________% %
G Not Hispanic or Latino ___________% %
G Other/Unknown Specify: _____________:___________%
: %
Socioeconomic status G LowG Middle/upperG Not reported
G LowG Middle/upperG Not reported
Other population demographic and risk factor characteristics Specify:
_____________________
_____________________
_____________________
_____________________
_____________________
_____

September 1999
INSTRUCTIONS Part II. Descriptive Information
C. Results18. Primary study results: From Part I/Question 3 of this form, describe each of the primary outcome measures used in this
study and the effect measure as reported by the author. Indicate the table number (in the paper) from which the data aretaken, if applicable. For each outcome measure, report the results for each arm of the intervention group (as applicable)and for each of the comparison groups (as applicable); report the results for each time period measured as applicable to thestudy design (i.e., before and after the intervention, only after the intervention, for each time period in a time series design). Fill in the time periods as shown.
Examples:
Outcome measure (List from Part I/Question 10and describe effect measure
in numbered row)
Effect size reported by authorsSoftware used,
hypothesistesting,
p values, CI, etc.
Studies with pre - postmeasurements
Studies with multiple measurements over time
PreOct 77
PostOct 78
Time 1Mar 80
Time 2Apr 80
Time 3May 80
Time 4Jun 80
1a. Prevalence rates of self-reported child restraint device use (baseline rate is pre-intervention rate[Oct ’77] for comparison group). Table 3, page 22 in the paper.
Intervention arm1 versuscomparison:?2 = xx, p = xx
Intervention arm2 versuscomparison:?2 = xx, p = xx
Intervention Arm 1Intervention Arm 2Intervention Arm 3
50%45%
75%68%
Comparison Group 1Comparison Group 2Comparison Group 3
50% 50%
1b. Validation of 1a using observed rates of child restraint device use (baseline rate is pre-intervention rate [Oct ’77] for comparison group). Table 2, page 22 in the paper.
Intervention arm1 versuscomparison:?2 = xx, p = xx
Intervention arm2 versuscomparison:?2 = xx, p = xx
Intervention Arm 1Intervention Arm 2Intervention Arm 3
49%49%
70%62%
Comparison Group 1Comparison Group 2Comparison Group 3
45% 53%
2. Vaccine coverage rates for children over time (March ’80 = baseline rate, intervention appliedbefore time 2; no comparison group). Table 1, page 1543 in the paper.
SAS (Proc freq)Change ininterventiongroup time 4versus time 1(baseline): ?2 = xx, p = xx
Intervention Arm 1Intervention Arm 2Intervention Arm 3
44% 46% 76% 56%
Comparison Group 1Comparison Group 2Comparison Group 3
3. Percent of students self-reporting drinking and driving. Table 3, page 29 in paper. EpiInfoIntervention arm1 versuscomparison: ?2 = xx, p=xx
Intervention arm2 vs comparison: ?2 = xx, p=xx
Intervention Arm 1Intervention Arm 2Intervention Arm 3
NANA
13%16%
Comparison Group 1Comparison Group 2Comparison Group 3
NA 29%
19. Did the authors conduct a power analysis, discuss other statistical procedures, or cite other literature to determine theappropriate sample size PRIOR to implementation of the intervention? If no, IN YOUR OPINION, was the sample sizesufficient to find the desired effect? Provide a brief justification of this determination.
Example: Study included interviews with 98% of women with live births in 2 communities and conducted follow-up with80% of the original study population. Sample sufficient to find a relatively small effect.

September 19997
Part II. Descriptive Information DATA SHEET
C. Results18. Primary study results.
Outcome measure (List from Part I/Question 10and describe effect measure
in numbered row)
Effect size reported by authorsSoftware used,
hypothesistesting,
p values, CI, etc.
Studies with pre - postmeasurements
Studies with multiple measurements over time
Pre
_______
Post
_______
Time 1
______
Time 2
______
Time 3
______
Time 4
______
1.
Intervention Arm 1Intervention Arm 2Intervention Arm 3
Comparison Group 1Comparison Group 2Comparison Group 3
2.
Intervention Arm 1Intervention Arm 2Intervention Arm 3
Comparison Group 1Comparison Group 2Comparison Group 3
3.
Intervention Arm 1Intervention Arm 2Intervention Arm 3
Comparison Group 1Comparison Group 2Comparison Group 3
4.
Intervention Arm 1Intervention Arm 2Intervention Arm 3
Comparison Group 1Comparison Group 2Comparison Group 3
19. Power calculation, other statistical analysis, or citation?[ ] Yes[ ] No; was sample size sufficient? (Justification):
September 1999
INSTRUCTIONS Part II. Descriptive Information
20. Were secondary results of interest reported (including subpopulation differences, dose-response relationships, or others)? If yes, describe those results. Include page and table numbers.
Examples:• The effect was stronger among African-American children (the postcard reminder resulted in 70% of children being up
to date on immunizations at age 2 years compared to 20% of children who received “usual care.”)• The intervention had less effect among white children where 40% of children who did and did not receive the
intervention were up to date on immunizations at age 2 years).
D. Feasibility and Other Key Issues Addressed in the Paper
21. Which of the following feasibility and other key issues were addressed in the paper? To flag issues that might be ofimportance in describing the intervention or its implementation, check off any of the following issues that are described bythe authors. This will assist the chapter development team in quickly identifying papers that address these issues. Checkall that apply. Include the page numbers where this information can be found in the paper.
• Costs of the intervention (include monetary, nonmonetary or human resources)• Potential harms of the intervention (includes health and social consequences)• Other benefits• Implementation of the intervention• Barriers to implementation• Community acceptance or involvement in development or implementation of the intervention• Formation or use of existing coalitions to develop, implement, or evaluate interventions• Ethical constraints• Other• Not discussed (i.e., no other data were presented)
22. In the space provided, include any other information that you feel we should be aware of or that will aid you in evaluatingthe quality of the intervention in the next section of this form. Example: Some evaluations may be able to measure howthe intervention was monitored (e.g., fidelity, quality assurance). Describe such efforts here.
23. Identify references from the reference list that might be related to the particular intervention, subtopic, or topic that is thefocus of this review. Provide this information by circling or highlighting the relevant references directly on a photocopy ofthe references pages from the paper and returning it with this form or by listing the reference numbers (or the author andyear) from the reference list in the space provided.
Example: During a review about the effectiveness of patient reminders in improving vaccine coverage, a reference aboutpatient reminders to improve measles vaccine coverage would be directly relevant, but references about efficacy of vaccine oreffectiveness of community education in improving vaccine coverage, or about burden of measles disease in the U.S. wouldnot be directly relevant.

September 19998
Part II. Descriptive Information DATA SHEET
20. Secondary results G Yes G Not reported
If yes, specify:
E. Feasibility and Other Key Issues Addressed in the Paper
21. G Costs
G Potential harms
G Other benefits
G Implementation
G Barriers to implementation
G Community acceptance or involvement
G Formation or use of existing coalitions to develop, implement, or evaluate interventions
G Ethical constraints
G Other Describe:
G Not discussed
22. Other important information:
23. Relevant references:

September 1999
This page was intentionally left blank.

September 1999
Part III: Study Quality Instructions
Study quality is evaluated using six categories of common problems (Descriptions, Sampling, Measurement, Analysis,Interpretation of Results, and Other). Study validity poses a complex problem when evaluating the quality of studies. It ispossible that elements of each of the 6 categories contribute to problems with study validity. Therefore, we have tried to elicitinformation in each category that may contribute to poor study validity which potential limit our ability to interpret the results ofthe study.
Some problems with a study can be included under several of the categories. Use your best judgement to list the problem underthe MOST appropriate category.
Example: Students at schools that had an intensive educational program to reduce drug use could have been lesslikely than other students to report drug use (independent of actual use). This problem could be marked as alimitation of this study under the category “Measurement” because of problems with the validity and reliability ofself-reported outcomes. Alternatively, this problem could be marked as a limitation of the study under the category“Interpretation of Results” because of poor randomization, other activities ongoing in the schools, uncontrolleddifferences in the intervention and comparison populations prior to implementation of the intervention, etc. Thereviewer must decide if one or both of these categories are limited based on the information provided in the paper. Ifquestions arise, err on the side of providing more information and checking the maximum number of categories.
The relative merits of different study designs will be considered separately from the quality of execution of the study. Thus,given that the study you reviewed has a particular study design (Part I/Question 8), answer these questions based on the qualityof execution of this study’s design, NOT whether this was the best possible study design that could have been used.
One or more questions are posed for each of the first five study quality categories. Each question is designed to elicitinformation about potential limitations in the quality of a study. In the column to the right of each question, the numberscorresponding to items in Part II of this form relevant to answering that question are provided. Answers that suggest qualitylimitations are labeled “limitation.” Potential quality limitations for a question should be noted if they are of sufficientmagnitude to diminish your confidence in the results.
Briefly explain each of your assessments in the space provided; always provide comments for limitations of a question. Ifpossible, the impact of the limitation on the results should be estimated. (e.g., a study in which many members of the controlgroup received an intervention that was similar to that offered to the intervention group would probably underestimate anyreported effect of the intervention).

September 1999
INSTRUCTIONS Part III. Study Quality
Note: When it appears as a response option, N/A=Not Applicable.
EXPLAIN ALL ASSESSMENTS!
1. Descriptions Cross-Reference
A. Was the study population (i.e., the intervention and comparison population) well described? The study population should be described by time (e.g., when the study population received theintervention), place, and person. Information about “person” should include at least age (for allstudies) and should include other relevant characteristics of participants that are key to aparticular study (e.g., SES, gender, other). Important potential confounding factors should alsobe described.
II/1, 5, 6, 11a/b, 13
B. Was the intervention well described? The intervention should be described in terms of whatwas done, how it was delivered, who was targeted, and where it was done.
II/1, 2, 3, 4
2. Sampling Cross-Reference
A. Did the authors specify (i.e., describe characteristics and size of) the sampling frame or universeof selection for the study population?
II/1, 11b
B. Did the authors specify the screening criteria for study eligibility (if applicable)? II/1, 11a
C. Was the population that served as the unit of analysis the entire eligible population or aprobability sample at the point of observation?
To answer this question follow these steps:1. Using question 11b in Part II (page 4) refer to the column “Number analyzed” to identify the
unit(s) of analysis(es).2. The question refers to the sampling method (“Samp.”) under the column labeled
“Observation” for that unit of analysis. If the sampling method is “E” or “P” the answer tothis question is “Yes;” otherwise, the answer to this question is “No.”
II/11b
D. Are there other selection bias issues not identified above? This might include a very lowparticipation rate (or a high refusal rate), an all-volunteer sample (as opposed to a conveniencesample selected by the investigators), an inappropriate control or comparison group, or extremelyrestricted sampling inappropriate for measuring the effectiveness of the intervention beingstudied.
II/11a/b

September 19999
Part III. Study Quality DATA SHEET
EXPLAIN ALL ASSESSMENTS!
1. Descriptions Yes No Cross-Reference
A. Was the study population well described? G G II/1, 5, 6, 11a/b, 13
B. Was the intervention well described (what, how, who, where)? G G II/1, 2, 3, 4
Explain:
2. Sampling Yes No N/A Cross-Reference
A. Did the authors specify the sampling frame or universe of selection for thestudy population?
G G G II/1, 11b
B. Did the authors specify the screening criteria for study eligibility? G G G II/1, 11a
C. Was the population that served as the unit of analysis the entire eligiblepopulation or a probability sample at the point of observation?
G G G II/11b
D. Are there other selection bias issues not otherwise addressed? Describe. G G G II/11a/b
Explain:
DID YOU PROVIDE COMMENTS FOR ALL ASSESSMENTS?

INSTRUCTIONS Part III. Study Quality3. Measurement Cross-Reference
A. Was there an attempt to measure exposure to the intervention? (If NA or No, go to 3C) II/12
B. Were the exposure variables valid measures of the intervention under study? The authors should have reported one or more of the following:• Clear definition of the exposure variable.• Measurement of exposure in different ways. Example: consistency checks for self reports;
use of corroborating respondents; program or organizational record searches compared toself-reports.
• Citations or discussion as to why the use of these measures is valid. Example: the authorsconsidered evidence from similar studies, or available standards of measurement.
• OtherWere the exposure variables reliable (consistent and reproducible) measures of the interventionunder study? The authors should have reported one or more of the following:• Measures of internal consistency. Example: Cronbach’s alpha; confirmatory factor
analysis.• Measurement of exposure in different ways. Example: see above.• Inter-rater reliability checks (if exposure was determined by an observer). Example: percent
agreement, Kappa• Citations or discussion as to why the use of these measures is reliable. Example: see above• Other
II/12
II/12
C. Were the outcome and other independent (or predictor) variables valid measures of the outcome ofinterest? The authors should have reported one or more of the following:• Clear definition of the outcome variable.• Measurement of the outcome in different ways. Example: Correlational analysis between
measured outcomes to demonstrate convergent (i.e., 2 or more measures reflect the sameunderlying process) or divergent validity (i.e., 2 or more measures reflect differentdimensions). An example of the former is that 5 items on self-efficacy correlate highly witheach other; an example of the latter is that self-efficacy measures do not correlate highlywith attitude measures.
• Citations or discussion as to why the use of these measures is valid. Example: see above• Other. Example: If authors fail to blind observers/interviewers to treatment vs. comparison
group, when applicable, the answer to this question should be “no.”Were the outcome and other independent (or predictor) variables reliable (consistent andreproducible) measures of the outcome of interest? The authors should have reported one or more of the following:• Measures of internal consistency. Example: see 3B• Measurement of the outcome in different ways. Example: see 3B and 3C (above).• Considered consistency of coding, scoring or categorization between observers (e.g., inter-
rater reliability checks) or between different outcome measures. Example: percentagreement, Kappa
• Considered how setting and sampling of study population might affect reliability.• Citations or discussion as to why the use of these measures is reliable. Example: see 3B.• Other
I/10
II/8, 9 10, 18, 20
4. Data analysis Cross-Reference
A. Check “yes,” “no,” or “not applicable” for each of the following:Did the authors conduct appropriate analysis by:• Conducting statistical testing (when appropriate)? • Reporting which statistical tests were used?• Controlling for design effects in the statistical model?
Examples:1. The study population was sampled using complex stratified sampling, however, the
authors did not control for the sampling method in the analysis.2. The answer should be “no” if the study had a matched design but an unmatched analysis.
• Controlling for repeated measures in the analysis, for study designs in which the same populationwas followed with repeated measurements over time?
• Accounting for different levels of exposure in segments of the study population in the analysis?• If the authors analyzed group-level and individual-level covariates in the same statistical model,
was the model designed to handle multi-level data?
II/18, 20II/18, 20II/18, 20
II/18, 20
II/12
II/1, 11b
B. Were there other problems with data analysis that limit interpretation of the results of the study?Specify.
II/18, 20

September 199910
Part III. Study Quality DATA SHEET
EXPLAIN ALL ASSESSMENTS!
3. Measurement Yes No N/A Cross-Reference
A. Did the authors attempt to measure exposure to the intervention? G G G II/12go to
3Bgo to
3Cgo to
3C
B. Was the exposure variable:• Valid?• Reliable (consistent and reproducible)?
GG
GG
GG
II/12II/12
C. Were the outcome and other independent (or predictor) variables:• Valid?• Reliable (consistent and reproducible)?
GG
GG
GG
I/10II/8, 9 10, 18, 20
Explain:
4. Data Analysis Yes No N/A Cross-Reference
A. Did the authors conduct appropriate statistical testing by:• Conducting statistical testing (when appropriate)?• Reporting which statistical tests were used?• Controlling for design effects in the statistical model?• Controlling for repeated measures in populations that were
followed over time?• Controlling for differential exposure to the intervention?• Using a model designed to handle multi-level data when they
included group-level and individual covariates in the model?
GGGG
GG
GGGG
GG
GGGG
GG
II/18, 20II/18, 20II/18, 20II/18, 20
II/12II/1, 11b
B. Are there other problems with the data analysis? Describe. G G G II/18, 20
Explain:
DID YOU PROVIDE COMMENTS FOR ALL ASSESSMENTS?
* Many excellent epidemiology and evaluation texts describe biases inherent in different study designs. For a conciselist and definitions of various biases, refer to:
A dictionary of epidemiology. 2nd Edition. Last JM, ed. New York, New York: Oxford University Press, 1988.
September 1999
INSTRUCTIONS Part III. Study Quality
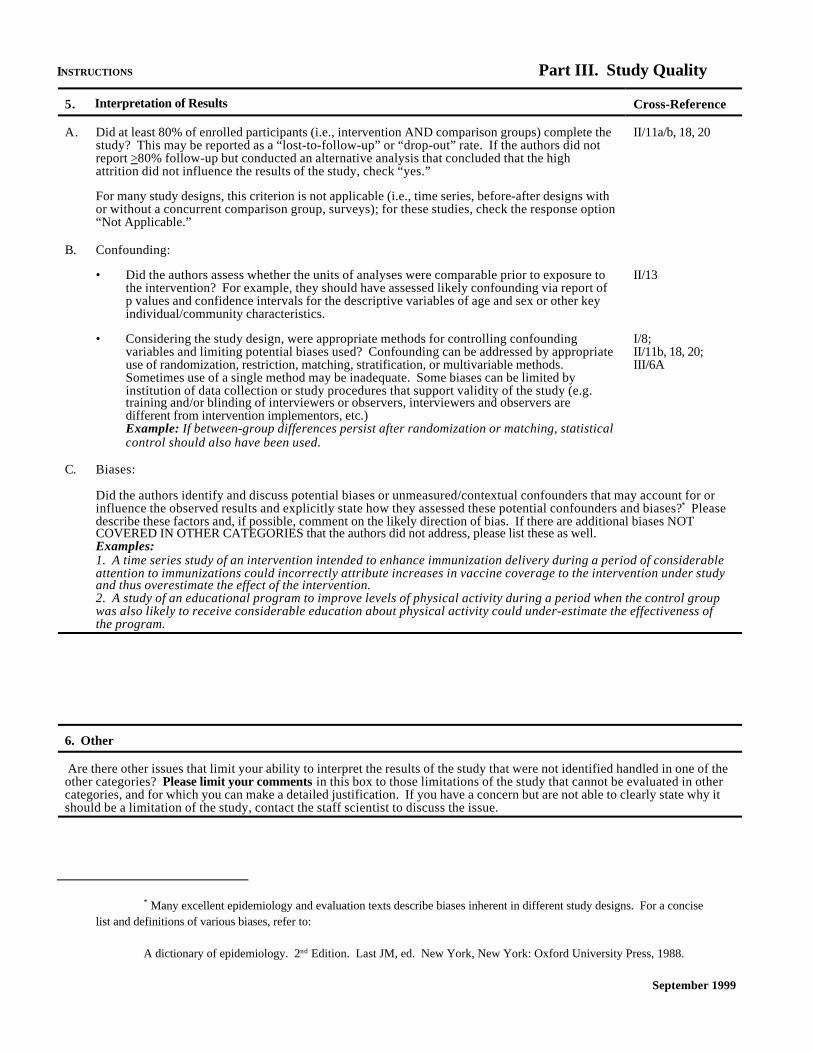
5. Interpretation of Results Cross-Reference
A. Did at least 80% of enrolled participants (i.e., intervention AND comparison groups) complete thestudy? This may be reported as a “lost-to-follow-up” or “drop-out” rate. If the authors did notreport >80% follow-up but conducted an alternative analysis that concluded that the highattrition did not influence the results of the study, check “yes.”
For many study designs, this criterion is not applicable (i.e., time series, before-after designs withor without a concurrent comparison group, surveys); for these studies, check the response option“Not Applicable.”
II/11a/b, 18, 20
B. Confounding:
• Did the authors assess whether the units of analyses were comparable prior to exposure tothe intervention? For example, they should have assessed likely confounding via report ofp values and confidence intervals for the descriptive variables of age and sex or other keyindividual/community characteristics.
• Considering the study design, were appropriate methods for controlling confoundingvariables and limiting potential biases used? Confounding can be addressed by appropriateuse of randomization, restriction, matching, stratification, or multivariable methods. Sometimes use of a single method may be inadequate. Some biases can be limited byinstitution of data collection or study procedures that support validity of the study (e.g.training and/or blinding of interviewers or observers, interviewers and observers aredifferent from intervention implementors, etc.)Example: If between-group differences persist after randomization or matching, statisticalcontrol should also have been used.
II/13
I/8; II/11b, 18, 20;III/6A
C. Biases:
Did the authors identify and discuss potential biases or unmeasured/contextual confounders that may account for orinfluence the observed results and explicitly state how they assessed these potential confounders and biases?* Pleasedescribe these factors and, if possible, comment on the likely direction of bias. If there are additional biases NOTCOVERED IN OTHER CATEGORIES that the authors did not address, please list these as well.Examples:1. A time series study of an intervention intended to enhance immunization delivery during a period of considerableattention to immunizations could incorrectly attribute increases in vaccine coverage to the intervention under studyand thus overestimate the effect of the intervention. 2. A study of an educational program to improve levels of physical activity during a period when the control groupwas also likely to receive considerable education about physical activity could under-estimate the effectiveness ofthe program.
6. Other
Are there other issues that limit your ability to interpret the results of the study that were not identified handled in one of theother categories? Please limit your comments in this box to those limitations of the study that cannot be evaluated in othercategories, and for which you can make a detailed justification. If you have a concern but are not able to clearly state why itshould be a limitation of the study, contact the staff scientist to discuss the issue.
September 199911
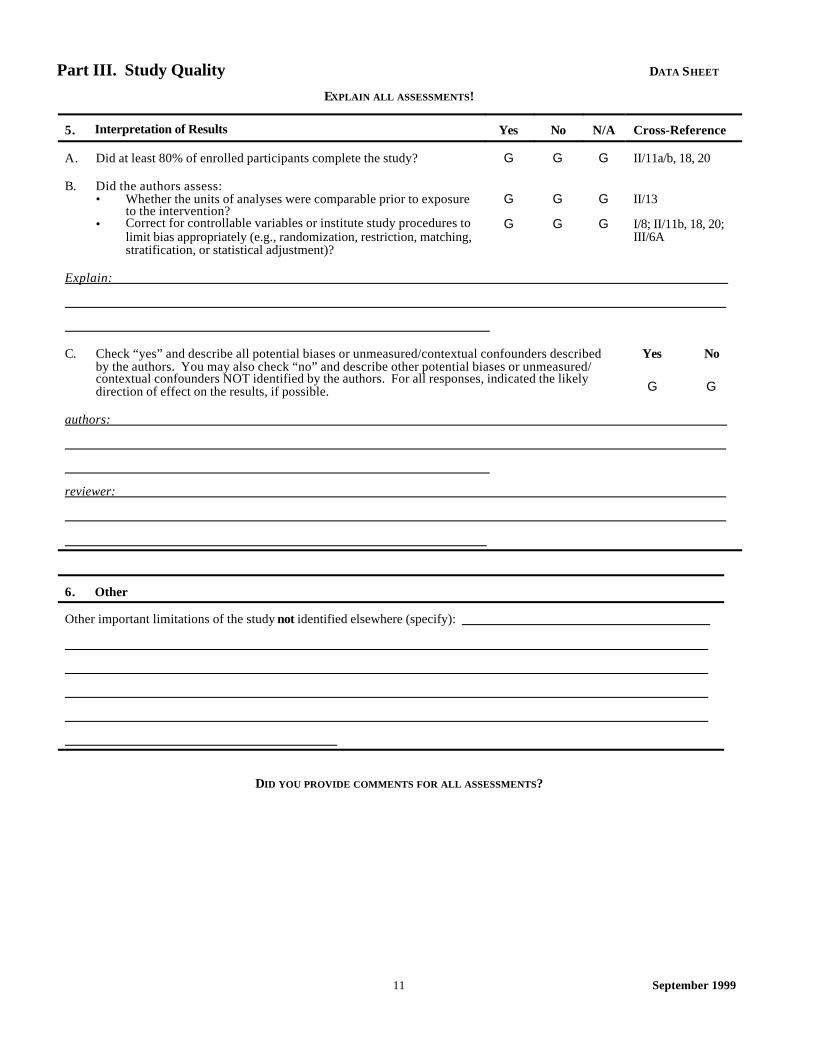
Part III. Study Quality DATA SHEET
EXPLAIN ALL ASSESSMENTS!
5. Interpretation of Results Yes No N/A Cross-Reference
A. Did at least 80% of enrolled participants complete the study? G G G II/11a/b, 18, 20
B. Did the authors assess:• Whether the units of analyses were comparable prior to exposure
to the intervention?• Correct for controllable variables or institute study procedures to
limit bias appropriately (e.g., randomization, restriction, matching,stratification, or statistical adjustment)?
G
G
G
G
G
G
II/13
I/8; II/11b, 18, 20;III/6A
Explain:
C. Check “yes” and describe all potential biases or unmeasured/contextual confounders describedby the authors. You may also check “no” and describe other potential biases or unmeasured/contextual confounders NOT identified by the authors. For all responses, indicated the likelydirection of effect on the results, if possible.
Yes No
G G
authors:
reviewer:
6. Other
Other important limitations of the study not identified elsewhere (specify):
DID YOU PROVIDE COMMENTS FOR ALL ASSESSMENTS?
September 1999
No
More than onegroup studied?
Multiplemeasurements madebefore, during or after
an intervention?
Investigatorsassign exposure?
Groups definedby?
TimeSeries
Cohort Design?Prospective
Cohort Study
No
Yes
No
Exposure
Outcome
No Yes
Yes
No
Yes
Exposureassigned
randomly?
No
Before-After
CaseControl
Other designs withconcurrent comparison
groups(e.g., time series study
with comparison group)
Non-randomized"trial"
(Group or Individual)
Randomizedtrial
Grouprandomized
trial
Exposureassigned atgroup level?
(e.g., community,county, clinic)
Yes
Yes
No
Prospective?
RetrospectiveCohort Study
Yes
No
Comparisonbetween exposedand unexposed?
Exposure andoutcome determined
in the samepopulation at the
same time?
Non-ComparativeStudy
e.g., Case seriesFocus groupCase study
Descriptive epi. study
Yes
No
Yes
CrossSectional
Figure. Study Design Algorithm