abstract thesis: a probabilistic risk assessment …
TRANSCRIPT
ABSTRACT
Title of Thesis: A PROBABILISTIC RISK ASSESSMENT
BASED APPROACH TO UNDERSTANDING AND MANAGING RISKS OF NATURAL GAS DISTRIBUTION PIPING IN THE UNITED STATES
Sara Lyons, Master of Science, 2020 Thesis Directed By: Professor Mohammed Modarres
Department of Mechanical Engineering Two hundred sixty-nine regulated pipeline system accidents caused fatalities and/or
injuries in the United States between 2010 and 2018, resulting in 106 fatalities and
599 injuries requiring hospitalization. About 84% of these serious accidents occurred
on gas distribution systems, which primarily transport natural gas. This study adapts
probabilistic risk assessment (PRA) methods which are used predominantly in the
space and nuclear industries to gas distribution systems in the U.S. Nationwide
system and accident data are used to evaluate natural gas distribution system risks,
estimate how many additional resources the public would be willing to dedicate to
reduce or eliminate these risks, and determine which improvement areas warrant
further evaluation. Recommendations regarding the overall PRA-based framework,
as well as the scope, quality, and level of detail of the underlying data, are provided.
A PROBABILISTIC RISK ASSESSMENT BASED APPROACH TO UNDERSTANDING AND MANAGING THE RISKS OF NATURAL GAS
DISTRIBUTION PIPING IN THE UNITED STATES
by
Sara Lyons
Thesis submitted to the Faculty of the Graduate School of the University of Maryland, College Park, in partial fulfillment
of the requirements for the degree of Master of Science
2020 Advisory Committee: Professor Mohammad Modarres, Chair Professor Katrina Groth Professor Jeffrey Herrmann

This work is not under copyright protection
ii
Preface
I began my career shortly after the Space Shuttle Columbia accident took the
lives of seven astronauts in 2003. With a Bachelor’s degree in Mechanical
Engineering and very little practical experience, I moved from my hometown in
South Florida to work at the Michoud Assembly Facility in New Orleans, Louisiana.
For the next five years, I learned from some of the country’s most talented engineers,
as we collectively worked toward reducing the risks of space flight for future
astronauts. While my responsibilities focused on materials testing and analysis, I
gained some exposure to the world of risk management that stayed with me in the
years to come.
In 2008, my personal life led me to look for career opportunities in Denver,
Colorado, and I found a great position with the Pipeline and Hazardous Materials
Safety Administration (PHMSA). While there, I studied their pipeline accident data
and learned from their pipeline accident investigators in support of various data-
driven initiatives the agency was pursuing at the time. I was convinced that further
analysis of available accident data could help drive significant safety improvements,
but I did not have a strong enough background in reliability engineering to
demonstrate the value.
A few years later, a position with the Nuclear Regulatory Commission (NRC)
motivated me and my family to move to the D.C. area. The NRC provided many
opportunities for me to learn more about reliability engineering, risk management,
probabilistic risk assessment, public perception of risk, and a seemingly endless list of
iii
related intricacies and nuance in application. I learned a great deal about these topics
from the staff at the NRC, especially while supporting response efforts following the
tragic events that occurred at the Fukushima Daiichi nuclear power plant in 2011.
As my understanding and curiosity grew, I realized that I needed to look to
academia to learn more. In 2017, I began studying reliability engineering part-time at
the University of Maryland with the goal of building the skills needed to inspire
safety improvements through the application of these methods. As my thesis project,
I have decided to take another look at the work I attempted while studying accident
data for PHMSA. Now, with an additional decade of experience, related graduate-
level coursework, and the advisement of Dr. Modarres, I hope that I have laid out a
framework that can be built upon and improved by others. As I have recently joined
the National Transportation Safety Board as a Pipeline Accident Investigator, I fully
expect to be able to contribute to this effort myself in coming years.
iv
Table of Contents
Preface........................................................................................................................... ii Table of Contents ......................................................................................................... iv List of Tables ................................................................................................................ v List of Figures .............................................................................................................. vi List of Abbreviations .................................................................................................. vii Chapter 1: Introduction ................................................................................................. 1
Section 1.1: Background .......................................................................................... 2 Section 1.2: Safety ................................................................................................... 3
Chapter 2: PRA Methodology ...................................................................................... 5 Section 2.1: Gas Distribution System Characterization ........................................... 6 Section 2.2: Threat Identification ............................................................................ 9 Section 2.3: Likelihood Determination .................................................................. 10 Section 2.4: Consequence Analysis ....................................................................... 13 Section 2.5: Risk Quantification ............................................................................ 15 Section 2.6: Uncertainty Evaluation ...................................................................... 16 Section 2.7: Sensitivity and Importance Analysis ................................................. 16 Section 2.8: Risk Acceptance ................................................................................ 17 Section 2.9: Risk Reduction ................................................................................... 17
Chapter 3: Results ....................................................................................................... 18 Section 3.1: Gas Distribution System Characterization ......................................... 18 Section 3.2: Threat Identification .......................................................................... 21 Section 3.3: Likelihood Determination .................................................................. 23 Section 3.4: Consequence Analysis ....................................................................... 30 Section 3.5: Risk Quantification ............................................................................ 36 Section 3.6: Uncertainty Evaluation ...................................................................... 38 Section 3.7: Sensitivity and Importance Analysis ................................................. 40 Section 3.8: Risk Acceptance ................................................................................ 42 Section 3.9: Risk Reduction ................................................................................... 43
Chapter 4: Recommendations for Future Work .......................................................... 47 Chapter 5: Conclusion................................................................................................ 49 Bibliography ............................................................................................................... 53
v
List of Tables
Table 1. Serious Accidents by System Type (2010-2018) [2] ...................................... 1 Table 2. U.S. Gas Distribution Systems – Miles of Main and Service Lines by Material [2] ................................................................................................................. 20 Table 3. Total Repairs and Repairs of Hazardous Leaks in 2018 [2] ......................... 21 Table 4. Comparison of Gas Pipeline Threat Categories Used by ASME B31.8S and PHMSA [30], [31] ...................................................................................................... 23 Table 5. Estimated U.S. Gas Distribution Hazard Rate by Decade Installed [2] ...... 26 Table 6. U.S. Gas Distribution Hazard Rate by Age (Pipelines Installed 2010-2018) [2] ................................................................................................................................ 26 Table 7. Average U.S. Gas Distribution Hazard Rate by PHMSA Major Causes and Subcauses .................................................................................................................... 30 Table 8. Risk Matrices by Accident Cause for Four Consequence Measurements (Number of Fatalities, Number of Injuries, Cost (Excluding VSL), and Statistical Value ........................................................................................................................... 34 Table 9. Statistical Value of Significant Accidents ................................................... 37 Table 10. Assumptions with Justification .................................................................. 38 Table 11. Comparison of Cause Information Reported to PHMSA by the Pipeline Operator and the Probable Cause Determined by the NTSB (Accidents with Inconsistent Causes are Highlighted).......................................................................... 40 Table 12. Statistical Value of Significant Accidents by Major Cause ....................... 41 Table 13. Relative Importance of Subcauses Contributing at Least 1% ..................... 42 Table 14. Comparison of Layers of Defense Between Commercial Nuclear Safety and Gas Distribution Pipeline Safety .......................................................................... 45 Table 15. PHMSA Data Indicating Over-Pressurization of a Low-Pressure Distribution System (Excluding NTSB Investigations) .............................................. 46
vi
List of Figures
Figure 1. Methodology Flowchart ................................................................................ 6 Figure 2. Example Natural Gas Distribution System Designs. Top: Low-Pressure Distribution System. Bottom: High-Pressure Distribution System. [22] .................... 8 Figure 3. Bathtub Curve of Human Mortality [25] .................................................... 12 Figure 4. Simple, Notional Gas Distribution Accident Event Tree (Branching Convention: Success Path is Up, Failure is Down) .................................................... 14 Figure 5. U.S. Gas Distribution Systems – Miles of Main and Service Lines by Decade Installed [2] .................................................................................................... 20 Figure 6. U.S. Gas Distribution Systems – Main and Service Lines by Diameter [2] 21 Figure 7. U.S. Gas Distribution Hazard Rate by Age ................................................ 27 Figure 8. U.S. Gas Distribution Hazard Rates by Age for PHMSA Causes Identified by ASME B31.8S as Time-Dependent, Stable, or Unknown ..................................... 28 Figure 9. U.S. Gas Distribution Hazard Rates by Age for PHMSA Causes Identified by ASME B31.8S as Time-Dependent, Stable, or Unknown ..................................... 29 Figure 10. Serious and Significant U.S. Gas Distribution Accidents (2010-18) ....... 35 Figure 11. Statistical Value of Significant Accidents by PHMSA Major Cause (2010-18) ............................................................................................................................... 35 Figure 12. Statistical Value of Significant Accidents by Class Location and SCADA (2010-18)..................................................................................................................... 36
vii
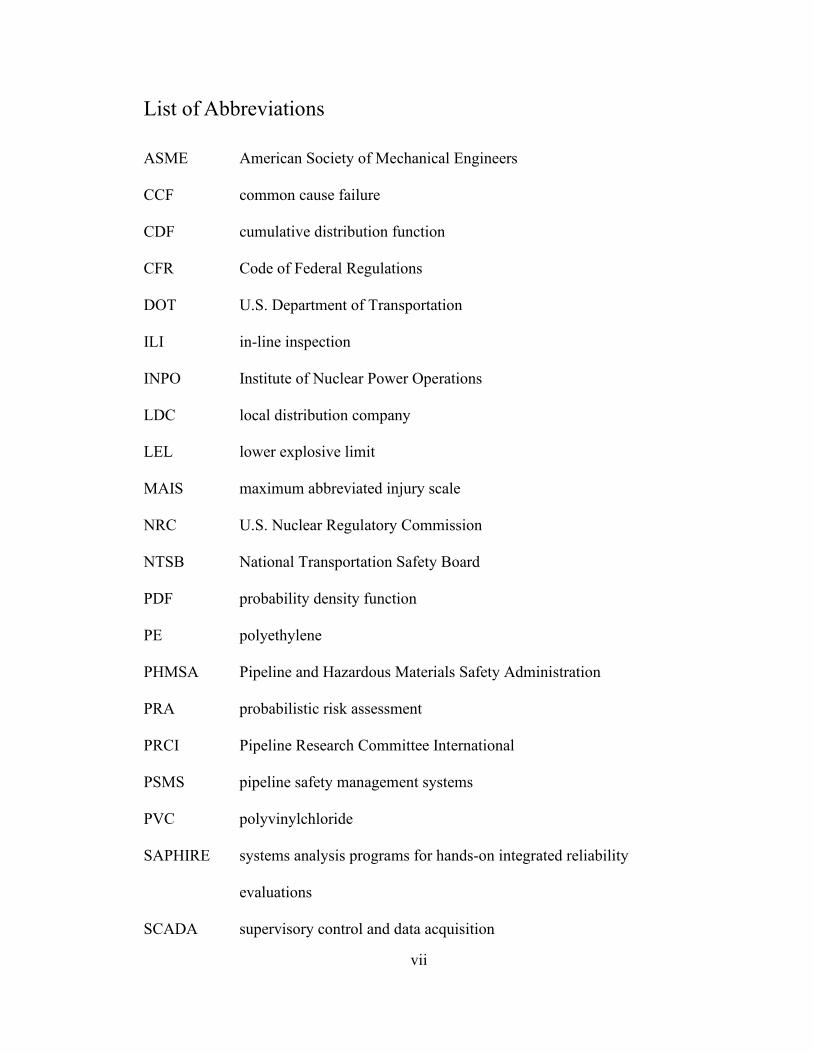
List of Abbreviations
ASME American Society of Mechanical Engineers
CCF common cause failure
CDF cumulative distribution function
CFR Code of Federal Regulations
DOT U.S. Department of Transportation
ILI in-line inspection
INPO Institute of Nuclear Power Operations
LDC local distribution company
LEL lower explosive limit
MAIS maximum abbreviated injury scale
NRC U.S. Nuclear Regulatory Commission
NTSB National Transportation Safety Board
PDF probability density function
PE polyethylene
PHMSA Pipeline and Hazardous Materials Safety Administration
PRA probabilistic risk assessment
PRCI Pipeline Research Committee International
PSMS pipeline safety management systems
PVC polyvinylchloride
SAPHIRE systems analysis programs for hands-on integrated reliability
evaluations
SCADA supervisory control and data acquisition

viii
UEL upper explosive limit
VSL value of a statistical life
1
Chapter 1: Introduction
When compared to other available transportation methods, pipelines offer a
relatively safe alternative for transporting hazardous materials to downstream
customers. However, there are accidents and incidents1 associated with these pipelines
each year, some of which impact public safety and result in significant unexpected
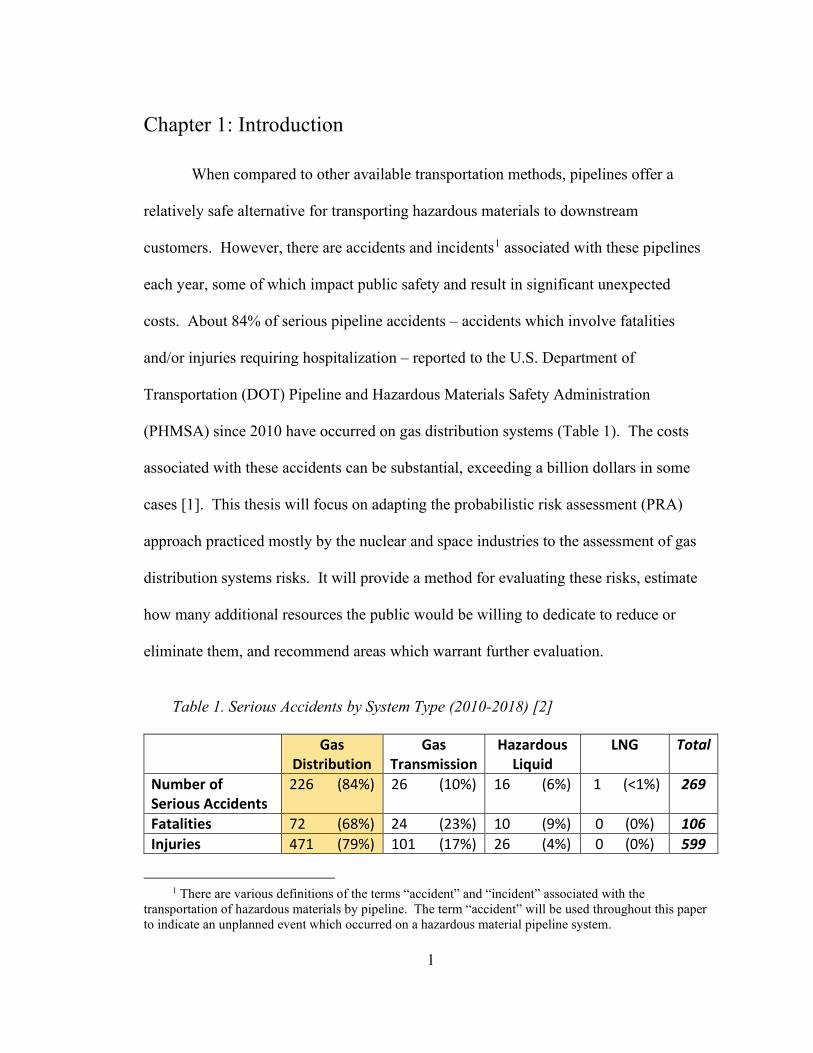
costs. About 84% of serious pipeline accidents – accidents which involve fatalities
and/or injuries requiring hospitalization – reported to the U.S. Department of
Transportation (DOT) Pipeline and Hazardous Materials Safety Administration
(PHMSA) since 2010 have occurred on gas distribution systems (Table 1). The costs
associated with these accidents can be substantial, exceeding a billion dollars in some
cases [1]. This thesis will focus on adapting the probabilistic risk assessment (PRA)
approach practiced mostly by the nuclear and space industries to the assessment of gas
distribution systems risks. It will provide a method for evaluating these risks, estimate
how many additional resources the public would be willing to dedicate to reduce or
eliminate them, and recommend areas which warrant further evaluation.
Table 1. Serious Accidents by System Type (2010-2018) [2]
Gas Distribution
Gas Transmission
Hazardous Liquid
LNG Total
Number of Serious Accidents
226 (84%) 26 (10%) 16 (6%) 1 (<1%) 269
Fatalities 72 (68%) 24 (23%) 10 (9%) 0 (0%) 106 Injuries 471 (79%) 101 (17%) 26 (4%) 0 (0%) 599
1 There are various definitions of the terms “accident” and “incident” associated with the
transportation of hazardous materials by pipeline. The term “accident” will be used throughout this paper to indicate an unplanned event which occurred on a hazardous material pipeline system.
2
Section 1.1: Background
Natural gas pipeline technology has evolved since the Chinese introduced it in
900 BC. At that time, the Chinese used bamboo tubes to transport natural gas over short
distances to supply heat and light [3]. The first commercial use of natural gas occurred in
1802 when the Scottish engineer William Murdoch transported gas to the James Watt
factory for lighting. Four years later, in 1806, the first gas mains ever laid in a public
street were manufactured from sheet lead and installed in London, England. The first city
in the U.S. to install gas pipelines was Baltimore, Maryland in 1817 [4]. Significant
technological advancements have taken place since this time, improving materials, design
and construction methods, data management, and measurement techniques. World War
II brought advances in metallurgy, welding techniques and pipe rolling [3]. Around the
same time, in 1945, Polyvinylchloride (PVC) plastic pipe was developed. After World
War II, there was accelerated growth in pipeline construction [5].
Most customers receive natural gas from a local distribution company (LDC), a
utility that can either be owned by investors or local governments. LDCs typically
transport natural gas to households and businesses through thousands of miles of small-
diameter distribution pipelines. The point where the natural gas is transferred from a
transmission pipeline to the LDC is often termed the city gate. The natural gas is
typically depressurized, scrubbed, filtered, and odorized near the city gate. The odorant,
typically mercaptan, aides in the detection of natural gas, an otherwise odorless and
colorless gas. The natural gas is periodically compressed to ensure pipeline flow.
Supervisory control and data acquisition (SCADA) systems are sometimes used to
provide a comprehensive measurement and control system for the LDC [6].
3
Current methods used to model the risk of gas pipelines varies from company to
company and sector of the industry. Methods include the use of quantitative risk analysis
(QRA), accident consequence analysis (ACA), and qualitative risk assessment methods
using indices [7], [8], [9], [10], [11]. In some cases, techniques parallel those used in
process safety management [12]. Some studies use nationwide PHMSA data to underpin
the analysis [13]. These existing methods typically incorporate a combination of subject
matter expert opinion and statistical analysis assumptions that are not thoroughly
justified. The results do not support comparison with nationwide risk acceptance criteria
or specific risk insights needed protect against catastrophic events. This study lays out a
framework that would support comparison with nationwide risk acceptance criteria and
allow for additional risk insights to be gleaned upon further development as described
herein.
Section 1.2: Safety
The safety of natural gas distribution systems has improved in the last 200 years.
Accidents that have occurred as the industry matured have shaped both company and
government policies. One of the most catastrophic accidents occurred when the London
Junior-Senior High School in New London, Texas, exploded on March 19, 1937. The
school board in the affluent town of New London had voted to have a plumber illegally
tap into a residue gas line of a local oil company to save money. The gas line connection
leaked, filling the school’s basement with natural gas which eventually ignited, taking
about 300 lives [14].
The responsibility for gas pipeline safety was assigned to the DOT by statute in
1968 [15]. Under the current structure, PHMSA, a DOT agency, is responsible for
4
ensuring adequate protection against risks to life and property posed by pipeline
transportation of natural gas [16], [17]. The regulations governing natural gas distribution
systems are codified in Title 49 of the Code of Federal Regulations (CFR) Parts 190, 191,
192, 196, and 199. Through a partnership with PHMSA, some states assume regulatory
and enforcement responsibility for the regulation of gas distribution systems.
Although pipeline safety has significantly improved over the years, catastrophic
accidents continue to occur. In the nine years that this analysis period includes, there
were three significant gas distribution accidents that resulted in five or more fatalities
each [18], [19], [20].
5
Chapter 2: PRA Methodology
The safety risks presented by gas distribution systems have been a topic of
national interest for many decades, in part due to catastrophic accidents that have
occurred in our country’s history. The accidents that have occurred in the recent past can
be used to help understand current safety risks. Risk can be defined as a measure of the
probability and severity of adverse events. Risk assessments often consist of answering
the following questions [21]:
(1) What can go wrong?
(2) How likely is this to happen?
(3) If it does happen, what are the consequences?
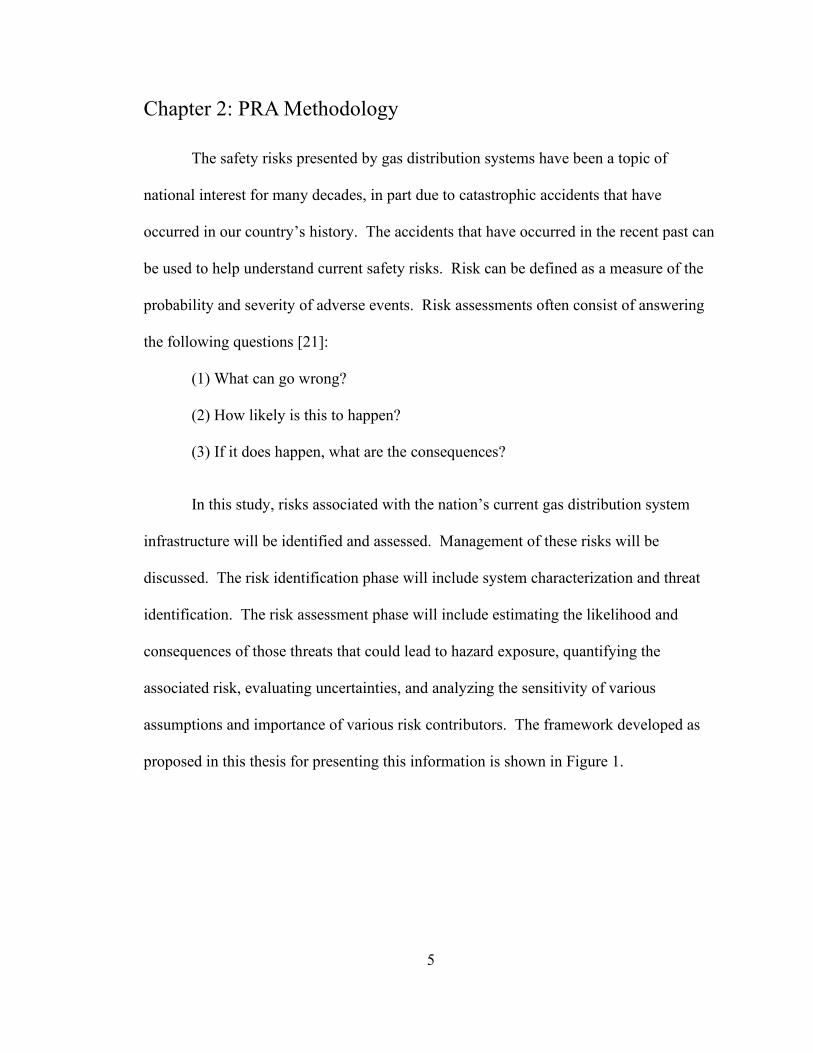
In this study, risks associated with the nation’s current gas distribution system
infrastructure will be identified and assessed. Management of these risks will be
discussed. The risk identification phase will include system characterization and threat
identification. The risk assessment phase will include estimating the likelihood and
consequences of those threats that could lead to hazard exposure, quantifying the
associated risk, evaluating uncertainties, and analyzing the sensitivity of various
assumptions and importance of various risk contributors. The framework developed as
proposed in this thesis for presenting this information is shown in Figure 1.
6
Figure 1. Methodology Flowchart
Section 2.1: Gas Distribution System Characterization
The natural gas distribution infrastructure in the U.S., which primarily transports
natural gas, has evolved. Technological advancements have led to improvements in all
aspects of these systems (e.g., materials, design, construction and maintenance practices,
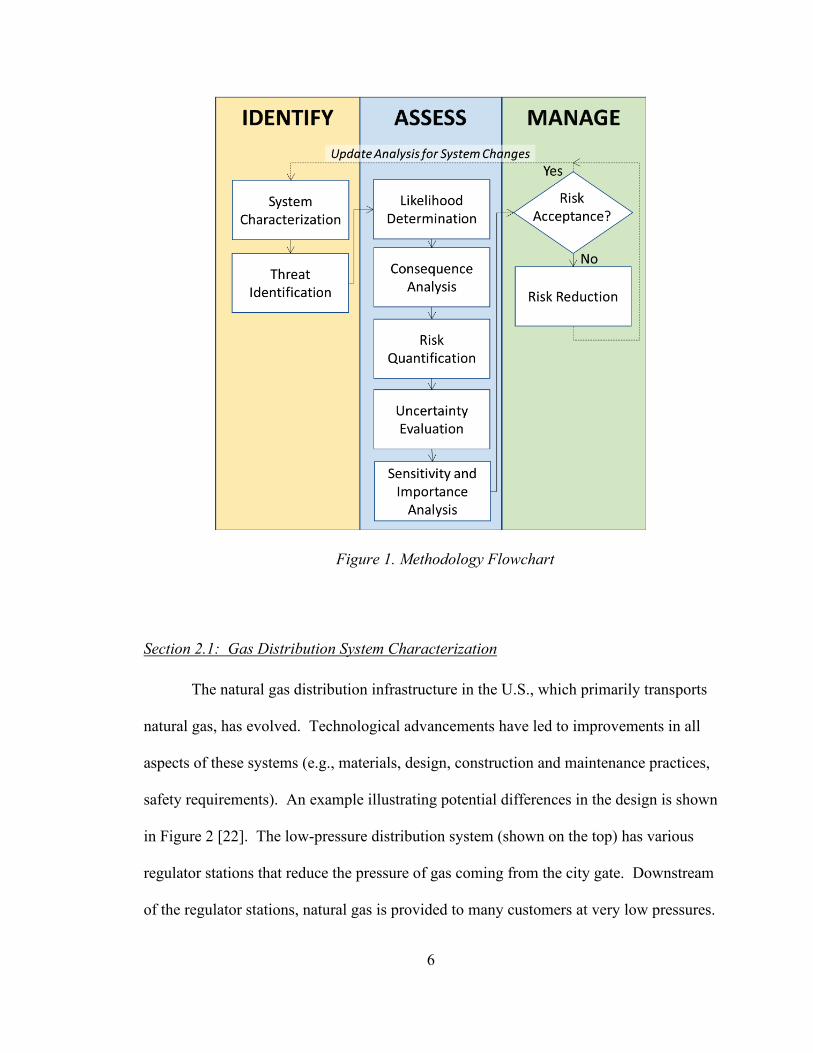
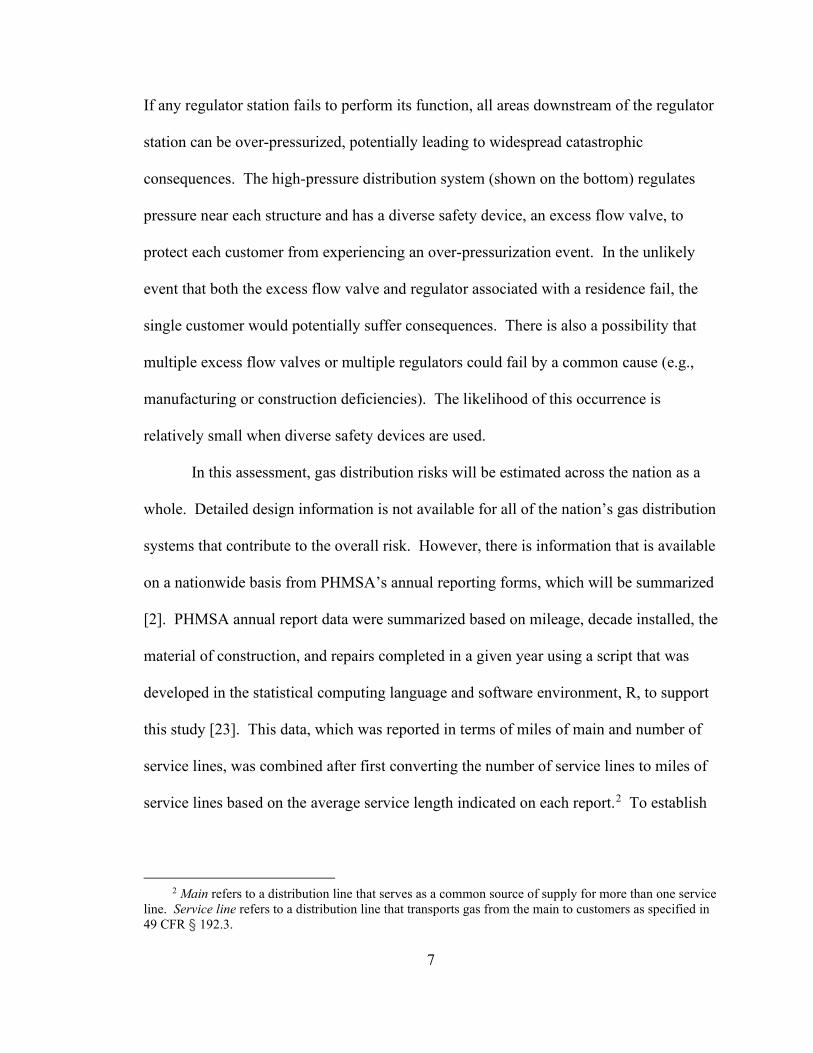
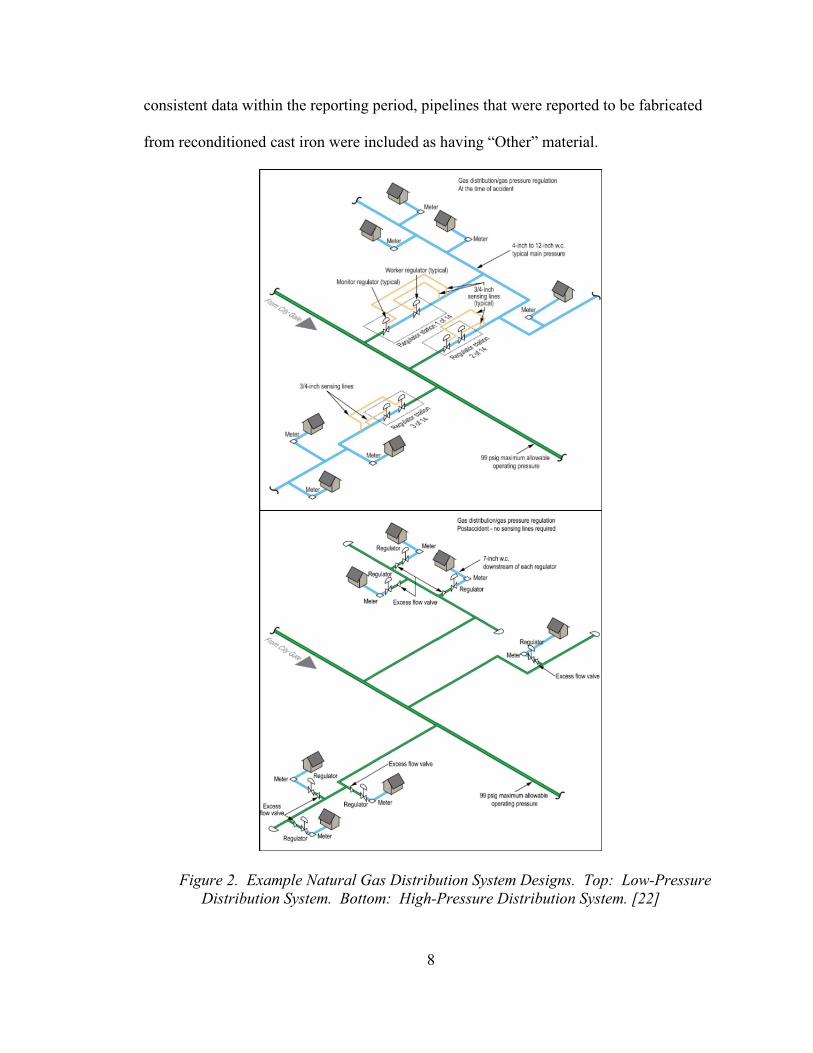
safety requirements). An example illustrating potential differences in the design is shown
in Figure 2 [22]. The low-pressure distribution system (shown on the top) has various
regulator stations that reduce the pressure of gas coming from the city gate. Downstream
of the regulator stations, natural gas is provided to many customers at very low pressures.
7
If any regulator station fails to perform its function, all areas downstream of the regulator
station can be over-pressurized, potentially leading to widespread catastrophic
consequences. The high-pressure distribution system (shown on the bottom) regulates
pressure near each structure and has a diverse safety device, an excess flow valve, to
protect each customer from experiencing an over-pressurization event. In the unlikely
event that both the excess flow valve and regulator associated with a residence fail, the
single customer would potentially suffer consequences. There is also a possibility that
multiple excess flow valves or multiple regulators could fail by a common cause (e.g.,
manufacturing or construction deficiencies). The likelihood of this occurrence is
relatively small when diverse safety devices are used.
In this assessment, gas distribution risks will be estimated across the nation as a
whole. Detailed design information is not available for all of the nation’s gas distribution
systems that contribute to the overall risk. However, there is information that is available
on a nationwide basis from PHMSA’s annual reporting forms, which will be summarized
[2]. PHMSA annual report data were summarized based on mileage, decade installed, the
material of construction, and repairs completed in a given year using a script that was
developed in the statistical computing language and software environment, R, to support
this study [23]. This data, which was reported in terms of miles of main and number of
service lines, was combined after first converting the number of service lines to miles of
service lines based on the average service length indicated on each report.2 To establish
2 Main refers to a distribution line that serves as a common source of supply for more than one service
line. Service line refers to a distribution line that transports gas from the main to customers as specified in 49 CFR § 192.3.
8
consistent data within the reporting period, pipelines that were reported to be fabricated
from reconditioned cast iron were included as having “Other” material.
Figure 2. Example Natural Gas Distribution System Designs. Top: Low-Pressure Distribution System. Bottom: High-Pressure Distribution System. [22]
9
Section 2.2: Threat Identification
In order to identify threats to the system, it is necessary to answer the first
question in the risk triplet: What can go wrong, or what can go wrong that could lead to
hazard exposure? When the specific pipeline system information is known, the system
can be evaluated to determine those threats that could result in hazard exposure. For
example, the natural gas distribution systems shown in Figure 2 could be evaluated by
considering the failure of any of the various subcomponents (e.g., failure of the pipe, a
regulator station, or an excess flow valve). This can be done by evaluating the associated
piping and instrumentation diagrams and identifying threats to the overall system
performance. For example, failure of any regulator station in the low-pressure
distribution system shown in Figure 2 (top) in the open position, would be identified as a
safety threat to all downstream residences. If the regulator stations failed in the closed
position, there could also be a safety risk associated with natural gas curtailment if the
failure occurred during very cold weather.
Since specific pipeline system information is not available for this nationwide
assessment, system reliability will be modeled based on failure cause. This is useful
because pipeline safety programs are often established to address particular failure
causes. For example, One-call programs (e.g., 8-1-1) target excavation accident
prevention, whereas, in-line inspection (ILI) assessments target prevention of accidents
from the particular failure mechanism(s) they can detect (e.g., cracks, corrosion, dents).
Causes and failure modes of the gas distribution pipeline need to be assessed to define
those threats that will be considered in this evaluation.
10
Section 2.3: Likelihood Determination
The likelihood that each of the identified threats will lead to hazard exposure will
be estimated. To support this evaluation, those scenarios that result in a significant
PHMSA reportable event should be considered to have led to hazard exposure. System
reliability will be assessed as it relates to each threat.
Reliability typically refers to the probability that a component or system will
function as expected for a predetermined amount of time when exposed to actual use, or
operating, conditions. Various functions can be used to describe the reliability of a
system, including the cumulative distribution, probability density, reliability, and hazard
functions.
The cumulative distribution function (cdf) describes the probability that the
component or system will fail before specified time, t. The probability density function
(pdf) describes the relative likelihood that the component or system will fail at a time, t,
and is defined as the derivative of the cdf. The reliability function describes the
probability that the component or system will survive beyond time t.
The hazard function describes the propensity to fail in the next small interval,
given survival up to that point. Mathematically, the hazard function is represented by:
ℎ(𝑡𝑡) = 𝑙𝑙𝑙𝑙𝑙𝑙𝜏𝜏→0
1𝜏𝜏𝐹𝐹(𝑡𝑡+𝜏𝜏)−𝐹𝐹(𝑡𝑡)
𝑅𝑅(𝑡𝑡) = 𝑓𝑓(𝑡𝑡)𝑅𝑅(𝑡𝑡) (Eq. 1)
The hazard function is important because it shows changes in the probability of failure
over the lifetime of a component. For large samples, a nonparametric estimate of the
reliability function can be calculated by:
𝑅𝑅�(𝑡𝑡𝑖𝑖) = 𝑁𝑁𝑠𝑠(𝑡𝑡𝑖𝑖)𝑁𝑁
(Eq. 2)
11
where 𝑁𝑁𝑠𝑠(𝑡𝑡𝑖𝑖) is the number of surviving components at a time, 𝑡𝑡𝑖𝑖, and 𝑁𝑁 is the total
number of components. A nonparametric estimate of the pdf can be calculated by:
𝑓𝑓(𝑡𝑡𝑖𝑖) = 𝑁𝑁𝑓𝑓(𝑡𝑡𝑖𝑖)
𝑁𝑁𝑁𝑁𝑡𝑡 (Eq. 3)
where 𝑁𝑁𝑓𝑓(𝑡𝑡𝑖𝑖) is the number of failures observed in the interval (𝑡𝑡𝑖𝑖, 𝑡𝑡𝑖𝑖 + 𝛥𝛥𝑡𝑡). From
Equations 2 and 3, the hazard rate (or failure rate) can be estimated:
ℎ�(𝑡𝑡𝑖𝑖) = 𝑁𝑁𝑓𝑓(𝑡𝑡𝑖𝑖)
𝑁𝑁𝑠𝑠(𝑡𝑡𝑖𝑖)𝑁𝑁𝑡𝑡 (Eq. 4)
In Equation 4, 𝑁𝑁𝑓𝑓(𝑡𝑡𝑖𝑖)
𝑁𝑁𝑠𝑠(𝑡𝑡𝑖𝑖) estimates the probability that a component will fail in the given
interval, provided it survives up to time, ti. Dividing by 𝛥𝛥𝑡𝑡 estimates the failure rate
(probability of failure per unit time) for interval 𝛥𝛥𝑡𝑡 [24].
This concept allows for the development of life tables, which are used to describe
human mortality and life expectancy. In this application, there are two types of life
tables. The first type of life table is the cohort life table, which is developed by following
a particular birth cohort throughout their life. This life table takes many years to develop
and the development is sometimes not possible due to unavailable or incomplete data.
The second type of life table is the period life table, which represents a hypothetical
cohort that is alive during a specific period. For example, the period life table that was
developed for the year 2015 “assumes a hypothetic cohort that is subject throughout its
lifetime to the age-specific death rates prevailing for the actual population in 2015” [25].
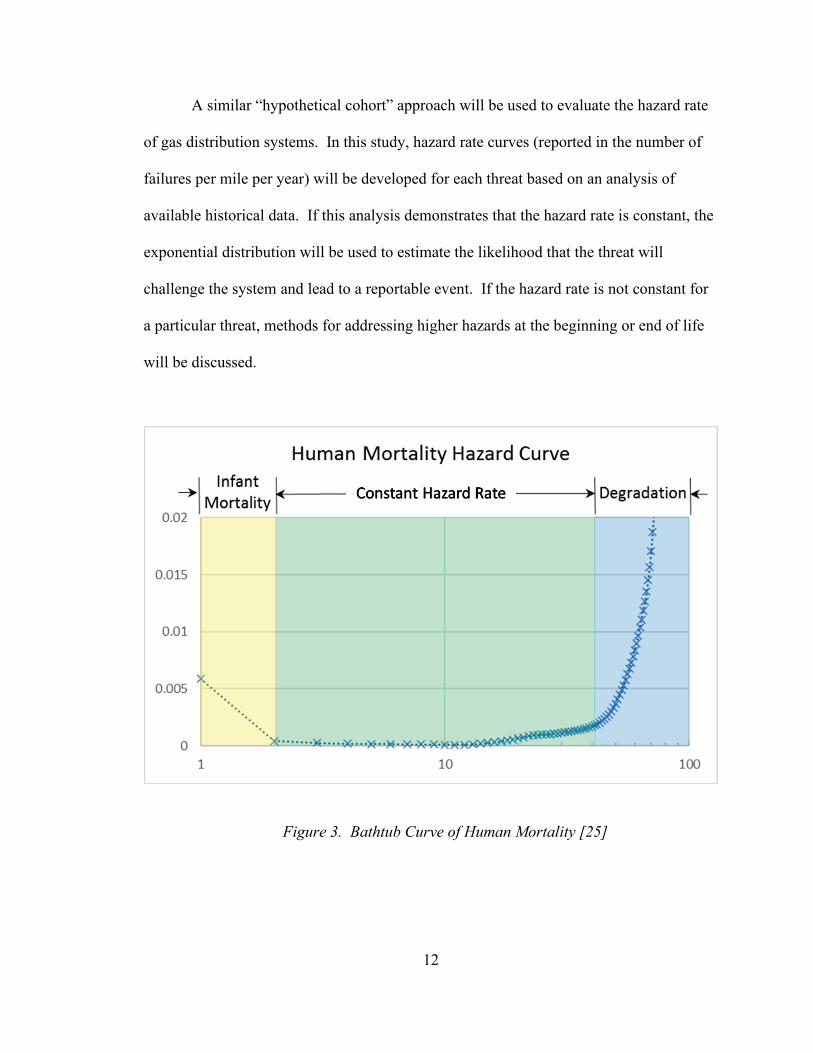
When the human mortality hazard rate is plotted, it illustrates how the hazard rate
changes with age for the hypothetical cohort, decreasing very early in life, remaining
relatively constant, and increasing later in life during the “degradation” period (Figure 3).
This typical shape is often described as a “bathtub curve.”
12
A similar “hypothetical cohort” approach will be used to evaluate the hazard rate
of gas distribution systems. In this study, hazard rate curves (reported in the number of
failures per mile per year) will be developed for each threat based on an analysis of
available historical data. If this analysis demonstrates that the hazard rate is constant, the
exponential distribution will be used to estimate the likelihood that the threat will
challenge the system and lead to a reportable event. If the hazard rate is not constant for
a particular threat, methods for addressing higher hazards at the beginning or end of life
will be discussed.
Figure 3. Bathtub Curve of Human Mortality [25]
13
Section 2.4: Consequence Analysis
Natural gas can form an explosive mixture when combined with air in
concentrations between 5% (the lower explosive limit, or LEL) and 15% (the upper
explosive limit, or UEL) natural gas in the air. In a typical gas distribution system
accident sequence, there is the potential for very serious consequences, including
fatalities, injuries, and extensive property damage. It is also possible that the
consequences are relatively minor (e.g., venting gas to the atmosphere, cost of lost
product and repairs). It is often convenient to model consequence scenarios using event
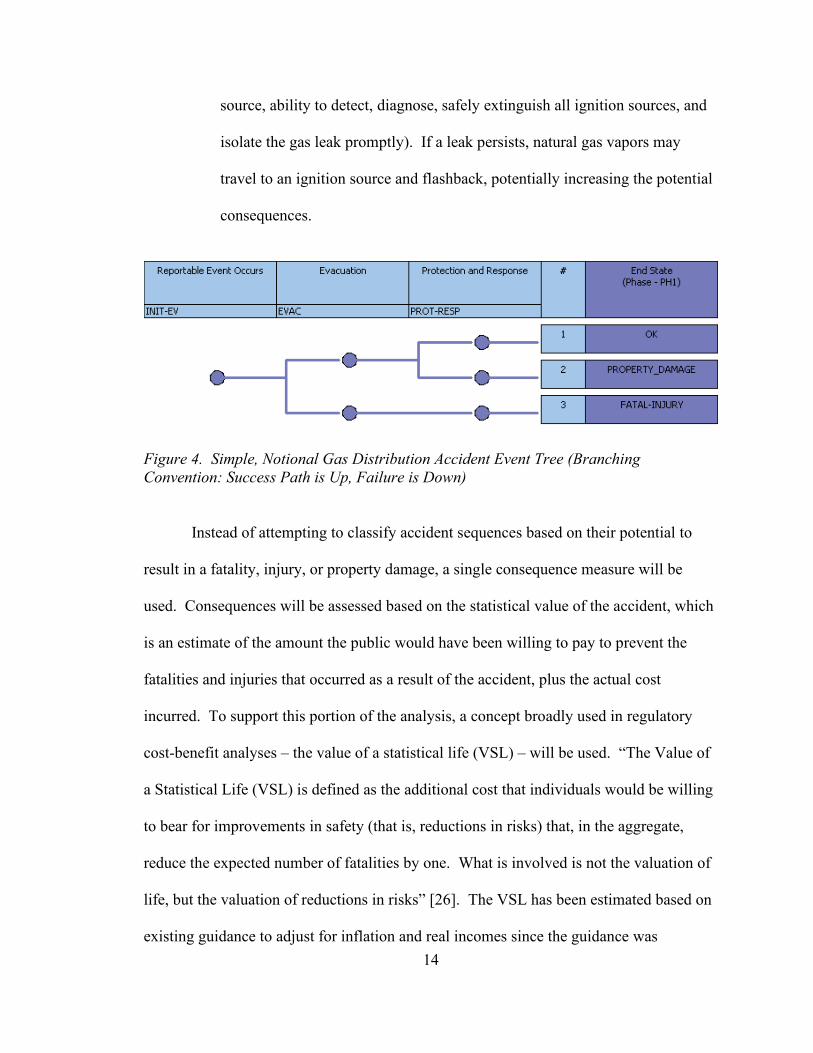
tree models. In the simplified, notional event tree shown in Figure 4, the initiating event
is assumed to be a PHMSA reportable gas distribution accident. If this initiating event
occurs, there are a series of pivotal events (also called top events) that determine the
associated consequences. In the notional event tree shown, the pivotal events include:
• Evacuation: Success of this top event is defined as a timely evacuation which
is completed prior to the gas presenting a hazard to any person whose safety
may be compromised (e.g., ignition/explosion or asphyxiation). The
probability of success will depend on the specific scenario (potential
consequences; available response time; ability to detect, diagnose, and
appropriately evacuate). If the scenario does not present a hazard to any
person, success is guaranteed.
• Protection and Response: Success of this top event occurs when gas vents to
atmosphere without reaching flammable concentrations (i.e., 5-15% natural
gas in air) in the vicinity of an ignition source. The probability of success
will depend on the specific scenario (potential for gas to reach an ignition
14
source, ability to detect, diagnose, safely extinguish all ignition sources, and
isolate the gas leak promptly). If a leak persists, natural gas vapors may
travel to an ignition source and flashback, potentially increasing the potential
consequences.
Figure 4. Simple, Notional Gas Distribution Accident Event Tree (Branching Convention: Success Path is Up, Failure is Down)
Instead of attempting to classify accident sequences based on their potential to
result in a fatality, injury, or property damage, a single consequence measure will be
used. Consequences will be assessed based on the statistical value of the accident, which
is an estimate of the amount the public would have been willing to pay to prevent the
fatalities and injuries that occurred as a result of the accident, plus the actual cost
incurred. To support this portion of the analysis, a concept broadly used in regulatory
cost-benefit analyses – the value of a statistical life (VSL) – will be used. “The Value of
a Statistical Life (VSL) is defined as the additional cost that individuals would be willing
to bear for improvements in safety (that is, reductions in risks) that, in the aggregate,
reduce the expected number of fatalities by one. What is involved is not the valuation of
life, but the valuation of reductions in risks” [26]. The VSL has been estimated based on
existing guidance to adjust for inflation and real incomes since the guidance was
15
developed. Using this procedure, the VSL was updated from $9.6 million in 2016 and
rounded to $10 million in 2019. For this analysis, since injury severity information is
generally not available, it is assumed that all reported injuries had a severity of the
Maximum Abbreviated Injury Scale (MAIS) 3 or serious. This corresponds to a fraction
of VSL of 0.105 for the purposes of statistical value calculations [26].
The statistical value is intended to estimate the total amount that the public would
have been “willing to pay” for safety enhancements that would have prevented a given
accident. The statistical value of each accident will be calculated based on the sum of:
• additional costs that individuals would have been willing to bear for improvements in
safety to prevent the accident (i.e., VSL), and
• actual costs related to property damage, repairs, emergency response, clean-up, and
lost product
Note that the statistical value does not include costs associated with lost productivity or
psychological consequences which can result from a major accident or evacuation.
Section 2.5: Risk Quantification
Risk estimation is used to interpret the various contributors to risk. Because all
sequences will be defined to be mutually exclusive, the risk can be calculated by
Equation 5.
𝑅𝑅 = ∑ 𝐹𝐹𝑖𝑖𝑖𝑖 × 𝐶𝐶𝑖𝑖 (Eq. 5)
where 𝐹𝐹𝑖𝑖 is the frequency or likelihood of sequence i occurring, and
𝐶𝐶𝑖𝑖 is the consequence of sequence i
16
The risk will be estimated for each threat.
Section 2.6: Uncertainty Evaluation
Risk assessments, like all engineering analyses, involve assumptions that are
made to support the analyses. There are three types of epistemic uncertainty that
typically need to be addressed directly, including completeness, parameter, and model
uncertainty. Completeness uncertainty is either known or unknown, but not modeled. If
known, it can be addressed by conservative or bounding analysis; if unknown, it can be
addressed by the addition of safety margins or defense-in-depth. Parameter uncertainty is
typically propagated through the probabilistic model. Model uncertainty occurs when
there are multiple modeling approaches and no consensus model exists. Model
uncertainty can be addressed by making assumptions, determining which are important to
the decision, and quantitatively or qualitatively justifying them [27], [28]. The
completeness, parameter, and model uncertainty that may be important to decisions that
involve a risk assessment of gas distribution pipeline systems will be tabulated and
discussed.
Section 2.7: Sensitivity and Importance Analysis
Sensitivity analysis will be performed, as needed, based on the results of the
uncertainty evaluation. Importance analysis will be performed to assess the relative risk
contribution of each threat. This is useful to understand which safety improvement areas
have the most significant potential risk benefit.
17
Section 2.8: Risk Acceptance
Federal guidelines will be reviewed to determine the level of risk that is tolerable
as it relates to gas distribution systems. Risk acceptance thresholds are used in several
industries. One example is the commercial nuclear industry. The Nuclear Regulatory
Commission (NRC) has two safety goals, one that relates to the risk of prompt fatality to
an individual and one that relates to the societal risk of cancer fatalities [29]. The safety
goal related to individual risk is:
Individual members of the public should be provided a level of protection from the consequences of nuclear power plant operations such that individuals bear no significant additional risk to life and health.
This safety goal has a corresponding quantitative objective:
The risk to an average individual in the vicinity of a nuclear power plant of prompt fatalities that might result from reactor accidents should not exceed one-tenth of one percent (0.1 percent) of the sum of prompt fatality risks resulting from other accidents to which members of the U.S. population are generally exposed.
A comparable framework is necessary to evaluate gas distribution system risk
acceptability.
Section 2.9: Risk Reduction
The estimated risk will be compared to the acceptance threshold. If the current
risks are not within the acceptable range, approaches to reduce these risks will be
identified for further study.
18
Chapter 3: Results
This case study focuses on adapting PRA methods to the U.S. gas distribution
system to help understand and manage risks. There are some challenges with this
application that do not exist in other industries where PRA is more widely used. When
contrasted with the nuclear and space industries, natural gas distribution systems:
• traverse broad, often populated areas that are not under the direct control of the
operator,
• may have unknown configurations and materials of construction, especially for
older systems,
• have limited experience data, and
• have not been studied as extensively with the intent of establishing the bases for
assumptions that are needed to support a PRA
Despite these challenges, the structure that PRAs offer to support risk
management are valuable and can be applied to other technologies, including gas
distribution systems, to further advance safety performance. The results presented below
show how this structure can be applied, given the currently available information.
Section 3.1: Gas Distribution System Characterization
The current U.S. gas distribution system primarily transports natural gas. Natural
gas distribution systems include a network of piping that supply gas to various
consumers. According to data provided by PHMSA, there are over two million miles of
main and service lines which distribute gas to customers across the country.
19
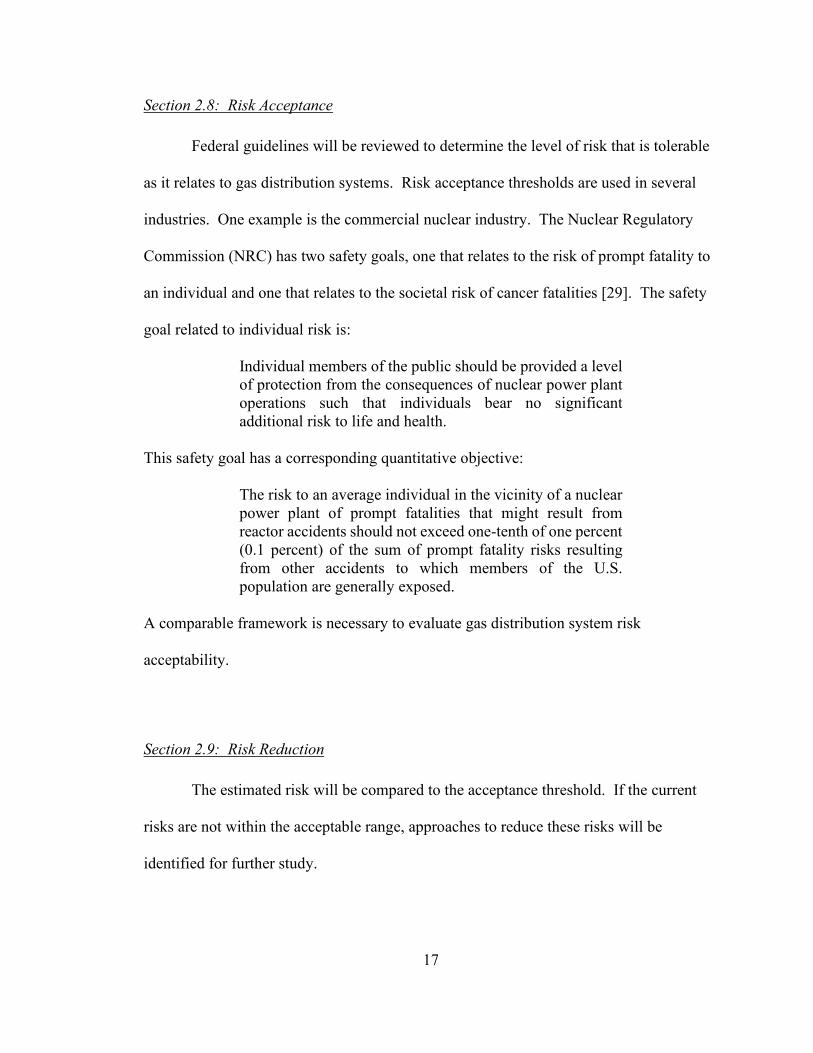
The gas distribution infrastructure includes pipelines of various ages. Distribution
pipelines that have known ages were installed between the start of the twentieth century
and today, but the age of some gas distribution pipelines is unknown (Figure 5).
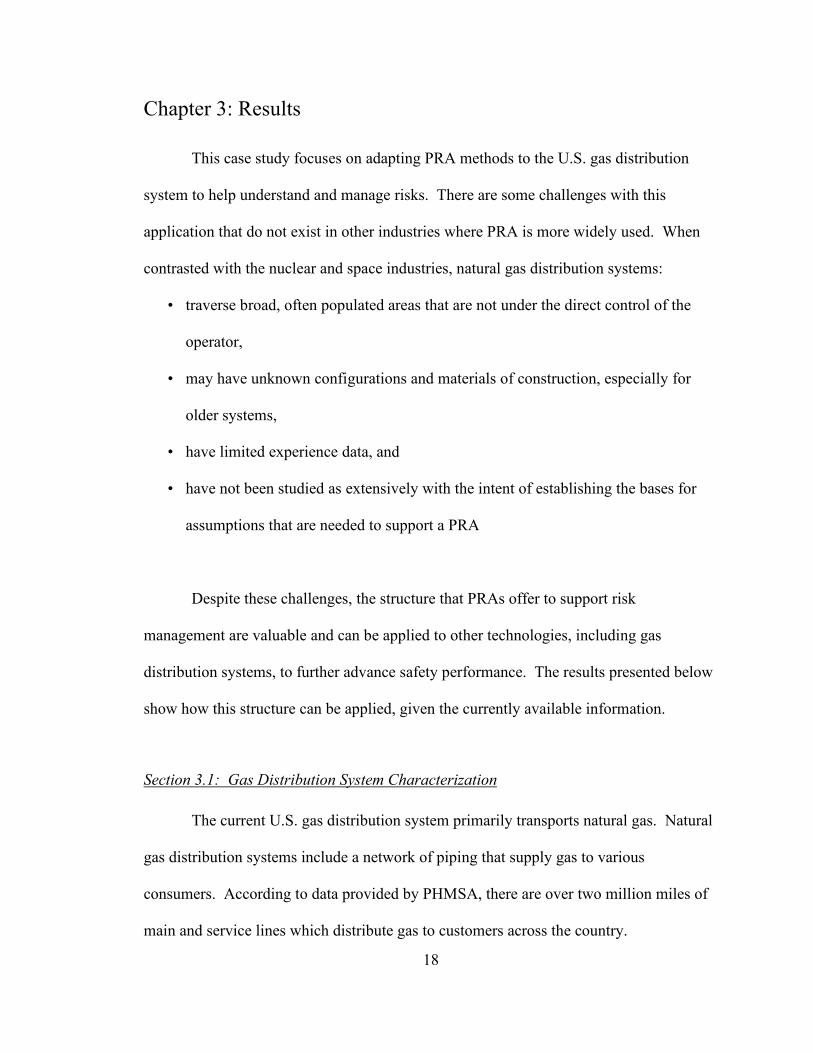
There are several materials that have been used to construct these pipelines, with
the majority being from polyethylene (PE) or coated, cathodically protected (CP) steel.
Most newly constructed gas distribution pipelines are fabricated from PE (Table 2).
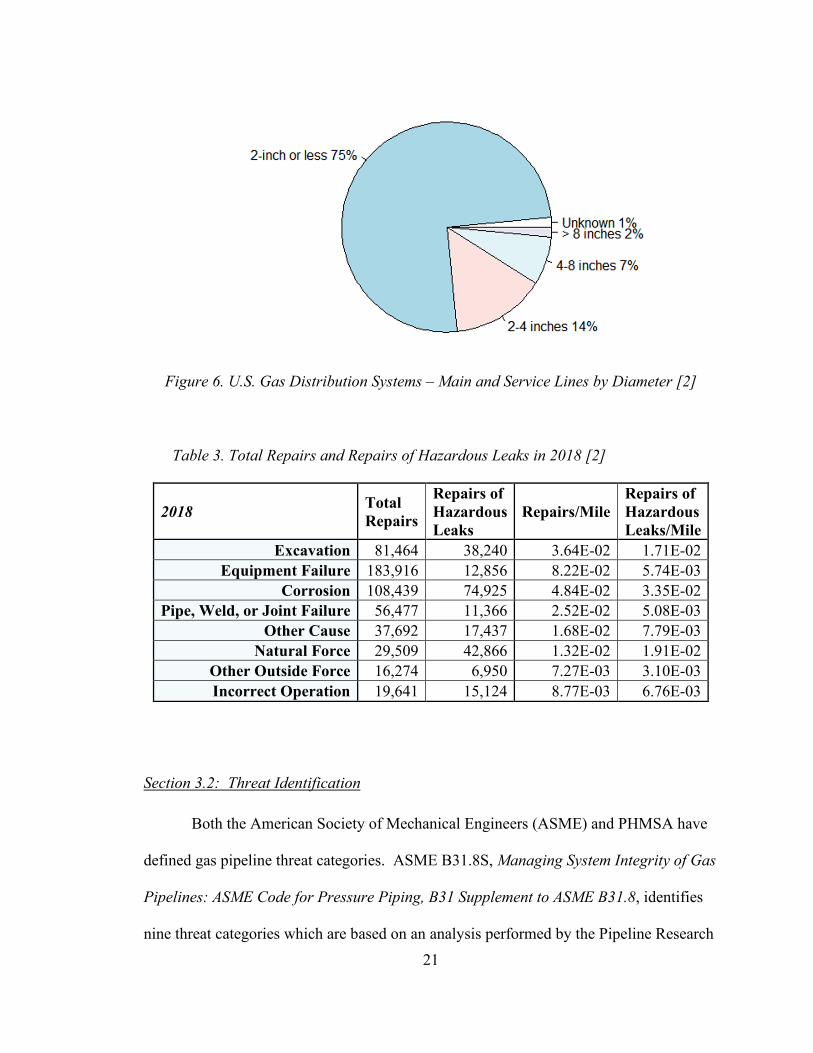
The diameter of pipelines used in gas distribution systems varies. The majority
have a diameter of 2-inches or less (Figure 6).
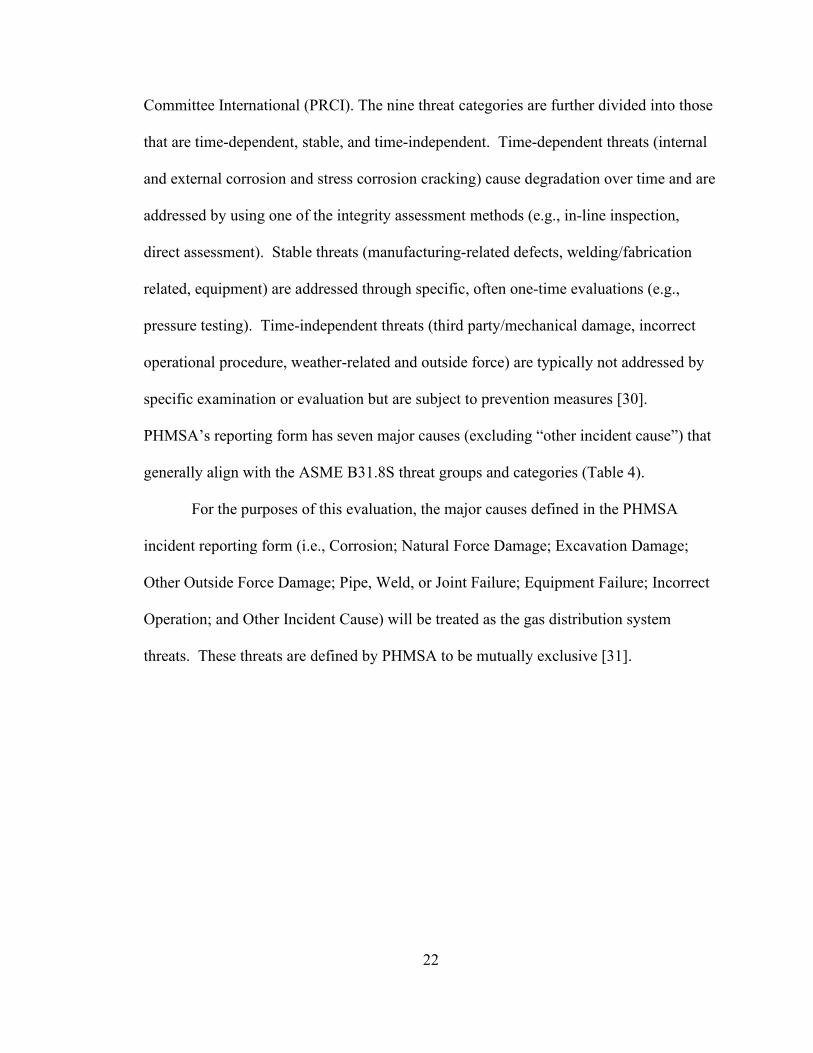
Gas distribution operators track and report leaks that are repaired in a given year
by leak cause (Table 3). The repairs are considered to be associated with a “hazardous”
leak if the operator determines that the leak requires an immediate response. Most
repairs are attributed to equipment failure, corrosion, or excavation damage; most
hazardous repairs are attributed to corrosion, natural force damage, or excavation
damage.
20
Figure 5. U.S. Gas Distribution Systems – Miles of Main and Service Lines by Decade Installed [2]
Table 2. U.S. Gas Distribution Systems – Miles of Main and Service Lines by Material [2]
2010 2018 Polyethylene (PE) 1,201,543 1,424,057
Steel, Cathodically Protected (CP), Coated 668,072 636,457 Steel, Unprotected, Bare 78,826 50,307
Steel, Unprotected, Coated 37,387 36,549 Other 23,431 23,493
Cast/Wrought Iron 34,807 22,952 Steel, CP, Bare 21,058 15,936
Polyvinyl Chloride (PVC) 14,949 11,672 Copper 13,835 9,390
Other Plastic 3,258 4,312 Acrylonitrile-Butadiene-Styrene (ABS) 3,595 2,957
Ductile Iron 796 516 TOTAL 2,101,556 2,238,597
21
Figure 6. U.S. Gas Distribution Systems – Main and Service Lines by Diameter [2]
Table 3. Total Repairs and Repairs of Hazardous Leaks in 2018 [2]
2018 Total Repairs
Repairs of Hazardous Leaks
Repairs/Mile Repairs of Hazardous Leaks/Mile
Excavation 81,464 38,240 3.64E-02 1.71E-02 Equipment Failure 183,916 12,856 8.22E-02 5.74E-03
Corrosion 108,439 74,925 4.84E-02 3.35E-02 Pipe, Weld, or Joint Failure 56,477 11,366 2.52E-02 5.08E-03
Other Cause 37,692 17,437 1.68E-02 7.79E-03 Natural Force 29,509 42,866 1.32E-02 1.91E-02
Other Outside Force 16,274 6,950 7.27E-03 3.10E-03 Incorrect Operation 19,641 15,124 8.77E-03 6.76E-03
Section 3.2: Threat Identification
Both the American Society of Mechanical Engineers (ASME) and PHMSA have
defined gas pipeline threat categories. ASME B31.8S, Managing System Integrity of Gas
Pipelines: ASME Code for Pressure Piping, B31 Supplement to ASME B31.8, identifies
nine threat categories which are based on an analysis performed by the Pipeline Research
22
Committee International (PRCI). The nine threat categories are further divided into those
that are time-dependent, stable, and time-independent. Time-dependent threats (internal
and external corrosion and stress corrosion cracking) cause degradation over time and are
addressed by using one of the integrity assessment methods (e.g., in-line inspection,
direct assessment). Stable threats (manufacturing-related defects, welding/fabrication
related, equipment) are addressed through specific, often one-time evaluations (e.g.,
pressure testing). Time-independent threats (third party/mechanical damage, incorrect
operational procedure, weather-related and outside force) are typically not addressed by
specific examination or evaluation but are subject to prevention measures [30].
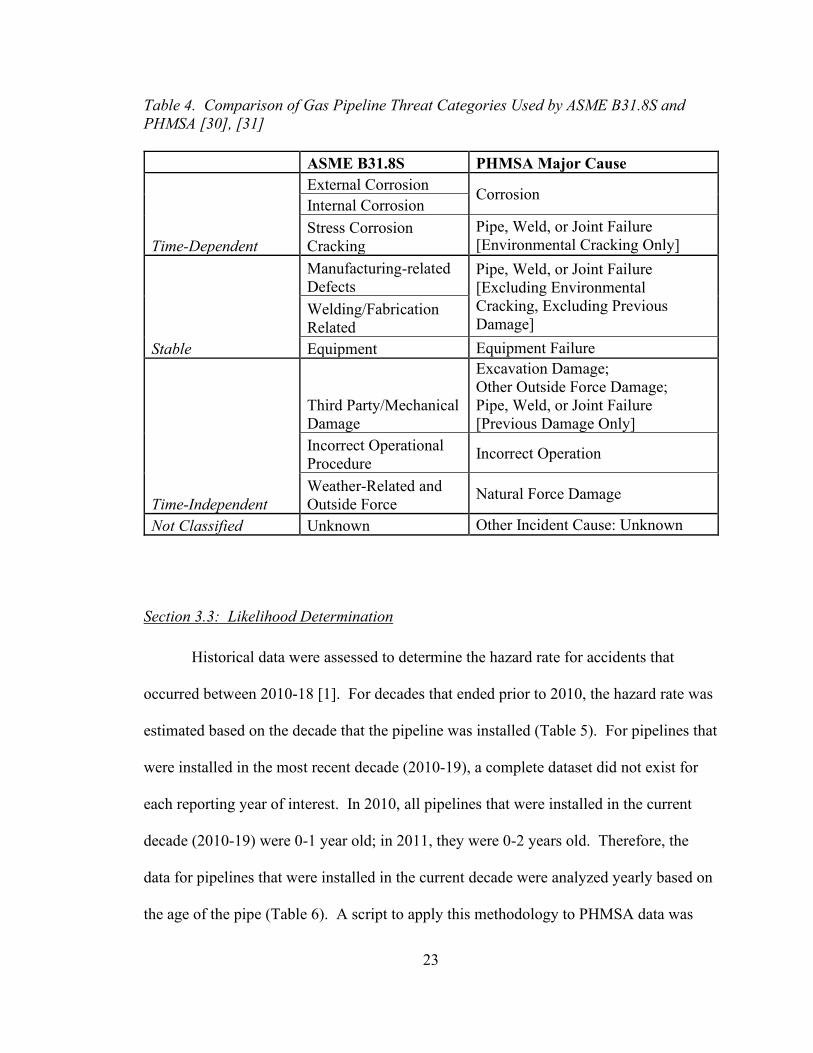
PHMSA’s reporting form has seven major causes (excluding “other incident cause”) that
generally align with the ASME B31.8S threat groups and categories (Table 4).
For the purposes of this evaluation, the major causes defined in the PHMSA
incident reporting form (i.e., Corrosion; Natural Force Damage; Excavation Damage;
Other Outside Force Damage; Pipe, Weld, or Joint Failure; Equipment Failure; Incorrect
Operation; and Other Incident Cause) will be treated as the gas distribution system
threats. These threats are defined by PHMSA to be mutually exclusive [31].
23
Table 4. Comparison of Gas Pipeline Threat Categories Used by ASME B31.8S and PHMSA [30], [31]
ASME B31.8S PHMSA Major Cause
Time-Dependent
External Corrosion Corrosion Internal Corrosion Stress Corrosion Cracking
Pipe, Weld, or Joint Failure [Environmental Cracking Only]
Stable
Manufacturing-related Defects
Pipe, Weld, or Joint Failure [Excluding Environmental Cracking, Excluding Previous Damage]
Welding/Fabrication Related Equipment Equipment Failure
Time-Independent
Third Party/Mechanical Damage
Excavation Damage; Other Outside Force Damage; Pipe, Weld, or Joint Failure [Previous Damage Only]
Incorrect Operational Procedure Incorrect Operation
Weather-Related and Outside Force Natural Force Damage
Not Classified Unknown Other Incident Cause: Unknown
Section 3.3: Likelihood Determination
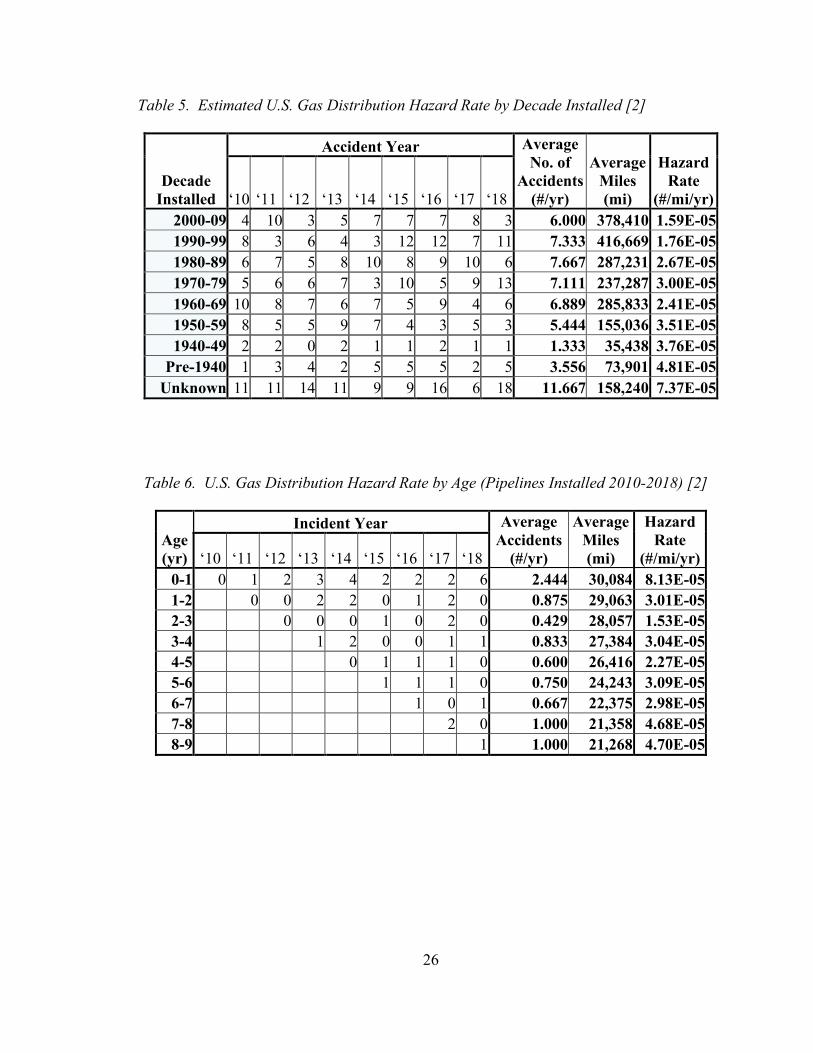
Historical data were assessed to determine the hazard rate for accidents that
occurred between 2010-18 [1]. For decades that ended prior to 2010, the hazard rate was
estimated based on the decade that the pipeline was installed (Table 5). For pipelines that
were installed in the most recent decade (2010-19), a complete dataset did not exist for
each reporting year of interest. In 2010, all pipelines that were installed in the current
decade (2010-19) were 0-1 year old; in 2011, they were 0-2 years old. Therefore, the
data for pipelines that were installed in the current decade were analyzed yearly based on
the age of the pipe (Table 6). A script to apply this methodology to PHMSA data was
24
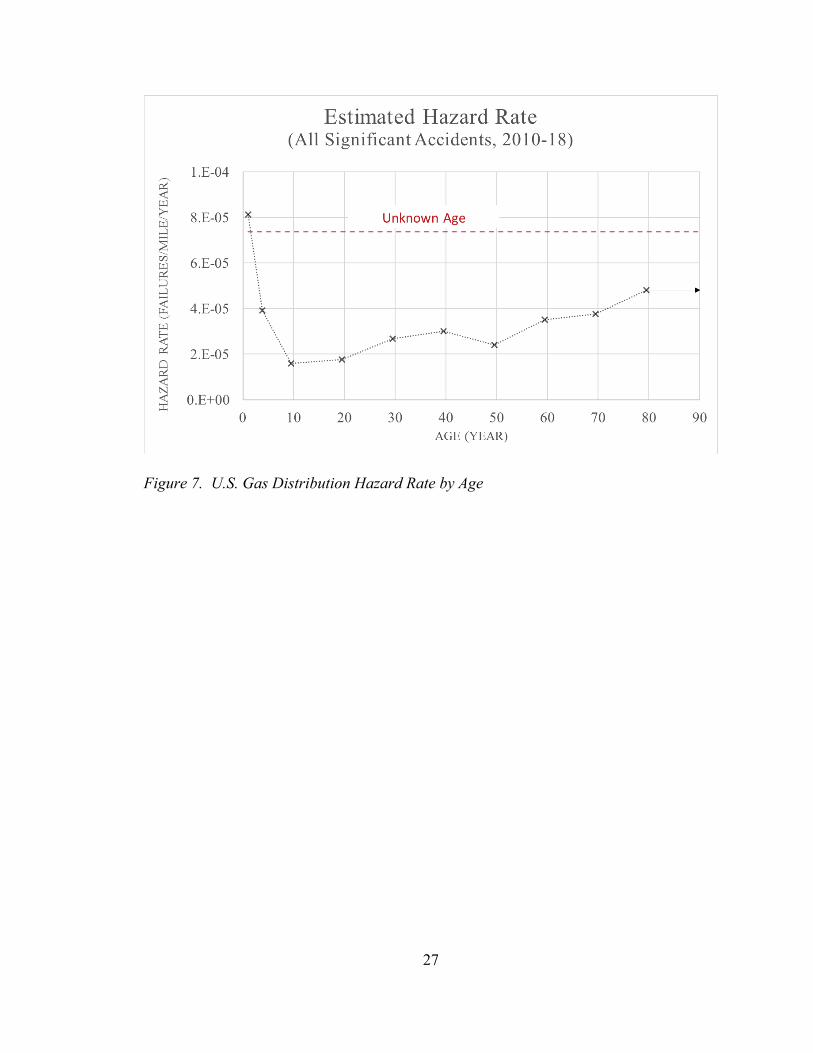
developed in R [5]. The overall resulting hazard curve is shown in Figure 7. The
contribution from each cause is shown in Figure 8 and Figure 9. Note that some data was
grouped in Figure 7 through Figure 9 and the data points do not directly correspond to
those in Table 6.
The higher hazard rate early in life was attributed to the following causes:
excavation, other outside force, equipment, and incorrect operations. Three of these
causes were designated to be “time-independent,” or random, in ASME B31.8S. The
remaining cause was designated “stable” in ASME B31.8S. The higher hazard at the
beginning of life appeared to be due to increased construction activity in the vicinity of
the new pipeline for excavation, equipment, and incorrect operation failures. For failures
attributed to other outside forces, increased construction activities and unexpected
environmental conditions (e.g., water jet or electrical arcing from nearby utilities)
explained the higher hazard early in life. Initiatives to flatten the hazard curve early in
life may focus on enhancing existing processes to perform new construction safely,
expanding public outreach related to new construction projects, and developing more
robust processes to define and design for actual in-service conditions.
The increasing hazard rate later in life was attributed to corrosion and natural
force failures. Higher hazard rates towards the end of life are typically attributed to
degradation, which explains the response for corrosion failures. For natural force
damage, the hazard rate may increase later in life due to less mature requirements that
were in place at the time the system was installed (before 1950), or degradation that may
have compromised performance during weather-related events such as cold temperatures.
Initiatives to flatten the hazard curve later in life may focus on enhancing integrity
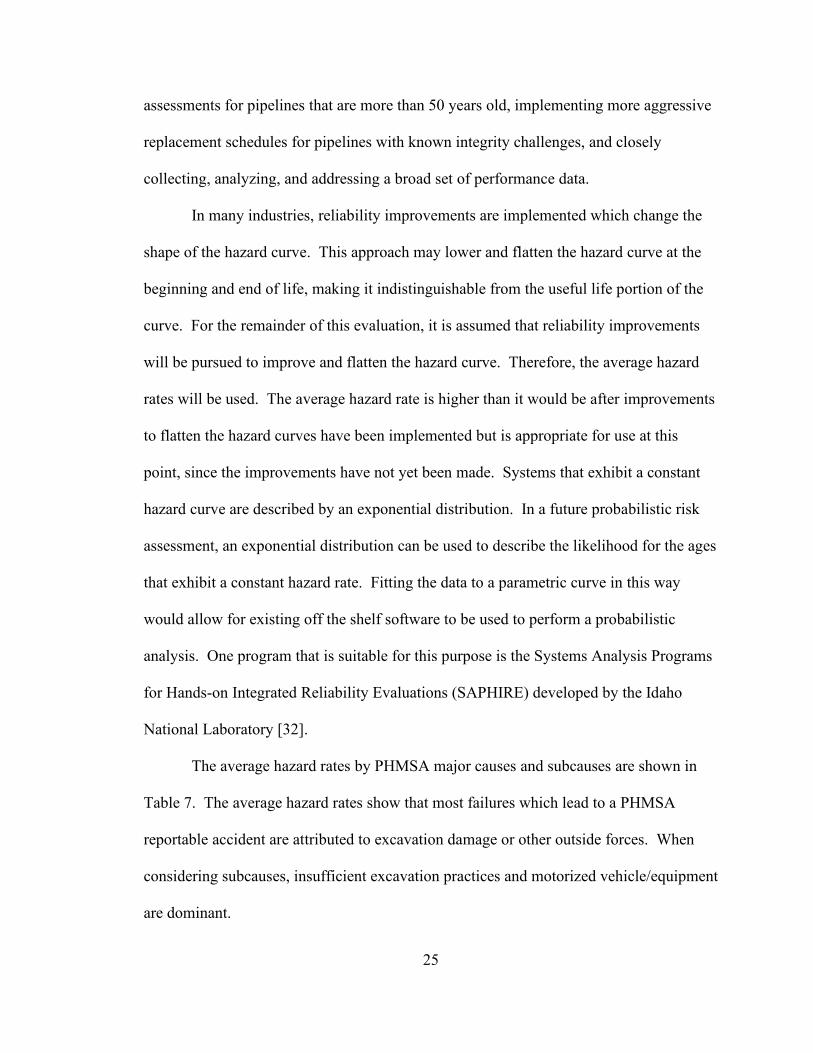
25
assessments for pipelines that are more than 50 years old, implementing more aggressive
replacement schedules for pipelines with known integrity challenges, and closely
collecting, analyzing, and addressing a broad set of performance data.
In many industries, reliability improvements are implemented which change the
shape of the hazard curve. This approach may lower and flatten the hazard curve at the
beginning and end of life, making it indistinguishable from the useful life portion of the
curve. For the remainder of this evaluation, it is assumed that reliability improvements
will be pursued to improve and flatten the hazard curve. Therefore, the average hazard
rates will be used. The average hazard rate is higher than it would be after improvements
to flatten the hazard curves have been implemented but is appropriate for use at this
point, since the improvements have not yet been made. Systems that exhibit a constant
hazard curve are described by an exponential distribution. In a future probabilistic risk
assessment, an exponential distribution can be used to describe the likelihood for the ages
that exhibit a constant hazard rate. Fitting the data to a parametric curve in this way
would allow for existing off the shelf software to be used to perform a probabilistic
analysis. One program that is suitable for this purpose is the Systems Analysis Programs
for Hands-on Integrated Reliability Evaluations (SAPHIRE) developed by the Idaho
National Laboratory [32].
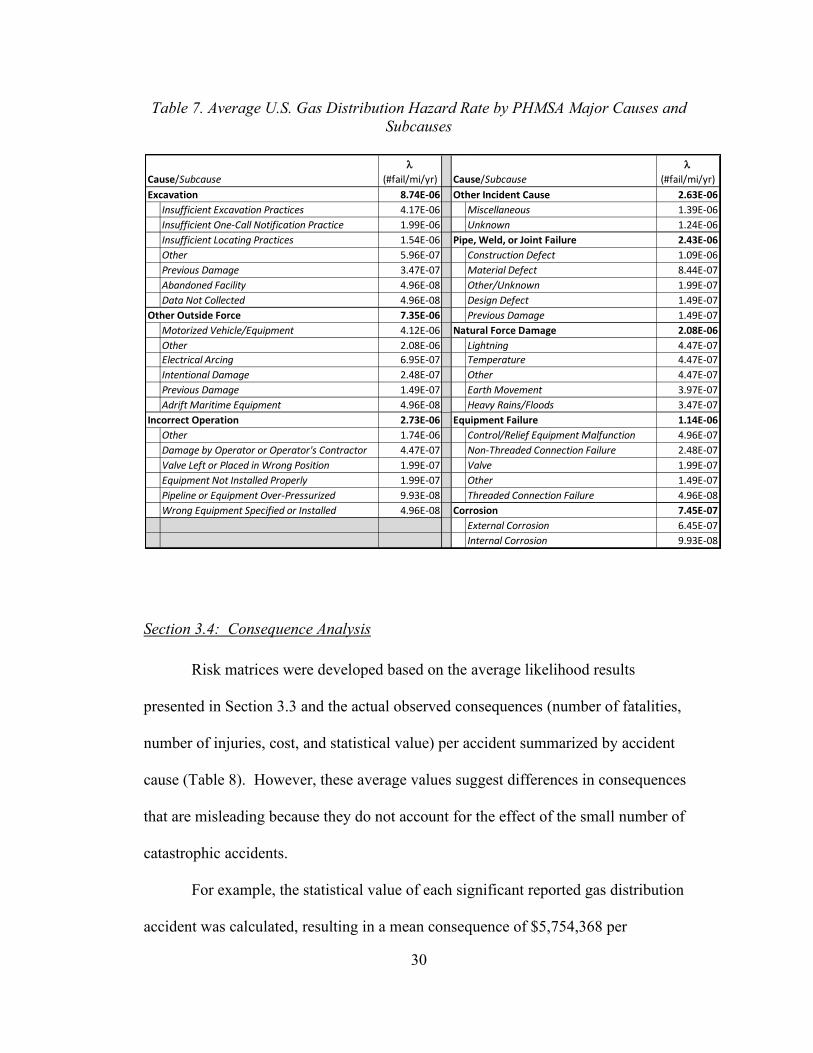
The average hazard rates by PHMSA major causes and subcauses are shown in
Table 7. The average hazard rates show that most failures which lead to a PHMSA
reportable accident are attributed to excavation damage or other outside forces. When
considering subcauses, insufficient excavation practices and motorized vehicle/equipment
are dominant.
26
Table 5. Estimated U.S. Gas Distribution Hazard Rate by Decade Installed [2]
Decade Installed
Accident Year Average No. of
Accidents (#/yr)
Average Miles (mi)
Hazard Rate
(#/mi/yr) ‘10 ‘11 ‘12 ‘13 ‘14 ‘15 ‘16 ‘17 ‘18 2000-09 4 10 3 5 7 7 7 8 3 6.000 378,410 1.59E-05 1990-99 8 3 6 4 3 12 12 7 11 7.333 416,669 1.76E-05 1980-89 6 7 5 8 10 8 9 10 6 7.667 287,231 2.67E-05 1970-79 5 6 6 7 3 10 5 9 13 7.111 237,287 3.00E-05 1960-69 10 8 7 6 7 5 9 4 6 6.889 285,833 2.41E-05 1950-59 8 5 5 9 7 4 3 5 3 5.444 155,036 3.51E-05 1940-49 2 2 0 2 1 1 2 1 1 1.333 35,438 3.76E-05
Pre-1940 1 3 4 2 5 5 5 2 5 3.556 73,901 4.81E-05 Unknown 11 11 14 11 9 9 16 6 18 11.667 158,240 7.37E-05
Table 6. U.S. Gas Distribution Hazard Rate by Age (Pipelines Installed 2010-2018) [2]
Age (yr)
Incident Year Average Accidents
(#/yr)
Average Miles (mi)
Hazard Rate
(#/mi/yr) ‘10 ‘11 ‘12 ‘13 ‘14 ‘15 ‘16 ‘17 ‘18 0-1 0 1 2 3 4 2 2 2 6 2.444 30,084 8.13E-05 1-2 0 0 2 2 0 1 2 0 0.875 29,063 3.01E-05 2-3 0 0 0 1 0 2 0 0.429 28,057 1.53E-05 3-4 1 2 0 0 1 1 0.833 27,384 3.04E-05 4-5 0 1 1 1 0 0.600 26,416 2.27E-05 5-6 1 1 1 0 0.750 24,243 3.09E-05 6-7 1 0 1 0.667 22,375 2.98E-05 7-8 2 0 1.000 21,358 4.68E-05 8-9 1 1.000 21,268 4.70E-05
27
Figure 7. U.S. Gas Distribution Hazard Rate by Age
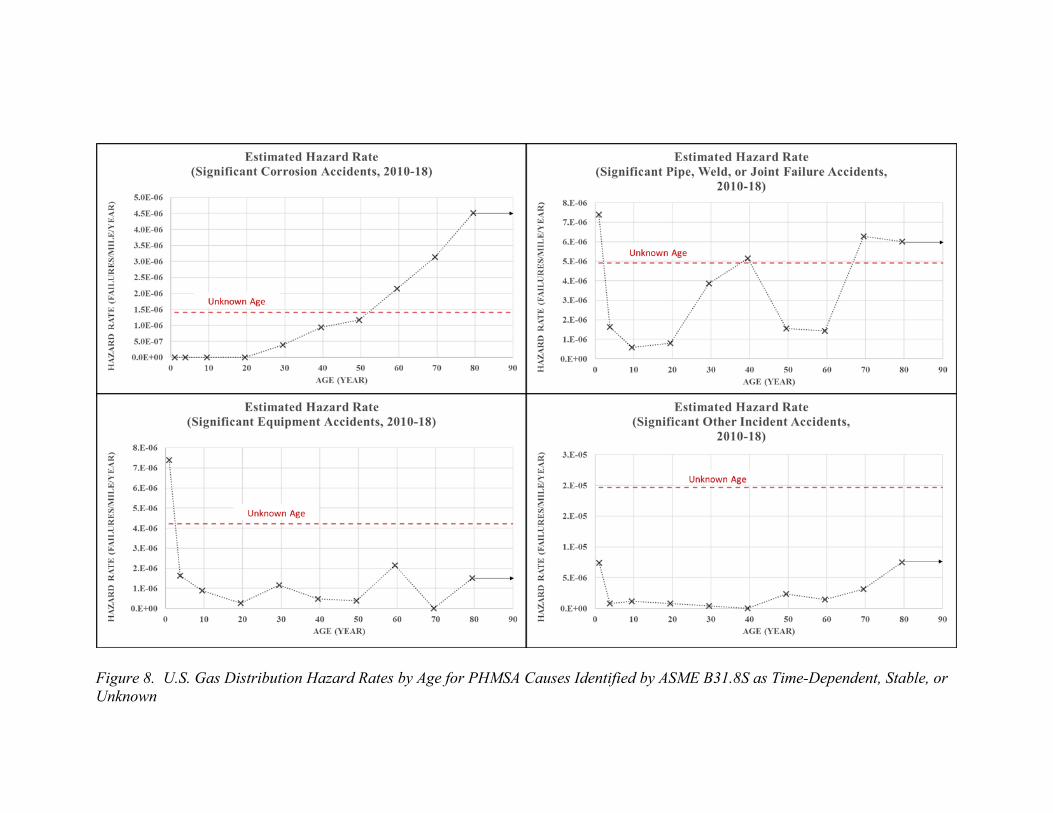
Figure 8. U.S. Gas Distribution Hazard Rates by Age for PHMSA Causes Identified by ASME B31.8S as Time-Dependent, Stable, or Unknown
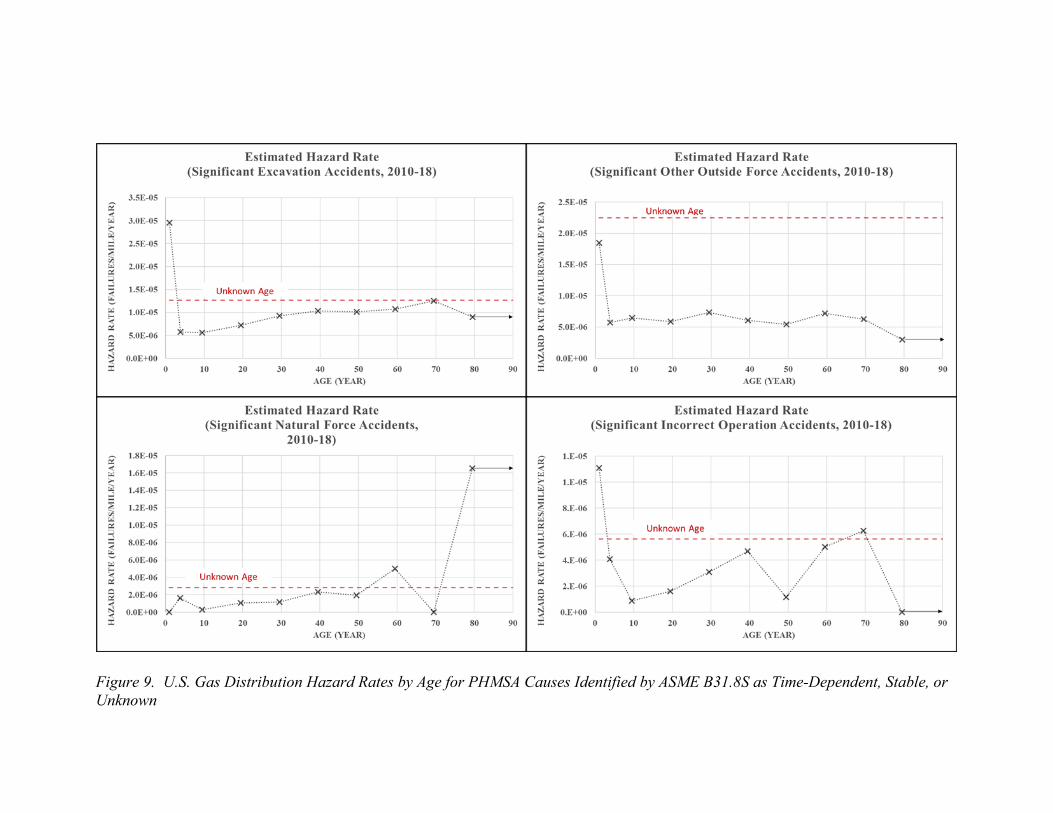
Figure 9. U.S. Gas Distribution Hazard Rates by Age for PHMSA Causes Identified by ASME B31.8S as Time-Dependent, Stable, or Unknown
30
Table 7. Average U.S. Gas Distribution Hazard Rate by PHMSA Major Causes and Subcauses
Section 3.4: Consequence Analysis
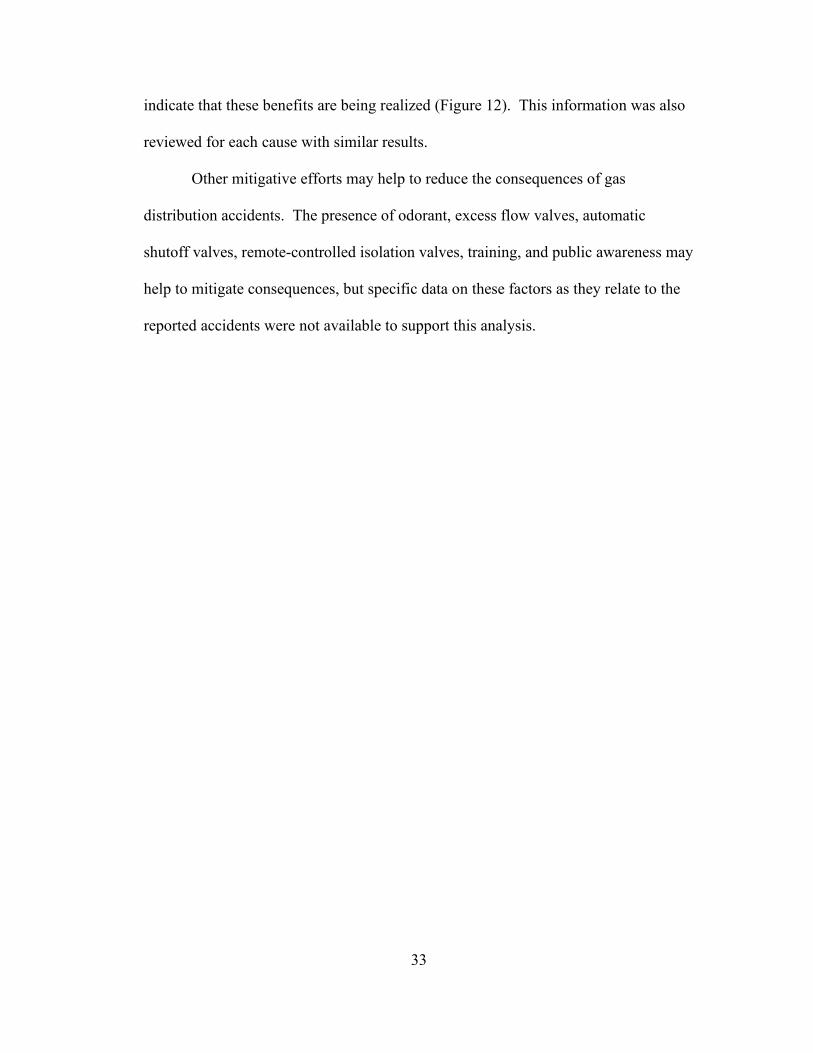
Risk matrices were developed based on the average likelihood results
presented in Section 3.3 and the actual observed consequences (number of fatalities,
number of injuries, cost, and statistical value) per accident summarized by accident
cause (Table 8). However, these average values suggest differences in consequences
that are misleading because they do not account for the effect of the small number of
catastrophic accidents.
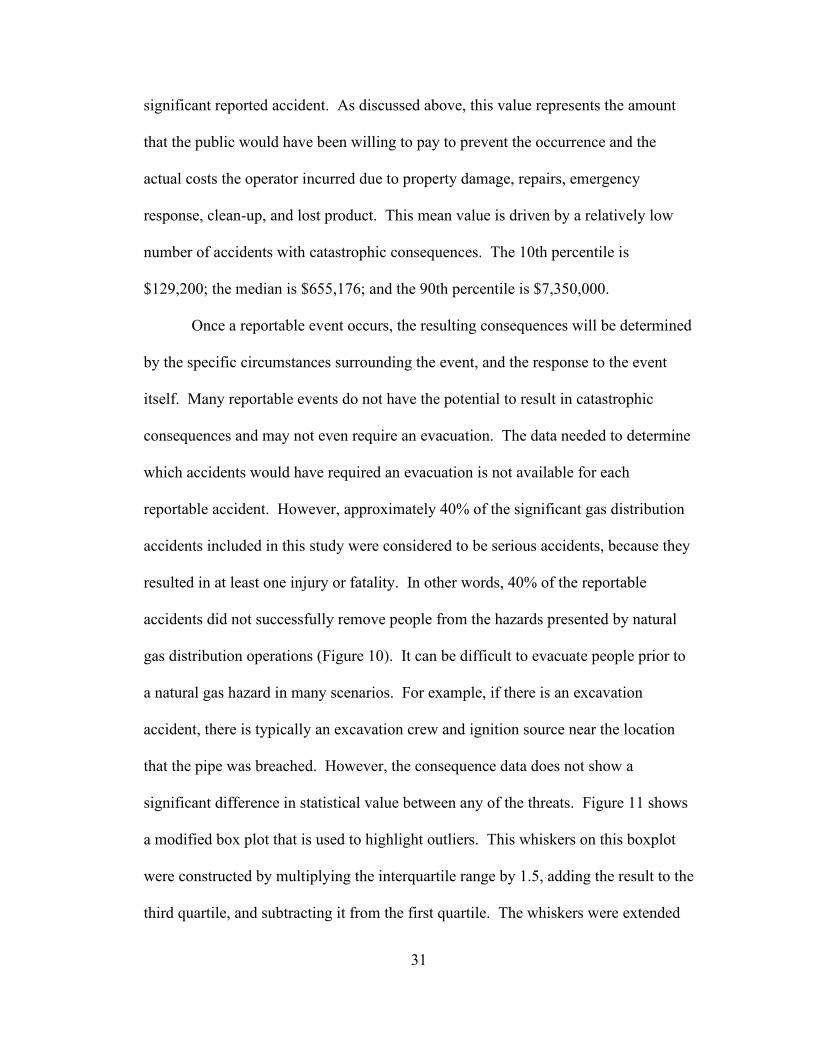
For example, the statistical value of each significant reported gas distribution
accident was calculated, resulting in a mean consequence of $5,754,368 per
Cause/Subcauseλ
(#fail/mi/yr) Cause/Subcauseλ
(#fail/mi/yr)Excavation 8.74E-06 Other Incident Cause 2.63E-06
Insufficient Excavation Practices 4.17E-06 Miscellaneous 1.39E-06Insufficient One-Call Notification Practice 1.99E-06 Unknown 1.24E-06Insufficient Locating Practices 1.54E-06 Pipe, Weld, or Joint Failure 2.43E-06Other 5.96E-07 Construction Defect 1.09E-06Previous Damage 3.47E-07 Material Defect 8.44E-07Abandoned Facility 4.96E-08 Other/Unknown 1.99E-07Data Not Collected 4.96E-08 Design Defect 1.49E-07
Other Outside Force 7.35E-06 Previous Damage 1.49E-07Motorized Vehicle/Equipment 4.12E-06 Natural Force Damage 2.08E-06Other 2.08E-06 Lightning 4.47E-07Electrical Arcing 6.95E-07 Temperature 4.47E-07Intentional Damage 2.48E-07 Other 4.47E-07Previous Damage 1.49E-07 Earth Movement 3.97E-07Adrift Maritime Equipment 4.96E-08 Heavy Rains/Floods 3.47E-07
Incorrect Operation 2.73E-06 Equipment Failure 1.14E-06Other 1.74E-06 Control/Relief Equipment Malfunction 4.96E-07Damage by Operator or Operator's Contractor 4.47E-07 Non-Threaded Connection Failure 2.48E-07Valve Left or Placed in Wrong Position 1.99E-07 Valve 1.99E-07Equipment Not Installed Properly 1.99E-07 Other 1.49E-07Pipeline or Equipment Over-Pressurized 9.93E-08 Threaded Connection Failure 4.96E-08Wrong Equipment Specified or Installed 4.96E-08 Corrosion 7.45E-07
External Corrosion 6.45E-07Internal Corrosion 9.93E-08
31
significant reported accident. As discussed above, this value represents the amount
that the public would have been willing to pay to prevent the occurrence and the
actual costs the operator incurred due to property damage, repairs, emergency
response, clean-up, and lost product. This mean value is driven by a relatively low
number of accidents with catastrophic consequences. The 10th percentile is
$129,200; the median is $655,176; and the 90th percentile is $7,350,000.
Once a reportable event occurs, the resulting consequences will be determined
by the specific circumstances surrounding the event, and the response to the event
itself. Many reportable events do not have the potential to result in catastrophic
consequences and may not even require an evacuation. The data needed to determine
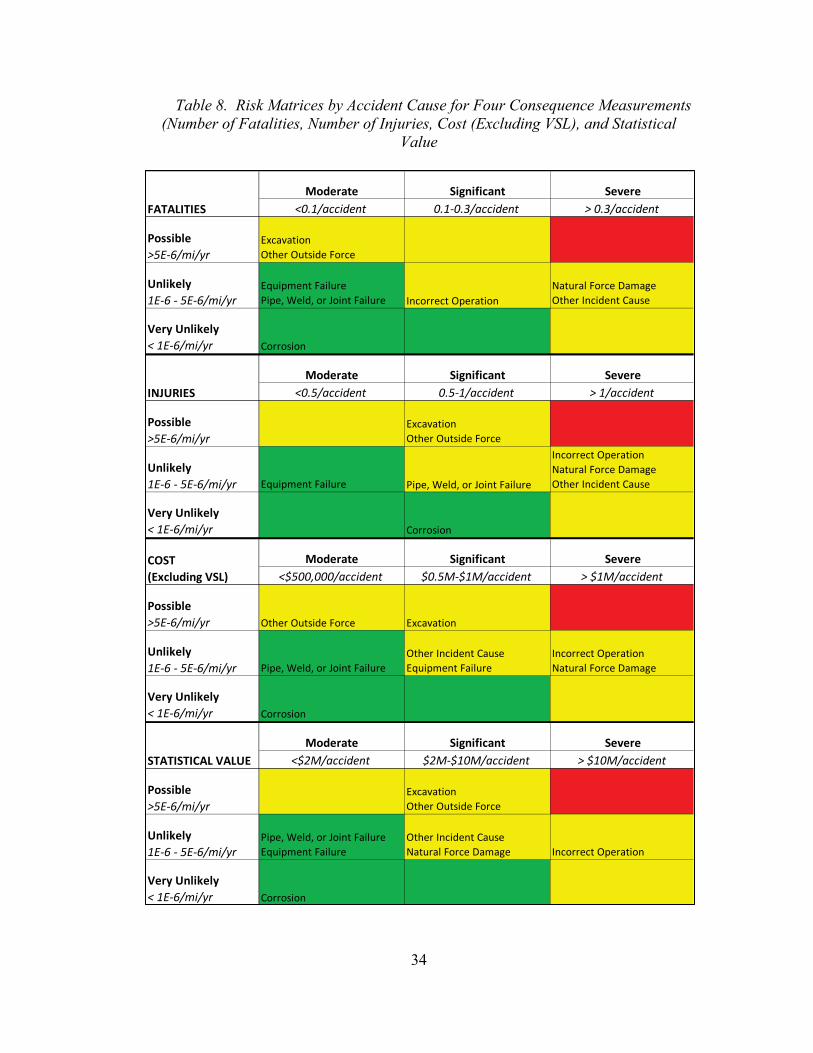
which accidents would have required an evacuation is not available for each
reportable accident. However, approximately 40% of the significant gas distribution
accidents included in this study were considered to be serious accidents, because they
resulted in at least one injury or fatality. In other words, 40% of the reportable
accidents did not successfully remove people from the hazards presented by natural
gas distribution operations (Figure 10). It can be difficult to evacuate people prior to
a natural gas hazard in many scenarios. For example, if there is an excavation
accident, there is typically an excavation crew and ignition source near the location
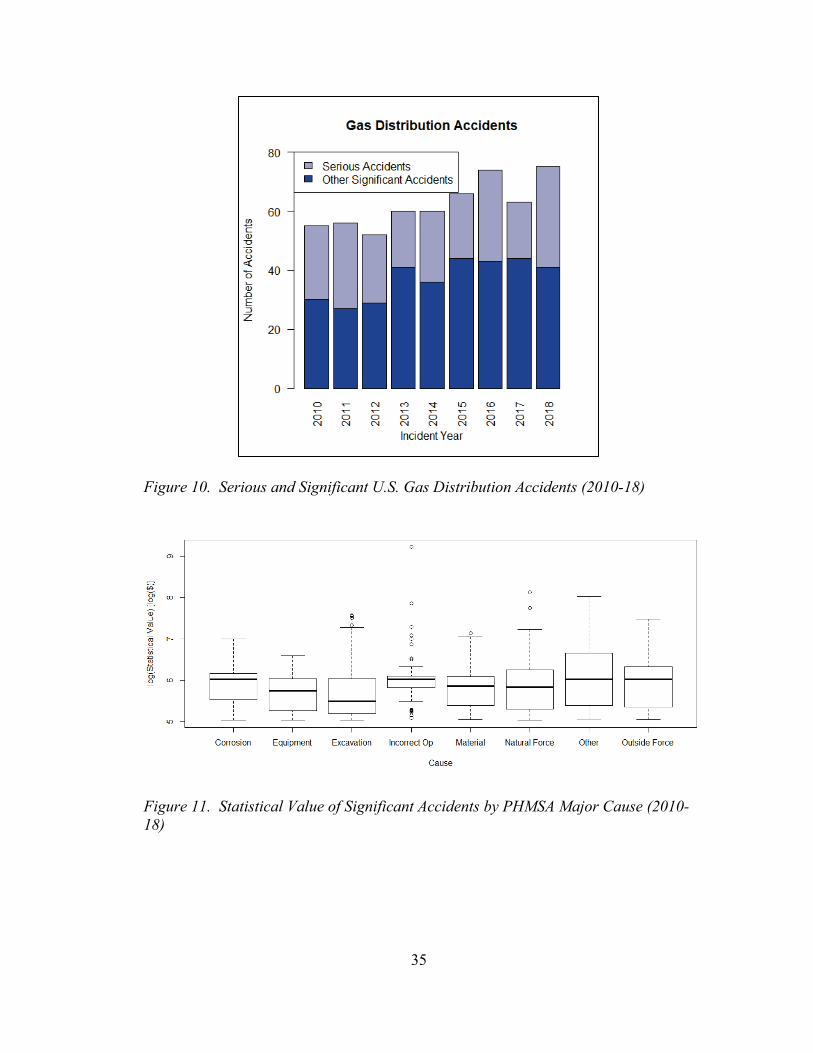
that the pipe was breached. However, the consequence data does not show a
significant difference in statistical value between any of the threats. Figure 11 shows
a modified box plot that is used to highlight outliers. This whiskers on this boxplot
were constructed by multiplying the interquartile range by 1.5, adding the result to the
third quartile, and subtracting it from the first quartile. The whiskers were extended
32
to include the maximum and minimum data points within this range. All data points
outside of this range were indicated by circular markers. The modified box plot is
used throughout this section.
Another measure that is often used as an indication of potential gas
distribution system consequences is the class location. A gas pipeline’s class location
broadly indicates the level of potential consequences for a pipeline release based upon
population density along the pipeline. According to 49 CFR 192.5(a), class locations
are specified by using a “sliding mile” that extends 220 yards on both sides of the
centerline of a pipeline. The number of buildings within this sliding mile at any point
during the mile’s movement determines the class location for the entire mile of
pipeline contained within the sliding mile. Class 1 locations have 10 or fewer
buildings intended for human occupancy. Class 2 locations contain more than 10 but
fewer than 46 buildings intended for human occupancy. Class 3 locations contain 46
or more buildings or an outside area that is occupied by 20 or more persons on at least
5 days a week for 10 weeks in any 12-month period. Class 4 locations have a
prevalence of buildings of at least four stories in height. Class locations are used to
differentiate some regulatory requirements so that they are commensurate with the
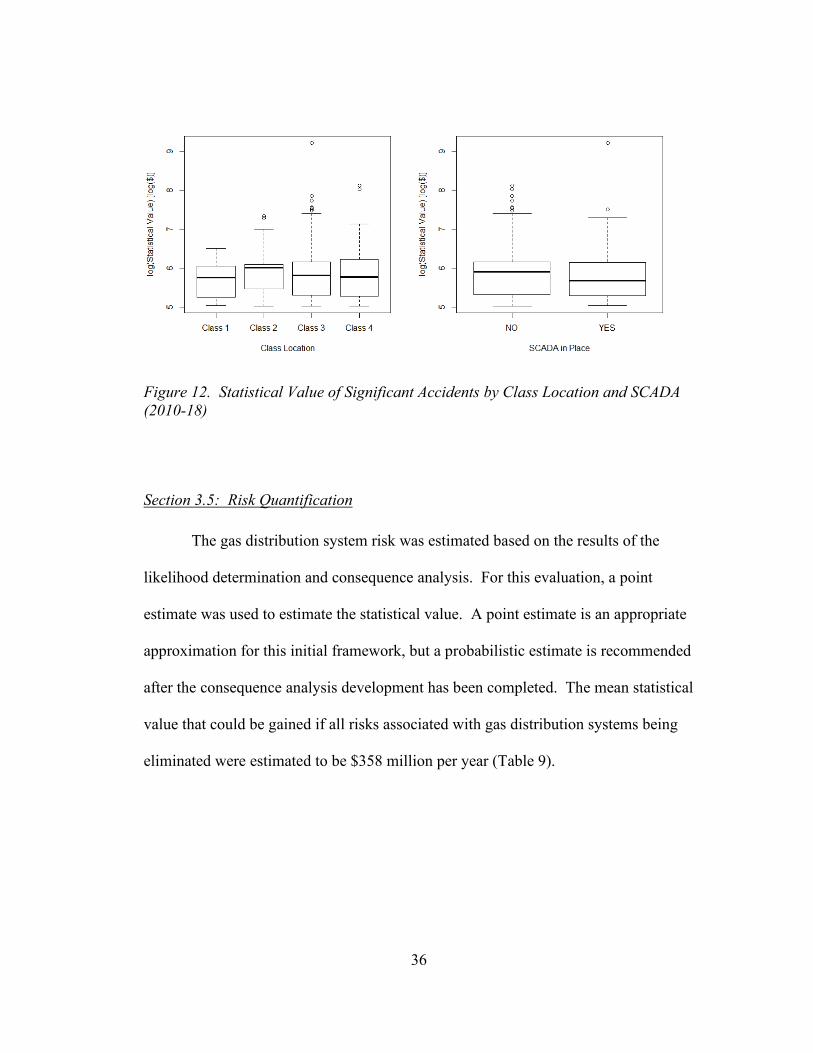
potential consequences. The current data shows that the statistical values of accidents
are similar for each class location, but the more catastrophic accidents may be more
prevalent in Class 3 and Class 4 locations (Figure 12).
Similarly, SCADA systems have the potential to significantly reduce the
consequences of a gas distribution accident. However, the available data does not
33
indicate that these benefits are being realized (Figure 12). This information was also
reviewed for each cause with similar results.
Other mitigative efforts may help to reduce the consequences of gas
distribution accidents. The presence of odorant, excess flow valves, automatic
shutoff valves, remote-controlled isolation valves, training, and public awareness may
help to mitigate consequences, but specific data on these factors as they relate to the
reported accidents were not available to support this analysis.
34
Table 8. Risk Matrices by Accident Cause for Four Consequence Measurements (Number of Fatalities, Number of Injuries, Cost (Excluding VSL), and Statistical
Value
Moderate Significant Severe<0.1/accident 0.1-0.3/accident > 0.3/accident
Possible>5E-6/mi/yr
ExcavationOther Outside Force
Unlikely1E-6 - 5E-6/mi/yr
Equipment FailurePipe, Weld, or Joint Failure Incorrect Operation
Natural Force DamageOther Incident Cause
Very Unlikely< 1E-6/mi/yr Corrosion
Moderate Significant Severe<0.5/accident 0.5-1/accident > 1/accident
Possible>5E-6/mi/yr
ExcavationOther Outside Force
Unlikely1E-6 - 5E-6/mi/yr Equipment Failure Pipe, Weld, or Joint Failure
Incorrect OperationNatural Force DamageOther Incident Cause
Very Unlikely< 1E-6/mi/yr Corrosion
Moderate Significant Severe<$500,000/accident $0.5M-$1M/accident > $1M/accident
Possible>5E-6/mi/yr Other Outside Force Excavation
Unlikely1E-6 - 5E-6/mi/yr Pipe, Weld, or Joint Failure
Other Incident CauseEquipment Failure
Incorrect OperationNatural Force Damage
Very Unlikely< 1E-6/mi/yr Corrosion
Moderate Significant Severe<$2M/accident $2M-$10M/accident > $10M/accident
Possible>5E-6/mi/yr
ExcavationOther Outside Force
Unlikely1E-6 - 5E-6/mi/yr
Pipe, Weld, or Joint FailureEquipment Failure
Other Incident CauseNatural Force Damage Incorrect Operation
Very Unlikely< 1E-6/mi/yr Corrosion
FATALITIES
INJURIES
COST(Excluding VSL)
STATISTICAL VALUE
35
Figure 10. Serious and Significant U.S. Gas Distribution Accidents (2010-18)
Figure 11. Statistical Value of Significant Accidents by PHMSA Major Cause (2010-18)
36
Figure 12. Statistical Value of Significant Accidents by Class Location and SCADA (2010-18)
Section 3.5: Risk Quantification
The gas distribution system risk was estimated based on the results of the
likelihood determination and consequence analysis. For this evaluation, a point
estimate was used to estimate the statistical value. A point estimate is an appropriate
approximation for this initial framework, but a probabilistic estimate is recommended
after the consequence analysis development has been completed. The mean statistical
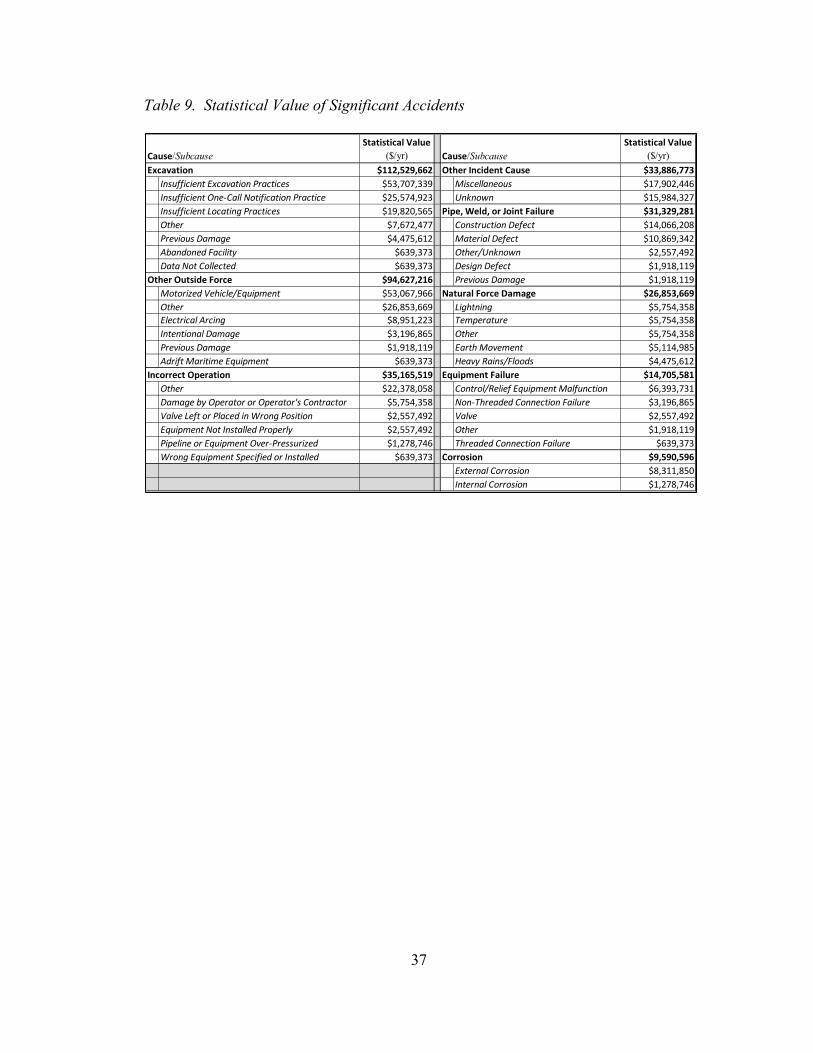
value that could be gained if all risks associated with gas distribution systems being
eliminated were estimated to be $358 million per year (Table 9).
37
Table 9. Statistical Value of Significant Accidents
Cause/SubcauseStatistical Value
($/yr) Cause/SubcauseStatistical Value
($/yr)Excavation $112,529,662 Other Incident Cause $33,886,773
Insufficient Excavation Practices $53,707,339 Miscellaneous $17,902,446Insufficient One-Call Notification Practice $25,574,923 Unknown $15,984,327Insufficient Locating Practices $19,820,565 Pipe, Weld, or Joint Failure $31,329,281Other $7,672,477 Construction Defect $14,066,208Previous Damage $4,475,612 Material Defect $10,869,342Abandoned Facility $639,373 Other/Unknown $2,557,492Data Not Collected $639,373 Design Defect $1,918,119
Other Outside Force $94,627,216 Previous Damage $1,918,119Motorized Vehicle/Equipment $53,067,966 Natural Force Damage $26,853,669Other $26,853,669 Lightning $5,754,358Electrical Arcing $8,951,223 Temperature $5,754,358Intentional Damage $3,196,865 Other $5,754,358Previous Damage $1,918,119 Earth Movement $5,114,985Adrift Maritime Equipment $639,373 Heavy Rains/Floods $4,475,612
Incorrect Operation $35,165,519 Equipment Failure $14,705,581Other $22,378,058 Control/Relief Equipment Malfunction $6,393,731Damage by Operator or Operator's Contractor $5,754,358 Non-Threaded Connection Failure $3,196,865Valve Left or Placed in Wrong Position $2,557,492 Valve $2,557,492Equipment Not Installed Properly $2,557,492 Other $1,918,119Pipeline or Equipment Over-Pressurized $1,278,746 Threaded Connection Failure $639,373Wrong Equipment Specified or Installed $639,373 Corrosion $9,590,596
External Corrosion $8,311,850Internal Corrosion $1,278,746
38
Section 3.6: Uncertainty Evaluation
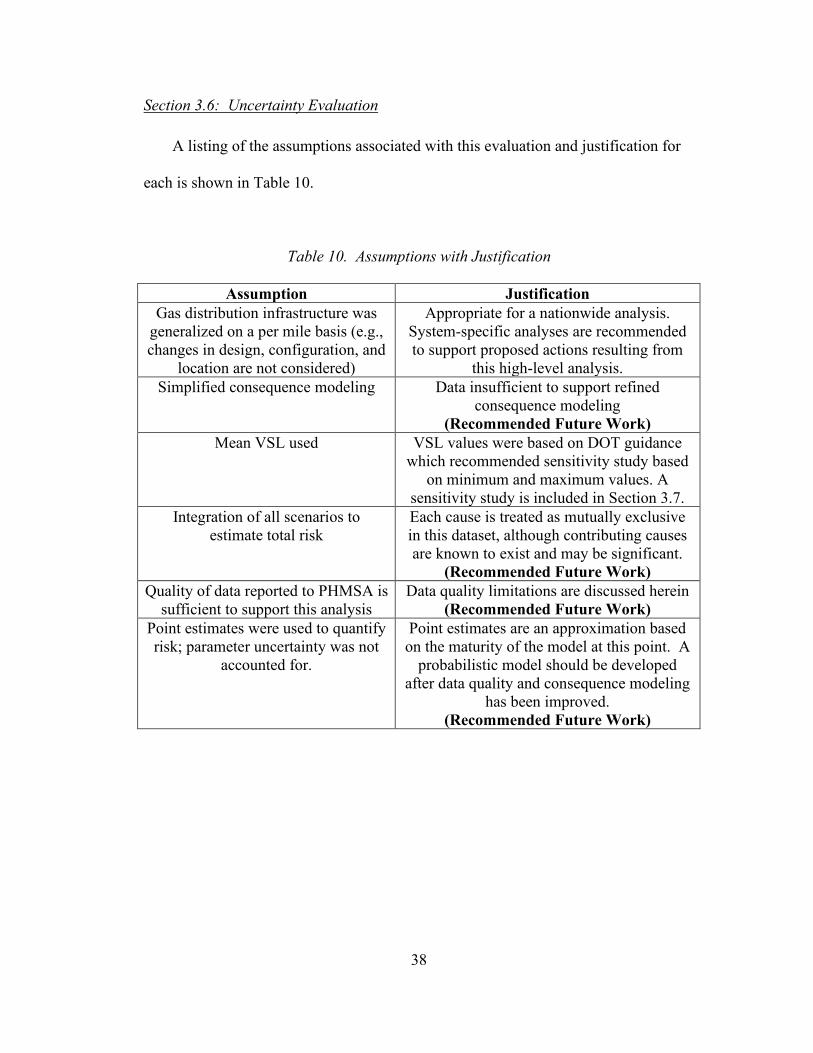
A listing of the assumptions associated with this evaluation and justification for
each is shown in Table 10.
Table 10. Assumptions with Justification
Assumption Justification Gas distribution infrastructure was
generalized on a per mile basis (e.g., changes in design, configuration, and
location are not considered)
Appropriate for a nationwide analysis. System-specific analyses are recommended to support proposed actions resulting from
this high-level analysis. Simplified consequence modeling Data insufficient to support refined
consequence modeling (Recommended Future Work)
Mean VSL used VSL values were based on DOT guidance which recommended sensitivity study based
on minimum and maximum values. A sensitivity study is included in Section 3.7.
Integration of all scenarios to estimate total risk
Each cause is treated as mutually exclusive in this dataset, although contributing causes are known to exist and may be significant.
(Recommended Future Work) Quality of data reported to PHMSA is
sufficient to support this analysis Data quality limitations are discussed herein
(Recommended Future Work) Point estimates were used to quantify risk; parameter uncertainty was not
accounted for.
Point estimates are an approximation based on the maturity of the model at this point. A
probabilistic model should be developed after data quality and consequence modeling
has been improved. (Recommended Future Work)
39
Data Quality Limitations: Many PHMSA reportable gas distribution accidents are
investigated by the operators, state regulators (sometimes with support from
PHMSA), or the National Transportation Safety Board (NTSB). The use of
investigation results to identify meaningful safety improvements within the gas
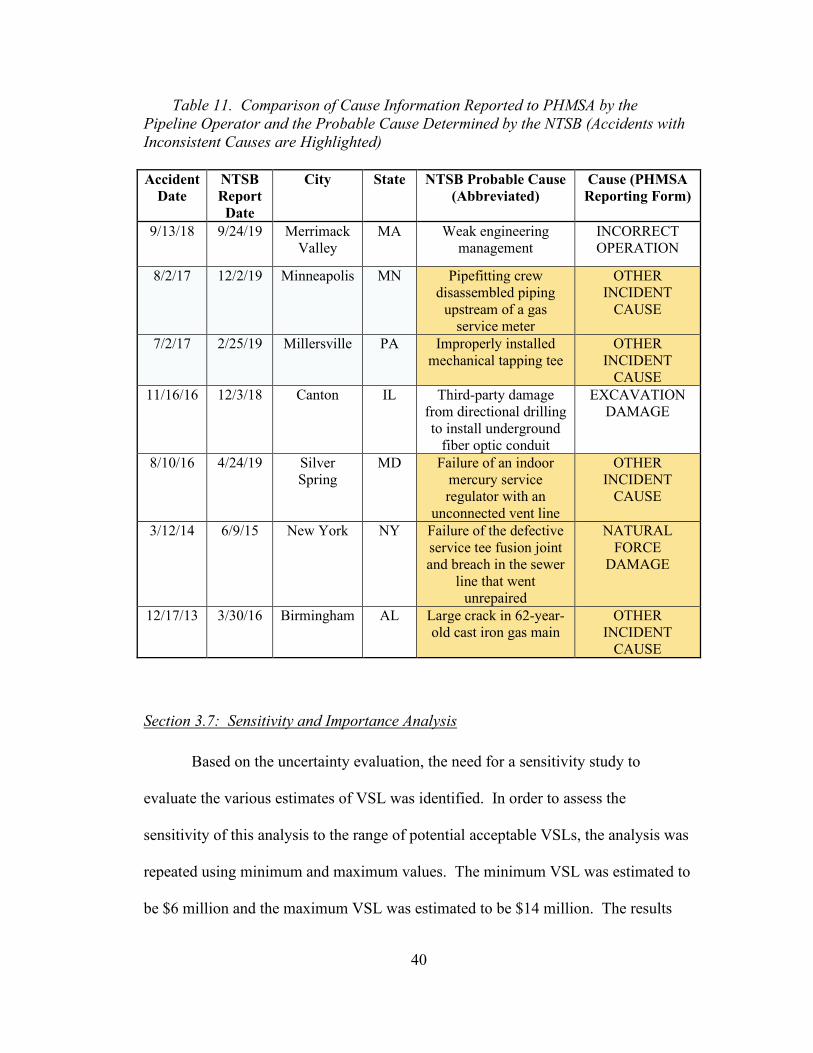
distribution industry requires accurate data to be provided in a timely manner. Table
11 shows a comparison between the cause information reported to PHMSA and the
NTSB determined probable cause for gas distribution accidents investigated by the
NTSB since 2010. Note that the cause information reported to PHMSA is not
consistent with the NTSB determined probable cause for the majority of these
accidents (5/7) which are highlighted in the table. A similar, more comprehensive
comparison could be completed with investigation results from the various State
regulators and/or operators to ensure that the most accurate information is available to
support analysis and consequential safety decisions. In some cases, the operator may
not agree with the probable cause determined by the NTSB, PHMSA, or state
regulator. However, the government-led accident investigations generally employ an
independent assessment of the facts, with input from the operators; they result in the
most useful cause information for this type of analysis.
Future work to capture government-led accident investigation results and
combine this information with the current operator reported PHMSA data could help
to make the most useful data available for future analysis. This future analysis could
then support the identification of performance-based safety enhancements.
40
Table 11. Comparison of Cause Information Reported to PHMSA by the Pipeline Operator and the Probable Cause Determined by the NTSB (Accidents with Inconsistent Causes are Highlighted)
Accident Date
NTSB Report
Date
City State NTSB Probable Cause (Abbreviated)
Cause (PHMSA Reporting Form)
9/13/18 9/24/19 Merrimack Valley
MA Weak engineering management
INCORRECT OPERATION
8/2/17 12/2/19 Minneapolis MN Pipefitting crew disassembled piping
upstream of a gas service meter
OTHER INCIDENT
CAUSE
7/2/17 2/25/19 Millersville PA Improperly installed mechanical tapping tee
OTHER INCIDENT
CAUSE 11/16/16 12/3/18 Canton IL Third-party damage
from directional drilling to install underground
fiber optic conduit
EXCAVATION DAMAGE
8/10/16 4/24/19 Silver Spring
MD Failure of an indoor mercury service regulator with an
unconnected vent line
OTHER INCIDENT
CAUSE
3/12/14 6/9/15 New York NY Failure of the defective service tee fusion joint and breach in the sewer
line that went unrepaired
NATURAL FORCE
DAMAGE
12/17/13 3/30/16 Birmingham AL Large crack in 62-year-old cast iron gas main
OTHER INCIDENT
CAUSE
Section 3.7: Sensitivity and Importance Analysis
Based on the uncertainty evaluation, the need for a sensitivity study to
evaluate the various estimates of VSL was identified. In order to assess the
sensitivity of this analysis to the range of potential acceptable VSLs, the analysis was
repeated using minimum and maximum values. The minimum VSL was estimated to
be $6 million and the maximum VSL was estimated to be $14 million. The results
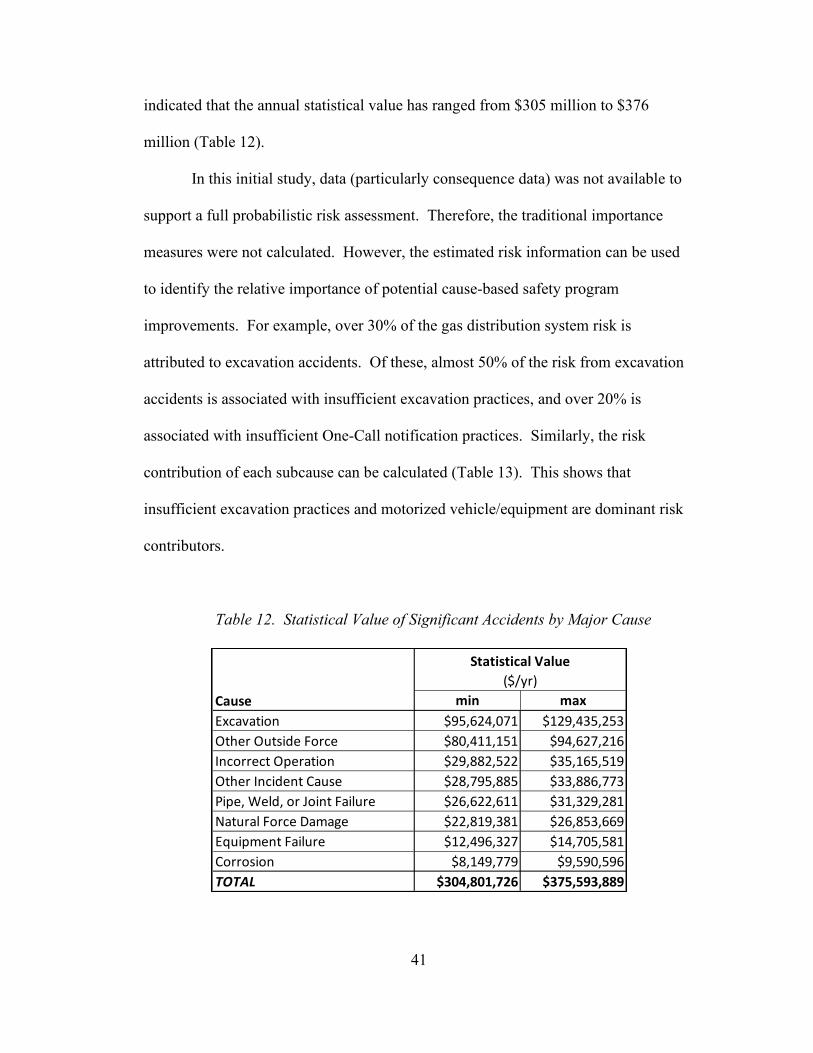
41
indicated that the annual statistical value has ranged from $305 million to $376
million (Table 12).
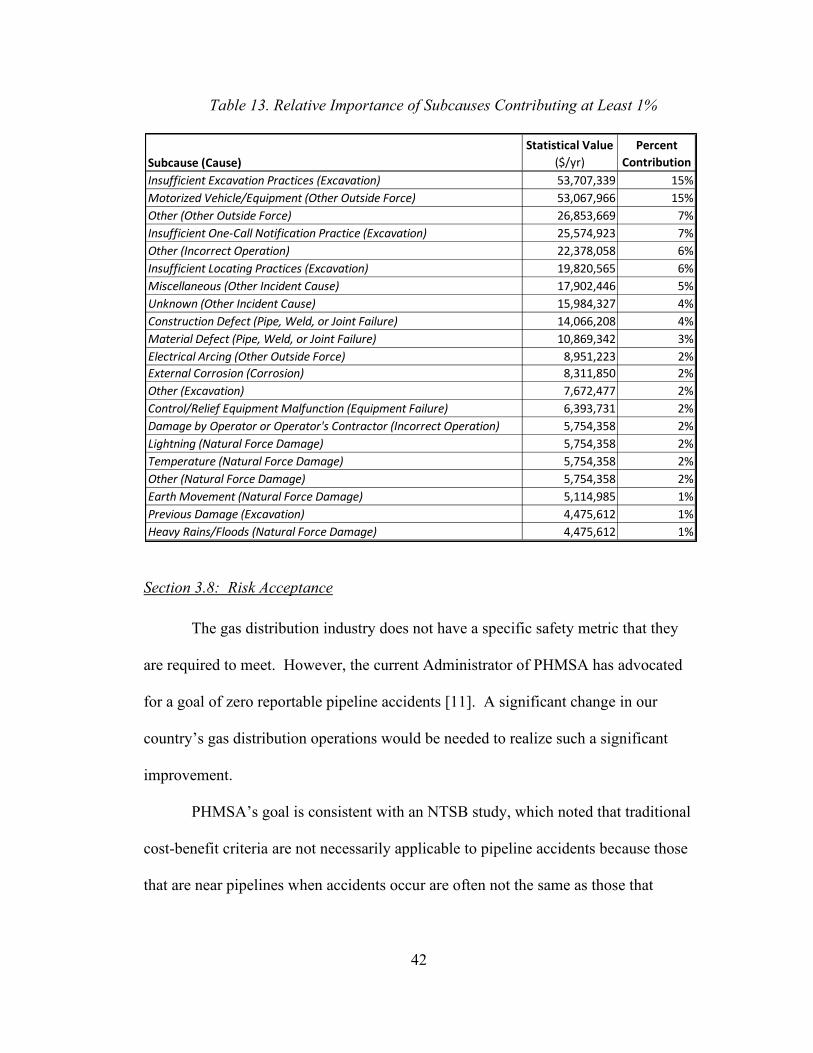
In this initial study, data (particularly consequence data) was not available to
support a full probabilistic risk assessment. Therefore, the traditional importance
measures were not calculated. However, the estimated risk information can be used
to identify the relative importance of potential cause-based safety program
improvements. For example, over 30% of the gas distribution system risk is
attributed to excavation accidents. Of these, almost 50% of the risk from excavation
accidents is associated with insufficient excavation practices, and over 20% is
associated with insufficient One-Call notification practices. Similarly, the risk
contribution of each subcause can be calculated (Table 13). This shows that
insufficient excavation practices and motorized vehicle/equipment are dominant risk
contributors.
Table 12. Statistical Value of Significant Accidents by Major Cause
min maxExcavation $95,624,071 $129,435,253Other Outside Force $80,411,151 $94,627,216Incorrect Operation $29,882,522 $35,165,519Other Incident Cause $28,795,885 $33,886,773Pipe, Weld, or Joint Failure $26,622,611 $31,329,281Natural Force Damage $22,819,381 $26,853,669Equipment Failure $12,496,327 $14,705,581Corrosion $8,149,779 $9,590,596TOTAL $304,801,726 $375,593,889
Statistical Value($/yr)
Cause
42
Table 13. Relative Importance of Subcauses Contributing at Least 1%
Section 3.8: Risk Acceptance
The gas distribution industry does not have a specific safety metric that they
are required to meet. However, the current Administrator of PHMSA has advocated
for a goal of zero reportable pipeline accidents [11]. A significant change in our
country’s gas distribution operations would be needed to realize such a significant
improvement.
PHMSA’s goal is consistent with an NTSB study, which noted that traditional
cost-benefit criteria are not necessarily applicable to pipeline accidents because those
that are near pipelines when accidents occur are often not the same as those that
Subcause (Cause)Statistical Value
($/yr)Percent
ContributionInsufficient Excavation Practices (Excavation) 53,707,339 15%Motorized Vehicle/Equipment (Other Outside Force) 53,067,966 15%Other (Other Outside Force) 26,853,669 7%Insufficient One-Call Notification Practice (Excavation) 25,574,923 7%Other (Incorrect Operation) 22,378,058 6%Insufficient Locating Practices (Excavation) 19,820,565 6%Miscellaneous (Other Incident Cause) 17,902,446 5%Unknown (Other Incident Cause) 15,984,327 4%Construction Defect (Pipe, Weld, or Joint Failure) 14,066,208 4%Material Defect (Pipe, Weld, or Joint Failure) 10,869,342 3%Electrical Arcing (Other Outside Force) 8,951,223 2%External Corrosion (Corrosion) 8,311,850 2%Other (Excavation) 7,672,477 2%Control/Relief Equipment Malfunction (Equipment Failure) 6,393,731 2%Damage by Operator or Operator's Contractor (Incorrect Operation) 5,754,358 2%Lightning (Natural Force Damage) 5,754,358 2%Temperature (Natural Force Damage) 5,754,358 2%Other (Natural Force Damage) 5,754,358 2%Earth Movement (Natural Force Damage) 5,114,985 1%Previous Damage (Excavation) 4,475,612 1%Heavy Rains/Floods (Natural Force Damage) 4,475,612 1%
43
benefit from them. The NTSB notes that “those who are bearing the risk deserve to
be protected by expenditures far beyond the dictates of cost-benefit” [12].
Section 3.9: Risk Reduction
The U.S. gas distribution industry has undergone many safety improvements
over the last two centuries. Despite many successes and improvements, the industry
has not yet achieved an acceptable level of risk. Low frequency, high consequence
events continue to occur, significantly increasing the overall risk across the industry.
Many industries use the concept of defense-in-depth to protect against such
events. This concept originated as a military strategy where layered lines of defense
would be used instead of a single strong line of defense. The use of diverse and
redundant components can reduce risk by preventing system failure or mitigating its
consequences. If failure of the diverse and/or redundant components is detected,
timely repair of the failed components can be completed without suffering
catastrophic consequences [33].
The defense-in-depth concept has been employed in nuclear safety since about
1957 [33]. In the nuclear safety arena, one acceptable method of supporting risk-
informed safety decisions includes maintaining a defense-in-depth philosophy. In
this context, defense-in-depth is considered to include four layers of defense which
are shown in Table 14 [34]. Although it is not often referred to as “defense-in-
depth,” a similar framework has been employed in the gas distribution pipeline
industry, also shown in Table 14. However, many of the efforts that have been
44
implemented in gas distribution systems to date have focused on preventing
accidents, strengthening the first layers of defense.
Additional efforts to strengthen the second and third layers of defense could
yield significant safety benefits. For example, the NTSB’s investigation of a gas
distribution accident that occurred on September 13, 2018, in Merrimack Valley, MA
indicated that the NTSB had previously investigated seven accidents that involved
natural gas under high pressure entering low-pressure natural gas lines. A search of
PHMSA data yielded seven additional accidents that involved over-pressurization of
a low-pressure distribution system (Table 15). Analysis of these fourteen accidents
may have identified a cost-effective safety enhancement to protect low-pressure
distribution systems from common cause failure (CCF) of their overpressure
protection system (e.g., worker-monitor regulator valves). Note that inconsistencies
in the cause described in the narrative section of these reports and the cause reported
in the cause field are highlighted in Table 15 (see Data Quality Limitations discussion
in Section 3.6).
In order to mitigate these types of accidents before they occur, the information
must be available, analyzed, and safety improvements must be implemented. It is
critical to have a collection of relevant, accurate data available in a useable format
and representing a broad group of operators. It is beneficial for this information to be
collected on a national or international basis so that individual companies are not
relying on sparse and disparate data. In the nuclear industry, industry stakeholders
formed the Institute of Nuclear Power Operations (INPO) after the Three Mile Island
accident, in part, to serve this purpose.
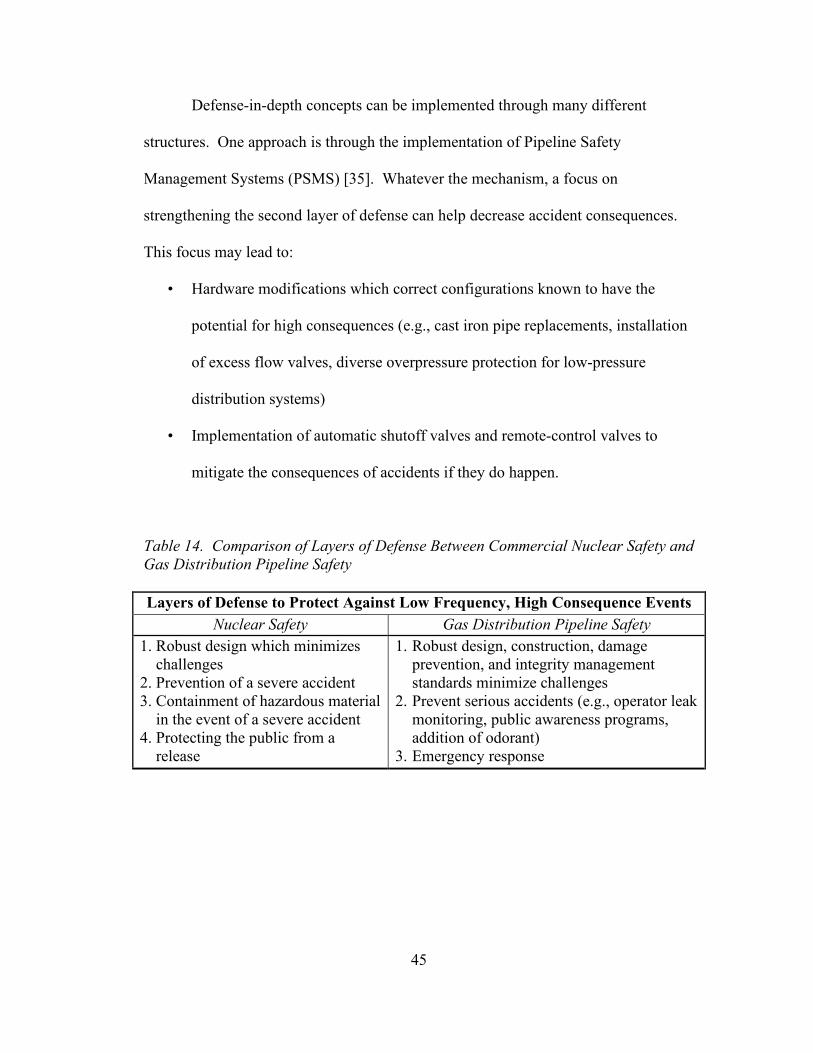
45
Defense-in-depth concepts can be implemented through many different
structures. One approach is through the implementation of Pipeline Safety
Management Systems (PSMS) [35]. Whatever the mechanism, a focus on
strengthening the second layer of defense can help decrease accident consequences.
This focus may lead to:
• Hardware modifications which correct configurations known to have the
potential for high consequences (e.g., cast iron pipe replacements, installation
of excess flow valves, diverse overpressure protection for low-pressure
distribution systems)
• Implementation of automatic shutoff valves and remote-control valves to
mitigate the consequences of accidents if they do happen.
Table 14. Comparison of Layers of Defense Between Commercial Nuclear Safety and Gas Distribution Pipeline Safety
Layers of Defense to Protect Against Low Frequency, High Consequence Events Nuclear Safety Gas Distribution Pipeline Safety
1. Robust design which minimizes challenges
2. Prevention of a severe accident 3. Containment of hazardous material
in the event of a severe accident 4. Protecting the public from a
release
1. Robust design, construction, damage prevention, and integrity management standards minimize challenges
2. Prevent serious accidents (e.g., operator leak monitoring, public awareness programs, addition of odorant)
3. Emergency response
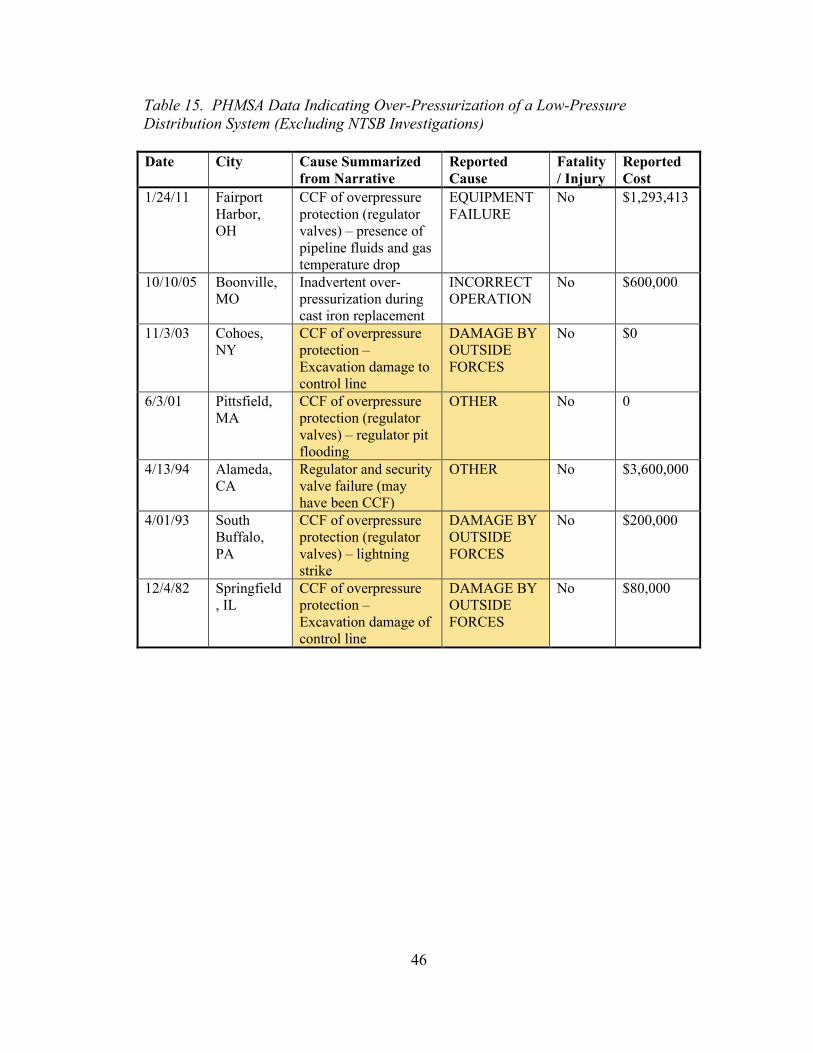
46
Table 15. PHMSA Data Indicating Over-Pressurization of a Low-Pressure Distribution System (Excluding NTSB Investigations)
Date City Cause Summarized from Narrative
Reported Cause
Fatality/ Injury
Reported Cost
1/24/11 Fairport Harbor, OH
CCF of overpressure protection (regulator valves) – presence of pipeline fluids and gas temperature drop
EQUIPMENT FAILURE
No $1,293,413
10/10/05 Boonville, MO
Inadvertent over-pressurization during cast iron replacement
INCORRECT OPERATION
No $600,000
11/3/03 Cohoes, NY
CCF of overpressure protection – Excavation damage to control line
DAMAGE BY OUTSIDE FORCES
No $0
6/3/01 Pittsfield, MA
CCF of overpressure protection (regulator valves) – regulator pit flooding
OTHER No 0
4/13/94 Alameda, CA
Regulator and security valve failure (may have been CCF)
OTHER No $3,600,000
4/01/93 South Buffalo, PA
CCF of overpressure protection (regulator valves) – lightning strike
DAMAGE BY OUTSIDE FORCES
No $200,000
12/4/82 Springfield, IL
CCF of overpressure protection – Excavation damage of control line
DAMAGE BY OUTSIDE FORCES
No $80,000
47
Chapter 4: Recommendations for Future Work
In the U.S. gas distribution industry, many safety improvements have been
implemented since gas distribution first began. Some of these improvements have
been codified and consistently required through regulation and others were
implemented through industry initiatives and technological advancement. As the
industry strives to reduce safety risks further, a set of risk acceptance criteria or safety
goals should be developed, similar to the risk acceptance criteria used by the nuclear
industry. To reach an acceptable level of risk, additional work to understand and
manage risks is needed.
As a starting point, the analysis proposed in this thesis should be further
developed. In particular, the improvements identified in the uncertainty evaluation
should be completed, including:
- Develop a more complete consequence model.
- Assess the need to consider contributing causes and develop a mechanism
for incorporating them.
- Improve the quality of the available data by requiring updates and
incorporating information from multiple sources.
- After the data quality and consequence modeling improvements have been
made, develop a probabilistic model to address parametric uncertainty and
update analysis to identify and address any new model and completeness
uncertainties that are introduced.
48
Additionally, this model should be frequently updated since it relies on historical
records to predict the future. Regularly reviewing the model with the goal of
continuous improvement could provide a way to accurately estimate risk given the
changing infrastructure and incremental improvements in both operations and data
quality.
Future improvements could be realized by moving towards a proactive,
predictive approach [36]. Prognostics and health management may also be explored
for this application that may enhance distribution system safety. There are examples
where predictive approaches have improved safety and reliability, while also saving
money [37].
49
Chapter 5: Conclusion
This study utilized PRA methods, nationwide gas distribution system
information, and operator reported accident data to evaluate gas distribution system
risks. Three phases – risk identification, risk assessment, and risk management –
were completed and could be iterated in the future as knowledge is gained and system
improvements are made. The risk identification phase included system
characterization and threat identification. The risk assessment phase included
estimating the likelihood and consequences of those threats that could lead to hazard
exposure, quantifying the associated risk, evaluating uncertainties, and analyzing the
sensitivity of assumptions and importance of various risk contributors. The risk
management phase included evaluating risk acceptance thresholds and the need for
risk reduction.
There are more than two million miles of main and service lines that distribute
gas in the U.S., comprised of infrastructure that varies in design, material,
configuration, and age. Operator-reported incident reports contain failure cause
information, each cause was identified as a threat to the system. Historical data were
assessed to determine the hazard rate for accidents that occurred between 2010-18.
The overall hazard curve exhibited a higher hazard rate towards the beginning and
end of life. The higher hazard rate early in life was attributed to the following failure
causes: excavation, other outside force, equipment, and incorrect operations. These
causes are typically thought of as being time-independent or stable in the pipeline
industry. However, increased construction in the vicinity of new pipelines and
unexpected environmental conditions explained the increased hazard early in life.
50
The increasing hazard rate later in life was attributed to corrosion and natural force
failures, which is a typical response for degradation mechanisms. Less mature
requirements that were in place before 1950 may have also contributed to this
response for older pipelines. Initiatives to improve safety performance early in life
may focus on enhancing existing processes to perform new construction safely,
expanding public outreach related to new construction projects, and developing more
robust processes to define and design for actual in-service conditions. Initiatives to
improve safety performance later in life may focus on enhancing integrity
assessments for pipeline that are more than 50 years old, implementing more
aggressive replacement schedules for pipelines with known integrity challenges, and
closely collecting, analyzing, and addressing a broad set of performance data.
Consequences were assessed based on the statistical value of each accident.
The statistical value was estimated based on the amount the public would have been
willing to pay to prevent the fatalities and injuries that occurred as a result of the
accident plus the actual cost incurred. The mean consequence of $5,754,368 per
significant reported accident was driven by a relatively low number of accidents with
catastrophic consequences.
The overall risk was estimated based on a point estimate of likelihood and
consequence due, in part, to the limited data available to support consequence
analyses. The mean statistical value that could be gained if all risks associated with
gas distribution systems were eliminated was estimated to be $358 million per year.
Excavation and other outside force accidents were dominant contributors.
51
The uncertainty evaluation identified several sources of model, completeness,
and parameter uncertainty which were either justified or recommended for future
analysis. Data quality was found to be a significant limitation of this work. For
example, the cause information reported to PHMSA and the probable cause
determined by the NTSB was inconsistent in the majority of cases (5/7). Similarly,
cause information summarized from the narrative provided by the operator and that
reported as the official cause in the same PHMSA form was inconsistent in five of
seven cases that were not investigated by the NTSB.
A sensitivity analysis was performed to address uncertainty associated with
the use of the estimated VSL. The results indicated elimination of all risks to public
health and safety from the U.S. gas distribution system could provide an estimated
benefit of between $305 million and $376 million per year.
Commonly used importance measures were not calculated because this was
not a full probabilistic risk assessment. However, the estimated risk information was
used to identify the relative importance of potential cause-based safety program
improvements. When assessing the information at the subcause level, insufficient
excavation practices and motorized vehicle equipment were dominant contributors.
While the industry does not have a specific safety metric, the current gas
distribution system risks were found to exceed acceptable levels. The current
Administrator of PHMSA advocates for a goal of zero reportable pipeline accidents.
A significant change would be needed to realize such a significant improvement.
Low frequency, high consequence events continue to occur, significantly increasing
the overall risk across the industry. One way to protect against such events would be
52
to employ a defense-in-depth philosophy by focusing on preventing serious accidents
through mitigation, rather than focusing primarily on preventing system challenges.
Such an approach may lead to: hardware modifications to improve configurations
known to have the potential for high consequences and installing automatic shutoff
valves and remote-control valves to mitigate the consequences of accidents if they do
happen.
Additional research is needed to develop this approach, to improve accident
data quality, develop consequence modeling, and consider contributing causes. Once
this additional research is completed, this approach can be updated to address
parameter uncertainty through Monte Carlo simulation using currently available
software [32].
53
Bibliography
[1] M. J. Valencia, "Toll from natural gas disaster in Merrimack Valley passes $1 billion," 20 February 2019. [Online]. Available: https://www.bostonglobe.com/metro/2019/02/20/merrimack-valley-disasters-toll-passes-billion/kZWuK2lPsZGh6i2uLigJrN/story.html.
[2] DOT PHMSA, "Source Data," March 2020. [Online]. Available: https://www.phmsa.dot.gov/data-and-statistics/pipeline/source-data.
[3] M. Hosmanek, Pipe Line Construction, Austin: University of Texas at Austin, 1984.
[4] W. Kilbourn, Pipeline, Toronto: Clarke, Irwin & Company, 1970. [5] M. Mohitpour, T. Van Hardeveld, W. Peterson and J. Szabo, Pipeline Operation
& Maintenance: A Practical Approach, New York: ASME, 2010. [6] NaturalGas.org, "Natural Gas Distribution," March 2020. [Online]. Available:
http://naturalgas.org/naturalgas/distribution/. [7] L. Lu, W. Liang, L. Zhang, H. Zhang, Z. Lu and J. Shan, "A Comprehensive
Risk Evaluation Method for Natural Gas Pipelines Combining a Risk Matrix with a Bow-Tie Model," Journal of Natural Gas Science and Engineering, 2015.
[8] Z. Han and W. Weng, "Comparison Study on Qualitative and Quantitative Risk Assessment Methods for Urban Natural Gas Pipeline Network," Journal of Hazardous Materials, 2011.
[9] Y.-D. Jo and B. J. Ahn, "A Method of Quantitative Risk Assessment for Transmission Pipeline Carrying Natural Gas," Journal of Hazardous Materials.
[10] M. Li, Z. Honglong, X. Xue, L. Xue, M. Ai and W. Ma, "Reliability Evaluation and Management of PetroChina's Large-Scale System of Natural Gas Pipeline Networks," Journal of Natural Gas Geoscience, 2019.
[11] Z. Han and W. Weng, "An Integrated Quantitative Risk Analysis Method for Natural Gas Pipeline Network," Journal of Loss Prevention in the Process Industries, 2010.
[12] G. DeWolf, "Process Safety Management in the Pipeline Industry: Parallels and Differences Between the Pipeline Integrity Management (IMP) Rule of the Office of Pipeline Safety and the PSM/RMP Approach for Process Facilities," Journal of Hazardous Materials, 2003.
[13] C. Lam and W. Zhou, "Statistical Analyses of Incidents on Onshore Gas Transmission Pipelines Based on PHMSA Database," International Journal of Pressure Vessels and Piping, 2016.
[14] D. M. Davies, "Texas Matters: 80 Years Aftern the New London School Explosion," March 2017. [Online]. Available: https://www.tpr.org/post/texas-matters-80-years-after-new-london-school-explosion. [Accessed March 2020].
54
[15] Natural Gas Pipeline Safety Act of 1968, Pub. L. No. 90-481, 82 Stat. 720, 1968.
[16] Norman Y. Mineta Research and Special Programs Improvement Act, Pub. L. No. 108-426, 118 Stat. 2423, 2004.
[17] 49 U.S.C. §§ 60102, 2018. [18] "PUC Approves Settlement with UGI in 2011 Allentown Explosion, Increases
Civil Penalty to $500,000," 24 January 2013. [Online]. Available: http://www.puc.pa.gov/about_puc/press_releases.aspx?ShowPR=3105. [Accessed March 2020].
[19] NTSB, "Natural Gas-Fueled Building Explosion and Resulting Fire, New York City, New York, March 12, 2014," NTSB, Washington, DC, 2015.
[20] NTSB, "Building Explosion and Fire, Silver Spring, Maryland, August 10, 2016," NTSB, Washington, DC, 2019.
[21] S. Kaplan and B. J. Garrick, "On the Quantitative Definition of Risk," Risk Analysis, 1981.
[22] NTSB, "Overpressurization of Natural Gas Distribution System, Explosions, and Fires in Merrimack Valley, Massachusetts, September 13, 2018," NTSB, Washington, DC, 2019.
[23] R Core Team, R: A language and environment for statistical computing, Vienna, Austria: R Foundation for Statistical Computing, 2017.
[24] M. Modarres, M. Kaminskiy and V. Krivtsov, Reliability Engineering and Risk Analysis: A Practical Guide, Boca Raton: Taylor & Francis Group, 2010.
[25] E. Arias, "United States Life Tables, 2015," in National Vital Statistics Reports, Vol. 67, No. 7, U.S. Department of Health and Human Services, 2018.
[26] M. J. Moran and C. Monje, Guidance on Treatment of the Economic Value of a Statistical Life (VSL) in U.S. Department of Transportation Analyses -- 2016 Adjustment, Washington, DC: DOT, 2016.
[27] A. Mosleh et al., in Proceedings of Workshop on Model Uncertainty, Its Characterization and Quantification: Annapolis, Maryland, USA, October 20-22, 1993, College Park, 1995.
[28] NRC, Guidance on the Treatment of Uncertainties Associated with PRAs in Risk-Informed Decisionmaking, Final Report (NUREG-1855, Rev. 1), Washington, DC: NRC, 2017.
[29] NRC, Safety Goals for the Operations of Nuclear Power Plants; Policy Statement; Republication, 51 Fed. Reg. 30028, 1986.
[30] ASME, Managing System Integrity of Gas Pipelines: ASME Code for Pressure Piping, B31 Supplement to ASME B31.8, New York: ASME, 2010.
[31] PHMSA, "Instructions (rev 10-2014) for Form PHMSA F 7100.1 (rev 10-2014)," PHMSA, Washington, DC, 2014.
[32] INL, "Systems Analysis Programs for Hands-on Integrated Reliability Evaluations (SAPHIRE)," March 2020. [Online]. Available: https://saphire.inl.gov/.
55
[33] NRC, "Historical Review and Observations of Defense-in-Depth (NUREG/KM-0009)," NRC, Washington, DC, 2016.
[34] NRC, "An Approach for Using Probabilistic Risk Assessment in Risk-Informed Decisions on Plant-Specific Changes to the Licensing Basis (RG 1.174)," NRC, Washington, DC, 2018.
[35] ANSI/API, Pipeline Safety Management Systems: ANSI/API Recommended Practice 1173, Washington, DC: API, 2015.
[36] C. Jackson and A. Mosleh, "Oil and Gas Pipeline Third Party Damage (TPD) - A New Way to Model External Hazard Failure," in Probabilistic Safety Assessment and Management PSAM 14, Los Angeles, 2018.
[37] NextEra Energy, "Changing the Current: Algorithms are Saving FPL Millions of Dollars," November 2013. [Online]. Available: http://www.nexteraenergy.com/pdf/algorithms.pdf. [Accessed April 2020].