abstract - richard f bliss iii · bud bliss, richard colley, brock daughtry. bsen 5220 final...
TRANSCRIPT
BUD BLISS, RICHARD COLLEY, BROCK DAUGHTRY BSEN 5220 FINAL PROJECT
WHITETAIL DEER HABITAT ANALYSIS
DECEMBER 2, 2015
Abstract
Odocoileus virginiaus, commonly known as the whitetail deer, has been hunted for sport
and survival for many years. In Alabama, deer harvesting records have been kept for an extended period of time. This report provides an analysis of overall whitetail deer habitat and harvesting records in the state of Alabama for 2011. The maps of hospitable land were then overlain on to the map containing the deer harvest records to see which areas are most apt to produce high deer populations. It was determined that the land with the highest deer inhabitance probability coincided with the areas possessing the highest harvest numbers. The county found to have the most productive hunting area was Clay County at 42% of the total land mass. From our findings, it could be considered accurate to assume that the areas highlighted by our final raster file have a higher probability producing trophy whitetail deer.
2
Table of Contents
Introduction 3
Methods and Procedures 3
Results and Discussion 6
Data Concerns 7
Conclusion 7
References 8
Appendix 1:
Alabama Land Use raster 1
Favorable Alabama Land Use Rasters 2
Alabama Tree Canopy Cover 3
Alabama LANDFIRE Data 4
Favorable Habitat for State of Alabama 5
2011 Deer Harvest Data per County 6
Final Alabama Favorable Hunting Environments Map 7
Favorable Environment and Harvest Data Overlay 8
Clay County Aerial Image 9
Clay County Favorable Hunting Locations 10
Urban Centers Overlay 11
Alabama GAP Project Habitat Map 12
3
Introduction: The purpose of this project was to determine ideal places to hunt in the state of Alabama.
Whitetail Deer hunting is a method of both fun and survival for many families across this state,
and even for students attending Auburn University. By knowing the areas that produce the most
Whitetail Deer, hunters can save time and resources making them more efficient at their craft.
Our analysis of the state of Alabama produces raster file consisting of the ideal places to hunt.
The habitat for whitetail deer in Alabama consists of various herbaceous environments.
The optimum environment consists of tree canopy coverage, sufficient brush for both food and
camouflage, a source of water, and significant distance from highly urbanized areas. This report
provides an analysis of the many areas within Alabama that provide any type of habitable land
and then divides those areas into optimal habitats for Whitetail Deer. This data was then
compared with state wide harvesting records from 2011 in order to determine how strong the
correlation was between the data. Our goal through this project was to provide an easily
interpreted map to give an individual interested in hunting a ball park idea of highly productive
hunting regions.
Methods and Procedures: For this laboratory analysis, GIS data of land use, tree canopy, and county outlines were
collected from the National Land Cover Database (NLCD), Alabama View, and other sources.
Alabama whitetail deer harvesting records, aerial imagery, and information about deer habitat
were all collected for use in ArcMap. Within ArcMap, these maps were converted to the NAD
1983 UTM Zone 16N projection to ensure accuracy and compatibility between files. The
habitable land raster found on page 5 of Appendix 1, consists of factors of: land use (Appendix
1: page 1), tree canopy and LANDFIRE data.
4
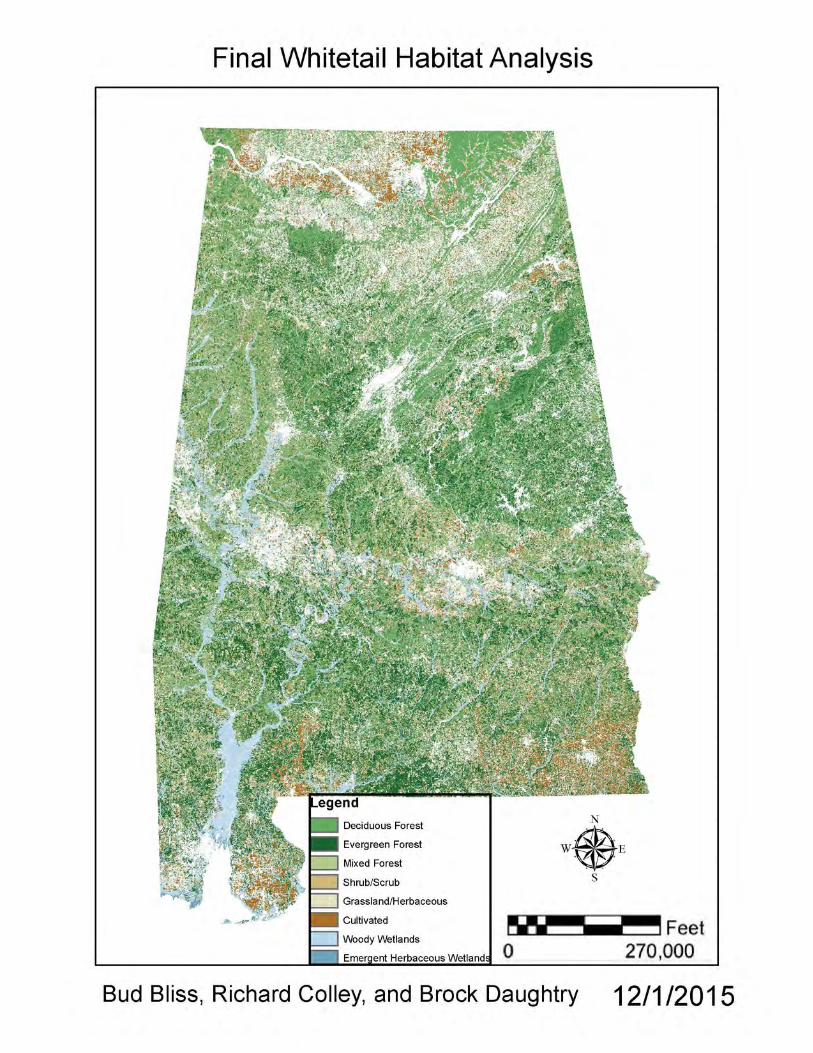
The land use maps were reclassified with values related to the level of hospitability of
that specific raster cell. Cells with highly hospitable land were given a value of two, areas that
were slightly less habitable were assigned a value of one and inhabitable cells were given a value
of zero. This reclassified land use raster (Appendix 1: page 2) was a component of the final
multiplication map, which indicates the best habitat for deer in Alabama.
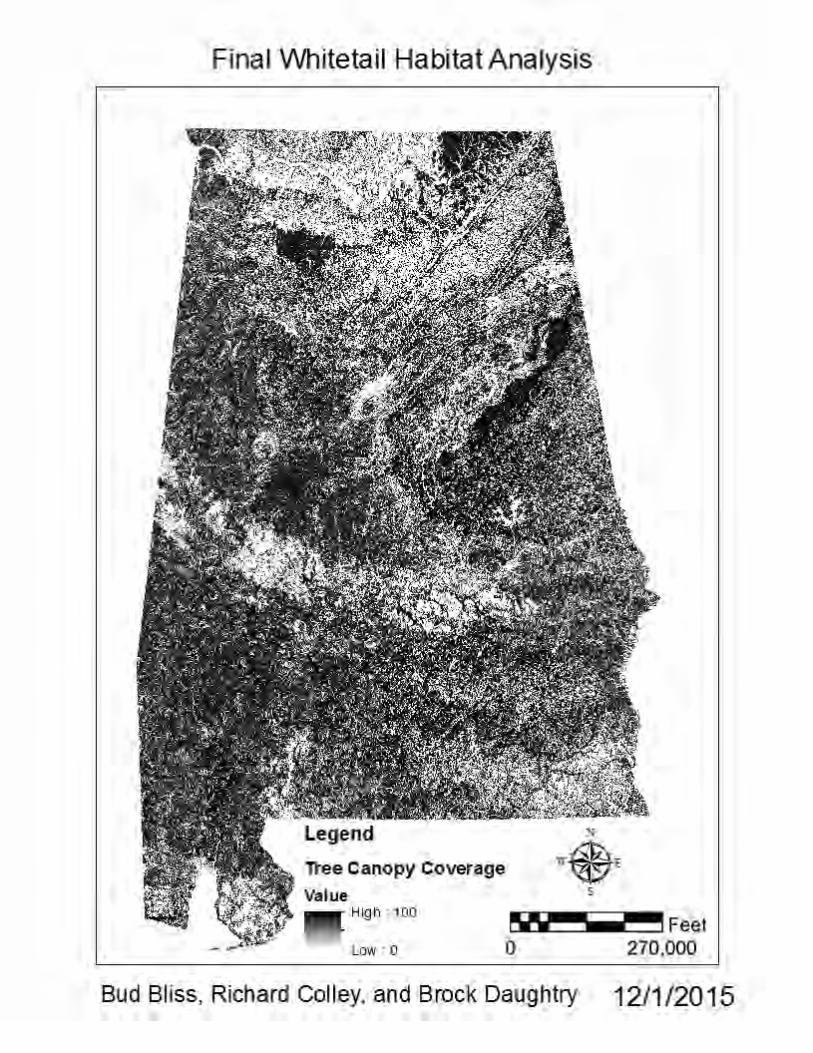
Tree canopy data (Appendix 1: page 3) was obtained from the USGS “National Map”
data collection, this data was provided in three separate zones for Alabama. This provided a
challenge because it had to be accurately be combined using the “Combine” tool under the
“Spatial Analyst” tab. This data was then extracted through the mask of the “Counties Layer”
obtained from the Alabama View Website. Tree canopy raster values are expressed in terms of
percent coverage, with 100% being full canopy coverage. Values from 1-100% were
implemented into the final multiplication raster, because habitable areas for deer typically have
more canopy coverage. However, sometimes land use rasters and tree canopy data can
occasionally be misleading, for this reason we employed data from the LANDFIRE program.
The LANDFIRE program provides a raster data file with more specific land use
assignments than the standard data files. This data was incorporated in order to ensure areas
with misleading tree canopy and land use values would not be included in the final multiplication
raster. For example, small one acre parks in a highly urbanized areas may possess favorable tree
canopy environments, and “Mixed Forest” land use values, but would be highly unfavorable for
hunting. Favorable values from the LANDFIRE file were selected and reassigned to a value of
1; while other cells such as “Urban Herbaceous” cells were assigned a value of zero (Appendix
1: page 4). By making this file one of the three major components of our final multiplication
file, a method of differentiation from misleading land use and tree canopy values was obtained.
5
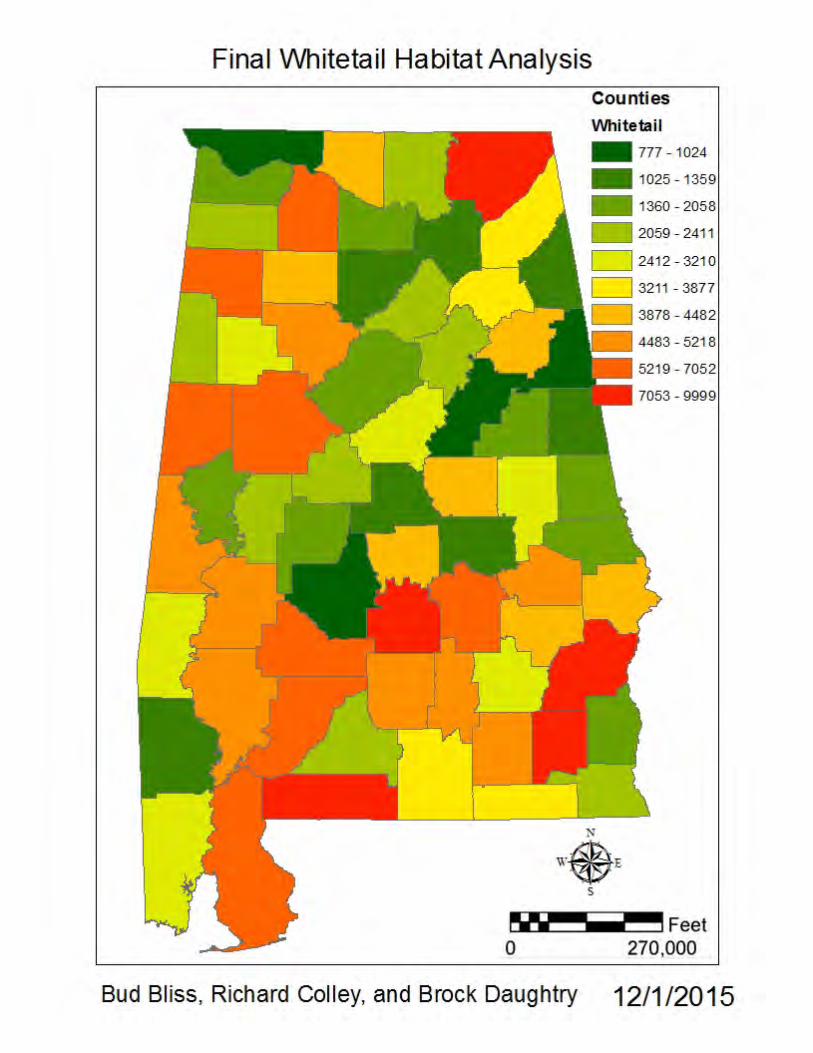
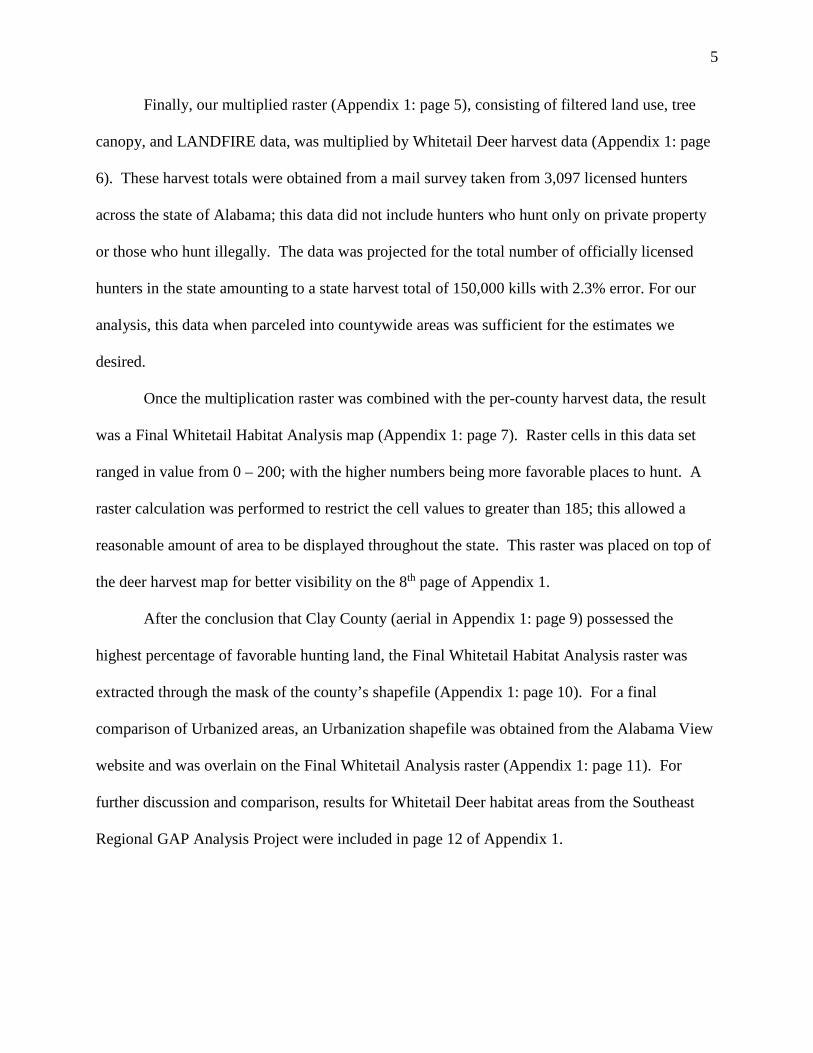
Finally, our multiplied raster (Appendix 1: page 5), consisting of filtered land use, tree
canopy, and LANDFIRE data, was multiplied by Whitetail Deer harvest data (Appendix 1: page
6). These harvest totals were obtained from a mail survey taken from 3,097 licensed hunters
across the state of Alabama; this data did not include hunters who hunt only on private property
or those who hunt illegally. The data was projected for the total number of officially licensed
hunters in the state amounting to a state harvest total of 150,000 kills with 2.3% error. For our
analysis, this data when parceled into countywide areas was sufficient for the estimates we
desired.
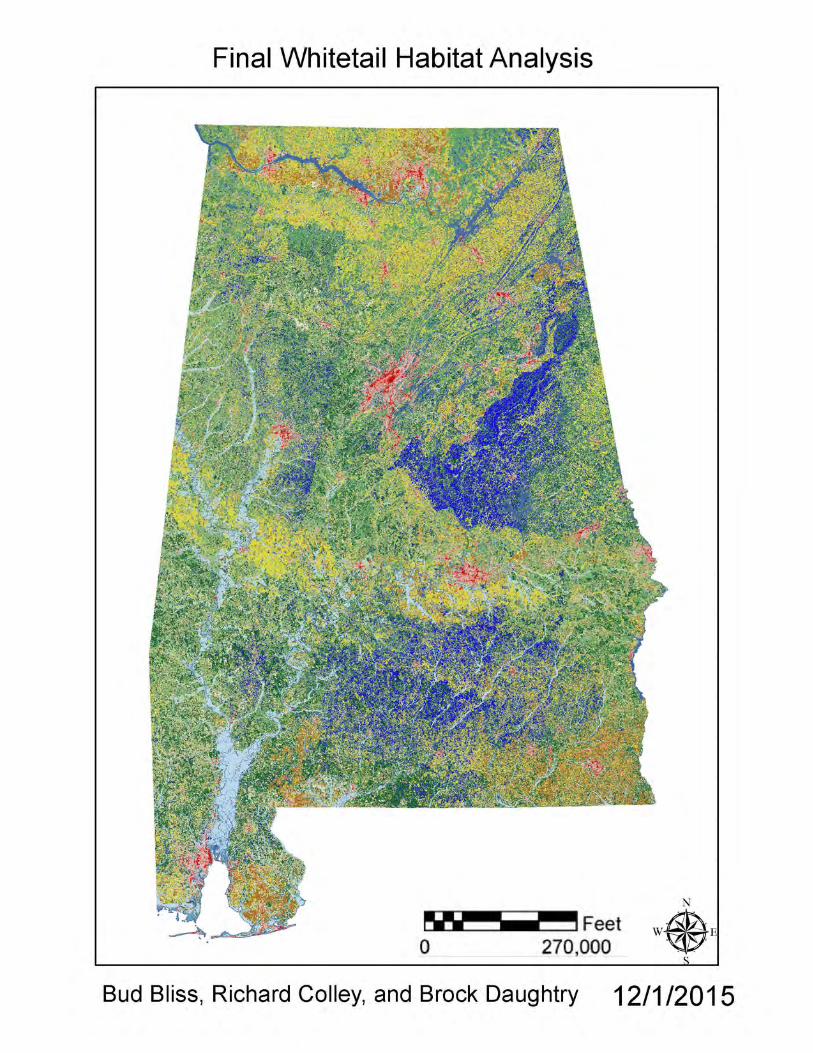
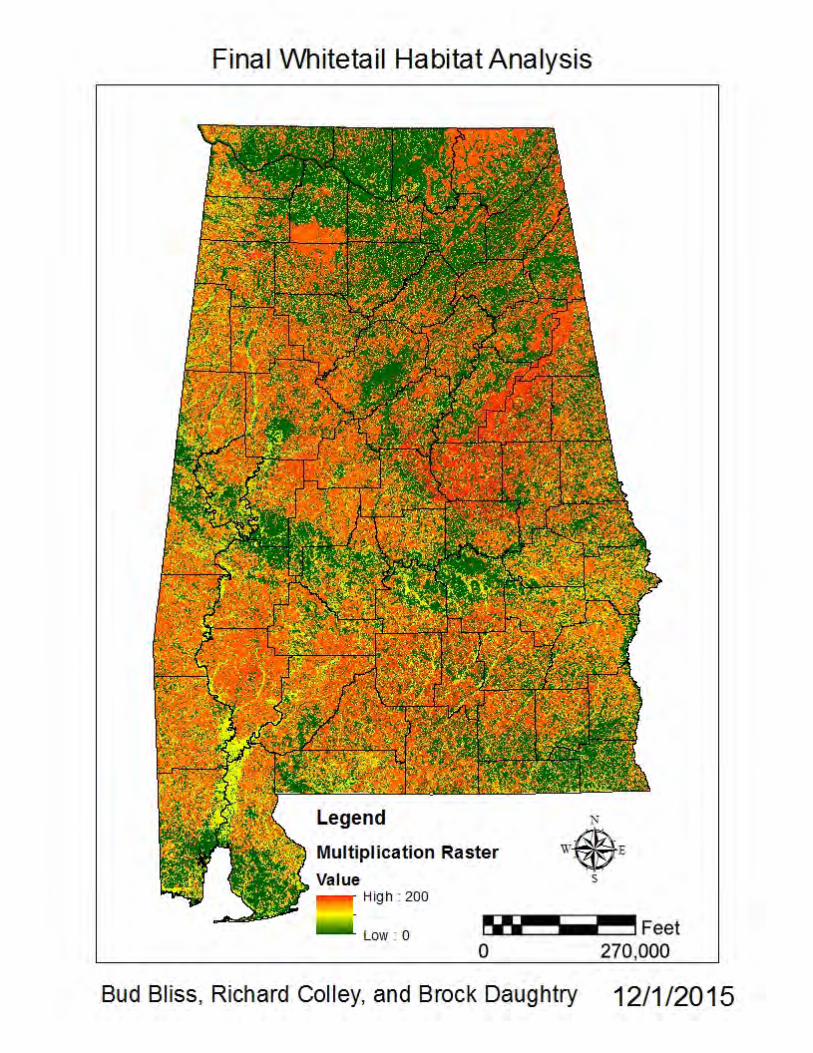
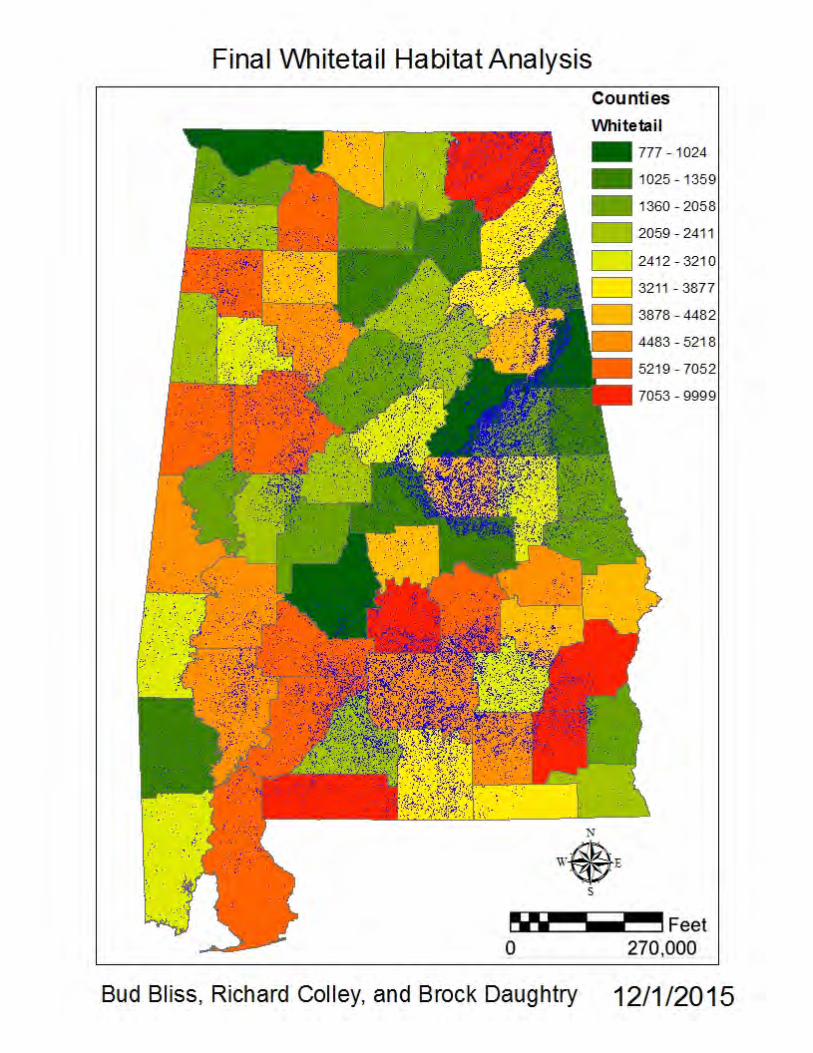
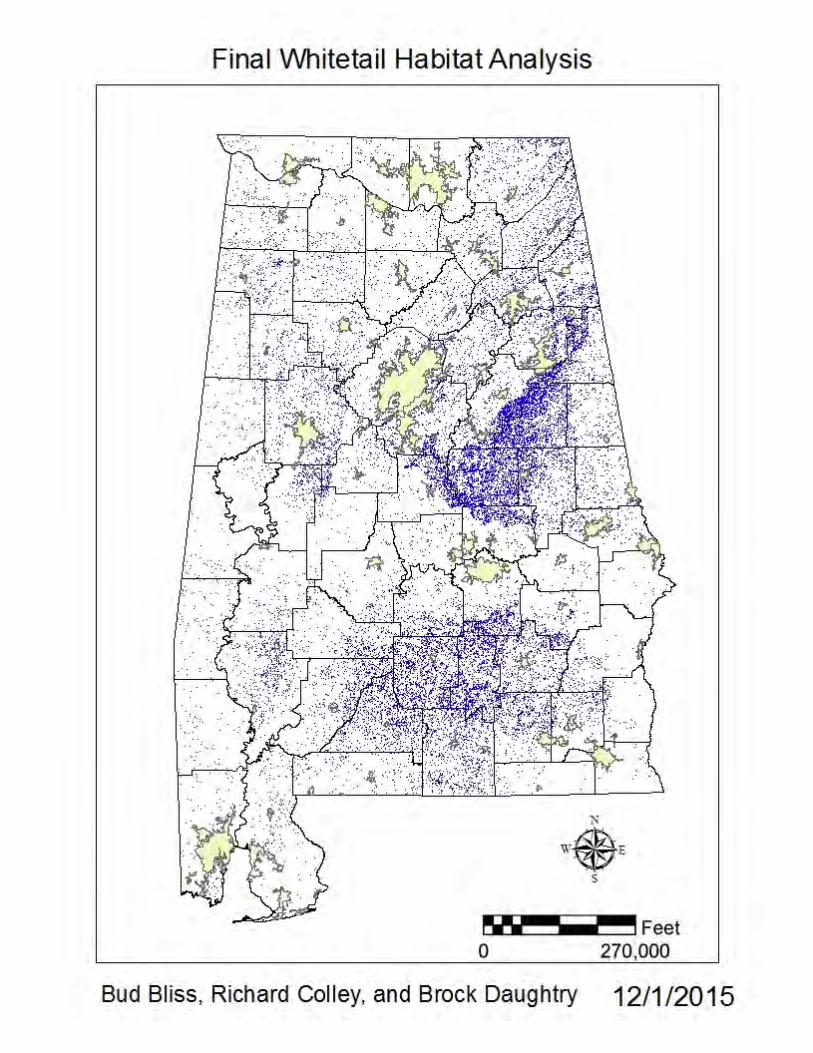
Once the multiplication raster was combined with the per-county harvest data, the result
was a Final Whitetail Habitat Analysis map (Appendix 1: page 7). Raster cells in this data set
ranged in value from 0 – 200; with the higher numbers being more favorable places to hunt. A
raster calculation was performed to restrict the cell values to greater than 185; this allowed a
reasonable amount of area to be displayed throughout the state. This raster was placed on top of
the deer harvest map for better visibility on the 8th page of Appendix 1.
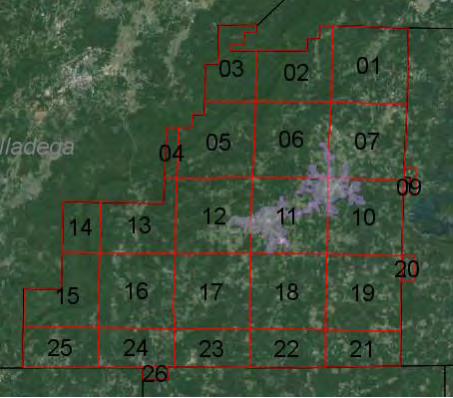
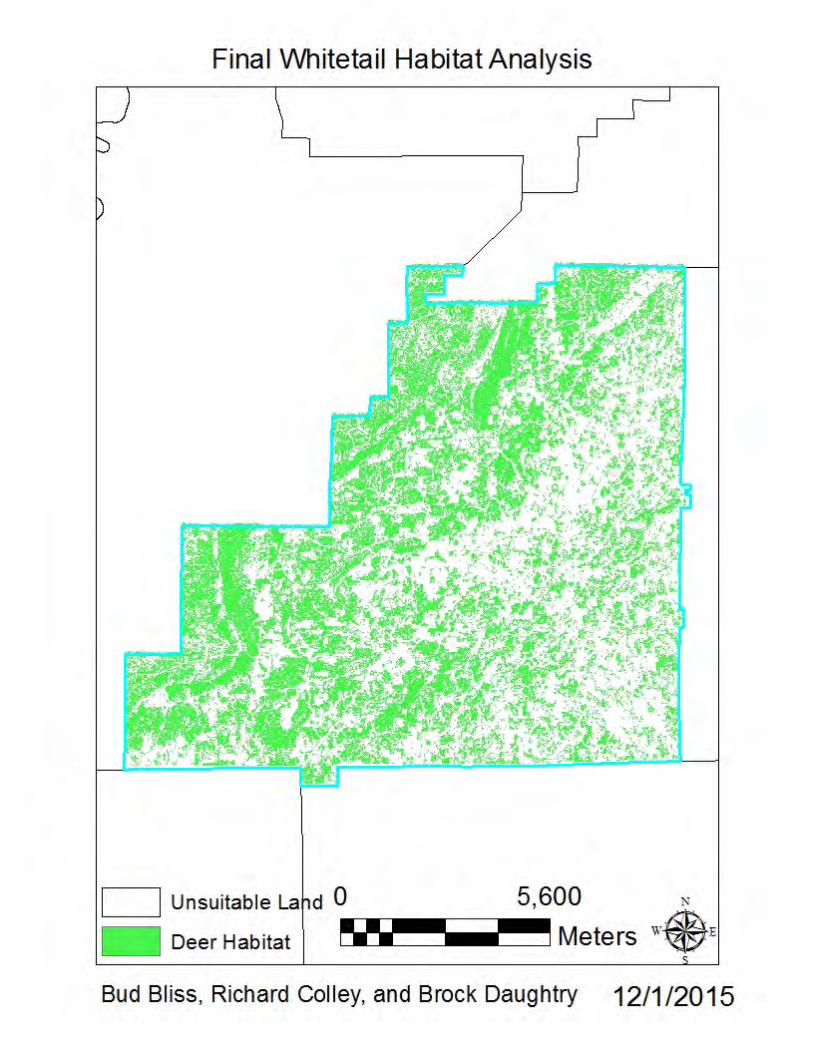
After the conclusion that Clay County (aerial in Appendix 1: page 9) possessed the
highest percentage of favorable hunting land, the Final Whitetail Habitat Analysis raster was
extracted through the mask of the county’s shapefile (Appendix 1: page 10). For a final
comparison of Urbanized areas, an Urbanization shapefile was obtained from the Alabama View
website and was overlain on the Final Whitetail Analysis raster (Appendix 1: page 11). For
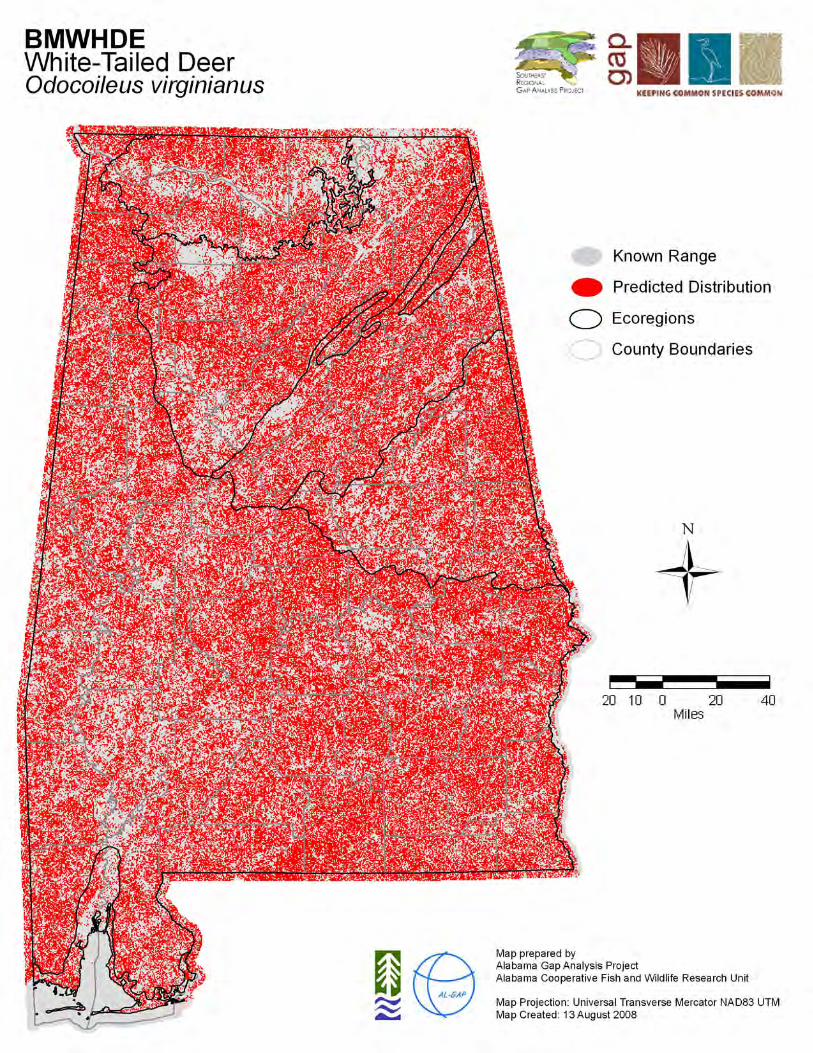
further discussion and comparison, results for Whitetail Deer habitat areas from the Southeast
Regional GAP Analysis Project were included in page 12 of Appendix 1.
6
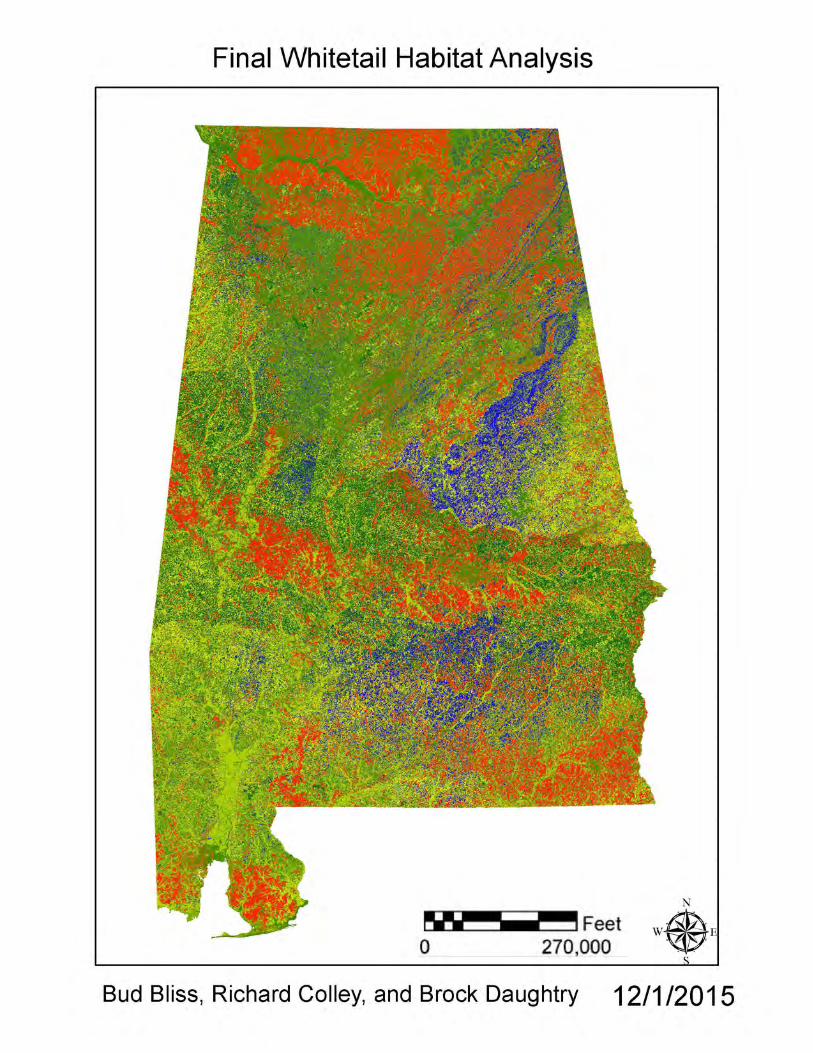
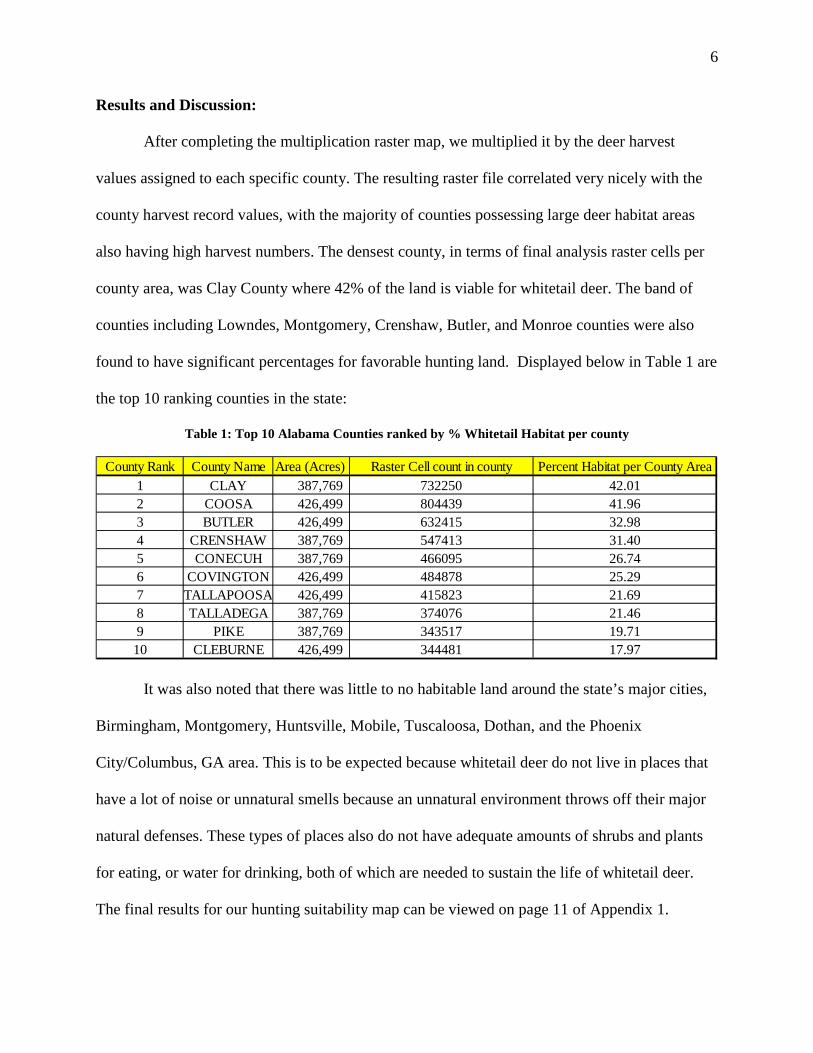
Results and Discussion: After completing the multiplication raster map, we multiplied it by the deer harvest
values assigned to each specific county. The resulting raster file correlated very nicely with the
county harvest record values, with the majority of counties possessing large deer habitat areas
also having high harvest numbers. The densest county, in terms of final analysis raster cells per
county area, was Clay County where 42% of the land is viable for whitetail deer. The band of
counties including Lowndes, Montgomery, Crenshaw, Butler, and Monroe counties were also
found to have significant percentages for favorable hunting land. Displayed below in Table 1 are
the top 10 ranking counties in the state:
Table 1: Top 10 Alabama Counties ranked by % Whitetail Habitat per county
It was also noted that there was little to no habitable land around the state’s major cities,
Birmingham, Montgomery, Huntsville, Mobile, Tuscaloosa, Dothan, and the Phoenix
City/Columbus, GA area. This is to be expected because whitetail deer do not live in places that
have a lot of noise or unnatural smells because an unnatural environment throws off their major
natural defenses. These types of places also do not have adequate amounts of shrubs and plants
for eating, or water for drinking, both of which are needed to sustain the life of whitetail deer.
The final results for our hunting suitability map can be viewed on page 11 of Appendix 1.
County Rank County Name Area (Acres) Raster Cell count in county Percent Habitat per County Area1 CLAY 387,769 732250 42.012 COOSA 426,499 804439 41.963 BUTLER 426,499 632415 32.984 CRENSHAW 387,769 547413 31.405 CONECUH 387,769 466095 26.746 COVINGTON 426,499 484878 25.297 TALLAPOOSA 426,499 415823 21.698 TALLADEGA 387,769 374076 21.469 PIKE 387,769 343517 19.71
10 CLEBURNE 426,499 344481 17.97
7
Data Concerns:
One anomaly we found in our map was the large density of hospitable area around the
Talladega/Clay County area. Here we had a very dense cluster of pixels that signified hospitable
area, however, the deer harvest records did not reflect a large amount of deer being killed there.
We concluded this was a problem because the Talladega National Forest is a conservation area
located in these counties and also has a very dense tree canopy; this could have caused our data
to be skewed. In addition to this, the deer harvest data we obtained from the Wildlife
Restoration Program was projected for all licensed hunters and did not contain data for Whitetail
Deer killed by hunters harvesting deer on their own property or hunters illegally poaching deer.
This assumption could lead to potential flaws in the final raster map. However, because of the
strong correlation between maximum values on our final habitat map and maximum values of
harvest values it can be inferred that our final raster is reasonably correct.
Conclusion:
In conclusion, this project showed how different files from different data bases and the
ArcMap software can be used to reach a desired solution to a given problem. In this case, the
problem we chose to diagnose was where in the state of Alabama would have the best chance of
seeing a deer. We used many different files to determine where we could find the best habitat for
whitetail deer by narrowing down things such as land cover and urbanization. After we
determined the best habitat, we correlated it with hunting records and found that our data
strongly matched with the harvest records for the state. This match confirms that our process was
done correctly and we have now found the best spots to hunt in Alabama.
8
References:
Alabama Gap Analysis Project (AL-GAP), Alabama Cooperative Fish & Wildlife Research Unit (ALCFWRU). “AL-GAP Vertebrate Predicted Habitat Distribution Map of Alabama (Provisional)” 2007. Auburn, AL: Auburn University. www.auburn.edu\gap.
“Clay Public GIS.” Clay Public GIS. Web. 30 Nov. 2015. Homer, C.G., Dewitz, J.A., Yang, L., Jin, S., Danielson, P., Xian, G., Coulston, J., Herold, N.D.,
Wickham, J.D., and Megown, K., 2015, Completion of the 2011 National Land Cover Database for the conterminous United States-Representing a decade of land cover change information. Photogrammetric Engineering and Remote Sensing, v. 81, no. 5, p. 345-354.
Liles, Randy. Alabama Hunting Survey 2011-2012 Season. Federal Assistance project, Grant
Number W-35, Study 6. August 2012. U.S. Department of Commerce, Bureau of the Census. Census TIGER 2010 State and County
Demographic Statistics by State. 2010. www.usda.gov Wildland Fire Science, Earth Resources Observation and Science Center, U.S. Geological
Survey. “LANDFIRE.US_130CBD” 2012. Sioux Falls, SD. www.landfire.gov