abstract - ppkurasige/thesis/omachi_doctor_thesis.… · el-1 lev trigger. 32 4.1.2 el high-lev...
TRANSCRIPT

Do toral DissertationStudy of muon trigger performan eswith the ATLAS dete tor at the LHCGraduate S hool of S ien e and Te hnology,Kobe UniversityChihiro Oma hiJanuary 2010

Abstra tThe LHC (Large Hadron Collider) at CERN laboratory, Geneva, Switzerland, started itsoperation in 2009. The LHC will a hieve high-energy proton-proton ollisions with the enter-of-mass energy at 14TeV, seven times higher than previously a hieved in proton-proton olliders.Two general purpose dete tors are built: the ATLAS and CMS dete tors. Muons play a majorrole for dis overy of new physi s in the ATLAS experiment. It is therefore important to sele t themuons e�e tively in parti ular in the online trigger environment. To this purpose, a new tra kingalgorithm for pre ise re onstru tion of muon momentum needs to be developed.In this thesis, a new tra king algorithm for online muon re onstru tion is presented. Thealgorithm utilizes the idea of Kalman Filter for taking into a ount non-uniform magneti �eldprovided for the muon spe trometer. The performan e and the pro essing time of the algorithmwas evaluated and ompared to the existing algorithm. A signi� ant improvement is observed inthe momentum resolution.
1

Contents1 Introdu tion 62 The LHC experiment 92.1 The LHC a elerator . . . . . . . . . . . . . . . . . . . . . . . . . . . . . . . . . . . 92.2 Physi s Motivation . . . . . . . . . . . . . . . . . . . . . . . . . . . . . . . . . . . . 102.2.1 The Standard Model Higgs . . . . . . . . . . . . . . . . . . . . . . . . . . . 102.2.2 B-physi s . . . . . . . . . . . . . . . . . . . . . . . . . . . . . . . . . . . . . 163 The ATLAS dete tor 183.1 Magnet system . . . . . . . . . . . . . . . . . . . . . . . . . . . . . . . . . . . . . . 193.1.1 Solenoidal magnet . . . . . . . . . . . . . . . . . . . . . . . . . . . . . . . . 203.1.2 Toroidal magnet . . . . . . . . . . . . . . . . . . . . . . . . . . . . . . . . . 203.2 Inner dete tors . . . . . . . . . . . . . . . . . . . . . . . . . . . . . . . . . . . . . . 223.2.1 Sili on-Pixel dete tor . . . . . . . . . . . . . . . . . . . . . . . . . . . . . . . 233.2.2 Semi- ondu tor tra ker . . . . . . . . . . . . . . . . . . . . . . . . . . . . . 243.2.3 Transition radiation tra ker . . . . . . . . . . . . . . . . . . . . . . . . . . . 243.3 Calorimeters . . . . . . . . . . . . . . . . . . . . . . . . . . . . . . . . . . . . . . . 253.3.1 Liquid argon alorimeters . . . . . . . . . . . . . . . . . . . . . . . . . . . . 253.3.2 Tile Calorimeters . . . . . . . . . . . . . . . . . . . . . . . . . . . . . . . . . 263.4 The muon system . . . . . . . . . . . . . . . . . . . . . . . . . . . . . . . . . . . . . 273.4.1 Trigger hambers . . . . . . . . . . . . . . . . . . . . . . . . . . . . . . . . . 273.4.2 Pre ision hambers . . . . . . . . . . . . . . . . . . . . . . . . . . . . . . . . 294 The ATLAS trigger system 314.1 Overview . . . . . . . . . . . . . . . . . . . . . . . . . . . . . . . . . . . . . . . . . 324.1.1 The Level-1 trigger . . . . . . . . . . . . . . . . . . . . . . . . . . . . . . . . 324.1.2 High-level trigger . . . . . . . . . . . . . . . . . . . . . . . . . . . . . . . . . 324.2 Muon trigger . . . . . . . . . . . . . . . . . . . . . . . . . . . . . . . . . . . . . . . 344.2.1 Level-1 muon trigger . . . . . . . . . . . . . . . . . . . . . . . . . . . . . . . 344.2.2 L1 barrel muon trigger . . . . . . . . . . . . . . . . . . . . . . . . . . . . . . 354.2.3 L1 end ap muon trigger . . . . . . . . . . . . . . . . . . . . . . . . . . . . . 364.3 L2 muon trigger . . . . . . . . . . . . . . . . . . . . . . . . . . . . . . . . . . . . . 382

4.4 TrigmuFast . . . . . . . . . . . . . . . . . . . . . . . . . . . . . . . . . . . . . . . . 384.5 TrigmuComb . . . . . . . . . . . . . . . . . . . . . . . . . . . . . . . . . . . . . . . 395 TrigmuFast 405.1 Algorithm . . . . . . . . . . . . . . . . . . . . . . . . . . . . . . . . . . . . . . . . . 405.1.1 Pattern Re ognition . . . . . . . . . . . . . . . . . . . . . . . . . . . . . . . 405.1.2 Tra k Fitting . . . . . . . . . . . . . . . . . . . . . . . . . . . . . . . . . . . 415.1.3 Transverse momentum estimation (in the Barrel region) . . . . . . . . . . . 425.1.4 Transverse momentum estimation (in the End ap region) . . . . . . . . . . 435.2 Performan e . . . . . . . . . . . . . . . . . . . . . . . . . . . . . . . . . . . . . . . . 445.2.1 pT resolution . . . . . . . . . . . . . . . . . . . . . . . . . . . . . . . . . . . 455.2.2 Trigger eÆ ien y . . . . . . . . . . . . . . . . . . . . . . . . . . . . . . . . . 455.2.3 Trigger rate . . . . . . . . . . . . . . . . . . . . . . . . . . . . . . . . . . . . 465.3 Possible reason of the worse pT resolution for low pT muons in the end ap region . 486 The Kalman �lter algorithm for tra king 516.1 Kalman Filter . . . . . . . . . . . . . . . . . . . . . . . . . . . . . . . . . . . . . . . 516.1.1 Algorithm . . . . . . . . . . . . . . . . . . . . . . . . . . . . . . . . . . . . . 526.2 Coordinates and parameterization for muFastKalman . . . . . . . . . . . . . . . . 536.2.1 The oordinate system . . . . . . . . . . . . . . . . . . . . . . . . . . . . . . 536.2.2 Filtering Node . . . . . . . . . . . . . . . . . . . . . . . . . . . . . . . . . . 546.2.3 Tra k State . . . . . . . . . . . . . . . . . . . . . . . . . . . . . . . . . . . . 556.3 Cal ulations in muFastKalman . . . . . . . . . . . . . . . . . . . . . . . . . . . . . 566.3.1 Extrapolation of Tra k State in muFastKalman . . . . . . . . . . . . . . . . 566.3.2 Validation for measurement value . . . . . . . . . . . . . . . . . . . . . . . . 576.3.3 Optimization of Tra k State . . . . . . . . . . . . . . . . . . . . . . . . . . . 576.3.4 �tting order and region of the muFastKalman . . . . . . . . . . . . . . . . . 576.3.5 The result of �tting . . . . . . . . . . . . . . . . . . . . . . . . . . . . . . . 587 Performen e of muFastKalman 597.1 Transverse momentum resolution . . . . . . . . . . . . . . . . . . . . . . . . . . . . 597.1.1 position dependen e . . . . . . . . . . . . . . . . . . . . . . . . . . . . . . . 618 Summary 62
3

List of Figures2.1 LHC . . . . . . . . . . . . . . . . . . . . . . . . . . . . . . . . . . . . . . . . . . . . 92.2 Pro esses for Higgs produ tion at the LHC . . . . . . . . . . . . . . . . . . . . . . 142.3 The ross se tions for ea h pro esses of Higgs produ tion at the LHC . . . . . . . . 152.4 The de ay bran hing ratios as a fun tion of mass of Higgs . . . . . . . . . . . . . . 153.1 ATLAS Dete tor . . . . . . . . . . . . . . . . . . . . . . . . . . . . . . . . . . . . . 183.2 oordinate system . . . . . . . . . . . . . . . . . . . . . . . . . . . . . . . . . . . . 193.3 ATLAS magnet system . . . . . . . . . . . . . . . . . . . . . . . . . . . . . . . . . . 203.4 magneti �eld map . . . . . . . . . . . . . . . . . . . . . . . . . . . . . . . . . . . . 213.5 Integrated magneti �eld provided by toroidal magnet . . . . . . . . . . . . . . . . 213.6 The overall view of the ATLAS inner dete tor . . . . . . . . . . . . . . . . . . . . . 223.7 ATLAS Radiation lenght for ea h inner dete tor . . . . . . . . . . . . . . . . . . . 233.8 ATLAS pixel dete tor . . . . . . . . . . . . . . . . . . . . . . . . . . . . . . . . . . 243.9 ATLAS alorimeter system . . . . . . . . . . . . . . . . . . . . . . . . . . . . . . . 253.10 A part of Liquid Argon Calorimeter . . . . . . . . . . . . . . . . . . . . . . . . . . 263.11 A part of tile alorimeter . . . . . . . . . . . . . . . . . . . . . . . . . . . . . . . . 273.12 The layout of muon hambers in the ATLAS dete tor . . . . . . . . . . . . . . . . 283.13 A ross se tion view of a TGC . . . . . . . . . . . . . . . . . . . . . . . . . . . . . 283.14 A pi ture of a MDT hamber . . . . . . . . . . . . . . . . . . . . . . . . . . . . . . 293.15 dete tion prin iple in MDT hamber . . . . . . . . . . . . . . . . . . . . . . . . . . 303.16 drift spa e . . . . . . . . . . . . . . . . . . . . . . . . . . . . . . . . . . . . . . . . . 304.1 ATLAS trigger . . . . . . . . . . . . . . . . . . . . . . . . . . . . . . . . . . . . . . 314.2 L1 trigger . . . . . . . . . . . . . . . . . . . . . . . . . . . . . . . . . . . . . . . . . 324.3 L2 to EF . . . . . . . . . . . . . . . . . . . . . . . . . . . . . . . . . . . . . . . . . 334.4 muon trigger . . . . . . . . . . . . . . . . . . . . . . . . . . . . . . . . . . . . . . . 344.5 RPC hambers and station . . . . . . . . . . . . . . . . . . . . . . . . . . . . . . . 354.6 Road of L1 Barrel trigger . . . . . . . . . . . . . . . . . . . . . . . . . . . . . . . . 364.7 Pad . . . . . . . . . . . . . . . . . . . . . . . . . . . . . . . . . . . . . . . . . . . . 374.8 Division of end- ap muon system . . . . . . . . . . . . . . . . . . . . . . . . . . . . 374.9 oin iden e logi for the L1 end ap muon trigger . . . . . . . . . . . . . . . . . . . 384.10 tra k sele tion . . . . . . . . . . . . . . . . . . . . . . . . . . . . . . . . . . . . . . . 394

5.1 pattern re ognition in TrigmuFast . . . . . . . . . . . . . . . . . . . . . . . . . . . 415.2 An illustration on left-right ambiguity . . . . . . . . . . . . . . . . . . . . . . . . . 415.3 Tra k Fitting in Trig muFast . . . . . . . . . . . . . . . . . . . . . . . . . . . . . . 425.4 pT estimation in Barrel . . . . . . . . . . . . . . . . . . . . . . . . . . . . . . . . . 435.5 � with only middle MDT . . . . . . . . . . . . . . . . . . . . . . . . . . . . . . . . 445.6 � with middle and outer MDT . . . . . . . . . . . . . . . . . . . . . . . . . . . . . 445.7 � with inner and middle . . . . . . . . . . . . . . . . . . . . . . . . . . . . . . . . . 445.8 � with all MDT . . . . . . . . . . . . . . . . . . . . . . . . . . . . . . . . . . . . . . 445.9 TrigmuFast Resolution . . . . . . . . . . . . . . . . . . . . . . . . . . . . . . . . . . 455.10 TrigmuFast eÆ ien y . . . . . . . . . . . . . . . . . . . . . . . . . . . . . . . . . . . 465.11 The ross se tion of muon at the LHC . . . . . . . . . . . . . . . . . . . . . . . . . 475.12 traje tory . . . . . . . . . . . . . . . . . . . . . . . . . . . . . . . . . . . . . . . . . 485.13 Trigger eÆ ien y of TrigmuFast . . . . . . . . . . . . . . . . . . . . . . . . . . . . . 495.14 intgB . . . . . . . . . . . . . . . . . . . . . . . . . . . . . . . . . . . . . . . . . . . . 505.15 hitmap of muon with under 6GeV . . . . . . . . . . . . . . . . . . . . . . . . . . . 506.1 Sket h for algorithm . . . . . . . . . . . . . . . . . . . . . . . . . . . . . . . . . . . 516.2 An example of Kalman Filter algorithm . . . . . . . . . . . . . . . . . . . . . . . . 526.3 Sket h for algorithm . . . . . . . . . . . . . . . . . . . . . . . . . . . . . . . . . . . 536.4 FilteringNode and Tra kState . . . . . . . . . . . . . . . . . . . . . . . . . . . . . . 536.5 parameters and oordinate system . . . . . . . . . . . . . . . . . . . . . . . . . . . 546.6 Filtering Node . . . . . . . . . . . . . . . . . . . . . . . . . . . . . . . . . . . . . . 556.7 measurement and error . . . . . . . . . . . . . . . . . . . . . . . . . . . . . . . . . . 566.8 A display of the �tting by muFastKalman . . . . . . . . . . . . . . . . . . . . . . . 587.1 pT distribution . . . . . . . . . . . . . . . . . . . . . . . . . . . . . . . . . . . . . . 597.2 pT resolution . . . . . . . . . . . . . . . . . . . . . . . . . . . . . . . . . . . . . . . 607.3 orrelation of pT distribution and resolution . . . . . . . . . . . . . . . . . . . . . . 607.4 pT resolution with negative Q and negative � . . . . . . . . . . . . . . . . . . . . . 61
5

Chapter 1Introdu tionThe fundamental for e in the nature is lassi�ed into four: ele tromagneti , weak, strong andgravitational intera tions. The Standard Model of parti le physi s is related to three among thefour, namely, all but the gravity. The Standard Model has been very su essful in des ribingthe intera tion between elementary parti les in the framework of gauge theory. The theory is on�rmed by many experiments for parti le physi s.In the gauge theory, whi h is the base of the Standard Model, all gauge bosons are expe tedto be massless be ause of the gauge symmetry. In addition, quarks and leptons also shouldbe massless under SU(2)�U(1) gauge symmetry . In reality however, most of the parti les aremassive. This is explained by the Higgs me hanism derived from the spontaneous symmetrybreaking of the va uum. The existen e of the Higgs boson an prove orre tness of the Higgsme hanism but it is the only parti le whi h have been not dis overed among parti les in theStandard Model.The LHC (Large Hadron Collider) onstru ted in Geneva, Switzerland is the largest proton-proton syn hrotron ollider in the world. Bun hes of protons are a elerated up to 7 TeV and ollide ea h other giving the enter-of-mass energy of 14 TeV. The ollisions rate is 40 MHz inorder to a hieve the high luminosity ne essary for studies on rare intera tions su h as produ tionof Higgs bosons or new physi s beyond the Standard Model.The ATLAS experiment is one of the multi-purpose experiments at the LHC. The mostimportant goal of the ATLAS is to dis over the Higgs boson. One of the most powerful methodin dis overing the Higgs boson is a sear h for a de ay mode ofH ! ZZ ! 4-leptons(e; �). Leptonswith high transverse momentum (pT ) an be identi�ed and the energy an be measured pre iselyin the ATLAS dete tor. This hannel, therefore, gives a narrow peak in the four-lepton invariantmass spe trum over relatively small amount of ba kground. In parti ular, the muons play a keyrole in the four-lepton hannel be ause muon an be identi�ed without ba kgroung. The ATLASdete tor is designed to pre isely measure of the muon momenta by using a ombination of largevolume air- oil toroid for the bending magnet and drift tubes with their lo ation monitored by adedi ated alignment system.6

At the LHC, the event rate will be high be ause the high intensity of the proton beam andthe large ross se tion of proton-proton ollisions. One of the keys for su h an experiment issele ting the interesting events whi h in lude high pT muons from W,Z bosons and new parti lese�e tively. In the ATLAS experiment, three level triggers are provided for the sele tion. Thelevel-1 trigger implemented on hardware, redu es the rate from 40MHz of bun h rossing rate to75kHz. The level-2 trigger performs sele tion of events by running software pro esses on a PCfarm. The rate is redu ed from 75kHz to 3kHz. Then the sele ted events are sent to the EventFilter, the last stage of trigger system onstru ted on another PC farm. At this level, the triggerrate is redu ed to 200Hz and remnant events are re orded.The muon trigger sele ts events with muons of its pT above a ertain threshold. In the L2muon trigger, the pre ise position information measured by the drift tubes an be used, whereasthe L1 trigger an only a give rough position information. The L2 muon trigger performs morepre ise pT measurement and severer algorithm than the L1 muon trigger. The rate of low pTmuons is expe ted to be high, be ause these muons are originated in the � and K parti les in jetsfrom the remnant quarks. The ontamination of low-pT muons mis-triggered as high-pT muons auses in rease of the trigger rate. Therefore, it is important to measure the pT pre isely toredu e by the low pT muons in triggered events.The TrigmuFast is provided at the �rst stage of the L2 muon trigger, and its role is to measurethe pT with the pre ise position information. It performs pT measurement by using the bendingangle in the magneti �eld based on the urvature of the muon tra k. One of the importantparameters for this al ulation is the integrated magneti �eld. But the integrated magneti �eldvaries position by position espe ially in the end ap region. Therefore, TrigmuFast al ulates thepT of a muon by using the measured its bending angle of traje tory and its position. The pT is al ulated by using a LUT method (Look Up Table) and parameters for the LUTs are preparedfor segmented regions of the muon dete tors. Thanks to the LUT method, the pro essing timeof TrigmuFast is only 2 ms ompared to 40 ms whi h is the limitation of the pro essing time forthe L2 muon trigger.TrigmuFast a hieves the fast pT measurement by measuring the bending angle and hit position.But it is diÆ ult to measure the pre ise pT when a parti le passes through the area where theintegrated magneti �eld is lose to zero. In addition, large multiple s attering angle auses mis-measurement of pT . In this ase, the method to re onstru t the tra k of a parti le is e�e tive forthe pre ise pT measurement. The Kalman Filter has advantages for these issues. It is originallyintrodu ed by R.E.Kalman in 1960, it has been applied for the re onstru tion of parti le in theexperiments for parti le physi s. The Kalman Filter performs a �tting in the iteration between thepredi tion and the �tting parameters whi h des ribe the tra k of the parti le at every measuredposition. With this pro edure, a kink tra k, whi h an be seen in ase of large multiple s attering, an be orre tly re onstru ted.The aim of this study is introdu ing the development of a new �tting pro edure using theKalman Filter and a study of the performan e with this new sele tion method. We have on�rmed7

that the improvement of the pT resolution by using this new method. The averaged pro essingtime with this new method is under the limitation of the pro essing time in the L2 muon trigger.In the future, the LHC will be operated with a high luminosity. In su h operations, themuon rate will be in reased. By using this new method in the L2 muon trigger, it will be ableto suppress the ba kground events in luding low pT muon, and to trigger the high pT muonse�e tivelyThis dissertation onsists of eight hapters. Chapter 2 and 3 introdu e the LHC a eleratorand the ATLAS experiment. In Chapter 4, an overview of ATLAS trigger system is presented.The performan e of the L2 muon trigger is presented in Chapter 5. Introdu tion of Kalman Filterand the tra k �tting pro edure is des ribed in Chapter 6, and the performan es with the new�tting method is presented in Chapter 7. The Chapter 8 is the summary of this study.
8

Chapter 2The LHC experiment2.1 The LHC a eleratorThe LHC is the largest a elerator in the world. It was onstru ted at CERN (European Orga-nization for Nu lear Resear h) lo ated on the border of Switzerland and Fran e. The LHC utilizesthe tunnel originally prepared for the LEP (Large Ele tron-Positron) ollider. The perimeter ofthis tunnel is 27km. The LHC ollides two proton beams ea h other at a very high enter-of-massenergy with a high frequen y. The design enter-of-mass energy is 14 TeV, whi h is the highestenergy in the world. The syn hrotron radiation of a proton is ten order of magnitude less than
Figure 2.1: LHC and lo ation of experimentsthat of an ele tron at this energy. Therefore, the proton is only the hoi e for ring a elerators atthis energy and radius. The proton has, however, the inner stru ture; it is omposed of partons9

whi h are quarks and gluons. This means that the e�e tive enter-of-mass energies of ollisions ofpartons are mu h lower than 14 TeV. Nevertheless, it has a strong potential to �nd new physi s atTeV energy s ale. Another issue to be onsidered in proton-proton ollisions is that the inelasti ross se tion between protons is very high (about a hundred of milibarn = 10�27 m2). A hugenumber of intera tions o ur and these events are the ba kground for the new physi s. Sele tingthe target physi s events among su h huge ba kground events is the key of experiments at theLHC.There are four ollision points lo ated in the LHC ring, provided for the following experiments.- ATLAS (A Toroidal Lh ApparatuS)- CMS (Compa t Muon Solenoid)- LHC-b- ALICE (A Large Ion Collider Experiment)ATLAS and CMS are general-purpose dete tors, LHC-b on entrates on the B-physi s, su h asrare de ay or �ne measurement of CP violation with B meson, and ALICE is a heavy ion ollisionexperiment to study e.g. the nature of the quark-gluon plasma.2.2 Physi s Motivation2.2.1 The Standard Model HiggsThe investigation of the dynami s responsible for the ele troweak symmetry breaking is one ofthe most important tasks of parti le physi s. The Standard Model [1, 2, 3℄ of the ele troweak andstrong intera tions is in very good agreement with almost all experimental measurements, butthe dynami s, whi h is responsible for ele troweak symmetry breaking, is still not experimentallyproven.Spontaneous symmetry breakingIn the Standard Model, the ele troweak se tor is des ribed as a SU(2)� U(1) gauge theory,where all the ele troweak intera tions between fermions are des ribed by ex hange of masslessve tor bosons. The Lagrangian whi h des ribes the free ve tor boson �eld an be written asL = �14F��(x)F ��(x)� 12F yW��(x)F ��W (x)� 14FZ��(x)FZ��(x); (2.1)By adding the terms, giving the masses to Z and W to the Lagrangian 2.1, it loses the invarian eunder the gauge transformation. To give the masses to the W and Z bosons while keeping thegauge invarian e, a me hanism, alled spontaneous symmetry breaking, is proposed.To introdu e the me hanism, suppose the Lagrangian density des ribed in Eq. 2.2,L = ��'���'� V (') (2.2)10

where ' is a omplex s alar �eld and V (') is the potential energy of the �eld. The a tual formsof su h terms are des ribed as follows: ' = p22 ['1 + i'2℄; (2.3)V (') = �2j'j2 + �j'j4: (2.4)In Eq. 2.4, the onstants � and �2 are real with � positive to make the total �eld energy boundedas des ribed below.It is required that the va uum at the lowest energy state is invariant under the Lorentz trans-formations. This implies that '(x) is onstant in this va uum state. There are two possibilitiesfor the va uum state depending on the parameter �2. When �2 has a positive value, the mini-mum potential energy is realized at ' = 0. When �2 has a negative value, the minimum potentialenergy does not orrespond to a unique value of ' but the value degenerate with the minimumlying on a ring in the omplex plane. The value is des ribed by Eq. 2.5.'Vmin =q��22� ei�; 0 � � � 2�: (2.5)As the Lagrangian in Eq. 2.2 is invariant under rotations in the omplex plane of ', ea h dire tionis equally good and setting � = 0 su h that'Vmin =q��22� � vp2 (2.6) an be done without loss of generality. A theory where the va uum has less symmetry than theoriginal Lagrangian is alled a theory with spontaneous symmetry breaking.The deviation from the hosen minimum an be des ribed by the two real �elds � and �de�ned through ' = p22 [v + � + i�℄ (2.7)The Equation 2.2 rewritten in terms of � and � is thenL = 12������ � �v2�2 + 12������� �v�[�2 + �2℄� 14�[�2 + �2℄2 + (2.8)where the onstant is of interest only for general relativity. Taking the higher order terms asintera tion terms the free Lagrangian readsL = 12������ � �v2�2 + 12������: (2.9)It is seen that � and � in fa t are two real Klein-Gordon �eld. By quantizing these �elds, Eq. 2.9provides two di�erent spin 0 parti le �elds. The � bosons will have massm� = vp2� (2.10)arising from the �2 term while the � bosons remains massless. The masslessness of the � bosonsia a dire t onsequen e of the minimum being degenerate. The remaining terms in Eq. 2.7 anbe treated as intera tions among the � and � parti les.11

Higgs me hanismWhat is alled the Higgs me hanism [4℄ is an appli ation of the spontaneous symmetry break-ing to reate massive ve tor bosons in a gauge invariant theory [4, 5, 6℄. Here it will be shownfor a U(1) theory. The idea is to repla e the normal derivative in Eq. 2.2 with the ovariantderivative: D� = �� + iqA�: (2.11)Adding the Lagrangian to the free gauge �eld A� results inL = D�'�D�'� V '� 14F��F �� : (2.12)This new Lagrangian is invariant under the U(1) gauge transformation'(x)! '0(x) = '(x)eiq�(x)A�(x)! A0� = A�(x) + ���(x); (2.13)where � are any di�erentiable fun tion. Continuing in exa tly the same way as for the substitutionwith Eqs. 2.7 and 2.8 with a negative �2 and expressing the Lagrangian in terms of the variables� and � as de�ned in Eq. 2.7, the result isL = 12������ � �v2�2 + 12������ � 14F��F ��+ 12q2v2A�A� + qvA��� + higher order terms (2.14)The Lagrangian learly has a massive ve tor boson �eld A and two s alar �elds �, � with �massless, but unfortunately also a term A���� whi h does not �t in. The Lagrangian 2.14 hasone degree of freedom. The extra degree of freedom an be absorbed by hoosing a spe i� gauge,where '(x) has the form '(x) = p22 [v + �(x)℄: (2.15)Su h a gauge transformation is always possible and the hosen gauge is alled as the unitarygauge. In this gauge the � �eld disappears and the resultant Lagrangian is as follows;L = 12������ � �v2�2 � 14F��F ��+ 12q2v2A�A� + higher order terms: (2.16)Here the gauge boson an obtain non-zero mass by the term 12q2v2A�A�. In summary, it is seenthat a omplex s alar �eld and a massless ve tor �eld, both with two degrees of freedom in Eq.2.12 is transformed in Eq. 2.15 into one real s alar �eld with one degree of freedom and a massiveve tor boson �eld with three degree of freedom as a result of the Higgs me hanism. A masslessspin 1 parti le has two transverse polarized states while a massive spin 1 parti le has an additionallongitudinal polarized state. It should be noted that the � �eld only disappears if the � bosons12

are massless. As shown in this se tion, this requires the va uum state to be degenerate i.e. theHiggs me hanism will only work with a degenerate va uum.The Higgs me hanism is demonstrated here for a U(1) gauge invariant Lagrangian. To extendit to SU(2) � U(1) gauge invariant Lagrangian of the ele troweak theory, Lagrangian should ontain a omplex s alar doublet and four massless ve tor bosons. Counting degrees of freedomgives four from the s alars and eight from the ve tor bosons. Through the Higgs me hanismthe Lagrangian is transformed into one real s alar, three massive ve tor and one massless ve torbosons. The massless ve tor boson is of ourse to be identi�ed as the photon and the singleremaining s alar as the Higgs boson. Counting degree of freedom again gives one from the Higgs,two from the photon and nine from the massive ve tor bosons, again adding up to twelve.The masses of the parti les in the Standard Model are given asmH = p2�v; mW = 12vg; mZ = mW os �W (2.17)where g is the weak oupling onstant and �W the Weinberg angle. Usingv2 = p22GF ; � = g2 sin2 �W4� (2.18)where GF is the Fermi onstant and � the �ne stru ture onstant, the ve tor boson masses anbe expressed through GF , � and sin �W . By using the Eq. 2.17, the va uum expe tation value is al ulated v = 2mWg = 246 GeV (2.19)
13

Higgs boson produ tionThe Higgs produ tion pro esses at the LHC are shown in Fig. 2.2 and ross se tions orre-sponding to these pro esses are shown in Fig. 2.3. More detail of ea h pro ess is explained below.
Figure 2.2: Feynman diagram of Higgs produ tions at the LHC.Gluon fusionIn this pro ess, the Higgs boson is produ ed through a loop of a top quark. This is thedominant pro ess of the Higgs produ tion at the LHC as shown in Fig. 2.3 be ause huge quantityof gluons are involved in p-p ollisions. Sin e no asso iated parti le hara terizing the Higgsprodu tion is produ ed in the pro ess, it is diÆ ult to �nd the signal of the Higgs boson amongthe ba kground events in this pro ess.Ve tor boson fusionThe event with this pro ess has a hara teristi signal: two high pT jets in the forward regionsand a rapidity gap between these re oil jets, whi h are e�e tive for suppressing the ba kgroundevents.Asso iated produ tion with W/ZThe Higgs boson is produ ed through the bremsstrahlung of the W/Z bosons. The produ tion ross se tion drops with in reasing Higgs mass. The de ay pro esses of W ! l� and Z ! ll areused to �nd this pro ess among the ba kground events.Asso iated produ tion with t/b (ttH/bbH)The hara teristi de ays of asso iated two top(bottom) quarks are used for event sele tion.14

Figure 2.3: The produ tion ross se tion of the Higgs boson at the LHC. The x-axis is the massof the Higgs, and y-axis is the ross se tion of Higgs produ tion [7℄.This pro ess is used for the measurement of the Yukawa oupling of top quark to the Higgs boson.Higgs boson de aysSin e the oupling of the Higgs boson to a parti le in the Standard Model is essentiallyproportional to the parti le mass, the Higgs boson de ays predominantly to heavy parti les andtheir bran hing ratios depend on the mass of the Higgs boson. Figure 2.4 shows the de aybran hing ratios of the Higgs boson as a fun tion of its mass.
Figure 2.4: The de ay bran hing ratios as a fun tion of Higgs mass [7℄.The region mH < 2mW 15

In this mass region, the major de ay pro esses are the following:H ! b�b (2.20)H ! �� (2.21)H ! (2.22)H ! WW � (2.23)The dominant de ay pro ess is (2.20), but it is diÆ ult to identify it at the LHC be ause of QCDba kground events. The energy resolution of b-quark is mu h worse than other parti les as it isobserved as one or more jets. The most promising pro ess for the dis overy of Higgs in this massrange is (2.22). Although the bran hing ratio of this pro ess is small, it is possible to �nd a peakon ba kgrund events thanks to the high mass resolution (� � 1:4GeV). For the VBF produ tion,(2.21) is also an important de ay pro ess for dis overy and (2.23) overs the wide range of theHiggs mass.The region mH > 2mWFigure 2.4 learly shows that the de ay to WW and ZZ is dominant in this region.2.2.2 B-physi sAt the LHC, enormous amount of B-hadrons are produ ed thanks to the large ross se tionfor b-quark and high luminosity(L = 1033 m�2s�1 at so- alled low luminosity operation). Withthis large statisti s, the pre ise measurement on the nature of B hadrons an be made. The aimof B-physi s studies in the ATLAS experiment is to test the Standard Model through pre isionmeasurements of B-hadron de ays, whi h may give indire t eviden e for new physi s, two of whi hare des ribed below.Measurement of asymmetry in B0d ! J= K0sThe measurement of the time-dependent CP-violating asymmetry of the de ay B0d ! J= K0sprovides a lean measurement of the angle � of the unitarity triangle. To a good approximation,the Standard Model predi tion for the asymmetry in this pro ess is given by;A(t) = sin 2� sin(�mdt); (2.24)where �md is the mass di�eren e in the B0d � �B0d system. The predi ted symmetry is insensitiveto the ontribution from penguin diagrams. This makes the B0d ! J= K0s de ay the so- alledgold-plated mode to measure the angle �.In the �nal state of B0d ! J= K0s pro ess, J= de ays into muons or ele trons. The J= ! ��pro ess is dete ted as a leaner signal than the pro ess of J= ! ee in hadron-hadron ollisions.Therefore, the muon system plays an important role for this study.16

Rare de ays of B mesonCertain rare de ays, Bs;d ! ��(X) for example, involve the avor- hanging neutral urrents(FCNC) and are strongly suppressed in the Standard Model, with predi ted bran hing ratiostypi ally in a range 10�5 � 10�10. For the purely muoni de ays, ATLAS will be sensitive tobran hing ratios of order 10�9 and should be able to measure the bran hing ratio for Bs ! ��assuming the Standard Model predi tion. New physi s might result in signi� ant enhan ementsover the Standard Model predi tions.
17

Chapter 3The ATLAS dete torATLAS is a multi-purpose dete tor designed for pre ise measurements of p-p ollisions at theLHC. Figure 3.1 shows the overall design of the ATLAS dete tor in 3D view. The size of theATLAS dete tor is 22m in hight and 45m long along the beam axis. The oordinate system
Figure 3.1: The ATLAS dete tor in 3D view[8℄of ATLAS is shown in Fig. 3.2. It is a right-handed oordinate system; the x-axis points tothe enter of the LHC ring and z-axis is set along the tunnel. The axis perpendi ular to thez-axis is R giving the radius in ylindri al oordinate. The origin of this oordinate is set to thenominal intera tion point. The region z > 0 is alled A side and z < 0 is alled C side. Thepseudo-rapidity of parti les from the nominal intera tion point is de�ned as� = � log tan �2 (3.1)where � is the polar angle of the parti le dire tion measured from the positive z-axis. Thetransverse momentum (pT ) is de�ned as the omponent of the momentum perpendi ular to thez-axis. 18

Figure 3.2: Coordinate system of the ATLAS dete torThe ATLAS dete tor onsists of a magnet system and numbers of dete tor omponents. Thedetail of ea h omponent is explained in this hapter. Here a brief overview is given.Magneti �elds are provided for identifying the harge and measuring the momentum of harged parti les. The ATLAS dete tor has two types of magnets. One is a solenoid with its enter at the nominal intera tion point providing 2T magneti �eld. The other is a systemwith toroids in the outermost part of the dete tor, giving magneti �eld of 1-2T. The toroidalmagneti �eld is for measuring muon momentum and made with air- oil magnets to redu emultiple s attering. The ombination of a long barrel toroid with two inserted end ap toroidsmakes the magneti �eld overing up to � = 2:7.The inner tra king dete tor, pla ed inside the solenoidal magnet, onsists of Sili on-pixelvertex dete tor (Pixel), Semi Condu tor Tra ker (SCT) and Transition Radiation Tra ker (TRT).The Pixel is pla ed losest to the intera tion point and the SCT is lo ated outside the Pixel, bothof them surrounded by the TRT.An ele tromagneti alorimeter and a hadron alorimeter form the ATLAS alorimeter system.The ele tromagneti alorimeter is a liquid argon sampling alorimeter, and it is pla ed outsidethe solenoid oil. The hadron alorimeter is a s intillator tile alorimeter for the barrel part, andpla ed outside the ele tromagneti alorimeter. The end ap hadroni alorimeter is a liquid-argontype alorimeter.The outermost part of the ATLAS dete tor is the muon system. Three layers of drift hambersare pla ed around the toroidal magnet.3.1 Magnet systemFigure 3.3 shows the oils of magnets in the ATLAS dete tor. The oil lo ated at the enterof the ATLAS dete tor with a tube-like shape is the solenoidal magnet. The other oils are fortoroidal magnets, the small ones are alled \end ap toroidal magnets", and the long one is alled\barrel toroidal magnets".19

Figure 3.3: The oil of magnets in ATLAS dete tor.[9℄3.1.1 Solenoidal magnetThe solenoidal magnet is pla ed inside the ele tromagneti alorimeter. This is kept at 4.5Kin temperature. To redu e the amount of material, the magnet does not have a separate ryostatbut rather it shares the ryostat with the liquid argon alorimeter lo ated immediately outside.The magneti �eld along the z-dire tion drops from 2T at the intera tion point to around 0.5 atthe end of the inner dete tor.3.1.2 Toroidal magnetThe toroidal magnet system is divided into one barrel part and two end ap toroid systems.The integrated magneti �eld along a parti le tra k is the important fa tor for the momentumresolution. The stru ture is open with eight oils in the entral region in separate ryostats. Inthe forward region, the toroidal �eld is also formed by eight super ondu ting oils.By passing the two di�erent toroidal magnets, the integrated magneti �eld along the parti letra k has a position dependen e in the forward region. Figure 3.4 shows the magneti �eld at alayer in the x-y view. The ir les in the �gure represent the oil of troidal magnets, and linesare magneti lines. It is lear that the interferen e of the magneti �elds from barrel and end aptoroids ause the ompli ated magneti �eld. Figure 3.5 shows the integrated magneti �eld as afun tion of �. Two urves, in red and bla k, show the integrated �eld at two di�erent � values.The di�eren e of red and bla k lines omes from the measured position of �. This graph alsoshows the ompli ated magneti �eld espe ially in the end ap region(j�j > 1:0). Su h non-uniformmagneti �eld a�e ts to the pT measurement in the muon system. The details are des ribed infollowing hapters.20

Figure 3.4: magneti �eld map in x-y view. The lines indi ates magneti lines.
Figure 3.5: Integrated magneti �eld provided by the toroidal magnet system in the ATLASdete tor.21

3.2 Inner dete torsThe innermost part of the ATLAS dete tor is dedi ated to tra king harged parti les. It an re onstru t the tra ks of harged parti les pre isely with �nely segmented dete tors in themagneti �eld of the solenoid. The layout of the ATLAS inner dete tor is shown in Fig. 3.6. Themost important points for the inner dete tor are as follows.
Figure 3.6: The overall view of the ATLAS inner dete tor in 3D [8℄.� Identi� ation of individual parti les in dense jets where the alorimeter annot resolve theindividual parti les. At the same time, the rate of fake tra ks should be low.� Momentum measurement in a large momentum range. Below a transverse momentum of 0.5GeV, the parti les loop in the magneti �eld, making the pattern re ognition very diÆ ult.This lower limit a�e ts the re onstru tion of onverted photons and J= de ays.� Charge identi� ation of parti les with large transverse momentum for the identi� ation ofe.g. a possible Z0 de ay. In reasing the magneti �eld will improve the harge identi� ationbut at the same time in rease the pT limit for loopers.� Distinguish between ele trons and photons, whi h reate similar lusters in the ele tromag-neti alorimeter.� De ay length re onstru tion for CP-violation studies in the B-system and for B0s mixingmeasurement.� Tagging of jets originating from high energy b-quarks. The b-jets an be from a H ! bbde ay or de ays of supersymmetri parti les. The tagging is done by se ondary vertexidenti� ation and through the identi� ation of leptons from semileptoni B-meson de ays.22

� Ele tron/jet separation in addition to the separation already provided by the alorimeter.� Momentum measurement of low energy muon whi h have large multiple s attering in thehadron alorimeter.� Identi� ation of the primary vertex in the presen e of many verti es from overlying minimumbias events.In line with the overage for the dete tion of ele trons and muons in the alorimeter and muonsystem, the overage of the Inner dete ter extends up to j�j <2.5.
Figure 3.7: the distribution of Radiation lengths in the inner dete tor.It is important to keep the amount of material in the inner dete tor low. The material budgetfor the inner dete tor is shown Fig. 3.7. Photon onversions, bremsstrahlung from ele trons andnu lear intera tions with pions all ause a degraded alorimeter performan e. The large tra kdensity, however, requires dete tion elements with a �ne granularity.3.2.1 Sili on-Pixel dete torThe pixel dete tors have �ne dete ting elements of size 50�m � 400 �m thus giving a 2-dimentional oordinate with just one layer. The better resolution is in the ' oordinate. Figure3.8 shows the layout of the Pixel dete tor.The most important requirements for the pixel dete tors are to provide se ondary vertexinformation for full re onstru tion of B-meson de ays, su h as b-tagging in top physi s, a H ! bb23

Figure 3.8: A 3D view of the ATLAS Pixel dete tor.[8℄de ay and possible de ays of supersymmetri parti les. For better performan e in re onstru tingse ondary verti es, the �rst pixel layer has to be as lose as possible to the beam pipe.3.2.2 Semi- ondu tor tra kerThe sili on strip dete tors have an n-type bulk with a single sided readout of n+ strips.Although radiation damage will ause the bulk material to hange into a p type semi ondu torwith time, the dete tors will still be fun tional. In ea h of the layers of the dete tor, two singlesided dete tors are pla ed ba k to ba k. For one of the layers the strips are parallel to the beampipe thus measuring the ' oordinate dire tly. The strips on the ba k side are rotated by 40 mradto give a stereo view and thereby re onstru ting the z(R) oordinate in the barrel (end ap). Ea hstrip in the dete ting element will have a length of 12 m and a width of 80 �m.3.2.3 Transition radiation tra kerThe Transition Radiation Tra ker (TRT) is pla ed between the sili on tra ker and the solenoid.The TRT onsists of thin proportional hambers, either in the form of straws with �bers embeddedor with foils and straws in separate layers.In total there are around 370000 straws with 4mm diameter in the TRT, whi h are pla edradially in the end ap and along the beam axis in the barrel region.The straws are �lled with a Xenon gas mixture (70%Xe, 27%CO2, 3%O2). Xenon is usedfor the absorption of transition radiation. CF4 enables the gas to have a faster drift-time forele trons, providing higher spatial resolution and redu ing the in uen e from neighboring bun h rossing at the LHC. As a (Xe/CF4) gas mixture is not stable under high voltage, CO2 is addedto stabilize the gas, thus preventing sparks and streamers inside the straw during operation. Inthe enter of the straw is a 30 �m gold overed tungsten wire. The gas gain in the straws will be2.5� 104 and the total drift-time approximately 40 ns and thus not fully ontained within onebun h rossing.24

Figure 3.9: A 3D-view of the ATLAS alorimeter system.[10℄3.3 CalorimetersA alorimeter is almost always divided into an ele tromagneti and hadroni alorimeter. Thedistin tion is possible be ause of the di�erent intera tion behavior between ele trons/photons andhadrons. The ratio between the response of the alorimeter for the purely hadroni and purelyele tromagneti part of the shower is alled the e=h ratio. For a good energy resolution the valueof e=h should be as lose as possible to one. The size of hadroni showers depends linearly on theintera tion length � of the material whi h is always longer than the radiation length.A measurement of missing transverse energy is a way to measure parti les es aping the dete torwithout intera tions. This an either be neutrinos or stable supersymmetri parti les. To identifymissing transverse energy, the alorimeter needs to have a good hermeti ity. This means that therapidity overage has to be extended as forwards as possible and any ra ks in the dete tor for ables and ooling have to be minimized. The hadroni alorimeter also needs to be thi k enoughto avoid leakage of hadrons into the muon system, whi h would both degrade the resolution inmissing transverse energy and give ba kground in the muon system.3.3.1 Liquid argon alorimetersThe ele tromagneti alorimeter in ATLAS is a liquid argon sampling alorimeter. Thelead/stainless steel is used for layers and liquid argon are interspa ed. The lead gives the showerdevelopment with its short radiation length and the se ondary ele trons reate ionization in thenarrow gaps of liquid argon. An indu tive signal from the ionization ele trons drifting in the25

ele tri �eld a ross the gap is registered by opper ele trodes.To a hieve a low apa itan e of the dete ting elements and thereby a fast signal, the lead plateshave an a ordion shape shown in Fig. 3.10. At the same time, this reates a fully homogeneous
Figure 3.10: S hemati view of a shower in the Liquid Argon Calorimeter.[8℄stru ture in the ' oordinate.The end ap ele tromagneti alorimeters start at j�j=1.5 and ontinue down to j�j=3.2 butwith an in reased ell size above j�j=2.5. There is a ra k with degraded energy resolution wherethe end ap and barrel alorimeters meet. The resolution of the ele tromagneti alorimeter isdes ribed by Eq. 3.2 with energies measured in GeV.�EE = 11:5%pE � 0:5% (3.2)To withstand the high radiation levels in the forward region, the hadroni alorimeter is alsoof liquid argon type in the end aps. The design is simpler than the ele tromagneti alorimeterand has parallel opper plates as absorbers pla ed perpendi ular to the beam. The very forwardhadroni alorimeter with a overage down to j�j=4.9 is made of opper/tungsten. The hoi e of opper/tungsten is ne essary to limit the width and depth of the showers from high energy jets lose to the beam pipe, and to keep the ba kground level low in the surrounding alorimetersfrom parti les spraying out from the forward region. The alorimeter is a metal matrix with ylindri al holes. The holes have rods inside with a slightly smaller radius allowing for liquidargon gap of just 250 �m.3.3.2 Tile CalorimetersThe hadron alorimeter of the ATLAS dete tor is a tile alorimeter whi h overs the entralregion rea hing j�j=1.7. The tile alorimeter is a steel matrix with s intillators inserted as tilesas shown in Fig. 3.11. The s intillator tiles are pla ed su h that the shower passes through themfrom the side to improve the e=h ratio.The light reated in the s intillator tiles is read out with wavelengh shifting �bers to photo-multipliers, pla ed on the outside of the alorimeter. The �bers absorb the blue light from the26

Figure 3.11: A part of tile alorimeter.[13℄s intillators and re-emit it at longer wave-lengths where it rea hes the photo-multipliers throughtotal re e tion inside the �bers.The resolution of the hadroni alorimeter is�EE = 50%pE � 3% for j�j < 3 (3.3)�EE = 100%pE � 10% for 3 < j�j < 5where the onstant term is dominated by the di�erent response to the hadroni and ele tromag-neti part of the shower as a larger part of the total energy ends up as an ele tromagneti showerat high energies.3.4 The muon systemThe identi� ation of muon is important for an experiment working at a high energy p-p ollider. The general layout of the muon system is shown in Fig. 3.12. The muon system onsistsof two types of dete tors on its purpose. One is the trigger hambers to sele t events with highenergy muons and the other is the pre ision hamber to measure the pre ise position.3.4.1 Trigger hambersTwo types of trigger hambers are pla ed in the muon system, one is Resistive Plate Chamber(RPC) overing j�j < 1:05 and the other is Thin Gap Chamber (TGC) for j�j > 1:05.27

Figure 3.12: A layout of muon hambers in the ATLAS experiment.[14℄The RPC has a gas-gap between two resistive bakelite plates with metal strips. The gasused for the operation is mixed one (94.7%C2H2F4, 5%Iso-C4H10, 0.3%SF6). A uniform ele tri �eld between the plates reates avalan hes when a parti le passes the gas-gap and the indu tionfrom the avalan he is measured by the losest metal strip. The 2 mm-thi k gas-gap gives a fastdete tion with a 1 ns time resolution allowing the individual bun h rossings to be identi�ed.The metal strips on ea h side of the dete tor are perpendi ular to ea h other giving a positionresolution of 1 m in ea h plane.TGC has a similar stru ture to the multi-wire proportional hamber (MWPC), and it isoperated in the saturated mode. This hamber has 2-dimensional readout from wire as anodeand strip for athode. The basi stru ture is the gas volume, whi h are sandwi hed by twographite athode planes and 50�m wires spa ed every 1.8 mm in this volume. The athode planeis made of a 1.6 mm FR4 plate on whi h the graphite is deposited. Behind the interior athodeplane, et hed opper strips provide the readout. A mixed gas are used in the operation, and theratio is (55%CO2,45%n-C5H12). Figure 3.13 is a ross se tion view of the TGC.
Figure 3.13: A ross se tion view of TGC [10℄.The region between the graphite layers are ful�lled with the mixed gas. When a hargedparti le passes through su h a gas volume, the gas mole ules are exited by the parti le and emitele trons. With high voltage provided between the wire and graphite layer, the emitted ele tronsdrift in the gas volume to the anode and are dete ted.28

3.4.2 Pre ision hambersTo measure the pre ise position of the parti les passing the muon system, Cathode StripChamber (CSC) and Monitored Drift Tube (MDT) are pla ed in the muon system. The MDT isproportional hambers made of alminium tube of 30 mm diameter and lengths varying from 70 mto 630 m. In the operation, the mixed gas of the argon and CO2 is used. The ratio is (93%Ar,7%CO2) A general MDT hamber used in the ATLAS dete tor is presented in Fig.3.14.
Figure 3.14: A pi ture of MDT hamber.[10℄To measure the oordinate in the bending plane of the magnet, the tubes are pla ed transverseto the beam axis. A set of MDT's onsists of 2 superlayers, ea h with 3 or 4 layers of tubes. Su hmany tubes in ea h set are required to redu e the level of fake tra ks re onstru ted from randomasso iations of ba kground hits and to provide 100% eÆ ien y for ea h set.The dete tion prin iple of the MDT is following. As des ribed above, the MDT onsists oflayered drift tubes. When a harged parti le passes through a tube, the gas mole ules are ionizedalong the traje tory. The ionized ele trons drift to the wire of the tube and the signal indu edfrom the ele trons and ions is read out. The drifted length is al ulated by pre-determined therelation between the drift length and the drift time. The drift length from the wire of the tube an be treated as the radius of a ir le. Therefore, by �tting the drift ir les in multi layersin MDT hamber with a straight traje tory tangent to the ir les, the path of the parti le isre onstru ted.The MDT's are not used in the forward region be ause of their long tubes resulting in atoo high rate. Instead the CSC is pla ed lose to beam pipe overing is 2:0 < j�j < 2:7. TheCSC is multi-wire proportional hambers with a wire spa ing of 2.5mm. Cathode strips arrangedperpendi ular to the anode wires give the se ond oordinate in the readout whi h, together withthe mu h �ner granularity ompared to the MDT's, make it possible to �nd tra ks in the forwardregion, where the tra k density is higher than the barrel region.29

Figure 3.15: MDT prin iple Figure 3.16: drift spa e
30

Chapter 4The ATLAS trigger systemAt the LHC, the intera tion rate of protons at the design luminosity is expe ted to be about1GHz. The trigger system is required to sele t interesting events e�e tively among enormousamount of su h ba kground events.Figure 4.1 shows a s hemati view of the trigger and data ow system of the ATLAS exper-iment. The trigger system is three-leveled triggers: Level-1 (L1), Level-2 (L2) and the EventFilter (EF). The L1 trigger is implemented using ustom-made ele troni s for alorimeters andthe muon dete tors. Sele tions of L2 and EF are based on software algorithms pro essed on aPC farm where the information of the inner dete tor is also available. The L2 and EF formthe high-level trigger (HLT) together with the event builder. The data from ollisions in everydete tor are temporary kept in the pipe-line memories until L1 de ision are made. Then the data orresponding to the ollision are read out through the Read Out Drivers (ROD) and sent toRead Out Bu�ers (ROB), whi h is a part of the Read Out System (ROS). At the HLT, networkswit hes are used to transfer the data between the PC nodes. The maximum trigger rates at L1,L2 and EF are 75�kHz, 3�kHz and 200�Hz, respe tively.
Figure 4.1: Blo k diagram of the Trigger and DAQ system[11℄31

4.1 Overview4.1.1 The Level-1 triggerWhen a parti le passes through dete tors, intera tions between the parti le and materials are onverted into ele troni signal and digitized. In the ATLAS experiment, the digitized signals arekept until the L1 de ision arrives at pipe-line memories, alled \Level-1 bu�er", equipped in thefront-end ele troni s of every dete tor system. A blo k diagram of L1 trigger is shown in Fig. 4.2.
Figure 4.2: A blo k diagram of L1 trigger[15℄The L1 trigger onsists of two subtrigger systems. The muon trigger sear hes high-pT muons andthe alorimeter trigger identi�es features with high-ET obje ts like ele trons, photons, jets and� -leptons de aying into hadrons. The alorimeter trigger also sele ts events with large missingET and large total ET . After these sele tions, the L1 A ept is made by the Central TriggerPro essor (CTP), whi h ombines results from muon and alorimeter triggers. The L1 a ept isdistributed to the front-end ele troni s via the Timing, Trigger and Control (TTC) system. Thelaten y of the L1 trigger, whi h is de�ned as the interval between the ollision of protons andarrival of the signal of L1 a ept to the front-end ele troni s, is 2.5 �s. On e the L1 a ept isdelivered, the data kept in pipe-line memories are read out and sent to the ROB through ReadOut Links (ROL's). In order to e�e tively perform L2 algorithm within a limited time, the regionof interest (RoI) information, indi ating the area of dete tors where positive signals are observedat L1, is produ ed. RoIs are reated in the sub-systems of L1 trigger (muon, alorimeters andCTP) and sent to the L2 trigger.4.1.2 High-level triggerThe HLT onsists of the L2 trigger, the EF and the event builder in between L2 and EF.The L2 trigger applies more sophisti ated algorithms than that in the L1 trigger using the dataasso iated to RoIs. The L2 trigger system is implemented in a PC farm. The maximum pro essing32

time allowed for ea h event is 40ms.
Figure 4.3: A ow hart of the data and triggers between the fun tional blo ks of HLT. Thenumbers on the line between boxes indi ate the order of pro essing of trigger.The logi al stru ture of the HLT onsists of several fun tional blo ks: the RoI builder, theL2 SuperVisor (L2SV), the L2 Pro essing Unit (L2PU) and the L2 trigger-spe i� ROS (pseudo-ROS). The role of the RoI builder is to assemble the RoI information sent from the di�erentsour es in L1 trigger into a single data stru ture, alled the RoI re ord, whi h is sent to theL2SV. The L2SV ontrols data and message ow in the L2 trigger system. Figure 4.3 shows a ow hart between fun tional blo ks of the HLT. The L2SV assigns one of the L2PUs to pro essan event by using the data asso iated with the RoI re ord. When a L2PU re eives the RoIinformation from the L2SV, it requests orresponding data to the ROS of the dete tor of interest.Then it performs algorithms for sele ting event. The results are sent to the pseudo-ROS, asoftware omponent behaving like real ROS. The pseudo-ROS adds the detailed LVL2 resultsinto the event data. The result of the sele tion is sent ba k to the L2SV.When an event is a epted by the L2 trigger, the Event Builder olle ts and assembles fulldata from all the dete tors. The Event Builder onsists of DFM (Data Flow Manager), ROS andSFI (Sub Farm Interfa es). The DFM is a multi-thread appli ation supervising event buildingpro esses. When the DFM re eives the result of the sele tion by the L2 trigger, it asks the SFIto olle t all the data in the event from the ROS and to assemble them. The SFI informs the ompletion of event building to the DFM. Then the DFM asks to the ROS to lear the data afterthe event is built or the event is reje ted by the L2 trigger.The EF performs sele tion algorithms after the standard ATLAS re onstru tion and analysisappli ations. The data from all part of the dete tors an be used for the sele tion. The limit onthe pro essing time is 4s per event. At the EF the event data a epted in the sele tion riteriaare lassi�ed into pre-determined sets of so- alled event streams, su h as ele trons, muons, jets,33

photons, EmissT and � , and B-physi s. The ags indi ating the lassi� ation is added to the eventstru ture. The event data are sent to the SFO (Sub Farm Output) and are re orded in a massstorage system.4.2 Muon triggerThe L1 muon trigger sele ts events with high-pT muons for every bun h- rossing. The sele tedmuons by the L1 trigger are either on�rmed or reje ted by using a urate re onstru tion of muontraje tory in the HLT (muon HLT).4.2.1 Level-1 muon trigger
Figure 4.4: A layout of L1 muon trigger system [15℄The L1 muon trigger is based on �nely segmented trigger hambers lo ated in the outer regionof the ATLAS dete tor, the RPC for barrel region (j�j < 1:05) and the TGC for the end- ap region(1:05 < j�j < 2:4). Figure 4.4 shows lo ations of these hambers and typi al traje tories of muons.High pT muons are sele ted in the barrel and end ap regions independently. The detail of thesele tion method is des ribed in the following.The prin iple of the sele tion method in the L1 muon trigger is making oin iden es of hits inmulti-layered hambers, measuring the pT qui kly by al ulating bending angles and lassifyingthe tra ks into six intervals in pT . The pT is measured in three steps. The �rst step is thedetermination of a traje tory with in�nite momentum, the se ond is the measurement of thedeviation between hits and in�nite momentum traje tory, and the last step is the sele tion ofthe pT intervals to whi h the muon belongs by estimating its pT value from the deviation. Therelation between the deviation and the pT intervals is given by a look-up tables (LUT). These34

LUTs are made from a Monte-Carlo simulation of single muon events. Muon andidates foundin the barrel and end ap regions are sent to the Muon to Central Trigger Pro essor Interfa e(MUCTPI) with the pT lass. The MUCTPI ombines all the L1 muon trigger information and ount the number of muon andidates for ea h of six pT intervals. The MUCTPI also removesdouble ount of a muon by taking into a ount overlapped dete tor regions.4.2.2 L1 barrel muon triggerThe RPC hambers in the barrel region are organized in three layers. The inner two layers,RPC1 and RPC2 in Fig. 4.4, are lo ated at approximately 7.5m from the beam axis. Thislo ation is alled Barrel Middle (BM) station. The third layer, RPC3, is lo ated in the outermostof the Barrel Outer (BO) station lo ated at about 10m from the beam axis. Every layer is madeof a doublet hamber with two gas gaps. There are two types of hambers in ea h layer, large hambers for large se tors and small hambers for small se tors, as shown in Fig. 4.5.
Figure 4.5: A part of the ross se tion view (in x-y plane) of the barrel muon system [15℄.The RPC measures hit positions in � and � oordinate. The parti le is bend in � dire tion in thebarrel toroidal magnets. Avoiding dead area, the sensitive areas are overlapped with adja ent hambers for both in � and � dire tion.Muon tra ks pointing to the nominal intera tion point are sear hed in two phases of oin i-den es, alled low-pT and high-pT triggers. The low-pT trigger is pro essed in the following way.When a hit is observed in RPC2 (pivot plane), hits in the RPC planes are sear hed within a roadfrom the hit in the pivot plane. The road is de�ned as a region within a ertain width from thestraight line drawn from the nominal intera tion point to the hit in the pivot plane. The widthof the road is determined from the angle of the lowest pT tra ks in onsideration. Three hits35

Figure 4.6: The Road for high-pT and low-pT trigger in the L1 barrel muon trigger [15℄are required for the four dete tor gaps in RPC1 and RPC2 for the low-pT trigger. The hits ina road are grouped and used to determine the lo al angle and position of a so- alled \tra klet".Deviations of hits found in a road from the in�nite momentum tra k are measured and used todetermine the pT by using the LUT.For the high-pT trigger, RPC3 is used in addition to the RPC1 and RPC2. Expe t for thewidth of the road, the sele tion method of high-pT trigger is similar to that low-pT trigger. As forthe oin iden es of hambers, one hit in two hamber gaps in the RPC3 is required in additionto the 3-out-of-4 oin iden e in the low-pT trigger. Deviations of muons both in � and � are al ulated in parallel. They are ombined to determine the pT .The RPC L1 data are segmented as follows. The largest division is � < 0 and � > 0. Thehalf of the barrel system onsists of 16 se tors, eight for small and eight for large hambers. Allthe hambers are divided in two in � dire tion, giving large or small trigger se tors. As a result,a half of the barrel is divided into 32 trigger se tors. Further segmentations, alled Pad and RoI,are shown in Fig. 4.7. Ea h se tor in ludes 7 Pads for trigger large se tors and 6 Pads for triggersmall se tors. The size of ea h Pad is 0.2 � 0.2 in �� � ��. A Pad in ludes 4 RoIs, ea h ofwhi h overs the area of about 0.1 � 0.1 in �����. The total number of Pads is 832 and thereare 3328 RoIs.4.2.3 L1 end ap muon triggerThe TGC hambers are used for the L1 trigger in the end ap region. The TGC onsists offour layers, ea h of whi h is alled, from the nominal intera tion point to outside, TGC EI/FI,TGC1, TGC2 and TGC3. The hambers are pla ed perpendi ular to the beam axis. The EI/FIlayer is lo ated at about 7m from the nominal intera tion point in z, and the others are lo atedat about 14m. The overage of the TGC are 1:05 < j�j < 2:4 for the TGC1, TGC2 and TGC3,and 1:05 < j�j < 1:96 for the EI/FI. A TGC hamber has a two-dimensional readout; the wire36

Figure 4.7: The division of Pad and RoI in the se tors. CM stands for Coin iden eMatri es for identifying the pT of a muon [11℄.gives R dire tion and the strip gives the azimuthal angle �. TGC EI/FI, TGC2 and TGC3 aredoublet hambers with two dete tor gaps. TGC1 onsists of triplet hambers with three dete torgaps. A doublet hamber has two readout layers for both wire and strips. A triplet hamberhas three readout layers for wires and two readout layers for strips. The pivot plane of the L1end- ap muon trigger system is TGC3, the outermost layer.
Figure 4.8: Readout and trigger se tors in an TGC o tant [11℄The end- ap muon system is subdivided into eight parts in �, alled o tant, whi h is shownin Fig. 4.8. A wheel is divided in two regions: \end ap" orresponds j�j < 1:92, and \forward"is j�j > 1:92. The end ap part of o tant is divided in six in � and the forward is divided inthree, alled se tors. A se tor is divided into RoIs, the number of whi h is 148 (64) for an end ap(forward) se tor. 37

When a hit is found in the pivot plane, the deviations of hit positions in other planes are al ulated. Here the deviation is de�ned as the distan e, in R and �, between the hit and the line onne ting the hit in the pivot plane and nominal intera tion point. These deviations are used toobtain the pT of the tra k. A tra k andidate is required a 3-out-of-4 oin iden e for two gas gapsin ea h of TGC2 and TGC3 both in R and �. This gives a low-pT oin iden e. The tra k is saidto be high-pT oin iden e if a 2-out-of-3 oin iden e for wires and a 1-out-of-2 oin iden e forstrips are found in TGC1. In the �nal stage of the trigger algorithm, two-dimensional patterns
Figure 4.9: A s hemati drawing of the oin iden es and pT determination of the L1 TGC triggersystem.of the deviations in both R and � are used to determine the pT of the tra k. EI/FI are reservedfor future use.4.3 L2 muon triggerThe aim of the L2 muon trigger is to improve measurements of pT of muons and reje tingba kground from tra ks found in the L1 muon trigger. At the L2 trigger, full dete tor informationinside an RoI an be used for analysis. The L2 muon trigger onsists of a number of sele tionalgorithms. These algorithms an be grouped a ording to their purposes. An algorithm for themuon stand-alone tra king, TrigmuFast (�Fast), �nds traje tories of muons by using hits only inthe RoI of the muon system to al ulate the pT . TrigmuComb ombines the traje tories found inTrigmuFast and L2ID tra ks re onstru ted by the inner dete tors. Other algorithms, for exampleTrigDiMuon and TrigmuIso, are more physi s oriented algorithm to tag spe i� types of muonslike dimuon events or isolated muons.4.4 TrigmuFastTrigmuFast is the re onstru tion algorithm whi h is performed at the �rst stage of L2 muontrigger. The aim is to measure pT more pre isely than in the L1 muon trigger by using hit38

information in the MDT hambers. The result of TrigmuFast is also used as a seed of othersele tion algorithms. The detail of TrigmuFast is des ribed in the next hapter.4.5 TrigmuCombTrigmuComb mat hes traje tories in the tra k olle tion, whi h ontains ID tra ks for innerdete tor and MS tra ks for muon system re onstru ted by TrigmuFast, in spa e, for improvingthe quality of re onstru tions. For non-isolated muons, the tra k olle tion orresponding to anRoI may ontain many ID tra ks. The mat hing is performed in (�, �) plane and the tra kproperties of the best-mat hed ombination are al ulated as a weighted average of the result.This weight is based on the resolution of pT . TrigmuComb also gives reje tion power for themuon from de ay-in- ight of �=K and the fake tra k by avern ba kground in muon system,sin e su h ba kground sour es likely do not have mat hing ID tra ks or mat hes with an ID withlarge impa t parameter.
Figure 4.10: A tra k marked as the \best-mat hed" tra k is sele ted based on the �2.
39

Chapter 5TrigmuFastAs des ribed in hapter 4, the TrigmuFast is used in the �rst stage of the L2 muon trigger.This re onstru tion algorithm measures pT more pre isely than the L1 muon trigger by makinguse of the information of the pre ise muon tra king dete tor, MDT. The events are sele ted basedon this pre isely measured pT . In this hapter, the algorithm and performan e of the TrigmuFastare des ribed.5.1 AlgorithmThe algorithm onsists of 3 major steps; \Pattern Re ognition", \Tra k Fitting" and \pTEstimation". The detail of ea h step is explained in the following sub-se tions.5.1.1 Pattern Re ognitionThe goal of the Pattern Re ognition is to sele t MDT tubes relevant to the muon identi�edby the L1 muon trigger. At most one MDT tube per ea h layer is sele ted. This sele tion is donebased on the muon traje tory de�ned by the L1 muon trigger, as s hemati ally depi ted in Fig.5.1. Two red thi k lines in the �gure represent the RPC hambers, and the green ir les representthe MDT tubes whi h make up a MDT hamber module. The hashed and �lled ir les show theMDT tubes in whi h hit information is re orded. The dashed line is the muon traje tory de�nedby the L1 trigger. A \road" is then de�ned with respe t to the L1 muon traje tory, whi h isshown as two solid lines in the �gure. All MDT tubes whi h have hit information and is lo atedwithin the \road" are olle ted. If there are more than one MDT tubes in one layer, the onethat has the least deviation from the traje tory is sele ted. This gives more robustness againstfake hits due to, for example, thermal neutrons and photons �lled in the experimental hall ( alled avern ba kground). These sele ted hits are then used in the next step, Tra k Fitting. In theend- ap region, the Pattern Re ognition is pro essed in the same way.40

Figure 5.1: A s hemati pi ture of Pattern Re ognition5.1.2 Tra k FittingIn TrigmuFast, a traje tory in ea h MDT station is treated as a straight line. As des ribed inSe t. 2, hit position measured by the MDT tube an be onsidered as a ir le. Therefore, thereis an ambiguity to determine the \left or right" side of the tube (left-right, L-R, ambiguity). Anexample is shown in Fig. 5.2.
Figure 5.2: An illustration of the left-right ambiguity. A blue ir le represents the drift ir le.From one hit, two andidates of muon traje tory an be derived.To solve this ambiguity and to de�ne the muon traje tory, four hits among those sele ted inthe Pattern Re ognition are used. The reason of using only four but not all the MDT hits is tosave the pro essing time. Two of the hits are pi ked up in the tubes nearest to the intera tionpoints and the other two hits of the farthest. Then, all 16 ombinations from the L-R ambiguityof the four tubes (i.e 24 = 16) are examined in a �2 te hnique to �nd out the best ombination,as follows. For ea h ombination, a straight line is drawn a ording to the L-R assumption ofthe four tubes. Then, this assumption is examined whether other tubes are lose enough to thestraight line. The �2 is used for this evaluation, whi h is de�ned as a sum of \residuals" of alltubes: 41

�2 = tubeXi residual2The residual is de�ned as a distan e from the straight line and the MDT hit position. Then, thebest ombination that gives the least �2 is hosen and hits with too large residuals are removed.Finally, the �tting result is used to de�ne a pseudo-hit alled super point, whi h represent boththe position and dire tion of the �tted line at a middle of the ea h hamber layer.
Figure 5.3: A s hemati pi ture of Tra k FittingThe Pattern Re ognition and the Tra k Fitting are pro essed in every MDT station and threesuper points from inner, middle and outer stations are obtained.5.1.3 Transverse momentum estimation (in the Barrel region)A harged parti le in an uniform magneti �eld goes along a helix, and its traje tory in theplane perpendi ular to the magneti �eld is a ir le. The relation between the momentum andthe radius of this ir le is given by the following equation,p = 0:3 �R�B (5.1)where p is the mometum in unit of GeV, R is the radius of the ir le in unit of meter, and B is themagneti �eld in unit of Tesla. The toroidal magneti �led in the barrel region is fairly uniformand thus traje tory of a harged parti le an be regarded as a ir le in the R�z plane. The radiusof the traje tory an be al ulated by using more than two super points. In the TrigmuFast, alook-up table is used for the al ulation of pT in order to speed up the algorithm. The formulafor the pT al ulation is given as follows;pT = A�R+B (5.2)42

where the parameters A and B depend on hit position and thus are prepared for ea h small ���region. Their values in LUT are determined by using the Monte-Carlo simulation. In this pT al ulation, the energy loss of muon before entering the muon dete tor system, su h as energyloss in alorimeters, are also orre ted. That is, the pT in the equation 5.2 an be onsidered asthe muon momentum at the p-p intera tion point.
Figure 5.4: A s hemati drawing on estimating pT in barrel muon system5.1.4 Transverse momentum estimation (in the End ap region)The pT measurements in the end ap region is more ompli ated than in the barrel region. Itis diÆ ult to de�ne a radius as in the barrel region, be ause the traje tory of a harged parti lepassed in the end ap region is generally not helix be ause of the non-uniformity of the magneti �eld along the path of the parti le. In TrigmuFast, two angles, � and �, whi h an be al ulatedby using the super points, are used for the pT measurement. The de�nition of these angles aredes ribed below. The angle � is mainly used and supplemented by the � for the pT al ulation,be ause only the middle layer information is mandatory in the � determination and there ispra ti ally no area where � (and thus pT ) annot be al ulated. While, � gives generally bettermomentum resolution than �, but in some regions the � annot be al ulated be ause of la k ofdete tor overage in the inner station. In the following, details of the al ulation for � and � aregiven.- �The angle � is al ulated by using the position and dire tion information of the super pointand the nominal intera tion point. Figure 5.5 shows how � is al ulated when the super point isfound only in the middle station. In this ase, � is de�ned as an angle between two lines; one isthe dire tion of the superpoint, and the other is the line onne ting the nominal intera tion pointand the position of the super point. The latter line orresponds to the traje tory of a muon,with an in�nite momentum oming from the nominal intera tion point. Figure 5.6 shows the ase where super points are found both in the middle and outer layers. In this ase, middle andouter super points are onne ted with a line, and the angle � is al ulated as an angle betweenthis line and the line onne ting between nominal intera tion point and the super point in themiddle station.- � 43

Figure 5.5: A s hemati view of the al ula-tion of � when hits are found in only middleMDT station Figure 5.6: A s hemati view of the al ula-tion of � when the hits are found both in themiddle and outer MDT station.On the other hand, to al ulate �, a super point must be found in the inner station. Theangle � is de�ned in a similar manner as �; only the di�eren e is using the dire tion de�ned bythe super point in the inner station instead of the in�nite momentum traje tory. By using thisline, the � al ulation is free from the assumption on the nominal intera tion vertex. Figure 5.7and 5.8 show how � is al ulated in the ases where super points are found only in inner andmiddle layers, and in all layers, respe tively.Figure 5.7: Cal ulation of angle � using thehits are found both in middle and outer MDTstation. Figure 5.8: Cal ulation of angle � using thehits found in all the MDT station.The relation between �(�) and pT is given by the following formula.for � : 1pT = A� � �+B�for � : 1pT = A� � � +B�In the formula, A and B are position dependent parameters. The Monte-Calro truth pT is usedfor determing the parameters A and B. The pT measurement is performed in a similar way tothe Barrel region, namely by using LUTs.5.2 Performan eThe performan e of the TrigmuFast is evaluated by using simulated single muon samples fordi�erent pT values. The study was done separately in four � regions; j�j < 1:0, 1:0 < j�j < 1:5,44

1:5 < j�j < 2:0 and 2:0 < j�j < 2:4, be ause the uniformity of the magneti �eld is di�erent inthe regions.5.2.1 pT resolutionThe resolution is given by the width of the distribution for the deviation of 1pT , whi h is al ulated by following formula,deviation of 1pT : 1pT (TrigmuFast)� 1pT (truth)1pT (truth)where pT (TrigmuFast) means the measured pT in TrigmuFast, and pT (truth) means the truthpT at the intera tion point in Monte-Carlo simulation. The plots for the pT resolution are shownin Fig. 5.9. The plot in the left side is the resolution as a fun tion of pT truth, and the right sideis the one as a fun tion of ���. The resolution in the barrel region is typi ally 2% at pT (truth)
Figure 5.9: Resolution by TrigmuFast[16℄<10 GeV, and it in reases as pT truth gets higher, rea hing to about 5% at pT (truth)=30 GeV.In the end ap region, the resolution is generally worse than that in the barrel region, 5% at pT(truth) <10 GeV, in reasing up to 10% at pT (truth)=40 GeV.5.2.2 Trigger eÆ ien yTrigger eÆ ien y is in general, the ratio of the numbers of the triggered and all generatedevents, where triggered means passing the trigger riteria. In the muon trigger, ea h trigger riterion is based on measured the pT value. For example, the trigger \MU4" refers to thelogi aiming for sele ting muons with pT (truth) >4GeV, whi h is realized as a pra ti al ut ofpT (measured) >3.2GeV for instan e for the barrel region. These thresholds on the measured pTvalue are a�e ted by the pT resolutions dis ussed in the previous se tion. In this se tion, by usingsingle muon Monte-Carlo events, we de�ne the eÆ ien y of the TrigmuFast as follows:TrigmuFast eÆ ien y = number of triggered muons passing L1 and TrigmuFastnumber of all generated muonsNote that this eÆ ien y by de�nition in ludes also the L1 trigger eÆ ien y, be ause TrigmuFastruns only on muon andidates whi h pass L1. Figure 5.10 is the trigger eÆ ien y of TrigmuFast45

pT(GeV/c)0 5 10 15 20 25 30 35 40 45 50
Eff
icie
ncy
0
0.2
0.4
0.6
0.8
1
1.2Barrel(|Eta|<1.05)
MU4
MU6
MU20
MU40
MU4
MU6
MU20
MU40
MU4
MU6
MU20
MU40
MU4
MU6
MU20
MU40
pT(GeV/c)0 5 10 15 20 25 30 35 40 45 50
Eff
icie
ncy
0
0.2
0.4
0.6
0.8
1
1.2EndCap1(1.05<|Eta|<1.5)
MU4
MU6
MU20
MU40
MU4
MU6
MU20
MU40
MU4
MU6
MU20
MU40
MU4
MU6
MU20
MU40
pT(GeV/c)0 5 10 15 20 25 30 35 40 45 50
Eff
icie
ncy
0
0.2
0.4
0.6
0.8
1
1.2EndCap2(1.5<|Eta|<2.0)
MU4
MU6
MU20
MU40
MU4
MU6
MU20
MU40
MU4
MU6
MU20
MU40
MU4
MU6
MU20
MU40
pT(GeV/c)0 5 10 15 20 25 30 35 40 45 50
Eff
icie
ncy
0
0.2
0.4
0.6
0.8
1
1.2EndCap3(2.0<|Eta|<2.4)
MU4
MU6
MU20
MU40
MU4
MU6
MU20
MU40
MU4
MU6
MU20
MU40
MU4
MU6
MU20
MU40Figure 5.10: TrigmuFast eÆ ien y, as de�ned in the text, shown as a fun tion of pT truthas a fun tion of pT (truth). It also shows the eÆ ien y separatery for j�j <1.05, 1.05< j�j <1.5,1.5< j�j <2.0 and 2.0< j�j <2.4. The eÆ ien ies show a lear turn-on behavior; i.e, as the pTgets higher it starts to turn on from zero around the threshold, rea hing to a plateau with theeÆ ien y typi ally 90% for all � regions and for all MU4, MU6, MU20, and MU40 triggers.5.2.3 Trigger rateThe number of triggered events per se ond expe ted at a given instantaneous luminosity is alled trigger rate. The muon trigger rate at the TrigmuFast (R) an be al ulated from the muonprodu tion ross se tion (d�=dpT ), the instantenous luminosity (L) and the trigger eÆ ien y (�)of TrigmuFast de�ned in the previous se tion, as follows:R = LZ d�dpT �(pT )dpT : (5.3)The muon produ tion ross se tion at the LHC is shown in Fig. 5.11. In the region where muonpT is less then a few GeV, the ontribution from the � and K parti les de ay in ight dominates,and its ross se tion in reases very rapidly as pT gets lower. Although the trigger eÆ ien y insu h low pT region is quite small, the large ross se tion may give substantial trigger rates. Inaddition, su h low pT muon produ tion ross se tion from � and K parti les is not only just largebut also diÆ ult to be pre isely predi ted. Thus, there are large un ertainties in the low pT muonprodu tion, whi h in turn bring large un ertainty in the trigger rate estimation. The trigger rateat low pT region may in rease signi� antly with a slight in rease of the trigger eÆ ien y.46

Figure 5.11: The ross se tion of muon at the LHCL2 muon standalone trigger ratesL = 1031 m�2s�1 L = 1033 m�2s�1 L = 1034 m�2s�1Barrel(Hz) End ap(Hz) Barrel(Hz) End ap(Hz) Barrel(Hz) End ap(Hz)4GeV 6GeV 20GeV�=K 190 140 4300 3700 410 1800beauty 50 67 3000 3900 540 1500 harm 70 94 4000 5200 520 1700top <0.1 <0.1 <0.1 <0.1 0.2 0.4W <0.1 <0.1 3 4 24 38TOTAL 310 301 11300 1280 1494 50385GeV 8GeV 40GeV�=K 82 120 840 1500 200 690beauty 37 59 1000 2200 87 280 harm 49 81 1300 2900 83 290top <0.1 <0.1 <0.1 <0.1 0.1 0.2W <0.1 <0.1 3 4 17 23TOTAL 168 260 3143 6604 387 1283Table 5.1: Rate at TrigmuFast [16℄.
47

Table 5.1 shows the single muon trigger rate with TrigmuFast for three di�erent luminosityassumptions. For ea h ase, two trigger thresholds are applied; 4GeV and 5GeV for the L =1031 m�2s�1, 6GeV and 8GeV for the L = 1033 m�2s�1 and 20GeV and 40GeV for the L =1034 m�2s�1. The trigger rate in the end ap region is larger than that in the barrel region,be ause of the less reje tion power for low pT muons due to worse pT resolution. To redu e thetrigger rate from low pT muons, improving the sele tion algorithm of TrigmuFast to su h low pTmuons is needed.5.3 Possible reason of the worse pT resolution for low pT muonsin the end ap regionIn the end ap muon system, the pre ise pT measurement of muon is diÆ ult when a muonpasses through the region where the magneti �eld is non-uniform. For example, in the regionwith weak magneti �eld, the traje tory of low pT muon gets similar to thet of high pT muons.So these low pT muons may be miss judged as high pT muons if the dire tion of parti le wasmis-measured or bended by multiple s attering. The urrent TrigmuDast algorithm measuresthe pT using the dire tion and position of the traje tory. When using �, it determines thebending angle after passing through the volume with the toroidal magneti �eld. If the �eld hasa ompli ated pro�le, the bending angle may not ne essarily. Figure 5.12 shows su h an exampleof the traje tory in the non-uniform magneti �eld. In this ase, the deviation of the dire tion oftraje tory in the middle station is measured small although the bending radius is small and thusthe hange in the dire tion at ea h point is large. As a onsequen e the pT of the traje tory ismeasured higher.
Figure 5.12: A example of the traje tory in ompli ated magneti �eldThree plots in Fig. 5.13 show the ratio of triggered muons in TrigmuFast with respe t tomuons, whi h passed the L1 muon trigger in the regions of j�j < 1:0, 1:0 < j�j < 1:5, 1:5 < j�j <2:0 and 2:0 < j�j < 2:4, respe tively. The urves with ir les represent the ratio of events passing48

Figure 5.13: Trigger eÆ ien y of the L2 TrigmuFast with respe t to the events passing the L1muon trigger, shown separately in four regions in � [16℄.
49

through the MU4 TrigmuFast trigger to that passing the L1 muon trigger. The plots with squareand triangle represent the MU06 and MU20 threshold, respe tively. Although muons with pT lessthan a ertain threshold should be reje ted, about half of su h muons are a epted in TrigmuFast.
Figure 5.14: The position of the regions in theend- ap system where momentum resolutionis poor. Figure 5.15: The hit map of the L1 muon trig-ger in the end ap region muons with pT , mea-sured by TrigmuFast less then 6GeV.
50

Chapter 6The Kalman �lter algorithm fortra kingAs des ribed in the hapter 5, TrigmuFast performs fast pT measurement by using the LUTs.However, there remains some points to be improved for better performan e, espe ially, the poorpT resolution in the weak magneti �eld regions. In order to over ome that, a new tra kingmethod has been introdu ed by using Kalman Filter. Hereafter, this new method is alled\muFastKalman", named after the algorithm used in the program.6.1 Kalman FilterExa tly speaking, a traje tory of a harged parti le passing through the magneti �elds isdistorted from helix be ause the urvature varies due to the energy loss in dete tors. In addition,traje tory may have kinks by the e�e t of multiple s attering, as shown in Figure 6.1. Thus, it isdiÆ ult to des ribe su h a traje tory by a simple formula with small number of parameters and�tting with the least-squares method is not suitable to re onstru t the tra k. It is known, however,that the Kalman Filter algorithm works well for su h a ase. In general, a tra k is des ribed bya set of parameters, ea h of whi h de�nes the position and the dire tion of momentum at ameasurement point. In Kalman Filter, these parameters are re- al ulated and orre ted by usingmeasured value at every point along the traje tory. Thus, e�e ts of multiple s attering and energyloss are taken into a ount.Figure 6.1: A on eptual drawing for the Kalman Filter algorithm51

6.1.1 AlgorithmIn this se tion, the basi idea of Kalman Filter is explained by taking an example of a simplephenomenon. Suppose that a harged parti le travels in a plane perpendi ular to an uniformmagneti �eld. Here, it is assumed that the position and dire tion of the tra k are measured atn-points as shown in Figure. 6.2. The traje tory of the parti le will be a perfe t ir le withoutenergy losses or multiple s attering. In reality, however, the traje tory may deviate from the ir le and measurements have errors. The parameters to de�ne the tra k at a measurement pointare; x, and y are position informations, � is dire tion information and Q=p is the harge overthe momentum of the parti le. The suÆx \m" represents \measured" values and \e" presents\estimated" values. Parameters without \m" or \e" mean the optimized parameters as results ofthe Kalman Filter at ea h measurement point. \1" to \n" means the order of the measurementpoints along the traje tory.
Figure 6.2: An example of Kalman Filter algorithmThe Kalman Filter algorithm onsists of three phases, \predi tion", \�ltering" and \smooth-ing". In the \predi tion" phase, the tra k is extrapolated by using optimized parameters at(k-1)th point and parameters at the k-th point are estimated. At the \�ltering" phase, param-eters are optimized by omparing estimated parameters and measured values at the k-th point.After \predi tion" and \�ltering" are performed at all measurement points along the traje tory,\smoothing" is pro essed. The aim of \smoothing" is to orre t the optimized parameters at allmeasurement point in the Kalman Filter. For example, parameters at k-th point are optimized byusing the \past" measured values from 1 to k. That is to say, these parameters does not in ludethe measurement values in \future" from k+1 to n. To obtain the optimized parameters withall measurement values, the reverse ordered �ltering from n to 1 is performed in the smoothingphase.As des ribed, Kalman Filter estimates and �ts the parameters at every measurement point.52
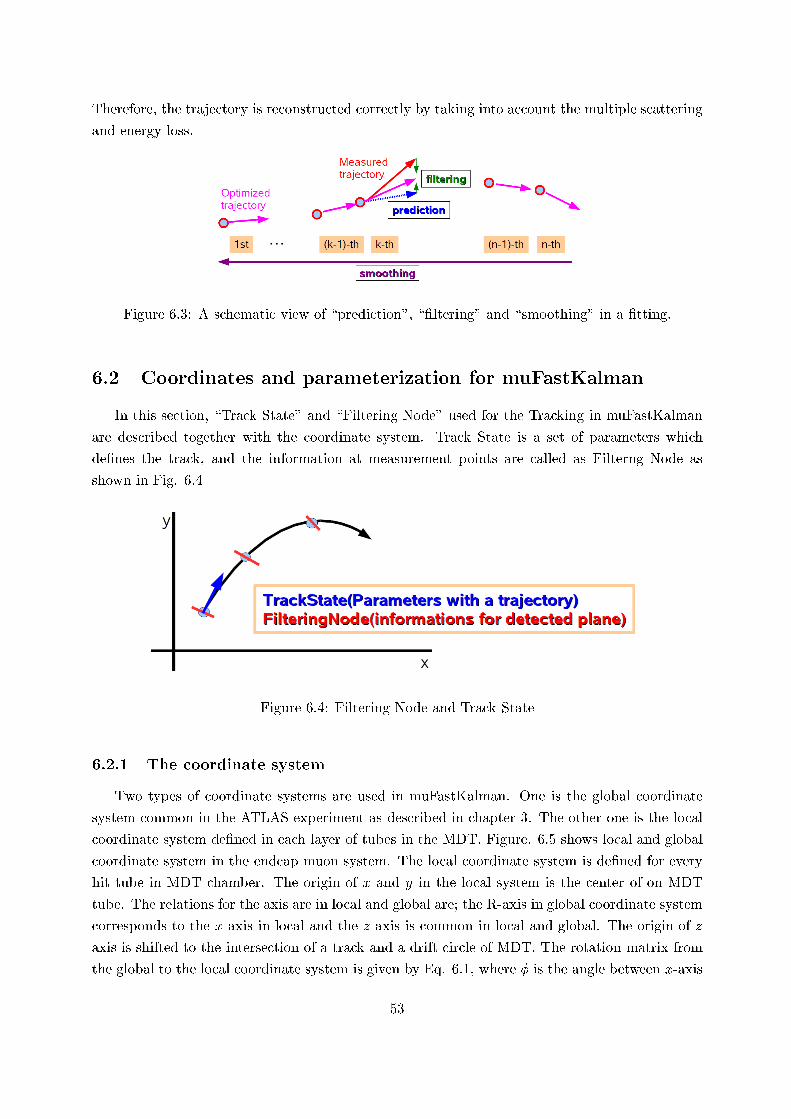
Therefore, the traje tory is re onstru ted orre tly by taking into a ount the multiple s atteringand energy loss.Figure 6.3: A s hemati view of \predi tion", \�ltering" and \smoothing" in a �tting.6.2 Coordinates and parameterization for muFastKalmanIn this se tion, \Tra k State" and \Filtering Node" used for the Tra king in muFastKalmanare des ribed together with the oordinate system. Tra k State is a set of parameters whi hde�nes the tra k, and the information at measurement points are alled as Filterng Node asshown in Fig. 6.4
Figure 6.4: Filtering Node and Tra k State6.2.1 The oordinate systemTwo types of oordinate systems are used in muFastKalman. One is the global oordinatesystem ommon in the ATLAS experiment as des ribed in hapter 3. The other one is the lo al oordinate system de�ned in ea h layer of tubes in the MDT. Figure. 6.5 shows lo al and global oordinate system in the end ap muon system. The lo al oordinate system is de�ned for everyhit tube in MDT hamber. The origin of x and y in the lo al system is the enter of on MDTtube. The relations for the axis are in lo al and global are; the R-axis in global oordinate system orresponds to the x-axis in lo al and the z-axis is ommon in lo al and global. The origin of zaxis is shifted to the interse tion of a tra k and a drift ir le of MDT. The rotation matrix fromthe global to the lo al oordinate system is given by Eq. 6.1, where � is the angle between x-axis53

in global and x-axis in lo al. In the end ap muon system, positions are measured in lo al-x andlo al-z oordinates by the MDT tubes. The measured value for position in lo al-x is al ulatedfrom drift length measured in the MDT, and lo al-z is given by the lo ation of MDT hamber.0B� os� � sin� 0sin� os� 00 0 1 1CA (6.1)
Figure 6.5: Lo al oordinate system in the x-y and R-z view of global oordinate system. z-axisis ommon in lo al and global oordinate system.6.2.2 Filtering NodeFiltering Node is a set of parameters on erning a measurement point. It in ludes two kinds ofinformation. At �rst, parameters to de�ne the measurement plane are in luded. These parametersare enter position and a normal ve tor of the plane and a rotation matrix from lo al to global oordinate system. In the end ap region, the measurement plane is perpendi ular to the beamaxis (i.e. z-axis) and lo ated at the interse tion point on the z-axis between the drift ir le andthe pre-determined tra k, where the pre-determined tra k is the re onstru ted tra k from thesuper point de�ned in the TrigmuFast as des ribed in se tion 5.1.2. Thus a measurement planeis de�ned for ea h tube in the MDT with a hit at the enter position and the normal ve tor inthe lo al oordinate system. Rotation matri es are prepared for onvenien e. Se ondly, FilteringNode ontains the measurement position along the x-axis in lo al and its error. The MDTmeasures the drift length, and only lo al x- oordinate an be determined in the measurementplane.No dete tors are provided in regions between inner and middle, and middle and outer MDT hambers. These dete tor gaps are about 6 to 7 m, whi h are too long to extrapolate the tra kfrom a node to node. Therefore, some \virtual" Filtering Nodes (virtual node) are inserted andthe tra k is extrapolated between these nodes as shown in Fig. 6.6. Virtual nodes are pla ed54

every 100 mm a ross the gaps. They have a same set of parameters as the Filtering Node, butthere are no measurement on the position and its error. Therefore, the measurement values atall virtual nodes are set to zero, and no \�ltering", i.e. updating the parameters, is performed atthese nodes.
Figure 6.6: A s hemati view of Filtering Nodes in the end ap muon system. Measurement planesat Filtering Nodes are shown as green lines and ones at virtual nodes are shown as purple lines.6.2.3 Tra k StateThe Tra k State is a set of parameters to de�ne the traje tory at ea h Filtering Node. Itin ludes �ve parameters; lo al-x, lo al-y, �, � and Q=p. Errors of these parameters are also in- luded. Lo al-x and lo al-y are position information on the measurement plane. The momentumdire tion of the parti le is des ribed by using the polar angle � and the azimuthal angle � in theglobal oordinate system. Q=p gives the momentum information.The Tra k State at the �rst Filtering Node in pro essing the muFastKalman is given byvalues obtained by TrigmuFast. The value of lo al-x is al ulated from the drift ir le measuredat �rst node, and � is al ulated from the super point de�ned in the Tra k Fitting in TrigmuFastdes ribed in 5.1.2. For the lo al-y, the position information from the TGC is used. The azimuthalangle � is al ulated from the hit information of the TGC te hni ally provided by TrigmuFast.The momentum omponent of Q=p is given by the pT al ulated in TrigmuFast using � and �.Errors for ea h parameter, whi h is the omponent of Tra k State, are given by a 5 by 5 ovarian e matrix. The diagonal omponents are the squared errors for �ve parameters and other omponents are the orrelated errors of �ve parameters. The ovarian e matrix for the errors of55

parameters are des ribed as0BBBBBBBBBB��2xx �2yx �2�x �2�x �2Qp x�2xy �2yy �2�y �2�y �2Qp y�2x� �2y� �2�� �2�� �2Qp ��2x� �2y� �2�� �2�� �2Qp ��2xQp �2yQp �2�Qp �2�Qp �2Qp Qp ;
1CCCCCCCCCCA (6.2)where � is the error of parameter and suÆx is the orresponding parameters.The initial error values for lo al-x in the Tra k State are set as 0.01 mm2 whi h is the typi alvalue of the position resolution of MDT, and the same value is also given for lo al-y. As for �and �, these errors are derived from the position information and its resolution of MDT by usingthe error propagation method. Last one is the error of Q=p; the error of p is al ulated from pTresolution of the TrigmuFast. The non-diagonal omponents are initially set to 0, and updatesin pro ess of the Kalman Filter algorithm.
Figure 6.7: A view of measurement in a MDT tube on the lo al oordinate system. Two ir lesrepresent drift tube and drift ir le. The traje tory is shown as the red line. The pink line is themeasurement plane. The purple line and green line represent the measured position and its erroralong the x-axis in lo al.6.3 Cal ulations in muFastKalman6.3.1 Extrapolation of Tra k State in muFastKalmanIn the \predi tion" phase in muFastKalman, the Tra k State is extrapolated between theFiltering Nodes by taking into a ount the magneti �eld. At the virtual nodes, the maximum56

distan e between Filtering Nodes is 100mm. At su h region, extrapolating the Tra k State in onestep degrades the pre ision in predi ting the parameters. Therefore, the region between FilteringNodes is divided into steps, whi h are very lose to ea h other, and tra k is extrapolated betweenthese steps. In the extrapolation, it is assumed uniform magneti �eld and no energy loss in ea hstep. The expe ted errors of the parameters in luded in the Tra k State at previous FilteringNode are used to update the Tra k State at the next Filtering Node taking into a ount the hange of parameters the extrapolation.6.3.2 Validation for measurement valueThe measurement points are used in the \Filtering" pro ess only if the point is lose enoughto the extrapolated Tra k State. For that, a value �2 is used, that is de�ned asresidual = (xm � xe) (6.3)�2 = residual2(�2m + �2e) ; (6.4)where xm is the measured value and xe is the estimated value on lo al-x. The measurementpoint is used when the �2 values below the upper limit. With this pro edure, the result ofmuFastKalman is not a�e ted by obvious bad measurement.6.3.3 Optimization of Tra k StateThe estimated Tra k State is updated by using the measurement value of urrent Filteringnode in the \�ltering" phase. The al ulation of \�ltering" is based on two values: one is theresidual whi h is de�ned Eq. 6.4, the other is the relevant errors of the parameters. The updatevalue is al ulated with following formula:Xi = �2xi(�2xm + �2xe) � residual : i = x; y; �; �; Qp ; (6.5)where X is the updated value of the parameters responsible for its suÆx and suÆx i is the typeof parameter. The obtained value Xi repla es to the parameters of estimated Tra k State. Theerror of parameters are al ulated the following formula:�2ij = �2ij(�2xm + �2xe) � �2ij : i; j = x; y; �; �; Qp : (6.6)6.3.4 �tting order and region of the muFastKalmanThe muFastKalman performs the �tting with reverse of time order and requires the hits inthe inner MDT station. In the end ap muon system, only the region between the inner andmiddle MDT stationd has magneti �elds, and the L1 trigger is performed in the middle station.Therefore, it is natural to regard the region from middle to inner station as the ore region ofmuFastKalman. When hits in outer station is found, they are supplementary used to obtain morepre ise information in the middle MDT station. That is to say, the �tting from outer to middle57

an be regard as that of to obtain the pre ise Tra kState for performing the more pre ise �ttingfrom the middle to inner MDT stations. With these reasons, the muFastKalman performs its�tting in reverse time order and requires the hits in inner station.6.3.5 The result of �ttingFigure 6.8 shows an example of �tting at the inner MDT station by muFastKalman. The dis-played event is the simulated muon of whi h pT is 16GeV. Cir les in the �gure show the drift ir lein hit tubes. Blue lines show \�ltered" tra ks at previous Filtering Node and they are only dis-played in the region of whi h tail. Red lines show the tra k after \predi tion" in muFastKalman,they are only displayed initial region of its tra ks. It is found that the muFastKalman tra es hittubes orre tly.
Figure 6.8: A view of the result of �tting by the muFastKalman in MDT inner station. The ir lesrepresent drift ir les of hit tubes. Blue lines orresponds to the expe ted tra k in the �ttingpro edure, and red lines represent a tra k whi h performed \�ltering" in the �tting pro edure.The x-axis in this plot orresponds to z in global and y-axis mat hes R-axis.
58

Chapter 7Performen e of muFastKalman7.1 Transverse momentum resolutionIn the muon trigger, making the trigger de ision is based on the measured pT , therefore, thepT resolution an be regarded as one of the parameter whi h represent the performan e of thetrigger algorithm. In this se tion, the pT resolution obtained by using the muFastKalman isdes ribed. In following studies, the simulated muon, of whi h pT is 16GeV, events are used.Figure 7.1 shows the distribution of pT multiplied by harge, pT � Q, whi h is measured bythe two sele tion methods, one is the muFastKalman shown with red line, and the other is theTrigmuFast whi h uses LUTs shown with bla k line. Comparing the two histograms, the entervalue of distribution obtained by muFastKalman is less than truth pT �Q. The reason of this shift isthe e�e t of the energy loss in the alorimeters. In the re onstru tion using muFastKalman, pT �Qis measured at the entry point of the muon system, but in the re onstru tion with TrigmuFast,pT �Q at the nominal intera tion point is used for LUTs. Between these two points, ele tromagneti and hadron alorimeters are lo ated and parti les lose their energy by intera tion with materials.
Figure 7.1: pT � Q distribution obtained by ea h sele tion method using simulated single muonevent with pT=16GeV. 59

By using the measured pT and Monte Carlo truth pT , the deviation of pT an be al ulated,ant it is des ribed as follows,deviation of pT = (1=measured pT)� (1=Monte-Carlo truth pT)(1=Monte-Carlo truth pT) (7.1)As des ribed above, muFastKalman and TrigmuFast give the pT of a muon at di�erent po-sitions. In the al ulation of pT deviation using Formula 7.1, the truth pT at suitable positionis used for ea h method, namely pT at the nominal intera tion for TrigmuFast, and pT at theentry point of the muon dete tor for the muFastKalman. Figure 7.2 shows histograms of pTdeviations. The resolutions of pT are the following; 15.8% with the TrigmuFast and 14.3 % withmuFastKalman. To obtain pT resolution, a Gaussian �tting is performed to ea h histogram. The�tting is performed iteratively, and the range of the �tting is within two � from the enter valueof distribution. Comparing these values, the muFastKalman an slightly improve the resolution.However, the distribution for muFastKalman has longer tail than one for TrigmuFast.
Figure 7.2: Histograms of the deviation of pT � Q. The x-axis is the deviation al ulated inFormula 7.1.
Figure 7.3: Correlation of pT distribution and pT resolution for TrigmuFast and muFasyKalman.In both plot, the x-axis is the result from TrigmuFast, and y-axis is muFastKalman. By usingthe muFastKalman, the tail events are in reased, but the ore resolution is improved.60

7.1.1 position dependen eIn the end ap muon system, two toroidal magneti �elds exist, one is generated by the barreltoroid magnet and the other is generated by the end ap toroid magnet. In the end ap region,most of parti les pass through these two magneti �eld geometri ally, and integrated magneti �eld along the traje tory has position dependen e. Therefore, the performan e of re onstru tionalso has position dependen e.To show these e�e t of the position dependen e, the region of end ap muon system is dividedinto some regions and the resolution are al ulated in every segmented region. The magneti �eldhas an o tant symmetry along � be ause eight magnet oils are lo ated. Taking into a ountthe symmetry of magneti �eld, end ap muon system is divided into eight regions. This dividedregion is alled \o tant" as every o tant has a similar magneti �eld, all of them are aggregatedinto one o tant. One o tant is further divided into 25 regions in total, namely �ve regions along� and � dire tions, respe tively. Figure 7.4 shows the typi al three histograms of pT deviation
Figure 7.4: The pT deviation measured by muFastKalman and TrigmuFast. Bla k line shows theresult from TrigmuFast, and the red line is the result with muFastKalman. The region of � forea h histograms are the left side is 1:0 < � < 1:3, the enter is 1:3 < � < 1:6 and the right side is1:6 < � < 1:9. The region of � is ommon to all histograms, � �40 < � < �40 .pi ked up from 25 regions in an o tant. From these plots, the enter value of these plots withmuFastKalman are lose to 0 than TrigmuFast, whi h means that muFastKalman an re overmore pre ise pT for most of traje tories. The width of the resolution in high � region are smallerthan TrigmuFast, but in low � region espe ially 1.3 � 1.6 be ome larger. This low � region orresponds to the region where the integrated magneti �eld is weak. On the other hands, high� region has uniform integrated magneti �elds. The pT resolutions are a�e ted by the intensityof the integrated magneti �eld. One of the reasons of this result is the initial value of themuFastKalman. The initial value of the muFastKalman is used the result of TrigmuFast, andthis result in these regions are already too worse. In addition, the integrated magneti �eld inthis region is too weak to re over the pre ise momentum in the muFastKalman. This is assumedas one of possible reasons that degrade the performan e in su h a region.61

Chapter 8SummaryFollowing the low luminosity run (L = 1033 m�2s�1), the LHC will be operated with thehigh luminosity (L = 1034 m�2s�1). With su h high luminosity, produ tion of huge number oflow pT muons are expe ted. Under su h situations, the pT resolution of the trigger algorithm isan important key to keep the muon trigger rate under its allowed limit.The TrigmuFast at the se ond level of the ATLAS muon trigger performs a pT measurementfor muon andidates a epted in the L1 trigger. It a hieves the fast pro essing of pT measurement,however, there are some points to be improved for better pT resolution as des ribed in Chapter5. The pT measurement in TrigmuFast does not take into a ount all e�e ts whi h o ur alongthe path of a parti le, for example, the multiple s attering or a drasti hane of the magneti �eld. To take into a ount su h e�e ts for the pT measurement, a new tra k �tting pro edurewith Kalman Filter is developed. In this new pro edure, the tra k parameters, whi h des ribethe tra k of a parti le, are al ulated and updated at every measured point. Therefore, there onstru ted tra k by this new pro edure in ludes, for example, the e�e t of multiple s attering.By applying this new method with Kalman Filter, the bias of pT al ulation was redu edabout to 1% from 12% obtained with the TrigmuFast. On the other hand, applying KalmanFilter in reases the tail of the pT deviations, but the pT resolution is improved from 15.8 % to14.3 % in the total region of end ap muon system. The mean pro essing time in reases from 2.38ms to 4.38 ms.In this thesis, it is on�rmed that the development of muFastKalman gives the improvementof performan es of L2 muon trigger below the maximum pro essing time. The muFastKalman isexpe ted to be used in the online trigger algorithm and gives the pre ise pT measurement.62

Bibliography[1℄ S. Weinberg \A Model of Leptons" 1967Phys. Rev. Lett. 19, 1264-1266[2℄ Sheldon L. Glashow \Partial Symmetries of Weak Intera tions" 1961Nu l. Phys. 22 579-588[3℄ A. Salam \Elementary Parti le Theory" 1968Almquist and Wiksell, Sto kholm[4℄ Peter W. Higgs \Broken Symmetries and the Masses of Gauge Bosons" 1964Phys. Rev. Lett. 13, 508-509[5℄ Peter W. Higgs \Broken Symmetries, Massless Parti les and Gauge Fields" 1964Phys. Lett. 12, 132-133[6℄ Peter W. Higgs \Spontaneous Symmetry Breakdown without Massless Bosons" 1966Phys. Rev. 145, 1156-1163[7℄ M. Spira P.M.Zerwars \Ele troweak Symmetry Breaking and Higgs Physi s" 1997hep-ph/9803257[8℄ CERN Publi home http://publi .web. ern. h/publi [9℄ The ATLAS Magnet System http://atlas-ma.web. ern. h/atlas-ma/[10℄ The ATLAS Collaboration \ATLAS DETECTOR AND PHYSICS PERFORMANCE Te h-ni al Design Report Vol.1 and Vol2" 1999CERN. Geneva. LHC Experiments Committee[11℄ The ATLAS Collaboration \ATLAS Level-1 Trigger Te hni al Design Report" 1998[12℄ The ATLAS Collaboration \ATLAS High-Level Trigger,Data A quisition and Controls Te h-ni al Design Report" 2003[13℄ The ATLAS Collaboration \The Calorimeter performan e Te hini al Design Report" 1997[14℄ The ATLAS Collaboration \Muon Spe trometer Te hni al Design Report" 199763

[15℄ The ATLAS Collaboration \The ATLAS Experiment at the CERN Large Hadron Collider"2008JINST 3 S08003[16℄ The ATLAS Collaboration \Expe ted Performan e of the ATLAS Experiment - Dete tor,Trigger and Physi s" 2009arXiv:0901.0512
64