abstract - pakacademicsearchpakacademicsearch.com/pdf-files/ech/387/466-486 volume 27, no 3... ·...
TRANSCRIPT

jei Matthias Busse and Steffen Gröning
466
Abstract
This paper assesses the impact of Jordan’s substantial trade liberalization over the last two de-cades. Using a gravity model, a large country sample, and a long time-series, we estimate the effects of various Free Trade Agreements (FTAs) and the World Trade Organization (WTO) accession on both Jordan’s exports and imports. Overall, we find that the impact has been rath-er small, as no statistically significant and robust impact on exports and imports can be found due to multilateral or preferential trade liberalization. However, there is one exception: the FTA with the United States of America has boosted Jordan’s exports to the US to a considerable de-gree.
JEL Classifications: F13, F14
Key Words: Jordan, Trade Liberalization, Free Trade Agreements, WTO Accession
Assessing the Impact of Trade Liberalization: The Case of Jordan
jei Journal of Economic Integration
Matthias Busse Ruhr-University of Bochum Steffen Gröning Hamburg Institute of International Economics
* Corresponding Author: Matthias Busse; Faculty of Management and Economics, Ruhr-University Bochum, Universitaetsstr. 150, GC 3/145, 44801 Bochum, Germany, Tel: +49 (0)234-32-22902, Fax: +49-234-32-14520, Email: [email protected], [email protected];Co-Author: Steffen Gröning; Department of Economic, Hamburg Institute of International Economics (HWWI), Univ of Hamburg, Von-Melle-Park 5 (Room 2008), 20146 Hamburg, Germany, Tel: +49 040340576448, FaX: +49 040340576776.
ⓒ 2012-Center for Economic Integration, Sejong Institution, Sejong University, All Rights Reserved.
06-035(466-486).indd 466 2012-11-05 오후 4:23:38

jeiAssessing the Impact of Trade Liberalization: The Case of Jordan
467
I. Introduction
The Hashemite Kingdom of Jordan (hereafter referred to as Jordan) is a comparatively small country that has undergone a major process of economic opening up within a short period of time. In this paper, we analyze the main aspects of its trade strategy and assess the success of these measures. Since many developing countries strive to apply a successful economic strat-egy for economic development, Jordan might be a good example.
Jordan itself is an outstanding example of trade liberalization. Since the mid-1990s, it has consistently been trying to enhance its trading position not only bilaterally and regionally but also multilaterally. By signing various Free Trade Agreements (FTAs), such as FTAs with the United States of America (US) and the European Union (EU), and its accession to the World Trade Organization (WTO), Jordan has lowered trade barriers to entry significantly. Accord-ingly, reduction in (tariff and non-tariff) trade barriers is expected to lead to an increase in Jor-dan’s trade flows as production and consumption improve in efficiency.
Indeed, Jordan’s exports and imports have increased considerably since the liberalization process began. The expansion of imported goods has been much larger than the rise in exports, leading to a substantial increase in its trade deficit (Figure 1).1 While Jordan had a small deficit in its services account (US $68 million in 2007), it had a surplus in both its income account (US $835 million) and its current transfers (US $2,779 million). Overall, Jordan faced a US $2,776 million deficit in its current account in 2007 (IMF 2010). Notwithstanding the growing impor-tance of services, almost all of Jordan’s FTAs and its WTO accession have focused on trade liberalization in goods only. This will therefore be the main subject of this paper.
Figure 1. Jordanian Trade Flows and Trade Balance in Billions of US Dollars, 1990~2007
Source: The UN Comtrade (2011).
1 Note that these figures refer to trade in goods only.
-10
-5
0
5
10
15
1990 1994 1998 2002 2006
Imports Exports Trade balance
06-035(466-486).indd 467 2012-11-05 오후 4:23:38

jei Matthias Busse and Steffen Gröning
468
Empirical evidence for analytical studies on Jordan’s trade flows is fairly limited. So far, only two studies have estimated the effects of Jordan’s Association Agreement with the EU. Using a Computable General Equilibrium (CGE) model, Hosoe (2001) simulated the impact of the Association Agreement with the EU on Jordan’s output, exports, and imports. According to Hosoe’s results, all three are likely to increase due to the agreement. For example, imports from the EU are expected to increase by 12 percent, while exports to the EU are expected to rise by 8 percent. However, according to Hosoe (2001), not all sectors would benefit from trade liberalization. While an expansion in Jordan’s chemical and agricultural sectors is expected, the non-metal mineral sector is predicted to decline.2
The second study estimated the effects of the EU Association Agreement on Jordan and was undertaken by Feraboli (2007). Similar to Hosoe, Feraboli also used a CGE model. But he employed an updated structural accounting matrix, calibrated to 1998 data, and a dynamic (rather than a static) CGE model, taking capital accumulation effects into account. He focused on Jordan’s macroeconomic variables, such as private consumption and investment, govern-ment revenues, and welfare levels, and used three main scenarios that differ according to the response of the Jordanian government and in respect to changes in revenues due to the decline in customs revenues. In all simulations the agreement was expected to boost Jordan’s welfare levels in the long run. To counteract any fiscal losses due to the agreement, Feraboli suggested that the government adjust domestic taxes, for example, by increasing the value added tax rate.
To the best of our knowledge, no study has undertaken an ex post impact assessment of the various FTAs Jordan has ratified in recent years and its WTO accession on its trade flows. This paper intends to fill that gap by investigating their impact on Jordan’s imports and exports. This disaggregation is vital as the various trade agreements might have had diverging impacts on trade. This paper is structured as follows: Section II gives a short historic overview of Jordan’s trade policy. While Section III explains the econometric methodology, the samples and the variables used in the analysis, Sections IV and V analyze and explain the empirical results in detail. Based on the results, Section VI concludes with some policy recommendations.
II. On Jordan Trade Policy – A Short Historical Review
Comprehensive economic reforms in Jordan started roughly in the mid-1990s, including major trade and investment reforms. To begin with, Jordan adopted the Investment Promotion Law in 1995 which offers non-discriminatory treatment to foreign investors. In addition, certain
2 Hosoe (2001) also investigated Jordan’s implementation of the GATT Uruguay Round, concluded in 1994, in a general equilibrium model simulation. Since Jordan’s WTO accession in 2000 involved even more commitments and Hosoe’s analysis was based on a simulation, the results are not directly comparable. Still, Hosoe found positive welfare effects due to the implementation of the Uruguay Round.
06-035(466-486).indd 468 2012-11-05 오후 4:23:38
jeiAssessing the Impact of Trade Liberalization: The Case of Jordan
469
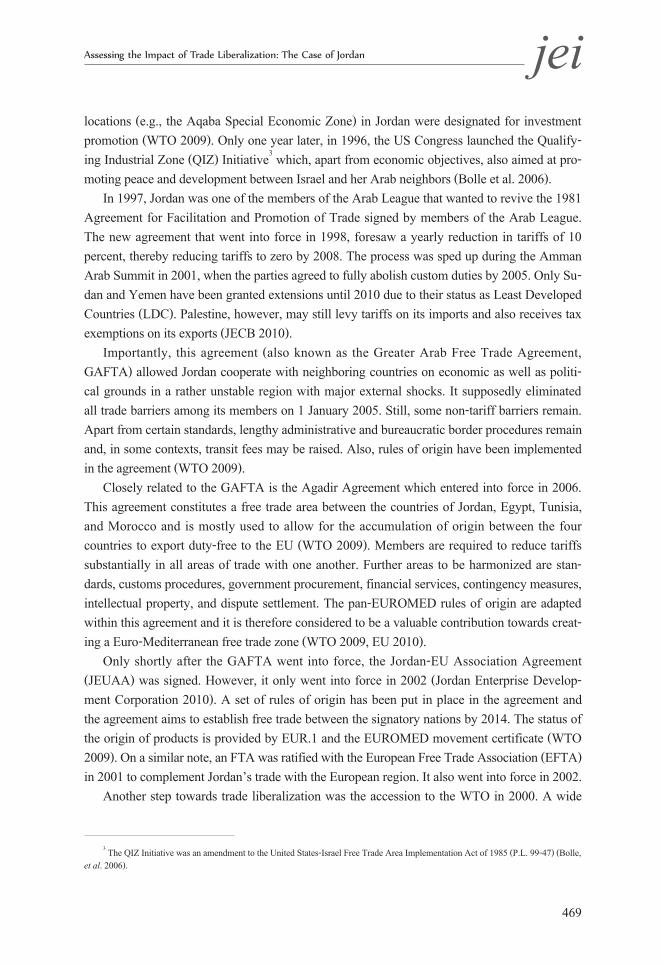
locations (e.g., the Aqaba Special Economic Zone) in Jordan were designated for investment promotion (WTO 2009). Only one year later, in 1996, the US Congress launched the Qualify-ing Industrial Zone (QIZ) Initiative3 which, apart from economic objectives, also aimed at pro-moting peace and development between Israel and her Arab neighbors (Bolle et al. 2006).
In 1997, Jordan was one of the members of the Arab League that wanted to revive the 1981 Agreement for Facilitation and Promotion of Trade signed by members of the Arab League. The new agreement that went into force in 1998, foresaw a yearly reduction in tariffs of 10 percent, thereby reducing tariffs to zero by 2008. The process was sped up during the Amman Arab Summit in 2001, when the parties agreed to fully abolish custom duties by 2005. Only Su-dan and Yemen have been granted extensions until 2010 due to their status as Least Developed Countries (LDC). Palestine, however, may still levy tariffs on its imports and also receives tax exemptions on its exports (JECB 2010).
Importantly, this agreement (also known as the Greater Arab Free Trade Agreement, GAFTA) allowed Jordan cooperate with neighboring countries on economic as well as politi-cal grounds in a rather unstable region with major external shocks. It supposedly eliminated all trade barriers among its members on 1 January 2005. Still, some non-tariff barriers remain. Apart from certain standards, lengthy administrative and bureaucratic border procedures remain and, in some contexts, transit fees may be raised. Also, rules of origin have been implemented in the agreement (WTO 2009).
Closely related to the GAFTA is the Agadir Agreement which entered into force in 2006. This agreement constitutes a free trade area between the countries of Jordan, Egypt, Tunisia, and Morocco and is mostly used to allow for the accumulation of origin between the four countries to export duty-free to the EU (WTO 2009). Members are required to reduce tariffs substantially in all areas of trade with one another. Further areas to be harmonized are stan-dards, customs procedures, government procurement, financial services, contingency measures, intellectual property, and dispute settlement. The pan-EUROMED rules of origin are adapted within this agreement and it is therefore considered to be a valuable contribution towards creat-ing a Euro-Mediterranean free trade zone (WTO 2009, EU 2010).
Only shortly after the GAFTA went into force, the Jordan-EU Association Agreement (JEUAA) was signed. However, it only went into force in 2002 (Jordan Enterprise Develop-ment Corporation 2010). A set of rules of origin has been put in place in the agreement and the agreement aims to establish free trade between the signatory nations by 2014. The status of the origin of products is provided by EUR.1 and the EUROMED movement certificate (WTO 2009). On a similar note, an FTA was ratified with the European Free Trade Association (EFTA) in 2001 to complement Jordan’s trade with the European region. It also went into force in 2002.
Another step towards trade liberalization was the accession to the WTO in 2000. A wide
3 The QIZ Initiative was an amendment to the United States-Israel Free Trade Area Implementation Act of 1985 (P.L. 99-47) (Bolle, et al. 2006).
06-035(466-486).indd 469 2012-11-05 오후 4:23:38
jei Matthias Busse and Steffen Gröning
470
array of commitments under the GATT, GATS, and TRIPS agreements has been implemented. In the WTO context, Jordan signed the Information Technology Agreement (ITA) and has been trying to become covered by the WTO Agreement on Government Procurement. However, as of 2010, it is only listed as having observer status under the Agreement on Government Pro-curement thereby limiting the potential gains of the agreement (WTO 2009, WTO 2010a).
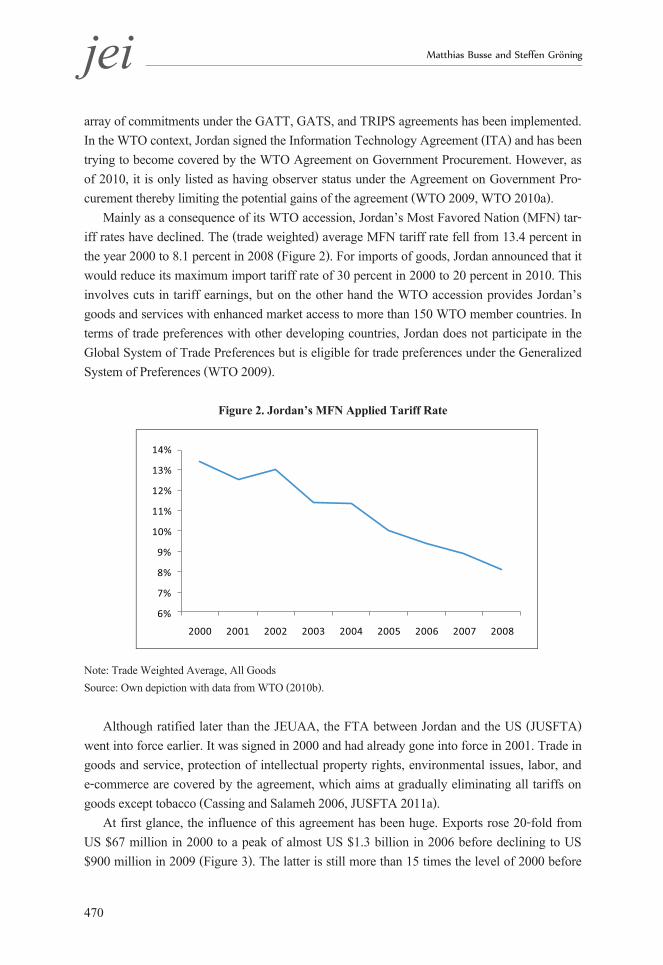
Mainly as a consequence of its WTO accession, Jordan’s Most Favored Nation (MFN) tar-iff rates have declined. The (trade weighted) average MFN tariff rate fell from 13.4 percent in the year 2000 to 8.1 percent in 2008 (Figure 2). For imports of goods, Jordan announced that it would reduce its maximum import tariff rate of 30 percent in 2000 to 20 percent in 2010. This involves cuts in tariff earnings, but on the other hand the WTO accession provides Jordan’s goods and services with enhanced market access to more than 150 WTO member countries. In terms of trade preferences with other developing countries, Jordan does not participate in the Global System of Trade Preferences but is eligible for trade preferences under the Generalized System of Preferences (WTO 2009).
Figure 2. Jordan’s MFN Applied Tariff Rate
Note: Trade Weighted Average, All GoodsSource: Own depiction with data from WTO (2010b).
Although ratified later than the JEUAA, the FTA between Jordan and the US (JUSFTA) went into force earlier. It was signed in 2000 and had already gone into force in 2001. Trade in goods and service, protection of intellectual property rights, environmental issues, labor, and e-commerce are covered by the agreement, which aims at gradually eliminating all tariffs on goods except tobacco (Cassing and Salameh 2006, JUSFTA 2011a).
At first glance, the influence of this agreement has been huge. Exports rose 20-fold from US $67 million in 2000 to a peak of almost US $1.3 billion in 2006 before declining to US $900 million in 2009 (Figure 3). The latter is still more than 15 times the level of 2000 before
6%
7%
8%
9%
10%
11%
12%
13%
14%
2000 2001 2002 2003 2004 2005 2006 2007 2008
06-035(466-486).indd 470 2012-11-05 오후 4:23:38

jeiAssessing the Impact of Trade Liberalization: The Case of Jordan
471
the agreement went into force. The main goods exported were textiles and apparel, jewelry, machinery and equipment, plastics, and pharmaceuticals. The import side has also developed dynamically. Starting with US $452 million in 2000, imports more than doubled to US $977 million in 2009. This growth in imports has been sustainable and from 2008 to 2009 imports grew by a further 26 percent. The highest shares of imports was comprised of machinery, me-chanical appliances, vehicles, arms and ammunition, cereals, aircrafts and parts, electrical ma-chinery and equipment and parts, and optical, measuring, precision, and medical and surgical instruments and parts.
Figure 3. Jordanian Imports from and Exports to the US
Note: Millions of US Dollars Source: Own depiction with data from UN Comtrade (2011).
Also, Jordan was the first country in the region to sign an FTA with Singapore, which went into force in 2005. It thereby emphasized its role as a gateway for business partnerships in the region. Further negotiations for FTAs are being held with Turkey, Canada, and the Mercado Común del Sur (MERCOSUR).4 Another pillar of Jordan’s economic expansion has been the signing of bilateral economic-cooperation agreements. These are non-preferential agreements with 45 countries that serve to foster discussions on further trade liberalization and are expected to build the groundwork for future agreements. To sum up, due to the combined effect of these agreements Jordan is now listed as one of the most open economies in the Middle East. Behind the United Arab Emirates, it is ranked second in the region in terms of trade openness (WTO 2009).
4 In 2009 Jordan signed an FTA with Canada, which will eliminate all non-agricultural tariffs and most agricultural tariffs. Non-tariff barriers are to be reduced as well. This will help Canadian exports to gain access to the Jordanian market while, on the other hand, open-ing up another market for Jordanian exporters (FAITC 2010). Due to data availability, this agreement will not be part of this analysis.
24
06-035(466-486).indd 471 2012-11-05 오후 4:23:39
jei Matthias Busse and Steffen Gröning
472
III. Sample, Methodology, and Variables
The sample used in our empirical analysis covers the period from 1980 to 2007 and 137 countries (see Appendix B). We thus use a relatively long time-series and cover basically all of Jordan’s trading partners. Our trade data is taken from the Comtrade Database operated by the United Nations (UN Comtrade 2011). As trade data from supranational institutions can some-times deviate from national sources, the figures reported by the partner country were checked against figures provided by the Jordanian Ministry of Industry and Trade. We were therefore able to use first hand data to cross check and construct a comprehensive and up-to-date dataset for use in our analysis.
In our empirical analysis, we follow large parts of the relevant literature and estimate a gravity-type model on the determinants of trade flows. As noted by Deardorff (1998), this class of models first appeared in the empirical literature on bilateral trade flows without much in the way of a serious attempt to justify them theoretically. However, Deardorff shows that even sim-ple gravity models can be derived from standard trade theories. A further advantage of this type of economic model is the relatively low risk of econometric problems. These problems include vulnerabilities due to simultaneous and omitted variable biases, the robustness of the results to different specifications, modeling assumptions and data sets, and the suitability of measur-ing explicitly the impact of various trade policy changes at a bilateral level. Consequently, this model is quite appropriate for an analysis of the trade agreements Jordan has ratified thus far.
Tinbergen (1962) first applied a gravity model to the effect of FTAs. He used international trade flows and controlled for the effect of FTAs via dummy variables, finding that FTAs only account for a relatively small influence on trade flows. From thereon there have been several applications of gravity type models on trade-related issues. The results, however, have been ambiguous. Baier and Bergstrand (2007) give an overview of the mixed results of several stud-ies that have used gravity models in analyzing free trade agreements.
In a panel setting, Ordinary Least Squares (OLS) random- or fixed-effects models have traditionally been used for the estimation of gravity equations. A Hausman test could indicate which econometric technique would be the most suitable for the dataset at hand.5 Applying both OLS methods in a gravity model, however, may lead to biased results due to heteroske-dasticity or a large share of zero (trade) observations. As a remedy, Santos Silva and Tenreyro (2006) proposed using a pseudo-poisson maximum likelihood (PPML) estimator to deal with both econometric problems. While our dataset contains relatively few zeroes for trade variables (below 15 percent), heteroskedasticity can pose serious problems. Moreover, the trade data of larger or richer countries (in terms of GDP per capita) tend to be of higher quality. Since the poisson regression will give less weight to those observations with larger variance, the PPML
5 The Hausman test for our dataset indicated that a fixed-effects model would be the preferred choice.
06-035(466-486).indd 472 2012-11-05 오후 4:23:39
jeiAssessing the Impact of Trade Liberalization: The Case of Jordan
473
estimator is suitable for our analysis.6
The specification of our econometric model reads as follows:
where Tradeit stands for Jordanian imports or exports from/to country i in period t (in the regression tables, the variables are labeled Exports and Imports), GDP Partner Countryit is the total Gross Domestic Product (GDP) of Jordan’s trade partner, GDP Jordant stands for Jor-dan’s GDP, WTOt corresponds to Jordan’s WTO membership, and FTAit refers to the various Free Trade Agreements between Jordan and its trading partners.7 We also include a set of year dummies and country-pair fixed effects effects ; represents the error term.
Since we always use the PPML fixed-effects estimator, some of the more traditional ex-planatory variables in a gravity model, such as the distance between the trading partners, a shared border, a common language or colonial ties, cannot be included. Also, we do not incor-porate price index terms or a multilateral resistance term (Anderson and van Wincoop 2003, Baldwin 2006, Baldwin and Taglioni 2006), as we exploit variations over time and/or the data is not available for all countries included in our analysis.
The first two independent variables, Jordan’s trading partner GDP and Jordan’s GDP, are likely to have a positive impact on Exports and Imports.8 Jordan’s accession to the WTO grant-ed it immediate access to the markets of more than 150 WTO-member countries and we there-fore assume that the impact of the accession could be realized with close to full impact from the beginning. Further adjustments are accounted for by taking the average MFN applied tariff rate (World Bank 2011). Our variable for the WTO accession is therefore not modeled as a simple 0/1 dummy variable; rather, it takes the value 0 before the year 2000 and afterwards is takes the value of (100 - average MFN applied tariff rate)/100. It reaches a maximum of 0.89 in 2007.
For corresponding Free Trade Agreements, we employ a set of variables that refer to bilat-eral trade liberalization (i.e., JEUAA, JUSFTA, GAFTA, EFTA, and Singapore-FTA). As our focus in this paper is on the evaluation of the trade strategy of Jordan as a whole we incorporat-ed as much information as is sensible. However, Free Trade Agreements tend to be rather com-plex in their design. Especially the agreements with the EU and the US cannot be considered to be trivial in their design. To begin with the FTA with the EU, various (temporary) exemptions from trade liberalization and complex tariff schedules makes it quite complicated to model the
6 We use a PPML fixed-effects rather than a random-effects model.7 See Appendix A for exact definitions of all variables used in this paper including data sources. Descriptive statistics for these vari-
ables are provided in Appendix C.8 Note that we use nominal GDP and trade figures, since there is no adequate deflator available for trade flows in many developing
countries. The suggested remedy of using the US deflator instead is likely to bias the results (Baldwin and Taglioni 2006).
06-035(466-486).indd 473 2012-11-05 오후 4:23:39
jei Matthias Busse and Steffen Gröning
474
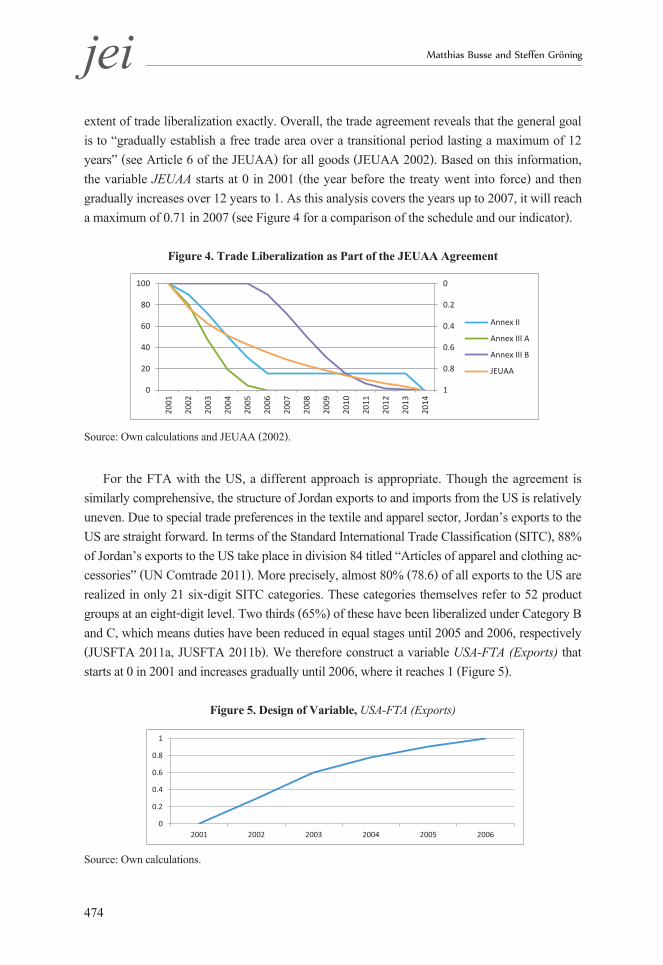
extent of trade liberalization exactly. Overall, the trade agreement reveals that the general goal is to “gradually establish a free trade area over a transitional period lasting a maximum of 12 years” (see Article 6 of the JEUAA) for all goods (JEUAA 2002). Based on this information, the variable JEUAA starts at 0 in 2001 (the year before the treaty went into force) and then gradually increases over 12 years to 1. As this analysis covers the years up to 2007, it will reach a maximum of 0.71 in 2007 (see Figure 4 for a comparison of the schedule and our indicator).
Figure 4. Trade Liberalization as Part of the JEUAA Agreement
Source: Own calculations and JEUAA (2002).
For the FTA with the US, a different approach is appropriate. Though the agreement is similarly comprehensive, the structure of Jordan exports to and imports from the US is relatively uneven. Due to special trade preferences in the textile and apparel sector, Jordan’s exports to the US are straight forward. In terms of the Standard International Trade Classification (SITC), 88% of Jordan’s exports to the US take place in division 84 titled “Articles of apparel and clothing ac-cessories” (UN Comtrade 2011). More precisely, almost 80% (78.6) of all exports to the US are realized in only 21 six-digit SITC categories. These categories themselves refer to 52 product groups at an eight-digit level. Two thirds (65%) of these have been liberalized under Category B and C, which means duties have been reduced in equal stages until 2005 and 2006, respectively (JUSFTA 2011a, JUSFTA 2011b). We therefore construct a variable USA-FTA (Exports) that starts at 0 in 2001 and increases gradually until 2006, where it reaches 1 (Figure 5).
Figure 5. Design of Variable, USA-FTA (Exports)
Source: Own calculations.
0
0.2
0.4
0.6
0.8
10
20
40
60
80
100
2001
2002
2003
2004
2005
2006
2007
2008
2009
2010
2011
2012
2013
2014
Annex II
Annex III A
Annex III B
JEUAA
0
0.2
0.4
0.6
0.8
1
2001 2002 2003 2004 2005 2006
06-035(466-486).indd 474 2012-11-05 오후 4:23:39
jeiAssessing the Impact of Trade Liberalization: The Case of Jordan
475
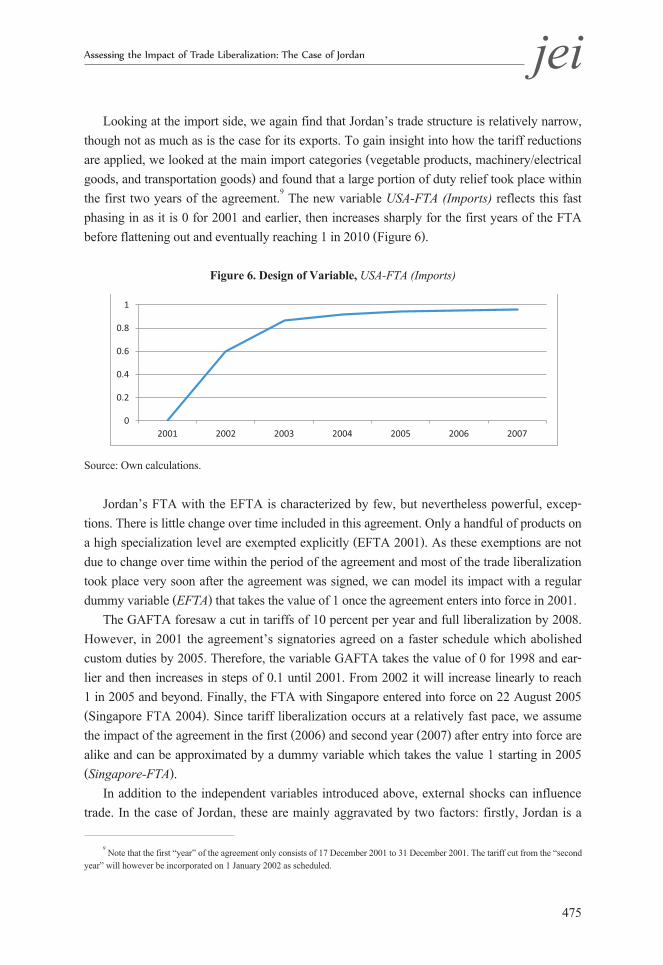
Looking at the import side, we again find that Jordan’s trade structure is relatively narrow, though not as much as is the case for its exports. To gain insight into how the tariff reductions are applied, we looked at the main import categories (vegetable products, machinery/electrical goods, and transportation goods) and found that a large portion of duty relief took place within the first two years of the agreement.9 The new variable USA-FTA (Imports) reflects this fast phasing in as it is 0 for 2001 and earlier, then increases sharply for the first years of the FTA before flattening out and eventually reaching 1 in 2010 (Figure 6).
Figure 6. Design of Variable, USA-FTA (Imports)
Source: Own calculations.
Jordan’s FTA with the EFTA is characterized by few, but nevertheless powerful, excep-tions. There is little change over time included in this agreement. Only a handful of products on a high specialization level are exempted explicitly (EFTA 2001). As these exemptions are not due to change over time within the period of the agreement and most of the trade liberalization took place very soon after the agreement was signed, we can model its impact with a regular dummy variable (EFTA) that takes the value of 1 once the agreement enters into force in 2001.
The GAFTA foresaw a cut in tariffs of 10 percent per year and full liberalization by 2008. However, in 2001 the agreement’s signatories agreed on a faster schedule which abolished custom duties by 2005. Therefore, the variable GAFTA takes the value of 0 for 1998 and ear-lier and then increases in steps of 0.1 until 2001. From 2002 it will increase linearly to reach 1 in 2005 and beyond. Finally, the FTA with Singapore entered into force on 22 August 2005 (Singapore FTA 2004). Since tariff liberalization occurs at a relatively fast pace, we assume the impact of the agreement in the first (2006) and second year (2007) after entry into force are alike and can be approximated by a dummy variable which takes the value 1 starting in 2005 (Singapore-FTA).
In addition to the independent variables introduced above, external shocks can influence trade. In the case of Jordan, these are mainly aggravated by two factors: firstly, Jordan is a
9 Note that the first “year” of the agreement only consists of 17 December 2001 to 31 December 2001. The tariff cut from the “second year” will however be incorporated on 1 January 2002 as scheduled.
25
0
0.2
0.4
0.6
0.8
1
2001 2002 2003 2004 2005 2006 2007
06-035(466-486).indd 475 2012-11-05 오후 4:23:39
jei Matthias Busse and Steffen Gröning
476
relatively small (and now open) country. With a population of little more than 6 million, with more than one third (2.5 million) in the capital city of Amman (CIA 2010), it is particularly vulnerable to external shocks. Secondly, Jordan is located in a politically volatile region. Apart from the Iran-Iraq War (1980 to 1988) and the Gulf Wars in 1991 and 2003, there have almost constantly been armed conflicts in neighboring countries, such as in Lebanon and the Israel-Palestine Territory. Frequently, trade flows have been diverted or reduced in times of conflict. To account for these various shocks, we included a comprehensive set of time dummies, cap-turing specific exogenous variation that is not explicitly addressed by our model.
Finally, we do not use any standard gravity model explanatory variables, such as the dis-tance between trading partners, sharing a common border or a common language, and other time invariant variables. Since we use country-pair fixed effects in all regressions, these vari-ables would drop out of the regressions. Yet all time-invariant determinants of Jordanian trade flows are incorporated into the fixed effects.
IV. Empirical Results
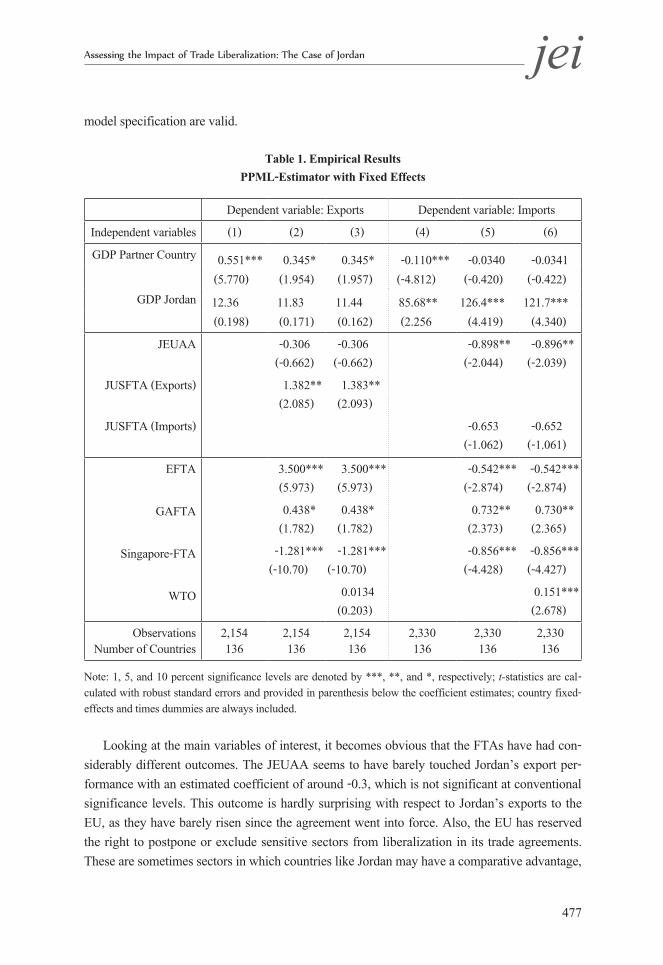
Next, we turn to the empirical results. Overall, we find the differentiation between imports and exports to be well founded. The coefficients differ substantially regarding the relevant variables (Table 1). Host country GDP (i.e., the GDP of Jordan) and partner country GDP con-stitute our base specification (regressions 1 and 4). We then proceed to add the relevant FTA dummy variables as described above (regressions 2 and 5) and, finally, include the WTO vari-able to control for the effects of WTO membership (regressions 3 and 6).
Looking at the export side, we find that the GDP coefficient for Jordan’s partner countries is statistically significantly positive and ranges between 0.35 and 0.55, which is within the usu-ally perceived range.10 This is expected and Jordan’s exports should benefit from rising GDP levels in its trading partners. For Jordanian imports, we obtain a somewhat different outcome (columns 4 to 6). Regarding our standard gravity model variables (GDP Partner Country and GDP Jordan), we mostly obtain the expected signs. In contrast to the results for exports, we do not obtain any significant coefficients for the GDP of Jordan’s partner countries (apart from the base specification, which excludes our variables of interest). The variable GDP Jordan shows a similar behavior: it fails to approach any conventional threshold of statistical significance in the case of the exports. However, as one would expect, Jordanian imports do depend on its GDP. In fact, we always obtain positive coefficients that are statistically significant at the 5% level or better. Based on the results for the GDP variables, we conclude that our main approach and
10 See Magee (2008) for recent estimates. Santos Silva and Tenreyro (2006) examine the impact of different econometric techniques on the size of the coefficients for the main gravity variables.
06-035(466-486).indd 476 2012-11-05 오후 4:23:40
jeiAssessing the Impact of Trade Liberalization: The Case of Jordan
477
model specification are valid.
Table 1. Empirical ResultsPPML-Estimator with Fixed Effects
Dependent variable: Exports Dependent variable: Imports
Independent variables (1) (2) (3) (4) (5) (6)
GDP Partner Country 0.551***(5.770)
12.36(0.198)
0.345*(1.954)
11.83(0.171)
0.345*(1.957)
11.44(0.162)
-0.110***(-4.812)
85.68**(2.256
-0.0340(-0.420)
126.4***(4.419)
-0.0341(-0.422)
121.7***(4.340)
GDP Jordan
JEUAA
JUSFTA (Exports)
JUSFTA (Imports)
-0.306(-0.662)
1.382**(2.085)
-0.306(-0.662)
1.383**(2.093)
-0.898**(-2.044)
-0.653(-1.062)
-0.896**(-2.039)
-0.652(-1.061)
EFTA
GAFTA
Singapore-FTA
WTO
3.500***(5.973)
0.438*(1.782)
-1.281***(-10.70)
3.500***(5.973)
0.438*(1.782)
-1.281***(-10.70)
0.0134(0.203)
-0.542***(-2.874)
0.732**(2.373)
-0.856***(-4.428)
-0.542***(-2.874)
0.730**(2.365)
-0.856***(-4.427)
0.151***(2.678)
ObservationsNumber of Countries
2,154136
2,154136
2,154136
2,330136
2,330136
2,330136
Note: 1, 5, and 10 percent significance levels are denoted by ***, **, and *, respectively; t-statistics are cal-culated with robust standard errors and provided in parenthesis below the coefficient estimates; country fixed-effects and times dummies are always included.
Looking at the main variables of interest, it becomes obvious that the FTAs have had con-siderably different outcomes. The JEUAA seems to have barely touched Jordan’s export per-formance with an estimated coefficient of around -0.3, which is not significant at conventional significance levels. This outcome is hardly surprising with respect to Jordan’s exports to the EU, as they have barely risen since the agreement went into force. Also, the EU has reserved the right to postpone or exclude sensitive sectors from liberalization in its trade agreements. These are sometimes sectors in which countries like Jordan may have a comparative advantage,
06-035(466-486).indd 477 2012-11-05 오후 4:23:40
jei Matthias Busse and Steffen Gröning
478
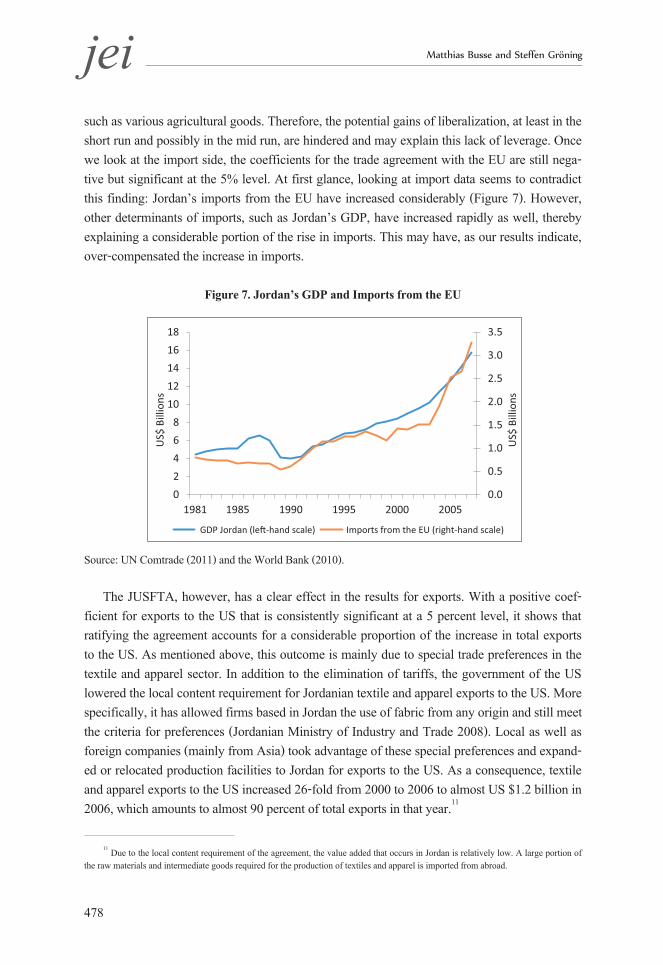
such as various agricultural goods. Therefore, the potential gains of liberalization, at least in the short run and possibly in the mid run, are hindered and may explain this lack of leverage. Once we look at the import side, the coefficients for the trade agreement with the EU are still nega-tive but significant at the 5% level. At first glance, looking at import data seems to contradict this finding: Jordan’s imports from the EU have increased considerably (Figure 7). However, other determinants of imports, such as Jordan’s GDP, have increased rapidly as well, thereby explaining a considerable portion of the rise in imports. This may have, as our results indicate, over-compensated the increase in imports.
Figure 7. Jordan’s GDP and Imports from the EU
Source: UN Comtrade (2011) and the World Bank (2010).
The JUSFTA, however, has a clear effect in the results for exports. With a positive coef-ficient for exports to the US that is consistently significant at a 5 percent level, it shows that ratifying the agreement accounts for a considerable proportion of the increase in total exports to the US. As mentioned above, this outcome is mainly due to special trade preferences in the textile and apparel sector. In addition to the elimination of tariffs, the government of the US lowered the local content requirement for Jordanian textile and apparel exports to the US. More specifically, it has allowed firms based in Jordan the use of fabric from any origin and still meet the criteria for preferences (Jordanian Ministry of Industry and Trade 2008). Local as well as foreign companies (mainly from Asia) took advantage of these special preferences and expand-ed or relocated production facilities to Jordan for exports to the US. As a consequence, textile and apparel exports to the US increased 26-fold from 2000 to 2006 to almost US $1.2 billion in 2006, which amounts to almost 90 percent of total exports in that year.11
11 Due to the local content requirement of the agreement, the value added that occurs in Jordan is relatively low. A large portion of the raw materials and intermediate goods required for the production of textiles and apparel is imported from abroad.
0.0
0.5
1.0
1.5
2.0
2.5
3.0
3.5
02468
1012141618
1981 1985 1990 1995 2000 2005U
S$ B
illio
ns
US$
Bill
ions
GDP Jordan (le�-hand scale) Imports from the EU (right-hand scale)
06-035(466-486).indd 478 2012-11-05 오후 4:23:40
jeiAssessing the Impact of Trade Liberalization: The Case of Jordan
479
The Jordanian textile and clothing industry is largely driven by its preferential access to the US market as well as the above-mentioned QIZ (WTO 2009). Although five years after the incorporation of the QIZ an FTA with the US went into force, Jordanian articles predominantly enter the US through the QIZ Initiative (75 percent). These exports represent 99.9 percent of Jordan’s QIZ exports (WTO 2009). The main reason for this is the staging of the JUSFTA. While QIZ exports can already enter duty free, the tariffs under the JUSFTA will not be entirely eliminated until 2011 (Bolle et al. 2006). After this period of phasing in, the QIZ will probably not retain much relevance as they do not offer any advantages over the FTA. Furthermore, the JUSFTA will eliminate or significantly reduce tariffs on nearly all goods (Cassing and Salameh 2006). We do not find, in spite of the huge influence on the exports side, a significant influence on imports. While the coefficients are negative, they are not significant. Using the same line of reasoning as above for the estimates, this can be explained by the design of the agreement.
Jordan’s trade agreement with other Arab countries (GAFTA) has had a significant influence on its trade, much like the impact of the JUSFTA on exports but with a much lower dimension of around 0.4, thereby increasing Jordan’s exports to countries in the region. Cultural as well as linguistic and geographical proximity make it easy to engage in diverse trade activity within a relatively short period of time. Apart from trade liberalization, the GAFTA dummy may well account for these influences. Similar to the export side, the GAFTA seems to have had a positive and significant impact on Jordan’s imports. In line with arguments above, it could be assumed that the simplified trade basis of culturally closely linked states removes barriers and therefore explains a rise in imports on the basis of this FTA. Another possible explanation that comes to mind is the increase in (the value of) Jordanian oil imports from GAFTA oil produc-ers, such as Qatar, Kuwait, Saudi Arabia, and the United Arab Emirates. Indeed, the total value of oil imports has risen significantly since the late 1990s. This is in line with steep increases in oil prices but also with an increase in Jordan’s GDP. But even if we exclude oil imports from the trade figures, the agreement still has had a significant and positive impact on Jordan’s im-ports from other GAFTA members.12
As for the FTA with Singapore, we obtain negative coefficients for both exports and im-ports that are statistically significant at the 1 percent level. This result might lead one to think that this dummy is capturing a different aspect rather than the effect of the FTA, which at this point is not easily identifiable. The agreement only went into force as recently as August 2005, which leaves us with a mere three recent observations, thereby making these results volatile and possibly weak.
The FTA with the EFTA countries, which complements the agreement with the EU, shows diverging results: while we obtain a positive and significant influence on the export side, the results for imports show a negative impact of that agreement. While this outcome is to some extent unexpected in terms of the magnitude and significance of both exports and imports, a
12 Results not reported. They can be obtained from the authors upon request.
06-035(466-486).indd 479 2012-11-05 오후 4:23:40
jei Matthias Busse and Steffen Gröning
480
closer look reveals further insights. The EFTA group in our estimations consists only of Ice-land, Switzerland, and Norway.13 These countries may have a rather unusual trade pattern with Jordan. For example, if we exclude Switzerland from our regressions on exports we do not get a positive and significant result any longer. Therefore, we assume that each country has a particularly strong effect on the overall result. Adding to that, even though the coefficient may seem high, the trade volume is not nearly as high as that of other groups because it is limited to three relatively small countries.
Finally, while Jordan’s WTO accession shows no significant influence on the export side, it does influence imports positively at a 1 percent level. The interpretation of this result is not clear-cut. For example, some benefits of multilateral trade liberalization might have been real-ized even without being a member. This result may also point towards a relatively well set up industry compared to those of surrounding nations and Jordan’s biggest export partners, import-ing internationally and exporting regionally. On the other hand, WTO accession has certainly led to a decline in Jordanian import tariffs which has boosted imports considerably.
V. Interpretation of the Results
Apart from the JUSFTA, which incorporates special sectoral trade preferences, no bilat-eral or multilateral trade agreement has led to a large increase in exports. Conversely, imports from Jordan’s preferential trading partners, e.g., from GAFTA members, have increased due to reductions in tariff and non-tariff trade barriers. How can this outcome be explained? To begin with, tariffs are often not eliminated immediately after the agreement goes into force but rather lifted step by step over a time span of ten or more years (Jordanian Ministry of Industry and Trade 2008). We accommodate this in our analysis by adjusting our set of variables for transitional periods as comprehensively as possible; still, the complexity of trade agreements can only partly be represented in our model. Also, the time frame of the analysis (end of 2007) might have been too short to correctly identify all relevant influences. Exporters need sufficient time to exploit new trade opportunities abroad due to special trade preferences. This is especial-ly true for recent agreements such as the FTA with Singapore. Both factors are likely to imply considerable time lags, meaning that any or larger trade effects might still occur in the future and would therefore not be mirrored in the current data.
Another reason for this might be restrictive and complicated rules of origin and various product standards in the importing country that have the potential to undermine granted trade preferences (Brenton and Manchin 2003). If the bureaucratic procedures require consider-able time, effort and expenses or, even worse, if they exclude products that do not meet the
13 Due to a lack of trade data, Lichtenstein was excluded in the analysis of the EFTA.
06-035(466-486).indd 480 2012-11-05 오후 4:23:40
jeiAssessing the Impact of Trade Liberalization: The Case of Jordan
481
rules of origin or product standards, trade effects are not very likely to occur. In fact, exporters sometimes do not take advantage of trade preferences as part of an FTA if compliance costs outweigh the preference itself.
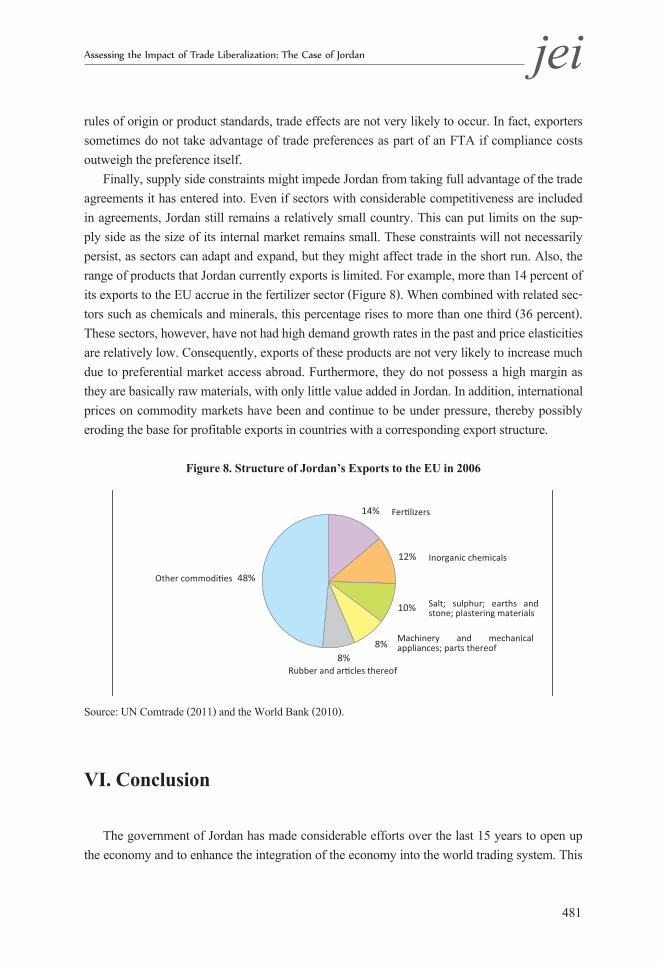
Finally, supply side constraints might impede Jordan from taking full advantage of the trade agreements it has entered into. Even if sectors with considerable competitiveness are included in agreements, Jordan still remains a relatively small country. This can put limits on the sup-ply side as the size of its internal market remains small. These constraints will not necessarily persist, as sectors can adapt and expand, but they might affect trade in the short run. Also, the range of products that Jordan currently exports is limited. For example, more than 14 percent of its exports to the EU accrue in the fertilizer sector (Figure 8). When combined with related sec-tors such as chemicals and minerals, this percentage rises to more than one third (36 percent). These sectors, however, have not had high demand growth rates in the past and price elasticities are relatively low. Consequently, exports of these products are not very likely to increase much due to preferential market access abroad. Furthermore, they do not possess a high margin as they are basically raw materials, with only little value added in Jordan. In addition, international prices on commodity markets have been and continue to be under pressure, thereby possibly eroding the base for profitable exports in countries with a corresponding export structure.
Figure 8. Structure of Jordan’s Exports to the EU in 2006
Source: UN Comtrade (2011) and the World Bank (2010).
VI. Conclusion The government of Jordan has made considerable efforts over the last 15 years to open up
the economy and to enhance the integration of the economy into the world trading system. This
14%
12%
10%
8% 8%
48%
Rubber and ar�cles thereof
Salt; sulphur; earths and stone; plastering materials
Machinery and mechanical appliances; parts thereof
Inorganic chemicals
Fer�lizers
Other commodi�es
06-035(466-486).indd 481 2012-11-05 오후 4:23:40
jei Matthias Busse and Steffen Gröning
482
process had accelerated since the late 1990s, as six free trade agreements have been ratified and put into force and the country has joined the WTO. As a result, Jordan is a suitable candidate for an analysis of the effects of this outward strategy on trade flows. The results of our inves-tigation show that opening up a country by means of FTAs and WTO accession can lead to diverse trade effects. These may not always be expected or appreciated. Our empirical analysis was restricted to the impact of the first years after the respective agreements went into force; it could well be that the outcome changes with time. Still, our results show that an increase in ex-ports cannot be taken for granted due to trade preferences. In fact, this outcome underlines the importance of caution and negotiation before FTAs are ratified.
Above all, potentially promising FTAs can yield rather low increases in overall exports if certain sectors are excluded or if domestic firms cannot cope with an increase in demand or are just not competitive abroad. Jordan’s trade agreement with the US, on the other hand, has led to an enormous increase in exports to the US. Since the increase has been limited to the textile and apparel sector with a low increase in value added in Jordan, the benefits of boosting exports can be questionable.
As a result, policy makers should especially take into account the needs and potential of their supply side. Competitiveness, (national) market size, and a disadvantageous export struc-ture can hinder or prohibit a country from reaping the potential benefits of trade liberalization. However, even if the only agreements that are put into force are those that boost imports but not exports, they might still lead to economic effects in other sectors, such as technology spillovers, or an increase in competition in sectors that were closed before the liberalization process began. Accordingly, countries could achieve gains from trade liberalization even though their exports have not risen in the short run after the opening up of the economy. Still, to take full advantage of preferential trade agreements (and trade in general), a country like Jordan has to increase the international competitiveness of its firms and broaden their scope of products offered on world markets.
Received 22 October 2011, Revised 05 March 2012, Accepted 06 April 2012
References
Anderson, J.E., van Wincoop, E. (2003), Gravity with Gravitas: A Solution to the Border Puzzle, American Economic Review, 93(1), 170-92.
Baier, S., Bergstrand, J. (2007), Do Free Trade Agreements Actually Increase Members’ International Trade?, Journal of International Economics, 71(1), 7295.
Baldwin, R. (2006), In or Out: Does it Make a Difference? An Evidence-based Analysis of the Trade Effects of the Euro. Center for Economic Policy Research, London.
Baldwin, R., Taglioni, D. (2006), Gravity for Dummies and Dummies for Gravity Equations. NBER Working
06-035(466-486).indd 482 2012-11-05 오후 4:23:40
jeiAssessing the Impact of Trade Liberalization: The Case of Jordan
483
Paper Series 12516.
Bolle, M.J., Prados A., Sharp, J. (2006), Qualifying Industrial Zones in Jordan and Egypt. CRS Report for Con-gress, Order Code RS22002, The Library of Congress. at http://www.au.af.mil/au/awc/awcgate/crs/rs22002.pdf.
Brenton, P., Manchin, M. (2003), Making EU Trade Agreements Work: The Role of Rules of Origin, World Economy, 26(5), 755-769.
Cassing, J., Salameh, A.M. (2006), JUSFTA Economic Impact Study: Searching for Effects of the FTA on Exports, Imports and Trade Related Investments. at http://www.econ.pitt.edu/papers/James_10.JUSFTA__Eco-nomic_Impact_Study_2006.pdf.
CIA (2010), CIA World Factbook: Jordan. at https://www.cia.gov/library/publications/the-world-factbook/geos/jo.html.
Deardorff, A. (1998), Determinants of Bilateral Trade: Does Gravity Work in a Neo-classical World, in Fran-kel, J. (ed.), Regionalization in the World Economy. University of Chicago Press, Chicago, 7-22.
EFTA (2001), Agreement Between the EFTA States and the Hashemite Kingdom of Jordan. EFTA Secretariat. at http://secretariat.efta.int/free-trade/free-trade-agreements/jordan.aspx.
EU (2010), European Commission, Trade, Euromed. at http://ec.europa.eu/trade/creating-opportunities/bilater-al-relations/regions/euromed/.
FAITC (2010), Foreign Affairs and International Trade Canada, Canada-Jordan Free Trade Agreement. at http://www.international.gc.ca/trade-agreements-accords-commerciaux/agr-acc/jordan-jordanie/index.aspx?lang=en.
Feraboli, O. (2007), Preferential Trade Liberalisation, Fiscal Policy Responses and Welfare: A Dynamic CGE Model for Jordan, Jahrbuecher für Nationaloekonomie und Statistik, 227(4), 335-357.
Hosoe, N. (2001), A General Equilibrium Analysis of Jordan’s Trade Liberalization, Journal of Policy Model-ing, 23(6), 595-600.
IMF (2010), Balance of Payments Statistics of the International Monetary Fund, Jordan. at http://www.imfsta-tistics.org/bop/.
JECB (2010), Jordan Bureau of Economic & Commerce at the Embassy of Jordan, Washington, D.C. at http://www.jordanecb.org/agreements_arabcountries2.shtm.
JEUAA (2002), Euro-Mediterranean Agreement, Official Journal of the European Communities. at http://eur-lex.europa.eu/LexUriServ/LexUriServ.do?uri=OJ:L:2002:129:0003:0165:EN:PDF.
Jordan Enterprise Development Corporation (2010), Jordan-EU Agreement. at http://www.agreements.jedco.gov.jo/main/eu_doc/eu_agreement.html.
Jordanian Ministry of Industry and Trade (2008), Economic and Trade Agreements of the Hashemite Kingdom of Jordan. Ministry of Industry and Trade, Foreign Trade Policy Department. at http://www.mit.gov.jo/Default.aspx?tabid=731.
JUSFTA (2011a), The Jordan-US Free Trade Agreement. FTA Unit, United States-Jordan FTA Coordinating Committee. at http://www.jordanusfta.com/free_trade_agreement_text_en.asp.
JUSFTA (2011b), Tariff Schedule of the United States of America. at http://www.jordanusfta.com/documents/us_tariff.pdf.
JUSFTA (2011c), Tariff Schedule of the Hashemite Kingdom of Jordan. at http://www.jordanusfta.com/docu-
06-035(466-486).indd 483 2012-11-05 오후 4:23:40
jei Matthias Busse and Steffen Gröning
484
ments/jordantariff.pdf.
Magee, C. (2008), New Measures of Trade Creation and Trade Diversion, Journal of International Economics, 75(2), 349–362.
Santos Silva, J.M.C., Tenreyro, S. (2006), The Log of Gravity, Review of Economics and Statistics, 88(4), 641–658.
Singapore FTA (2004), Agreement Between the Government of the Hashemite Kingdom of Jordan and the Government of the Republic of Singapore on the Establishment of a Free Trade Area. at http://www.fta.gov.sg/fta_sjfta.asp?hl=5.
Tinbergen, J. (1962), Shaping the World Economy: Suggestions for an International Economic Policy. Twenti-eth Century Fund, New York.
UN Comtrade (2011), United Nations Statistics Division, United Nations Commodity Trade Statistics Database (COMTRADE). at http://comtrade.un.org/db/.
World Bank (2010), World Development Indicators. Online Database. http://publications.worldbank.org/sub-scriptions/WDI/WDI.html.
World Bank (2011), Trends in Average MFN Applied Tariff Rates in Developing and Industrial Countries, 1981-2009 (Unweighted in %). at http://siteresources.worldbank.org/INTRES/Resources/469232-1107449512766/tar2009.xls.
WTO (2009), Trade Policy Report: Jordan. World Trade Organization. at http://docsonline.wto.org/imrd/gen_searchResult.asp?RN=0&searchtype=browse&q1=%28+%40meta%5FTitle+Jordan%29+and+%28+%28+%40meta%5FSymbol+WT%FCTPR%FCS%FC%2A+%29%29&language=1.
WTO (2010a), World Trade Organization. at http://www.wto.org/english/tratop_e/gproc_e/overview_e.htm.
WTO (2010b), Tariff Analysis Online. World Trade Organization. at http://tariffanalysis.wto.org/report/Tar-iffAverages.aspx.
06-035(466-486).indd 484 2012-11-05 오후 4:23:40
jeiAssessing the Impact of Trade Liberalization: The Case of Jordan
485
Appendices
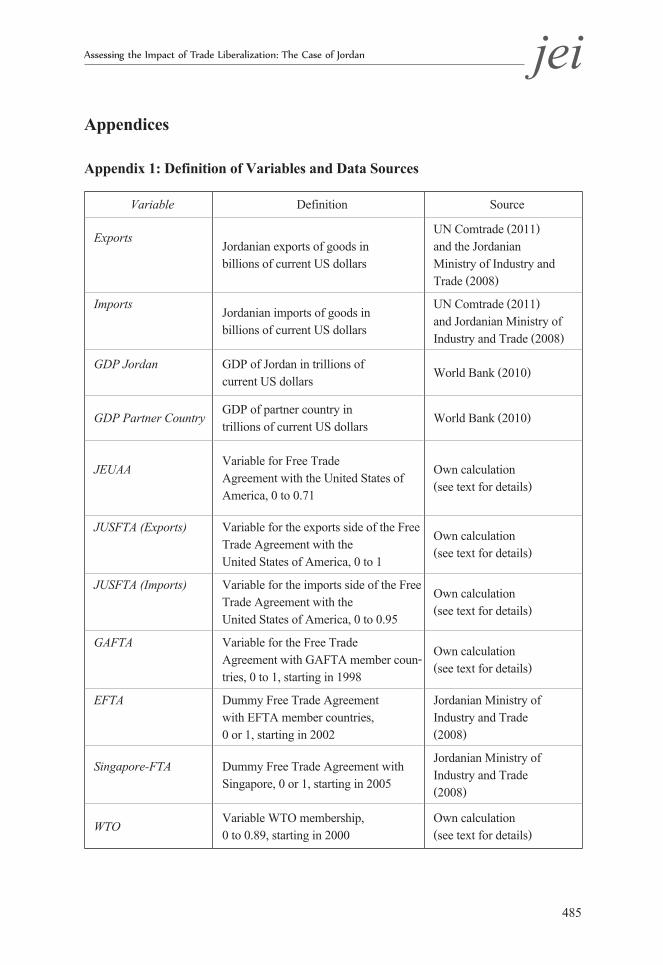
Appendix 1: Definition of Variables and Data Sources
Variable Definition Source
ExportsJordanian exports of goods in billions of current US dollars
UN Comtrade (2011) and the Jordanian Ministry of Industry and Trade (2008)
ImportsJordanian imports of goods in billions of current US dollars
UN Comtrade (2011) and Jordanian Ministry of Industry and Trade (2008)
GDP Jordan GDP of Jordan in trillions of current US dollars
World Bank (2010)
GDP Partner CountryGDP of partner country in trillions of current US dollars
World Bank (2010)
JEUAAVariable for Free Trade Agreement with the United States of America, 0 to 0.71
Own calculation (see text for details)
JUSFTA (Exports) Variable for the exports side of the Free Trade Agreement with the United States of America, 0 to 1
Own calculation (see text for details)
JUSFTA (Imports) Variable for the imports side of the Free Trade Agreement with the United States of America, 0 to 0.95
Own calculation (see text for details)
GAFTA Variable for the Free Trade Agreement with GAFTA member coun-tries, 0 to 1, starting in 1998
Own calculation (see text for details)
EFTA Dummy Free Trade Agreement with EFTA member countries, 0 or 1, starting in 2002
Jordanian Ministry of Industry and Trade (2008)
Singapore-FTA Dummy Free Trade Agreement with Singapore, 0 or 1, starting in 2005
Jordanian Ministry of Industry and Trade (2008)
WTOVariable WTO membership, 0 to 0.89, starting in 2000
Own calculation (see text for details)
06-035(466-486).indd 485 2012-11-05 오후 4:23:40
jei Matthias Busse and Steffen Gröning
486
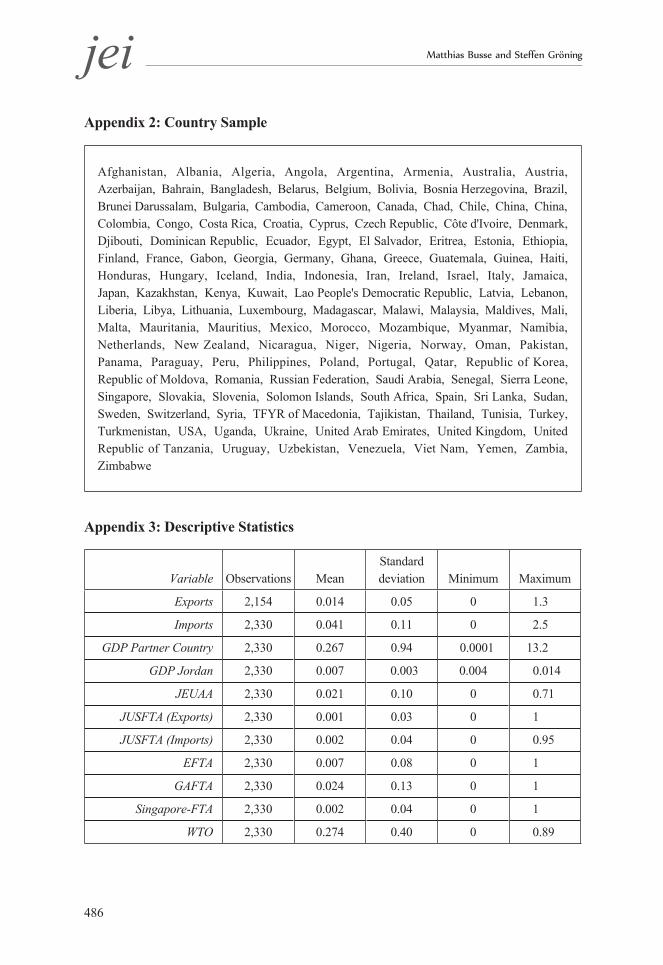
Appendix 2: Country Sample
Afghanistan, Albania, Algeria, Angola, Argentina, Armenia, Australia, Austria, Azerbaijan, Bahrain, Bangladesh, Belarus, Belgium, Bolivia, Bosnia Herzegovina, Brazil, Brunei Darussalam, Bulgaria, Cambodia, Cameroon, Canada, Chad, Chile, China, China, Colombia, Congo, Costa Rica, Croatia, Cyprus, Czech Republic, Côte d'Ivoire, Denmark, Djibouti, Dominican Republic, Ecuador, Egypt, El Salvador, Eritrea, Estonia, Ethiopia, Finland, France, Gabon, Georgia, Germany, Ghana, Greece, Guatemala, Guinea, Haiti, Honduras, Hungary, Iceland, India, Indonesia, Iran, Ireland, Israel, Italy, Jamaica, Japan, Kazakhstan, Kenya, Kuwait, Lao People's Democratic Republic, Latvia, Lebanon, Liberia, Libya, Lithuania, Luxembourg, Madagascar, Malawi, Malaysia, Maldives, Mali, Malta, Mauritania, Mauritius, Mexico, Morocco, Mozambique, Myanmar, Namibia, Netherlands, New Zealand, Nicaragua, Niger, Nigeria, Norway, Oman, Pakistan, Panama, Paraguay, Peru, Philippines, Poland, Portugal, Qatar, Republic of Korea, Republic of Moldova, Romania, Russian Federation, Saudi Arabia, Senegal, Sierra Leone, Singapore, Slovakia, Slovenia, Solomon Islands, South Africa, Spain, Sri Lanka, Sudan, Sweden, Switzerland, Syria, TFYR of Macedonia, Tajikistan, Thailand, Tunisia, Turkey, Turkmenistan, USA, Uganda, Ukraine, United Arab Emirates, United Kingdom, United Republic of Tanzania, Uruguay, Uzbekistan, Venezuela, Viet Nam, Yemen, Zambia, Zimbabwe
Appendix 3: Descriptive Statistics
Variable Observations MeanStandard deviation Minimum Maximum
Exports 2,154 0.014 0.05 0 1.3
Imports 2,330 0.041 0.11 0 2.5
GDP Partner Country 2,330 0.267 0.94 0.0001 13.2
GDP Jordan 2,330 0.007 0.003 0.004 0.014
JEUAA 2,330 0.021 0.10 0 0.71
JUSFTA (Exports) 2,330 0.001 0.03 0 1
JUSFTA (Imports) 2,330 0.002 0.04 0 0.95
EFTA 2,330 0.007 0.08 0 1
GAFTA 2,330 0.024 0.13 0 1
Singapore-FTA 2,330 0.002 0.04 0 1
WTO 2,330 0.274 0.40 0 0.89
06-035(466-486).indd 486 2012-11-05 오후 4:23:41