abstract document: in situ activity of nac11-7
TRANSCRIPT

ABSTRACT
Title of Document: IN SITU ACTIVITY OF NAC11-7 ROSEOBACTERS IN COASTAL WATERS OFF THE CHESAPEAKE BAY BASED ON FTSZ EXPRESSION
Daohong Yao, Master of Science, 2009 Directed By: Dr. Marcelino T. Suzuki
Marine Estuarine Environmental Science Phylogenetic analysis of sequences of the cell division gene ftsZ retrieved from the
Atlantic coast revealed an interesting subgroup NAC11-7, which was targeted by a
specifically designed and optimized Taqman assay in diel samples collected in situ and in
parallel on-deck incubations. Rapid changes of ftsZ gene copies and the patchy
distribution of other phylotypes at different time points suggested that different NAC11-7
populations were sampled. Strong correlations between ftsZ expression and gene
abundance (r-squared=0.62), and between ftsZ expression and water temperature (r-
squared=0.73) for in situ samples suggested non-synchronous growth of NAC11-7 group.
Contrastingly, a sharp 9:00 AM peak of ftsZ expression in the on deck incubation
experiment suggested synchronous growth. We propose a possible mixed model in which
a certain fraction of the population is synchronously dividing, while a background of
asynchronously dividing NAC11-7 cells also exist, some of which are expressing ftsZ at
any given time.

IN SITU ACTIVITY OF NAC11-7 ROSEOBACTERS IN COASTAL WATERS OFF THE CHESAPEAKE BAY BASED ON FTSZ EXPRESSION
By
Daohong Yao
Thesis submitted to the Faculty of the Graduate School of the University of Maryland, College Park, in partial fulfillment
of the requirements for the degree of Masters of Science
2009 Advisory Committee: Assistant Professor Marcelino T. Suzuki, Chair Assistant Professor Byron Crump Professor Diane K. Stoecker

© Copyright by Daohong Yao
2009

ii
Acknowledgements
I would like to take this opportunity to express my deep gratitude to my advisor, Dr.
Marcelino Suzuki, for providing me this precious opportunity to study and work at his
laboratory at CBL. He is a brilliant and enthusiastic scientist who patiently taught me
laboratory techniques and more importantly, guided me in the right direction of research.
He was always available when I needed his guidance through my research or even in my
life. He always offered his countless efforts and dedication. Thank you, Dr. Suzuki, for
all that you have done for me and wish you the best of everything in the future. I would
like to thank my other committee members, Dr. Diane Stoecker, Dr. Byron Crump, and
Dr. Feng Chen, for their great help and valuable advice in my research and thesis writing.
I want to specially thank Dr. Diane Stoecker for agreeing to be my thesis defense
committee member when Dr. Feng Chen could not make it due to time conflicts.
I would like to thank Karen Norton and Jack Norton who are my neighbors but also more
like parents to me. I’m deeply grateful for everything they did for me, such as teaching
me to drive, introducing American culture to me, giving me advices, and inviting me to
family parties. I feel so lucky to know them and enjoy every moment with them. I am
very grateful to Joan Caruthers for inviting me to her house during lonely weekends and
celebrating Chinese New Year for me. I would also like to thank every friend at CBL,
George G. Waldbusser, Maude Livings, Ryan Woodland, Deanna Hanks, Karen A.
Taylor, Tammy Newcomer, Travis Burrel, Kari Fenske, Janis and Denis King, Carys

iii
Mitchelmore, Elaine Proctor, Gail D. Canaday, only to name a few. Thank you for
making my life easier and happier here at Solomons and give my best wishes to you all.
Finally, I am especially grateful to my parents, my aunt, my sister, and my brothers for
their endless love, support and encouragement. Last, my most sincere thanks go to my
beloved husband, Yongle. Without you, I would not have been able to accomplish this
achievement, and to you I do not only offer my thanks but my love.

iv
Table of Contents Acknowledgements............................................................................................................. ii
Table of Contents............................................................................................................... iv
List of Figures .................................................................................................................... vi
Title of Thesis ..................................................................................................................... 1
Abstract ............................................................................................................................... 2
Chapter 1: Introduction ....................................................................................................... 3
Measurement of bacterioplankton growth rate ............................................................... 3
Cell division gene ftsZ.................................................................................................... 5
The Roseobacter group ................................................................................................... 5
Quantification of gene expression .................................................................................. 6
Real time PCR................................................................................................................. 8
Chapter 2: Materials and Methods.................................................................................... 11
Sampling ....................................................................................................................... 11
Nucleic acid extraction and quantification ................................................................... 13
Construction of ftsZ DNA PCR clone library............................................................... 15
Real Time PCR Assays................................................................................................. 18
Design ....................................................................................................................... 18
Optimization: ............................................................................................................ 19
Primer concentration................................................................................................. 19
Optimized Real Time PCR assays ............................................................................ 20
Optimization of Reverse Transcription......................................................................... 21
v
ARISA (Automated rRNA intergenic spacer analysis) ................................................ 22
Chapter 3: Results ............................................................................................................. 24
Clone library and Phylogeny of Rhodobacterales ftsZs ............................................... 24
Real time PCR and RT-PCR assays for NAC11-7 ftsZ................................................ 26
Diel expression of NAC11-7 ftsZ genes: in situ........................................................... 29
ARISA results ............................................................................................................... 32
Diel expression of NAC11-7 ftsZ gene: on board incubations..................................... 34
Chapter 4: Discussion ....................................................................................................... 36
Chapter 5: Conclusions ..................................................................................................... 43
Bibliography ..................................................................................................................... 46
vi
List of Figures
Fig.1. Map showing the Southern section of the Chesapeake Bay and the study sampling
site RM6.
Fig.2. Bayesian phylogenetic tree of FtsZ protein sequences from the Rhodobacterales
group reconstructed using MrBayes v3.1. FtsZ sequences retrieved in this study are
marked in boldface and labeled as “clone ftsZ05xx”, where xx represents the clone
position in 96-well plate. The numbers within the parentheses indicate the FtsZ sequences
retrieved from our study. The numbers on nodes represent branch confidence values.
Fig.3. NAC11-7 group: A. FtsZ amino acid sequences; B. ftsZ gene sequences.
Fig.4. ftsZ gene copy numbers (filled squares) and expression (estimated from the ratio of
ftsZ cDNA copies to gene copies; open circles) at station RM6 on September 3 and 4,
2005, and tidal heights at Ship Shoal Inlet (37° 13′N, 75° 48′W). Error bars represent the
standard deviation of triplicate samples. Pre-dawn and post-dusk sampling times are
represented by the grayed areas.
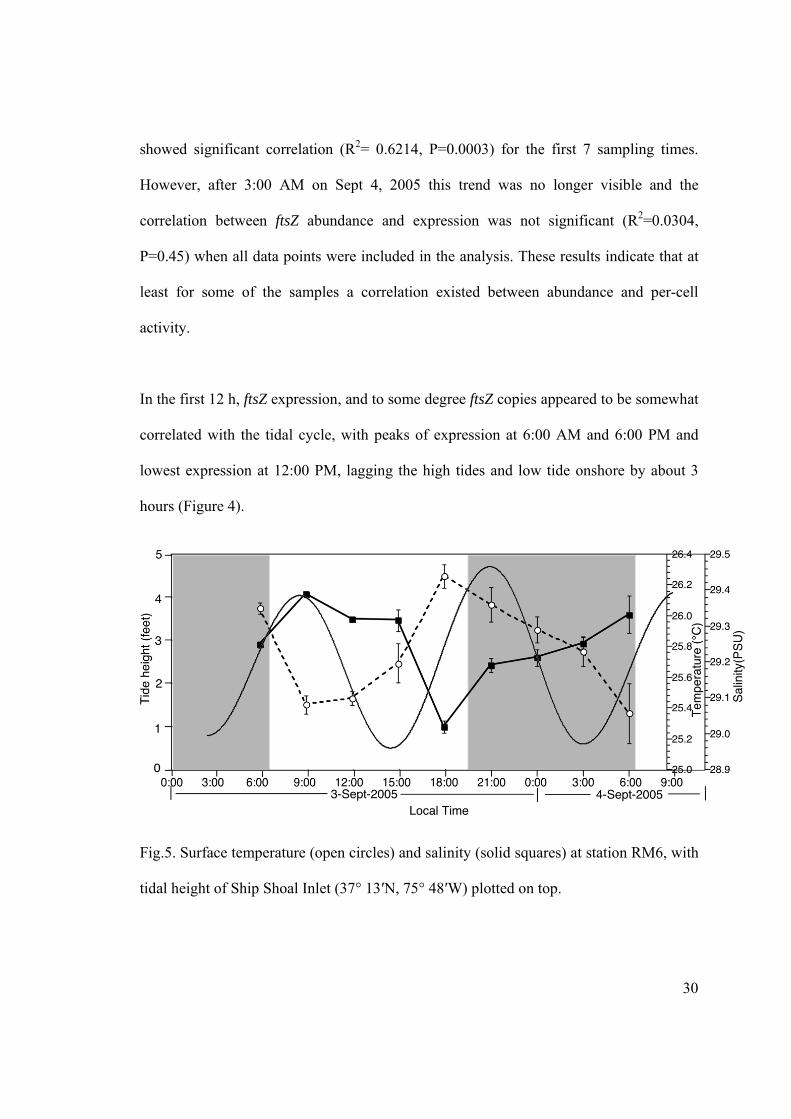
Fig.5. Surface temperature (open circles) and salinity (solid squares) at station RM6, with
overlayed tidal heights at Ship Shoal Inlet (37° 13′N, 75° 48′W).

vii
Fig.6. Temperature and Salinity plot, with overlayed ftsZ NAC11-7 expression
measurements at RM36. The ftsZ expression levels were in proportional to the area of
the circles.
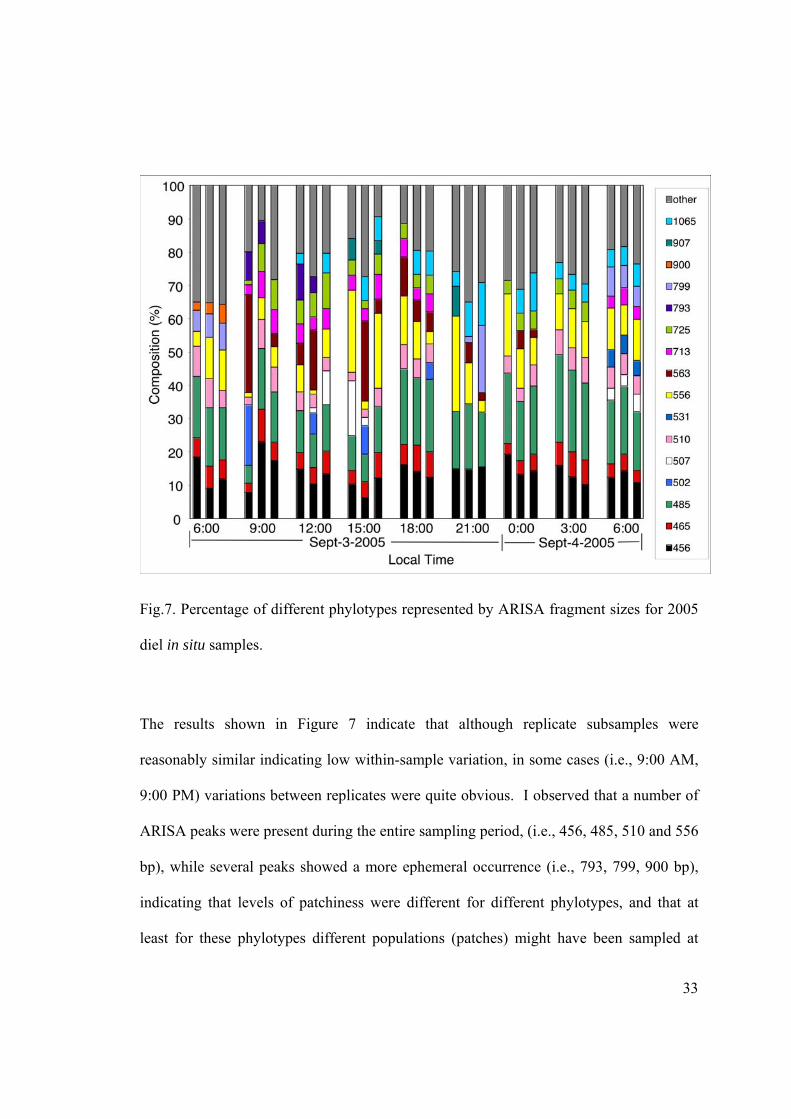
Fig.7. Percentage of different phylotypes represented by ARISA fragment sizes for in situ
samples.
Fig.8. ftsZ gene copy numbers (filled squares) and expression (estimated from the ratio of
ftsZ cDNA copies to gene copies; open circles) in samples collected at 6:00 AM on
09/03/2005 at station RM6 and incubated onboard. Error bars represent the standard
deviation of triplicate samples.

1
In situ Activity of NAC11-7 roseobacters in Coastal Waters off the
Chesapeake Bay based on ftsZ Expression

2
Abstract
Measurements of in situ growth rates of specific bacterioplankton groups are of critical
importance to the understanding of their contributions to the flow of energy and matter in
the Ocean. Quantification of in situ expression of cell division gene is a possible
approach towards these measurements. In order to test assumptions related to this
approach regarding synchronous growth, an ftsZ library was constructed using primers
targeting genes from Rhodobacterales and a phylogenetic analysis of ftsZ retrieved from
the coast off the Chesapeake Bay revealed genes belonging to the widespread NAC11-7
subgroup. This subgroup was targeted by a specifically designed and optimized real time
assay in diel samples collected in situ and in parallel on deck incubations. Rapid changes
of ftsZ gene copies and the patchy distribution of co-occurring phylotypes at different
time points suggested that different NAC11-7 populations were sampled in situ. Strong
correlations between ftsZ expression and gene abundance (r-squared=0.62), and between
ftsZ expression and water temperature (r-squared=0.73) for in situ samples suggested
non-synchronous growth of NAC11-7 group. Contrastingly, a sharp 9:00 AM peak of ftsZ
expression in the on deck incubation experiment suggested synchronous growth. We
propose a possible mixed model in which a certain fraction of the population is
synchronously dividing, while a background of asynchronously dividing NAC11-7 cells
also exist, some of which are expressing ftsZ at any given time.

3
Chapter 1: Introduction
Measurement of bacterioplankton growth rate
Marine bacterioplankton play an important role in microbial food webs and the cycling of
organic matter with global consequences (Azam, 1998; Wohlers et al., 2009). In recent
years the application of molecular and genomic techniques has provided us with vast
genomic and metagenomic datasets, greatly expanding our knowledge of
bacterioplankton phylogenetic diversity and their environmental distributions (for
reviews see Rappé and Giovannoni, 2003 and Delong, 2009). Despite this knowledge,
challenges still exist to the understanding of ecological functions to specific
bacterioplankton. Among these challenges is the current lack of measurements of in situ
growth rates of specific bacterioplankton ecotypes. This information is essential for the
understanding of the contributions of specific organisms to biogeochemical cycles critical
to ecosystem functions.
The most common approaches for determining growth rates of heterotrophic marine
bacterioplankton are indirect and rely on measurements of bacterial production. Growth
rates are calculated from bacterioplankton production, which are usually estimated from
the incorporation of 3H-thymidine or 3H-leucine (Fuhrman and Azam, 1982; Kirchman et
al., 1985; Simon and Azam, 1989), or non-radioactive bromodeoxyuridine (Steward and
Azam, 1999). These methods all regard the whole bacteria community as a “black box”

4
and measure the activity of the entire community. Therefore, they provide no information
on the production and growth rates of specific bacteria in the community. While the
combination of microautoradiography with fluorescence in situ hybridization (Micro-
FISH) allows the assessment of specific bacterioplankton activities at narrower
phylogenetic levels (i.e., Amann et al., 2001; Moter and Gobel, 2000; Cottrell and
Kirchman, 2003; Alonso and Pernthaler, 2005), these experiments still suffer from issues
inherent to confinement and based tracer studies (i.e., bottle effects).
A possible approach to measure in situ activity, and perhaps growth rates of specific
bacterioplankton, could involve the measurement of the expression (mRNAs) of genes
coding proteins involved in cell division. The idea behind such approach would be to
determine direct relationships between in situ production of these proteins and growth
rates of specific bacterioplankton, without additions or incubations. The rationale is
analogous to that of the measurement of the frequency of dividing cells (Hagstrom et al.,
1979), except that the measurement would be made at specific phylogenetic levels, and
earlier stages in the cell cycle, thus avoiding problems associated with preferential protist
grazing of dividing cells (Sherr and Sherr, 1992). Major assumptions of this type of
approach would be that growth is not synchronous in the targeted organisms, and that the
regulation of protein synthesis occurs at the transcriptional level.

5
Cell division gene ftsZ
Among proteins involved in bacterial cell division, FtsZ initiates cell division of most
prokaryotes by self-assembling into a membrane-associated Z-ring structure and by
recruiting other proteins to form the cell division septum (Margolin, 2005; Dajkovic and
Lutkenhaus, 2006; Osawa and Erickson, 2006). In synchronized population of
Caulobacter crescentus swarmer cells, the transcription of ftsZ gene is regulated by the
cell cycle and ftsZ is activated concurrently with the initiation of DNA replication during
the differentiation of swarmer cells into stalk cells, coordinated by global cell cycle
regulators CtrA and DnaA (Kelly et al., 1998; Laub et al., 2000; Laub et al., 2002; Hottes
et al., 2005). The expression of ftsZ genes was also found to be growth rate dependent in
Prochlorococcus populations in the Gulf of Aqaba, with the maximum expression at the
replication phase (S phase; Holtzendorff et al., 2001; Holtzendorff et al., 2002). These
authors concluded that transcriptional regulation of ftsZ might be responsible for the
synchronized cell division of Prochlorococcus populations. Finally, the sequence of FtsZ
protein is highly conserved in most bacteria and ftsZ gene phylogeny has good
congruence to 16S rRNA phylogeny (Vaughan et al., 2004), allowing putative
assignments of genes uncovered from the environment.
The Roseobacter group
The Roseobacter clade was chosen for our experiment due to the following reasons: first,
this lineage (Alpha-3 subdivision of Proteobacteria) is a ubiquitous and abundant group,
broadly distributing in all the major ecological niches of the ocean and constituting more

6
than 20% of the total bacterial community (Suzuki et al., 2001; Wagner-Dobler and Biel,
2006; Brinkoff et al., 2008). Second, of all the major marine lineages, Roseobacter clade
is one of the most easily cultured groups. Nearly one third of the known clade diversity
has cultured representatives (Buchan et al., 2005), making it one of the most accessible
and intensively studied groups. Third, members of Roseobacter (roseobacters herefter)
are physiologically heterogeneous, playing a significant role in the global carbon and
sulfur cycle and possibly influencing climate change. For instance, representatives of
Roseobacter are aerobic anoxygenic phototrophs (AAnP), preserving a considerable
amount of organic carbon by supplementing or substituting respiration with the light-
driven generation of ATP and reductants (Kolber et al., 2001; Yutin et al., 2007; Jiao et
al., 2007). In northeastern US coastal waters, members of the roseobacter-associated
clade (RAC) are the most active oxidizers of carbon monoxide - an indirect greenhouse
gas -and might contribute up to 15% of the total CO oxidation (Tolli et al., 2006) in
costal waters. Finally, roseobacters are actively involved in the degradation of dimethyl
sulfoniopropionate (DMSP), either cleaving DMSP to the climate relevant gas-DMS or
incorporating DMSP as carbon and sulfur source into food web (Kiene et al., 1999;
Moran et al., 2003; Vila et al., 2004; Malmstrom et al., 2004). As the availability of a
significant amount of genomic sequence information, studies of Roseobacter lineage are
of particular importance to the understanding of ecosystem functions.
Quantification of gene expression
The quantification of taxonomic or functional genes and their expressions have
increasingly been used to study microorganisms in natural environments (see review by

7
Sharkey et al., 2004), after the realization that 1) more than 99% of bacteria seen under
microscope are not cultivable using routine culture techniques (Kogure et al., 1979;
Kogure et al., 1980), that 2) some abundant microorganisms in biogeochemical processes
are only distantly related to or have no cultured representatives (Pace 1997; Rappé and
Giovannoni 2003), and that 3) the knowledge obtained from laboratory experiments does
not necessarily reflect microbial activities in situ. Gene expression measurements are
based on the assumption that once a functional gene is expressed, its transcripts will be
translated into a function protein. Therefore, understanding patterns of expression for
genes involved in specific ecological roles and functions is necessary to assure that these
genes are transcriptionally regulated and to understand the contribution of particular
organisms within different biogeochemical cycles.
mRNA levels have been broadly used as surrogate for gene expression levels (Fey et al.,
2004; Bird et al., 2005; John et al., 2007). However, due to the labile nature of RNA,
proper normalization is necessary to compensate for RNA losses during the process of
cell lysis, RNA isolation, DNA removal, and reverse transcription steps (Johnson et al.,
2005). Moreover, changes in total mRNA levels do not always reflect transcriptional
activity, as it might be caused by changes in cell numbers and consequently gene
abundance (Pichard and Paul, 1993; Wyman, 1999), which emphasizes the importance of
data normalization. In my study, I processed all the samples in parallel and assumed that
the loss rate in all the processes were proportionally the same (Shi 2004). Furthermore,
mRNA was normalized to the corresponding ftsZ gene concentration, accounting for
possible changes in mRNA levels due to variations in cell abundance.

8
Various methods have been used to quantify mRNA, including Fluorescence in situ
hybridization (FISH) (Wagner et al., 1998; Pernthaler and Amann, 2004), DNA
microarrays (Roth, 2002; Dennis et al., 2003, Sharkey et al., 2004), and reverse
transcription quantitative PCR (RT-Q-PCR) (i.e., Church et al., 2005; Bustin et al., 2005;
Smith and Osborn, 2009). Among these methods, RT-Q-PCR is one of the most
extensively used methods in environmental microbial ecology research due to its
sensitivity, specificity and simplicity. Q-PCR is especially suitable for environmental
samples that are in low abundance and therefore was used in this study. Compared to
traditional endpoint PCR, Q-PCR allows the quantification of gene (or transcript)
numbers at the early exponential phase when they are proportional to the starting
template amount, avoiding the inherent biases associated with the endpoint PCR due to
PCR plateau effects (Livak et al., 1995; Suzuki and Giovannoni, 1996).
Real time PCR
In Real time PCR (Q-PCR), the increase of amplicon numbers is recorded by the
detection of a fluorescent reporter that indicates accumulation of amplicons in every
cycle. Two common reporter systems are SYBR green and Taqman probes. SYBR green
binds to all double-stranded DNA and emits fluorescent signal. This method is easy to
operate and eliminates the complicated design of probes. However, the sensitivity and
specificity is sometimes affected by non-specific binding, such as to primer-dimers.
Therefore, extensive optimization is required before quantification and melting curve

9
analysis is necessary in every reaction to ensure the specificity (Sharkey et al., 2004;
Smith and Osborn, 2009). In contrast, Taqman assays utilize a sequence specific and
fluorescent-labeled probe to quantify only DNA or cDNA sequences that are
complimentary to be probe, which enhances specificity. The probe has a fluorescent
reporter at the 5’ end and a quencher molecule at the 3’ end. In an intact probe, the
reporter is prevented from fluorescing by the proximate quencher molecule through
fluorescent resonance energy transfer (Livak et al., 1995). During the annealing step in
every Q-PCR cycle, primers and intact probe bind to their target sequences. As the Taq
DNA polymerase elongates the primer strand along the template and approaches the
probe, its 5’ exonuclease activity will cleave the probe, which separates reporter dye and
quench dye, resulting increased fluorescence signal (Holland et al., 1991; Bustin, 2000;
Zhang and Fang, 2006).
In this article, I studied in situ expression of ftsZ genes of the NAC11-7 subclade of the
Roseobacter group. The NAC11-7 has putative roles in DMSP degradation (Zubkov et
al., 2001; Buchan et al., 2005) and the genome sequence of NAC11-7 suggests this
organism might in fact be an aerobic anoxygenic phototroph (i.e., it contains a pufM
gene). I followed the diel variation in ftsZ expression to determine whether evidence
exists for synchronicity in cell division. Gene expression was measured as the ratio of
ftsZ mRNA and ftsZ gene copies using quantitative real time PCR (Q-PCR) and reverse
transcription Q-PCR (RT-Q-PCR) in samples collected from a station in the Atlantic

10
coast of the USA near the mouth of Chesapeake Bay, as well as samples in parallel
incubation experiments.

11
Chapter 2: Materials and Methods
Sampling
Surface water samples were collected every 3 hours from 6:00 AM local time on
September 3 to 6:00 AM on September 4, 2005 at station RM6 (37°05.61N, 75°42.35 W)
aboard the RVs Cape Henlopen using a rosette of Niskin bottles. Temperature and
salinity profiles were taken simultaneously using a SBE 9CTD (Seabird, Bellevue, WA),
and tidal effects were estimated from the height of the tide at Ship Shoal Inlet calculated
using the data at http://tidesandcurrents.noaa.gov/. Triplicate 600 ml water subsamples
for RNA, DNA and cell counts were collected in polycarbonate bottles (Nalge Nunc
International Corp., Rochester, NY) at each sampling time. For each triplicate, 10 ml
water was fixed in a 15 ml tube containing 500 μl formalin. The remaining 590 ml water
was pre-filtered through GF/A filters (1.6 µm nominal pore; Whatman, Maidstone, UK).
90 ml of prefiltered water was filtered through 13 mm diameter 0.2 µm Supor200®
polysulfone filters (Pall Corp., East Hills, NY) and transferred to a tube containing 130 μl
lysis buffer. (2 mM NaEDTA (pH 8.0), 20 mM Tris•Cl (pH 8.0), 1.2% v/v Triton X100)
the remaining 500 ml of prefiltered water was filtered through 25 mm diameter 0.2 µm
Supor200® filters (Pall Gelman Inc.) and transferred to a screw cap tube containing 250
μl RNAlater (Ambion, Austin, TX). All samples were frozen at –20ºC aboard and stored
within a week at –70ºC until nucleic acid extraction.

12
Fig.1. Map showing the Southern section of the Chesapeake Bay and the study sampling
site RM6
Meanwhile, on-deck incubation experiments were conducted to control possible effects
of sampling different populations in situ. At the first sampling time (time zero, hereafter:

13
6:00 AM, 03 September, 2005), 15 liter of surface water was used to fill 27 x 500 ml
(600 ml total volume) clear polycarbonate bottles (Nalge Nunc), which were incubated in
an on-deck incubator. At the same times that in situ samples were taken, three of the
incubation bottles were taken and sampled for nucleic acids and cell counts as described
for cast samples.
Nucleic acid extraction and quantification
Total DNA was extracted from Supor200® 0.2 µm filters using the DNeasy 96 Tissue Kit
(Qiagen Inc., Valencia, CA) with modifications. Filters in tubes were thawed at room
temperature and 50 µl lysozyme (72 mg/ml) was added into each tube, which was
incubated for 1 hr at 37 ºC. Five µl of Rnase A (6 U/µl, Sigma) was added into each
tube, and incubated for 5 min at room temperature to digest RNA. 20 µl proteinase K
(Qiagen) were added into each tube, and the mixture incubated for 30 min at 70 ºC before
the entire contents were transferred into a 1.5 ml tube and 410 µl of this mixture of buffer
ALE was added into each of the 1.5 ml tubes, which were vortexed for 15 sec and the
entire volume was transferred into wells of a DNeasy 96 plate. The DNeasy 96 plate was
sealed with tape to prevent cross contamination and centrifuged in a Sorvall® Legend™ T
Centrifuge with a Highplate® rotor (Kendro lab, Osterode, Germany) at 5250 rpm for 10
min at room temperature. The columns were washed with AW1 and AW2 buffer
(Qiagen) at 5240 rpm for 5 min at room temperature following the DNeasy 96 kit
protocol. The DNeasy 96 plate was incubated at 70 ºC in an ISOtemp Incubator (Fisher
Scientific Inc., Pittsburgh, PA), for 15 min evaporate traces of ethanol. DNA was finally

14
eluted from each column with 200 µl TE buffer (pH 8.0, Ambion Inc., Austin, TX) by
centrifugation at 5250 rpm, for 2 min.
Total RNA was extracted from Supor200® 0.2 µm filters following an optimized protocol
adapted from the Qiagen RNeasy® 96 manual (Shi 2005). Filters in screw cap tubes were
thawed on the ice and 320 µl (measured by filling a thin wall 0.6 ml PCR tube) Low
Protein Binding Zirconium Oxide beads (200 Micron, OPS Diagnostics, Lebanon, NJ)
were added into each tube. ß-Mercaptoethanol was added in a 1:100 ratio to RLT buffer
(Qiagen) and 875 µl of the mixture was added to each of the screw cap tubes. The tubes
were beaten in a MM301 mixer mill (Retsch GmbH Inc., Haan, Germany) at maximum
speed (30.0 HZ) for 2 min and then incubated for 5 min at 70 ºC. 800 µl of the liquid
phase was transferred into a new low-RNA-binding 2 ml microcentrifuge tube (Ambion,
Inc.), avoiding transferring the beads. 800 µl 100% ethanol was added into each tube and
mixed well, resulting 1.6 ml crude lysate. 800 µl of this mixture was transferred into
wells of RNeasy 96 plate, which was sealed with airpore tape and centrifuged at 5000 rcf
for 5 min at room temperature. The remaining 800 µl of the crude lysate was added into
the corresponding wells of RNeasy 96 plate and the centrifugation repeated. The columns
were washed once with 800 µl RW1 buffer and twice with 800 µl RPE buffer at 5000 rcf
for 5 min at room temperature, with the last spin for 15 min. 35 µl Diethylpyrocarbonate
(DEPC) treated water (Ambion) were added into each column, followed by 1 min
incubation at room temperature and 5 min centrifugation at 5000 rcf. Another 35
microliter DEPC water was used to repeat this elution, resulting in c.a. 60 µl RNA
extracts. RNA was treated with deoxyribonuclease (DNase) I using the DNA-free™ kit
15
(Ambion) to remove co-extracted DNA before the downstream reverse transcription and
RNA quantification.
DNA and RNA concentrations were quantified fluorometrically by PicoGreen® staining
and RiboGreen® staining respectively (Molecular Probes, Invitrogen Corp., Carlsbad,
CA) on a Spectra MAX Gemini microplate spectrofluorometer (Molecular Devices,
Sunnyvale, CA). For DNA quantification, the DNA standard (provided with PicoGreen®
kit) was diluted in duplicate with TE buffer to generate a standard curve, ranging from
1000 pg/µl to 5.25 pg/µl and with a dilution factor of 0.35. RNA was quantified in a
similar way using the RiboGreen kit, except for the following: RNA standard was diluted
using DEPC treated water to generate the standard curve, ranging from 1000 pg/µl to
31.25 pg/µl and with a dilution factor of 0.5. Samples were diluted 1:100 using DEPC
treated water before their measurements. Standards and samples were quantified by
Ribogreen fluorescent dye on the same spectrofluorometer using the same software
module.
Construction of ftsZ DNA PCR clone library
An initial ftsZ database was developed using arb (Ludwig et al., 2004) by importing
DNA sequences listed by Vaughan et al 2004. 163 representative FtsZ sequences were
exported and used to retrieve additional ftsZ DNA sequences using blastp searches
against the March 2005 NCBI nt, env_nt and wgs databases. These sequences were
translated and the amino acid sequence aligned using clustalW (Thompson et al., 1994).
An amino acid-based (144 homologous position) bayesian tree containing 507 sequences

16
was constructed using MrBayes version 3.0 (Ronquist and Huelsenbeck, 2003) with the
following parameters: 800,000 generations, mixed models of amino acid substitution, and
a burnin of 6000 trees. In this initial tree the Alphaproteobacteria formed a
monophyletic clade with high confidence values and several orders including Rhizobiales
and Rhodobacterales also formed monophyletic clades. This database was continually
updated with public sequences belonging to the Rhodobacterales, and was used for the
design of PCR primers and probes.
Based on the sequences in this database, a preliminary clone library was constructed
using degenerate primers designed using CODEHOP (Rose et al., 2003) to target all
Alphaproteobacteria ftsZs: ftsZalphaF (5’-GCW GYN AAY CAN GAY GCN CA-3’)
and ftsZalphaR (5’-ACR TCN GCR AAR TCN ARR TT-3’). Preliminary results showed
that among 48 sequences, 21 were ftsZ sequences, all belonging to the SAR11 clade (i.e.,
closely related to the ftsZ from Pelagibacter ubique) and none of them to the Roseobacter
group. Therefore, our database was updated and I designed two degenerate primers
targeting ftsZ from Rhodobacterales more specifically. FtsZ amino acid sequences of
Rhodobacterales were exported and used to retrieve additional ftsZ DNA sequences using
blastp searches against the March 2007 NCBI nt database. I retrieved 111 ftsZ DNA
sequences that were imported to the existing ARB database and translated into amino
acid sequences, which were aligned using the alignment tool in ARB_EDIT, followed by
manual editing. In addition, the amino acid sequence of Rhodobacter sphaeroides was
blasted against the GOS ORF PEPTIDE DATABASE (http://camera.calit2.net/) with 500
maximum sequence hits. These sequences were then retrieved from the NCBI database.

17
Among these 500 amino acid sequences, 232 sequences not closely related to-Candidatus
Pelagibacter ubique were added into the ARB database and aligned. The 343 new FtsZ
amino acid sequences were added into the original bayesian tree using ARB_Parsimony.
Primers ftsZrb2F (5’-AAY GCN GTS AAY AAY AT-3’) and ftsZrb2R (5’-YTT NCC
CAT YTC RT-3’) were successfully designed and used to retrieve ftsZ gene sequences by
PCR and cloning from a subsample from 6:00 AM on September 6, 2005.
Approximate 1 µl of extracted genomic DNA was used as template in a 10 µl-volume
PCR reaction, which also included 10X PCR buffer, 0.2 mM of each dNTP, 3 mM
MgCl2, 500 nM Forward primer ftsZ2rbF, 500 nM Reverse primer ftsZ2rbR and 0.025
U/µl of Platinum® Taq DNA Polymerase (Invitrogen, Carlsbad, CA). Reactions were
performed on a GeneAmp 9700 PCR system (Applied Biosystems) and cycling
conditions were as follows: 2 min at 94 °C and 37 cycles of 30 sec at 94 °C, 30 sec at 55
°C and 2 min at 72 °C. The initial PCR was followed by a reconditioning PCR of 5 steps
as recommended by Thompson et al. (2002). All reconditioned PCR products were
loaded on a 1% modified TAE (40 mM Tris-acetate, pH 8.0, 0.1 mM Na2EDTA) agarose
gel and separated by electrophoresis. Target fragments were cut, recovered by
Ultrafree®-DA (Millipore) gel extraction and used to build an ftsZ gene clone library
using the TOPO™ TA cloning kit (Invitrogen) following the manufacturer’s instructions.
96 clones were bidirectionally sequenced using BigDye V3.1 chemistry and capillary
electrophoresis on an AB3100 genetic analyzer (Applied Biosystems Inc, Foster City,
CA). 73 sequences identified as ftsZ were imported into the ARB database described
above and added to the tree above using the ADD_BY_PARSIMONY tool.

18
A bayesian tree of all Rhodobacterales was constructed using Mr Bayes V3.1 (Ronquist
and Huelsenbeck, 2003). 188 homologous amino acid positions from 123 sequences were
exported and used in the phylogenetic analysis. Two parallel four chains of 2,000,000
generations were run with mixed models of amino acid substitution; trees were sampled
every 100 generations, and 11000 “burnin” trees were excluded to generate the consensus
tree. The average standard deviation of split frequencies was below 0.05 after 1,100,000
generations.
Real Time PCR Assays
Design
The primers and a Taqman probe were designed to target selected members of the
NAC11-7 group. Results of ftsZ cloning and sequencing indicated that based on amino
acid sequences five clone sequences were affiliated with the strain HTCC2255 ftsZ.
However the DNA sequence of one of these clones (F3) contained obviously higher
variation than the remainder of clones and HTCC 2255 (Figure 3). In accordance to the
ecotype concept (Cohan, 2001), it appeared that the distinct clone might belong to a
different ecotype, and was not subject to an assumed periodic selection event. In view of
this possibility, the primers and probe were designed to exclusively target the remaining
four sequences and HTCC 2255. The primer and the probe were manually designed with
aid of probe match functions in the arb_edit module of the ARB package. TM, secondary
19
structure and possible dimers were checked using Primer Express (Applied Biosystems)
and the Oligo Analyzer online tool (www.idtdna.com).
Optimization:
To test specificity of primers to the target sequences, 3 target clones and 15 non-target
clones were purified using QuickLyse Miniprep kit (Qiagen), and diluted to 107 ftsZ
copies/µl with nuclease-free TE buffer (Ambion). Ten microliter PCR reaction contained
5 µl TaqMan® Universal PCR Master Mix (Applied Biosystems), 0.5 µM Forward
primer ftsZrbA03-2qF (GTG AAA AAG CTA CTG AGG GTC T) and Reverse primer
ftsZrbA03-2qR (GCT TCC TGC CAG ATG ATC), and 1 µl plasmid template. The
cycling parameters were as follows: 2 min at 50 °C, 10 min at 95 °C and 30 cycles of 15
sec at 95 °C and 1min at 57 °C. All PCR products were loaded in a 2% NuSieve® (3:1)
Agarose Gel (Cambrex, Rockland, ME), electrophoresed, and post-stained with 1:10,000
SYBR® Gold (Invitrogen) for 30 min. The gel was visualized with a FluoroChem 8900
(Alpha Innotech, San Leandro, CA).
Primer concentration
In order to get the highest amplification efficiency in real time PCR, a primer
concentration matrix was performed. In each 25 µl reaction, the following reagent
concentrations were kept constant: 1X PCR buffer, 0.2 mM of dATP, dGTP and dCTP,
0.4 mM of dUTP, 5 mM MgCl2, 200 nM probe NAC11-7 (AAC
CAACAGTAGGAGCATTAGCCGCT), 1.2 µM SuperROX™ (Biosearch Technologies,
20
Novato, CA), 0.01 U/µl AmpErase® Uracil N-glycosylase (UNG) (Applied Biosystems),
0.025 U/µl of Platinum® Taq DNA Polymerase (Invitrogen), 2.5 µl NAC11-7 standard
(104 copies/µl) and a matrix of forward and reverse primer concentrations of 100 nM, 500
nM, 1000 nM, 1500 nM. Reactions were set in a MicroAmp® Optical 96-Well Reaction
Plate (Applied Biosystems), which was sealed with an optical adhesive cover (Applied
Biosystems) and ran in an ABI Prism 7000 Sequence Detection system, following the
cycling parameters: 2 min at 50 °C, 10 min at 95 °C and 40 cycles of 15 sec at 95 °C and
1 min at 57 °C. The primer combination yielding the lowest CT was used in all
subsequent measurements.
Optimized Real Time PCR assays
A plasmid containing cloned DNA that was purified and linearized as previously
described (Suzuki et al., 2000) was used to prepare standards for real time PCR for
quantification of ftsZ gene and mRNA. 2.5 µl of DNA extracts were used in 25 µl
reactions, containing 1X PCR buffer, 0.2 mM of dATP, dGTP and dCTP, 0.4 mM of
dUTP, 5 mM MgCl2, 1.5µM Forward Primer ftsZrbA03-2qF and 0.5 µM reverse primer
ftsZrbA03-2qR, 200 nM NAC11-7 probe, 1.2 µM SuperROX™ (Biosearch
Technologies, Novato, CA), 0.01 U/µl AmpErase® Uracil N-glycosylase (Applied
Biosystems), and 0.025 U/µl of Platinum® Taq DNA Polymerase (Invitrogen). Standards
ranged from 102 to 107 copies/µl and were run in duplicate along with non template
controls. All reactions were run on an ABI PRISM 7000 Sequence Detection System
(Applied Biosystems) with the following cycle parameters: 2 min at 50 °C, 10 min at 95
°C and 40 cycles of 15 sec at 95 °C and 1 min at 57 °C. ftsZ cDNA was quantified in the
same manner as ftsZ gene except that 5 µl of reverse transcription products were used as

21
template. All real time PCR measurements were calculated as copy numbers per volume
of seawater, assuming that nucleic acid extraction efficiencies were constant as shown in
Shi (2004). mRNAs copies were assumed to be the same as cDNA copies. Since DNA
and mRNA were measured in triplicate biological samples, ftsZ genes and mRNA copy
numbers that were >2X or <X/2 (X is the average of the remaining two replicates) were
treated as outliers and removed from the analyses.
Optimization of Reverse Transcription
I tested whether different starting amount of template in reverse transcription would
affect estimations of ftsZ cDNA copies/µl extracted RNA. Three different amounts (1 µl,
2 µl and 3 µl) of RNA extracted from a single sample were used to synthesize cDNA in
duplicate 10 µl RT reactions. Briefly, template and 10 pmol of the reverse primer
ftsZrbA03-2qR were heated to 65°C for 5 min and immediately chilled on ice, followed
by the addition of 5 X cDNA synthesis buffers, 5 mM DTT, 2 U/µl RNaseOUT™
Inhibitor (Invitrogen) and 0.75 U/µ of ThermoScript™ Reverse Transcriptase
(Invitrogen). Reactions were incubated at 52 °C for 55 min to synthesize cDNA and at 85
°C for 5 min to inactivate the transcriptase. 2.5 µl of these RT products were used in
subsequent 25 µl real time PCR reactions.
Since preliminary results indicated that low copy numbers of ftsZ cDNA were added to
Q-PCR reactions (lower than 100 copies/µl), I attempted to increase ftsZ cDNA copy
numbers using two strategies: (1). Increasing the reverse transcription efficiency, by
optimizing RT temperature and duration. (2). Adding increased amounts of cDNA
22
products in real-time PCR reactions. A 2.5 µl RNA sample from the in situ diel sampling
was used as template to synthesize cDNA in 10 µl reactions. Reactions were conducted at
two temperatures 52 °C and 55 °C and were run in triplicate using the NAC11-7 specific
primer ftsZrbA03-2qR and ThermoScript™ Reverse Transcriptase for 60 minutes.
Different RT incubation times (60 min, 90 min, and 120 min) were also tested and longer
incubation times did not produce higher yields of ftsZ cDNA (data not show).
Four microliter purified RNA was reverse transcribed to cDNA using ThermoScript™
Reverse Transcriptase. Template and 10 pmol of the NAC11-7 specific primer
ftsZrbA03-2qR were heated to 65 °C for 5 min and chilled on ice immediately, followed
by the addition of 5X cDNA synthesis buffer, 5 mM DTT, 2 U/µl RNaseOUT™ Inhibitor
(Invitrogen), 0.75 U/µ of reverse transcriptase and DEPC-treated water to a final volume
of 10 µl. Reactions were incubated at 55 °C for 60 min to synthesize cDNA and at 85 °C
for 5 min to inactivate the transcriptase. No-RT controls were performed for one of the
triplicate samples using the same method except substituting reverse transcriptase with
DEPC-treated water.
ARISA (Automated rRNA intergenic spacer analysis)
One microliter of environmental genomic DNA was used to perform a 10 µl ARISA
reactions, containing 1X PCR buffer, 1.2 mM MgCl2, 0.08 mM dNTPs (Promega Corp.,
Madison, WI), 0.5 µM primer 1406F-FAM (M. M. Fisher and E. W. Triplett, 1999), 1.5
µM primer 23S-Y (Dyda et al., 2009), and 0.01 U/µl of Platinum® Taq DNA Polymerase
(Invitrogen). Reactions were run on a GeneAmp 9700 (Applied Biosystems) under the
23
following conditions: Initial denaturation and enzyme activation at 94 ºC for 2 min,
followed by 35 cycles of 94 ºC for 30 sec, 55 ºC for 30 sec and 65 ºC for 2min. 1 µl of
each PCR reaction was mixed with 9 µl of 1:0.06 formamide and GS2500 size standard
(Applied Biosystems), denatured at 94 ºC for 2 min and separated by capillary
electrophoresis using an Applied Biosystems Genetic 3100 analyzer. Sizes of the
fragments were analyzed by the Peak Scanner™ Software v1.0 (Applied Biosystems).

24
Chapter 3: Results
Clone library and Phylogeny of Rhodobacterales ftsZs
Degenerate primers were designed based on Rhodobacterales FtsZ amino acid sequences
and retrieved gene sequences from a surface seawater sample of coastal Atlantic Ocean.
An ftsZ gene clone library was built using the TOPO™ TA cloning kit and clones
sequenced. Preliminary placement of sequences using blastx against the NCBI nr
database showed that sequences of 76 out of 93 clones were those of ftsZs. Among these
ftsZ sequences, 63 were associated with Rhodobacterales.

25
Fig.2. Bayesian phylogenetic tree of FtsZ protein sequences from the Rhodobacterales
group reconstructed using MrBayes v3.1. FtsZ sequences retrieved in this study are
marked in boldface and labeled as “clone ftsZ05xx”, where xx represents the clone
position in 96-well plate. The numbers within the parentheses indicate the FtsZ sequences
retrieved from our study. The numbers on nodes represent branch confidence values.
Diverse FtsZ amino acid sequences were retrieved in this study, as shown in the Bayesian
FtsZ phylogenetic tree (Figure 2). FtsZ sequences retrieved from our experiment

26
clustered into 5 groups within the Rhodobacterales. One interesting group was related to
strain HTCC 2255, which based on 16S rRNA phylogeny is a member of the NAC11-7
group (Buchan et al., 2005). The other four groups were unidentified and clustered with
sequences from the Global Ocean Survey (Rusch et al., 2007). Surprisingly, a yet
unidentified group (Group 2) contained 31 sequences, which represented more than 30%
of the library, suggesting that this prevalent clade might be an important roseobacter of
our sampling site.
Real time PCR and RT-PCR assays for NAC11-7 ftsZ
I developed a real-time PCR assay for ftsZ from a putative NAC11-7 ecotype. A primer
specificity test showed that all targeted clones were amplified and produced clear single
bands in an Agarose Gel (not shown), while no amplified bands were detected for 15
controls, including “clone ftsZ05F03”, which I assumed to belong to a different NAC11-
7 ecotype (Figure 3). In addition to primer-led specificity, a Taqman fluorogenic probe
was designed with no degeneracies to specifically target the selected NAC11-7 ecotype,
further ensuring the specificity of our assay. The combination of 1500 nM Forward
primer and 500 nM reverse primer showed the lowest CT and the highest amplification
efficiency in primer matrix experiments, and was used in all subsequent assays.

27

28
Fig.3. NAC11-7 group: A. FtsZ amino acid sequences; B. ftsZ gene sequences.
In order to test whether the efficiency of RT reactions was dependent of the starting
amount of mRNAs, cDNA copy numbers were compared between RT reactions where
increasing amounts of RNA were used as templates. A single factor ANOVA analysis
showed that there was no significant difference (P=0.172) between ftsZ cDNA copies per
µl extracted RNA, when 1, 2 and 3 µl of total extracted RNA were used in the RT
reactions. Incubation temperature in reverse transcription reactions significantly affected
the efficiency of reverse transcription and two-sample t-test (assuming equal variances)
analysis showed that the number of copies ftsZ cDNA synthesized from RTs at 55 °C was
significantly higher than that of 52 °C RTs. (P=0.0037). An inhibitory effect was
observed when larger amounts of reverse transcription (RT) products were used as
templates in real time PCR, seen as a decrease in the estimated copy numbers per
microliter in RT products with increased volume of RT products as templates. No
significant inhibition effect was observed when 5 µl and 2.5 µl RT products were used in
the real time PCR (two-sample t-test P=0.219), while there was significant inhibition
when 7 µl RT products were used in the real time PCR compared to 2.5 µl (two-sample t-
test P=0.0026). Therefore, ftsZ cDNAs were measured using 5 µl RT products as
templates.

29
Diel expression of NAC11-7 ftsZ genes: in situ
Fig.4. ftsZ gene copy numbers (filled squares) and expression (estimated from the ratio of
ftsZ cDNA copies to gene copies; open circles) at station RM6 on September 3 and 4,
2005, and tidal heights at Ship Shoal Inlet (37° 13′N, 75° 48′W). Error bars represent the
standard deviation of triplicate samples. Pre-dawn and post-dusk sampling times are
represented by the grayed areas.
FtsZ transcriptional activity was measured as the ratio of ftsZ mRNA concentration in the
seawater normalized to ftsZ gene concentration in the seawater (per gene normalization).
Gene copies, and more remarkably, gene expression showed rapid and sometimes large
(around four fold) changes with time (i.e., from 9:00 AM to 12:00 PM and from 6:00 PM
to 9:00 PM), suggesting that distinct populations (i.e., patches) were sampled at different
times as a result of water advection (Figure 4). Interestingly, except at the last two
sampling times, ftsZ expression followed closely the ftsZ gene abundance trends. A
regression analysis between ftsZ abundance and expression using individual replicates
30
showed significant correlation (R2= 0.6214, P=0.0003) for the first 7 sampling times.
However, after 3:00 AM on Sept 4, 2005 this trend was no longer visible and the
correlation between ftsZ abundance and expression was not significant (R2=0.0304,
P=0.45) when all data points were included in the analysis. These results indicate that at
least for some of the samples a correlation existed between abundance and per-cell
activity.
In the first 12 h, ftsZ expression, and to some degree ftsZ copies appeared to be somewhat
correlated with the tidal cycle, with peaks of expression at 6:00 AM and 6:00 PM and
lowest expression at 12:00 PM, lagging the high tides and low tide onshore by about 3
hours (Figure 4).
Fig.5. Surface temperature (open circles) and salinity (solid squares) at station RM6, with
tidal height of Ship Shoal Inlet (37° 13′N, 75° 48′W) plotted on top.

31
Temperature and salinity also showed fluctuations that loosely followed the tidal cycle
with a 3 h lag (Figure 5). For the first 12 h, surface temperatures were highest c.a. 3 h
before the high tide on shore and lowest before the low tide. After 6:00 PM a steady drop
in temperature and increase in salinity was observed. Overall the trends in salinity and
temperature suggest that our sampling site was likely influenced by tidal currents and that
different water masses with different communities and perhaps different NAC11-7
populations (or patches) were sampled (see ARISA results below).
In order to further examine the relationships between gene abundance and expression,
and water masses, I overlaid gene abundance and expression values onto temperature-
salinity (T-S) plots. These plots indicate a cyclical variation between warmer, less saline
waters and cooler, more saline waters. While, gene copies did not show clear trends in
the T-S plot (data not shown), ftsZ expression showed an interesting relationship where
with the exception of the 9:00 AM sample, samples below 25.8 °C showed significant
lower ftsZ expression (two-sample t-test P=0.003) than those above 25.8 °C (Figure 6).
A regression analysis excluding 9:00 AM measurements showed a significant correlation
(R2=0.725, P=0.007) between ftsZ expression and temperature. Samples at 9:00 AM
were excluded from this regression analysis after evidence for synchronous ftsZ
expression was observed in the on-deck incubated samples.

32
Fig.6. Temperature and Salinity plot, with ftsZ expression data of NAC11-7 group in
2005 Diel RM36 samples plotted on top. The ftsZ expression levels were in proportional
to the area of the circles.
ARISA results
Finally, in order to examine the dynamics of bacterioplankton communities and
populations at the different sampling times, these communities were examined using
automated ribosome intergenic spacer analysis (ARISA).
33
Fig.7. Percentage of different phylotypes represented by ARISA fragment sizes for 2005
diel in situ samples.
The results shown in Figure 7 indicate that although replicate subsamples were
reasonably similar indicating low within-sample variation, in some cases (i.e., 9:00 AM,
9:00 PM) variations between replicates were quite obvious. I observed that a number of
ARISA peaks were present during the entire sampling period, (i.e., 456, 485, 510 and 556
bp), while several peaks showed a more ephemeral occurrence (i.e., 793, 799, 900 bp),
indicating that levels of patchiness were different for different phylotypes, and that at
least for these phylotypes different populations (patches) might have been sampled at

34
different times. Unfortunately ARISA peaks corresponding to the NAC11-7 group were
not detected, as these organisms were likely present in numbers below the resolution of
ARISA.
Diel expression of NAC11-7 ftsZ gene: on board incubations
Fig.8. ftsZ gene copy numbers (filled squares) and expression (estimated from the ratio of
ftsZ cDNA copies to gene copies; open circles) in samples collected at 6:00 AM on
09/03/2005 at station RM6 and incubated onboard. Error bars represent the standard
deviation of triplicate samples at the same sampling time.
A parallel on-deck incubation experiment was conducted to control possible effects of
advection and sampling of different bacteria populations (patches). ftsZ gene and
transcripts in those incubated samples were quantified as for in situ samples and the
results are shown in Figure 8. ftsZ gene abundance dropped from 6:00 AM to 3:00 PM

35
and stabilized at c.a. 10000 copies/ml (a 2.5-fold decrease). Contrastingly, ftsZ expression
showed a very remarkable 4-fold increase in expression at 9:00 AM followed by a sharp
5-fold decrease at 12:00 PM. Considering that the measurements were made in three
separately incubated bottles and that CTs of the 9:00 AM cDNA samples were nearly two
units lower than those of the remaining samples, I am very confident that this observation
was not an experimental artifact.

36
Chapter 4: Discussion
In order to test assumptions related to the measurement of in situ growth rates of specific
roseobacters based on cell division genes, a Rhodobacterales ftsZ gene clone library was
built and phylogenetic analysis indicated sequences from two interesting subgroups were
retrieved: a prevalent, yet unidentified group (c.a. 30% of the library) and the NAC11-7.
Further analysis of the NAC11-7 sequences reveals that although all the sequences have
similar amino acid sequences, one sequence ftsZ5F03 was different at the DNA level
(Figure 3). Based on the ecotype theory (Cohan, 2001), the “clone ftsZ5F03” clone was
assumed to belong to a different ecotype, since it was not subjected to the theoretical
selective sweep assumed to have happened in the remaining 5 phylotypes. Clone “clone
ftsZ05F03” was therefore not targeted by our Q-PCR assay. Using this assay, ftsZ gene
and transcripts of NAC11-7 group were quantified in diel in situ and on-deck incubation
experiments.
It is important to emphasize that our measurements of expression are an average per cell
for the whole population. Thus, depending on how ftsZ is expressed during the cell cycle
in a single cell, the mRNA to gene ratio would in fact reflect: 1) the fraction of the
population that is transcribing ftsZ [i.e., if expression only happens in a short time span
during the cell cycle] 2) the average per cell expression level [i.e., ftsZ is constitutively
transcribed] or perhaps 3) a combination of both [i.e., ftsZ has a basal level of expression,
but transcription increases for a short span of time, related to cell division]. If

37
synchronous growth occurs in combination cases 1 or 3 above, one would observe peaks
in the average ftsZ expression, as a large proportion of the population would be
concurrently transcribing ftsZ in a short time span. In contrast, if case 2 above is true,
one would not expect peaks of ftsZ expression even in synchronous populations. Finally
even for synchronous populations, with time-constrained ftsZ expression, it is
conceivable that one would observe "basal" ftsZ transcription reflecting expression by the
non-synchronous fraction of the population. This last measurement would be in fact also
correlated to the whole population growth rates, assuming that synchronous and non-
synchronous cells are dividing at the same rates.
In the 2005 diel in situ experiment, several evidence indicate that different NAC11-7
populations (or patches) with different growth rates were likely sampled at different time
points. First, remarkable fluctuations of NAC11-7 gene copy numbers (nearly 4 fold in 3
hours) were observed in situ (Figure 4), implying changes in populations resulting from
advective processes. Second, ARISA analysis of the total bacterioplankton community
structure showed evidence for patchiness, as certain phylotypes were only detected in
specific time points (Figure 7). The fact that different subpopulations were sampled
complicated our interpretation of the data, and currently it is not completely clear whether
the cell division in NAC11-7 clade is or is not synchronous in situ.
During the first seven data points (6:00 AM, 9:00 AM, 12:00 PM, 3:00 PM, 6:00 PM,
9:00 PM, and 0:00 AM), a strong correlation (R2= 0.6214) was observed between
NAC11-7 gene abundance and in situ expression (inferred from ftsZ copies/ml and per
38
cell ftsZ expression), suggesting that more active populations yielded or were associated
with higher abundances of these organisms. This strong correlation also supports the case
for non-synchronous cell division since ftsZ expression was not constrained to specific
times. On the other hand, the correlation between abundance and expression was
reversed at the last two data points (3:00 AM and 6:00 AM), with high gene abundance
associated with low gene expression, indicating that some degree of temporal variation in
gene expression also occurs. Interestingly, the plot of gene expression data over a
Temperature-Salinity diagram showed that excluding 9:00 AM samples a high correlation
between water temperature and ftsZ expression.
In addition to the good correlations between ftsZ gene expression and gene copies, and
ftsZ gene expression and temperature, I found a remarkable peak of expression (not
associated with a gene copy increases) at 9:00 AM in the on-deck incubation experiment,
strongly suggesting that ftsZ expression (and by extension cell division) is synchronous in
this possibly photoheterotrophic NAC11-7 ecotype. The fact that the in situ sample from
9:00 AM deviated from the correlation between gene expression and temperature (Figure
6) also seem to support this hypothesis. Remarkably, although there is peak ftsZ
expression at 9:00 AM sample in the incubation experiment, expected increases of gene
copy number in the subsequent samples were not observed (Figure 8). The drop in gene
copy numbers from 6:00 AM sample to 3:00 PM sample suggest a large percentage of
NAC11-7 group might have been grazed or lysed. A possible explanation for the
disconnection between the increased ftsZ expression at 9:00 AM and lack of subsequent
increment in copy numbers in these bottles is that cells were already preconditioned to

39
expressing ftsZ before the start of the incubation, but did not proceed to the division
phase due to changes in conditions.
Prochlorococcus strains were found to grow synchronously in nature, tightly phased to
the light-dark cycle, with DNA replication in the late afternoon and cell division at night
(Vaulot et al., 1995; Liu et al., 1997, Partensky et al., 1999). An explanation for this
circadian growth of Prochlorococcus is that this division pattern might make efficient use
of daylight hours for carbon fixation via photosynthesis in order to prepare for cell
division during the night (Shalapyonok et al., 1998). Synchronized expression of ftsZ
gene has also been shown for Prochlorococcus spp. populations in the Red Sea, with
maximum expression within the DNA replication phase in the afternoon, and
transcriptional control of ftsZ was speculated to be a major factor triggering the
synchronized cell division of Prochlorococcus ( Holtzendorff et al., 2001; Holtzendorff
et al., 2002). If NAC11 ftsZ is expressed at a limited time span, as in Prochlorococcus
and Caulobacter crescentus (Kelly et al., 1998), the single peak expression of ftsZ
observed would indicate synchronous growth in NAC11-7. Ample evidence shows that at
least in the case of the alphaproteobacterium Caulobacter crescentus, ftsZ is expressed
during a limited period during the cell cycle (Quardokus et al., 1996; Sackett et al., 1998;
Martin and Brun, 2000; Brun, 2001). On the other hand, FtsZ protein concentration per
cell was also found to be constant regardless of growth rates in copiotrophic E.coli and
B.subtilis (Rueda et al., 2003; Weart and Levin, 2003; Haeusser and Levin, 2008).

40
Several arguments support constrained ftsZ expression in NAC11-7. As members of the
Alphaproteobacteria, these bacteria are more closely related to C. crescentus than to
E.coli or B. subtilis. In addition, the genome of HTCC2255 contains the gene coding for
CtrA, a two-component signaling protein that coordinates ftsZ expression and DNA
replication to ensure correct division in C. crescentus (Laub et al., 2000; Laub et al.,
2002; Quardokus and Brun, 2003; Skerker and Laub, 2004). Finally, it is difficult to
envision reasons NAC11-7, an organism adapted to somewhat oligotrophic conditions
would synthesize a constant amount of FtsZ proteins through the whole cell cycle unless
FtsZ has an alternative function in these organisms. Since members of NAC11-7 are
putatively AAnPs, the cell cycling of this group might be triggered by irradiance levels,
similar as in Prochlorococcus (Jacquet et al., 2001). Although light is a possible factor
regulating cell cycle in both NAC11-7 group and Prochlorococcus populations, there is a
difference in the time of peak ftsZ expression between Prochlorococcus (afternoon) and
NAC11-7 (morning). One possible reason would be differences in general metabolism
between phototrophs and photoheterotrophs. AAnP do not fix significant amounts of
inorganic carbon, using reduced organic carbon for anabolism. In addition,
Bacteriochlorophyll (BChla) of many AAnP is mainly synthesized at night-time (Yurkov
and Beatty, 1998). Therefore, it is probable that NAC11-7 synthesizes enough BChla at
night prior to cell division.
A way to reconcile the somewhat contrasting results from the in situ and incubation
experiments is a model in which a certain fraction of the population is synchronously
dividing and expresses ftsZ at 9:00 AM, while a background of asynchronously dividing
41
cells also exist, some of which are expressing ftsZ at any given time. This "background"
expression might in fact be better correlated to temperature or other parameters. The fact
that a certain level of ftsZ expression was measured throughout the diel cycle of
synchronously dividing Prochlorococcus populations (Holzendorf et al., 2001) seems to
support our model.
Although I have compelling evidence for synchronous growth, our sampling was limited
to a single diel sampling, and a single geographic location, and therefore it is obvious that
more studies are required to examine whether synchronized cell division occurs at some
later time in the day. I was unable to observe such spike in cell division in the incubated
bottles, since the population steadily decreased likely due to effects of confinement.
Future in situ studies should also include Lagrangian sampling (Mariano et al., 2002) to
minimize advective effects, and to ensure the measurement in more coherent populations.
To our knowledge this is the first indication that specific heterotrophic bacterioplankton
grow synchronously in the environment, and if proven true, this will have very important
implications for the study of bacterioplankton ecology, and raises interesting questions
for future research. For instance, as bacterioplankton production is in most cases
measured for the bulk community at short time incubations, and thus understanding
whether synchronized and unsynchronized cells in single populations, or synchronous
and non-synchronous species have the similar rate of cell division will be paramount to
the interpretation of these measurements. Since there is putative evidence that some
representatives of NAC11-7 are photoheterotrophic, understanding the relationships

42
between light-driven metabolism and synchronous growth in nature would also be of
interest.

43
Chapter 5: Conclusions
In conclusion, I quantified the in situ expression of cell division gene ftsZ of NAC11-7
group in diel experiments and tested whether synchronized growth exists in the
roseobacter group.
Specifically, two degenerate primers were designed successfully based on the existing
ftsZ gene database of Rhodobacterales and used to construct a PCR clone library from
one sample of coast Atlantic Ocean. 63 sequences were retrieved from the library and
used to build a Bayesian phylogenetic protein tree, the analysis of which revealed an
interesting group clustered with HTCC2255 (NAC11-7 group). A real time PCR
(Taqman) assay was specifically designed and optimized to quantify ftsZ gene and
transcripts of the NAC11-7 group in diel samples collected in situ and on deck parallel
incubations. Since NAC11-7 was not abundant in our samples, I enhanced the efficiency
of RT-Q-PCR (Reverse Transcription Quantitative Polymerase Chain Reaction) through
the optimization of template amount and incubation temperatures. Those optimized
procedures could be applied to other gene expression studies where the mRNAs of
interest are in low abundance. In addition, we normalized ftsZ mRNA abundance (copies
per volume seawater) to ftsZ gene abundance (copies per volume seawater) to account for
changes of NAC11-7 abundances, which are not unexpected in the samples from the
ocean.

44
From this study, we observed rapid changes of ftsZ gene copies which could not be
explained solely by biological factors such as grazing or cell division. Moreover, our
ARISA analysis of in situ samples showed patchy distribution of specific phylotypes at
different time points. Both those facts above suggest different subpopulations (patches) of
NAC11-7 group might have been sampled due to physical processes which complicated
the interpretation of my data. I could not determine with certainty whether the changes of
ftsZ expression was due to the change of transcription activity or the change of NAC11-7
populations. Therefore I suggest that a Lagrangian sampling scheme be used in future
experiments to minimize advective effects and monitor more coherent microbial
populations.
We found a strong correlation between ftsZ expression and gene abundance (r-
squared=0.62), and between ftsZ expression and water temperature (r-squared=0.73) for
in situ samples of NAC11-7 group. The fact that ftsZ expression was not confined to
narrow time periods and was related by temperature to some degree suggests the
existence of non-synchronous growth within NAC11-7 groups. However, we also found
evidence for synchronous growth of this group. For instance, a sharp 9:00 AM peak
expression of ftsZ gene was observed in the on-deck incubation diel samples and a
deviation of ftsZ expression and water temperature was also detected at 9:00 AM time
point sample in the in situ diel experiment. This is the first indication, to our knowledge,
that heterotrophic bacterioplankon might have synchronized growth and if proven true, it

45
will have significant consequences to microbial ecology research. For instance, growth
rates estimated from classic methods (tracer uptake) will probably be underestimates,
since the incubation might be taken when certain cells are not dividing and do not
synthesize DNA or protein. In order to confirm the existence of synchronized cell
division in heterotrophic bacterioplankton, experiments including several diel cycles and
at different geographic locations, and targeting specific bacterial cells should be
performed. Moreover, one could design experiments to test whether the 9:00 AM peak
expression of ftsZ in NAC11-7 incubated samples is caused by light (and not other bottle
effects) by incubating parallel samples in dark conditions or by starting experimental
setup from times other than 6:00 AM.
Finally, I propose a possible model, in which, a certain fraction of the NAC11-7
population is synchronously dividing, while a background of asynchronously dividing
NAC11-7 cells also exist, some of which are expressing ftsZ at any time. The coexistence
of two types of cell cycles within one closely related gene cluster or likely one ecotype
might result from the complexity of seawater habitats where heterotrophic bacterial
populations thrive. While a large proportion of the synchronized population might be
free living, some cells might deviate from this cycle due to responses of different
substrate conditions (i.e., in particles).
46
Bibliography
Alonso, C. and J. Pernthaler (2005). "Incorporation of glucose under anoxic conditions
by bacterioplankton from coastal North Sea surface waters." Appl. Environ. Microbiol. 71: 1709-1716.
Amann, R. I., W. Ludwig, and K. H. Schleifer (1995). "Phylogenetic identification and in situ detection of individual microbial cells without cultivation." Microbiol. Rev. 59:143–169.
Amann R, Fuchs BM, Behrens S (2001). "The identification of microorganisms by fluorescence in situ hybridization." Curr. Opin. Biotechnol. 12:231–236.
Azam, F. (1998). "Microbial control of oceanic carbon flux: the plot thickens." Science 280(5364): 694-696.
Bird, C., J. Martinez Martinez, A. G. O'Donnell, and M. Wyman. (2005). "Spatial distribution and transcriptional activity of an uncultured clade of planktonic diazotrophic {gamma}-proteobacteria in the Arabian Sea." Appl. Environ. Microbiol. 71:2079-2085.
Brinkhoff, T., H. A. Giebel, and M. Simon (2008). "Diversity, ecology, and genomics of the Roseobacter clade: a short overview." Arch. Microbiol. 189:531-539.
Brun, Y. V. (2001). "Global analysis of a bacterial cell cycle: tracking down necessary functions and their regulators." Trends Microbiol. 9(9): 405-407.
Buchan, A., J. M. Gonzalez and M. A. Moran (2005). "Overview of the marine Roseobacter lineage." Appl. Environ. Microbial. 71(10): 5665-5677.
Bustin SA. (2000). "Absolute quantification of mRNA using real-time reverse transcription polymerase chain reaction assays." J. Mol. Endocrinol. 25: 169–193.
Bustin, S. A., V. Benes, T. Nolan, and M. W. Pfaffl. (2005). "Quantitative real-time RT-PCR—a perspective." J. Mol. Endocrinol. 34:597-601.
Campbell, L. and E. J. Carpenter (1986). "Diel patterns of cell division in marine Synechococcus spp. (Cyanobacteria): use of the frequency of dividing cells technique to measure growth rate." Mar. Ecol. Prog. Ser. 32: 139-148.
Church, M. J., C. M. Short, B. D. Jenkins, D. M. Karl, and J. P. Zehr.(2005). "Temporal patterns of nitrogenase (nifH) gene expression in the oligotrophic North Pacific Ocean." Appl. Environ. Microbiol. 71:5362-5370.
Cohan, F. M. (2001). "Bacterial species and speciation." Syst. Biol. 50(4): 513-524. Cottrell, M. T. and D. L. Kirchman (2003). "Contribution of major bacterial groups to
bacterial biomass production (thymidine and leucine incorporation) in the Delaware estuary." Limnol. Oceanogr. 48: 168-178.
Dajkovic, A. and J. Lutkenhaus (2006). "Z ring as executor of bacterial cell division. ." J. Mol. Microbiol. Biotechnol. 11: 140-151.
Delong, E. F. (2009). "The microbial ocean from genomes to biomes." Nature 459: 200-206.
Dennis, P., E. A. Edwards, S. N. Liss, and R. Fulthorpe (2003). "Monitoring gene expression in mixed microbial communities by using DNA microarrays." Appl. Environ. Microbiol. 69:769-778.

47
Dyda, R.Y., Suzuki, M.T., Yoshinaga, M.Y. and Harvey, H.R. (2009). "The response of microbial communities to diverse organic matter sources in the Arctic Ocean." Deep-Sea Research II, this issue.
Fey, A., S. Eichler, S. Flavier, R. Christen, M. G. Höfle, and C. A. Guzman. (2004). "Establishment of a real-time PCR-based approach for accurate quantification of bacterial RNA targets in water, using Salmonella as a model organism." Appl. Environ. Microbiol. 70:3618-3623.
Fisher, M. M. and E. W. Triplett (1999). "Automated approach for ribosomal intergenic spacer analysis of microbial diversity and its application to freshwater bacterial communities." Appl. Environ. Microbial. 65(10): 4630-4636.
Fuhrman, J. A. and F. Azam (1982). "Thymidine incorporation as a measure of heterotrophic bacterioplankton production in marine surface waters: evaluation and field results. " Mar. Biol. 66(2): 109-120.
Haeusser, D. P. and P. A. Levin (2008). "The great divide: coordinating cell cycle events during bacterial growth and division." Curr. Opin. Microbiol. 11: 94-99.
Hagstrom, A., U. Larsson, P. Horstedt and S. Normark (1979). "Frequency of dividing cells, a new approach to the determination of bacterial growth rates in aquatic environments." Appl. Environ. Microbial. 37(5): 805-812.
Holland, P. M., R. D. Abramson, R. Watson, and D. H. Gelfand (1991). "Detection of specific polymerase chain reaction product by utilizing the 59339 exonuclease activity of Thermus aquaticus DNA polymerase." Proc.Natl. Acad. Sci. USA 88:7276–7280.
Holtzendorff, J., D. Marie, A. F. Post, F. Partensky, A. Rivlin and W. R. Hess (2002). "Synchronized expression of ftsZ in natural Prochlorococcus populations of the Red Sea." Environ. Microbiol. 4(11): 644-653.
Holtzendorff, J., F. Partensky, S. Jacquet, F. Bruyant, D. Marie, L. Garczarek, I. Mary, D. Vaulot and W. R. Hess (2001). "Diel Expression of Cell Cycle-Related Genes in Synchronized Cultures of Prochlorococcus sp. Strain PCC 9511." J. Bacteriol. 183(3): 915-920.
Hottes, A. K., L. Shapiro and H. H. McAdams (2005). "DnaA coordinates replication initiation and cell cycle transcription in Caulobacter crescentus." Mol. Microbiol. 58: 1340-1353.
Jacquet, S., F. Partensky, D. Marie, R. Casottii, and D. Vaulot (2001). "Cell cycle regulation by light in Prochlorococcus strains." Appl. Environ. Microbiol. 67(2): 782-790.
Jiao, N., Y. Zhang, Y. Zeng, N. Hong, R. Liu, F. Chen, and P. Wang.(2007). Distinct distribution pattern of abundance and diversity of aerobic anoxygenic phototrophic bacteria in the global ocean. Environ. Microbiol. 9:3091-3099.
John, D. E., Wang, Z. A., Liu, X., Byrne, R. H., Corredor, J. E., L´opez, J. M., Cabrera, A., Bronk, D., Tabita, F.R., and Paul, J. H. (2007). "Phytoplankton carbon fixation gene (RuBisCO) transcripts and air-sea CO2 flux in the Mississippi River Plume." The ISME Journal. 1:517–531.
Johnson, D. R., P. K. Lee, V. F. Holmes, and L. Alvarez-Cohen (2005). "An internal reference technique for accurately quantifying specific mRNAs by real-time PCR with application to the tceA reductive dehalogenase gene." Appl. Environ. Microbiol. 71:3866-3871.

48
Kelly, A. J., M. J. Sackett, N. Din, E. Quardokus and Y. V. Brun (1998). "Cell cycle-dependent transcriptional and proteolytic regulation of FtsZ in Caulobacter." Genes Dev. 12: 880-893.
Kiene, R. P., L. J. Linn, J. M. González, M. A. Moran, and J. A. Bruton (1999). Dimethylsulfoniopropionate and methanethiol are important precursors of methionine and protein-sulfur in marine bacterioplankton. Appl. Environ. Microbiol. 65:4549-4558.
Kirchman, D. L., E. K'Nees and R. Hodson (1985). "Leucine incorporation and its potential as a measure of protein synthesis by bacteria in natural aquatic systems." Appl. Environ. Microbial. 49(3): 599-607.
Kogure, K. U. Simidu and N. Taga (1979). "A tentative direct microscopic method for counting living marine bacteria." Can. J. Microbiol. 25(3): 415-420.
Kogure, K. U. Simidu and N. Taga (1980). "Distribution of viable marine bacteria in neritic seawater around Japan." Can. J. Microbiol. 26(3): 318-323.
Kolber, Z. S., F. G. Plumley, A. S. Lang, J. T. Beatty, R. E. Blankenship, C. L. Van Dover, C. Vetriani, M. Koblizek, C. Rathgeber, and P. G. Falkowski (2001). "Contribution of aerobic photoheterotrophic bacteria to the carbon cycle in the ocean." Science 292:2492-2495.
Laub, M. T., S. L. Chen, L. Shapiro and H. H. McAdams (2002). "Genes directly controlled by CtrA, a master regulator of the Caulobacter cell cycle." Proc. Natl. Acad. Sci. 99(7): 4632-4637.
Laub, M. T., H. H. McAdams, T. F. Feldblyum, Claire M and L. Shapiro (2000). "Global analysis of the genetic network controlling a bacterial cell cycle." Science 290: 2144-2148.
Liu, H., H. A. Nolla, and L. Campbell (1997). "Prochlorococcus growth rate and contribution to primary production in the equatorial and subtropical North Pacific Ocean." Aquat. Microb. Ecol. 12:39-47.
Livak, K., S. Flood, J. Marmaro, W. Giusti, and K. Deetz (1995). "Oligonucleotides with fluorescent dyes at opposite ends provide a quenched probe system for detecting PCR product and nucleic acid hybridization." PCR Methods Appl. 4:357-362.
Malmstrom, R. R., R. P. Kiene, and D. L. Kirchman (2004). Identification and enumeration of bacteria assimilating dimethylsulfoniopropionate (DMSP) in the North Atlantic and Gulf of Mexico. Limnol. Oceanogr. 49:597-606.
Margolin, W. (2005). "FtsZ and the division of prokaryotic cells and organelles." Nat. Rev. Mol. Cell Biol. 6: 862-871.
Mariano, A. J., A. Griffa, T. M. Ozgokmen and E. Zambianchi (2002). "Lagrangian analysis and predictability of coastal and ocean dynamics." J. Atmos. Oceanic. Technol. 19: 1114-1126.
Martin, M. E. and Y. V. Brun (2000). "Coordinating development with the cell cycle in Caulobacter." Curr. Opin. Microbiol. 3: 589-595.
Moran, M. A., J. M. González, and R. P. Kiene (2003). Linking a bacterial taxon to sulfur cycling in the sea: studies of the marine Roseobacter group. Geomicrobiol. J. 20:375-388.
Moter, A., and U. B. Gobel (2000). "Fluorescence in situ hybridization (FISH) for direct visualization of microorganisms." J. Microbiol. Methods 41:85-112.

49
Newell, S. Y. and R. R. Christian (1981). "Frequency of dividing cells as an estimator of bacterial productivity. ." Appl. Environ. Microbial. 42(1): 23-31.
Osawa, M. and H. P. Erickson (2006). "FtsZ from divergent foreign bacteria can function for cell division in Escherichia coli." J. Bacteriol. 188: 7132-7140.
Pace, N. R. (1997). "A molecular view of microbial diversity and the biosphere." Science 276:734-740.
Partensky, F., W. R. Hess, and D. Vaulot (1999). "Prochlorococcus, a marine photosynthetic prokaryote of global significance." Microbiol. Mol. Biol. Rev. 63:106-127.
Pernthaler, A and R. Amann (2004). " Simultaneous fluorescence in situ hybridization of mRNA and rRNA in environmental bacteria." Appl. Environ. Microbiol. 70(9):5426-5433.
Pichard, S. L., and J. H. Paul. (1993). "Gene expression per gene dose, a specific measure of gene expression in aquatic micro-organisms." Appl. Environ. Microbiol. 59:451-457.
Quardokus, E. M. and Y. V. Brun (2003). "Cell cycle timing and developmental checkpoints in Caulobacter crescentus." Curr. Opin. Microbiol. 6: 541-549.
Quardokus, E. M., N. Din and Y. V. Brun (1996). "Cell cycle regulation and cell type-specific localization of the FtsZ division initiation protein in Caulobacter." Proc. Natl. Acad. Sci. 93: 6314-6319.
Rappe, M. S. and S. J. Giovannoni (2003). "The uncultured microbial majority." Annu. Rev. Microbial. 57: 369-394.
Ronquist, F. and J. P. Huelsenbeck (2003). "MrBayes 3: Bayesian phylogenetic inference under mixed models." Bioinformatics. 19: 1572-1574.
Rose, T. M., J. G. Henikoff and S. Henikoff (2003). "Codehop (consensus-degenerate hybrid oligonucleotide primer ) PCR primer design." Nucleic Acids Res. 31:3763-3766.
Roth C. M.(2002). "Quantifying gene expression." Curr. Issues. Mol. Biol. 4:93–100 Rueda, S., M. Vicente and J. Mingorance (2003). "Concentration and assembly of the
division ring proteins FtsZ, FtsA, and ZipA during the Escherichia coli cell cycle." J. Bacteriol. 185(11): 3344-3351.
Rusch, D.B., A.L. Halpern, G. Sutton, K.B. Heidelberg, S. Williamson and S. Yooseph et al.(2007). " The Sorcerer II Global Ocean Sampling Expedition: Northwest Atlantic through Eastern Tropical Pacific." PLoS Biol. 5(3):0398-0431.
Sackett, M. J., A. J. Kelly and Y. V. Brun (1998). "Ordered expression of ftsQA and ftsZ during the Caulobacter crescentus cell cycle." Mol. Microbiol. 28(3): 421-434.
Shalapyonok, A., R. J. Olson, and L. S. Shalapyonok (1998). "Ultradian growth in Prochlorococcus spp." Appl. Environ. Microbiol. 64:1066-1069.
Sharkey FH, Banat IM, Marchant R (2004). " Detection and quantification of gene expression in environmental bacteriology".Appl Environ Microbiol 70:3795–3806
Simon, M. and F. Azam (1989). "Protein content and protein synthesis rates of planktonic marine bacteria." Mar. Ecol. Prog. 51: 201-213.
Smith, C. J. and A. M. Osborn (2009). " Advantages and limitations of quantitative PCR (Q-PCR) based approaches in microbial ecology." FEMS. Microbiol. Ecolo. 67(1): 6-20.

50
Skerker, J. M. and M. T. Laub (2004). "Cell-cycle progression and the generation of asymmetry in Caulobacter crescentus." Nat. Rev. Microbiol. 2: 325-337.
Steward, G. F. and F. Azam (1999). "Bromodeoxyuridine as an alternative to H-3-thymidine for measuring bacterial productivity in aquatic samples." Aquat. Microb. Ecol. 19: 57-66.
Suzuki, M., and S. J. Giovannoni (1996). "Bias caused by template annealing in the amplification mixtures of 16S rRNA genes by PCR." Appl. Environ. Microbiol. 62:625-630
Suzuki, M. T., C. M. Preston, O. Beja, J. R. de la Torre, G. F. Steward and E. F. Delong (2004). "Phylogenetic screening of ribosomal RNA gene-containing clones in Bacterial Artificial Chromosome (BAC) libraries from different depths in Monterey Bay." Microb. Ecol. 48(473-488).
Suzuki, M. T., O. Beja, L. T. Taylor and E. F. Delong (2001). "Phylogenetic analysis of ribosomal RNA operons from uncultivated coastal marine bacterioplankton." Environ. Microbiol. 3(5): 323-331.
Suzuki, M. T., L. T. Taylor and E. F. Delong (2000). "Quantitative analysis of small-subunit rRNA genes in mixed microbial populations via 5'-nuclease assays." Appl. Environ. Microbial. 66(11): 4605-4614.
Thompson, J. D., D. G. Higgins and T. J. Gibson (1994). "Clustal W: improving the sensitivity of progressive multiple sequence alignment through sequence weighting, position-specific gap penalties and weight matrix choice. " Nucleic Acids Res. 22(22): 4673-4680.
Tolli, J. D., S. M. Sievert and C. D. Taylor (2006). Unexpected diversity of bacteria capable of carbon monoxide oxidation in a coastal marine environment, and contribution of the Roseobacter-associated clade to total CO oxidation. Appl.Environ. Microbiol. 72: 1966–1973.
Vaughan, S., B. Wickstead, K. Gull and S. G. Addinall (2004). "Molecular evolution of FtsZ protein sequences encoded within the genomes of archaea, bacteria, and eukaryota." J. Mol. Evol. 58: 19-29.
Vaulot, D., D. Marie, R. J. Olson, and S. W. Chisholm (1995). "Growth of Prochlorococcus, a photosynthetic prokaryote, in the Equatorial Pacific Ocean." Science 268:1480-1482
Vila, M., R. Simó, R. P. Kiene, J. Pinhassi, J. M. González, M. A. Moran, and C. Pedrós-Alió (2004). Use of microautoradiography combined with fluorescence in situ hybridization to determine dimethylsulfoniopropionate incorporation by marine bacterioplankton taxa. Appl. Environ. Microbiol. 70:4648-4657.
Wagner-Döbler, I., and H. Biebl. 2006. "Environmental biology of the marine Roseobacter lineage." Annu. Rev. Microbiol. 60:255-280.
Wagner, M., M. Schmid, J. Stefan, K. H. Trebesius, A. Bubert, G. Werner and K. H. Schleifer. 1998. "In situ detection of a virulence factor mRNA and 16S rRNA in Listeria monocytogenes." FEMS. Microbiol. Lett. 160(1): 159-168. Weart, R. B. and P. A. Levin (2003). "Growth rate-dependent regulation of medial FtsZ ring formation." J. Bacteriol. 185(9): 2826-2834.
Werbrouck, H., N. Botteldoorn, M. Uyttendaele, L. Herman and E. Van Coillie (2007). "Quantification of gene expression of Listeria monocytogenes by real-time reverse

51
transcription PCR: Optimization, evaluation and pitfalls." J. Microbiol. Meth. 69: 306-314.
Wohlers, J., A. Engel, E. Zollner, P. Breithaupt, K. Jurgens, H. G. Hoppe, U. Sommer and U. Riebesell (2009). "Changes in biogenic carbon flow in response to sea surface warming." Proc. Natl. Acad. Sci. 106(17): 7067-7072.
Wyman, M. (1999). "Diel rhythms in ribulose-1,5-bisphosphate carboxylase/oxygenase and glutamine synthetase gene expression in a natural population of marine picoplanktonic cyanobacteria (Synechococcus spp.)." Appl. Environ. Microbiol. 65:3651-3659.
Yurkov, V. V., and J. T. Beatty (1998). "Aerobic anoxygenic phototrophic bacteria." Microbiol. Mol. Biol. Rev. 62:695-724.
Yutin, N., M. T. Suzuki, H. Teeling, M. Weber, J. C. Venter, D. B. Rusch, and O. Béjà. (2007). Assessing diversity and biogeography of aerobic anoxygenic phototrophic bacteria in surface waters of the Atlantic and Pacific Oceans using the Global Ocean Sampling expedition metagenomes. Environ. Microbiol. 9(6): 1464-1475.
Zhang, T., and H. P. Fang (2006). "Application of real-time polymerase chain reaction for quantification of microorganisms in environmental samples." Appl. Microbiol. Biotechnol. 70:281-289.
Zubkov, M. V., B. M. Fuchs, S. D. Archer, R. P. Kiene, R. Amann and P. H. Burkill (2001). "Linking the composition of bacterioplankton to rapid turnover of dissolved dimethylsulphoniopropionate in an algal bloom in the North Sea." Environ. Microbiol. 3(5): 304-311.