abstract document: family structure and income poverty
TRANSCRIPT

ABSTRACT
Title of Document: FAMILY STRUCTURE AND INCOME REDISTRIBUTION POLICIES: COMPARING CHILD POVERTY OUTCOMES IN CANADA, THE UNITED KINGDOM, AND THE UNITED STATES
Stephanie K. Grutzmacher, PhD in Family Studies, 2007
Directed By: Professor Elaine A. Anderson
Department of Family Studies
The United States has greater income inequality and higher child poverty than any
other industrialized, wealthy nation, which greatly impacts opportunities for American
children. Given that social and economic institutions are predicated on the breadwinner-
homemaker family structure as the ideal family, family formation and living
arrangements also appear to create disadvantages and high poverty risk for some
children. Government income redistribution policies have varied success in reducing
child poverty, especially among children living in vulnerable family structures. Cross-
national comparisons may provide useful information for improving the effectiveness of
antipoverty policies.
This study used data from Wave V of the Luxembourg Income Study to
comparatively analyze income redistribution and relative child poverty in various family
structures in nationally representative samples from Canada, the United Kingdom, and
the United States. Single mother, single father, two-parent, single grandmother, single
grandfather, and two-parent grandparent families with children under the age of 18 were
analyzed. Structural functional theory is used as a guiding conceptual framework.
Results indicate that income from government programs is differentially redistributed
across various family structures in all three countries, often with smaller child poverty

reductions among more vulnerable family structures. Single mother families have the
highest child poverty rates at each phase of income redistribution, while two-parent
families have the lowest rates. Children living in grandparent-headed families experience
the largest reductions in poverty through income redistribution. Children living in
households with young children have higher poverty rates at each phase of income
redistribution than children living in households with no young children, yet they
experience smaller reductions in poverty across all three countries. The United States has
the highest child poverty rates in all examined structures at each phase of income
redistribution, while the United Kingdom reduces child poverty by the largest proportion.
While income is redistributed differentially by family structure, the utilization of
structural characteristics for policy development is questioned. Policy implications for
improving child poverty reduction efforts in the United States through labor market
regulation, caregiving relief, and caregiving support are discussed.
FAMILY STRUCTURE AND INCOME REDISTRIBUTION POLICIES:
COMPARING CHILD POVERTY OUTCOMES IN CANADA, THE UNITED
KINGDOM, AND THE UNITED STATES
by
Stephanie Kristen Grutzmacher
Dissertation submitted in partial fulfillment of the requirements for the degree of
Doctor of Philosophy 2007
Advisory Committee: Professor Elaine A. Anderson, Chair Associate Professor Suzanne Randolph Assistant Professor Kevin M. Roy Professor Steven Selden Associate Professor Judith K. Hellerstein

©Copyright by
Stephanie Kristen Grutzmacher
2007

ii
Acknowledgements
I am grateful to the members of my committee and the staff at the Luxembourg
Income Study for their time, expertise, feedback, and support. First, I would like to
extend my deepest gratitude to Dr. Elaine Anderson, who shepherded me through this
process with immeasurable support and cheerleading. Elaine’s advising not only
supported my growth as a professional, but provided a role-model for mentoring
relationships that I will remember and hope to exemplify in my own career. Elaine has
been selfless and fully committed to my success, most evident in her willingness to read
many, many drafts on evenings and weekends.
Thank you to Dr. Suzanne Randolph, whose pertinent questions and honest
criticism I value. I also appreciate the contributions of Dr. Kevin Roy, who challenged
me to think harder about theory and the subjective experience of welfare receipt and child
poverty. Thank you to Dr. Steven Selden for his stirring course on inequality, his interest
in my work, and his contribution of an interdisciplinary perspective to this project. I
would like to express my thanks to Dr. Judith Hellerstein for her questions, criticisms,
and feedback, as well as her disciplinary perspective to strengthen this project.
I would like to extend my gratitude to Dr. Tim Smeeding for his numerous and
paramount examples of comparative research, commitment to improving child well-being
in the United States, and early guidance on this project. I am also very appreciative of
Dr. Janet Gornick for her suggestions and assistance in planning this analysis. Thank you
to Paul Alkemade and Emilia Niskanen for sharing their expertise and experience with
the LIS datasets. Their workshop training sessions and responses to my countless queries
guided me through the data analysis process.

iii
Table of Contents
Table of Contents...............................................................................................................iii List of Tables ......................................................................................................................v List of Figures ....................................................................................................................vi Chapter 1: Introduction .......................................................................................................1 Chapter 2: Review of Literature .........................................................................................8
Theoretical Framework...........................................................................................8 Conceptual Model ................................................................................................16 Conceptualizing and Measuring Poverty..............................................................17 Income Inequality, Child Poverty, and Family Structure.....................................18
Child Poverty ...........................................................................................18 Income Inequality.....................................................................................20 Family Structure.......................................................................................21 The Family Gap: Gender, Family Structure, and Child Poverty..............22 Family Structure and High Relative Poverty in the United States...........27
Reducing Inequality and Child Poverty through Social Policy............................28 Orientations towards Welfare Policy in Anglo-Saxon Nations ...............28 Income Redistribution Policies ................................................................31
Canada ..........................................................................................31 United Kingdom ...........................................................................33 United States .................................................................................35
Reducing Income Inequality and Poverty through Social Policy ............37 Antipoverty Effects for Working Parents. ....................................39 Antipoverty Effects for Single-Parent Families............................40 Antipoverty Effects for Two-Parent Families. .............................41
Antipoverty Effects for Children in Other Family Structures ......42 The Role of Spending in Poverty Reduction ................................42
Gaps to be Addressed ...........................................................................................44 Research Questions and Hypotheses ....................................................................44
Chapter 3: Methods...........................................................................................................46
Population Characteristics ....................................................................................46 Sample ..................................................................................................................46 Procedures ............................................................................................................47 Definitions ............................................................................................................48 Measures...............................................................................................................52 Independent Variables ..........................................................................................52 Dependent Variables.............................................................................................53 Data Analysis........................................................................................................54
Chapter 4: Results .............................................................................................................57 Demographic Characteristics ............................................................................................57

iv
Pre-Transfer Child Poverty Rates: Relationship between Family Structure and Pre-Transfer Child Poverty Rates ..................................................................59 Post-Transfer Child Poverty Rates: Relationship between Family Structure and Disposable Income.........................................................................................61 Poverty Reduction through Income Redistribution ..........................................................63
Total Child Poverty Reduction.............................................................................63 Child Poverty Reduction by Groups of Policies...................................................66
Households with Children Ages Five and Under .............................................................71 Summary of Findings........................................................................................................73 Chapter 5: Discussion .......................................................................................................75 Policy Implications ...........................................................................................................84 Demographic Solutions.........................................................................................85 Work-Based Solutions ..........................................................................................88 Policy Barriers and Needs in the United States ....................................................92 Limitations ........................................................................................................................97 Directions of Future Research ........................................................................................101 Conclusion ......................................................................................................................102 References.......................................................................................................................105

v
List of Tables
Table 1: Children Living in Various Income Households ................................................20 Table 2: Poverty Rates among Children by Family Type.................................................24 Table 3: Overview of Social Policies in Canada ..............................................................32 Table 4: Overview of Social Policies in the United Kingdom..........................................34 Table 5: Overview of Social Policies in the United States ...............................................36 Table 6: Reducing Poverty through Taxes, Transfers, and Social Assistance..................38 Table 7: Antipoverty Effects for Children Whose Parents Worked 1000+ Hours ...........40 Table 8: Summary of Research Questions and Hypotheses .............................................45 Table 9: Summary of Research Questions, Hypotheses, and Analytic Methods..............55 Table 10: Age of Youngest Child in Household...............................................................57 Table 11: Race/Ethnicity of Household Head ..................................................................58 Table 12: Children’s Family Structures............................................................................59 Table 13: Pre-Transfer Poverty Rates for Children in Various Family Structures...........59 Table 14: Poverty Rates among Children in Various Family Structures..........................61 Table 15: Percent of Poverty Reduced among Children in Various Family Structures ...64 Table 16: Child Poverty Reduction via Income Redistribution in Canada, the United
Kingdom, and the United States ........................................................................67 Table 17: Child Poverty Reduction in Households with and without Children Ages Five and Under..................................................................................................72 Table 18: Summary of Research Questions, Hypotheses, and Results.............................74

vi
List of Figures
Figure 1. Conceptual Model for Predicting Child Poverty Rates ..................................... 16

1
Chapter One: Introduction
Children under the age of 18 are largely dependent upon parents, other adults, and
the societies in which they live for their basic health, educational, material, and social
needs. Widespread and growing inequality among parents, and weak systems of income
redistribution, often leave children disproportionately at risk for being poor (Smeeding,
2004). Poverty is widely conceptualized in industrialized countries as a condition of
limited material, cultural, and social resources that exclude children from a minimum
acceptable lifestyle in the society in which they live (Adamson, Micklewright, & Wright,
2000). Children who live in households in which incomes fall below one half of the
median country income are typically classified as living in such conditions.
Child poverty is correlated with numerous and long-lasting negative outcomes for
children, including low educational attainment, poor physical health, and future poverty
status (Mayer, 2002). Given the wide range of incomes among families with children,
governments often supplement the cost of low-income children’s basic needs. Policies
that redistribute income from the citizen tax base to low-income families aim to
ameliorate the numerous negative outcomes associated with child poverty by ensuring a
minimum standard of material resources such as food, housing, and health care. While
the phenomenon of child poverty is not unique to any one country, countries vary greatly
in the level of child poverty tolerated (Smeeding, 2005).
In consideration of the variation in child poverty observed across countries, one
can conclude that some countries employ successful antipoverty policies, while others
have less positive outcomes reducing poverty through income redistribution. Cross-
national comparisons among nations may provide useful contributions in improving the

2
effectiveness of antipoverty policies. Due to shared histories, the government and
economic structures in the United States and Canada are very similar to those of the
United Kingdom. These three countries have similar populations, orientations toward
welfare, and income inequality (Esping-Anderson, 1990, 1999; LIS, 2006; Smeeding,
2004). Despite efforts to reduce child poverty, many children remain poor in each of
these countries. Child poverty, however, remains most prevalent in the United States, in
comparison to these other similar industrialized nations (Smeeding, Rainwater, &
Burtless, 2001). Therefore, to assess the effectiveness of antipoverty efforts targeted
towards different families with children in the United States, poverty and income
redistribution in Canada and the United Kingdom are comparatively examined.
The United States is among the wealthiest countries in the world, but also has
greater income inequality and more child, elder, and overall poverty than any other
industrialized, wealthy nation (Smeeding, 2000, 2004, 2005b). Even as income
inequality has increased over the last twenty years, the amount of income redistribution
through social policies remains minute (Kenworthy & Pontusson, 2005; Smeeding, 2004;
Smeeding et al. 2001). Divides between the wealthy and the poor greatly impact
opportunities for American children (Rainwater & Smeeding, 2003), especially those
living in families disproportionately likely to be poor. Further, family formation and
living arrangements also appear to create a disadvantage for American children. Children
living with single parents are substantially more likely to live in low-income households
than other children in the U.S. (United States Census Bureau, 2006b). Nearly 22% of
children in the United States live in households with incomes less than half of the median
country income, amounting to 14.8% of children in two-parent families and 49.3% of

3
children in single mother families (LIS, 2006). Although relative poverty data in
grandparent-headed families was not available prior to this study, using the federal
poverty line, 19% of American children living in grandparent-headed families are poor
(Simmons & Lawler Dye, 2003), and 63% of American children living with single
grandmothers are poor (Casper & Bryson, 1998).
Compared with the percentage of children living in families earning below 50%
of the median income in the United States (21.9%), only 14.9% of Canadian children live
in poverty (LIS, 2006). Most Canadians are engaged in the labor force and have
relatively high average earnings, yet Canada’s overall, single mother (40.7%), and two-
parent (10.9%) child poverty rates also exceed those of many other wealthy nations
(Heuveline & Weinshenker, 2006; LIS, 2006; Rainwater & Smeeding, 2003).
Additionally, the child poverty rates in the United Kingdom are 15.3% among all
children, 9.9% among children in two-parent families, and 33.8% among children in
single mother families (LIS, 2006). However, earnings and labor force participation
among single and partnered mothers are lower in the United Kingdom than in the United
States and Canada, with only 28% of low-income mothers in the United Kingdom
working, compared to 53% in Canada and the United States (Rainwater & Smeeding,
2003).
High pre-transfer inequality and unequal distribution of income among parents in
both single and two-parent households is related to high child poverty for Canada, the
United Kingdom, and the United States, relative to their Continental European and
Nordic counterparts (Rainwater & Smeeding, 2003). Economic institutions and policies
in Canada, the United Kingdom, and the United States are based upon the assumption

4
that children are best raised in the two-parent, married, male breadwinner family model
(Abrahamson & Wehner, 2006). Additionally, women and single parents face reduced
earnings capacity and labor force participation and the expense of child care, resulting in
the disproportionate representation of female-headed single parent families in the poverty
populations of Canada, the United Kingdom, and the United States. Comparatively, in
spite of the presence of only one adult to fulfill financial and child-rearing responsibilities
in male-headed single parent families, the gender wage gap and other resources afforded
to men typically position this family type in slightly better circumstances than female-
headed single parent families (LIS, 2005). Both of these single parent family structures,
however, fare much worse than two-parent households, with or without dual incomes
(LIS, 2005).
Child poverty among grandparent-headed families is less researched than poverty
in single mother and two-parent families. The number of grandparents raising their
grandchildren has substantially increased in the United States, however, due to increased
single parenting, teen pregnancy, incarceration, substance abuse, child abuse, and death
or disability (American Academic of Child and Adolescent Psychiatry, 2000; Casper &
Bryson, 1998; Fuller-Thompson & Minkler, 2000; Goodman & Silverstein, 2002;
Jendrick, 1994). Countries’ effectiveness in redistributing income to the elderly is likely
a factor in the poverty status of grandparent-headed families.
Government social policies have varied success in achieving the widespread goal
of reducing poverty, especially among children, and increasing economic opportunities
for low-income families (Smeeding, 2005b). The means and the extent to which
governments aim to redistribute income are strongly influenced by historical, political,

5
and economic characteristics. Those factors greatly influencing a nation’s collective
response to poverty include tax structures, the extent of economic and labor regulation,
attributions of responsibility for individuals’ employment status and income, government
versus private sector provisions for social services, characteristics of social protection
programs, and the commodification of goods and services (Rainwater & Smeeding,
2003).
Although many social policies are targeted towards families with children, in part
because they are at higher risk for experiencing poverty, it is unclear whether or not
policies are adequately targeted towards children living in more vulnerable family
structures to reduce disparities. Just as the functions and capacities of different family
structures vary, social policies may reduce poverty in each family structure differentially.
Evidence suggests that countries’ particular orientations towards poverty are associated
with the degree of income inequality and poverty among households (Smeeding, 2004),
but the relationships among social and redistributive policies, family structure, and
household-level child poverty need to be further examined. With additional knowledge
about the antipoverty effects of income redistribution packages for various family
structures in similar industrialized countries, the United States may be able to strengthen
its social policies to address the categorical strengths and needs of vulnerable family
structures. Bringing needed attention to growing disparities in the United States may be
the first step to improve policies that reduce the negative outcomes associated with child
poverty across family structures within the context of the American orientation towards
welfare.

6
Using data from the most recent wave of the Luxembourg Income Study (LIS)
(Wave V, 1999-2000), this study analyzes various types of social policies, including
universal transfers, taxes, means-tested transfers, and near-cash benefits and the extent to
which these policies are related to child poverty rates among three English-speaking
countries. Descriptive statistics are used to examine the poverty status of children in
various family structures in Canada, the United Kingdom, and the United States and to
analyze income redistribution resulting from various social policies and the economic
well-being of children living in single mother, single father, two-parent, single
grandmother, single grandfather, and two-parent grandparent family structures, as well as
families with children ages five and under. Using structural functional theory as a guide,
this study addresses the question: To what extent do social policies reduce child poverty
in various family structures in Canada, the United Kingdom, and the United States?
Gaps in knowledge addressed uniquely by this study include the examination of
child poverty and income redistribution among single father and grandparent-headed
families and families with young children. Additionally, the macroeconomic and
comparative approach provides a new perspective on child poverty and social policies in
the field of family science. Despite its obsoleteness, this study uses structural
functionalism as a theoretical lens to examine the role of structure in child poverty and
poverty alleviation, purporting that principles of structural functionalism are fundamental
to the formation and implementation of social welfare policies in the United States. This
perspective also underscores the problems associated with basing income redistribution
on family structure and the need to better understand the ways in which policies help
families perform their earning and childrearing functions. This comparative analysis of

7
social welfare policies in three similar countries may yield important information about
the success of each country’s policy approaches in reducing child poverty in the political
and economic context of the liberal welfare regime.
In this paper, research relevant to the role of social policies in reducing income
inequality and poverty are presented. Specifically, current literature on income
inequality, child poverty, and family structure is reviewed. A brief comparison of
existing social policies in the United States, Canada, and the United Kingdom is
presented. Previous findings on the extent to which social policies redistribute income
among various subpopulations are shared. Methods for addressing the research questions
and hypotheses are outlined. Results addressing child poverty in Canada, the United
Kingdom, and the United States are presented. Finally, a discussion of the findings,
including the limitations of the study and policy implications, is included.

8
Chapter Two: Review of Literature
This chapter presents a review of literature on child poverty, income inequality,
and family structure. A theoretical framework and conceptual model for the relationship
among family structure, country social benefits packages, and child poverty are
presented. Income redistribution in Canada, the United Kingdom, and the United States
and their relative effectiveness in reducing poverty among various risk groups are
reviewed. The gaps in knowledge, as well as research questions and hypotheses are
presented.
Theoretical Framework
This research is guided by elements of structural functional theory, which
suggests that the structure and functions of a family unit are intricately connected
(Winton, 1995). One of the most prominent structural functional theorists, Talcott
Parsons, discussed the ways in which the roles fulfilled by individual members of a
society complement each other in order to fulfill the necessary functions of that society
(1961). These roles are defined by norms, values, and expectations within the society
(Parsons, 1951). Widely accepted roles are institutionalized into economic, educational,
political, and family structures, which help to fulfill functional needs. In order to
maintain a society, people fulfill roles that achieve key functions, such as having,
socializing, and educating children, producing and consuming goods and services, and
maintaining order and harmony (Winch, 1963). Parsons posited that a society in which
individuals are acting in their expected roles, and thus performing necessary functions, is
in a desired state of balance and equilibrium (1961, 1965). Children are socialized into
the society’s roles and functions by being rewarded for desirable behaviors and punished

9
for undesirable behaviors. Societies that do not engage in such socialization can expect
that their values may not be transferred to future generations.
Even though structural functionalism experienced prominence in family and
sociological research for decades, it is nearly obsolete in recent family research
(Kingsbury & Scanzoni, 1993). This is partly due to the inability of the theory to explain
change as a normative occurrence in societies, its political and social conservatism, and
its perceived inability to address contemporary sociological issues (Coleman, 1990;
Holman & Burr, 1980; Kinsgbury & Scanzoni, 1993). Yet, many of the central
assumptions of structural functionalism are omnipresent in family research and in policy.
As Kingsbury and Scanzoni (1993, p. 205) suggest, “On one side [of the family
literature], stands the family- the normatively legitimized social system uniquely fitted to
benefit society. On the other side stand “alternative” or “other” lifestyles- documented
behavioral variations that may have dysfunctions for children and society.” Deeply rooted
assumptions about the family characteristics that are “best” for children and society likely
influence family research and family policy, even when structural functional theory and
language are not explicitly addressed. Current perspectives on family issues emphasize
function over form, but the basic idea that one family structure is more desirable,
functional, and normative is pervasive. Structural functionalism is used in this study to
inform the ways in which particular family structures are rewarded for normative
behavior. Specifically, it is used to explain the ways in which family structure results in
divergent economic outcomes for children at the family level. It does not imply,
however, that non-nuclear family structures be thought of as deviant, rather that social
and economic structures differentially reward nuclear families.

10
Structural functional theory suggests that income inequality, as it affects various
family structures, is attributable to the functions that particular structures are able to
fulfill. The primary functions of families are to socialize children to become adult
members of a society and to enable labor force participation (Ingoldsby, Smith, & Miller,
2004), although these two roles continue to be related to gender. The economic functions
of a family are fulfilled by dividing family responsibilities to each person in a couple
unit, which is thought to be achieved most efficiently through the breadwinner-
homemaker model. This “benchmark” family (Hofferth, 1985) features men working
outside of the home and providing instrumental support to the family and women caring
for children and providing expressive support to the family (Bales & Slater, 1955). Since
society’s basic ideas about family, and therefore its economic institutions and policies,
are built upon the breadwinner-homemaker model, being situated in such a family affords
children many privileges (Abrahamson, & Wehner, 2006; Ingoldsby et al., 2004). Being
situated outside of this normative and legitimized structure is often considered deviant
and dysfunctional for children and for society (Kingsbury & Scanzoni, 1993).
Family structure is related to both a family’s capacity to provide resources for
family members and a family’s risk for poverty. Single parent families are at greater risk
for poverty (LIS, 2005), while two-parent families may offer more protective resources
for family members. While families are largely dedicated to the well-being of children,
resource constraints greatly reduce the capacity of low-income families to ensure this
well-being. Two-parent families tend to have more choices in providing for children than
single-parent families. Both parents may work, increasing the household resources with
dual incomes, or one parent may work while the other is primarily responsible for

11
childrearing, sparing the household the expense of childcare. Because of these
possibilities, two-parent family structures may be more likely to provide necessary
resources and avoid poverty than single parent families (Dickman, 2003; Pressman, 2003;
Sigle-Rushton & Waldfogel, 2004; LIS, 2005). Recent data show that fewer married
mothers in the United States are employed than single mothers (U.S. Census Bureau,
2007), perhaps illustrating married mothers’ exercising the choice to disengage from the
labor force in order to raise children. Given that family structures strongly influence the
ability of families to provide resources for children (and that structures are less easily
changed), policies that aim to strengthen vulnerable structures’ capacity to provide
resources to children may be necessary to reduce child poverty.
While there have been large increases in non-nuclear structures over the last
several decades, these structures have hardly become desired or socially endorsed
(Thompson & Gongla, 1983; Thorton, 1989, as in Kingsbury & Scanzoni, 1993). Instead
of accepting single parenting as a permanent and normative family form capable of
performing the “functional equivalent” to two-parent families, the lack of social and
cultural rewards for being a single parent suggests that people perceive that the
“problem” of single parenting only ends with marriage (Kingsbury & Scanzoni, 1993).
Families headed by relatives, especially those headed by grandparents, are also a non-
normative structure without a normative legal and social template to perform their roles
as caregivers.
Single parent families are thought to be less desirable than two-parent, married
families, with single parent families receiving negative sanctions (e.g., stigma, research
about negative outcomes for children raised by single parents, reduced economic
12
opportunities, unalterable strains between work and family roles, high poverty) and few
cultural or social supports (e.g., U.S. marriage promotion policies discouraging single
parenting) (Administration for Children and Families, 2007; Aquilino, 1996; Bennett,
Bloom, & Miller, 1995; ChildTrends, 2002; Driscoll, Hearn, Evans, Moore, Sugland, &
Call, 1999; Duncan, Brooks-Gunn, & Klebanov, 1994; Fagan, Rector, Johnson, &
Peterson, 2002; Fagan, Rector, & Noyes, 2003; Hofferth, 1985; Lerman, 2002; Logan,
Moore, Manlove, Mincieli, & Cottingham, 2007; McLanahan & Sandefur, 1994; Moore,
Morrison, & Glei, 1995; Terry-Human, Manlove, & Moore, 2001). A structural
functional perspective posits that single parenting undermines the socialization of
children, given that children in single parent families do not receive the support,
resources, and involvement from one parent (Kingsbury & Scanzoni, 1993). For
example, the relatively high proportion of single parent families among black Americans
has been cited as a factor in economic and social problems disproportionately
experienced by blacks (e.g., Malone-Colon & Roberts, 2006; Parsons, 1965; U.S.
Department of Labor, 1965), shifting attention and policy priorities from structural and
social inequalities to individual behaviors and individual family structures.
As applied to comparative research, structural functionalism may explain why
different countries adopt various systems of welfare and social policy. According to
Dumon (1988), social policy in the United States is oriented towards helping individuals
overcome inadequacies (e.g., move into two-parent families), whereas social policy in
Europe is oriented towards just allocation of resources (e.g., reduce inequality). For
example, the welfare regime in the United States strongly encourages self-sufficiency,
independence, and work. The welfare structure is limited by these priorities, as is the role

13
of the welfare state in reducing poverty. Americans value individualism, capitalism, and
the “equality of opportunity” notion, all of which contribute to the United States’
orientation towards welfare and social policy. Based on such perspectives, the United
States’ mechanisms for addressing poverty have been shaped into a responsibility of
private institutions and are aimed at changing individual behaviors or deficits.
Politically and demographically similar to the United Kingdom and Canada, the
United State’s welfare system is rooted in English poor laws, which emphasized work
opportunities for the able-bodied and relief for those unable to work (Trattner, 1999).
The United States, however, has a unique history and distinct value of rugged
individualism that influence the country’s orientation towards social policy and poverty
alleviation. Canadian and British welfare programs are aimed at providing a slightly
larger safety net for those in poverty, while welfare policy in the United States since
welfare reform predominantly encourages work and independence from the government.
The extent to which engaging in work can reduce poverty depends heavily, however, on
family structure. Participation in the labor force is influenced by a number of factors,
such as gender, availability of childcare, work opportunities, and education. Single
parents may engage in the labor force differently than two-parent families due to time and
resource constraints, although among women, American single mothers are in the labor
force in larger proportions than married mothers (U.S. Census Bureau, 2007).
European social policies aimed at child poverty reduction are child-focused,
rather than structure-focused. For example, child allowances are universally distributed,
and structural characteristics are not used to determine income redistribution.
Conversely, welfare policies in the United States are heavily influenced by the idea that,

14
if a family’s structure can be changed, its risk for poverty will also be changed. Income
is redistributed differentially on the basis of structural characteristics, such as the number
of adults and children in a household, parental marital status, and the employment status
and earnings of these adults. Moreover, allowing the persistence of low market income,
limited income redistribution, and high child poverty functions as a negative sanction
against single parent families in response to their non-normative structures. Means-tested
programs, however, often provide single mothers incentives to avoid marriage, as higher
household earnings may cause families to lose their eligibility for some programs.
Both structural functional theory and Esping-Anderson’s theory of welfare
capitalism (1990) suggest that welfare states’ orientations towards poverty alleviation are
relatively stable and determined by historical, social, and political factors unique to each
cluster of countries. The structural forces of the labor market and welfare policies exert
influence over the responsibilities and capacities of families to provide for children. As
we do not expect children to engage in work and earn wages, governments must provide
social supports and benefits that adequately meet the basic needs of children if parents are
unable to do so. Given that employment itself is not protective of poverty, meeting the
basic needs of underemployed or unemployed families depends largely on adequate
public safety nets and programs. If public policies and programs support the basic needs
of low-income family structures that have reduced capacity to protect themselves from
poverty, such programs may help families perform their functions, reducing poverty and
increasing well-being among poor children.
Because the capacity to be economically self-sufficient is dependent upon the
ability to earn adequate wages, discussion of family structures and functions, and the

15
strengths and weaknesses of various structures are essential elements of poverty and
welfare policy research. Societal institutions afford benefits to desired family structures
and avoid rewarding non-normative structures. This explanation raises several questions
about the role of policy in reinforcing such norms: Should policies be predicated upon the
assumption that a particular structure leads to the most desirable outcomes for children?
Should policies aim to encourage the formation of particular types of families? Should
policies aim to reinforce the most desired family structures or should they correct
inequalities between normative and non-normative structures? Is a policy goal of
changing family structures more or less effective in strengthening child outcomes than a
goal of supporting families in performing their functions?
Given lower U.S. public expenditures and investment in basic needs for the poor,
in contrast to Canada, the United Kingdom, and many other industrialized countries, the
weakness of the safety net results in a relative disadvantage for American children
(Smeeding, 2005; 2005b). Children living in low-income families are more likely to
experience social exclusion, developmental delays, school performance problems,
reduced life chances, and other negative outcomes often associated with child poverty
(Duncan & Brooks-Gunn, 1997; Korenman & Miller, 1997; McLeod & Shanahan, 1997;
Moore & Redd, 2002; Pagani, Boulerice, & Tremblay, 1997; Smith, Brooks-Gunn, &
Klebanov, 1997). It is not known, however, if increasing the generosity of social
programs would improve child outcomes. The effectiveness of poverty reduction policies
in various family structures in other English-speaking nations provides the United States
with a tool for potentially strengthening its social policies to protect low-income children
living in all family structure types. Additionally, this analysis calls for researchers and

16
policymakers to critically examine the structural functional foundations of welfare and
child poverty.
Conceptual Model
Figure 1 depicts the relationships explored among family structure, countries’
social policy packages, income, and child poverty rates in various industrialized
countries: 1) the relationship between family structure and pre-transfer child poverty
rates, 2) the relationship between family structure and post-transfer child poverty rates, 3)
the relationship between family structure and the value of social policy benefits packages,
4) the relationship between social policy benefits packages and post-transfer child
poverty rates, and 5) the relationship among family structure, social policy benefits
packages, and post-transfer child poverty rates.
Figure 1. Model for predicting relative child poverty rates from social policy benefits packages in various family structures.
Country Social Policy Benefits Package:
Universal transfers, taxes, means-tested transfers,
near-cash social benefits
Family Structure: Single Mother Single Father Two-Parent Grandparent
Presence of Young Children
Total Equivalized Disposable Income: (Market income + social benefits – mandatory employee contributions – income tax)
÷ {0.5 + [.25*(number of persons-1)]} x number of household members under 18
Country Child Poverty Rate: The percentage of children who live in households with a total equivalized disposable income equal to
or less than 50% of the median country income
Market income: (Total earnings + cash
property income + public and private pensions)

17
Conceptualizing and Measuring Poverty
Although there are many ways to define poverty, poverty is conceptualized as a
condition of income deprivation for the purpose of this study. Based upon this
assumption, there are three ways in which income deprivation poverty could be
measured: in absolute terms, in relative terms, and in quasi-relative terms. Absolute
measures assume that there is a basic level of income needed to survive and that this
level, adjusted for inflation, is consistent over time. Any household with income below
an absolute threshold is considered poor, while any household with an income above the
threshold is considered not poor. The United States’ official measure of poverty is an
absolute measure, the threshold for which is determined by outdated assumptions about
the proportion of a family’s income spent on food, the costs of that food, and the
definition of income (Iceland, 2003).
Relative measures assume that poverty is contextualized in the standards of living
of a society, where comparative social and economic disadvantage, not a basic standard
of needs, determine who is poor. Relative measures of poverty, therefore, indirectly
measure inequality, or distance between a country’s lowest earners and highest earners.
The most common use of relative measures is setting a poverty threshold at one-half of
the median income (Iceland, 2003). In wealthy, industrialized countries, relative
measures are thought to be more meaningful than absolute measures, given the higher
standard of living (OECD, 2001). Relative measures, however, may be more susceptible
to fluctuations in conditions of economic growth or recession, which could
underrepresent hardship during economic downturns (National Research Council, 1995,
as in Iceland, 2003).

18
In the United States, the use of a relative measure to define poverty categorizes a
greater proportion of the population as poor than the official poverty threshold. Viewing
poverty in the United States in relative terms, thus, highlights a larger poverty problem
than that implied by the absolute measure. For example, 11.3% of Americans were
classified as poor in 2000 using the official poverty measure, whereas 21.1% of
Americans were classified as poor using a relative measure of 50% of the median income
in the same year (Dalaker, 2001). Quasi-relative measures combine principals from
absolute and relative measures, creating a poverty measure with both a minimum
standard and a relative reflection of standard of living.
For the purpose of comparative research, in which countries with different
currencies, standards of living, and economic conditions are viewed in relation to one
another, relative measures of poverty are most widely used. Additionally, relative
measures serve as a proxy measure for inequality, although a reduction in inequality does
not necessarily equate to a reduction in poverty. Relative measures of poverty are used in
this study.
Child Poverty, Income Inequality, and Family Structure
Child Poverty
As the most vulnerable members of households and countries alike, children
require many resources in order to have their basic health, safety, educational, and
psychosocial needs met. Often, parents with low incomes have difficulty meeting the
needs of children due to limited resources. Parents’ incomes are positively correlated
with many dimensions of child well-being, including health, behavior, education, and

19
future earnings, although these relationships are not necessarily causal in nature (Mayer,
2002).
Given the vast differences in opportunity among parents and their children,
governments are responsible for ensuring a minimum standard of resources in the form of
income redistribution or other social welfare. Reducing child poverty (rather than overall
poverty) is often a policy focus due to the perception that children are blameless for
poverty and that child poverty has serious societal implications for the future
(Micklewright, 2004). The goals of such policy and program efforts are to help alleviate
the numerous and serious outcomes associated with child poverty. The scope and
effectiveness of such efforts have significant consequences for the well-being of children.
Using the relative measure of 50% of median income, the United States has the
highest child, elderly, and overall poverty rates of the nineteen industrialized countries
included in the Luxembourg Income Study (LIS) in 2001 (Smeeding et al., 2001). The
United States has the largest proportion of children living in households earning less than
50 percent of the median income (21.9%), while Canada and the United Kingdom have
slightly smaller proportions of children represented in the poverty population at 14.9 and
15.3% respectively (see Table 1) (LIS, 2005). All three countries tolerate higher levels of
child poverty than most other wealthy industrialized countries, where relative child
poverty ranges from 2.8% in Finland to 17.2% in Ireland (LIS, 2006; Rainwater &
Smeeding, 2003; Smeeding, 2004).

20
Table 1. Children Living in Various Income Households Less than 50%
median 50-150% median More than 150%
median Canada 14.9 71.2 13.8 United Kingdom 15.3 67.7 17.0 United States 21.9 61.6 16.5 Source: Luxembourg Income Study Key Figures, accessed at www.lisproject.org/keyfigures.htm on October 24, 2006.
The use of child poverty rates, rather than poverty levels for households with
children, accurately reflects the number of children living in economic disadvantage.
Moreover, utilizing households as the unit of analysis to measure child well-being would
obscure the impact of larger family size among low-income families on poverty rates.
Income Inequality
Income inequality is defined by the spread of the distribution of a country’s
highest income levels and lowest income levels. Specifically, using quantile groups to
calculate shares of total income to a given proportion of units (e.g., quartiles, quintiles, or
deciles), percentile ratios show the relative distance between high (top quartile), median-
level (middle half), and low earners (bottom quartile) (Canberra Group on Household
Income Statistics, 2001). In countries with high income inequality, the distance between
high and low earners is greater than the distance between earners in countries with lower
levels of income inequality. Income inequality is determined by a complex combination
of economic conditions, national wealth, labor force participation and earning
opportunities, structural inequalities, and social policies.
The United States has the highest level of income inequality and has experienced
the greatest recent increases in income inequality among wealthy member countries of
the Organization for Economic Cooperation and Development (OECD) (Shapiro &
Greenstein, 2005; Smeeding, 2004). Among all 26 member countries of the OECD, the

21
United States has higher income inequality than all other countries except Poland,
Turkey, and Mexico (OECD, 2006). In addition to having the highest poverty rates, low-
income families in the U.S. have lower relative incomes than low-income families in the
other industrialized countries (Mayer, 1996). In 2000, low-income Americans in the
tenth percentile of the income distribution had an income that is 39% of the median
income, while Northern Europeans in the same percentile earned income at 57% of the
median income (Smeeding, 2004). Additionally, the tenth percentile for U.S. single
parent households with children is 21% of the median, the lowest in any OECD nation
(Smeeding, 2005; Wong, Garfinkel, & McLanahan, 1993).
The dramatic differences between income inequality in the United States and
other OECD countries can be attributed to many factors, including low wages at the
bottom of the U.S. income distribution and the lack of income supports for low-income
families (Iceland, 2003; Smeeding, 2004). Despite both low- and high-income U.S.
earners working many more hours than workers in other industrialized nations, it appears
that wage disparities and scant social welfare programs have resulted in significantly
higher poverty rates in the United States than in the comparison nations (Osberg, 2002;
Smeeding, 2004). In particular, there are noted differences in poverty rates between
single and two-parent family structures (Heuveline & Weinshenker, 2006).
Family Structure
Family structure refers to a combination of characteristics, such as the number of
adults in a household and the relationship between the adult(s) and the children. Children
live in households with various family structures, including two-parent, single mother,
single father, and grandparent-headed families. The United Kingdom has the highest
22
proportion of children living in single mother families (21.7%), followed by the United
States (19.5%). Canada has a relatively small proportion of children living in single
mother families (13.1%). The United States has the highest proportion of children living
in households not headed by an adoptive or biological parent such as grandparents
(10.0%), while the United Kingdom (6.7%) and Canada (3.3%) have smaller proportions
of children living in such households (LIS, 2006).
The Family Gap: Gender, Family Structure, and Child Poverty
Family structure is often a focus of income inequality and poverty research, as the
presence of children and the number of adults in a household are principal factors in
predicting low income. Particularly, single women with children are represented in the
poverty population more than any other household type (LIS, 2005). The “family gap”
refers to this difference in earnings between women with children and women without
children. The differences in women’s wages and earnings between women with and
women without children are well documented (Moller & Misra, 2005; Sigle-Rushton &
Waldfogel, 2004). A study by Sierminska (2004) suggests that the generosity of a
countries’ social benefit system account for the size of the family gap. While differences
are more pronounced among single women with and without children, couples that are
childless have much lower poverty rates than similarly situated couples with children
(Dickman, 2003; LIS, 2005).
Gender expectations, labor market institutions, and social policies influence the
economic position of women in various countries. Because women have historically
been relied upon for unpaid domestic and family work, women have been commodified
to a lesser extent than men, giving them less valuable opportunities in the workforce

23
(Orloff, 1993, as in Moller & Misra, 2005). Women, consequently, are at a
disproportionate risk to be poor, with other explanations for this feminization of poverty
including household structure, parenting, earning potential, and labor market participation
(Pressman, 2003).
At the intersection of gender, parenthood, and parenting alone are single mothers.
Children living in households headed by single mothers in most industrialized countries
experience poverty at disproportionately high rates (LIS, 2005). Single streams of
income, child care expenses, reduced labor force opportunities and engagement,
employment in the secondary labor force, reduced earnings, limited opportunities for job
advancement, and insubstantial work-family policies may heighten single mothers’ risk
for poverty. Single working mothers in the United States and the United Kingdom are
more likely to have low-wage, private sector jobs with little job security, whereas many
single working mothers in Nordic countries have better-paying, more secure jobs in the
social services and government sectors (Rainwater & Smeeding, 2003).
When comparing child poverty rates among children in single mother and two-
parent household structures, three times as many children in single mother families are
poor (LIS, 2005). Nearly half of children in single mother structures in the United States
live in households with earnings below 50% of the median income, while only 14.8% of
children in two-parent structures live in poverty. In comparison with Canada and the
United Kingdom, the United States’ child poverty rates across family types are only
slightly higher (See Table 2).

24
Table 2. Poverty Ratesa among Children by Family Type Year All
Children Two-Parent Family
% of children living in two
parent families
Single-Mother Family
% of children living in single mother families
Canada 2000 14.9 10.9 83.1 40.7 13.1 United Kingdom 1999 15.3 9.9 76.2 33.8 21.7 United States 2000 21.9 14.8 76.7 49.3 19.5 Source: Luxembourg Income Study Key Figures, accessed at www.lisproject.org/keyfigures.htm on April 19, 2005 and Heuveline & Weinshenker, 2006. aPoverty rates based upon 50% of the median adjusted disposable income for all persons in the family unit
Approximately 7% of American children live with a single mother and another
non-parent adult, representing one third of children living with single mothers. Despite
the presence of an additional adult, though, half of these children remain in poverty
(Rainwater & Smeeding, 2003). This trend is not observed among other wealthy,
industrialized nations. Similarly, the number of American children in a single mother
household is related to risk for poverty, with child poverty rates increasing with each
additional child. This trend is also not observed in other wealthy industrialized nations,
perhaps due to the notable absence of child allowances in the United States (Rainwater &
Smeeding, 2003).
Extreme poverty is higher among children living in single mother families in the
United States than any other industrialized, wealthy nation. Extreme poverty is higher
among this group than the total child poverty rate for single mother families in Belgium,
Denmark, Finland, France, the Netherlands, Spain, Sweden, and Switzerland (Rainwater
& Smeeding, 2003). In terms of both real income and relative income, American
children in single mother families fare worse than children in single mother families in
many other countries (Rainwater & Smeeding, 2003).
Single mother families may be well-researched due to their disproportionate risk
of poverty and sizeable make-up of the population, but single father families and

25
grandparent-headed families may also have less disposable income and greater risk for
poverty than two-parent families. While there is less research on child poverty among
grandparent-headed families, the proportion of grandparent-headed families in poverty
may be strongly related to elder poverty in each nation and the extent to which social
policies target older adults. The number of grandparent-headed families increased 20%
in Canada between 1991-2001 (Fuller-Thompson, 2005). In the United States, the
number of multigenerational households has increased substantially over the last thirty
years. The number of grandparent-headed households without a parent present, however,
was steady until a large increase between 1990 and 1997 (Casper & Bryson, 1998).
The majority of American grandparent caregivers are females (62.7%) between
the ages of 50 and 59 (35.1%) (Simmons & Lawler Dye, 2003). White and Asian adults
are less likely to be grandparent caregivers than Hispanic or black adults (1.06% of white
adults over the age of 30 are grandparent caregivers, 1.27% of Asian adults, 2.9% of
Hispanic adults, and 4.26% of black adults) (Simmons & Lawler Dye, 2003). The
majority of children living with grandparent caregivers have been in such an arrangement
for five or more years, consistently observed across racial/ethnic groups (Simmons &
Lawler Dye, 2003).
Much like the trends observed among single mothers, the intersection of gender,
marital status, and age functions to disadvantage grandmother-headed households
(Casper & Bryson, 1998). In 1997, sixty-three percent of American children living with
a single grandmother lived below the federal poverty level, while 23% of children living
with a single grandfather and 15% of children living with both grandparents were poor
(Casper & Bryson, 1998). Additionally, 90% of children living with a single

26
grandmother received public assistance, compared with 69% of children in single
grandfather families and 58% of children living with both grandparents (Casper &
Bryson, 1998). Moreover, children in grandparent-headed families are more likely to live
in poverty than children in the care of other non-parent relatives (Scarcella, Ehrle, &
Geen, 2003).
Children living in grandparent-headed families may also experience many of the
negative outcomes associated with residing in a single parent family (Edwards & Daire,
2006; Scarcella et al., 2003), yet some research shows that the educational and behavioral
outcomes for children with a single parent and grandparent are similar to children from
two-parent families (DeLeire & Kalil, 2002). Generally, grandparent-headed families
may be economically worse off than families headed by parents due to fixed income
(Hardin, Clark, & Maguire, 1997).
Single fathers make up 6.9% of families in the United States and have a median
income about 67% of two-parent families ($40,277 for single fathers, $66,050 for
married couples with children) (U.S. Census Bureau, 2006b), but little research examines
the poverty status of children in such families. Despite a single source of income in male-
headed single parent families, in contrast, the gender wage gap and other resources
position this family structure in better circumstances than the female-headed single parent
family in the United States (LIS, 2005; U.S. Census Bureau, 2006b). All variations of
single parent families, however, typically fare much worse than two-parent households,
with or without dual incomes (LIS, 2005). Social policies are largely targeted towards
families with children, in part because they are at higher risk for experiencing poverty,

27
but it is unclear whether or not policies are adequately targeted towards the most
vulnerable structures: single parent families.
Although some policies are targeted specifically to assist families with dependent
children (e.g., the Canada Child Tax Benefit in Canada, the Special Supplemental
Nutrition Program for Women, Infants, and Children in the United States, and Family
Credit in the United Kingdom), the policies’ anti-poverty effects may not be great enough
to close the income gap between single parent families and two-parent families or
between families with dependent children and families without dependent children.
Family Structure and High Relative Poverty
Explanations for high income inequality and poverty in the United States often
center on demographic issues. Purportedly, a large proportion of families headed by
single mothers is thought to explain high poverty rates in the United States (Fagan, 1999;
Iceland, 2003b; Rector, 2006; Renwick, 1998; Smeeding, 2004). Comparisons with
similarly situated industrialized countries such as Australia, Canada, and the United
Kingdom, however, suggest that single parenting does not account for higher poverty
rates and greater income inequality within the United States (Bradbury & Jäntti, 2001;
Iceland, 2003b; Rainwater & Smeeding, 2003; Smeeding, 2004). Single parent families
in Canada comprise similar proportions of their population to the United States, and the
United Kingdom has more children living in single parent families than the United States.
The poverty rates among all children, children in two-parent families, and children in
single parent families are higher, however, in the United States than in the other two
countries. Compared with the impact of redistributive tax and social benefits in
explaining differences among industrialized nations, the effects of family demography

28
(i.e., number of single parent families, elderly, etc.) on reducing income inequality are
minute (Iceland, 2003b; Rainwater & Smeeding, 2003).
Comparative studies consistently find that the economic well-being of single
mothers in the United States is lower than single mothers in most other industrialized
nations, with mother’s youth, more children, and lower levels of education associated
with the lowest earning capacity among single mothers (Rainwater & Smeeding, 2003;
Wong et al., 1993). The poverty rate for single mother families in the United States is the
highest of any family structure in any nation (Heuveline & Weinshenker, 2006; Lino,
1995).
Reducing Inequality and Child Poverty through Social Policy
Canada, the United Kingdom, and the United States have similar orientations
towards reducing poverty via social policies. These orientations, as well as the specific
policies available in each country are presented. The effectiveness of these policy
packages in reducing poverty among various risk groups, such as working parents, single
parent, and two-parent families are discussed. Finally, gaps in the literature such as the
antipoverty effect of policies for children living in single father or grandparent-headed
households, are discussed.
Orientations towards Welfare Policy in Anglo-Saxon Nations
Esping-Anderson’s theory of welfare capitalism (1990, 1999; Kolberg & Esping-
Anderson, 1992) suggests that countries’ orientations towards welfare and social policies
are determined by their economic structures and stratification. Present-day orientations
towards welfare in Canada, the United Kingdom, and the United States are heavily rooted
in English poor laws dating back to the seventeenth century. The lasting influence of

29
these laws is seen in the conflict between the government’s desire to maintain economic
structures and their recognition of responsibility for needy children, unemployed adults,
and unemployable adults (Trattner, 1999). Canada, the United Kingdom, and the United
States have high social stratification, which is produced by heavy reliance on market
forces. Engagement in the labor force and commodification are high, but social rights
and reliance on the government are low. This orientation represents the liberal, social
assistance-dominated model of welfare states characteristic of the English-speaking
countries (Esping-Anderson, 1990), where the poor rely on the government for means-
tested benefits and everyone else relies on the market. Policies in this regime interfere
minimally with market forces.
It is important to note, however, that Esping-Anderson’s early classification
(1990) has been criticized for ignoring the importance of women’s labor force
participation and family policies in influencing welfare ideologies (Moller & Misra,
2005). One useful perspective classifies welfare regimes by familializing or
defamilializing policies, which refer to the extent to which social policies strengthen
families’ caregiving or relieve families of caregiving. Policies that strengthen family
caregiving may include tax benefits to caregivers and parental leave policies, while
policies that provide caregiving relief may include public child care subsidies (Leitner,
2003). Canada, the United Kingdom, and the United States are classified as having both
weak familialization and weak defamilialization policies relative to other industrialized
nations (Gornick & Meyers, 2003; Moller & Misra, 2005).
Poverty reduction and welfare in Canada and the United Kingdom are funded
publicly to a greater extent than in the United States. Relative to other industrialized

30
countries, however, their welfare states are most similar to the United States: liberal
welfare regimes oriented towards strengthening the market and encouraging private
sector welfare. In contrast, the continental European welfare states, conservative welfare
regimes, are characterized by compulsory state social insurance whose distribution is
dependent on contributions and employment. Finally, the Scandinavian welfare states,
social democratic welfare regimes, are characterized by equal benefits available to all,
regardless of contributions, that provide comparable alternatives to surviving through
work alone. The welfare state is not just a means of correcting social inequalities, but can
function as a system of stratification itself (Esping-Anderson, 1990). Stratification
created by market forces and capitalist economies may remain intentionally stratified
through a welfare system that does not redistribute income to reduce income inequalities.
Given the differences between the three welfare state regimes’ orientations
towards poverty reduction, it is expected that spending levels cluster around these regime
types. Relative to the social democratic regimes (Denmark, the Netherlands, Finland,
Norway, and Sweden) and conservative regimes (Austria, Belgium, France, Germany,
Luxembourg), countries in the liberal regime (Australia, Canada, United Kingdom,
United States) spend and redistribute income in the smallest amounts, thus having the
smallest antipoverty effects (Smeeding, 2004). The United States, moreover, stands out
from other liberal regime countries as having the least generous and least effective
policies on poverty alleviation (Smeeding, 2004), tolerating high poverty rates and
substantial inequalities. More research is needed, however, to explore redistribution in
the United States among various family structures. The United States’ unique orientation
towards social welfare rests largely on deeply held beliefs that all Americans have equal

31
opportunities and that individuals are responsible for their own poverty or wealth
(Ozawa, 2004). As compared with Europeans, about half as many Americans support
income redistribution policies (Redmond, Schnepf, & Suhrcke, 2002 as in Micklewright,
2004).
Income Redistribution Policies
Child poverty varies greatly among industrialized nations, possibly due to
variation in the type, scope, and effectiveness of poverty alleviation policies aimed at
families with children. Liberal welfare regimes in countries like Canada, the United
Kingdom, and the United States rely on means-tested transfers rather than universal
transfers and labor market regulation (Nelson, 2004). While these three nations are most
similar, each employs distinct strategies towards poverty alleviation. Both Canada and
the United Kingdom, for example, have recently set the reduction of child poverty as a
prominent domestic policy goal. Canadian policymakers stated a goal in 1989 to
eliminate child poverty by 2000 (Micklewright, 2004), although given poverty rates
remain the same, its success is imperceptible. The United Kingdom set the elimination of
child poverty as a goal in 1999 to be achieved by 2020, with incremental goals for 2004
and 2010, and some success to date (Micklewright, 2004; Minoff, 2006). Despite some
rhetoric to the contrary, child poverty in the United States is accepted and its reduction or
elimination is not a policy priority (Micklewright, 2004).
Canada. Canadian income redistribution policies are characterized by both
national and provincial benefits financed by general tax revenue (federal, provincial, and
local) and employee and employer contributions. Canadians are eligible to receive public
retirement benefits, child tax benefits, employment insurance benefits, workers’

32
compensation, and a variety of provincial means-tested cash social assistance programs,
focusing spending on public pensions (universal and means-tested), child and family
allowances (small universal and slightly larger means-tested), and various cash benefits
(means tested) (see Table 3).
Table 3. Overview of Social Policies in Canada Social retirement benefits
• Old Age Security pension, Guaranteed Income Supplement, (Partner) Allowance
• Canada Pension Plan (CPP) and Quebec Pension Plan (QPP) retirement pensions, disability benefits, and survivors’ benefits
Child and family allowances
• Canada Child Tax Benefit (CCTB) • National Child Benefit Supplement (NCBS) • Provincial Child Tax Benefits (Alberta Family Employment Tax
Credit, BC Family Bonus, New Brunswick Child Tax Benefit, Northwest Territories Child Benefit, Nova Scotia Child Benefit, Nunavut Child Benefit, Quebec Family Allowance and Allowance for Handicapped Children, Saskatchewan Child Benefit, and Yukon Child Benefit
Unemployment compensation
• Employment insurance (regular unemployment, benefits for persons taking courses, and fishing benefits)
Sick pay (Included in unemployment compensation program) Accident pay • Workers’ Compensation benefits Disability pay None Maternity/paternity pay (Included in unemployment compensation program) Military/veterans benefits
None

33
Means-tested cash benefits
Social Assistance and Provincial Income Supplements • Supports for Independence (SFI), Assured Income for the
Severely Handicapped (AISH), Widows’ Pension Program, Family Maintenance Program, Skills Development Program (Alberta)
• Employment and Assistance Programs (British Columbia) • Employment and Income Assistance (EIA), Income Assistance
for Persons with Disabilities Program, Municipal Assistance Program, Child Related Income Support Program (CRISP), 55 PLUS Program (Manitoba)
• Social Assistance (New Brunswick) • Income Support Program/Social Assistance, Family Benefit
Program (Newfoundland and Labrador) • Income Assistance (Northwest Territories) • Employment Support and Income Assistance Program (Nova
Scotia) • Social Assistance/Income Support Program (Nunavut) • Ontario Works, Ontario Disability Support Program (ODSP)
(Ontario) • Financial Assistance Program (Prince Edward Island) • Employment Assistance Program, Parental Wage Assistance
Program (PWA), Quebec Maternity Allowance Program (PRALMA) (Quebec)
• Saskatchewan Assistance Plan, Saskatchewan Income Plan, Saskatchewan Employment Supplement, Provincial Training Allowance (Saskatchewan)
• Social Assistance (Yukon) Near-cash benefits Unavailable Sources: Gornick & Meyers, 2003; Luxembourg Income Study Institutional Information for Canada, 2000; Department of Human Resources and Skills Development Canada, 2006.
The United Kingdom. The United Kingdom offers a variety of national welfare
programs financed through taxation, employer contributions, and individual
contributions. Recent social policy reforms in the United Kingdom include the addition
of a childcare tax credit, the establishment (and subsequent increases) of a minimum
wage, expanded child services and programs, and the establishment of several “New
Deal” welfare to work policies (i.e., New Deal for Lone Parents, the New Deal 25+, the
New Deal for Young People, the New Deal for Disabled People) (Minoff, 2006). Each
New Deal program is designed to help unemployed people in various circumstances

34
prepare to find adequate work. The New Deal for Lone Parents includes job training and
incentives, child care subsidies, and jobseekers’ benefits, all of which are designed to
foster labor force participation among single parents.
The United Kingdom offers several programs in each policy area, including social
retirement benefits (universal), child and family allowances (universal), unemployment
benefits (universal and means-tested), and cash and near-cash benefits (means-tested).
Redistributive efforts, however, are concentrated on means-tested benefits and small
child allowances (Rainwater & Smeeding, 2003). For an overview of the social policies
available in the United Kingdom in 1999, see Table 4.
Table 4. Overview of Social Policies in the United Kingdom Social retirement benefits
• Retirement pension (National Insurance Pension, Old Persons’ Pension (OPP)
• Widows’ Pension • Widowed Mother’s Allowance • Widow’s Payment
Child and family allowances
• Child Benefit (CB) • Guardian’s Allowance (orphans) • Fostering Allowance • Adoption Allowance
Unemployment compensation
• Contribution-based Jobseekers’ Allowance (JSA) • Income-based Jobseekers’ Allowance • Government Training Allowances (Youth Training, Training for
Work, Work Trial, Project Work, Career Development Loans/Youth Credit, New Deal)
• Back to Work bonus Sick pay • Statutory Sick Pay Accident pay • Industrial Injury Disablement Benefit
• Industrial Death Benefit • Constant Attendance Allowance • Exceptionally Severe Disablement Allowance
Disability pay • Incapacity Benefit (IB) • Disability Living Allowance (DLA) • Severe Disablement Allowance • Attendance Allowance

35
Maternity/paternity pay • Statutory Maternity Pay (SMP) • Maternity Allowance • Maternity Payment (Social Fund)
Military/veterans benefits
• War disablement pension • War Widows’ pension
Other social insurance • Invalid Care Allowance • Educational grants • Cold Weather Payment (Social Fund) • Earnings Top-Up • Reduced Earnings Allowance
Means-tested cash benefits
• Income Support • Disability Working Allowance (DWA) • Family Credit (FC) • Funeral Payment (Social Fund) • Community Care Grant (Social Fund)
Near-cash benefits • Free School Meals, Free School Milk, Free Welfare Milk • Housing Benefit (HB) and extended payment • Council Tax Benefit (CTB) and extended payment • Educational grants • Direct DSS payments
Sources: Gornick & Meyers, 2003; Luxembourg Income Study Institutional Information for the United Kingdom, 1999; Department for Work and Pensions
The United States. The United States’ orientation towards welfare emphasizes
individual responsibility, economic independence, and work (Administration for Children
and Families, 2006). This orientation is evident in policies and programs administered by
the government such as the Earned Income Tax Credit (EITC) and the Personal
Responsibility and Work Opportunities Reconciliation Act of 1996 (PRWORA). The tax
credit is intended to reward work, while the PROWRA-imposed welfare receipt time
limitations penalize those who are not working. The emphasis on work, however, differs
for married versus single mothers (Millar, 1996). For example, the lack of welfare for
non-working single mothers strongly encourages their labor force participation, whereas
married mothers may opt to work or to stay home.

36
The United States offers social programs through employer and employee
contributions and general tax revenue, distributed at the state and national level. While
Social Security is the largest social and redistributive program, smaller programs target
groups such as military veterans, Native Americans, and families with young children
(see Table 5). Unlike Canada, the United Kingdom, and many other wealthy,
industrialized nations, the United States does not have programs for guaranteed sickness
benefits or child allowances (Rainwater & Smeeding, 2003). Similarly, the United States
has poorly developed work supports (minimum wages and benefits, child care, parental
leave, workers’ rights, etc.) aimed at decreasing the negative impact of high labor market
inequalities on children (Gornick & Meyers, 2003).
Table 5. Overview of Social Policies in the United States Social retirement benefits
• Retirement basic benefit (Social Security) • Supplements to Social Security (child/dependent spouse) • Survivors’ insurance benefits (Social Security)
Child and family allowances
None
Unemployment compensation
• Federal-State Unemployment Insurance Program
Sick pay None Accident pay • Office of Workers’ Compensation Programs Disability pay • Disability insurance benefits (Social Security) Maternity/paternity pay None Military/veterans benefits
• Veterans’ Administration benefits (disability and death pension for veterans, disability and survivor compensation, education benefits, Assistance for Homeless Veterans, Former POW, Home Loan Guaranty Benefits, Incarcerated Veteran Benefits, Service-Disabled Veterans Insurance)
Means-tested cash benefits
• Supplemental security income (SSI) • Temporary Assistance for Needy Families (TANF) • Aid to Dependent Children (ADC) • General Assistance/Emergency Assistance Program • Refugee Cash and Medical Assistance Program • General Assistance from Bureau of Indian Affairs • Tribal Administered General Assistance • Earned Income Tax Credit (EITC)

37
Near-cash benefits • Food Stamp Program (FSP) • Low-Income Home Energy Assistance Program (LIHEAP) • Federal student aid
Sources: Gornick & Meyers, 2003; Luxembourg Income Study Institutional Information for the United States, 2000
Compared with other wealthy, industrialized nations, Canada, the United
Kingdom, and the United States approach poverty with similar social policies. Although
all three countries have a substantial social security/retirement program, they provide
more means-tested benefits than universal benefits, typically providing welfare for only
low-income residents rather than all residents. Canada offers national and provincial
programs to help low-income residents, primarily by providing cash benefits. The United
States offers subsidies, near-cash benefits, and income redistribution primarily through
social security. The United Kingdom offers a variety of programs in each policy area,
including several new programs aimed at encouraging labor force participation. Work as
a means to poverty alleviation is strongly supported in each of the three countries, even
among caregivers.
Reducing Income Inequality and Poverty through Social Policy – Differential Impacts
Although many countries have programs that redistribute income to reduce
income inequality, the effectiveness of such programs varies widely from country to
country. Different levels and different types of spending on low-income populations
among various countries consequently have dramatically different impacts on national
rates of poverty (Smeeding, 1997; Smeeding, Rainwater, & Burtless, 2001). English-
speaking countries have higher pre-transfer poverty than Continental or Northern
European countries, a consistently observed phenomenon associated with lower social
spending (Micklewright, 2004).

38
Analyses of overall poverty reduction in Canada, the United Kingdom, and the
United States represent the combined effectiveness of the policies outlined in tables 3, 4,
and 5 toward reducing poverty in the general population. Using market income, the
poverty rate in the United Kingdom is 31.1%, the highest of the three nations. Taxes and
transfers reduce pre-transfer poverty in Canada by nearly half, in the United Kingdom by
a quarter, and in the United States by 16%. Combined with taxes and transfers, social
assistance reduces poverty in the United Kingdom by 60%. Canada reduces poverty by
46%, while the United States reduces poverty by 26.4%. After the effects of taxes,
transfers, and social assistance, the United Kingdom’s policies achieve the greatest
overall reduction in poverty among all poor persons, followed by Canada and the United
States (see Table 6) (Smeeding, 2005b). These initiatives mark an improvement in
poverty reduction in the United Kingdom from 1994-1995, when Canada reduced poverty
by the largest percent of the three countries (see Nelson, 2004). It should be noted,
however, that Canada’s pre-transfer poverty rate is substantially lower than that of the
United Kingdom.
The United Kingdom serves as an interesting case study in poverty alleviation,
given its recent policy reforms aimed at reducing child poverty. The comprehensive
Table 6. Reducing Poverty through Taxes, Transfers, and Social Assistancea
Country Year Pre-Transfer Poverty Rate
Poverty Rate after Taxes and
Transfers
Poverty Rate after Social Assistance
Total Percentage
Change Canada 2000 21.1 12.9 11.4 -46.0 United Kingdom 1999 31.1 23.5 12.4 -60.1 United States 2000 23.1 19.3 17.0 -26.4 Source: Smeeding, 2005b aBased upon household poverty rates in households with heads age 25-64 and income below 50% of the median ADPI

39
strategy includes efforts to increase income, improve education, health, and safety, and
reduce infant mortality and teenaged pregnancies. New policies such as an establishment
and increase in the national minimum wage, child tax credits, expanded child benefits,
assistance to single parents looking for work, and other improvements have resulted in
lifting more than a million children out of poverty and moving hundreds of thousands of
parents into the labor force (Piachaud & Sutherland, 2002; Minoff, 2006). The United
Kingdom’s new policies are aimed at promoting work, but unlike the United States, the
policies also consider the impact of a lack of work opportunities and the inability to work
among some adults, such as the disabled. These policies do not limit welfare receipt over
time, but continue to provide substantial means-tested benefits such as disability and
unemployment compensation and social security.
Antipoverty Effects for Working Parents. The strong emphasis on employment as
a means of reducing poverty demands an examination of poverty reduction among
parents who work. Table 7 shows poverty rates for children living with parents who
work at least 1000 hours annually, the equivalent of one earner with 20 hours per week of
employment. Both the pre and post-tax and transfer child poverty rates in the United
States are substantially higher than Canada and other OECD countries (Smeeding,
2004a). Similarly, the effect of taxes and transfers on the child poverty rate in the United
States are much smaller than the policy effects in other countries, reducing the poverty
rate by only 10 percent. This is especially noteworthy, considering that the United States
has higher part and full-time employment rates among mothers in both two and single
parent families than the United Kingdom (Moller & Misra, 2005). Additionally, welfare
leavers in the United States earn incomes that are often not sufficient to reduce poverty

40
(Micklewright, 2004). These data challenge the effectiveness of the United States’
emphasis on work-based poverty reduction efforts (Micklewright, 2004), as market
incomes are more important in reducing child poverty than government transfers
(Bradbury & Jäntti, 2001). Low-income parents are further challenged to balance work
and family demands, as Canada, the United Kingdom, and the United States have weak
parental leave and childcare policies (Gornick & Meyers, 2003).
Antipoverty Effects for Single Parent Families. Transfer programs in the United
States raise the income of single parent families, and taxes often reduce the income of
two-parent families (Lino, 1995). Single mothers, however, may not be the beneficiaries
of a proportionate amount of antipoverty spending in the United States (Heuveline &
Weinshenker, 2006). Many single mother families receive near-cash benefits, such as
food stamps, but the size of these transfers is fairly small at 6% of the median income
(Rainwater & Smeeding, 2003). Even after programs reduce poverty among single
parent families in the United States, a significant percent of single parent families remain
poor (Lino, 1995).
Income redistribution in the United States moves less than 20% of low-income
children with single mothers out of poverty, compared with a reduction of more than one
third in Canada and 50% in the United Kingdom (Rainwater & Smeeding, 2003). Due
Table 7. Antipoverty Effect for Children Whose Parents Worked 1000+ Hours a
Pre-Transfer Child Poverty Rate
Post-Transfer Income Child Poverty Rateb Total Percentage Change
Canada 17.9 9.9 -44.7 United States 27.9 25.1 -10.0 Source: Smeeding, 2004a and author’s tabulations aBased upon household poverty rates in households with children in 2000. bAntipoverty effects include cash and near-cash spending such as transfers, Earned Income Tax Credit, food stamps, housing, etc. and exclude health care and public education expenditures.

41
especially to its recent efforts to reduce child poverty, the United Kingdom redistributes
income among single parent households more than the United States (Heuveline &
Weinshenker, 2006). The United Kingdom has a very high market poverty rate for
children living with single mothers (over 80%), but high benefit levels (35% of the
median) account for the substantial reduction in poverty. Canada’s low spending moves
relatively few low-income children with single mothers out of poverty, but has a lower
market child poverty rate for single mother families (and thus a smaller poverty gap) than
the United Kingdom or the United States (Rainwater & Smeeding, 2003). Canada, the
United Kingdom, and the United States have high pre-transfer child poverty rates
compared to other wealthy nations due to low labor force participation and low wages
among single mothers (Rainwater & Smeeding, 2003). Relatively few children are
moved out of poverty by these nations’ social transfers.
Antipoverty Effects for Two-Parent Families. Among poor children in two-parent
families in the United States, fewer than 25% are moved out of poverty due to social
transfers. About half of Canadian and British children in two-parent families are moved
out of poverty (Rainwater & Smeeding, 2003). A majority of children in British and
American low-income families receive cash and near-cash government benefits, but the
size of those benefits is so small, it has little relative impact on national child poverty
rates. The United Kingdom, however, provides larger benefits than the United States
(7% of the median in the U.S., compared to 29% of the median in the United Kingdom)
(Rainwater & Smeeding, 2003). In terms of real income, all low-income American
children with two parents are better off than low-income British children with two
parents, due to high income in the United States. In terms of relative income, however,

42
94% of low-income British children with two parents are better off than their American
counterparts (Rainwater & Smeeding, 2003).
Antipoverty Effects for Other Family Stuctures. Grandparent-headed families
may have unique characteristics that may present different risks and benefits than those
observed in families headed by parents. In addition to the social programs available to all
types of low-income families, grandparent-headed families may have unique access to
additional benefits. Grandparent-headed families may be eligible to receive
Supplemental Security Income (SSI), Old-Age Survivors and Disability Insurance
(OASDI), and adoption, foster care, or guardianship subsidies (Children’s Defense Fund,
2004). Even though grandparents are likely to be living on a fixed income due to
retirement (Hardin et al., 1997), retirement may reduce or eliminate child care expenses
(Scarcella et al., 2003). Grandparents may also possess certain assets, such as a house,
that ease household expenditures. Currently, there are no analyses showing the
antipoverty effect of social policies in grandparent-headed families, but elder poverty
reduction itself is relatively successful in the United States. Researchers have noted that
policymakers continuously shift spending from low-income children to low-income
elderly adults (Lichter & Crowley, 2004; Lichter & Jayakody, 2002), resulting in
extensive benefits packages for older adults (Smeeding, 2005; 2005b).
While research shows that single father families are less likely to be in poverty
than single mother families (LIS, 2005; U.S. Census Bureau, 2006b), little is known
about the antipoverty effects of social policies for single father families.
The Role of Spending in Poverty Reduction. As compared with other
industrialized countries, the safety net for low-income families in the United States is

43
weak (Mayer, 1996). Because of the small size of benefit programs in the United States,
social benefits move fewer than 25% of children in two-parent families and fewer than
20% of children in single-parent families out of poverty (Rainwater & Smeeding, 2003).
The level of spending on both cash and near-cash programs in the United States is
diminutive, in comparison to other OECD countries, with the United States spending less
than 25% of the amount spent by Finland and Sweden in 2000 (Smeeding, 2004). While
the United States does spend more on in-kind benefits, such as health care and public K-
12 education, the value of such benefits may differ greatly by social class (Garfinkel,
Rainwater, & Smeeding, 2004).
The relatively low level of social spending in the United States is well-
documented and often criticized for its impotence in reducing inequality and poverty (see
Garfinkel et al., 2004; Ozawa, 2004; Rainwater & Smeeding, 2003; Smeeding, 2004).
The United States’ income redistribution and safety net programs reduce income
inequality by the smallest percentage of any industrialized country, and thus, have the
smallest antipoverty effect (Smeeding, 2004). Combinations of tax redistribution and
social assistance programs reduce relative poverty rates in some industrialized countries
by 62.5 to 88.6 percent. The poverty reduction in the United States is a mere 36.6
percent, with universal transfers contributing the most and social assistance contributing
the least to the reduction (Smeeding et al., 2001; Smeeding & Ross Phillips, 2001).
Increases in market income inequality over the last two decades have not been met with
increases in redistributive efforts (Kenworthy & Pontusson, 2005). The widespread
perspective that Americans benefit from a smaller and less generous government is

44
doubtful, given that the economic well-being of Americans declines when social policies
are less generous to the poor (Lobao & Hooks, 2003).
Gaps to be Addressed
The economic disadvantage of children in single parent families is well-
established. Not only is the poverty status of children in all family structures, including
single fathers and grandparent-headed families not extensively researched, but the
effectiveness of antipoverty policies in these various family structures has yet to be
examined. Additionally, the presence of a child age five or younger needs to be
examined in a comparative context. This study will address grandparent-headed families,
single father families, and families with young children. The comparative and economic
approach used in this study also contributes to the field of family science, as child
poverty research in the field often focuses on social, behavioral, and developmental
characteristics and domestic policy analysis. This study explores the role of structure in
child poverty and poverty reduction and the need to better understand the ways in which
policies help families perform their functions. Given the economic, political, and cultural
similarities among Canada, the United Kingdom, and the United States, a comparative
analysis of antipoverty policies in various family structures may provide important
information about the success of each policy approach in reducing child poverty in the
context of a liberal welfare regime.
Research Questions and Hypotheses
Based upon previous research and the proposed directional model of this study,
the following research questions and hypotheses are examined (see table 8):

45
Table 8. Summary of Research Questions and Hypotheses Research Question Hypothesis 1. What is the relationship between family structure and pre-transfer child poverty rates?
a. Pre-transfer child poverty will be higher among single parent structures than two-parent or grandparent structures.
2. What is relationship between family structure and post-transfer child poverty rates?
a. Child poverty will be higher among single parent structures than two-parent or grandparent structures
3. What proportion of poverty is reduced through income redistribution in each family structure?
a. Reductions in poverty will be greatest among grandparent-headed structures, followed by single parent structures, then two-parent structures. b. Income redistribution for single parent structures will not reduce post-transfer child poverty to levels comparable to two-parent structures. c. Social policy benefit packages will reduce child poverty by the smallest proportion in the United States.
4. What is the relationship between poverty and the presence of children ages five and under?
a. Children living in households with children ages five and younger will have higher poverty rates than other children. b. Reductions in poverty among children living in households with children ages five and younger will be greater than reductions among other children.
46
Chapter Three: Methods
Population Characteristics
The following describes the family structure and poverty status of families with
children in the selected countries. The United Kingdom has the highest proportion of
children living in single mother families (21.7%), followed by the United States (19.5%).
Canada has a relatively small proportion of children living in single mother families
(13.1%). The United States has the highest proportion of children living in households
not headed by an adoptive or biological parent, such as grandparent-headed families
(10.0%). The United States has the largest proportion of children living in households
earning less than 50 percent of the median income (21.9%), while Canada and the United
Kingdom have smaller proportions of children represented in the poverty population
(14.9% and 15.6%, respectively).
Sample
Children from three countries, Canada, the United Kingdom, and the United
States, are included in this study. These three countries are selected due to similarities in
welfare regime, economic structure, and extent of commodification (Esping-Anderson,
1999; Hicks & Kenworthy, 2002). While children are the units of analysis for this study,
data about the children’s households were collected from household heads. Respondents
who are at least eighteen years of age and head a household with at least one child under
the age of eighteen are included. Multi-family households, households without children
under the age of 18, and households with missing income or family structure data are
excluded. Appropriate sample weights for child variables are applied to each country’s
sample.

47
Procedures
The Luxembourg Income Study (LIS) is an aggregate dataset representing
national surveys from 30 countries. For this study, data from the fifth wave are used.
Three countries with liberal welfare state typologies, Canada, the United Kingdom, and
the United States, are compared. The Wave V LIS data for Canada were collected using
the 2000 Survey of Labour and Income Dynamics (unweighted n = 14,344 children,
weighted n = 6,915,951 children), which uses a stratified, multi-stage probability
sampling design. The Wave V LIS data for the United Kingdom were collected using the
1999 Family Resources Survey (unweighted n = 12,698 children, weighted n =
13,005,058), which uses a stratified clustered probability sample. The Wave V LIS data
for the United States were collected using the 2000 March Current Population Survey
(unweighted n = 29,005 children, weighted n = 71,276,344), which uses a multi-stage
cluster sample. Because of survey non-response and unequal probability of selection into
the samples for various population subgroups in each country dataset, weights are used to
strengthen the representativeness of the sample. The weighted data are considered
representative of a country’s population.
The major advantage of the LIS dataset is that the microdata from various
countries’ income surveys are harmonized and standardized, making data comparable
across countries. Variables in the LIS dataset are constructed and modified using the
guidance of the Canberra Group’s definitions and recommendations for internationally
comparable household income statistics (Canberra International Expert Group on
Household Income Statistics, 2001). Without harmonization, slight differences in
variable definitions would render the data from each country incomparable to data from

48
other countries. While the LIS dataset does not have high quality data for consumption
patterns and variables, consumption measures are not utilized in this study. LIS data are
best suited for examining inequality and poverty at one point in time and are less robust
when used in analyses over time (Smeeding, 2000).
The author attended a training workshop for researchers intending to use the LIS
dataset. To conduct analyses, registered users of the LIS dataset submit SPSS, SAS, or
STATA syntax programs via email to a batch processing computer that stores the LIS
microdata. Data protection laws of many member countries restrict access to microdata,
and identifying variables are suppressed or transformed to aggregates in the LIS dataset.
There were no risks or benefits to participants, as they were not contacted for this study.
This research does not meet the University of Maryland Institutional Review Board’s
definition of human subjects research, therefore IRB approval has not been sought.
Definitions
The Canberra Group, which exists to set standards to improve the measurement
and comparability of household income data, has developed a guide to conceptual issues
and income definitions for organizational and governmental use in collecting national
data. The following definitions are the recommended conceptual definitions for
comparative income distribution analyses.
Gross wages. Gross wages refers to the remuneration given by employers to
employees, including wages and salaries, overtime, and payment for foster children, tips,
bonuses, and employment benefits such as severance pay, hazard pay, profit sharing, and
other goods and services provided as a part of an employment package.

49
Self-employment income. Self-employment income refers to business profits or
losses, royalty payments, goods produced for home consumption, and other forms of
payment in exchange for labor not provided by an employer.
Total earnings. Total earnings is the sum of gross wages and salaries and self-
employment income.
Cash property income. Cash property income includes income from rentals of
property (excluding land) and property income, such as interest, dividends, and land rent.
Private and public pensions. Employer-based pensions or other retirement
income.
Market income. Market income is the sum of total earnings, cash property
income, and private and public pensions. Market income represents only the household
income provided by the market economy and excludes government transfers.
Income from social benefits. Income from social benefits includes any cash or
near-cash benefits such as retirement benefits, child and family allowances,
unemployment compensation, sick pay, accident pay, disability pay, maternity pay,
military benefits, social insurance, means-tested cash benefits, near-cash benefits (such as
food, housing, medical, heating, education, and child care payment subsidies), child
support and alimony, other regular private income (such as that from unions as strike pay,
scholarships, or charitable institutions), and other regular cash income or inter-household
transfers of income. Social benefits may come from employers or the government.
Disposable income. Disposable income is the sum of market income and income
from social benefits, less mandatory employee contributions and income tax payments.
Disposable income is conceptualized by assets and can be spent immediately without

50
having to be sold or otherwise converted into cash or near-cash assets. Disposable
income is the preferred aggregate measure in income inequality analyses, as the impact of
institutional arrangements are lessened and it is more accurate in assessing what
individuals have available for spending than total income (Canberra International Expert
Group on Household Income Statistics, 2001).
Mandatory employee contributions. Mandatory employee contributions are
required contributions to government or private social insurance, deducted from market
income.
Equivalization. While resources needed and consumed by families increase as the
size of the family increases, larger households benefit from economies of scale.
Equivalization is the process of equalizing households of various sizes so that total
disposable income is comparable among various household sizes. Income is equivalized
by dividing the total household disposable income by the value of a household member
equivalence scale and then weighing by the number of household members.
Commodification. Commodification refers to the extent to which economic value
is assigned to something that does not inherently have economic value and pay for goods
and services. A country with high commodfication may transform a large proportion of
non-commercial relationships into commercial ones, “outsourcing” the work of
childrearing, food preparation, landscaping, intellectual property, privatization of
government services, and other services to individuals or businesses outside of the
household unit. In countries with low commodification, individuals are more likely to
perform these services for themselves.

51
Economic Family. An economic family is defined by the United States
government as a group of two or more people who are related by birth, marriage, or
adoption and all living in the same household (United States Census Bureau, 2006). The
Canadian government uses a nearly identical definition, but also includes common-law
relationships (Statistics Canada, 2006). The United Kingdom defines a family as a
married or cohabiting couple, with or without children, or a lone parent with children
(Department of Work and Pensions, 2006). Due to slight variation in national definitions,
this study will define an economic family as a household unit of two or more people (at
least one of whom is a dependent child) who are related by birth, marriage, or adoption.
Family Structure. Family structure refers to the broad classification of economic
families by the number of adults in the households and the relationship of the adult(s) to
the child(ren). Households with one biological or adoptive parent are considered single-
parent families, either headed by a biological or adoptive mother or father. Households
with at least one biological or adoptive parent and a residential partner or spouse are
considered two-parent families. Households in which both biological parents are absent
are classified as “other,” which includes grandparent-headed families. Grandparent-
headed families are selected for this study, while other non-biological, non-adoptive
parent caregivers are excluded.
Familialization. Familialization refers to the extent to which governments or
markets encourage families to be responsible for the welfare of children.
Defamilialization, on the other hand, refers to the reduction of family responsibilities
through government policies or market forces in order to help families engage in work
(Esping-Anderson, 1999).

52
Measures
Independent Variables. The independent variables for this study are pre-transfer
poverty rate, the dollar amount or near-cash value of social benefits, and family
structure. Pre-transfer poverty rate is constructed by determining the percent of children
who live in households with market incomes equal to or less than the median market
income. Market income is constructed by adding total earnings (gross wages and salaries
and self-employment income), cash property income, and private and public pensions.
Income from social benefits is constructed by adding dollar amounts for retirement
benefits, child and family allowances, unemployment compensation, sick pay, accident
pay, disability pay, maternity pay, military benefits, social insurance, means-tested cash
benefits, near-cash benefits (such as food, housing, medical, heating, education, and child
care payment subsidies), child support and alimony, other regular private income, and
other regular cash income. All income variables are ratio-level measurements and are
constructed and harmonized by LIS using data from national income surveys in each of
the three countries of interest. For comparisons among various household sizes, total
disposable income is equivalized by dividing the total household disposable income by
the value of a household member equivalence scale and then weighing by the number of
household members. Then, dataset weights representing the number of children in the
household are applied.
The variable family structure is created using a combination of marital
status/married couple indicator, gender, and relationship of parent to children (biological
parent, adoptive, grandparent, other relative). The family structure variable is nominal,
dividing families into single father families, single mother families, two-parent families,

53
two-parent grandparent, single grandmother, or single grandfather family structures.
Single parent families are defined by the residential presence of one biological/adoptive
parent and absence of a residential partner or spouse or second parent. Single parent
families are grouped and examined based upon the sex of the household head. Two-
parent families are defined by the residential presence of at least one biological/adoptive
parent and the presence of a residential partner or spouse, who may or may not be a
biological/adoptive parent. Grandparent family structures are defined by the residential
absence of both biological parents and the residential presence of at least one biological
or adoptive grandparent, examined by the sex and relationship status of the household
head. Family structure is constructed using household and person-level data.
Data for households with at least one child at or under the age of five are
examined separately, determined by using the age of the youngest child in the household.
Although the race/ethnicity attributes differ for each country, descriptive statistics are
presented for race/ethnicity categories.
Dependent Variables. The outcome variable in this study is post-transfer poverty
rate, which represents the percent of children in each country that live in households
earning a disposable income equal to or less than fifty percent of the country median
disposable income. This variable is a ratio-level measurement, calculated using
household total disposable income and country median income. Country child poverty
rate is set at 50 percent of the median country income, where the variable represents the
percentage of children who live in households with an income equal to or less than 50
percent of the median country income.

54
Disposable income is constructed by adding market income and income from
social benefits, then subtracting mandatory employee contributions and income tax. For
comparisons among various household sizes, total disposable income is equivalized by
dividing the total household disposable income by the value of a dataset household
member equivalence scale in order to account for economies of scale {0.5 +
[.25*(number of persons-1)]}, and then weighing by the number of household members.
Data Analysis
A secondary data analysis was conducted using existing quantitative data. The
researcher analyzed the data via a remote access system, through which the researcher
submitted syntax programs and received output, therefore microdata were not directly
accessed.
Descriptive statistics were generated to show country-level pre-transfer poverty
rates, poverty rates after universal transfers, poverty rates after taxes, and poverty rates
after near-cash benefits for each country (see table 9). Total proportion of poverty
reduction was also calculated. These descriptive statistics were computed for each
country, as well as each of six family structures within each country. Households with a
child at or under the age of five were examined separately. Descriptive data analyses are
widely used by LIS researchers and other comparative researchers to illustrate poverty
and poverty reduction through a demographic or macroeconomic lens (see Rainwater &
Smeeding, 2003; Sigle-Rushton & Waldfogel, 2004; Smeeding, 2004; 2005; 2005b;
Weinshenker & Heuveline, 2006).

55
Using half of the median income, total disposable income was converted into a
relative child poverty figure for each country for interpretation. These results are used to
evaluate the antipoverty effects of welfare policies on child poverty rates in Canada, the
United Kingdom, and the United States. Both the independent (universal transfers,
means-tested tax transfers, near-cash social benefits) and combined antipoverty effects of
social transfers are evaluated. These results are used to evaluate the nature of income
Table 9. Summary of Research Questions, Hypotheses, and Analytic Method Research Question Hypothesis Analytic
Method 1. What is the relationship between family structure and pre-transfer child poverty rates?
a. Pre-transfer child poverty is higher among single parent structures than two-parent or grandparent structures.
Descriptive statistics
2. What is relationship between family structure and post-transfer child poverty rates?
a. Child poverty is higher among single parent structures than two-parent or grandparent structures
Descriptive statistics
3. What proportion of poverty is reduced through income redistribution in each family structure?
a. Reductions in poverty are greatest among grandparent-headed structures, followed by single parent structures, then two-parent structures. b. Income redistribution for single parent structures will not reduce post-transfer child poverty to levels comparable to two-parent structures. c. Social policy benefit packages will reduce child poverty by the smallest proportion in the United States.
Descriptive statistics
4. What is the relationship between poverty and the presence of children ages five and under?
a. Children living in households with children ages five and younger will have higher poverty rates than other children. b. Reductions in poverty among children living in households with children ages five and younger are greater than reductions among other children.
Descriptive statistics

56
redistribution of welfare policy types and family structures on household child poverty
across three nations.
Even though the policies of each country are analyzed separately, specific country
characteristics that influence the dependent variable, including labor force participation
and unemployment, are not explicitly examined. Problems with nonnrepresentative
samples are adjusted with an appropriate sample weight for each country (household,
person, or child-level weights), but there is no differential selection of subjects into
groups, as the groups of interest (country) are pre-established. There may be, however,
differential selection into family structure groupings.

57
Chapter Four: Results
Demographic Characteristics
The samples for this study consist of children less than 18 years old who live with
parents or grandparents. In Canada, the weighted sample is comprised of 6,915,951
children. In the United Kingdom, the weighted sample is comprised of 13,005,058
children. The weighted sample for the United States is comprised of 71,276,344
children.
Among Canadian children, 43.7% were between the ages of zero and five. The
United Kingdom and the United States had slightly larger proportions of children ages
zero to five, with 49.4% and 49.7% respectively. The mean age for Canadian children is
7 years old, while the mean age for American children is 6 years, four months old, and
the mean age for British children is 6.5 years old (see table 10).
Due to the socially constructed nature of race, each of the three countries uses
different attributes for race. In Canada, one third of household heads is classified as non-
immigrants, 15.8% as immigrants, and nearly half of the data for this variable are
missing. In the United Kingdom, 93% of household heads is white, nearly 2% is black,
and more than five percent is classified as other, which includes subgroups such as
Chinese, Indian, and Bangladeshi. In the United States, about 70% of household heads is
Table 10. Age of Youngest Child in Household (in years) 0-5 6-17 Mean age Standard deviation
Canada 43.7% 56.3% 7.03 4.869 United Kingdom 49.4% 50.6% 6.49 4.942 United States 49.7% 50.3% 6.31 4.868

58
white, 12.4% is black, 12.2% is Hispanic/Latino, less than one percent is Native
American, and nearly four percent is Asian or Pacific Islander (see table 11).
The majority of children in Canada (86.3%), the United Kingdom (74.4%), and
the United States (75.9%) live with two parents. The second largest number of children
lives with single mothers. Among the three countries, Canada has the fewest (10.4%)
children living in single mother families. Seventeen percent of children in the United
States live in single mother families, and nearly 23% of children in the United Kingdom
live in single mother families. While single father families are less prevalent in all three
countries, more than three percent of children in Canada, two percent of children in the
United States, and almost two percent of children in the United Kingdom live with single
fathers. Relatively few children reside in grandparent families in the United Kingdom,
with less than one percent of children living in two-parent grandparent (0.5%), single
grandmother (0.5%), and single grandfather families (0.1%). Grandparent-headed
families in the United States, however, are as prevalent or more prevalent than single
father families. Two and a half percent of children reside in a two-parent grandparent
family, 2.2% live with a single grandmother, and 0.3% live with a single grandfather (see
table 12). Grandparent data are not available for Canada.
Table 11. Race/Ethnicity of Household Head Canada Non-immigrant Immigrant Missing data
33.3% 15.8% 49.0%
United Kingdom White Black Other 93.0% 1.8% 5.2%
United States White Black Native American Asian/PI Hispanic 70.8% 12.4% .9% 3.8% 12.2%

59
Pre-Transfer Child Poverty Rates: Relationship between Family Structure and Market
Income
In order to answer the question, what is the relationship between family structure
and pre-transfer child poverty rates, the percent of children whose households fall at or
below 50% of the median income are calculated for each examined family structure. It is
hypothesized that pre-transfer child poverty rates will be higher among single parent
structures than two-parent structures.
Nearly 25% of Canadian children live in households with market incomes at or
below 50% of the median market income. Based upon market income, those living with
two-parent families are least likely to live in poverty (20.1%), while those living with
single mothers are most likely to live in poverty (65.9%). Canadian children living with
single fathers have a market income poverty rate below that of all children and nearly as
low as children living with two parents (23.3%) (see table 13).
Table 13. Pre-Transfer Poverty Rates among Children in Various Family Structures All
children Two
parent Single mother
Single father
Two parent grandparent
Single grandmother
Single grandfather
Canada 24.2% 20.1% 65.9% 23.3% -- -- --
United Kingdom 34.8% 25.5% 85.9% 62.9% 40.0%a 38.0%a 43.0%a
United States 27.4% 20.7% 70.0% 33.2% 34.0% 60.0% 30.9%a
aThese figures should be interpreted with caution due to small sample sizes.
Table 12. Children’s Family Structures Two-parent
Single mother
Single father
Two-parent grandparent
Single grandmother
Single grandfather
Canada 86.3% 10.4% 3.3% -- -- -- United Kingdom 74.4% 22.8% 1.7% 0.5% 0.5% 0.1% United States 75.9% 17.0% 2.2% 2.5% 2.2% 0.3%

60
Among all children in the United Kingdom, 35% live in households with market
income at or below 50% of the median market income. Nearly 86% of children with
single mothers and 63% of children with single fathers live in households below the pre-
transfer poverty line. One quarter of British children in two-parent families live below
the pre-transfer poverty line, the lowest pre-transfer poverty rate of any family structure.
Children in two-parent grandparent (40%), single grandmother (38%), and single
grandfather families (43%) have similar pre-transfer poverty rates.
The pre-transfer poverty rate for all children in the United States is 27.4%.
Seventy percent of children with single mothers and 60% of children with single
grandmothers live in households below the pre-transfer poverty line. Pre-transfer poverty
rates for other structures are much lower, with 20.7% of children in two-parent families,
33.2% of children in single father families, 34% of children in two-parent grandparent
families, and nearly 31% of children in single grandfather families living below the pre-
transfer poverty line.
Comparing all three countries, the United Kingdom has the highest overall, two
parent, single mother, single father, two-parent grandparent, and single grandfather pre-
transfer child poverty rates. The United States has the highest pre-transfer poverty rate
for children living with single grandmothers. Canada has the lowest pre-transfer poverty
rates for all children and children living in two-parent, single mother, and single father
families. Among grandparent families in the United States and United Kingdom, the
United States has the highest pre-transfer poverty rate for children in single grandmother
families and the lowest pre-transfer poverty rates for children in two-parent grandparent
and single grandfather families. Providing partial support for the first hypothesis, pre-
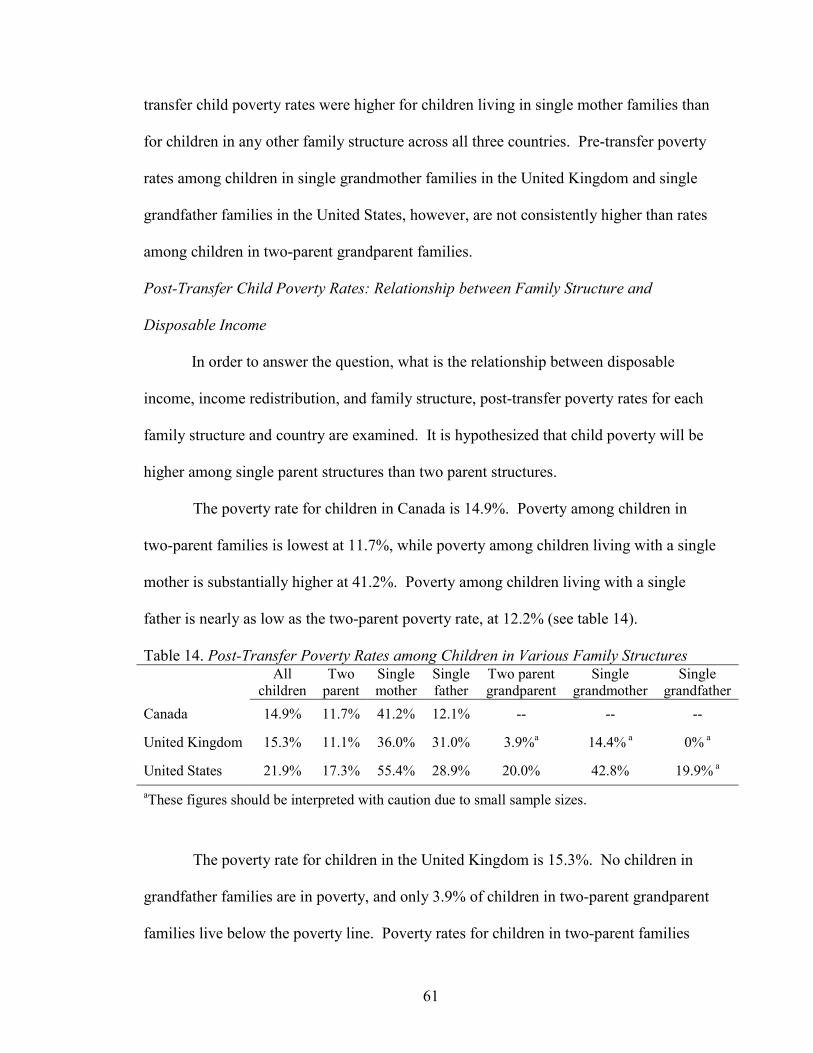
61
transfer child poverty rates were higher for children living in single mother families than
for children in any other family structure across all three countries. Pre-transfer poverty
rates among children in single grandmother families in the United Kingdom and single
grandfather families in the United States, however, are not consistently higher than rates
among children in two-parent grandparent families.
Post-Transfer Child Poverty Rates: Relationship between Family Structure and
Disposable Income
In order to answer the question, what is the relationship between disposable
income, income redistribution, and family structure, post-transfer poverty rates for each
family structure and country are examined. It is hypothesized that child poverty will be
higher among single parent structures than two parent structures.
The poverty rate for children in Canada is 14.9%. Poverty among children in
two-parent families is lowest at 11.7%, while poverty among children living with a single
mother is substantially higher at 41.2%. Poverty among children living with a single
father is nearly as low as the two-parent poverty rate, at 12.2% (see table 14).
The poverty rate for children in the United Kingdom is 15.3%. No children in
grandfather families are in poverty, and only 3.9% of children in two-parent grandparent
families live below the poverty line. Poverty rates for children in two-parent families
Table 14. Post-Transfer Poverty Rates among Children in Various Family Structures All
children Two
parent Single mother
Single father
Two parent grandparent
Single grandmother
Single grandfather
Canada 14.9% 11.7% 41.2% 12.1% -- -- --
United Kingdom 15.3% 11.1% 36.0% 31.0% 3.9%a 14.4% a 0% a
United States 21.9% 17.3% 55.4% 28.9% 20.0% 42.8% 19.9% a aThese figures should be interpreted with caution due to small sample sizes.
62
(11.1%) and single grandmother families (14.4%) both fall below the national child
poverty rate. Children living with single mothers and single fathers, however, have
considerably higher poverty rates than all other structures examined. Thirty-six percent
of children in single mother families and 31% of children in single father families in the
United Kingdom are in poverty.
Nearly 22% of American children are in poverty. Children in two-parent
(17.3%), two-parent grandparent (20%), and single grandfather families (19.9%) have
lower poverty rates than other structures examined. The poverty rate for children in
single mother families is 55.4%, while the poverty rate for children living with single
grandmothers is nearly 43%. The poverty rate for children in single father families
(28.9%) is higher than the national rate, but lower than the rates for single mother and
single grandmother structures.
Among all three countries, the United States has the highest poverty rates overall
and for two-parent, single mother, single grandmother, single grandfather, and two-parent
grandparent families. Children in single father families in both the United States and the
United Kingdom have similarly high rates of poverty. Canadian children in single father
and two-parent families and British children in single mother, two-parent, and
grandparent families have lower poverty rates than their counterparts in the examined
countries. Children in single mother families fare worse than children in all other
structures in each of the three countries (see table 14). It was hypothesized that child
poverty is higher among single parent structures than two-parent family structures. This
hypothesis is supported for single mother and single grandmother families. It is not
supported, however, for single father families in Canada and single grandfather families

63
in the United Kingdom and United States, which have child poverty rates similar to or
less than the corresponding two-parent structures.
Poverty Reduction through Income Redistribution
In answering the question, what proportion of poverty is reduced through income
redistribution in each family structure, three hypotheses are examined. First, it is
hypothesized reductions in poverty will be greatest among grandparent-headed structures,
followed by single parent structures, then two-parent structures. Second, it is
hypothesized that income redistribution for single parent structures will not reduce total
post-transfer income poverty levels comparable to two-parent structures. Third, income
redistribution will reduce child poverty by the smallest proportion in the United States.
Total child poverty reduction. In order to determine the relative reduction in child
poverty rates, the percent reduction (not percentage point reduction) from pre-transfer
child poverty to post-transfer poverty was calculated. In income redistribution that
occurs between market income and disposable income, Canadian children in all family
structures experience a 38.4% reduction in poverty (see table 15). Among children in
two-parent structures, poverty is reduced by 41.8%. Children living with single mothers
experience a poverty reduction of 37.5%, while children living with single fathers
experience a reduction of 48.1%. Although Canadian children with single fathers
experience the largest reduction in poverty from income redistribution, the rates for each
family structure are similar.

64
In the United Kingdom, poverty among children is reduced by 56%. Children in
two-parent families experience a 56.5% reduction, while children living with single
mothers experience a 58.1% reduction. Child poverty in single father families is reduced
by the smallest proportion of all structures in the United Kingdom (50.7%). Two-parent
grandparent and single grandfather families experience remarkable reductions in child
poverty, at 90.2% and 100% respectively. Children living with single grandmothers
experience less poverty reduction (62.1%) than other grandparent structures, but more
than two-parent, single mother, and single father structures.
Poverty among American children is reduced by 20.1% through income
redistribution. Child poverty is reduced by the smallest amount among children in two-
parent (16.4%) and children in single father families (13.%). Children in single mother
families experience a reduction of 20.9%. Child poverty in grandparent structures is
reduced by the largest amount of all structures in the United States, with a 41.2%
reduction among two-parent grandparent families, 28.7% in single grandmother families,
and 35.6% in single grandfather families.
Overall child poverty rates and child poverty rates in each examined family
structure are greatest in the United Kingdom and smallest in the United States. Among
Table 15. Percent of Post-Transfer Poverty Reduced among Children in Various Family Structures
All children
Two parent
Single mother
Single father
Two parent grandparent
Single grandmother
Single grandfather
Canada 38.4% 41.8% 37.5% 48.1% -- -- --
United Kingdom 56.0% 56.5% 58.1% 50.7% 90.2%a 62.1%a 100.0%a
United States 20.1% 16.4% 20.9% 13.0% 41.2% 28.7% 35.6%a
aThese figures should be interpreted with caution due to small sample sizes.

65
children in two-parent families, poverty is reduced through income redistribution by
41.8% in Canada, 56.5% in the United Kingdom, but only 16.4% in the United States.
Child poverty rates for single mother families are reduced by 37.5% in Canada, 58.1% in
the United Kingdom, and 20.9% in the United States. Poverty rates for children living
with single fathers are reduced by similar proportions in both Canada (48.1%) and the
United Kingdom (50.7%), while reduction in the United States is substantially less
(13.0%). In grandparent families, child poverty reduction after income redistribution is
greater in the United Kingdom than in the United States. Income redistribution results in
a 90% reduction for children in two-parent grandparent families, 62.1% for children in
single grandmother families, and 100% for children in single grandfather families. In
contrast, income redistribution in the United States reduces poverty by 41.2% among
children in two-parent grandparent families, 28.7% among children in single grandmother
families, and 35.6% among children in single grandfather families after income
redistribution (see table 15).
In addressing what proportion of poverty is reduced through income
redistribution, these results provide partial support for the first hypothesis. In Canada,
the hypothesis is partially supported, as child poverty in single father families is reduced
by a greater proportion than in two-parent families. Child poverty in two-parent
families, however, is reduced by a greater proportion than in single mother families. In
both the United Kingdom and the United States, child poverty is reduced by the greatest
proportion in grandparent-headed families, followed by single mother families and two-
parent families. Poverty is reduced by the smallest proportion among children in single
father families in the United Kingdom and the United States. The first hypothesis is

66
partially supported in these countries, where grandparent families experience the largest
reductions in child poverty. In the United Kingdom and the United States, single
mothers experience the second largest reductions in poverty, followed by two-parent
families. Within grandparent-headed families in the United Kingdom and the United
States, children in two-parent grandparent families and single grandfather families
experience the largest reduction in poverty, while children living with single
grandmothers experience relatively smaller reductions.
The second hypothesis, which posits that income redistribution for single parent
structures will not reduce post-transfer child poverty levels to those of two-parent
families, is supported with the exception of children living with single grandfathers.
Across all three countries, single mother, single father, and single grandmother families
have higher post-transfer child poverty rates than two-parent grandparent and two-parent
families. In all three countries, the child poverty rate for single mothers is more than
three times as high as the child poverty rate in two-parent families.
The third hypothesis that the United States will reduce child poverty by the
smallest proportion is supported. Overall child poverty and child poverty in each of the
examined structures is higher in the United States than in Canada and the United
Kingdom.
Child poverty reduction by groups of policies. After the implementation of
universal transfers, Canadian children living with single fathers experience the highest
proportion of poverty reduction (25.8%), while children in single mother families
experience the smallest poverty reduction (5.9%) (see table 16). After taxes, Canadian
children in two-parent (21.3%) and single father (22%) families experience the largest

67
Table 16. Child Poverty Reduction via Income Redistribution in Canada, the United Kingdom, and the United StatesCountry Pre-Transfer
PovertyRate
Poverty Rateafter
UniversalTransfers
PercentChange dueto Universal
Transfers
PovertyRate after
Taxes
PercentChange due
to Taxes
Poverty Rateafter Means-
TestedTransfers
PercentChange dueto Means-
TestedTransfers
Poverty Rateafter Near-
CashAssistance
PercentChange due
to Near-Cash
Assistance
TotalPercentChange
Canada (n = 6,915,951)Total 24.2% 21.3% 12.0% 17.7% 16.9% 16.2% 8.5% 14.9% 8.0% 38.4%
Two-Parent 20.1% 16.9% 15.9% 13.3% 21.3% 12.6% 5.3% 11.7% 7.1% 41.8%
Single-Mother 65.9% 62.0% 5.9% 53.9% 13.1% 48.2% 10.6% 41.2% 14.5% 37.5%
Single-Father 23.3% 17.3% 25.8% 13.5% 22.0% 13.5% 0% 12.1% 10.4% 48.1%
Two-Parent Grandparent -- -- -- -- -- --
Single Grandmother -- -- -- -- -- --
Single Grandfather -- -- -- -- -- --
United Kingdom (n = 13,005,058)
Total 34.8% 33.5% 3.7% 32.9% 1.8% 25.9% 21.3% 15.3% 40.9% 56.0%
Two-Parent 25.5% 23.8% 6.7% 23.1% 2.9% 15.6% 32.5% 11.1% 28.8% 56.5%
Single-Mother 85.9% 84.0% 2.2% 82.4% 1.9% 68.7% 16.6% 36.0% 47.6% 58.1%
Single-Father 62.9% 61.7% 1.9% 60.7% 1.6% 53.9% 11.2% 31.05 42.5% 50.7%
Two-Parent Grandparenta 40.0% 32.6% 18.5% 30.1% 7.7% 6.9% 77.1% 3.9% 43.5% 90.2%
Single Grandmothera 38.0% 36.0% 5.3% 34.1% 5.3% 28.8% 15.5% 14.4% 50.0% 62.1%
Single Grandfathera 43.0% 4.9% 88.6% 4.9% 0% 0% 100% 0% -- 100%
United States (n = 71,276,344
Total 27.4% 27.8% -1.5% 25.7% 7.6% 23.4% 8.9% 21.9% 6.4% 20.1%
Two-Parent 20.7% 21.4% -3.4% 19.3% 9.8% 18.1% 6.2% 17.3% 4.4% 16.4%
Single-Mother 70.0% 69.7% 0.4% 66.2% 5.0% 62.1% 6.2% 55.4% 10.8% 20.9%
Single-Father 33.2% 32.1% 3.3% 30.7% 4.4% 28.4% 7.5% 28.9% -1.8% 13.0%
Two-Parent Grandparent 34.0% 32.2% 5.3% 24.9% 22.7% 20.9% 16.1% 20.0% 4.3% 41.2%
Single Grandmother 60.0% 54.2% 9.7% 48.2% 11.1% 44.5% 11.2% 42.8% 3.9% 28.7%
Single Grandfathera 30.9% 21.7% 29.8% 21.7% 0% 20.2% 8.3% 19.9% 1.5% 35.6%aThese figures should be interpreted with caution due to small sample sizes.

68
poverty reduction, while children in single mother families again experience the smallest
poverty reduction (13.1%). After means-tested transfers in Canada, child poverty is
reduced by 10.6% in single mother families and 5.3% in two-parent families. Child
poverty is not reduced through means-tested transfers in single father families. Near-cash
assistance in Canada is most beneficial for children in single mother families (14.5%).
Near-cash assistance also helps children in two-parent and single father families through
a poverty reduction of 7.1% and 10.4% respectively.
For Canadian children in single mother families, the most substantial reductions
in poverty occur as a result of taxes (13.1%) and near-cash assistance (14.5%). Child
poverty is reduced in single father families largely through universal transfers (25.8%)
and taxes (22%). Children in two-parent families benefit most from taxes (21.3%).
In the United Kingdom, universal transfers result in small reductions in child
poverty for two-parent (6.7%), single mother (2.2%), single father (1.9%), and single
grandmother (5.3%) families. These transfers, however, are important to children in
single grandfather families, reducing child poverty by 88.6%. Income redistribution
through taxes in the United Kingdom has little influence on child poverty rates across
family structures, with the most substantial reduction occurring for children in two-parent
grandparent families at 7.7%. Means-tested transfers reduce child poverty by 32.5% in
two-parent families, 16.6% in single mother families, 11.2% in single father families,
77.1% in two-parent grandparent families, 15.5% in single grandmother families, and
100% in single grandfather families. Near-cash assistance is helpful to all structures,
reducing child poverty between 28.8% in two-parent families to 50% in single
grandmother families.

69
With the notable exception of universal transfers in single grandfather families
(88.6%), most income redistribution in the United Kingdom occurs via means-tested
transfers and near-cash assistance. Children in two-parent families (32.5%) and two-
parent grandparent families (77.1%) benefit most from means-tested transfers. Children
in single mother (47.6%), single father (42.5%), and single grandmother (50%) families
benefit most from near-cash benefits.
Finally, in the United States, universal transfers increase child poverty overall
(-1.5%), as well as in two-parent families (-3.4%). Child poverty is reduced by universal
transfers in small proportions among single mother (0.4%), single father (3.3%), and
two-parent grandparent (5.3%) families. Children living with single grandmothers
experience nearly a ten percent reduction in poverty (9.7%), while children living with
single grandfathers experience nearly a 30% reduction. Taxes in the United States
reduce poverty among children living with two grandparents by 28.7%. Child poverty
reductions in other structures are more modest, with 9.8% in two-parent families, 5% in
single mother families, 4.4% in single father families, and 11.1% in single grandmother
families. Child poverty is not reduced among children living with single grandfathers
via taxes. Means-tested transfers in the United States result in a 6.2% reduction among
children in both two-parent and single mother families. Children living with single
fathers experience a 7.5% reduction, while children living with single grandfathers
experience an 8.3% reduction. Two-parent grandparent and single grandmother families
benefit slightly more from means-tested transfers, with reductions in child poverty at
16.1% and 11.2% respectively. Near-cash assistance raises child poverty among
children living with single fathers (-1.8%), but children in all other structures experience

70
a modest reduction. Child poverty is reduced by nearly 11% in single mother families,
4.4% in two-parent families, 4.3% in two-parent grandparent families, 3.9% in single
grandmother families, and 1.5% in single grandfather families.
American children in two-parent families experience the greatest reduction in
poverty through taxes. Child poverty is most substantially reduced for single mother
families through near cash assistance. Children living with two grandparents and single
grandmothers benefit from taxes and means-tested benefits. Child poverty is reduced by
the largest proportion via means-tested transfers in single father families and universal
transfers in single grandfather families. Unlike Canada and the United Kingdom, which
redistribute income with strong packages in specific policy areas, there is no discernable
trend in the vehicles of income redistribution in the United States.
Using universal transfers, Canada reduces overall child poverty by 12%, the
United Kingdom reduces child poverty by 3.7%, and the United States increases child
poverty by 1.5%. Using taxes, child poverty is reduced in Canada by 16.9%, in the
United Kingdom by 1.8%, and in the United States by 7.6%. Redistribution through
means-tested transfers reduces child poverty by 8.5% in Canada, 21.3% in the United
Kingdom, and 8.9% in the United States. Redistribution through near-cash assistance
reduces child poverty in Canada by 8%, in the United Kingdom by 40.9%, and in the
United States by 6.4%. Canadian efforts to reduce child poverty consist largely of
redistributive taxes. In the United Kingdom, child poverty alleviation efforts are
achieved through generous means-tested and near-cash benefits. The United States
spreads its means of income redistribution across several policy groups: predominantly
through taxes and means-tested transfers, but differing substantially by family structure.

71
The most successful reductions in child poverty rates in Canada and the United States
range from 25 to 30%. In comparison, the United Kingdom makes many child poverty
rate reductions ranging from 40 to 100%.
Households with Children Ages Five and Under
In answering the question, what is the relationship between child poverty rates
and the presence of children five years of age and younger, rates are consistently higher
for households with young children across all three countries (see table 17). The pre-
transfer child poverty rate in Canadian households with children ages five and younger is
27.7%, while the rate for households with children over five is 21.5%. After all
redistribution, the child poverty rate for children in households with children five and
younger is 18.1%, while the rate for children over five is 12.4%.
In the United Kingdom, the pre-transfer child poverty rate is 40.5% for
households with children five and younger and 29.3% for households with children over
five. The post-transfer child poverty rate is 20.4% for households with children five and
under, whereas the rate for households with children older than five is 10.9%.
In the United States, the pre-transfer child poverty rate is 31.2% for children in
households with children five and younger and 23.8% in households with children over
five. The post-transfer poverty rates for households with and without children five and
younger are 25.8% and 18.1% respectively.
Child poverty is reduced by larger proportions in households with children over
five in all three countries. In Canada, child poverty is reduced by 34.7% in households
with children five and under and by 42.3% by households with children older than five.
In the United Kingdom, child poverty is reduced by 49.6% in households with children

72
Table 17. Child Poverty Reduction in Households with and without Children Ages Five and UnderCountry Pre-Transfer
Poverty RatePoverty Rate after
Universal TransfersPoverty Rateafter Taxes
Poverty Rate afterMeans-Tested Transfers
Poverty Rate afterNear-Cash Assistance
Total PercentChange
Canada (n = 6,915,951)Children 5 and under 27.7% 24.4% 20.6% 19.1% 18.1% 34.7%Children over 5 21.5% 18.9% 15.5% 14.1% 12.4% 42.3%United Kingdom (n = 13,005,058)Children 5 and under 40.5% 39.6% 39.5% 31.9% 20.4% 49.6%Children over 5 29.3% 27.5% 26.4% 19.9% 10.9% 62.8%United States (n = 71,276,344)Children 5 and under 31.2% 32.0% 29.7% 27.0% 25.8% 17.3%Children over 5 23.8% 23.7% 21.7% 19.8% 18.1% 23.9%

73
five and under, while the rate for households with children older than five is 62.8%. In
the United States, poverty in households with children five and younger is reduced by
17.3%, while it is reduced by 23.9% among children in households with children older
than five. The United Kingdom is most successful in reducing child poverty in both
household age groups, while the United States is least successful.
In examining the relationship between child poverty and the presence of children
ages five and under, two hypotheses are examined. First, it is hypothesized that children
living in households with children ages five and younger have higher poverty rates than
other households. This hypothesis is supported by evidence in Canada, the United
Kingdom, and the United States at each phase of income redistribution. Second, it is
hypothesized that reductions in child poverty among children living in households with
children ages five and younger are greater than reductions in households without
children ages five and younger. This hypothesis is not supported. A greater proportion
of poverty is reduced in households with children over five in all three countries.
Summary of Findings
A summary of results for this study follows (see table 18).

74
Table 18. Summary of Research Questions, Hypotheses, and Results Research Question
Hypothesis Results
1. What is the relationship between family structure and pre-transfer child poverty rates?
a. Pre-transfer child poverty will be higher among single parent structures than two-parent structures.
Hypothesis supported among all families, except single grandmother families in the United Kingdom and single grandfather families in the United States.
2. What is relationship between family structure and post-transfer child poverty rates?
a. Child poverty will be higher among single parent structures than two-parent structures.
Hypothesis supported for single mother and single grandmother families. Hypothesis not supported for single father families in Canada and single grandfather families in the United Kingdom and United States, which have poverty rates similar to or less than two parent structures.
3. What proportion of poverty is reduced through income redistribution in each family structure?
a. Reductions in poverty will be greatest among grandparent-headed structures, followed by single parent structures, then two-parent structures. b. Income redistribution for single parent structures will not reduce post-transfer child poverty to levels comparable to two-parent structures. c. Social policy benefit packages will reduce child poverty by the smallest proportion in the United States.
a. Hypothesis partially supported. Two-parent grandparent, single grandmother, and single grandfather families experience larger reductions than non-grandparent families. Within grandparent families, reductions among single grandfather families and single grandmother families are smaller than two-parent grandparent families in the United States. Reductions for single grandmother families are smaller than two-parent grandparent families, but larger for single grandfather families in the United Kingdom. Compared with two-parent families in Canada, reductions for single father families are greater and reductions for single mother families are smaller. Compared with two-parent families in the United Kingdom and United States, reductions for single mother families are greater, while reductions for single fathers are smaller. b. Hypothesis supported, except for single grandfather families. c. Hypothesis supported across all structures.
4. What is the relationship between poverty and the presence of children ages five and under?
a. Children living in households with children ages five and younger will have higher poverty rates than other children. b. Reductions in poverty among children living in households with children ages five and younger will be greater than reductions among other children.
a. Hypothesis supported in all three countries. b. Hypothesis not supported in any country.

75
Chapter Five: Discussion
This study analyzes representative samples of children in Canada, the United
Kingdom, and the United States in order to comparatively examine child poverty
reduction efforts. The relationship between family structure and pre-transfer child
poverty rates and the relationship between family structure and post-transfer child
poverty rates are examined. The proportion of poverty reduced through universal
transfers, taxes, means-tested benefits, and near-cash benefits was also examined across
family structures. Finally, child poverty and poverty reduction are examined, comparing
households with children ages five and younger and households with children over five.
A better understanding of how child poverty reduction efforts differentially impact
various family structures can help policymakers more appropriately target such efforts to
achieve their policy goals. Further, in an increasingly global economy, comparative
studies could be useful to inform innovations in social policy. Rather than aiming to alter
family structures, however, policy efforts to reduce child poverty should support various
family structures in their needs to both earn and provide care for children.
In examining the relationship between pre-transfer child poverty and family
structure, single parent structures often have higher pre-transfer child poverty rates than
their two-parent counterparts. Findings indicate that, before taxes and transfers, the
United Kingdom has the highest overall child poverty rate (34.8%) and Canada has the
lowest (24.2%). Within Canada, children in single mother families have the highest pre-
transfer poverty rate (65.9%), while children in two-parent families have the lowest
(20.1%). In the United Kingdom, the pre-transfer child poverty rate also was highest for
single mother families (85.9%) and lowest for two-parent families (25.5%). Likewise,

76
American children have the highest pre-transfer poverty rate in single mother families
(70.0%) and the lowest in two-parent families (20.7%). However, high pre-transfer
poverty in the United Kingdom may be, in part, due to low labor force participation
among single parents (Rainwater & Smeeding, 2003). High pre-transfer child poverty
rates across all three countries are consistent with their welfare state typology (Esping-
Anderson, 1990), which favors reducing poverty through means-tested benefits, rather
than through labor market regulations such as a “living” minimum wage. While this
study’s data for the United Kingdom (1999) indicate high pre-transfer poverty, recent
efforts over the last seven years to increase job opportunities, strengthen work supports,
and raise the minimum wage will likely distinguish the United Kingdom from Canada
and the United States in comparative analyses of future data (Brewer, Goodman, Shaw, &
Sebeita, 2006; Department for Work and Pensions, 2006; Micklewright, 2004; Minoff,
2006; Piachaud & Sutherland, 2002). Consistent findings regarding the low market
incomes of single parent family structures, especially those headed by women, imply that
policies must aim to support the caregiving or work functions of these families in order to
improve their well-being.
It was hypothesized that pre-transfer child poverty will be higher among single
parent structures than two-parent structures. In regards to both single mother and single
father families, this hypothesis is supported in all three countries. This supports the idea
that the demands of childrearing and working are more easily balanced by two adults,
whereas parenting alone hinders one’s market earnings (Dickman, 2003; Pressman, 2003;
Sigle-Rushton & Waldfogel, 2004). This finding speaks to the importance of developing
work policies that support the difficult task of work/family balance. In regards to single

77
grandmother structures in the United Kingdom and single grandfathers in the United
States, the hypothesis is not supported, as these groups have lower pre-transfer poverty
rates than their two-parent counterparts. This exception is unexpected, due to typically
low market incomes among older adults who have retired or reduced their work hours
(Smeeding & Sandstrom, 2004). Grandparent age, gender, employment status, and assets
may be important factors in determining pre-transfer poverty risk within these two groups
and should be explored in future research (Casper & Bryson, 1998; Smeeding &
Sandstrom, 2004).
The relationship between child poverty rates and family structure were examined.
After taxes and transfers, Canada (14.9%) and the United Kingdom (15.3%) have lower
child poverty rates than the United States (21.9%). In Canada, children living with single
mothers are most likely to be in poverty (41.2%), while children living with two parents
or single fathers have substantially lower poverty rates, at 11.7% and 12.1% respectively.
Differences in Canada indicate the role of gender in poverty risk, which may be
attributable to a number of factors such as wage disparities, labor force opportunities,
social exclusion, childrearing responsibilities, and low wages (Townson, 2005). Children
in single mother (36%) and single father families (31%) in the United Kingdom have the
highest rates of poverty. Poverty rates for children living with two-parent grandparent
families in the United Kingdom are lowest (3.9%), while poverty among children in
single grandfather families was eliminated with taxes and transfers. Poverty risk in the
United Kingdom seems to be related to age, with families headed by grandparents,
especially those with men present, fairing better than families headed by parents. This
may point to the strength of old-age policies that are attached to labor force participation.

78
In the United States, single mother families (55.4%) and single grandmother families
(42.8%) have the highest child poverty rates, while two-parent families (17.3%) and
single grandfather families (19.9%) have the lowest. In the United States, poverty risk
seems to be related to an intersection of single parent status and gender, with children
with single mothers and single grandmothers fairing the worst. This observation may be
due to reduced labor force opportunities for women, childrearing responsibilities, less
income via pensions, and fewer assets (Orloff, 1993, as in Moller & Misra, 2005;
Pressman, 2003; Sigle-Rushton & Waldfogel, 2004; Smeeding & Sandstrom, 2004).
Therefore, policy efforts aimed at reducing child poverty must address wage disparities,
workplace discrimination, and underemployment for women, as well as childcare or
family leave initiatives.
It was hypothesized that child poverty is higher among single parent structures
than two-parent structures. The hypothesis was supported for single mother and single
grandmother families across all three countries. The hypothesis was not supported for
single grandfathers in the United Kingdom and the United States, whose child poverty
rates are slightly lower than two-parent grandparent families. Children living with single
fathers in Canada have poverty rates slightly greater than those living with two parents,
but substantially lower than those in single mother families. Children living with single
grandfathers in the United States have slightly lower poverty rates than children living
with two grandparents. These findings suggest that having a male caregiver functions as
a protective factor for children, which supports previous assertions that women are more
vulnerable to poverty. This gendered outcome may be due to reduced earning
opportunities, primary parenting responsibilities, labor market participation, and

79
employment in low-wage jobs for women (Orloff, 1993 as in Moller & Misra, 2005;
Pressman, 2003; Rainwater & Smeeding, 2003). Findings also suggest that single parent
status complicates the family function of providing necessary resources for children and
thus, avoiding poverty (Dickman, 2003; Pressman, 2003; Sigle-Rushton & Waldfogel,
2004; LIS, 2005).
The extent to which social benefits redistribute income and reduce child poverty
in various family structures was examined. Through a combination of universal transfers,
taxes, means-tested benefits, and near-cash benefits, the United Kingdom reduces child
poverty by the largest proportion (56%), followed by Canada (38.4%) and the United
States (20.1%). In Canada, child poverty is reduced by 41.8% in two-parent families,
37.5% in single mother families, and 48.1% in single father families. In the United
Kingdom, child poverty is reduced by 56.5% in two-parent families, 58.1% in single
mother families, 50.7% in single father families, 90.2% in two-parent grandparent
families, 62.1% in single grandmother families, and 100% in single grandfather families.
In the United States, child poverty is reduced by 16.4% in two-parent families, 20.9% in
single mother families, 13% in single father families, 41.2% in two-parent grandparent
families, 28.7% in single grandmother families, and 35.6% in single grandfather families.
It is remarkable how little child poverty is reduced through income redistribution in the
United States, in comparison with Canada and the United Kingdom. In the context of
other industrialized, wealthy countries, the U.S. reductions are even more distinct (LIS,
2006; Smeeding, 2004, 2005, 2005b). These small values reiterate the suggestion that
income redistribution in the United States is an extreme outlier in comparison to other
wealthy, industrialized countries in its poverty alleviation efforts, redistributing far less

80
income to the poor (Smeeding, 2005b). Moreover, these findings lend support to
previous suggestions that single mothers in the United States are not the beneficiaries of a
large proportion of antipoverty spending (Heuveline & Weinshenker, 2006). Women’s
historical roles as unpaid laborers and caregivers continue to disadvantage women in the
form of wage disparities and reduced opportunities. These inequalities disadvantage
children living with single women more than children in any other family structure.
In regards to income redistribution, three hypotheses were examined. First, it was
hypothesized that reductions in poverty will be greatest among grandparent-headed
structures, followed by single parent structures, then two-parent structures. The
hypothesis that children in any grandparent families experience larger reductions than
non-grandparent families is supported. Within grandparent-headed families, reductions
among single grandfather families and single grandmother families are smaller than two-
parent grandparent families in the United States. Compared to two-parent grandparent
families in the United Kingdom, reductions for single grandmother families are smaller
and reductions for single grandfather families are larger. In both the United Kingdom
and United States, however, children living with single fathers had smaller reductions
than two-parent families, while children living with single mothers had larger reductions
than two-parent families. Compared with two-parent families in Canada, reductions for
single father families are greater and reductions for single mother families are smaller.
This finding may illuminate the ways in which benefits are directly tied to work in
Canada (Lightman & Riches, 2000). Second, it was hypothesized that income
redistribution for single parent structures does not reduce child poverty to levels
comparable to two-parent structures. This hypothesis is supported across all structures,

81
except for single grandfather families in the United Kingdom and the United States. This
finding suggests that being older and being a male may reduce risk for poverty in the
United Kingdom and the United States, while being older and being a female increases
poverty risk (Smeeding & Sandstrom, 2004). This observation may reflect both strong
social policies for elders and social benefits and social insurance that are tied to the labor
market in these countries, and a gender gap among older adults (Smeeding & Sandstrom,
2004). Finally, it was hypothesized that income redistribution will reduce child poverty
by the smallest proportion in the United States. Canada and the United Kingdom reduce
child poverty by substantially larger proportions than the United States across all family
structures, therefore this hypothesis is supported. These findings are congruent with
other research that has shown that the United States has the least effective means of
poverty alleviation of any industrialized, wealthy country (Smeeding, 2004; Smeeding,
2005b).
Canadian efforts to reduce child poverty consist largely of redistributive taxes,
while child poverty alleviation efforts in the United Kingdom are achieved through
generous means-tested and near-cash benefits. The United States’ attempt at income
redistribution varies by family structure, but child poverty is most reduced through taxes
and means-tested transfers. This finding differs from analyses of an earlier wave of LIS
data (1994-1997), in which the United States redistributed most income using universal
transfers (Smeeding et al., 2001; Smeeding & Ross-Phillips, 2001). In the present study,
income for children in two-parent families was reduced by universal transfers, which
differs from research that suggests that taxes reduce incomes among children in two-
parent families in the United States (Lino, 1995). Moreover, previous research that

82
suggests that transfer programs in the United States raise incomes for children in single
parent families (Lino, 1005) is not supported in this study for children living with single
fathers. Overall, the most successful child poverty reductions in Canada and the United
States range from 25 to 30%, while the United Kingdom makes many reductions ranging
from 40 to 100%. These findings are supportive of liberal welfare state characteristics
(Esping-Anderson, 1990), which help the poor through means-tested assistance, while
the non-poor more likely rely on the market.
Differences in pre and post-transfer child poverty rates between children in
households with children five and under and children in households without children five
and under were examined. Children living in households with at least one child age five
or younger have higher pre-transfer and post-transfer poverty rates than children in
households without a child five and younger in Canada, the United Kingdom, and the
United States. In Canada, the child poverty rate in households with children five and
under is 18.1%, compared with a rate of 12.4% in households with children older than
five. In the United Kingdom, 20.4% of children living in households with children five
and under are in poverty, while 10.9% of children in households with children older than
five are in poverty. In the United States, the child poverty rate in households with
children five and under is 25.8%, while the rate for households with children older than
five is 18.1%. Findings indicate that child poverty is greater among children who live in
households with young children in all six family structures and in all three countries.
Additionally, income redistribution reduces child poverty by a greater extent
among children who live in households with no children who are five and younger. It
was hypothesized that children living in households with young children have higher

83
poverty, which is supported by the data across family structures in all three countries.
These findings support previous research that suggests that risk for child poverty
diminishes as a child ages (Douglas-Hall, Chau, & Koball, 2006). Younger children
may be more likely to be in poverty because parents may reduce their work hours, and
thus their earnings, to care for a young child. Parents of younger children are also more
likely to be young themselves, resulting in lower earnings and fewer assets than older
parents with older children. Additionally, high costs associated with young children,
such as car seats, diapers, child care, and formula, may increase expenditures for
families. Risks for young children increase with teen parenting, single parenting,
maternal depression, and low levels of skills and education (Knitzer & Lefkowitz, 2006).
The United States, in particular, has the poorest work supports, such as a low minimum
wage, underfunded and unavailable child care subsidies, and no paid parental leave
assurance (Ewen & Matthews, 2007; Gornick & Meyers, 2003; Nelson, 2004; Smeeding,
2004). Thus, the United States having the highest child poverty rate for children in
households with children five and under among all three countries may not be surprising.
Given the known vulnerability of young families and the greater strain between work
and childrearing responsibilities they experience, income redistribution and other social
supports should be increasingly targeted towards these most vulnerable families.
Comparing children in households with children under five and children in
households without children under five, differences in proportions of child poverty
reduced through income distribution were examined. In all three countries, the
proportion of poverty reduced through universal transfers, taxes, means-tested transfers,
and near-cash benefits was greater for children in households without children five and

84
under. In Canada, child poverty was reduced by 34.7% in households with children five
and under, compared with a reduction of 42.3% for households without children five and
under. In the United Kingdom, child poverty was reduced by 49.6% in households with
children five and under, while children in households without children five and under
experience a 62.8% reduction. In the United States, children in households with children
five and under experience a 17.3% reduction in poverty, compared with a 23.9%
reduction for children in households without children five and under. It was
hypothesized that reductions in poverty among children living in households with young
children are greater than reductions among children living in households with children
six or older. This hypothesis is not supported by the data in any country. Given weak
familialization and defamilialization policies in Canada, the United Kingdom, and the
United States (Gornick & Meyers, 2003; Leitner, 2003; Moller & Misra, 2005), the lack
of supports for caregiving or relief from caregiving are not surprising. This lack of
support results in the redistribution of less money and fewer benefits to families with
young children, who have the greatest caregiving needs and greatest conflict between
work and family responsibilities.
Policy Implications
Clearly, the United States is less successful in addressing child poverty than
Canada, the United Kingdom, and most other industrialized countries (Smeeding,
2005b). Various family structures do experience differential pre-transfer child poverty
rates, income redistribution, and post-transfer child poverty rates within each examined
country. The findings of this study suggest that single parents, households with young
children, and women face extensive and critical challenges in earning enough income to

85
move their children out of poverty in all three countries. Furthermore, in the United
States, these groups are receiving barely perceptible amounts of assistance from the
government to move out of poverty (Kenworthy & Pontusson, 2005; Smeeding, 2004,
Smeeding, 2005b). Among vulnerable groups, such as single mothers in Canada, single
parents in the United States, and households with children ages five and younger, income
redistribution is smaller than that afforded to less vulnerable groups with smaller
representation in the poverty population and higher market incomes, such as two-parent
households and households with no children ages five and younger.
Demographic solutions. The overrepresentation of particular groups in the U.S.
poverty population has led to a number of policy solutions based in demography. The
number of adults in a household is one of the most salient factors in assessing child
poverty and income redistribution (Fields & Smith, 1998; Lerman, 2002). Single
parenting is an oft-mentioned condition when examining which children are poor and
what policies are best suited to address poverty. Two-parent families generally have
more resources and more choices in regards to balancing childrearing with work. The
presence of two parents, whether in a single or dual earner household, increases the odds
that parents can meet the resource needs of children and avoid poverty (Dickman, 2003;
Pressman, 2003; Sigle-Rushton & Waldfogel, 2004). Institutions and policies that are
modeled around the breadwinner-homemaker family afford privileges to children in two-
parent families (Abrahamson & Wehner, 2006). Additionally, the prevalence of dual
earner households has likely raised household income and standards of living, possibly
increasing economic distance between single and two-parent families. Conflicts between

86
needing to earn income to provide resources to children and providing care for those
children gives single parents few means of avoiding poverty.
An obvious and widely purported solution to the risks associated with single
parenting is to encourage marriage. In the United States, a central policy goal of the
Personal Responsibility and Work Opportunities Reconciliation Act (PROWRA) of 1996
is to promote strong marriages in order to fight poverty. A portion of the funds
dedicated to welfare is used for activities that promote marriage among low-income
adults in hopes of reducing the prevalence of single mother families and thus, poverty
among children living with single mothers. This policy advances the perceived
importance of family structure over family function by attempting to alter structures and
reshape them to emulate the family type perceived as most ideal. Labor market
institutions and PROWRA provide rewards to normative structures, while denying
rewards for the undesired behavior of single parenting. Of the many analyses of the
impact of welfare reform on family formation choices, child poverty reduction, and other
outcomes, PROWRA’s substantial reforms have resulted in small impacts on marriage,
childbearing, and children’s school and health outcomes (Blank, 2007). This outcome
greatly calls into question the wisdom and antipoverty effectiveness of spending focused
on individuals’ private and complicated marriage and childbearing decisions.
While children in two-parent families are clearly afforded economic advantages,
marriage promotion policies and spending are of questionable effectiveness. The
availability of marriageable males, relationship stability, intimate partner violence,
unemployment, and paternity are just a few potential shortcomings of marriage as a
poverty solution. Additionally, family researchers have long assumed the perspective

87
that family functioning is more important to child well-being than family structure
(Kingsbury & Scanzoni, 1993). Why, then, are child poverty policies in the United
States aiming to address structures rather than functions? As Heuveline & Weinshenker
(2006) suggest, “policymakers have more control over welfare and labor market
regulation than they do over individual adults’ family formation and living arrangement
decisions.” Assumptions that differences between married and unmarried people are
solely attributable to the marriage itself ignore the problems of selectivity, imply
causation erroneously, and excessively simplify the complex role of economic and
structural forces in child poverty. Moreover, the assumption that the act of marriage will
alleviate the disadvantages associated with unmarried parenting is unrealistic (Acs &
Nelson, 2004). With child poverty at profoundly higher levels in the United States than
in other industrialized, wealthy countries, researchers, practitioners, and citizens should
be compelled by the data to question marriage promotion as an effective and logical
poverty solution.
This study demonstrates a gender gap in child poverty, with single grandfather
families better off than single grandmother families and single father families better off
than single mother families in each country. The disparate earning potential for men and
women and the employment of women in low-wage, secondary labor force jobs
(Rainwater & Smeeding, 2003) point to problems with gender equality and wage parity.
Gender-based wage disparities are problematic in and of themselves, but given the
likelihood that children raised by single parents are raised by women, this market
inequality between men and women substantially impacts children. If policymakers are

88
sincere about reducing child poverty, gender disparities in labor force opportunities and
earnings must be addressed.
Demographic characteristics such as age, family structure, and gender, should not
be thought of as causes of higher child poverty in the United States (Bradbury & Jäntti,
2001; Rainwater & Smeeding, 2003; Smeeding, 2004). Rather, demographic
characteristics are markers of inequality, while market income and poor redistribution
explain cross-national differences in poverty (Iceland, 2003b, Rainwater & Smeeding,
2003). Because immutable or enduring demographic characteristics have less to do with
high child poverty in the United States than alterable welfare policies and labor market
institutions, policy interventions aimed at reducing child poverty, such as those
strengthening welfare and reducing market inequality, could be very effective in the
United States (Heuveline & Weinshenker, 2006). Race, a demographic characteristic
associated with intolerably great disparities in the United States, compounds the
structural disparities discussed in this study. Effective child poverty solutions must also
address the substantial differences in economic and social opportunities faced by both
children and parents of some racial/ethnic groups.
Work-based solutions. In countries with small redistribution packages and
policies strongly oriented towards encouraging labor force participation, including
Canada, the United Kingdom, and the United States, policymakers tie social benefits to
the labor market. The effectiveness of work-based policy solutions varies greatly, and
should be examined carefully. An emphasis on work in the United States, including
welfare time limits and work requirements, tax credits associated with earnings, and
social benefits tied to labor force participation, is predicated upon assumptions about the

89
impact of work on child poverty. The basic idea is that, if low-income parents are
moved into the labor force or encouraged to work more, the subsequent earnings and
work-related benefits will lift them out of poverty. Yet, researchers have shown that
income redistribution in the United States reduces child poverty by only ten percent
among parents working at least 1000 hours annually (Smeeding, 2004a). Moreover,
low-income working parents in the United States work more hours and receive fewer
benefits than their counterparts in other industrialized countries (Osberg, 2002;
Smeeding, 2004; Smeeding, 2005b). They also have lower relative incomes than low-
income families in other industrialized countries (Mayer, 1996). These findings suggest
that low earnings and small benefits, rather than insufficient work hours, contribute to
child poverty in the United States. In Canada, the movement of mothers into work has
had similar shortcomings, where the wages earned are not adequate to cover the costs
associated with work (Mason, 2003; Walter, 2002). Therefore, market income
inequalities in the United States render work as a sole policy solution to child poverty
ineffective. Only when work is coupled with adequate wages and/or income
supplementation, child care support, and needed benefits can it help reduce child poverty
in a country with such substantial market inequality.
Obviously, families with no earners are more likely to be in poverty than families
with one or two earners. In the United Kingdom, 24.8% of households have no earner,
compared with 7.3% in Canada and 5.7% in the United States (Rainwater & Smeeding,
2003). Yet, the child poverty rates for children living in households with no earners are
50.4% in the United Kingdom, 78.7% in Canada, and 87.4% in the United States. Sixty-
two percent of American households have two earners and 32.2% have one earner.

90
Regarding welfare-to-work policy solutions, Rainwater and Smeeding (2003), ask, “why
does so much of the discussion of poverty policy in the United States revolve around
income maintenance for non-earner families, despite the fact that three-quarters of
American poor children live in families with workers?” This sentiment recognizes that
the rhetoric of welfare policy in the United States is overwhelmingly targeted to parents
who are not engaged in the labor force. Yet, poverty persists primarily among
households with parents who work.
The United Kingdom has experienced success in reducing child poverty,
primarily by moving parents into work. Efforts to reduce child poverty have centered
around three tactics: promotion of work among unemployed working-age adults,
increased cash benefits and tax credits for low-income children, and long-term
investments in reducing social inequalities and problems (Waldfogel & Hills, 2004).
New Deal programs instituted at the turn of the century, minimum wage standards, and
other new policies have helped the United Kingdom reduce child poverty by 17% within
the first six years. More than 370,000 previously unemployed parents joined the labor
force, which contributed substantially to the reduction in child poverty benefiting
700,000 children, despite a substantial increase in child poverty in 2005 (Brewer et al.,
2006; Department for Work and Pensions, 2006). Work supports have helped make
employment feasible and worthwhile to parents. But, the government also recognized
that a lack of work opportunities or an inability to work requires additional welfare
provisions to protect families from poverty.
Contrarily, the United States’ emphasis on work has manifested underwhelming
and mixed results, with fewer single mothers moving into the labor force and smaller

91
reductions in child poverty than those experienced in the United Kingdom (Waldfogel &
Hills, 2004). While the 1996 welfare reform did increase employment among welfare
recipients, employment failed to raise household incomes among welfare leavers enough
to move out of poverty (Micklewright, 2004; Perrott & Sherman, 2006). Time limits on
welfare receipt ensure that families will leave welfare programs, but certainly do not
ensure that families move out of poverty. This approach to welfare, which emphasizes
shrinking welfare roles over improving family and child well-being, seems to ignore the
many insurmountable barriers faced by low-income families in moving out of poverty.
In an assessment of the goals of social policies aimed at poverty reduction, the United
States has achieved a decrease in welfare receipt, while simultaneously experiencing an
increase in child poverty (Perrott & Sherman, 2006). This outcome poses a challenge to
the United States’ work-based approach, given that work does not pay for parents or
children. It seems that raising market income, rather than decreasing transfers and
welfare receipt, is more likely to generate the desired outcome (Bradbury & Jäntti,
2001). Moreover, work prospects for low-skill workers are limited, and parental leave
and childcare supports are weak, inaccessible, or nonexistent (Gornick & Meyers, 2003),
especially among low-wage workers (Hofferth, 2000). Two million children in the
United States are living with single mothers who are neither working, nor receiving
welfare (Perrott & Sherman, 2006). Clearly, this approach is not improving child well-
being, exposing a fundamental problem with the goal of American welfare policies,
which are oriented towards reducing social spending rather than reducing poverty and
helping children.

92
While encouraging parents to work is a reasonable and potentially effective
strategy to reduce child poverty, policies must also address barriers to work, provide
work supports, and make the benefits of work outweigh the costs. Market incomes must
be substantial enough to afford the expenses associated with work, such as child care and
transportation. They must also be large enough that the loss of welfare benefits is
recovered through wages. In addition to a “living” minimum wage, policies such as
parental leave and child allowances support parents’ pursuits of work outside of their
homes.
Policy barriers and needs in the United States. The United States is in need of a
more effective approach to alleviating child poverty than the punitive, short-term, and
insular approach taken since welfare reform (Waldfogel & Hills, 2004). Currently, the
combination of high pre-transfer inequality and poor work supports and income
redistribution disadvantages low-income children, leaving them substantially worse off
than their counterparts in other wealthy nations (Rainwater & Smeeding, 2003;
Smeeding, 2005b). The lack of both labor market regulations to reduce income
inequality and social policies to redistribute income results in high poverty for American
children (Gornick & Meyers, 2003; Nelson, 2004; Smeeding, 2005b). In order to reduce
child poverty, the United States must address at least one of these problems.
Possible actions to address child poverty in the United States include increasing
spending on redistributive programs, strengthening familialization or defamilialization
policies, or addressing pre-transfer inequality. The United States spends less on social
programs than all other wealthy nations, and its social spending is a very small portion of
overall spending (Smeeding, 2004; Waldfogel, 2004). Moreover, inequality is

93
increasing, as low spending remains the same (Kenworthy & Pontusson, 2005).
Increased spending would help alleviate the poverty created by high pre-transfer
inequality by redistributing money needed by vulnerable groups. Redistribution should
be especially directed towards children living with single parents and households with
young children. Providing paid parental leave or child allowances, which are
conspicuously absent in the United States (Rainwater & Smeeding, 2003), would support
parents in their efforts to meet their caregiving responsibilities. Providing appropriately
administered and funded child care subsidies would alleviate parents’ caregiving
responsibilities and help them maintain income through work. In absence of universal
early care or preschool, families with young children need additional assistance to
maintain work. High pre-transfer inequality could be addressed through strengthened
labor market regulations, including a higher minimum wage and better benefits for
secondary labor force workers. Workplace discrimination and wage disparities must
also be addressed.
Critics of increased antipoverty spending may suggest that antipoverty spending
and standards of living among the poor are already too high (Rector & Johnson, 2004;
Rector, Johnson, & Youssef, 1999). Others suggest that government spending on
income redistribution is harmful to economic growth and contrary to the American way
(Alesina & Rodrik, 1994; Perotti, 1996), despite evidence that low social spending for
the poor reduces the economic, and arguably, social well-being of all Americans (Lobao
& Hooks, 2003). Widely held beliefs about equality of opportunity, individualism, and
welfare result in a lamentable tolerance of child poverty and low public support for
increased social spending (Micklewright, 2004; Redmond et al., 2002, as in

94
Micklewright, 2004). These opinions, rather than a critical comparative analysis of
inequality and antipoverty efforts in the United States, drive policymakers’ decisions to
continue to reduce social spending and not support or fund effective social program
models. While family structure itself is currently a point of policy intervention, it is
clear that feasible, sincere efforts to reduce child poverty must help families perform
their earning and childrearing functions.
This study does not explicitly address race, despite the centrality of race in the
issue of inequalities in the United States. The observed disparities in child poverty rates
based upon structural characteristics were wide in this study, yet examining data by race
would likely reveal even wider inequalities among children. Family structures and
family formation patterns, economic and educational opportunities, and risk for poverty
all vary by race, with blacks, Latinos, and Native Americans experiencing
disproportionately more social exclusion than whites and Asians. The intersection of
race and structural characteristics would undoubtedly reveal an even greater prevalence
of child poverty for families with young children, single mother families, and single
grandmother families than that observed among disadvantaged family structures alone.
This cumulative disadvantage faced by particular racial groups is a critical factor in
communicating the scope of the problem of child poverty in the United States, as well as
in improving policies to reduce child poverty.
With the widely held beliefs in equality of opportunity and individualism in the
United States, disparities faced by racial minorities are often attributed to non-normative
behaviors. Thus, the negative sanctions experienced by such individuals may seem
somehow justified and unalterable with policy interventions. Yet, the indisputable

95
innocence of children for their economic status should incite a sense of moral obligation
to increase opportunities for children, ensure their well-being, and meet their basic
material, social, educational, and developmental needs. In order to do this, antipoverty
policies must be improved to help support parents in their critical roles as caregivers and
providers, while discrimination and inequalities are also addressed.
The problem of race-based inequalities is perhaps greater now than in decades
past, if only because many policymakers, employers, and citizens actively deny the
existence of racial inequalities and unknowingly, passively, or untraceably practice racial
discrimination. Moreover, the denial of the importance of race in social and economic
inequalities functions to perpetuate them. In order to be effective, antipoverty policies
require recognition of racial inequalities and must provide long-term solutions to address
these and other disparities.
In examination of the small scope and relative ineffectiveness of welfare policies
in the United States, the tacit acceptance of child poverty is unmistakable. Rather than
decreasing inequality and redistributing resources from wealthy to low-income families,
social policies in the United States clearly and continually provide additional advantages
to the wealthy over those already afforded by the market. In addition to the lack of
effective social policies supporting low-income families, political and economic
institutions perpetuate an abundance of conditions that continually advantage the
wealthy, aiding in the compounding and intergenerational transmission of wealth.
Already wide inequalities are increasing in the current political climate, in which
policymakers have eliminated estate taxes on the wealthy and passed unaffordable tax
cuts for the wealthy, effectively flattening tax rates and reducing what little redistribution

96
previously took place via taxes. Additionally, free trade policies, the weakening of labor
unions, and market deregulation have provided a “business-friendly” environment in
which business owners and investors can compound their wealth. These same conditions
decrease job security and keep wages and benefits low for employees. Beyond
economic advantages, social and educational privileges are also disproportionately
afforded to the wealthy.
The cumulative advantages given to the wealthy, contrasted with the cumulative
disadvantages experienced by the poor, create ever-widening disparities and reduce
opportunities for future generations of children in low-income families. Since
intergenerational transfers of both wealth and poverty undermine the believability of
equality of opportunity, policy interventions on the issues of poverty and inequality are
imperative to develop a fair and functioning society. Before reasonable, data-based
policy solutions can be proposed, discussed, and tested, citizens and policymakers must
acknowledge the problem of child poverty and income inequality and agree that the
problem is intolerable and worthy of policy intervention. With relatively inexpensive
investments in children and families, the problem of child poverty is amendable. The
changes required to address gender and racial discrimination, work-family conflicts, and
other social problems may require a longer-term investment, but are morally imperative
and fundamental to a functioning democracy. Rather than allowing continued inaction
on the issue of child poverty and increasingly punitive welfare in the United States,
researchers and advocates need to bring attention to the shortcomings of current policy
approaches. Policymakers may then acknowledge family structure as a challenge, but
use family functions to formulate effective policy solutions.

97
Limitations
This study has several key limitations, including omitted variables, the use of a
relative measure of child poverty to measure policy effectiveness, and the collection and
harmonization of national data into an international dataset.
The complexity and scope of comparative poverty and policy analysis suggests a
likelihood of unanalyzed variables confounding the relationships among the examined
variables. The impact of omitted variables, various individual-level controls, such as
parental age, education, and employment status, and country-level controls such as
economic and labor market characteristics, may be substantial, but are not explicitly
examined in this study. Other factors may include cultural capital, geography, state or
provincial policies, and local economic and educational opportunities. This study also
does not examine the role of private charity, irregular gifts, or other sporadic sources of
income. The presence of individuals who are eligible for but not receiving various
benefits, due to circumstances such as social stigma or transportation and health
problems, may result in an underestimation of the effectiveness of policies in reducing
child poverty.
This study does not consider consumption patterns or level of need beyond the
number of adults and children in a household. Failing to consider consumption and need
in determining poverty status may not entirely capture the financial well-being or risk of
individual families. Moreover, differences in standard of living, cost of living, and
consumption among various regions and countries may somewhat limit comparability.
This study only uses a relative poverty measure based upon household income.
The use of a relative measure, rather than absolute or quasi-relative measures, may be

98
criticized for its apparent inflation of child poverty. Thus, in a wealthy country with a
high standard of living, relative poverty does not indicate that people are necessarily
unable to meet basic needs, rather that they face social exclusion or limited
opportunities. While a relative measure is dependent upon the income distribution and
standard of living in each country, it is most useful in making cross-national
comparisons and reflects the conventions of comparative researchers (Smeeding, 2005b).
Some critics of relative measures suggest that poverty reduction efforts should aim to
provide for low-income children’s basic material needs and that their status relative to
other children is irrelevant (Rector & Johnson, 2004; Rector et al., 1999). Yet,
researchers have demonstrated that poverty in the United States is a larger problem than
in most of the wealthy countries participating in LIS, regardless of whether absolute or
relative measures are used (Smeeding, 2005b). The use of a single indicator of child
poverty in this study, however, also has limitations. There is a chance, for example, that
policies may effectively reduce income inequality, but these improvements would not
necessarily be reflected in relative poverty rates.
While the study aims to compare social benefits packages among countries, the
programs and policies themselves may vary widely. The extent to which families utilize
welfare programs, and provincial/state differences also vary. Recent policy changes in
each of the countries may also influence the relationship among the examined variables,
although the examination of each country’s policy changes and their impacts on poverty
over time was not included in this study. Data represent the financial circumstances of
respondents at one point in time, therefore, estimating poverty among households with
inconsistent or fluctuating income may be inaccurate. Because this study uses only the

99
most recent year of data available for each country, it cannot account for variation in
economic circumstances in each country over time. Countries with high inflation or
unstable social policies may be especially variable, although these factors are not thought
to influence the examined countries significantly.
In this study, family structure is determined by marital/couple status, relationship
of household head to the child, and gender. This definition allows for other adults to be
present in households. In some cases, additional adults may help lower costs in the
household and contribute to child-rearing or financial responsibilities of the parent. In
other cases, an additional adult may be a child age 18 or older or other dependent,
increasing costs for the household head. In the United States, about a third of children
living with single mothers also live with another non-parent adult, but this presence is
not thought to reduce child poverty (Rainwater & Smeeding, 2003). The presence of
additional adults who are not parents of the household’s children, nor partners of the
household head, is not analyzed. Cohabiting and married adults are not examined
separately due to the aggregation of these two groups in the dataset, however research
has shown differences in poverty risk among these two types of two-parent families (Acs
& Nelson, 2007; Lerman, 2002). In order to further examine the utility of marriage,
rather than the presence of two parents regardless of their marital status, child poverty
among children of married parents and cohabiting parents should be compared.
Additionally, children living in other family structures outside of the six examined in this
study, such as children in foster care or children living in the care of another relative, are
not examined. Differences between families headed by parents and those headed by
grandparents are conceived as differences that are attributable to policies benefiting
100
elders, however relationship to child, not age, is used to determine parent or grandparent
status. This method may result in some false attributions of family structure differences
to policies targeted towards elders, given that some grandparents may not be elderly
adults and some parents may be elderly.
Given its economic and descriptive examination of family structures, this study
does not provide implications about family processes or functions. It does not explore
the ways in which families navigate, use, and experience welfare programs, nor does it
explore how families negotiate conflicts between work and family. Additionally, while
this study examines the extent to which policies redistribute income and reduce the
number of children in poverty, it does not measure the effectiveness of these policies in
improving child outcomes.
Despite the detail and preeminence of the income data in the LIS dataset, there are
several limitations due to problems with availability and comparability of demographic
variables. First, this study does not use estimates of non-cash income and resources such
as education and health care, as the measurement of these resources is very difficult and
imprecise due to wide variations in availability and quality (Garfinkel et al., 2004).
These resources may improve well-being for low-income families, especially in the
United States where spending on in-kind benefits is comparably high to other social
spending for children, therefore their exclusion as a financial resource may limit the
findings of this study (Garfinkel et al., 2004). Second, while most of the variables are
appropriately harmonized, some variables such as race/ethnicity, are not comparable
from country to country. Nearly half of Canadian data on race are missing, and the
attributes for race/ethnicity are immigrant and non-immigrant. Additionally, data from

101
Canada do not allow for the identification of non-biological parents or other caretakers.
Therefore, grandparent households were not examined independently, but were instead
aggregated with single mothers, single fathers, and two-parent families. While
grandparents are thought to comprise a fairly small number of caregivers, comparisons
of characteristics of Canadian single mother, single father, and two-parent families with
those in other countries may have limited external validity.
Directions for Future Research
Because comparative analyses can be difficult due to different procedures adopted
by each participating country, an international committee of experts has published a
guide to household income data collection (Canberra International Expert Group on
Household Income Statistics, 2001). Using these recommendations, which provide a
common framework of variable definitions, countries can increase the comparability of
income and demographic data for use in international research. As new waves of data
from LIS are harmonized, problems with harmonization are likely to be reduced.
This study used a relative measure of child poverty as a single indicator of child-
well-being. Future studies should utilize quasi-relative measures, inequality measures,
and measures of social exclusion and opportunity to comparatively assess child well-
being. Analysis of income distribution across all four quartiles would help to illuminate
the ways in which children living in households across the income distribution benefit
from income redistribution. Moreover, education levels and work hours should be
analyzed in order to analyze disparities due to skills and level of employment. The
analysis of additional countries and additional waves of data may reveal useful policy
implications. Further examination of families with young children, cohabiting and

102
married two-parent families, and single parents with no other adults present could also
inform policy decisions. Because of the small sample sizes of grandmother, grandfather,
and two-parent grandparent structures, grandparent-headed families could be aggregated
in future studies, perhaps controlling for parent age and number of adults.
Due to the recent changes in social policy and welfare in the United Kingdom,
analyses of future waves of data may help assess the country’s progress towards its goal
to eradicate child poverty. This study was conducted using data from 1999 in the United
Kingdom and from 2000 in Canada and the United States. Given that the child poverty
reduction efforts in the United Kingdom began in 1999, future analyses of data from the
United Kingdom will likely reveal even greater antipoverty successes. Contrarily, in the
United States, inequality and poverty have likely increased since 2000, due to the tax
reforms benefiting the wealthy, substantial market deregulation, and decreased social
spending under the Bush Administration. Therefore, future analyses of data from the
United States will likely reveal greater child poverty and even smaller income
redistribution than that observed in this study. Researchers may also explore the
influence of new policies on income redistribution and economic conditions.
Conclusions
Using a comparative perspective, this study addresses the critical issues of income
redistribution and child poverty reduction in the United States and the differential impact
of such social policies on various family structures. Analyzing child poverty and income
redistribution in various family structures reveals a broad range of economic well-being
in different family structures. In addressing the effectiveness of policies oriented
towards changing family structures versus policies that support parents in performing

103
family functions, comparisons between welfare reforms in the United Kingdom and the
United States yield interesting implications. While both countries have some family
structures that are more vulnerable than others, the United Kingdom’s approach reflects
an attempt to correct inequalities among children and support parents’ pursuit of work.
Additionally, the recognition that work alone is not enough to alleviate poverty in a
country with high inequality led policymakers in the United Kingdom to provide a safety
net for low-wage workers and parents unable to work. Conversely, the United States’
welfare policies aim to change less desired family structures into two-parent families,
which seems to be unsuccessful in improving child well-being and reducing child
poverty. The use of structural functional theory helps to illuminate the ideas about
families upon which policies are designed, which advances the usefulness of policy
analyses. This study reinforces the perspective that, while structure may present
challenges to families and policymakers, the consideration and support of family
functions is likely to be a more effective means of policy intervention than changing
structures. This study uniquely contributes to the field of family science by using a
comparative economic lens to examine child poverty and income redistribution. Future
research in family science should include both economic and socio-behavioral studies in
order to expand knowledge around the experience of poverty and the use and
effectiveness of antipoverty policies.
Successful child poverty reduction efforts in other countries provide models after
which the United States may consider reforming its welfare policies. Policymakers
should consider the vulnerability of children living with single parents, single
grandmothers, and families with young children when targeting policies on the basis of

104
structural characteristics. Using other countries as examples, the United States can
improve its efforts to reduce child poverty and its negative impacts on children, families,
and society. Policymakers should consider a combination of three approaches: reducing
pre-transfer inequality, help families fulfill caregiving responsibilities by relieving them
of work, and help families fulfill work responsibilities by relieving them of caregiving.
In particular, child allowances, child care subsidies, and parental leave policies should be
considered in order to help parents fulfill necessary child-rearing functions and improve
the well-being of low-income children.

105
References
Abrahamson, P., & Wehner, C. (2006). Family and/or work in Europe? Journal of
Comparative Family Studies, 37, 153-171.
Acs, G., & Nelson, S. (2004). What do “I Do’s” do? Potential benefits of marriage for
cohabiting couples with children. Washington, D.C.: The Urban Institute.
Adamson, P., Micklewright, J., & Wright, A. (2000). A league table of child poverty.
Innocenti Report Card 1. Florence, Italy: UNICEF Innocenti Research Centre.
Administration for Children and Families. (2006). About ACF: ACF Mission. Retrieved
December 3, 2006, from http://www.acf.hhs.gov/acf_about.html#mission
Administration for Children and Families. (2007). The Healthy Marriage Initiative
(HMI). Retrieved March 25, 2007 from
http://www.acf.hhs.gov/healthymarriage/about/mission.html
Alessina, A., & Rodrik, D. (1994). Distributive politics and economic growth. Quarterly
Journal of Economics, 109, 465-490.
Arts, W.A. (2002). Three worlds of welfare capitalism or more? A state-of-the-art report.
Journal of European Social Policy, 12, 137-158.
Aquilino, W.S. (1996). The life course of children born to unmarried mothers: Childhood
livin arrangements and young adult outcomes. Journal of Marriage and the
Family, 58, 293-310.
Bales, R., & Slater, P. (1955). Role differentiation in small decision-making groups. In
T. Parsons & R. Bales (Eds.), Family socialization and interaction process (pp.
259-306). Glencoe, IL: Free Press.

106
Bennett, N.G., Bloom, D.E., & Miller, C.K. (1995). The influence of non-marital
childbearing on the formation of first marriages. Demography, 32, 47-62.
Blank, R. (2007). What we know, what we don’t know, and what we need to know about
welfare reform. Paper presented at Ten Years After: Evaluating the Long-Term
Effects of Welfare Reform on Children, Families, Work, and Welfare.
Lexington, KY.
Bradbury, B. & Jäntti. M. (1999). Child poverty across industrialized nations. Innocenti
Occasional Papers, Economic Policy Series No. 71. Florence, Italy: UNICEF
International Child Development Centre.
Bradbury, B., & Jäntti. M. (2001). Child poverty across 25 countries. In Bradbury, B.,
Jenkins, S.J., & Micklewright, J. (Eds.). The dynamics of child poverty in
industrialized countries (pp. 62-91). Cambridge: Cambridge University Press.
Brewer, M., Goodman, A., Shaw, J., & Sibeita, L. (2006). Poverty and inequality in
Britain: 2006. London: Institute for Fiscal Studies.
Canberra International Expert Group on Household Income Statistics. (2001). Expert
group on household income statistics: Final report and recommendations. Ottawa,
Canada: Author.
Casper, L.M., & Bryson, K.R. (1998). Co-resident grandparents and their
grandchildren: Grandparent maintained families. Washington, D.C.: United
States Census Bureau.
Children’s Defense Fund. (2004). Financial assistance for grandparents and other
relatives raising children. Paper prepared for Generations United’s Second
National Symposium on Grandparents and Other Relatives Raising Children.

107
Coleman, J.S. (1990). Commentary: Social institutions and social theory. American
Sociological Review, 55, 333-339.
Dalaker, J. (2001). Poverty in the United States: 2000. Washington, D.C.: United States
Census Bureau Current Population Reports.
DeLeire, T. & Kalil, A. (2002). Good things come in threes: Single parent
multigenerational family structure and adolescent adjustment. Demography, 39,
393-413.
Department for Work and Pensions. (2006). Making a difference. Tackling poverty: A
progress report. London: The Stationery Office.
Department of Human Resources and Social Development Canada. Policies and
programs. Retrieved December 3, 2006, from
http://www.hrsdc.gc.ca/en/gateways/nav/top_nav/ps.shtml
Department for Work and Pensions/Office of National Statistics. (2006). Family
Resources Survey: United Kingdom 2004-2005. London: Department for Work
and Pensions.
Dickman, N. (2003). Fertility and family income on the move: An international
comparison over 20 years. Syracuse, NY: Luxembourg Income Study Working
Paper Series.
Douglas-Hall, A., Chau, M., & Koball, H. (2006). Basic facts about low-income children:
Birth to age 18. Fact sheet from the National Center for Children in Poverty.
Retrieved from http://www.nccp.org/pub_lic06b.html

108
Driscoll, A.K., Hearn, G.K., Evans, V.J., Moore, K.A., Sugland, B.W., & Call, V. (1999).
Non-marital childbearing among adult women. Journal of Marriage and Family,
61, 178-187.
Dumon, W. (1988). The meaning of family policy in western Europe and the United
States. In D.M. Klein & J. Aldous (Eds.), Social stress and family development,
pp. 234-245). New York: Guilford.
Duncan, G.J., & Brooks-Gunn, J. (1997). Consequences of growing up poor. New York:
Russell Sage Foundation.
Duncan, G.J., Brooks-Gunn, J., & Klebanov, P.K. (1994). Economic deprivation and
early childhood development. Child Development, 65, 296-318.
Edwards, O.W., & Daire, A.P. (2006). School-age children raised by their grandparents:
Problems and solutions. Journal of Instructional Psychology, 33, 113-119.
Esping-Anderson, G. (1990). The three worlds of welfare capitalism. Princeton, NJ:
Princeton University Press.
Esping-Anderson, G. (1999). Social foundations of postindustrial countries. New York:
Oxford University Press.
Ewen, D., & Matthews, H. (2007). Families forgotten: Administration’s priorities put
child care low on the list. Washington, D.C.: Center for Law and Social Policy.
Fagan, P.F. (1999). How broken families rob children of their changes for future
prosperity. Washington, D.C.: The Heritage Foundation.
Fagan, P.F., Rector, R.E., Johnson, K.A., & Peterson, A. (2002). The positive effects of
marriage: A book of charts. Washington, D.C.: The Heritage Foundation.

109
Fagan, P.F., Rector, R.E., & Noyes, L.R. (2003). Why Congress should ignore radical
feminist opposition to marriage. Washington, D.C.: The Heritage Foundation.
Fields, J.M., & Smith, K.E. (1998). Poverty, family structure, and child well-being:
Indicators from the SIPP. Washington, D.C.: Population Division, United States
Census Bureau.
Fuller-Thompson, E. (2005). Canadian first nations grandparents raising grandchildren:
A portrait in resilience. International Journal of Aging and Human Development,
60, 331-342.
Fuller-Thompson, E., & Minkler, M. (2000). America’s grandparent caregivers: Who are
they? In B. Hayslip, Jr., & R. Goldberg-Glen (Eds.), Grandparents raising
grandchildren: Theoretical, empirical, and clinical perspectives (pp. 3-21). New
York: Springer.
Garfinkel, I., Rainwater, L., & Smeeding, T. (2004). Welfare state expenditures and the
redistribution of well-being: Children, elders, and others in comparative
perspective. Syracuse, NY: Luxembourg Income Study Working Paper Series.
Goodman, C., & Silverstein, M. (2002). Grandmothers raising grandchildren: Family
structure and well-being in culturally diverse families. The Gerontologist, 42,
676-689.
Gornick, J.C. & Meyers, M.K. (2003). Families that work: Policies for reconciling
parenthood and employment. New York: Russell Sage Foundation.
Gottschalk, P., & Smeeding, T. (1997). Cross-national comparisons of earnings and
income inequality. Journal of Economic Literature, 35, 633-687.

110
Hardin, A., Clark, R., & Maguire, K. (1997). Informal and formal kinship care, Vol. 1:
Narrative reports. Washington, D.C.: United States Department of Health and
Human Services.
Heuveline, P., & Weinshenker, M. (2006). The international child poverty gap: Does
demography matter? Syracuse, NY: Luxembourg Income Study Working Paper
Series.
Hicks, A., & Kenworthy, L. (2002). Varieties of welfare capitalism. Syracuse, NY:
Luxembourg Income Study Working Paper Series.
Hofferth, S. L. (2000). Effects of public and private policies on working after childbirth.
In T. L. Parcel & D. B. Cornfield (Eds.). Work and family: Research informing
policy (pp. 131-160). Thousand Oaks, CA: Sage.
Hofferth, S. (1985). Children’s life course: Family structure and living arrangements in
cohort perspective. In G.H. Elder (Ed.), Life course dynamics: Trajectories and
transitions, 1968-1980 (pp. 75-112). Ithaca, NY: Cornell University Press.
Holman, T.B., & Burr, W.R. (1980). Beyond the beyond: The growth of family theories
in the 1970’s. Journal of Marriage and the Family, 42, 729-742.
Horney, J., Greenstein, R., & Kogan, R. (2005). What the President’s budget shows
about the administration’s priorities. Washington, D.C.: Center for Budget and
Policy Priorities.
Iceland, J. (2003a). Poverty in America: A handbook. Berkeley, CA: University of
California Press.
Iceland, J. (2003b). Why poverty remains high: The role of income growth, economic
inequality, and changes in family structure, 1949-1999. Demography, 40, 49-519.
111
Ingoldsby, B.B., Smith, S., & Miller, J.E. (2004). Exploring family theories, first edition.
Los Angeles: Roxbury.
Jäntti, M. & Danziger, S. (2000). Income poverty in advanced countries. In Atkinson,
A., & Bourguignon, F. (Eds.) Handbook of income distribution (pp. 309-378).
Amsterdam: North-Holland.
Jendrick, M.P. (1994). Grandparents who parent their grandchildren: Circumstances and
decisions. The Gerontologist, 34, 206-216.
Kenworthy, L., & Pontusson, J. (2005). Rising inequality and the politics of redistribution
in affluent countries. Perspectives on Politics, 3, 449-471.
Kingsbury, N., & Scanzoni, J. (1993). Structural-Functionalism. In Boss, P.G., Doherty,
W.J., LaRossa, R., Schumm, W.R., & Steinmetz, S.K. (Eds.), Sourcebook of
family theories and methods: A contextual approach (pp. 195-217). New York:
Plenum Press.
Knitzer, J., & Lefkowitz, J. (2006). Pathways to early school success: Helping the most
vulnerable infants, toddlers, and their families. Issue brief #1. New York:
National Center for Children in Poverty.
Kolberg, J.E., & Esping-Anderson, G. (1992). Welfare states and employment regimes.
In Kolberg, J.E. (Ed.), The study of welfare state regimes (pp.3-35). New York:
M.E. Sharpe.
Korenman, S., & Miller, J.E. (1997). Effects of long-term poverty on physical health of
children in the National Longitudinal Survey of Youth. In G. Duncan & J. Brooks-
Gunn (Eds.), Consequences of growing up poor (pp. 70-99). New York: Russell
Sage Foundation.

112
Leitner, S. (2003). Varieties of familialism: The caring function of the family in
comparative perspective. European Societies, 5, 353-375.
Lerman, R.I. (2002). Should government promote healthy marriages? Washington, D.C.:
The Urban Institute. Retrieved November 30, 2006 from
http://www.urban.org/publications/310499.html
Lichter, D.T., & Crowley, M.L. (2004). Welfare reform and child poverty: Effects of
maternal employment, marriage, and cohabitation. Social Science Research, 33,
385-408.
Lichter, D.T., & Jayakody, R. (2002). Welfare reform: How do we measure success?
Annual Review of Sociology, 28, 117-141.
Lightman, E.S., & Riches, G. (2000). Rom modest rights to commodification in
Canada’s welfare state. European Journal of Social Work, 3, 179-200.
Lino, M. (1995). The economics of single parenthood: Past research and future
directions. Marriage and Family Review, 20, 99-114.
Lobao, L. & Hooks, G. (2003). Public employment, welfare transfers, and economic
well-being across local populations: Does a lean and mean government benefit the
masses? Social Forces, 82, 519-556.
Logan, C., Moore, K.A., Manlove, J., Mincieli, L., & Cottingham, S. (2007).
Conceptualizing a “strong start:” Antecedents of positive child outcomes at birth
and intro early childhood. Washington, D.C.: ChildTrends.
Luxembourg Income Study. (2006). Luxembourg Income Study (LIS) Key Figures.
Retrieved December 26, 2006 from http://www.lisproject.org/keyfigures.htm

113
Luxembourg Income Study. (2005). Luxembourg Income Study (LIS) Key Figures.
Retrieved February 21, 2005 from http://www.lisproject.org/keyfigures.htm
Malone-Colon, L., & Roberts, A. (2006). Marriage and the well-being of African
American boys. New York: Institute for American Values.
Mason, R. (2003). Listening to lone mothers: Paid work, family life, and child care in
Canada. Journal of Children and Poverty, 9, 41-54.
Mayer, S. (1996). A comparison of poverty and living conditions in the United States,
Canada, Sweden, and Germany. In McFate, K., Lawson, R., & Wilson, W.J.
(Eds.) Poverty, inequality, and the future of social policy (pp. 109-152). New
York: Russell Sage Foundation.
Mayer, S. (2002). Parental income and children’s outcomes. Wellington, New Zealand:
Ministry of Social Development.
McLanahan, S., & Sandefur, G. (1994). Growing up with a single parent: What hurts,
what helps. Cambridge, MA: Harvard University Press.
McLeod, J.D., & Shanahan, M.J. (1993). Poverty, parenting, and children’s mental
health. American Sociological Review, 58, 351-366.
Micklewright, J. (2004). Child poverty in English-speaking countries. Syracuse, NY:
Luxembourg Income Study Working Paper Series.
Millar, J. (1996). Mothers, workers, and wives: Comparing policy approaches to
supporting lone mothers. In Bortolaia Silva, E. (Ed.), Good enough mothering?
Feminist perspectives on lone mothering (pp. 97-113). London: Routledge.
Minoff, E. (2006). The UK commitment: Ending child poverty by 2020. Washington,
D.C.: Center for Law and Social Policy.

114
Moller, S., & Misra, J. (2005). Familialism and welfare regimes: Poverty, employment,
and family policies. Syracuse, NY: Luxembourg Income Study Working Paper
Series.
Moore, K.A., Morrison, D.R., & Glei, D. (1995). Welfare and adolescent sex: The effects
of family history, benefit levels, and community context. Journal of Family and
Economic Issues, 16, 207-238.
Moore, K.A., & Redd, Z. (2002). Children in poverty: Trends, consequences, and policy
options. Washington, D.C.: ChildTrends.
Nelson, K. (2004). Mechanisms of poverty alleviation: anti-poverty effects of non-
means-tested and means-tested benefits in five welfare states. Journal of
European Social Policy, 14, 371-391.
Osberg, L. (2002). Time, money, and inequality in the international perspective.
Syracuse, NY: Luxembourg Income Study Working Paper Series.
Organization for Economic and Cooperative Development (2006). OECD Factbook.
Retrieved December 3, 2006, from http://www.sourceoecd.org/rpsv/factbook/
Organization for Economic and Cooperative Development. (2001). OECD employment
outlook. Paris: Author.
Orloff, A.S. (1993). Gender and the social rights of citizenship. American Sociological
Review, 58, 303-328.
Ozawa, M. (2004). Social welfare spending on family benefits in the United States and
Sweden: A comparative study. Family Relations, 53, 301-310.
Pagani, L., Boulerice, B., Tremblay, R.E. (1997). The influence of poverty on children’s
classroom placement and behavior problems. In G. Duncan & J. Brooks-Gunn

115
(Eds.), Consequences of growing up poor (pp. 311-339), New York: Russell Sage
Foundation.
Parsons, T. (1951). The social system. Glencoe, IL: Free Press.
Parsons, T. (1961). Theories of society: Foundations of modern sociological theory.
Glencoe, IL: Free Press.
Parsons, T. (1965). The normal American family. In S. Farber, P. Mustacchi, & R.
Wilson (Eds.), Man and civilization: The family search for survival (pp. 31-49).
New York: McGraw Hill.
Parrott, S., & Sherman, A. (2006). TANF at 10: Program results are more mixed than
often understood. Washington, D.C.: Center for Budget and Policy Priorities.
Piachaud, D., & Sutherland, H. (2002). Changing poverty post-1997. London: Centre for
Analysis of Social Exclusion.
Perotti, R. (1996). Growth, income distribution, and democracy: What the data say.
Journal of Economic Growth, 1, 149-187.
Pressman, S. (2003). Feminist explanations for the feminization of poverty. Syracuse,
NY: Luxembourg Income Study Working Paper Series.
Rainwater, L. & Smeeding, T. (2003). Poor kids in a rich country. New York: Russell
Sage Foundation.
Rector, R. (2006). Importing poverty: Immigration and poverty in the United States: A
book of charts. Special Report #9. Washington, D.C.: The Heritage Foundation.
Rector, R., & Johnson, K. (2004). Understanding poverty in America. Backgrounder
#1713. Washington, D.C.: The Heritage Foundation.

116
Rector, R., Johnson, K., & Youssef, S. (1999). The extent of material hardship and
poverty in the United States. Web Memo #187. Washington, D.C.: The Heritage
Foundation.
Redmon, G., Schnepf, S., & Suhrcke, S. (2002). Attitudes to inequality after ten years of
transition. Florence, Italy: UNICEF Innocenti Research Centre.
Renwick, T.J. (1998). Poverty and single parent families. London: Routeledge.
Scarcella, C.A., Ehrle, J., & Geen, R. (2003). Identifying and addressing the needs of
children in grandparent care. Washington, D.C.: The Urban Institute.
Shapiro, I. & Greenstein, R. (2005). Cuts to low-income programs may far exceed the
contribution of these programs to deficit’s return. Washington, D.C.: Center on
Budget and Policy Priorities.
Sierminska, E. (2004). Female income differentials and social benefits: A four country
comparison. Syracuse, NY: Luxembourg Income Study Working Paper Series.
Sigle-Rushton, W. & Waldfogel, J. (2004). Family gaps in income: A cross-national
comparison. Syracuse, NY: Luxembourg Income Study Working Paper Series.
Simmons, T., & Lawler Dye, J. (2003). Grandparents living with grandchildren: 2000.
Washington, D.C.: United States Census Bureau.
Smeeding, T. (2005). Government programs and social outcomes: The United States in
comparative perspective. Syracuse, NY: Luxembourg Income Study Working
Paper Series.
Smeeding, T. (2005b). Poor people in rich rations: The United States in comparative
perspective. Syracuse, NY: Luxembourg Income Study Working Paper Series.

117
Smeeding, T. (2004). Public policy and economic inequality: The United States in
comparative perspective. Syracuse, NY: Luxembourg Income Study Working
Paper Series.
Smeeding, T. (2004a, November). No child left behind? Economic and social
consequences for American kids in comparative perspective. Paper presented at
the meeting of the National Council on Family Relations, Orlando, FL.
Smeeding, T. (2000). Changing income inequality in OECD countries: Updated results
from the Luxembourg Income Study. Syracuse, NY: Luxembourg Income Study
Working Paper Series.
Smeeding, T. (1997). Poverty in developed countries: The evidence from the
Luxembourg Income Study. In Poverty and human development (pp. 195-240).
New York: United Nations Development Program.
Smeeding, T. (1997a). Financial poverty in developed countries: The evidence from the
Luxembourg Income Study: Final report to the UNDP. Syracuse, NY:
Luxembourg Income Study Working Paper Series.
Smeeding, T., & Ross Phillips, K. (2001). Social protection for the poor in the
developed world. In N. Lustig (Ed.), Shielding the poor: Social protection in the
developing world (pp. 267-307). Washington, D.C.: Brookings Institute.
Smeeding, T., Rainwater, L., & Burtless, G. (2001). U.S. poverty in a cross-national
context. In S.H. Danziger & R.H. Haveman (Eds.), Understanding poverty (pp.
162-189). New York: Russell Sage Foundation.

118
Smeeding, T., & Sandstrom, S. (2004). Poverty and income maintenance in old age: A
cross-national view of low income older women. Chestnut Hill, MA: Center for
Retirement Research at Boston College.
Smith, J.R., Brooks-Gunn, J., & Klebanov, P.K. (1997). Consequences of living in
poverty for young children’s cognitive and verbal ability and early school
achievement. In G. Duncan & J. Brooks-Gunn (Eds.), Consequences of growing
up poor (pp. 311-339), New York: Russell Sage Foundation.
Statistics Canada. (2006). Concepts and variables. Retrieved December 1, 2006, from
http://www.statcan.ca/english/concepts/definitions/eco-family.htm
Terry-Human, E., Manlove, J., & Moore, K.A. (2001). Births outside of marriage:
Perceptions vs. reality. Washington, D.C.: ChildTrends.
Trattner, W.I. (1999). From poor law to welfare state: A history of social welfare in
America. New York: The Free Press.
Townson, M. (2005). Poverty issues for Canadian women: Background paper. Ottawa,
Ontario: Status of Women Canada.
United States Census Bureau. (2006). Current Population Survey: Definitions and
explanations. Population Division, Fertility and Family Statistics Branch.
Retrieved December 1, 2006, from
http://www.census.gov/population/www/cps/cpsdef.html
United States Census Bureau. (2006b). 2006 Annual social and economic supplement,
Current Population Survey. Washington, D.C.: United States Government
Printing Office.

119
United States Census Bureau. (2007). Employment status of women by marital status and
presence and age of children: 1970 to 2004. Retrieved April 21, 2007 from
http://www.census.gov/compendia/statab/2006/labor_force_employment_earnings
/labor_force_status/
United States Department of Labor. (1965). The Negro family: The case for national
action. Washington D.C.: Office of Policy Planning and Research.
Waldfogel, J. (2001). Research on poverty and antipoverty policies. In S.H. Danziger &
R.H. Haveman (Eds.), Understanding poverty (pp. 463-372). New York: Russell
Sage Foundation.
Waldfogel, J. (2004). A cross-national perspective on policies to promote investments in
children. In A. Kalil & T. Deleire (Eds.), Family investments in children’s
potential: Resources and parenting behaviors that predict children’s success (pp.
237-262). Mahway, NJ: Lawrence Erlbaum.
Waldfogel, J., & Hills, J. (2004). A “third way” in welfare reform? Evidence from the
United Kingdom. Journal of Policy Analysis and Management, 23, 765-788.
Walter, M. (2002). Working their way out of poverty? Sole motherhood, work, welfare,
and material well-being. Journal of Sociology, 38, 361-380.
Wilson, K., Lambright, K. & Smeeding, T. (2004). School finance and equality of
opportunity: Equal dollars or equal changes for success? Unpublished
manuscript, Syracuse, NY: Center for Policy Research.
Winch, R.F. (1963). The modern family. New York: Holt, Rinehart, & Winston.
Winton, C.A. (1995). Frameworks for studying families. Guilford, CT: Dushkin.

120
Wong, Y., Garfinkel, I. & McLanahan, S. (1993). Single-mother families in eight
countries: Economic status and social policy. Social Service Review, 67, 177-198.