abstract - associação nacional dos centros de pós ... · palavras-chave: alfabetização aos...
TRANSCRIPT

1
Long-lasting effects of promoting literacy – Do when and how to learn matter?
Guilherme Hirata (IDados)
Paulo Rocha e Oliveira (IESE Business School and IDados)
Abstract
A non-negligible share of Brazil’s adult population is not able to understand what they read and this is
one of the reasons why labor force productivity is currently so low in the country. This paper analyzes
the long-lasting impacts of a pilot project aimed to teach children how to read and write at age six (1st
grade of elementary school). Specifically, we investigate whether a cohort of students that participated in
the program performed better on the Language and Math Exam for fifth graders than untreated students
of the same cohort. Using a Difference-in-Differences methodology, we found both that it is not enough
to get children literate at age six to secure long-lasting effects and that the instruction process used to
teach is an important factor in long-term literacy. Three teaching methods were implemented in the pilot.
We were able to find positive results only for children that learned how to read and write using the
Phonics method. The results are robust for a large set of time-varying control variables, including
socioeconomic status of children, the main variable associated with school performance. Our results also
suggest that the combined effect of age and teaching method has long-term impacts on math reasoning.
To get children literate at the right age, with the right method, is one of the primary challenges Brazil
faces in order to overcome the low skills trap.
Keywords: Literacy at age six, Phonics method, Prova Brasil, labor productivity, quality of education.
JEL Codes: JEL: I20, I25, C21
Área Anpec: 12 – Economia Social e Demografia Econômica
Resumo
Este artigo analisa o impacto da alfabetização aos seis anos de idade sobre proficiência escolar em leitura.
Em 2007, no contexto da mudança do ensino fundamental de oito para nove anos de duração, o governo
do Rio Grande do Sul realizou um projeto piloto de alfabetização aos seis anos de idade, implementando
três métodos de alfabetização. Alunos de escolas que passaram pela intervenção em 2007 realizaram a
Prova Brasil em 2011. Ao comparar o desempenho das escolas que passaram pela intervenção com o de
escolas que compuseram o grupo de controle do projeto ou que não foram incluídas no piloto, antes e
depois da intervenção, é possível identificar o efeito causal da alfabetização sobre proficiência escolar
medida pela Prova Brasil. Usando o método de Diferença-em-Diferenças, os resultados sugerem que não
é suficiente alfabetizar as crianças aos seis anos para obter efeitos de longo prazo. Apenas crianças
alfabetizadas pelo método fônico apresentaram desempenho melhor que o grupo de controle na Prova
Brasil. Esse resultado é robusto a diversas especificações.
Palavras-chave: Alfabetização aos seis anos, método fônico, Prova Brasil, produtividade do trabalho,
qualidade da educação.
This paper benefited from comments from João Batista Oliveira, Elydia Silva, Victor Delgado and Talita Mereb. All
remaining errors are our own.
2
1. Introduction
According to the literature on early childhood investment, a bulk of adult labor market outcomes are
determined by investments parents make in their child’s first years of life. What is less clear is which
investments are most effective, what methods to use and when to intervene. This paper analyzes a
particular phase of child development – the process of learning how to read and write to become literate –
and investigates whether the “when” and “how” have long term impacts on Language and Math
proficiency. Specifically, we analyze how reading and writing education at age six impacts Language and
Math test scores at age 10 using Prova Brasil data. In addition, we investigate whether the impact on
proficiency varies according to different methods of teaching and learning.
Both questions we address in this paper are connected to the literature that investigates the
determinants of cognitive skills acquired in school. When controlled for a student’s socioeconomic status,
there is a certain difficulty in attributing a causal effect on student performance to a given school or
student characteristic. This has been occurring since at least the publication of the Coleman Report
(1966), which details research on the U.S. educational system and echoes present day findings. The
analysis showed that socioeconomic differences among students are more important than differences
among other individual characteristics and across schools in determining school performance.
The conclusion that school resources do not seem to be a factor to proficiency is frequently found in
the literature. Glewee et al. (2013) conducted an extensive review for the 1990-2010 period. The papers
reviewed analyze several variables potentially related to student outcomes, such as school infrastructure,
teaching materials, teacher characteristics and organization of schools (teacher-student ratio, meal
offerings etc.). The authors conclude that there is little evidence pointing to the effect of these variables.
There are some exceptions though, such as teacher absenteeism and teacher’s knowledge regarding the
subject taught. It is worth mentioning that among the papers analyzed there are a few studies using data
from Brazil (Harbinson and Hanushek, 1992; Gomes Neto and Hanushek, 1994; Fuller et al, 1999;
Menezes-Filho and Pazello, 2007).
The effect of education on labor market outcomes is well documented in the literature. Several papers
show positive returns from schooling on individual income (Mincer, 1970; Card, 1999; Heckman et al.,
2006). There is also evidence that the importance of education surpasses labor market outcomes
impacting health, crime and electoral participation (Currie and Moretti, 2003; Lochner, 2011). In
addition, the impact of education is not restricted to the micro field. Barro and Lee (1993, 2001), for
instance, show positive impact of schooling on countries’ average economic growth.
On the other hand, Hanushek and Woessman (2008) and Hanushek (2013) present evidence that the
level of cognitive skills is more important than educational level: one standard deviation increase in
cognitive skills is associated with an increase of 2 percentage points in the GDP growth. Papers
highlighting the importance of cognitive skills changed the research focus to the quality of education. In
this context, the literature on early childhood investment emerged. This literature has been improving our
understanding about short- and long- term benefits that such investments bring to children (Almond and
Currie, 2011; Heckman et al, 2013; Carneiro and Ginja, 2014). More recently, there are some attempts to
analyze the role of investments in non-cognitive abilities and the relationship to labor market outcomes
(Heckman et al, 2014).
On average, adults in Brazil have eight years of schooling, and a considerably large share of the
population cannot understand the main message of a simple newspaper article1. Brazil is located at the
bottom of the Program for International Student Assessment (PISA) ranking, regardless the year we look
at. Therefore, as argued by Hanushek and Woessman (2008), years of schooling might be a poor measure
of cognitive abilities. One of the goals of Brazil’s National Education Plan (PNE) launched in 2014 is for
all children to learn how to read and write through the 3rd grade. Thus, the implicit idea is that Brazil can
wait until the child is eight years old to be literate. Notice that PNE does not refer to “argumentative
literacy” as described by Morais (2017), that would be equivalent to level 4 in PISA. It refers to a lower
level of literacy achievement.
1 Ação Educativa; Instituto Paulo Montenegro (2016).
3
Inserted in the context of the elementary school length change from eight to nine years in 2006, which
anticipated in one year the mandatory entry of children in the school system, the state government of Rio
Grande do Sul took the initiative to assess the impact of children's literacy at age six in reading, writing
and math. Through a pilot project in 2007 financially supported by the private sector, the government
invited three institutions to implement their literacy-teaching methods in the first year of elementary
school in a set of state and local (municipal) public schools in the state. The selection of participating
schools and methods to be used in each school were not random; however, there was a measure taken to
distribute the methods and intervention groups evenly throughout the territory so that teachers and
students from all regions were represented.
This paper takes advantage of the pilot project design to assess the long-lasting effects of being
literate at age six on Language and Math proficiency. We use a Difference-in-Differences (DD) approach
at the school level to investigate whether or not schools that implemented a teaching method for 1st
graders in 2007, improved their performance at grade 5 between 2007 and 2011, more than schools that
did not use a particular method and/or did not pursue the goal of having children literate at six years-old.
Children who attended the 1st grade of elementary school in 2007 attended the 5th grade in 2011 (if there
was no retention).2 We have data for the school average test score of 5th graders in 2007 and 2011.
Therefore, we can compare average test score variation between 2007 and 2011 for schools that
participated in the pilot project to the results of nonparticipating schools. In 2011, participating schools
had a cohort of students that engaged in the Literate at Age Six pilot project while nonparticipating
schools did not. Our sample includes around 2,000 schools and more than 450 municipalities.
Our results show that there is a positive, but not statistically significant, impact of being literate at age
six on Language test scores four years after being exposed to the program in the 1st grade. This
conclusion comes from the comparison of participating schools to all other schools in the state. When we
restrict the control group to the schools selected to compose the control group in the pilot project, then we
have a positive and statistically significant result.
Due to this divergence according to the control group, we test whether it is not enough to teach
children at age six to have long-term effects. The methods used to teach children how to read and write
may have distinct impacts. In order to test the hypothesis, we analyze the impact of each of the three
teaching methods separately: Phonics, Constructivism-Based Method, and Management-Based Method.
The Phonics method consists of explicitly teaching the relationship between letters and sounds. This
provided children with the elements for recognizing words without knowing them previously. A second
method, based on Constructivism, supports the idea that becoming literate is a global process. This means
that memorization of dual relationships harms the learning process. This suggests children should be
taught whole words directly instead of learning word parts initially. Finally, the third method was not a
teaching method strictly speaking. Basically, it relies on organization and monitoring of the learning
process aiming pre-defined levels of achievement, measured by exams. This Management method does
not necessarily have a particular way of teaching children how to read and write.
To assess the impact of each teaching method separately we use the same DD approach discussed
before but restrict the treated group to the schools of one method at a time. Our results show that the
Phonics method has a positive and significant long-term impact on Language test scores. On the other
hand, we were not able to identify a significant impact for the other two teaching methods. These results
do not change whether or not we control for time-varying variables that could affect proficiency. In
particular, we control for test score previous trend, mayor’s turnover, infrastructure and equipment
possession of schools, principal’s and teacher’s characteristics, and students’ characteristics, including
socioeconomic status.
Quantitatively, schools that used the Phonics method had a performance 0.34 of a standard deviation
higher than the schools that did not implement any method. Between 2007 and 2011, the average test
score in Language increased about 5 points more in treated than in untreated schools, which represents a
33% percent higher proficiency than the average increase in Language test scores.
2 According to the Ministry of Education (MEC), approval rates in Rio Grande do Sul state was 98% for 2007 for 1st grade and
87% for 2009 for 3rd grade. Thus, most of 2007 1st graders and 2011 5th graders are the same people.

4
We also found a positive impact on math performance for the Phonics method, statistically significant
at 10%. This impact is quantitatively smaller than the one we observe for language, but it represents an
impact of 0.24 of a standard deviation. Considering the other teaching methods, we were not able to find
any impact. This is consistent with the language findings.
The main contribution of this paper is to present evidence that it is not enough to get children literate
at age six in order to have long-lasting effects on Language and Math test scores. How children are taught
is important as well. As discussed in the next section, reading and writing exams at the end of 1st grade
for all pilot participants show that treated schools perform better, which means that there is an impact in
the short run. Therefore, combining age and teaching method should be in the education players’ outline
in order to consistently increase children’s cognitive abilities. The path to increase Brazil’s labor force
productivity starts before entry into the labor market.
This paper has five sections aside from this introduction and final remarks. The next section
contextualizes the paper by describing the pilot program conducted in the state of Rio Grande do Sul.
Section 3 presents the data and carries out a descriptive analysis comparing the characteristics of schools
in several dimensions. Section 4 discusses the impact of the program regardless of the teaching method.
The impact of each teaching method is discussed in Section 5 while Section 6 presents a set of robustness
checks. Finally, impacts on Math are reported in Section 7.
2. The Rio Grande do Sul Project
The pilot Literate at Age Six Project was motivated by the change in the structure of the elementary
school of the Brazilian educational system implemented in 2006. Before the change, the elementary
school was comprised of eight years of schooling, with entry in the system occurring in the year in which
the child turned seven years-old.3 In 2006, the elementary school was extended to nine years of
schooling. Entry was anticipated for the year in which the child turns six. Thus, the former 1st grade
became the 2nd grade of elementary school. Before 2006, some children attended a so-called literacy
class, where they were supposed to start learning how to read and write, but this was not mandatory. This
means that some children were (supposed to be) literate at six, and others at seven.
The goal of the project was that all children were able to read and write at the end of the 2nd year of
primary school, which was more ambitious than the National Educational Plan goal. The project began in
2007 and was a Rio Grande do Sul government initiative. The government worked in partnership with
local actors and had the support of the Ministry of Education (MEC). The Education State Department
tracked financial resources in the private sector in order to conduct the first year implementation activities
aimed at the 1st graders. In 2008 and 2009, the project continued with MEC funding. Pupils from the 2nd
grade who passed through the program in the 1st grade in 2007 and from 1st grade in 2008, participated in
the program in 2008.
Three institutions were invited to implement their literacy teaching methods. They were in charge of
training sections for teachers and managers, providing teaching materials, and monitoring the learning
process. Each invited institution had an expertise in a given teaching method: management of teaching
and learning, phonics and constructivism. The Management method does not necessarily apply any
specific teaching method; rather, its method is based on the promotion of actions to strengthen the
management of teaching and learning, while ensuring a certain percentage of literate children in the first
year of schooling. The Phonics method is also known as letter-sound method because it teaches the
relationship between the letters and sounds, i.e. the child is taught to associate the corresponding
phoneme (the sound) to its grapheme (the letter) with the possible breakdown of words into syllables
(Torgerson et al., 2006; Ramus, 2015). Finally, the Constructivism method has its roots in Piaget
(Fontanive et al., 2008) and is based on the theory that learning how to read and write is a global process.
3 Children born in the second semester usually got into school for the first time in the year they turned eight, since the school
year in Brazil starts in February.

5
This means that the child should learn the word and its meaning at the same time without breaking down
words into syllables or phonemes, for instance.
The selection of participating schools was not random. There was a public event where the three
institutions presented and explained their methods. The Local (Municipal) Education Departments, and
later the schools, had the opportunity to sign up to participate in the project and choose what teaching
method to implement. However, some criteria had to be met. In order to have teachers and students from
all geographical regions of the state represented, the state was divided into three macro regions. All three
methods had to be present in each one of these regions. In addition, another rule stipulated that only one
teaching method could be adopted in the same municipality (Porto Alegre, the state capital, was the only
exception). Therefore, some kind of bargaining process certainly occurred among schools. The target was
200 intervention classes in each macro region. The final number was 492 distributed in 432 schools.
Besides the schools that have gone through some pedagogical intervention, 169 classes were selected
to compose the project control group. The curriculum of these grades can vary substantially.
Unfortunately, it is unclear how these grades were selected. What can be said is that they are also
approximately uniformly distributed in the territory. More details on the pilot project can be found in
Fontanive et al. (2008). In the next section, a descriptive analysis will be carried out to check and
compare the characteristics of schools in the treatment and control groups.
Cesgranrio Foundation was the institution responsible for the design and evaluation of the pilot
project. At the end of the first year of the intervention, students took Language (reading and writing) and
Math exams elaborated by Cesgranrio (there was no baseline). According to the results (Cesgranrio,
2008), schools that participated in the intervention had better performance in reading and writing than the
control group, regardless of the teaching method used. Figure 1 shows the distribution of the test scores.
Clearly, the treated group distribution is asymmetric to the right, while the untreated is approximately
uniform. The vertical lines show the average for each group. A test on the equality of means rejected the
null hypothesis.
Because the sampling was not random, we cannot confirm that there was short run impact on
proficiency in reading and writing. Also, we do not have a baseline, which means that we cannot control
for differences at the starting point. Therefore, this is all we can say about short run impacts of the pilot
project.
Figure 1 – Language average test score by group of intervention –
Cesgranrio exam at the end of first year - 2007
Source: Cesgranrio (2008). Authors’ elaboration.

6
3. Data
The unit of analysis in this paper is the school. Three data sources are used. The participating schools
were gathered from the Cesgranrio Foundation report (Cesgranrio, 2008). From this report, we identify
the name and the municipality of schools as well as the teaching method implemented in each school.
This information is used to define the treated and control groups.
The other two databases come from MEC and are publicly available. They relate to the Prova Brasil
Exam, a national exam to assess students’ language and math knowledge implemented regularly by the
MEC every other year since 2005. All students from 5th and 9th grade attending public schools are
required to take the tests if the school has at least 20 students.
The first MEC database consists of average test scores for Language and Math at the national, state,
municipal and school level for public schools, a database we call Ideb4. The data also contains approval
rates, which combined with test scores, give birth to the Ideb index, the Brazilian Education Quality
Index.
The second MEC database is the Prova Brasil microdata, which brings information on students’
socioeconomic characteristics as well as schools’ characteristics related to the infrastructure, equipment
possession, faculty and principals. At the time this paper was written, the data that was publicly available
came from 2007 to 2015. This is why we cannot control for students’ and schools’ characteristics
previous to 2007.
There are 2,963 public elementary schools in the Rio Grande do Sul state in the Ideb database for
2007.5 However, we only have 2,110 (71%) schools that have test scores in both 2007 and 2011 Prova
Brasil waves. We lose some tread schools because of that. This can happen because i) schools can choose
to have their results made private and unavailable to the public, ii) the school may have not met the
criteria required to be a target school (in 2007, urban schools with at least 20 students in the grade), and
iii) the school may have had their activities interrupted in the period. Nevertheless, the sample loss should
not cause a selection issue. The average test score in 2007 in Language for schools present in both waves
is 179.9, just 0.5 points higher than the average for schools not present in 2011.
Table 1 presents descriptive statistics for our sample in 2007. We keep the schools for which we have
test scores for both 2007 and 2011 waves in the database. In addition to the project control group, we use
all the other schools of the state that did not participate in the program for which we have test score data
as control group. Again, the curriculum can change across schools. The number of schools is presented
on the bottom line; however, it can be less than that for some variables due to lack of information. The
number of municipalities is 472. The mean and standard deviation are presented for treated schools,
schools in the control group that participated in the pilot project, and for all untreated schools regardless
of participation status.
Overall, schools were similar across groups in the initial year. This is summarized in the first three
variables in the school variables panel: tests scores and approval rates are very close. Most important,
students and teacher characteristics are practically the same. The similarity is even greater when
comparing treated and untreated schools. Of course, there are some differences, such as the regional
distribution of schools. We also noticed that the project control group detaches a little bit. For instance,
equipment and infrastructure6 are better and teacher absenteeism is worse in these schools. Nevertheless,
given that selection was not random, the similarity observed in the table is surprisingly high.
4 Ideb stands for Basic Education Development Index in Portuguese. In addition to test scores, this database contains approval
rates, the index (a combination of approval rates and test scores) and the goal index for each school until 2021 as calculated by
the Ministry of Education. 5 The total number of schools in the database is higher than this because the database includes all schools that participate in
Prova Brasil at least once between 2005 and 2015. 6 Equipment and Infrastructure indexes are constructed based on the Item Response Theory, following Samejima (1969) and
Hambleton (1993).

7
Table 1 – Descriptive statistics by intervention group
Treated Project control
group
All untreated
schools
Mean s.d. Mean s.d. Mean s.d.
School variables
Language proficiency 180.27 15.09 186.42 14.33 179.85 15.07
Approval rate 1st grade 2007 98.66 3.01 99.13 2.49 98.26 3.90
Approval rate 3rd grade 2009 87.57 9.89 90.43 8.19 87.72 9.44
State schools (rather than local) 0.41 0.49 0.23 0.42 0.57 0.50
North 0.41 0.49 0.40 0.49 0.24 0.42
Center-South 0.28 0.45 0.17 0.37 0.28 0.45
Infrastructure index 0.10 0.83 0.27 0.80 0.26 0.82
Equipment index 0.17 0.75 0.43 0.70 0.24 0.71
Teacher variables (proportions)
Public university graduated 0.14 0.26 0.08 0.18 0.15 0.27
10 years + of experience 0.74 0.29 0.69 0.28 0.71 0.3
Work at more than one school 0.44 0.31 0.42 0.29 0.45 0.31
Temporary contract 0.11 0.2 0.1 0.16 0.1 0.19
Completed at least 80% of class schedule 0.52 0.32 0.61 0.29 0.52 0.33
Work at another activity in education 0.38 0.29 0.35 0.28 0.38 0.3
Work outside education field 0.08 0.15 0.07 0.12 0.08 0.17
Principal variables (proportions)
Public university graduated 0.09 0.28 0.05 0.23 0.13 0.33
10 years + of experience 0.47 0.50 0.45 0.50 0.51 0.50
Elected to run the office 0.23 0.42 0.15 0.35 0.30 0.46
Faced problems with teacher absenteeism 0.38 0.49 0.55 0.50 0.38 0.48
Students variables (proportions)
Male 0.51 0.08 0.49 0.08 0.51 0.09
Black 0.42 0.14 0.40 0.14 0.40 0.14
Work (not domestic chores) 0.12 0.07 0.11 0.07 0.12 0.07
Behind grade level 0.32 0.14 0.25 0.13 0.30 0.14
Attended kindergarten 0.29 0.16 0.28 0.17 0.29 0.17
Attended preschool 0.42 0.18 0.42 0.19 0.41 0.18
Mother’s education
Up to 5th grade of elementary school 0.33 0.14 0.29 0.12 0.35 0.15
Complete elementary school 0.22 0.09 0.23 0.08 0.21 0.10
Complete high school 0.18 0.10 0.20 0.09 0.16 0.10
College 0.16 0.12 0.20 0.12 0.16 0.12
Socioeconomic status 5.04 0.44 5.25 0.48 5.07 0.47
Observations 331 114 1,779
Source: MEC/Inep. Authors’ elaboration.
4. Long run effects of being literate at age six
Our first exercise is to test whether or not the literacy program implemented in the 1st grade of
elementary school in 2007 had long-lasting effects. In order to do so, we compare Prova Brasil 5th graders
Language test scores of schools that participated in the program, with the ones from schools that did not
participate, both before and after the program took place. The cohort of students that took the test in 2007
at grade 5, did not engage in that particular program in 2007 because the program was targeted on the 1st
graders only. On the other hand, the cohort that participated while in the 1st grade in 2007 took the Prova
Brasil exam in 2011 when they reached 5th grade. Of course, because we do not follow students through
time, it is not possible to ensure that all 1st graders of 2007 took the Prova Brasil in 2011. Some students

8
dropped out, some enrolled after 2007, and others switched schools. Nevertheless, we know that most
children under 10 attend school and the approval rate is around 90%. Therefore, it is unlikely that the 1st
grade cohort of a given school changed substantially when the cohort reached grade 5.
Therefore, our empirical strategy is to follow a Difference-in-Differences (DD) approach. The
treatment group is composed of schools that participated in the Literate at Age Six Program. The control
group are made up of the other public schools of Rio Grande do Sul state. The DD method does not
require treatment and control groups to be similar. The main assumption of the DD method is that the
treatment group outcome trend would have been parallel to the control group in the absence of treatment.
We are going to present some evidence that this is indeed the case.
Let 𝐷 be the treatment dummy. The DD model is estimated through the following equation:
𝑦𝑖 = 𝛼 + 𝛽𝐷𝑖 + 𝑋𝑖𝛾 + 𝜖𝑖 (1)
where 𝑦𝑖 = 𝑦𝑡 − 𝑦𝑡−1 is the difference in the test score for school 𝑖 between 2007 and 2011, 𝑋𝑖 = 𝑋𝑡 −𝑋𝑡−1 is a vector of time-varying control variables, and 𝜖𝑖 is the disturbance term. The parameter we are
interested in is 𝛽, which we interpret as the long-run treatment effect of being literate at age six. Note that
all school-fixed effects are controlled for in this approach.
As noted in Section 2, the schools (as a group) were allowed to choose whether to participate in the
program or not. Thus, self-selection might be an issue. It might have been the case that the best schools,
or those with higher socioeconomic level, or that have the best teachers, have decided to participate into
the program. Under the assumption that these variables influence student performance on the Prova Brasil
exam, a positive difference between treated and control schools might be attributed to the Literate at Age
Six program, when in fact, the effect would have occurred due to other school characteristics associated
with program participation. If that was the case, we would see a different trajectory before 2011 in test
scores. For instance, if treated schools had the best teachers, and this fact was translated into best
performance through time, we would see an increasing difference in performance before 2011. In
addition, at the same time the program was introduced, other changes may have occurred in school and/or
in students’ characteristics. These effects are potentially confounders of the treatment effect and will be
addressed through the set of time-varying control variables.
Table 2 reports the results of equation (1). The estimated coefficient for the treatment dummy is
presented for several specifications. Panel A uses as control group the schools of the project control
group. In this case, the treated group has three times more observations than the control group. In Panel
B, the control group is composed of all schools in the database that are not in the treatment group. All
standard errors as clustered at municipal level.
In general, all coefficients are positive, but just a few are statistically significant at traditional levels
and only for specifications where we use the project control group. Without any control variable (Column
1), the value of the point estimate is practically the same independent of the choice of the control group,
although as expected, the precision of the estimated parameter is much higher when we use all schools.
The influence of control variables is also similar in both specifications. Column (2) adds to the model
the outcome’s previous trend. This variable is the change in the Language test score between 2005 and
2007. Because participation in Prova Brasil increased between these years, we lost a number of schools
by introducing this variable. Column (3) includes a dummy variable for a reelected mayor. Mayoral
elections occur every four years in Brazil with one at the end of 2008. A change in office may represent a
change in the local educational policy, a factor for which a control is necessary. We construct a variable
indicating whether the mayor in 2004-2008 term was reelected in 2008 for a second four-year term.
Column (4) includes two variables related to infrastructure and equipment possession of schools.7
These variables account for physical investment in schools that might be related to school performance,
although there is no sharp empirical evidence to support this as we previously discussed.8 Column (5)
adds controls for the principal’s characteristics related to schooling, experience and how she or he got
7 School microdata contain several variables related to infrastructure and equipment. From this information we estimate two
indexes using an Item Response Theory approach to summarize it. 8 See, for example, Coleman (1966) and Hanushek (1997).

9
into office.9 This attempts to control for changes in how the school is run. Column (6) controls for
changes in teacher characteristics related to schooling, experience, type of contract and work plan
accomplishment. Students’ characteristics are incorporated in Column (7) and control for changes in
socioeconomic status, gender and race composition, mother’s education and preschool attendance.
Because we do not have complete information for each control variable, the number of observations
changes across specifications.
Table 2 – Lon run impacts of Literate at Age Six program on Language – Prova Brasil – DD estimates –
2007-2011
(1) (2) (3) (4) (5) (6) (7) (8)
Panel A (RS project)
Treated 1.07 0.48 1.93 1.06 2.62* 1.88 0.99 2.77*
(1.67) (1.55) (1.50) (1.66) (1.54) (1.69) (1.74) (1.39)
Observations 445 407 445 443 392 405 445 331
R-squared 0.00 0.07 0.03 0.00 0.04 0.03 0.05 0.23
Panel B (all municipalities)
Treated 1.01 1.39 1.33 1.09 1.11 1.22 0.83 1.41
(0.90) (1.04) (0.88) (0.89) (0.99) (0.92) (0.98) (1.13)
Observations 2,110 1,778 2,110 2,089 1,809 1,909 2,110 1,406
R-squared 0.00 0.13 0.01 0.00 0.00 0.01 0.04 0.20
2005-2007 trend X X
reelection 2008 X X infrastructure/
equipment X X
school principal X X
Teachers X X
Students X X Clustered standard errors in parenthesis. +1% significant; ∗∗ 5% significant; ∗ 10% significant.
The analysis of Table 2 suggests that omitting relevant variables works against finding statistically
significant results in most specifications. After incorporating several types of controls one group at a
time, the point estimate of the treatment variable coefficient tends to increase. In column (5), for instance,
after controlling for a principal’s characteristics, the point estimate is 2.62 and is statistically significant
at 10% when using the project control group (Panel A). This means that the change in these variables are
favoring control group schools in a way that cannot be considered a confounder. When all controls are
put together in the regression (Column 8), the point estimate is the highest among all specifications and is
statistically significant at 5% when using the project control group.
Considering the full specification (Column 8) in Panel A, the point estimate suggests that being
literate at age six has a long-run effect on Language test scores: on average, students at treated schools increased Language test scores by 2.81 points more than untreated students in the 5th grade. This
represents 18% of total increase in average test scores in that period.
Because we i) lose about 25% of schools by incorporating all control variables, ii) do not observe the
same significant effect in Panel B where we use all untreated schools, and iii) have just one statistically
significant coefficient in specifications (2) to (7), it is possible that the impact observed in Column (8)
ascends due to the sample restriction imposed on the full specification.
9 The variables are dummies indicating whether the principal graduated from a public university (in Brazil, public universities
are associated with better quality courses in general); has at least five years of experience as a school principal; was elected to
run the office (instead of appointed), and faced teacher absenteeism problems during the current year.

10
On the other hand, the lack of impact may come from the fact that we are actually evaluating three
distinct literacy programs as a single program. To have long run impacts, perhaps it is not enough to
teach children how to read and write at age six. It could be the case that the way children learn matters,
which means that the teaching method might make a difference. We are going develop more on this
subject in the next section.
5. Letter-sound or Phonics method impact
There is some evidence that the learning process may have different impacts on literacy according to
the type of instruction received (Ehri et al., 2001; Torgerson et al., 2006) and that this probably has to do
with the part of the brain stimulated during the learning process. According to Yoncheva et al. (2015),
adults learning how to read and write a new language through the letter-sound method display more brain
activity on the left side of the brain while reading. According to the authors, this is the part of the brain
most associated with visual and language functionalities and is the region recruited by experienced and
skilled readers while reading. On the other hand, people who learned to read through memorizing whole
words show brain activity on the right or both sides of the brain while reading, which means that the
reader is less efficient in reading. In addition, the authors argue that phonics-taught learners are more
capable of reading new words because they can split the word and make letter-sound associations
previously learned, a process that whole-word-taught learners cannot do.
Given the empirical evidence, it is possible that the long run effects of being literate at age six
depends on how the process of reading was taught. If this is true, one would expect different Language
test performance in the long run associated to distinct methods used. Figure 2 shows the evolution of the
average test scores in Language between 2007 and 2011 for the three types of treated schools and for the
control groups. At the starting point, there is a difference of about 10 test score points between the lowest
(constructivism) and the highest score (project’s control). Nevertheless, one can see there is a clear path-
breaking shift between 2009 and 2011 for schools that implemented the Phonics method as the instruction
strategy for the 1st graders in 2007. In 2007 and 2009, phonic-schools average test score was close to the
other untreated (not in the pilot project) schools in the state. In 2011, however, the phonic-schools closed
the gap to the management schools.
Figure 2 – Language average test score evolution by teaching method and type of school – 2007-2011
Source: Prova Brasil; Cesgranrio (2008). Authors’ elaboration.
11
Aside from initial test score differences, schools that implemented different literacy instructions are
similar in several characteristics, such as percentage of blacks, mother’s education, socioeconomic status
and approval rate (table available upon request). On the other hand, there are some initial differences in
regional location, infrastructure, teacher experience and where a principal went to college.
In order to access the long-run impact of each teaching method, we run equation (1) for each group of
schools separately. For each equation, the dummy variable 𝐷 assumes value 1 if the school implemented one of the three methods. Again, we run the model considering two control groups, one includes only the
project control group, and the other includes all untreated schools in the state. We estimate the fixed
effect model using the same set of control variables used before in order to mitigate confounding time-
varying factors.
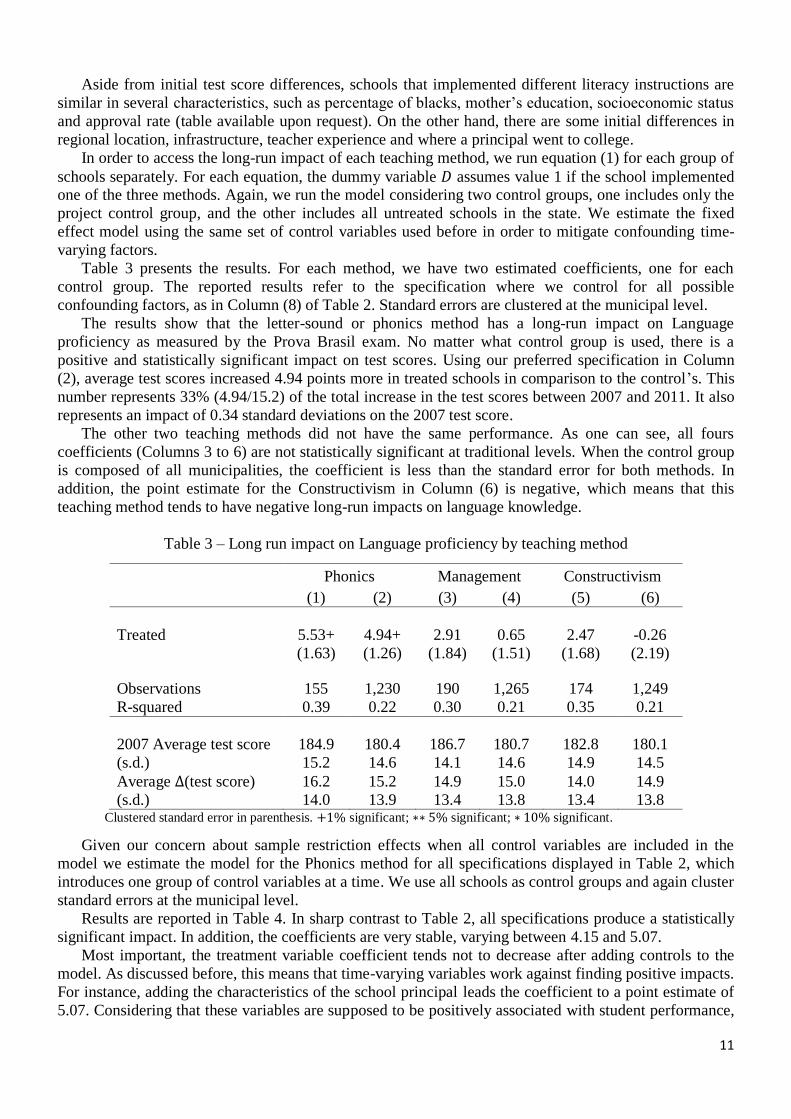
Table 3 presents the results. For each method, we have two estimated coefficients, one for each
control group. The reported results refer to the specification where we control for all possible
confounding factors, as in Column (8) of Table 2. Standard errors are clustered at the municipal level.
The results show that the letter-sound or phonics method has a long-run impact on Language
proficiency as measured by the Prova Brasil exam. No matter what control group is used, there is a
positive and statistically significant impact on test scores. Using our preferred specification in Column
(2), average test scores increased 4.94 points more in treated schools in comparison to the control’s. This
number represents 33% (4.94/15.2) of the total increase in the test scores between 2007 and 2011. It also
represents an impact of 0.34 standard deviations on the 2007 test score.
The other two teaching methods did not have the same performance. As one can see, all fours
coefficients (Columns 3 to 6) are not statistically significant at traditional levels. When the control group
is composed of all municipalities, the coefficient is less than the standard error for both methods. In
addition, the point estimate for the Constructivism in Column (6) is negative, which means that this
teaching method tends to have negative long-run impacts on language knowledge.
Table 3 – Long run impact on Language proficiency by teaching method
Phonics Management Constructivism
(1) (2) (3) (4) (5) (6)
Treated 5.53+ 4.94+ 2.91 0.65 2.47 -0.26
(1.63) (1.26) (1.84) (1.51) (1.68) (2.19)
Observations 155 1,230 190 1,265 174 1,249
R-squared 0.39 0.22 0.30 0.21 0.35 0.21
2007 Average test score 184.9 180.4 186.7 180.7 182.8 180.1
(s.d.) 15.2 14.6 14.1 14.6 14.9 14.5
Average Δ(test score) 16.2 15.2 14.9 15.0 14.0 14.9
(s.d.) 14.0 13.9 13.4 13.8 13.4 13.8 Clustered standard error in parenthesis. +1% significant; ∗∗ 5% significant; ∗ 10% significant.
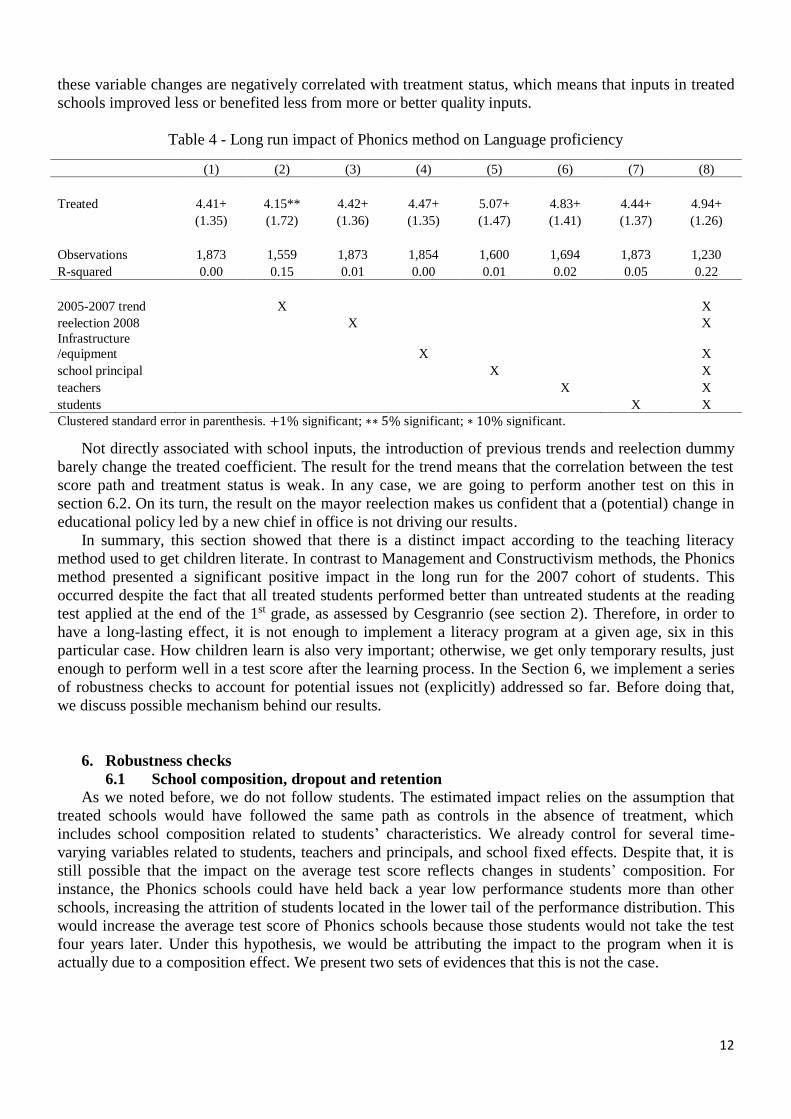
Given our concern about sample restriction effects when all control variables are included in the
model we estimate the model for the Phonics method for all specifications displayed in Table 2, which
introduces one group of control variables at a time. We use all schools as control groups and again cluster
standard errors at the municipal level.
Results are reported in Table 4. In sharp contrast to Table 2, all specifications produce a statistically
significant impact. In addition, the coefficients are very stable, varying between 4.15 and 5.07.
Most important, the treatment variable coefficient tends not to decrease after adding controls to the
model. As discussed before, this means that time-varying variables work against finding positive impacts.
For instance, adding the characteristics of the school principal leads the coefficient to a point estimate of
5.07. Considering that these variables are supposed to be positively associated with student performance,
12
these variable changes are negatively correlated with treatment status, which means that inputs in treated
schools improved less or benefited less from more or better quality inputs.
Table 4 - Long run impact of Phonics method on Language proficiency
(1) (2) (3) (4) (5) (6) (7) (8)
Treated 4.41+ 4.15** 4.42+ 4.47+ 5.07+ 4.83+ 4.44+ 4.94+
(1.35) (1.72) (1.36) (1.35) (1.47) (1.41) (1.37) (1.26)
Observations 1,873 1,559 1,873 1,854 1,600 1,694 1,873 1,230
R-squared 0.00 0.15 0.01 0.00 0.01 0.02 0.05 0.22
2005-2007 trend
X
X
reelection 2008
X
X
Infrastructure
/equipment
X
X
school principal
X
X
teachers
X
X
students X X
Clustered standard error in parenthesis. +1% significant; ∗∗ 5% significant; ∗ 10% significant.
Not directly associated with school inputs, the introduction of previous trends and reelection dummy
barely change the treated coefficient. The result for the trend means that the correlation between the test
score path and treatment status is weak. In any case, we are going to perform another test on this in
section 6.2. On its turn, the result on the mayor reelection makes us confident that a (potential) change in
educational policy led by a new chief in office is not driving our results.
In summary, this section showed that there is a distinct impact according to the teaching literacy
method used to get children literate. In contrast to Management and Constructivism methods, the Phonics
method presented a significant positive impact in the long run for the 2007 cohort of students. This
occurred despite the fact that all treated students performed better than untreated students at the reading
test applied at the end of the 1st grade, as assessed by Cesgranrio (see section 2). Therefore, in order to
have a long-lasting effect, it is not enough to implement a literacy program at a given age, six in this
particular case. How children learn is also very important; otherwise, we get only temporary results, just
enough to perform well in a test score after the learning process. In the Section 6, we implement a series
of robustness checks to account for potential issues not (explicitly) addressed so far. Before doing that,
we discuss possible mechanism behind our results.
6. Robustness checks
6.1 School composition, dropout and retention
As we noted before, we do not follow students. The estimated impact relies on the assumption that
treated schools would have followed the same path as controls in the absence of treatment, which
includes school composition related to students’ characteristics. We already control for several time-
varying variables related to students, teachers and principals, and school fixed effects. Despite that, it is
still possible that the impact on the average test score reflects changes in students’ composition. For
instance, the Phonics schools could have held back a year low performance students more than other
schools, increasing the attrition of students located in the lower tail of the performance distribution. This
would increase the average test score of Phonics schools because those students would not take the test
four years later. Under this hypothesis, we would be attributing the impact to the program when it is
actually due to a composition effect. We present two sets of evidences that this is not the case.

13
Dropout and retention
The first evidence is the impact of the program on dropout and retention rates. Being capable of
reading and writing is the first step for a good performance in test scores. If retention and dropout rates
are related to test performance, one would expect low performance students to have higher propensity to
dropout or hold back a year. Thus, if the program had a positive impact on student literacy skill, a
consistent result to that hypothesis would be to find a negative impact on dropout and retention.
To better investigate this hypothesis, we run equation (1) using the change in proportion of dropout
and hold back students between 2007 and 2011 as outcomes. To compute the proportions for each school
and year, we use the answers provided by students to the multiple-choice question “have you ever
dropout (hold back a year in) school?” The possible answers are “no”, “once”, and “twice or more”. For
each question, we create a dummy indicating at least one retention or dropout event from which we get
the school proportion.
Table 5 presents the results. Specifications include all the control variables we used in previous
regressions. As one can see, dropout rates fall in Phonics schools as compared to both control groups.
The impact is equivalent to 0.31 of a standard deviation when the control group is composed of all
nonparticipating school. The evidence on retention is weaker. Using all nonparticipating schools as
control group, we also found a negative impact on retention rates, meaning that approval rates increased
in Phonics schools. The point estimate using the project control group is also negative, but not
statistically significant at 5% level.
Table 5 – Impact of Phonic method on dropout and retention rates (1) (2) (3) (4)
Retention Dropout
Treated -0.036 -0.046* -0.023* -0.012*
(0.023) (0.022) (0.009) (0.006)
Observations 155 1,230 155 1,230
R-squared 0.226 0.105 0.190 0.053
2007 average 0.293 0.310 0.044 0.048
2007 s.d. 0.140 0.132 0.034 0.039 Clustered standard error in parenthesis.∗∗ 1% significant; ∗ 5% significant.
The results show that the Phonics-method schools were not favored in terms of variation in students’
composition. Because the program has reduced dropout rates in those schools, it actually worked against
finding positive results in test scores since students who otherwise would dropout ended up reaching 5 th
grade, impacting average test score negatively.10
Impact on the median and other percentiles
The impact on the average test score may be particularly sensitive to uneven changes in composition
between treatment and control groups if outlier students enroll in or dropout of a given school. To
analyze the impact on the whole distribution, we estimate the impact of the program on five percentiles of
the student distribution: 10th, 25th, 50th, 75th and 90th. The impact on the median is less sensitive to
compositional changes. In addition, the other percentiles allow us to assess whether there were large
10 These variables were not controlled for in the main regressions presented in Tables 2, 3 and 4 because they are
endogenous in those specifications. However, including those dropout and retention variables do not change the results. The
treatment variable remains positive and statistically significant at 5% level. The results are available upon request from the
authors.

14
impacts in some points of the distribution, which could be interpreted as an evidence of sudden student
compositional change in treated schools. Specifically, if low performance students of Phonic schools
dropped out, one would expect a large increase in the 10th percentile test score since students located in
higher percentiles would artificially be relocated to the 10th percentile.
To construct the outcome variables, we take the 2007-2011 difference in test scores of students
located in the percentiles we are interested in. Table 6 reports the results for equation (1) using these
differences as outcomes. Specifications include all control variables we have been using so far; standard
errors are clustered at municipal level.
According to our estimations, using all untreated schools as control group (Panel A), the Phonics
method program has impacted the whole distribution. The estimated impact on the median (column 3) is
very close to the one observed for the mean (4.96). In addition, we do not observe higher impact on the
extreme points of the distribution: both 10th and 90th percentiles point estimates are smaller than the one
for the median. More important, the difference among all percentile point estimates are not large,
meaning that there was no shock in the treated group composition.
Table 6 – Impact of Phonics method on moments of test score distribution (1) (2) (3) (4) (5)
10th 25th Median 75th 90th
Panel A
Treated 3.95** 4.83+ 4.64+ 5.44+ 4.33*
(1.72) (1.41) (1.44) (1.92) (2.53)
Observations 1,230 1,230 1,230 1,230 1,230
R-squared 0.13 0.16 0.18 0.18 0.12
Panel B
Treated 4.72* 5.97+ 4.14** 3.91* 7.04+
(2.56) (2.07) (2.05) (2.10) (2.39)
Observations 155 155 155 155 155
R-squared 0.29 0.38 0.35 0.34 0.26 Clustered standard error in parenthesis. +1% significant; ∗∗ 5% significant; ∗ 10% significant.
The impact using the project control group (Panel B) shows a somewhat large impact on the 90th
percentile, which might be an evidence of Phonics schools attracting top students. In any case, the other
point estimates are not distant from each other. In particular, the impact on the median is still positive,
statistically significant, and close the impact on the average test score.
Putting all things together, it seems very unlikely that a possible change in school composition plays a
leading role in explaining our results. This section showed that while dropout rates have fallen, the
impact on the median is practically the same as the one observe for the mean.
6.2 Selection bias
As noted in Section 2, the choice of treatment and control schools that participated in the project was
not random. The major aim of the project was to guarantee that all teaching methods were present in
schools in all geographic regions, as defined by the program design. Thus, it is possible that self-selection
is present. For instance, the best principals could be more willing to participate in the program and to
choose the Phonics method. If the factor related to self-selection are only associated with either the
school fixed effects or the set of time-varying control variables, the methodology applied above is suited
to handle the problem.
Still, pre-program differences can lead to a nontrivial difference in the outcome path of treated and
control groups. In order to minimize this potential bias, we combine the DD method with the Inverse
Probability Weighting. Following Abadie (2005), the idea is to weight equation (1) by the following
variable:
𝑤𝑖𝑡 = 𝐷𝑖 + (1 − 𝐷𝑖)×𝑝𝑠𝑖×(1 − 𝑝𝑠𝑖)−1 (2)

15
where 𝑝𝑠𝑖 is the propensity score for school 𝑖 in 2007 estimated through a Probit model. According to (2), schools in the control group that are more likely to receive treatment, receive higher weight in the
estimation.11 Tests performed to check the validity of the CIA assumption necessary to implement this
methodology were implemented and showed that it is a reasonable assumption.12
Table 7 reports the results. We run the model only for the schools that implemented the Phonics
method. The first two columns do not include time-varying controls variables, while the last two do. All
estimated coefficients are positive and statistically significant at 5%, so previous conclusions do not
change.
Table 7 – Long run impact of phonics-teaching method on Language score –
DD combined with Inverse Probability Weighting
(1) (2) (3) (4)
Treated 6.01+ 5.79+ 4.74** 5.17+
(2.32) (1.65) (2.27) (1.72)
Time-varying controls X X
Observations 190 1661 155 1230 Standard error in parenthesis. +1% significant; ∗∗ 5% significant; ∗ 10% significant.
In addition, the point estimate of each specification is very close to the one we discussed earlier in the
paper. We interpret this as evidence that the selection bias, if any, is not driving our results. Of course, if
selection is on unobservables, propensity score techniques will not solve the problem. Nevertheless, we
would like to emphasize that we are combining the weighting procedure with the DD method, which
controls for unobservables fixed in time. Therefore, unless there is some kind of unobserved effect not
correlated to observables at all, we can conclude that there is no selection bias in spite of not having a
random sample of schools.
6.3 Distinct trends
We already saw that the 2005-2007 trend does not affect the conclusions about the Phonics method
impact on language knowledge at 5th grade. In this section we perform a formal test for distinct trends
prior to the intervention.
We carry out the test by running the following equation
Δ(𝑦2007 − 𝑦2005) = 𝛿 + ∑ 𝜃𝑗𝑗 𝐷𝑗 + 𝜈 (3)
where the dependent variable is the test score variation between 2005 and 2007, 𝐷𝑗 is a dummy variable
for the 𝑗 teaching method, and 𝜈 is the error term. This specification controls for school-fixed effects, but because we do not have data on school characteristics for 2005, we miss time-varying control variables.
We argue that this is not an issue because the time interval is short, only two years. In addition, between
2005 and 2007 we did not have a mayorial election, which means that the local educational policy
probably did not experience a sudden change.
11 The use of the propensity score relies on two additional assumptions: the existence of a common support (the probability of
participation in the program must be strictly greater than zero, conditional on covariates, and less than one) and the conditional
independence assumption (CIA), which requires that observables have the same mean conditional on the propensity score. See
Rosenbaum and Rubin (1983), Dehejia and Wahba (2002), and Cameron and Trivedi (2005) for further details. 12 The test results are available upon request. One table presents results of simple linear regressions on the relationship
between the treatment variable and each independent variable included or not in the propensity score estimation before and
after weighting the regression. The table reports the t-statistics associated with each variable. One can observe that there is no
statistically significant result at 5%, suggesting that the CIA is not being violated. We also constructed a figure showing how
the propensity score distributions become similar after the weighting procedure. It is worth noticing that for each specification
in Table 7 we estimate the associated propensity score and perform all the relevant tests. The reported results refer to column
(4) of Table 7. The results using all schools as a control group (column 2) does not change much; the results related to the
other column present a few statistically significant results. All results are available upon request.

16
Table 8 presents the results of equation (3), where we omit the Phonics-teaching method dummy. The
table shows that there is no difference in the previous trend among all intervention schools. In addition,
the estimated standard error is bigger than the coefficient for all coefficients, which means that it is
highly unlikely that a particular group of schools presents a distinct trend from the others.
This evidence, associated with the IPW’s, reinforces the fact that there are no confounding factors,
observed or unobserved, driving our main conclusions, i.e. that there is a long run effect for the Phonics
method on literacy.
Table 8 – Outcome trend before treatment –
Dependent variable: change in Language test score between 2005 and 2007
(1)
Management -2.40
(3.08)
Constructivism 1.79
(3.17)
Project Control Group 0.80
(2.78)
Other Schools -0.86
(2.41)
Constant 1.15
(2.40)
Observations 1,778
R-squared 0.00 Clustered standard errors in parentheses.
+1% significant; ∗∗ 5% significant; ∗ 10% significant.
6.4 Municipality effects
How do we know that the Phonics method impact is not a municipality effect rather than a teaching
method effect? As we highlighted earlier in this paper, in a given municipality, participating schools were
supposed to implement the same teaching method. Therefore, it is possible that there is the existence of
some kind of unobserved municipality effect. That is, schools located in municipalities where there is no
treated school, may perform worse than untreated schools located in treated municipalities. It was not
possible to control for this in our previous specifications because we controlled for school fixed effects.
To test this specific municipality effect hypothesis, we restrict our sample to municipalities where
there is at least one treated school. Also, in order to have treatment variability in all municipalities, we
drop municipalities where all schools are treated. Table 9 presents the results of equation (1) estimated
under these restrictions for all teaching methods separately using the specification that includes all
control variables.
Table 9 – Controlling for municipality effects
(1) (2) (3)
Phonics Management Constructivism
Treated 4.18+ 1.34 1.37
(1.52) (1.32) (1.95)
Observations 522 567 539
R-squared 0.27 0.24 0.24 Clustered standard errors in parentheses. +1% significant; ∗∗ 5% significant; ∗ 10% significant.

17
The number of schools is practically the same across specifications, meaning that no teaching method
was (dis)favored in terms of municipality size. Again, the Phonics method was the only one to present
statistically significant results. The point estimate for this method is lower than the ones we previously
discussed, which supports the hypothesis discussed above: there is probably some municipality effect.
In addition, comparing the other teaching methods results in Table 9 with the ones using all schools
as a control group in Table 3, the point estimates are higher in the former. Although not statistically
distinct from zero in either of the tables, it suggests that untreated schools in treated municipalities
perform worse than untreated schools in untreated municipalities. The scenario for the Phonics method is
the opposite as we just saw. Therefore, we have evidence to rule out another hypothesis: that, contrary to
the other methods, the Phonics method was implemented in municipalities where the unobserved time-
varying variables were potentially associated to a path-improving student performance. It is not possible
to test it formally because we do not have different teaching methods implemented in the same
municipalities. However, the results discussed here point that the Phonics method, if any, is relatively
disfavored. If this is true, the long run impact of the Phonics method in municipalities that implemented
other teaching methods would be higher than the ones we found.
6.5 Falsification test
The Phonics method was introduced in the 2007 cohort of elementary schools. By comparing 2007
and 2011 Prova Brasil 5th grade test scores, we are comparing results for one treated and one untreated
cohort. A falsification test compares two untreated cohorts from the same schools used in the main
analysis. What we can do is to run equation (1) to compare 2005 and 2009 Prova Brasil 5th grade test
scores of forthcoming treated and untreated schools. There is no reason for any impact in this period
since there was no treatment.
Table 10 presents the results. We run the test only to the Phonics teaching method. Because we do not
have data related to school characteristics in 2005, the only time-varying control variable we can include
is the reelection dummy. Columns (1) and (2) refer to the specification where we use project control
schools only, while the other two columns include all the other schools as well.
As one can see, we do not find any statistically significant result in the falsification tests. All
coefficients are positive, but i) they are just one third of the standard error using the project control group
and ii) they are barely greater than the standard error using all schools as a control group. Therefore, it
does not seem to be the case that the long run impact we found is a simple coincidence.
Table 10 – Falsification tests – Long run impacts on the 2005 cohort
(1) (2) (3) (4)
Treated 0.93 1.13 2.47 2.41
(3.07) (3.18) (2.44) (2.31)
Reelection X X
Observations 184 184 1,529 1,529
R-squared 0.00 0.01 0.00 0.01 Clustered standard error in parenthesis. +1% significant; ∗∗ 5% significant; ∗ 10% significant.
The missing control variables are probably not an issue here. If the same pattern for 2007-2011
occurs, adding control variables would tend to increase the coefficient; however, it tends to increase the
variance as well (due to collinearity), which is already high.
Considering all robustness checks we performed in Section 6, the evidence demonstrates that we need
a combined strategy in order to have long-lasting effects from promoting literacy in children. Teaching
children how to read and write at age six (in Grade 1) through the Phonics method presented the best
results in the long run, as measured by Language test scores in 5th grade. The next section shows that the
impacts of the program were not restricted to Language.

18
7. Math
So far we have discussed Language impacts only. Nevertheless, literacy can also have long run
impacts on Math test scores because students cannot perform well if they do not know what the question
is asking. To assess the long run impact of the teaching method on Math, we switch the dependent
variable in the equation (1) to the change in the school’s average test scores in Math in the same period.
Again, we run the model for each teaching method separately using all untreated schools, including all
control variables.
Table 11 shows the results. We found a positive and statistically significant impact at 10% for the
Phonics method (Column 1). In spite of the fact that the significance level is a little bit high, it suggests
that being literate at age six has a long run impact not only on Language tests, but also on math
reasoning.
The Math and Language scales are not comparable but we can use the standard deviation to assess the
relative impact on each subject. The Math point estimate is smaller than Language’s, and represents a
0.24 of a standard deviation increase in the 2007 average test scores in Math, against 0.34 in Language.
Despite the smaller and (statistically) weaker impact, the effect of literacy programs on long run Math
test scores is non-negligible since the program did not include math classes.
Table 11 – Long run impact of teaching methods on Math test scores
Phonics Management Constructivism
(1) (2) (3)
Treat 3.72* 2.61 1.40
(1.98) (1.62) (2.30)
Observations 1,230 1,265 1,249
R-squared 0.18 0.18 0.18
2007 Average test score 204.7 199.5 203.0 (s.d.) 15.0 15.9 16.1
Clustered standard error in parenthesis. +1% significant; ∗∗ 5% significant; ∗ 10% significant.
In relation to the other methods, there was no impact on Math for Management or Constructivism.
This is consistent with our previous findings where we were not able to find any significant result on
Language in these cases. Therefore, the math results reinforce the conclusions related to distinct
performance of teaching methods in the long run.
8. Final Remarks
Brazil has increased the average years of schooling of its population in recent decades but labor
productivity has stagnated in the same period. This apparent contradiction comes from the fact that the
observed increase did not translate into a more literate labor force. This paper analyzed the impact of a
pilot project that addressed that problem by teaching children how to read and write at age six (1st grade
of elementary school). Specifically, we investigate whether a cohort of students that participated in the
program performed better than the students of the same cohort that were not targeted by any specific
program for the Language exam students take in 5th grade.
The results show that it is not enough to get children literate at age six to have long-lasting effects of
literacy, but that it is also important how children are taught. We show that we only have positive and
statistically significant effects when the teaching method used is the Phonics method. Unfortunately, we
are not able to separate the whole effect into an “age effect” and a “method effect” to observe the relative
importance of each one. It might well be the case that the age effect is zero, meaning that teaching
children at age 7 would cause no difference. Nevertheless, given the findings reported by early childhood

19
investment literature - later investments do not help to close the gap created at early ages -, it is very
unlikely the age effect to be zero.
This paper then, brings an important contribution to the Economics of Education literature. It also
adds to the public policy debate on how to improve the quality of education not only in Brazil but also in
other developing countries. Finally, in addition to the positive impacts on Language, our results also
suggest that there is some impact of Language skills on math performance in the long run.
References
Abadie, A. (2005). Semiparametric difference-in-differences estimators. The Review of Economic
Studies 72(1): 1–19.
Ação Educativa; Instituto Paulo Montenegro (2016). Indicador de Alfabetismo Funcional – INAF –
Estudo especial sobre alfabetismo e o mundo do trabalho. (Available at http://acaoeducativa.org.br/wp-
content/uploads/2016/09/INAFEstudosEspeciais_2016_Letramento_e_Mundo_do_Trabalho.pdf).
Almond, D.; Currie, J. (2011). Human Capital Development Before Age Five. In: Handbook of Labor
Economics. Vol. 4B, edited by Ashenfelter, O.; Card, D., 1315–1486. Amsterdam: Elsevier, North-
Holland.
Barro, R. J.; Lee, J. W. (1993). International Comparisons of Educational Attainment. Journal of
Monetary Economics, 32(3): 363–94.
Barro, R. J.; Lee, J. W. (2001). International Data on Educational Attainment: Updates and Implications.
Oxford Economic Papers, 53(3): 541–63.
Cameron, A. C., & Trivedi, P. K. (2005). Microeconometrics: methods and applications. Cambridge
university press.
Card, D. (1999). The Causal Effect of Education on Earnings. In: Handbook of Labor Economics,
Volume 3a, ed. Ashenfelter, O.; Card, D., 1801–63. Amsterdam; New York and Oxford: Elsevier
Science, North-Holland.
Carneiro, P., & Ginja, R. (2014). Long-term impacts of compensatory preschool on health and behavior:
Evidence from Head Start. American Economic Journal: Economic Policy, 6(4), 135-173.
Cesgranrio (2008). Projeto-Piloto para alfabetização de crianças de seis anos: leitura e escrita e
matemática. Fundação Cesgranrio (Research Report - Mimeo).
Coleman, J. S.; Campbell, E. Q.; Hobson, C. J. (1966). Equality of educational opportunity. Washington,
DC: U.S. Government Printing Office, 1966.
Currie, J.; Moretti, E. (2003). Mother’s Education and the Intergenerational Transmission of Human
Capital: Evidence from College Openings. Quarterly Journal of Economics, 118(4): 1495–1532.
Dehejia, R. H., Wahba, S. (2002). Propensity score-matching methods for nonexperimental causal
studies. Review of Economics and statistics, 84(1), 151-161.
Ehri, L. C., Nunes, S. R., Stahl, S. A., Willows, D. M. (2001). Systematic Phonics Instruction Helps
Students Learn to Read: Evidence from the National Reading Panel’s Meta-Analysis. Review of
Educational Research, Vol. 71(3), 393–447.
Fontanive, N., Klein, R., Abreu, M., & Bier, S. E. (2008). A alfabetização de crianças com seis anos: uma
contribuição para o debate sobre aquisição de habilidades de leitura escrita e matemática no primeiro ano
do ensino fundamental. Ensaio: Avaliação e Políticas Públicas em Educação, 16(61), 543-560.
Fuller, B.; Dellagnelo, L.; Strath, A.; Barretto, E. S.; Bastos, M. H. M; Matos, k. S. L.; Portela, A. L.;
Vieira, S. L. (1999). How to raise children's early literacy? the influence of family, teacher, and
classroom in northeast Brazil. Comparative Education Review 43 (1) (Feb.): pp. 1-35
Glewwe, Paul. W., Erik. A. Hanushek, Sara D. Humpage and Renato Ravina, “School resources and
educational outcomes in developing countries: A review of the literature from 1990 to 2010”, in
Education Policy in Developing Countries, Paul W. Glewwe, ed. (Chicago and London: The Chicago
University Press, 2013).
Gomes-Neto, J. B.; Hanushek, E. A. (1994). Causes and consequences of grade repetition: Evidence from
Brazil. Economic Development and Cultural Change 43 (1) (Oct.): pp. 117-148

20
Hambleton, R. K. Principles and selected applications of Item Response
Theory. In: Linn, R. (Ed.). Educational measurement. 3. ed. Washington,
DC: American Council on Education and the National Council on
Measurement in Education, 1993. p. 147-200.
Hanushek, E. A. (1997). Assessing the effects of school resources on student performance: an
update. Educational Evaluation & Policy Analysis, Washington, DC, v. 19, n. 2, p. 141-164, 2007.
Hanushek, Eric A. "Economic growth in developing countries: The role of human capital." Economics of
Education Review 37 (2013): 204-212.
Hanushek, E. A.; Woessmann, L. (2008). The role of cognitive skills in economic development. Journal
of Economic Literature, 46(September (3)), 607–668.
Harbison, R. W.; Hanushek, E. A. (1992). Educational performance of the poor: lessons from rural
northeast Brazil. New York: Oxford University Press.
Heckman, J. J., Humphries, J. E., & Kautz, T. (Eds.). (2014). The myth of achievement tests: The GED
and the role of character in American life. University of Chicago Press.
Heckman, J. J.; Lochner, L. J.; Todd, P. E. (2006). Earnings Functions, Rates of Return and Treatment
Effects: The Mincer Equation and Beyond.” In Handbook of the Economics of Education, Volume 1, ed.
Hanushek, E. A.; Welch, F., 307–458. Amsterdam and Oxford: Elsevier, North-Holland.
Heckman, J.; Pinto, R.; Savelyev, P. (2013). Understanding the mechanisms through which an influential
early childhood program boosted adult outcomes. The American Economic Review, 103(6), 2052-2086.
Lochner, L (2011). Nonproduction Benefits of Education: Crime, Health, and Good Citizenship. In
Hanushek, E. A.; Machin, S.; Woessmann, L. (eds.), Handbook of the Economics of Education, Vol. 4,
Ch. 2, Amsterdam: Elsevier Science, 2011.
Menezes-Filho, N.; Pazello, E. (2007). Do teachers' wages matter for proficiency? Evidence from a
funding reform in Brazil. Economics of Education Review, 26 (6): 660-72.
Mincer, Jacob, “The Distribution of Labor Incomes: A Survey with Special Reference to the Human
Capital Approach”, Journal of Economic Literature, v. 8, n. 1 (1970), p. 1-26.
Morais, J. (2017). Literacy and democracy. Language, Cognition and Neuroscience, 1-22.
Ramus, F. (2015). Alfabetização: que habilidades estão envolvidas, como avaliar. In: Morais, J. e
Oliveira. J. Alfabetização: em que consiste e como avaliar. Brasília: Instituto Alfa e Beto (Coleção IAB
de Seminários Internacionais).
Rosenbaum, P.; Rubin, D. (1983): The Central Role of the Propensity Score in Observational Studies for
Causal Effects, Biometrika, 70, 41–50.
Samejima, F. Estimation of latent ability using a response pattern of graded
scores. Psychometrika, New York, v. 17, Monograph Supplement, n. 4, part 2,
1969.
Torgerson, C. J.; Brooks, G.; Hall, J. (2006). A Systematic Review of the Research Literature on the Use
of Phonics in the Teaching of Reading and Spelling. Nottingham: DfES Publications (Research Report
RR711).
Yoncheva, Y. N.; Wise, J.; McCandliss, B. (2015). Hemispheric specialization for visual words is shaped
by attention to sublexical units during initial learning. Brain and Language, vol. 145–146, June–July,
pag. 23–33.