absorptive capacity and achieving the mdgs
TRANSCRIPT
141
6Absorptive Capacity and Achieving the MDGsThe Case of Ethiopia
MARK SUNDBERG AND HANS LOFGREN*
I. Introduction
The issues of effectiveness and absorptive capacity have attracted increasingattention in view of growing efforts to raise new and large-scale financialresources—beyond the 2000 Monterrey commitments—to help developingcountries achieve the Millennium Development Goals (MDGs). The estimatedannual cost of achieving the MDGs range from about $50 billion to $66 billioninitially, rising to $126 billion by 2015, in incremental MDG spending require-ments, on top of current aid flows.1 This represents a major increase in officialdevelopment assistance (ODA) flows to developing countries as a share ofOECD-Development Assistance Committee (DAC) country gross nationalincome. At the individual country level, this implies a large increase in ODA,in some cases a tripling or quadrupling of current flows to countries alreadyreceiving high levels of aid.
*World Bank. This work is part of a larger effort in the Development EconomicsDepartment of the World Bank (DECVP) to examine the financing requirements andeconomic impact of aid flows to support MDG-based poverty reduction strategies. SeeBourguignon and others (2004, 2005) and Lofgren and Diaz-Bonilla (2005).
1 Lower estimates are from the World Bank and various Development Committeepapers (see Global Monitoring Report, 2004) and higher estimates from the MillenniumProject Report, 2005.
3600-06_Ch06.qxd 4/12/06 2:41 PM Page 141
142 SUNDBERG AND LOFGRENf
Can low-income countries implement MDG programs and effectivelyabsorb much higher levels of aid and efficiently use them to achieve the MDGs?Some have argued that the MDG targets are overly ambitious “stretch targets,”whose achievement has no historical precedent (Clemens and others, 2004).Others argue (e.g., the Millennium Project Report 2005) that given the rightenvironment and level of external support, the MDGs are well within reach.All agree, however, that recipient countries must build adequate absorptivecapacity. In this paper, we consider the case of Ethiopia and examine severalimportant constraints to its absorption of aid in pursuit of the MDGs.
Ethiopia is a good case study of the impact of increased aid flows since con-siderable work has been done to assess its needs, limitations, and capacity. A2003 report by the Development Committee (the Joint Ministerial Commit-tee of the Boards of Governors of the Bank and Fund on the Transfer of RealResources to Developing Countries) for the 2003 Annual Meetings of theWorld Bank and IMF included a case study of Ethiopia that examined its capac-ity to absorb significantly higher aid flows in pursuit of the MDGs. The reportconcluded that a 60–100 percent increase in aid could be effectively absorbedif capacity-building efforts and accelerated structural reforms were put in place.This would allow Ethiopia to attain most of the core MDG targets (Develop-ment Committee, 2003). Ethiopia was also one of the pilot countries for workon Harmonization and Alignment of donor practices, and has made significantprogress toward coordinating assistance and harmonizing ODA flows.2 A studyby Foster and Keith (2003) for the British Overseas Development Institute onEthiopia and other African countries argues that a doubling of aid flows toEthiopia over the next five years is realistic. The Commission for Africa Report,released in March 2005 by the British government, also examines the poten-tial for Ethiopia to scale up spending for the MDGs and argues that a doublingof aid flows over the coming three to five years is feasible. An MDG “needsassessment” has been prepared for the Ethiopian government (Geda and oth-ers, 2005) and is being integrated into the government’s Poverty ReductionStrategy under the World Bank’s Sustainable Development and PovertyReduction Program (SDPRP). World Bank team and Millennium Projectteams have both been helping the Ethiopian government develop the method-ology and provide a consistency framework for the country’s medium-termMDG-focused forecasts. The World Bank’s “Maquette for MDG Simulations”(MAMS) has been one of the modeling frameworks used for this purpose.3
Large increases in aid clearly pose important macroeconomic risks and raisequestions about the underlying ability of the economy to effectively absorb
2 Harmonization and Alignment of donors refers to the efforts by bilateral and multi-lateral donors to harmonize their aid processing requirements with recipient countrypractices and align their support with the strategic priorities of recipient countries.
3 See Bourguignon and others (2004) and Lofgren (2004).
3600-06_Ch06.qxd 4/12/06 2:41 PM Page 142
Absorptive Capacity and Achieving the MDGs 143f
much higher resource flows. In this paper, we examine these issues for Ethiopiain a way that distinguishes between the implications of: directing aid at invest-ments in basic infrastructure (roads, energy, and irrigation) to help generaterapid growth and reduce the headcount poverty rate (consistent with pursuingMDG 1); and spending aid on social sectors to achieve the “social MDGs”—those for education, reduced mortality rates, and access to safe water and basicsanitation. We draw on simulations with the World Bank’s economy-wideMAMS model to address the issue of “Dutch disease”—whereby heavy aidinflows appreciate the exchange rate and hurt domestic demand and relativeprices. We explore the implications of different scenarios for real exchange ratesand exports as a share of GDP. We then analyze the trade-offs between front-loading aid disbursements and waiting until more absorptive capacity is in place,and we also look at the implications of a hypothetical increase in the rate of effi-ciency gain in public services achieved by “improved governance.” We provide abrief overview of Ethiopia’s macroeconomic performance and its main challenges.And then we briefly present an overview of the MAMS approach, which weuse to present the main MDG simulation results for the period 2005–15.
II. Ethiopia’s Economy and MDG Challenges
Ethiopia faces macroeconomic challenges characteristic of several low-income sub-Saharan African economies. Historically, it has experienced lowgrowth rates, is deeply indebted (it participates in the Heavily Indebted PoorCountries “HIPC” Initiative), is highly dependent on the agricultural sectorand agricultural exports (coffee), and has experienced volatile growth owing tofrequent external shocks (mainly from drought and terms of trade shocks).
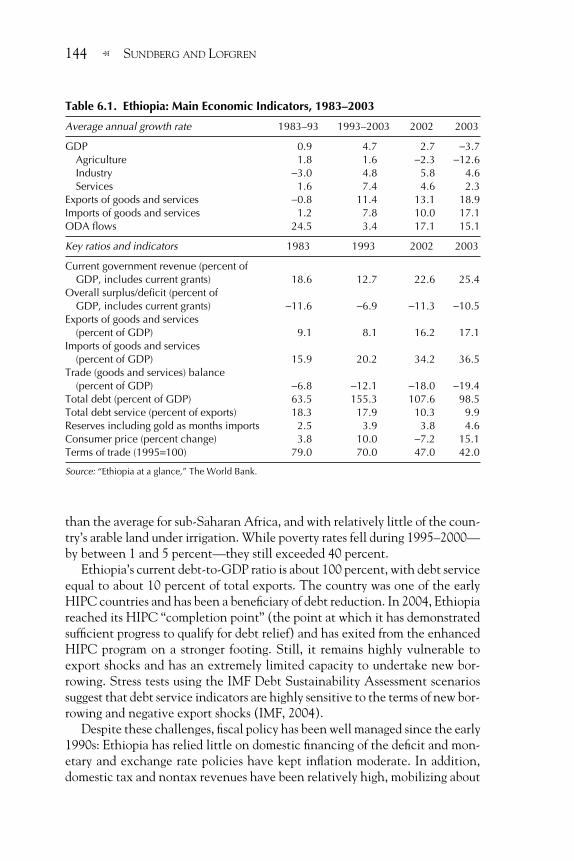
GDP growth in the 1980s was very low under Ethiopia’s socialist Derg regime.The overthrow of the regime in 1991, however, ushered in multiparty electionsin 1995 as well as a period of transition to market mechanisms, with reformsthat significantly boosted growth. In fact, growth accelerated during the 1990s,reaching 4.7 percent a year for the period from 1993 to 2003 (Table 6.1). Growthremained highly volatile throughout this period, however, and in 2003 growthfell by nearly 4 percent as the result of a drought that badly damaged agricul-ture output. Preliminary estimates for 2004 indicate that the economy expandedat a rate of nearly 11 percent. Following years of extremely weak performanceduring the 1980s and early 1990s, per capita incomes are today roughly wherethey were in the early 1970s.
The Ethiopian economy remains highly dependent on agriculture. The agri-cultural sector accounts for more than 40 percent of GDP and more than 85 per-cent of the population still depends on agriculture for its livelihood. This leavesa large part of the population at risk of famine owing to low yields and vulnera-bility to frequent drought, which is compounded by the weak rural infrastruc-ture. The national infrastructure overall is very poor, with far lower road density
3600-06_Ch06.qxd 4/12/06 2:41 PM Page 143
144 SUNDBERG AND LOFGRENf
than the average for sub-Saharan Africa, and with relatively little of the coun-try’s arable land under irrigation. While poverty rates fell during 1995–2000—by between 1 and 5 percent—they still exceeded 40 percent.
Ethiopia’s current debt-to-GDP ratio is about 100 percent, with debt serviceequal to about 10 percent of total exports. The country was one of the earlyHIPC countries and has been a beneficiary of debt reduction. In 2004, Ethiopiareached its HIPC “completion point” (the point at which it has demonstratedsufficient progress to qualify for debt relief) and has exited from the enhancedHIPC program on a stronger footing. Still, it remains highly vulnerable toexport shocks and has an extremely limited capacity to undertake new bor-rowing. Stress tests using the IMF Debt Sustainability Assessment scenariossuggest that debt service indicators are highly sensitive to the terms of new bor-rowing and negative export shocks (IMF, 2004).
Despite these challenges, fiscal policy has been well managed since the early1990s: Ethiopia has relied little on domestic financing of the deficit and mon-etary and exchange rate policies have kept inflation moderate. In addition,domestic tax and nontax revenues have been relatively high, mobilizing about
Table 6.1. Ethiopia: Main Economic Indicators, 1983–2003
Average annual growth rate 1983–93 1993–2003 2002 2003
GDP 0.9 4.7 2.7 −3.7Agriculture 1.8 1.6 −2.3 −12.6Industry −3.0 4.8 5.8 4.6Services 1.6 7.4 4.6 2.3
Exports of goods and services −0.8 11.4 13.1 18.9Imports of goods and services 1.2 7.8 10.0 17.1ODA flows 24.5 3.4 17.1 15.1
Key ratios and indicators 1983 1993 2002 2003
Current government revenue (percent ofGDP, includes current grants) 18.6 12.7 22.6 25.4
Overall surplus/deficit (percent of GDP, includes current grants) −11.6 −6.9 −11.3 −10.5
Exports of goods and services (percent of GDP) 9.1 8.1 16.2 17.1
Imports of goods and services (percent of GDP) 15.9 20.2 34.2 36.5
Trade (goods and services) balance (percent of GDP) −6.8 −12.1 −18.0 −19.4
Total debt (percent of GDP) 63.5 155.3 107.6 98.5Total debt service (percent of exports) 18.3 17.9 10.3 9.9Reserves including gold as months imports 2.5 3.9 3.8 4.6Consumer price (percent change) 3.8 10.0 −7.2 15.1Terms of trade (1995=100) 79.0 70.0 47.0 42.0
Source: “Ethiopia at a glance,” The World Bank.
3600-06_Ch06.qxd 4/12/06 2:41 PM Page 144
Absorptive Capacity and Achieving the MDGs 145f
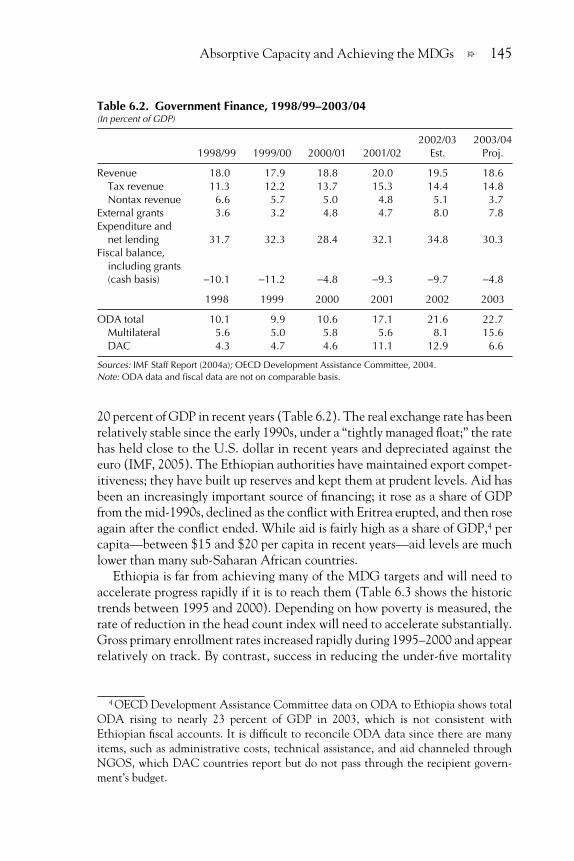
20 percent of GDP in recent years (Table 6.2). The real exchange rate has beenrelatively stable since the early 1990s, under a “tightly managed float;” the ratehas held close to the U.S. dollar in recent years and depreciated against theeuro (IMF, 2005). The Ethiopian authorities have maintained export compet-itiveness; they have built up reserves and kept them at prudent levels. Aid hasbeen an increasingly important source of financing; it rose as a share of GDPfrom the mid-1990s, declined as the conflict with Eritrea erupted, and then roseagain after the conflict ended. While aid is fairly high as a share of GDP,4 percapita—between $15 and $20 per capita in recent years—aid levels are muchlower than many sub-Saharan African countries.
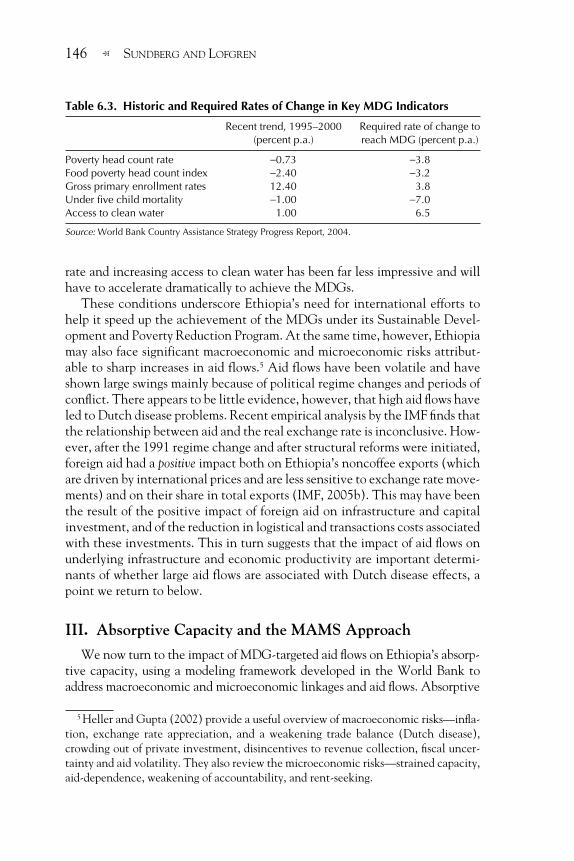
Ethiopia is far from achieving many of the MDG targets and will need toaccelerate progress rapidly if it is to reach them (Table 6.3 shows the historictrends between 1995 and 2000). Depending on how poverty is measured, therate of reduction in the head count index will need to accelerate substantially.Gross primary enrollment rates increased rapidly during 1995–2000 and appearrelatively on track. By contrast, success in reducing the under-five mortality
4 OECD Development Assistance Committee data on ODA to Ethiopia shows totalODA rising to nearly 23 percent of GDP in 2003, which is not consistent withEthiopian fiscal accounts. It is difficult to reconcile ODA data since there are manyitems, such as administrative costs, technical assistance, and aid channeled throughNGOS, which DAC countries report but do not pass through the recipient govern-ment’s budget.
Table 6.2. Government Finance, 1998/99–2003/04(In percent of GDP)
2002/03 2003/041998/99 1999/00 2000/01 2001/02 Est. Proj.
Revenue 18.0 17.9 18.8 20.0 19.5 18.6Tax revenue 11.3 12.2 13.7 15.3 14.4 14.8Nontax revenue 6.6 5.7 5.0 4.8 5.1 3.7
External grants 3.6 3.2 4.8 4.7 8.0 7.8Expenditure and
net lending 31.7 32.3 28.4 32.1 34.8 30.3Fiscal balance,
including grants(cash basis) −10.1 −11.2 −4.8 −9.3 −9.7 −4.8
1998 1999 2000 2001 2002 2003
ODA total 10.1 9.9 10.6 17.1 21.6 22.7Multilateral 5.6 5.0 5.8 5.6 8.1 15.6DAC 4.3 4.7 4.6 11.1 12.9 6.6
Sources: IMF Staff Report (2004a); OECD Development Assistance Committee, 2004.Note: ODA data and fiscal data are not on comparable basis.
3600-06_Ch06.qxd 4/12/06 2:41 PM Page 145
146 SUNDBERG AND LOFGRENf
rate and increasing access to clean water has been far less impressive and willhave to accelerate dramatically to achieve the MDGs.
These conditions underscore Ethiopia’s need for international efforts tohelp it speed up the achievement of the MDGs under its Sustainable Devel-opment and Poverty Reduction Program. At the same time, however, Ethiopiamay also face significant macroeconomic and microeconomic risks attribut-able to sharp increases in aid flows.5 Aid flows have been volatile and haveshown large swings mainly because of political regime changes and periods ofconflict. There appears to be little evidence, however, that high aid flows haveled to Dutch disease problems. Recent empirical analysis by the IMF finds thatthe relationship between aid and the real exchange rate is inconclusive. How-ever, after the 1991 regime change and after structural reforms were initiated,foreign aid had a positive impact both on Ethiopia’s noncoffee exports (whichare driven by international prices and are less sensitive to exchange rate move-ments) and on their share in total exports (IMF, 2005b). This may have beenthe result of the positive impact of foreign aid on infrastructure and capitalinvestment, and of the reduction in logistical and transactions costs associatedwith these investments. This in turn suggests that the impact of aid flows onunderlying infrastructure and economic productivity are important determi-nants of whether large aid flows are associated with Dutch disease effects, apoint we return to below.
III. Absorptive Capacity and the MAMS Approach
We now turn to the impact of MDG-targeted aid flows on Ethiopia’s absorp-tive capacity, using a modeling framework developed in the World Bank toaddress macroeconomic and microeconomic linkages and aid flows. Absorptive
Table 6.3. Historic and Required Rates of Change in Key MDG Indicators
Recent trend, 1995–2000 Required rate of change to(percent p.a.) reach MDG (percent p.a.)
Poverty head count rate −0.73 −3.8Food poverty head count index −2.40 −3.2Gross primary enrollment rates 12.40 3.8Under five child mortality −1.00 −7.0Access to clean water 1.00 6.5
Source: World Bank Country Assistance Strategy Progress Report, 2004.
5 Heller and Gupta (2002) provide a useful overview of macroeconomic risks—infla-tion, exchange rate appreciation, and a weakening trade balance (Dutch disease),crowding out of private investment, disincentives to revenue collection, fiscal uncer-tainty and aid volatility. They also review the microeconomic risks—strained capacity,aid-dependence, weakening of accountability, and rent-seeking.
3600-06_Ch06.qxd 4/12/06 2:41 PM Page 146
Absorptive Capacity and Achieving the MDGs 147f
capacity is a dynamic process linked to underlying forces of economic, social, andinstitutional development. The approach used here focuses on aid requirementsto reach the MDGs in Ethiopia. It abstracts from several elements of absorptivecapacity seen as instrumental to development, including governance, institu-tional capacity, ownership, and social and political stability. The approach alsoabstracts from several very real constraints facing Ethiopia today: severe financ-ing constraints, frequent exogenous shocks (particularly adverse climate and theterms of trade shocks), and unpredictable and volatile levels of foreign aid.
A Brief Overview of the MAMS Model
The MAMS model is a dynamic computable general equilibrium (CGE)model that has been extended to include a module that covers MDGs relatedto poverty, health, education, and water and sanitation. As noted earlier, therationale for using a model of this type is that the pursuit of MDG strategies hasstrong effects throughout the economy—via markets for foreign exchange, fac-tors (especially labor), and goods and services—with feedback effects that maysignificantly alter the findings of more narrow sectoral analyses. For example,the amount of real health or education services that a dollar in aid can buy maychange significantly in light of changes in exchange rates, prices, and wages. Inaddition, existing relationships between different MDGs (e.g., health and edu-cation) may influence the expansion in real services required—for example,improvements in water and sanitation may reduce the expansion in health ser-vices required to achieve the health MDGs.
In the application described here, the model is applied to an Ethiopian data-base and solved for the period 2002–15.6 More specifically, building on therecent literature and sector studies on health and education outcomes, MAMSconsiders the following MDGs:
• MDG 1: halving, between 1990 and 2015, the headcount poverty rate;• MDG 2: achieving universal primary education (100 percent completion
rate by 2015);• MDG 4: reducing by two thirds the under-five child mortality rate by 2015;• MDG 5: reducing by three fourths the maternal mortality rate; and• MDG 7: cutting by half the number of people without a) access to safe
water, and b) basic sanitation.
6 The model is presented in detail in Bourguignon and others (2004) and in Lofgren(2004). Preliminary applications to Ethiopia are discussed in Lofgren and Diaz-Bonilla(2005) and in Bourguignon and others (2005). The MAMS modeling remains a workin progress.
3600-06_Ch06.qxd 4/12/06 2:41 PM Page 147
148 SUNDBERG AND LOFGRENf
The model gives relatively detailed treatment to MDG-related governmentactivities. Government consumption, investment, and capital stocks are dis-aggregated by function into four education sectors, three health sectors, sectorsfor water and sanitation, public infrastructure, and other government activi-ties. The major government revenue sources are taxes (direct and indirect), foreign borrowing, and foreign grants. The nongovernment economy is repre-sented by a single activity. The primary factors of production are divided intopublic capital, private capital, and three types of labor (unskilled, skilled, andhighly-skilled). GDP growth is a function of growth in the stock of labor andcapital and productivity growth. The composition and overall growth of thelabor force depends on the evolution of the education sector whereas capitalstock growth depends on investments. Productivity growth is also endogenous,depending on growth in the stock of public capital in infrastructure.
The core MDG module specifies how changes in the different MDG indi-cators are determined. To the extent possible, it is parameterized on the basisof detailed sector studies on Ethiopia. In the education module, the govern-ment has an annual primary education budget covering teacher salaries, recur-rent operations and maintenance costs, and capital investment (for example,in new classrooms). Recurrent expenditures and the capital stock in primaryeducation together determine the supply side.7 Demand for primary schoolingand student behavior—the population share that enrolls in the first grade, grad-uation shares among the enrolled, and the share of graduates that choose tocontinue to the next grade—depend on six variables: the quality of education(student-teacher and student-capital ratios), income incentives (using currentwages as a proxy, the expected relative income gain from climbing one step onthe salary ladder), the under-five mortality rate (a proxy for the health statusof the school population), household consumption per capita, and the level ofpublic infrastructure services.
This specification of sector demand and supply captures lags between invest-ment and outcomes, which is one strength of the approach. Based on sectorstudies, the lags between increased enrollments and outcomes at different edu-cation levels are related to the number of years required for completion and onactual completion rates.
The specification of health services draws on a World Bank health sectorstrategy report for Ethiopia. Improvement in under-five and maternal mortal-ity rates (MDGs 4 and 5) are determined by the level of health services percapita (public and private services), per-capita consumption, and the popula-tion shares with access to improved water and sanitation services (MDG 7).The package of health services that achieves MDGs 4 and 5 also includesHIV/AIDS prevention services sufficient to halt the spread of the disease (part
7 Private supply of education services has not been separately included since it is rela-tively small in Ethiopia, but this could be elaborated for countries where it is important.
3600-06_Ch06.qxd 4/12/06 2:41 PM Page 148
Absorptive Capacity and Achieving the MDGs 149f
of MDG 6). For water and sanitation, the population share with access toimproved services is specified as a function of per capita household consump-tion and per capita provision of government water and sanitation services.
The provision of the additional government services needed to reach theMDGs clearly requires additional resources—capital, labor, and intermediateinputs—that then are unavailable to the rest of the economy. The effects of aprogram depend on how it is financed—from foreign sources, domestic taxes(which reduce consumption), or domestic borrowing (which crowds out pri-vate investment). Even with 100 percent foreign grant financing for additionalservices, which minimizes domestic resource costs, the rest of the economy isaffected through two main channels—labor markets and relative prices. Expand-ing the provision of health or education services increases demand for teachersand doctors, reducing the number of skilled workers available in other sectors.Increased school enrollment also reduces the size of the overall labor force(since it removes a larger part of the school-age population from the laborforce), although in the medium run it adds to the share of skilled labor in thelabor force. Two forces drive changes in relative commodity prices. First, domes-tic demand switches toward MDG-related government services with effects onproduction costs and prices throughout the economy. Second, increased aidflows lead to an appreciation of the real exchange rate, manifested in increasedprices of nontraded relative to traded outputs. These manifestations of Dutchdisease can bring about long-lasting changes in the structure of production,which is diverted from exports and competition with imports.
The limitations on absorptive capacity are captured through three mainchannels—the two channels just mentioned, in the labor market and in changesin the real exchange rate), as well as through potential infrastructure bottle-necks, particularly in transport and energy infrastructure. Large investments ineducation services, for example, will tend to reduce further absorptive capac-ity as skilled labor is diverted to education as the relative price of nontradablesrises (e.g., real wages are bid up reflecting the Dutch disease effect), and if infra-structure bottlenecks reduce the efficiency of public service delivery. Moreover,the impact will not be limited to the education sector; it also affects coststhroughout the economy, including other public services and costs in the pri-vate sector.
Policymakers thus face important trade-offs: increased investment in publicservice delivery is essential for improved MDG outcomes but beyond somepoint the unit costs begin rising, along with indirect costs to other sectors. Thechallenge is to keep costs down while targeting social outcomes over time.Building absorptive capacity is clearly a central element of this process.
There are also important complementarities in spending across differentMDGs—in our modeling framework represented by cross-elasticities—whereprogress toward one MDG may contribute to progress toward others. For exam-ple, progress in providing improved water and sanitation services has a positive
3600-06_Ch06.qxd 4/12/06 2:41 PM Page 149
150 SUNDBERG AND LOFGRENf
impact on heath outcomes. Another example is education: provision of pri-mary and secondary education helps expand the skilled workforce needed toincrease productivity both in the private sector and with respect to work inpublicly funded schools and clinics.
IV. Simulation Results from the Ethiopia MAMS Model
These simulation results build on work under way at the World Bank, incoordination with the Ethiopian authorities, to provide analytic inputs forEthiopia’s development strategy framework (the SDPRP). The model used forthis purpose has been calibrated around an Ethiopian country database for 2002and a basic Social Accounting Matrix prepared for Ethiopia, and supplementedby more detailed sector studies relevant to the MDGs, as described above. Thesimulations help to identify ODA magnitudes required to scale up public servicedelivery to achieve the MDGs, illustrate some of the major macro-economicimpacts under different financing and sequencing scenarios, and help quantifysome of the key trade-offs facing policymakers. The following basic simulationsdraw heavily on Lofgren and Diaz-Bonilla (2005). We first examine the basecase and variants on it and then discuss the issue of Dutch disease and its rele-vance for Ethiopia, frontloading and the implications of frontloading for costsand outcomes. We then briefly address the key role of governance and institu-tional reform in capacity building.
The reference point used to compare results is a “business-as-usual” base case,under which Ethiopia continues to receive external assistance and to performalong current trends. As a result of increased grant financing (annual foreignborrowing does not increase over time), external aid as grant financing isassumed to expand at an average rate of 1.5 percent a year from its level in2002—to $19 per capita in 2015—while foreign loans remain at their 2002level.8 The different areas of government services as well as GDP all grow at anannual rate of about 4 percent. This performance is similar to the long-rungrowth trend for Ethiopia’s economy.
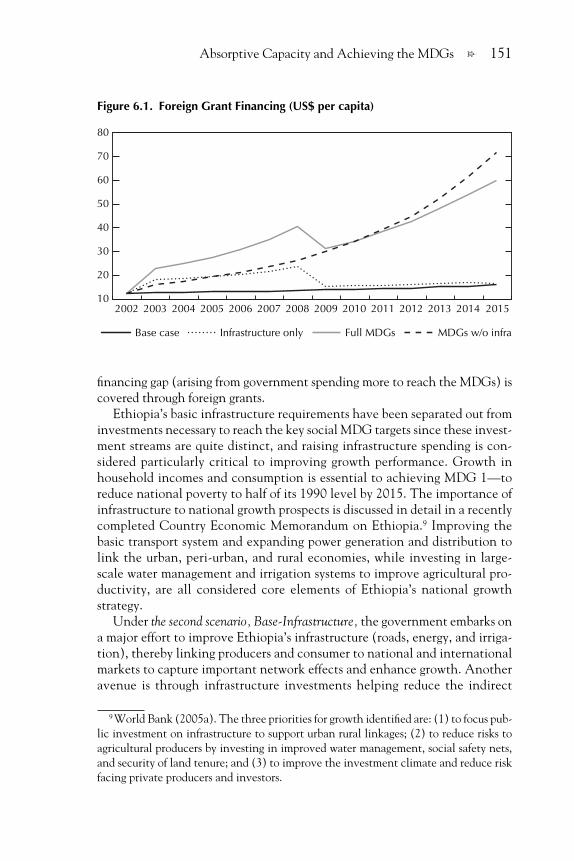
This base-case scenario is contrasted with three other scenarios that includeadditional ODA levels directed toward: (1) strengthening Ethiopia’s basicnational infrastructure and “connectivity” (Base + Infrastructure); (2) addi-tional ODA flows targeted to reach each of the five education, health, waterand sanitation MDGs in the model; and (3) ODA flows targeted to meet thesesocial MDGs, but without the underlying infrastructure financing. Using thesefour scenarios allows comparison across different levels ODA inflows with dif-ferent objectives and economic impact. Figure 6.1 shows the different foreigngrant financing paths underlying each scenario. In each of these scenarios, the
8 ODA here refers to official development assistance to government only, excludingflows to “other official entities,” and thus differs from data on total ODA.
3600-06_Ch06.qxd 4/12/06 2:41 PM Page 150
Absorptive Capacity and Achieving the MDGs 151f
financing gap (arising from government spending more to reach the MDGs) iscovered through foreign grants.
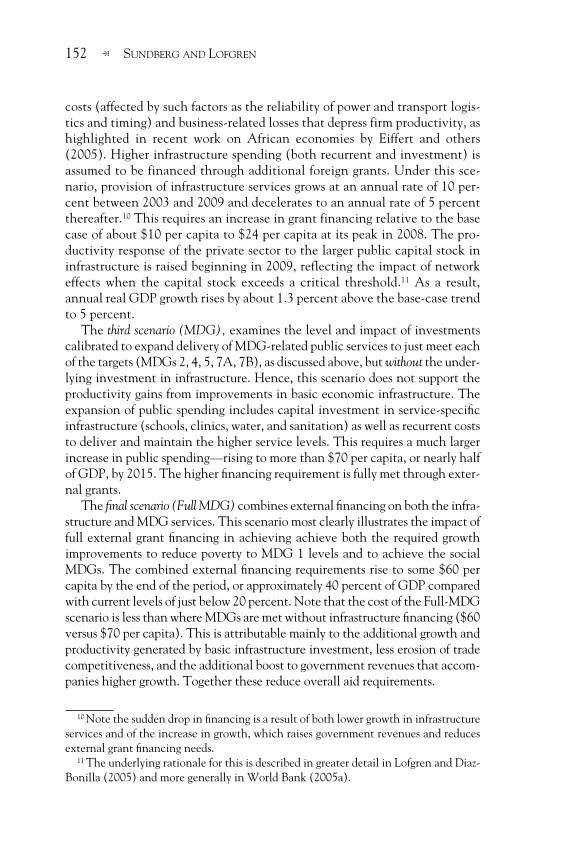
Ethiopia’s basic infrastructure requirements have been separated out frominvestments necessary to reach the key social MDG targets since these invest-ment streams are quite distinct, and raising infrastructure spending is con-sidered particularly critical to improving growth performance. Growth inhousehold incomes and consumption is essential to achieving MDG 1—toreduce national poverty to half of its 1990 level by 2015. The importance ofinfrastructure to national growth prospects is discussed in detail in a recentlycompleted Country Economic Memorandum on Ethiopia.9 Improving thebasic transport system and expanding power generation and distribution tolink the urban, peri-urban, and rural economies, while investing in large-scale water management and irrigation systems to improve agricultural pro-ductivity, are all considered core elements of Ethiopia’s national growthstrategy.
Under the second scenario, Base-Infrastructure, the government embarks ona major effort to improve Ethiopia’s infrastructure (roads, energy, and irriga-tion), thereby linking producers and consumer to national and internationalmarkets to capture important network effects and enhance growth. Anotheravenue is through infrastructure investments helping reduce the indirect
80
70
60
50
40
30
20
102002 2003 2004 2005 2006 2007 2008 2009 2010 2011 2012 2013 2014 2015
Infrastructure onlyBase case Full MDGs MDGs w/o infra
Figure 6.1. Foreign Grant Financing (US$ per capita)
9 World Bank (2005a). The three priorities for growth identified are: (1) to focus pub-lic investment on infrastructure to support urban rural linkages; (2) to reduce risks toagricultural producers by investing in improved water management, social safety nets,and security of land tenure; and (3) to improve the investment climate and reduce riskfacing private producers and investors.
3600-06_Ch06.qxd 4/12/06 2:41 PM Page 151
152 SUNDBERG AND LOFGRENf
costs (affected by such factors as the reliability of power and transport logis-tics and timing) and business-related losses that depress firm productivity, ashighlighted in recent work on African economies by Eiffert and others(2005). Higher infrastructure spending (both recurrent and investment) isassumed to be financed through additional foreign grants. Under this sce-nario, provision of infrastructure services grows at an annual rate of 10 per-cent between 2003 and 2009 and decelerates to an annual rate of 5 percentthereafter.10 This requires an increase in grant financing relative to the basecase of about $10 per capita to $24 per capita at its peak in 2008. The pro-ductivity response of the private sector to the larger public capital stock ininfrastructure is raised beginning in 2009, reflecting the impact of networkeffects when the capital stock exceeds a critical threshold.11 As a result,annual real GDP growth rises by about 1.3 percent above the base-case trendto 5 percent.
The third scenario (MDG), examines the level and impact of investmentscalibrated to expand delivery of MDG-related public services to just meet eachof the targets (MDGs 2, 4, 5, 7A, 7B), as discussed above, but without the under-lying investment in infrastructure. Hence, this scenario does not support theproductivity gains from improvements in basic economic infrastructure. Theexpansion of public spending includes capital investment in service-specificinfrastructure (schools, clinics, water, and sanitation) as well as recurrent coststo deliver and maintain the higher service levels. This requires a much largerincrease in public spending—rising to more than $70 per capita, or nearly halfof GDP, by 2015. The higher financing requirement is fully met through exter-nal grants.
The final scenario (Full MDG) combines external financing on both the infra-structure and MDG services. This scenario most clearly illustrates the impact offull external grant financing in achieving achieve both the required growthimprovements to reduce poverty to MDG 1 levels and to achieve the socialMDGs. The combined external financing requirements rise to some $60 percapita by the end of the period, or approximately 40 percent of GDP comparedwith current levels of just below 20 percent. Note that the cost of the Full-MDGscenario is less than where MDGs are met without infrastructure financing ($60versus $70 per capita). This is attributable mainly to the additional growth andproductivity generated by basic infrastructure investment, less erosion of tradecompetitiveness, and the additional boost to government revenues that accom-panies higher growth. Together these reduce overall aid requirements.
10 Note the sudden drop in financing is a result of both lower growth in infrastructureservices and of the increase in growth, which raises government revenues and reducesexternal grant financing needs.
11 The underlying rationale for this is described in greater detail in Lofgren and Diaz-Bonilla (2005) and more generally in World Bank (2005a).
3600-06_Ch06.qxd 4/12/06 2:41 PM Page 152
Absorptive Capacity and Achieving the MDGs 153f
Meeting the MDGs
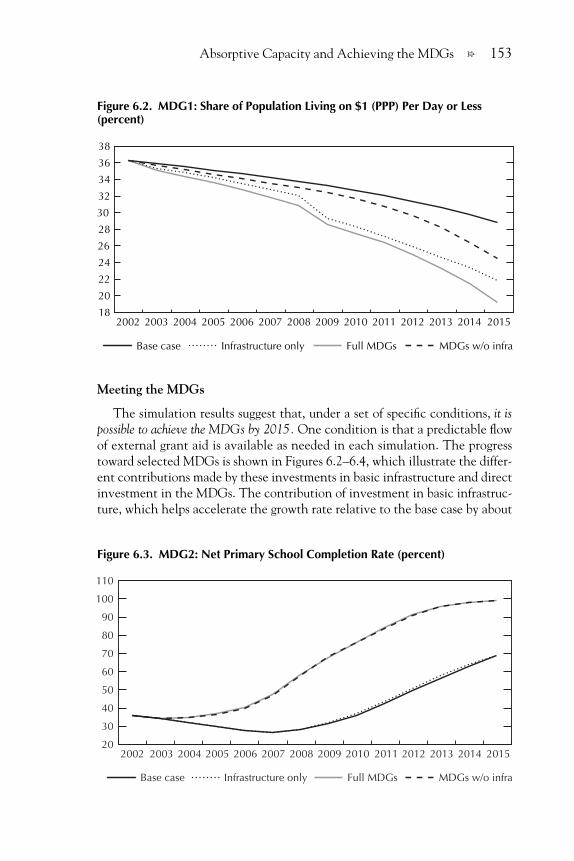
The simulation results suggest that, under a set of specific conditions, it ispossible to achieve the MDGs by 2015. One condition is that a predictable flowof external grant aid is available as needed in each simulation. The progresstoward selected MDGs is shown in Figures 6.2–6.4, which illustrate the differ-ent contributions made by these investments in basic infrastructure and directinvestment in the MDGs. The contribution of investment in basic infrastruc-ture, which helps accelerate the growth rate relative to the base case by about
32
34
36
38
30
28
26
24
22
20
182002 2003 2004 2005 2006 2007 2008 2009 2010 2011 2012 2013 2014 2015
Base case Infrastructure only Full MDGs MDGs w/o infra
Figure 6.2. MDG1: Share of Population Living on $1 (PPP) Per Day or Less (percent)
2002 2003 2004 2005 2006 2007 2008 2009 2010 2011 2012 2013 2014 201520
30
40
50
60
70
80
90
100
110
Full MDGsInfrastructure only MDGs w/o infraBase case
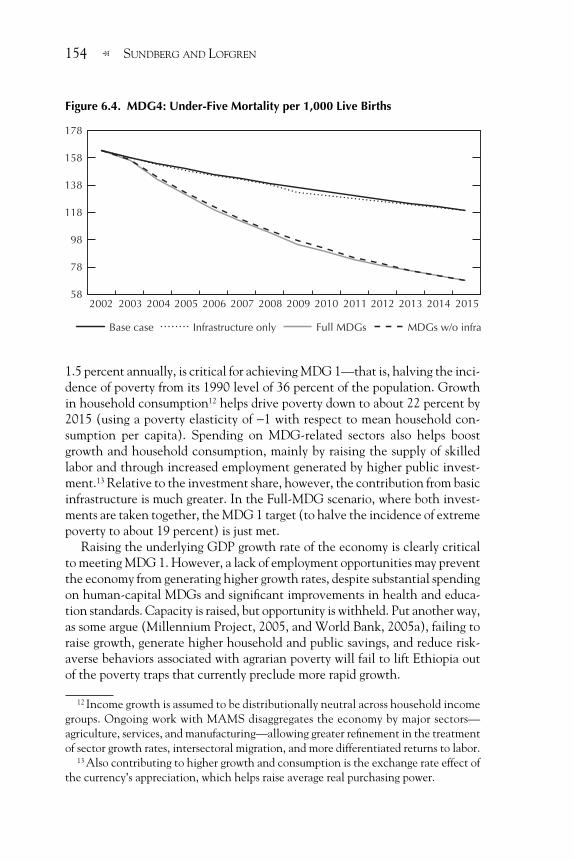
Figure 6.3. MDG2: Net Primary School Completion Rate (percent)
3600-06_Ch06.qxd 4/12/06 2:41 PM Page 153
154 SUNDBERG AND LOFGRENf
1.5 percent annually, is critical for achieving MDG 1—that is, halving the inci-dence of poverty from its 1990 level of 36 percent of the population. Growthin household consumption12 helps drive poverty down to about 22 percent by2015 (using a poverty elasticity of −1 with respect to mean household con-sumption per capita). Spending on MDG-related sectors also helps boostgrowth and household consumption, mainly by raising the supply of skilledlabor and through increased employment generated by higher public invest-ment.13 Relative to the investment share, however, the contribution from basicinfrastructure is much greater. In the Full-MDG scenario, where both invest-ments are taken together, the MDG 1 target (to halve the incidence of extremepoverty to about 19 percent) is just met.
Raising the underlying GDP growth rate of the economy is clearly criticalto meeting MDG 1. However, a lack of employment opportunities may preventthe economy from generating higher growth rates, despite substantial spendingon human-capital MDGs and significant improvements in health and educa-tion standards. Capacity is raised, but opportunity is withheld. Put another way,as some argue (Millennium Project, 2005, and World Bank, 2005a), failing toraise growth, generate higher household and public savings, and reduce risk-averse behaviors associated with agrarian poverty will fail to lift Ethiopia outof the poverty traps that currently preclude more rapid growth.
2002 2003 2004 2005 2006 2007 2008 2009 2010 2011 2012 2013 2014 201558
78
118
138
98
158
178
Full MDGsInfrastructure only MDGs w/o infraBase case
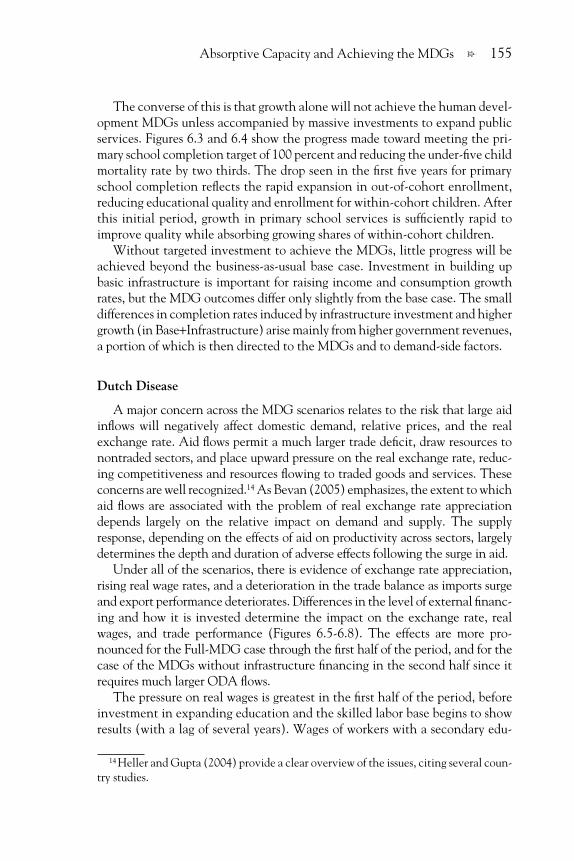
Figure 6.4. MDG4: Under-Five Mortality per 1,000 Live Births
12 Income growth is assumed to be distributionally neutral across household incomegroups. Ongoing work with MAMS disaggregates the economy by major sectors—agriculture, services, and manufacturing—allowing greater refinement in the treatmentof sector growth rates, intersectoral migration, and more differentiated returns to labor.
13 Also contributing to higher growth and consumption is the exchange rate effect ofthe currency’s appreciation, which helps raise average real purchasing power.
3600-06_Ch06.qxd 4/12/06 2:41 PM Page 154
Absorptive Capacity and Achieving the MDGs 155f
The converse of this is that growth alone will not achieve the human devel-opment MDGs unless accompanied by massive investments to expand publicservices. Figures 6.3 and 6.4 show the progress made toward meeting the pri-mary school completion target of 100 percent and reducing the under-five childmortality rate by two thirds. The drop seen in the first five years for primaryschool completion reflects the rapid expansion in out-of-cohort enrollment,reducing educational quality and enrollment for within-cohort children. Afterthis initial period, growth in primary school services is sufficiently rapid toimprove quality while absorbing growing shares of within-cohort children.
Without targeted investment to achieve the MDGs, little progress will beachieved beyond the business-as-usual base case. Investment in building upbasic infrastructure is important for raising income and consumption growthrates, but the MDG outcomes differ only slightly from the base case. The smalldifferences in completion rates induced by infrastructure investment and highergrowth (in Base+Infrastructure) arise mainly from higher government revenues,a portion of which is then directed to the MDGs and to demand-side factors.
Dutch Disease
A major concern across the MDG scenarios relates to the risk that large aidinflows will negatively affect domestic demand, relative prices, and the realexchange rate. Aid flows permit a much larger trade deficit, draw resources tonontraded sectors, and place upward pressure on the real exchange rate, reduc-ing competitiveness and resources flowing to traded goods and services. Theseconcerns are well recognized.14 As Bevan (2005) emphasizes, the extent to whichaid flows are associated with the problem of real exchange rate appreciationdepends largely on the relative impact on demand and supply. The supplyresponse, depending on the effects of aid on productivity across sectors, largelydetermines the depth and duration of adverse effects following the surge in aid.
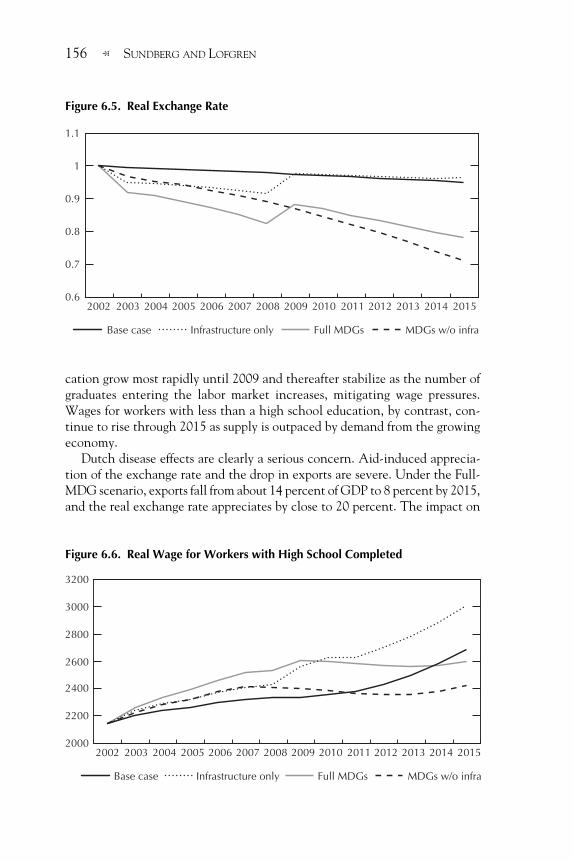
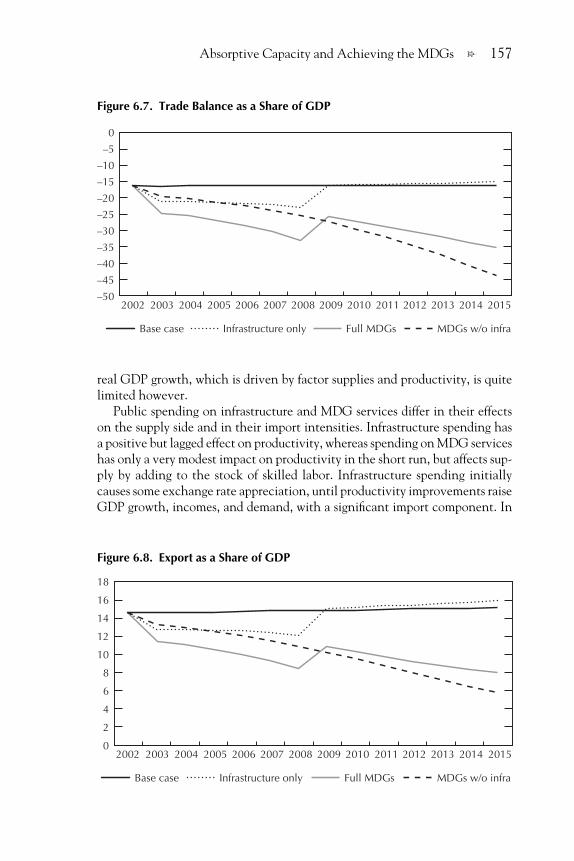
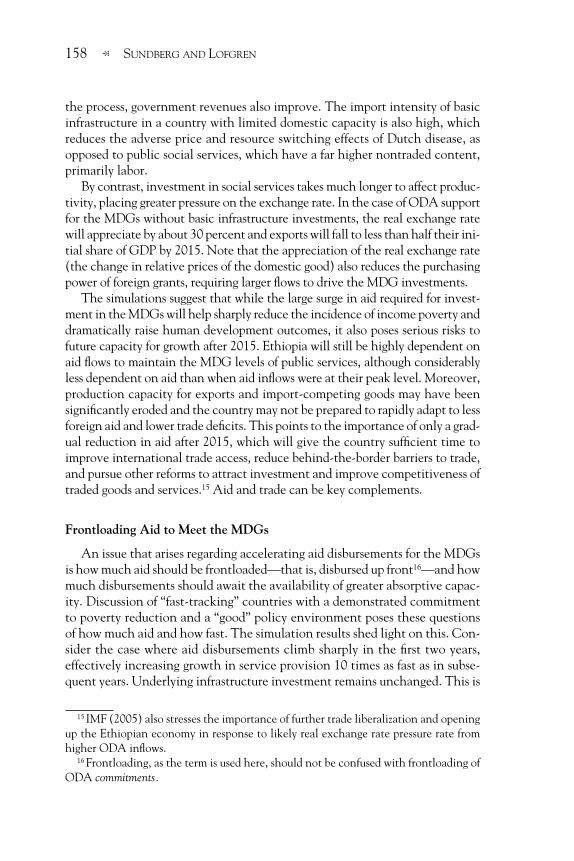
Under all of the scenarios, there is evidence of exchange rate appreciation,rising real wage rates, and a deterioration in the trade balance as imports surgeand export performance deteriorates. Differences in the level of external financ-ing and how it is invested determine the impact on the exchange rate, realwages, and trade performance (Figures 6.5-6.8). The effects are more pro-nounced for the Full-MDG case through the first half of the period, and for thecase of the MDGs without infrastructure financing in the second half since itrequires much larger ODA flows.
The pressure on real wages is greatest in the first half of the period, beforeinvestment in expanding education and the skilled labor base begins to showresults (with a lag of several years). Wages of workers with a secondary edu-
14 Heller and Gupta (2004) provide a clear overview of the issues, citing several coun-try studies.
3600-06_Ch06.qxd 4/12/06 2:41 PM Page 155
156 SUNDBERG AND LOFGRENf
cation grow most rapidly until 2009 and thereafter stabilize as the number ofgraduates entering the labor market increases, mitigating wage pressures.Wages for workers with less than a high school education, by contrast, con-tinue to rise through 2015 as supply is outpaced by demand from the growingeconomy.
Dutch disease effects are clearly a serious concern. Aid-induced apprecia-tion of the exchange rate and the drop in exports are severe. Under the Full-MDG scenario, exports fall from about 14 percent of GDP to 8 percent by 2015,and the real exchange rate appreciates by close to 20 percent. The impact on
2002 2003 2004 2005 2006 2007 2008 2009 2010 2011 2012 2013 2014 20150.6
0.7
0.9
1
0.8
1.1
Full MDGsInfrastructure only MDGs w/o infraBase case
Figure 6.5. Real Exchange Rate
2002 2003 2004 2005 2006 2007 2008 2009 2010 2011 2012 2013 2014 20152000
2200
2600
3000
2400
2800
3200
Full MDGsInfrastructure only MDGs w/o infraBase case
Figure 6.6. Real Wage for Workers with High School Completed
3600-06_Ch06.qxd 4/12/06 2:41 PM Page 156
Absorptive Capacity and Achieving the MDGs 157f
real GDP growth, which is driven by factor supplies and productivity, is quitelimited however.
Public spending on infrastructure and MDG services differ in their effectson the supply side and in their import intensities. Infrastructure spending hasa positive but lagged effect on productivity, whereas spending on MDG serviceshas only a very modest impact on productivity in the short run, but affects sup-ply by adding to the stock of skilled labor. Infrastructure spending initiallycauses some exchange rate appreciation, until productivity improvements raiseGDP growth, incomes, and demand, with a significant import component. In
2002 2003 2004 2005 2006 2007 2008 2009 2010 2011 2012 2013 2014 2015–50
–45
–35
–25
–20
–15
–10
–5
–40
–30
0
Full MDGsInfrastructure only MDGs w/o infraBase case
Figure 6.7. Trade Balance as a Share of GDP
2002 2003 2004 2005 2006 2007 2008 2009 2010 2011 2012 2013 2014 20150
2
6
10
12
14
16
4
8
18
Full MDGsInfrastructure only MDGs w/o infraBase case
Figure 6.8. Export as a Share of GDP
3600-06_Ch06.qxd 4/12/06 2:41 PM Page 157
158 SUNDBERG AND LOFGRENf
the process, government revenues also improve. The import intensity of basicinfrastructure in a country with limited domestic capacity is also high, whichreduces the adverse price and resource switching effects of Dutch disease, asopposed to public social services, which have a far higher nontraded content,primarily labor.
By contrast, investment in social services takes much longer to affect produc-tivity, placing greater pressure on the exchange rate. In the case of ODA supportfor the MDGs without basic infrastructure investments, the real exchange ratewill appreciate by about 30 percent and exports will fall to less than half their ini-tial share of GDP by 2015. Note that the appreciation of the real exchange rate(the change in relative prices of the domestic good) also reduces the purchasingpower of foreign grants, requiring larger flows to drive the MDG investments.
The simulations suggest that while the large surge in aid required for invest-ment in the MDGs will help sharply reduce the incidence of income poverty anddramatically raise human development outcomes, it also poses serious risks tofuture capacity for growth after 2015. Ethiopia will still be highly dependent onaid flows to maintain the MDG levels of public services, although considerablyless dependent on aid than when aid inflows were at their peak level. Moreover,production capacity for exports and import-competing goods may have beensignificantly eroded and the country may not be prepared to rapidly adapt to lessforeign aid and lower trade deficits. This points to the importance of only a grad-ual reduction in aid after 2015, which will give the country sufficient time toimprove international trade access, reduce behind-the-border barriers to trade,and pursue other reforms to attract investment and improve competitiveness oftraded goods and services.15 Aid and trade can be key complements.
Frontloading Aid to Meet the MDGs
An issue that arises regarding accelerating aid disbursements for the MDGsis how much aid should be frontloaded—that is, disbursed up front16—and howmuch disbursements should await the availability of greater absorptive capac-ity. Discussion of “fast-tracking” countries with a demonstrated commitmentto poverty reduction and a “good” policy environment poses these questionsof how much aid and how fast. The simulation results shed light on this. Con-sider the case where aid disbursements climb sharply in the first two years,effectively increasing growth in service provision 10 times as fast as in subse-quent years. Underlying infrastructure investment remains unchanged. This is
15 IMF (2005) also stresses the importance of further trade liberalization and openingup the Ethiopian economy in response to likely real exchange rate pressure rate fromhigher ODA inflows.
16 Frontloading, as the term is used here, should not be confused with frontloading ofODA commitments.
3600-06_Ch06.qxd 4/12/06 2:41 PM Page 158
Absorptive Capacity and Achieving the MDGs 159f
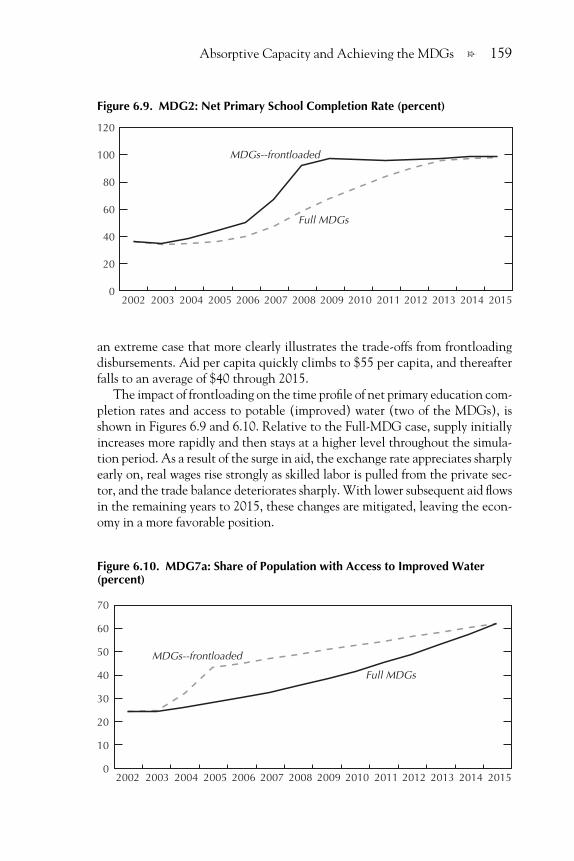
an extreme case that more clearly illustrates the trade-offs from frontloadingdisbursements. Aid per capita quickly climbs to $55 per capita, and thereafterfalls to an average of $40 through 2015.
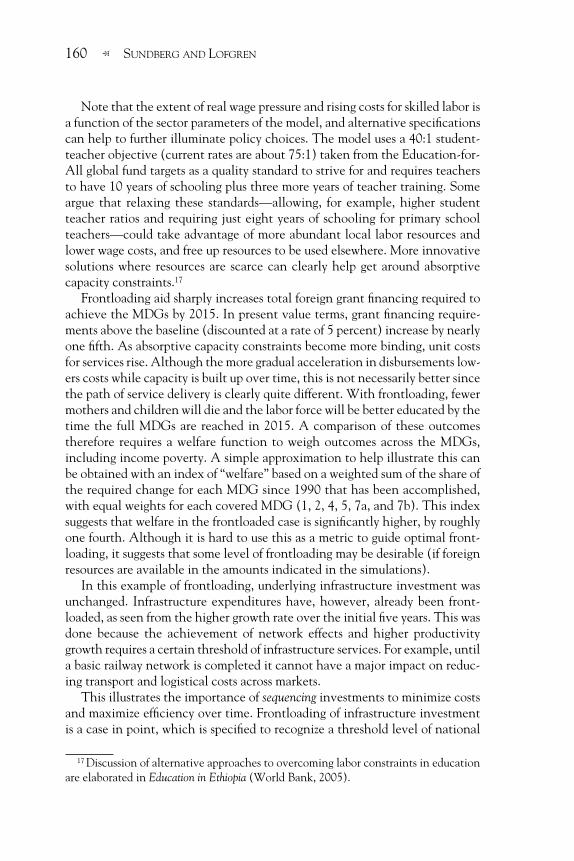
The impact of frontloading on the time profile of net primary education com-pletion rates and access to potable (improved) water (two of the MDGs), isshown in Figures 6.9 and 6.10. Relative to the Full-MDG case, supply initiallyincreases more rapidly and then stays at a higher level throughout the simula-tion period. As a result of the surge in aid, the exchange rate appreciates sharplyearly on, real wages rise strongly as skilled labor is pulled from the private sec-tor, and the trade balance deteriorates sharply. With lower subsequent aid flowsin the remaining years to 2015, these changes are mitigated, leaving the econ-omy in a more favorable position.
2002 2003 2004 2005 2006 2007 2008 2009 2010 2011 2012 2013 2014 20150
20
60
100
40
80
120
MDGs--frontloaded
Full MDGs
Figure 6.9. MDG2: Net Primary School Completion Rate (percent)
2002 2003 2004 2005 2006 2007 2008 2009 2010 2011 2012 2013 2014 20150
10
30
50
20
40
70
60
MDGs--frontloaded
Full MDGs
Figure 6.10. MDG7a: Share of Population with Access to Improved Water(percent)
3600-06_Ch06.qxd 4/12/06 2:41 PM Page 159
160 SUNDBERG AND LOFGRENf
Note that the extent of real wage pressure and rising costs for skilled labor isa function of the sector parameters of the model, and alternative specificationscan help to further illuminate policy choices. The model uses a 40:1 student-teacher objective (current rates are about 75:1) taken from the Education-for-All global fund targets as a quality standard to strive for and requires teachersto have 10 years of schooling plus three more years of teacher training. Someargue that relaxing these standards—allowing, for example, higher studentteacher ratios and requiring just eight years of schooling for primary schoolteachers—could take advantage of more abundant local labor resources andlower wage costs, and free up resources to be used elsewhere. More innovativesolutions where resources are scarce can clearly help get around absorptivecapacity constraints.17
Frontloading aid sharply increases total foreign grant financing required toachieve the MDGs by 2015. In present value terms, grant financing require-ments above the baseline (discounted at a rate of 5 percent) increase by nearlyone fifth. As absorptive capacity constraints become more binding, unit costsfor services rise. Although the more gradual acceleration in disbursements low-ers costs while capacity is built up over time, this is not necessarily better sincethe path of service delivery is clearly quite different. With frontloading, fewermothers and children will die and the labor force will be better educated by thetime the full MDGs are reached in 2015. A comparison of these outcomestherefore requires a welfare function to weigh outcomes across the MDGs,including income poverty. A simple approximation to help illustrate this canbe obtained with an index of “welfare” based on a weighted sum of the share ofthe required change for each MDG since 1990 that has been accomplished,with equal weights for each covered MDG (1, 2, 4, 5, 7a, and 7b). This indexsuggests that welfare in the frontloaded case is significantly higher, by roughlyone fourth. Although it is hard to use this as a metric to guide optimal front-loading, it suggests that some level of frontloading may be desirable (if foreignresources are available in the amounts indicated in the simulations).
In this example of frontloading, underlying infrastructure investment wasunchanged. Infrastructure expenditures have, however, already been front-loaded, as seen from the higher growth rate over the initial five years. This wasdone because the achievement of network effects and higher productivitygrowth requires a certain threshold of infrastructure services. For example, untila basic railway network is completed it cannot have a major impact on reduc-ing transport and logistical costs across markets.
This illustrates the importance of sequencing investments to minimize costsand maximize efficiency over time. Frontloading of infrastructure investmentis a case in point, which is specified to recognize a threshold level of national
17 Discussion of alternative approaches to overcoming labor constraints in educationare elaborated in Education in Ethiopia (World Bank, 2005).
3600-06_Ch06.qxd 4/12/06 2:41 PM Page 160
Absorptive Capacity and Achieving the MDGs 161f
infrastructure that must be met before productivity gains can be realized. Thethreshold level should ideally be estimated based on detailed infrastructure sec-tor studies.
Among the MDG services, investment in education services must be givenpriority, since skilled labor can only be produced with a lag, and since skilledlabor is a key input to expanding the supply of all the MDG services. In addi-tion, sequencing priority should be accorded to investment in public servicesthat generate positive externalities and thereby help lower the investment costof other MDGs. If access to improved water is a key element of reducing under-five mortality, then investment in developing and maintaining potable watersupplies must precede or accompany other child-health-related investments. Ifthis order of sequencing is reversed (i.e., the other MDGs are expanded beforeinvestment in water, education, and basic infrastructure services), total costswould rise and the likelihood of meeting the MDGs by 2015 would be reduced.
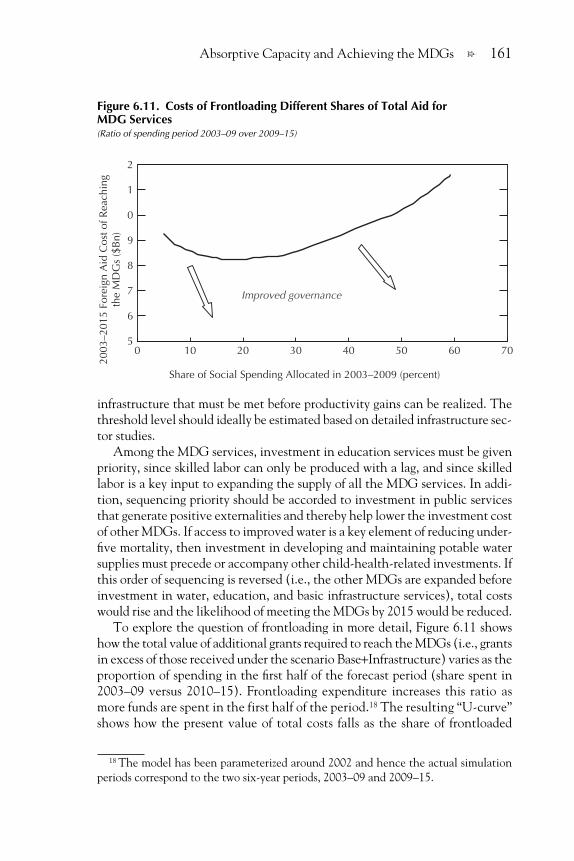
To explore the question of frontloading in more detail, Figure 6.11 showshow the total value of additional grants required to reach the MDGs (i.e., grantsin excess of those received under the scenario Base+Infrastructure) varies as theproportion of spending in the first half of the forecast period (share spent in2003–09 versus 2010–15). Frontloading expenditure increases this ratio asmore funds are spent in the first half of the period.18 The resulting “U-curve”shows how the present value of total costs falls as the share of frontloaded
5
6
7
8
9
0
1
2
0 10 20 30 40 50 60 70
Share of Social Spending Allocated in 2003–2009 (percent)
Improved governance
2003
–201
5 Fo
reig
n A
id C
ost o
f Rea
chin
gth
e M
DG
s ($
Bn)
Figure 6.11. Costs of Frontloading Different Shares of Total Aid for MDG Services(Ratio of spending period 2003–09 over 2009–15)
18 The model has been parameterized around 2002 and hence the actual simulationperiods correspond to the two six-year periods, 2003–09 and 2009–15.
3600-06_Ch06.qxd 4/12/06 2:41 PM Page 161
162 SUNDBERG AND LOFGRENf
expenditures increases from very low shares. Costs are minimized when about20 percent of resources are disbursed in the first period. Higher shares front-loaded lead to rising costs as constraints become more binding—labor costs rise,exchange rate appreciation reduces the purchasing value of aid, and congestioncosts from infrastructure bottlenecks increase. At the extreme, some pointabove 70 percent of resources frontloaded, costs become effectively infinite andpreclude reaching the MDGs.
We urge caution in interpreting this result, however. First, while this sug-gests that total present value costs are minimized at about 20 percent of out-lays, different points along the curve show very different welfare outcomes. Asmore resources are frontloaded, MDG outcomes are also frontloaded and wel-fare, measured by the simple MDG index, clearly improves. Second, underly-ing exchange rate and wage dynamics are very different along the curve, withconsequences for competitiveness of traded goods and sharp wage differentials.Our point is not to suggest an optimum, but rather to illustrate the real conse-quences of frontloading that merit consideration when countries plan aid-financed, long-term public investment programs.
Governance and Institutional Reforms
The model does not address the critical question of how to improve theunderlying institutional capacity and governance in Ethiopia. The broadrange of issues related to institutional capacity and governance are at theheart of most adjustment programs and poverty reduction strategies. Theseinclude improving expenditure management, strengthening accountabilitymechanisms, reducing leakages through “capture” and corruption, deregulat-ing excessive government controls often associated with rent-seeking, andprivatization and strengthening the environment for private business. InEthiopia, particular importance has been placed on decentralization in thegovernment’s reform program, with selective devolution of resources andresponsibilities—including important responsibilities over public servicedelivery19—to Ethiopia’s nine regions. Successful implementation of the decen-tralization program is recognized as a key element of the country’s povertyreduction strategy (SDPRP).
Taken together, governance and institutional reforms can be thought of asmeasures to improve the efficiency of public resource use. In terms of the model,they affect the underlying productivity of public activities and reduce the unitcosts of achieving the MDGs—falling teacher absenteeism; reduced waitingtimes for processing legal cases, licensing, and regulatory issues; and less leak-
19 As Heller and Gupta (2002) note, decentralization to channel resources throughlocal governments in particular runs the risk of administrative constraints and defi-ciencies in expenditure management.
3600-06_Ch06.qxd 4/12/06 2:41 PM Page 162
Absorptive Capacity and Achieving the MDGs 163f
age in the use of central government resources for delivery of services to end-users. Sometimes simple reforms can have major consequences.20
To reflect further on this, we consider the effect of introducing governanceand institutional reforms in the form of improvement in the underlying effi-ciency of public services at the rate of 2 percent, compounded annually, andindependent of the rate of public investment. Introducing this to the modeland recalculating the U-curve in Figure 6.11 suggests two results:
• The productivity gain in public services significantly reduces the cost ofachieving the MDGs along all points of the curve and “flattens” thecurve, reducing the total variation in costs. The total cost of achievingthe MDGs by 2015 in present value terms falls by about one third.
• The new point of cost minimization leans slightly toward greater front-loading contrary to the expectation that it would shift to the left (less front-loading as productivity levels are higher and unit costs are lower during thesecond period). The ambiguity in this outcome arises from two underlyingeffects that push in opposite directions. Behavioral effects would tend topush toward delaying investment and reduce frontloading since it is moreefficient to wait and take advantage of productivity gains. On the otherhand, there is a change in relative prices between periods with no behav-ioral shift since the present value of expenditures in period one falls by lessthan the present value of expenditures in the second period.
One implication of this analysis is that anticipated incremental gains inunderlying governance or productivity should not be a reason to delay publicexpenditures in capacity building and service delivery. Even with underlyingefficiency gains that reduce costs over time, there is no reason to delay invest-ment in the MDGs. Rather, the same constraints to absorptive capacity—laborcosts, macroeconomic constraints, and infrastructure congestion—should guidethe investment path.
V. Conclusions
One of the major concerns of governments over disbursing aid to help low-income countries achieve the MDGs is whether the large levels of aid requiredcan be effectively absorbed. There are both macroeconomic and microeconomicconstraints to aid absorption that are well recognized in the literature. In thispaper, we have focused on selective aspects of this question related to the level,
20 One frequently cited example is the Ugandan newspaper campaign to boost schools’and parents’ ability to monitor local officials’ handling of school grants. Through greaterpublic awareness, “capture” or leakage of budget resources fell from 80 percent to 20 per-cent between 1995 and 2001 (Reinikka and Svensson, 2003).
3600-06_Ch06.qxd 4/12/06 2:41 PM Page 163
164 SUNDBERG AND LOFGRENf
sequencing, and frontloading of aid necessary to fulfill the MDGs. If externalfinancing is not the constraint, we have posed the question of what major absorp-tive capacity constraints will guide identification of a cost-minimizing path toreach the targets. In particular, we looked at labor market, macroeconomic(Dutch disease), and basic infrastructure constraints. To address these questions,we have used a modeling approach that combines a relatively standard andhighly aggregated computable general equilibrium model with an MDG mod-ule that links MDG performance to the provision of different public services(health, education, and water and sanitation), public infrastructure, per-capitaincome, and other economic indicators. The MDG module draws on detailedsector studies undertaken by the Ethiopian government and the World Bank.
We have used model simulations to examine a set of alternative scenarios forexpanding public infrastructure and MDG-related services, with external grantscovering the financing gap. Meeting the first MDG—reducing by half the inci-dence of income poverty in 2015 from 1990 levels—will require higher economicgrowth. We argue that one key to raising growth is substantial investment in basicinfrastructure, particularly roads, energy, and water control. Reaching the otherhuman development MDGs will require spending to boost the quality and quan-tity of publicly-supplied services related to MDGs. According to model simula-tions, for the main scenario—which achieves the different MDGs through acombination of frontloaded expansion in infrastructure spending and growth inMDG services at a constant rate—foreign grant financing requirements will risefrom about $16 per capita at present to some $60 per capita in 2015, or nearly40 percent of annual GDP in foreign grants. This is roughly twice the averagelevel of ODA per capita reached in sub-Saharan Africa during the early 1990s.
On the basis of our analysis of the simulation results, we draw four othermain conclusions from the simulations presented.
1. Careful sequencing of public investment is important for minimizing thetotal cost of reaching the MDGs. From the outset priority investment isneeded in basic infrastructure to generate the basis for higher productiv-ity growth and network effects improving linkages across and withinregions and sectors. Among the MDG services, accelerating educationspending is a priority since skilled labor only results with a lag and is abinding constraint on absorptive capacity. Priority in sequencing shouldbe accorded to public investment in services that generate important pos-itive externalities, and in doing so lower investment costs of other MDGs.
2. The macroeconomic impact of large aid flows on the tradable sector,through pulling resources into nontradables and exchange rate appreci-ation (Dutch disease), is a serious concern. The danger is that the MDGsmay be met but at the cost of a severely diminished export sector—asector that is a potentially vital source for future growth. This poses apotentially serious trade-off for MDG-oriented poverty reduction strate-
3600-06_Ch06.qxd 4/12/06 2:41 PM Page 164
Absorptive Capacity and Achieving the MDGs 165f
gies. More important, it underscores the need to push further trade lib-eralization, press for market access in OECD countries, and addressbehind-the-border barriers to trade.
3. Large-scale frontloading of aid disbursements (other than infrastructure)is costly as it pushes up against absorptive capacity constraints, increasesthe premium on skilled wages, bids labor away from the private sector(depressing growth), and incurs more serious Dutch disease effects. Com-paring the present value of additional MDG grants while varying theshare of total aid disbursed in the first five years suggests that costs areminimized when about one fifth of additional resources are used in thefirst five years. On the other hand, frontloading also has different welfareimplications: greater frontloading secures earlier success of social out-comes, whose marginal benefits may outweigh rising costs.
4. Improvements in underlying governance and institutional structures maysecure broad productivity improvements in public service delivery.Whether such gains suggest more or less frontloading of expendituresdepends on the relative weight of behavior and price effects on supply.This, however, does not constitute a reason to delay public investmentpending efficiency gains. Rather, it suggests that the same constraints toabsorptive capacity—labor costs, macroeconomic constraints, infra-structure congestion—help guide the investment path.
We are not suggesting that simply tripling or quadrupling aid can achieve theMDGs in Ethiopia. Several other conditions, which may be even more impor-tant, must also be met. These include improvements in governance, strength-ening institutions, and improving the business climate. At the same time,donor countries and the international financial institutions must take serioussteps to improve the quality of assistance through better alignment of aid withnational strategic priorities, and harmonization of their administrative proce-dures with country standards.
ReferencesAdam, Christopher, and David Bevan, 2003, Aid, Public Expenditure and the Dutch Dis-
ease, CSAE Working Paper No. 2003–02 (Oxford: Centre for the Study of AfricanEconomies, University of Oxford).
Bevan, David, 2005, “An Analytical Overview of Aid Absorption: Recognizing andAvoiding Macroeconomic Hazards,” paper for the Seminar on Foreign Aid andMacroeconomic Management, Maputo, Mozambique, March 14–15.
Birdsall, Nancy, Stijn Claessens, and Ishac Diwan, 2003, “Policy Selectivity Forgone:Debt and Donor Behavior in Africa,” Working Paper No. 17 (Washington: Cen-ter for Global Development).
Bourguignon, François, 2004, “A Framework to Monitor Country-Based Aid Effectiveness”(unpublished; Washington: World Bank).
3600-06_Ch06.qxd 4/12/06 2:41 PM Page 165
166 SUNDBERG AND LOFGRENf
———, and others, 2006, Building Absorptive Capacity to Meet the MDGs (Washington:World Bank, forthcoming).
Bourguignon, François, Maurizio Bussolo, Luiz Pereira da Silva, Hans Timmer, andDominique van der Mensbrugghe, 2004, MAMS. Maquette for MDG Simulations(unpublished; Washington: World Bank).
Bourguignon, François, Maurizio Bussolo, Hans Lofgren, Hans Timmer, Dominique vander Mensbrugghe, 2004, Towards Achieving the MDGs in Ethiopia: An Economy-wideAnalysis of Alternative Scenarios (Washington: World Bank).
Bulír, Ales, and Timothy Lane, 2002, “Aid and Fiscal Management,” paper presentedat IMF Conference on Macroeconomics and Poverty, Washington, March 14–15.
Clemens, Michael A., Charles J. Kenny, and Todd J. Moss, 2004, “The Trouble withthe MDGs: Confronting Expectations of Aid and Development Success,” Work-ing Paper No. 40 (Washington: Center for Global Development).
Development Committee, 2003, “Supporting Sound Policies with Adequate andAppropriate Financing,” report prepared for the Annual Meetings of the WorldBank and the International Monetary Fund, Dubai, September.
———, 2004, “Aid Effectiveness and Financing Modalities,” report prepared for theAnnual Meetings of the World Bank and the International Monetary Fund, Wash-ington, September.
Eifert, Benn, Alan Gelb, and Vijaya Ramachandran, 2005, “Business Environment andComparative Advantage in Africa: Evidence from the Investment Climate Data,”Working Paper No. 56 (Washington: Center for Global Development).
FDRE (Federal Democratic Republic of Ethiopia), 2002, “Ethiopia: Sustainable Devel-opment and Poverty Reduction Program” (Addis Ababa: Ministry of Finance andEconomic Development).
Foster, Mick, and others, 2003, The Case for Increased Aid: Final Report to the Departmentfor International Development, Vols. 1 and 2 (Essex, United Kingdom: Mick FosterEconomics Ltd.).
Geda, Alemayehu, Adbeb Shimlesse, Demse Chanyalewu, and Oladele Arowolo, 2004,“A Synthesis of Millennium Development Goals (MDGs) Need Assessment forEthiopia,” background paper for UNDP-MOFED, January.
Heller, Peter, and Sanjeev Gupta, 2002, “Challenges in Expanding Development Assis-tance,” IMF Policy Discussion Paper No. 02/5 (Washington: International Mone-tary Fund).
International Monetary Fund, 2004, Ethiopia: Article IV Staff Report—Selected Issues(Washington).
———, 2005, The Federal Democratic Republic of Ethiopia: 2004 Article IV Consultationand Sixth Review Under the Three-Year Arrangement Under the Poverty Reduction andGrowth Facility, IMF Country Report No. 05/25 (Washington).
———, 2005a, The Federal Democratic Republic of Ethiopia: Debt Sustainability Analysis,IMF Country Report No. 05/27 (Washington).
———, 2005b, The Federal Democratic Republic of Ethiopia: Ex Post Assessment of Long-Term Fund Engagement, IMF Country Report No. 05/26 (Washington).
———, 2005c, The Federal Democratic Republic of Ethiopia: Selected Issues and StatisticalAppendix, IMF Country Report No. 05/28 (Washington).
Lofgren, Hans, 2004, “MAMS: An Economywide Model for Analysis of MDG CountryStrategies—Technical Documentation” (unpublished; Washington: World Bank).
3600-06_Ch06.qxd 4/12/06 2:41 PM Page 166
Absorptive Capacity and Achieving the MDGs 167f
———, and Carolina Diaz-Bonilla, 2005, “An Ethiopian Strategy for Achieving theMillennium Development Goals: Simulations with the MAMS Model” (unpub-lished; Washington: World Bank).
Prati, Alessandro, Ratna Sahay, and Thierry Tressel, 2003, “Is There a Case for Steriliz-ing Foreign Aid Inflows?” paper presented at the IMF Research Workshop, “Macro-economic Challenges in Low Income Countries,” Washington, October 23–24.
Radelet, Steven, 2003, Challenging Foreign Aid: A Policymaker’s Guide to the MillenniumChallenge Account (Washington: Center for Global Development).
———, Michael A. Clemens, and Rikhil Bhavnani, 2004, “Counting Chickens WhenThey Hatch: The Short-Term of Aid on Growth,” Working Paper No. 44 (Wash-ington: Center for Global Development).
Reinikka, Ritva, and Jakob Svensson, 2004, “The Power of Information: Evidence from aNewspaper Campaign to Reduce Capture,” Policy Research Working Paper No. 3239(Washington: World Bank).
UN Millennium Project, 2005, Investing in Development: A Practical Plan to Achieve theMillennium Development Goals (New York).
World Bank, 2004, “Ethiopia: Public Expenditure Review—The Emerging Challenge,”Poverty Reduction and Economic Management 2 (AFTP2) (Washington).
———, 2005, “Education in Ethiopia: Strengthening the Foundation for SustainableProgress,” Human Development Department (AFTH3) (Washington).
———, 2005a, “Ethiopia: A Strategy to Balance and Stimulate Growth—A Country Eco-nomic Memorandum,” Poverty Reduction and Economic Management 2 (AFTP2)(Washington).
3600-06_Ch06.qxd 4/12/06 2:41 PM Page 167