absolyte technology professional paper - ups exide/vrla/absolyte... · professional paper battery...
TRANSCRIPT

ABSOLYTE ®
TECHNOLOGY
Professional Paper
Battery Energy Storage System(BESS)

Abstract: In 1996, Exide Technologies in collaboration with the General Electric Company (GE), the Department of Energy (DOE) and Sandia National Laboratories (SNL) designed and installed a 1MW/1.4MWh Battery Energy Storage System (BESS) at the facilities of Metlakatla Power and Light (MP&L) at the island village of Metlakatla, Alaska. The battery powering this BESS was Exide’s ABSOLYTE® Valve-Regulated Lead-Acid (VRLA) design. The purpose of this installation was to stabilize the island community’s utility power grid providing instantaneous power into the grid when demand was high from local industry, and to absorb excess power from the grid to allow its hydroelectric generating units to operate under steady-state conditions. A secondary purpose was to demonstrate the technical and economic justification for a BESS in the operating environment of an electric utility, where battery performance, maintenance and life are critical factors. The return on investment (ROI) calculations for the BESS were initially based on a battery lifetime of 8 years. In September 2008, after 11-1/2 years of continuous operation at MP&L, Exide replaced the BESS’s battery with another ABSOLYTE® battery system. This paper looks at the economic and environmental benefits of having the BESS, and the performance and condition of sample field-aged cells selected at random from the original battery set during its replacement.
Background
Metlakatla is a small community on Annette Island located in southern Alaska about 25 miles from Ketchikan, Alaska and 575 miles from Seattle, Washington. The island is relatively inaccessible, especially in the winter, and is usually reached by boat or float airplane. Metlakatla Power & Light (MP&L) is a small, isolated utility that supplies the electricity needs of the island. The MP&L load consists of the Metlakatla residential community, several relatively small commercial businesses and, at the time the BESS was installed, a large sawmill. The load peaked at about 3.5MW, and the sawmill load, which was about one-third of the total, varied dramatically with the operation of a large log chipper at the facility.
The primary resource for the utility is 4.9MW of rain-fed hydroelectric generation. Typically the hydroelectric units can supply the average load, but they could not respond rapidly
enough to follow the erratic load fluctuations. As a consequence, the AC-line frequency became unstable and MP&L was forced to install a large 5.0MVA/3.3MW diesel generator which was oversized to provide an adequate load-following rate and operated at about 1MW to provide a suitable power dynamic range. Operating in this way a greater portion of the utility’s base load was shifted from the less expensive hydro generation to the more expensive diesel. Even after the addition of the diesel, electrical frequency still often drooped to less than 57-Hz and system voltage remained very erratic.
Operation and maintenance costs for the diesel generator added to the problem. Annual fuel consumption by the diesel averaged 475,000 gallons; and, operating expenses in the 5 years prior to installation of the BESS (1992-1997) were $2.5 million. Furthermore, transporting 475,000 gallons of diesel fuel per year by barge from the mainland, and then through a pipe across the island increased both the environmental risk and the financial burden on the community. At that time, each fuel shipment required an average cash outlay of $100,000 – a significant amount for the small local utility. In addition, minor overhauls to the diesel generator cost $150,000 every three years; and major overhauls costing $250,000 were required every six years.
Studies conducted by DOE and Sandia projected that a BESS on the MP&L system could: (i) help stabilize and improve the power quality of the system, i.e., reduce voltage and frequency deviations; and (ii) reduce reliance on the diesel generator and thus realize an attendant savings in fuel-related costs. Subsequently, the Exide-GE alliance designed a suitable 1.6MVA peak (10-seconds) / 1.0MW continuous / 1.4MWh BESS which was interconnected at the 12.47kV substation [1]. The design utilized standard, commercially proven components – the storage batteries were Exide’s ABSOLYTE® IIP VRLA technology and the PCS was GE’s Industrial AC drive technology. Construction of the BESS facility began in April 1996 and was completed in December 1996. The BESS was made operational on February 3, 1997 and, except for normal maintenance shutdowns, had been operating continuously until battery replacement was started in September 2008.
Economic and Environmental Benefits of the BESS
The economic benefits derived from the installation and operation of the MP&L BESS can be directly linked to the “avoided” costs associated with having to continuously operate
Achievements of an ABSOLYTE® Valve-Regulated Lead-Acid Battery Operating in a utility Battery Energy Storage System (BESS) for 12 Years
George Hunt and Joseph Szymborski
Exide TechnologiesAurora, Illinois USA
2
the 3.3MW diesel generator to maintain power quality and frequency control on the MP&L grid. These include the cost of the fuel oil consumed in operating the diesel, transportation costs to barge the fuel to the island, and periodic maintenance costs required for the diesel. This data for 1996, the year before the BESS was installed, is used to extrapolate the operational costs through September 2008 had the BESS not been installed; and that total is then compared to the operational costs (including fuel oil consumption and the replacement battery) with the BESS installed.
Operating Cost Estimates without the BESS
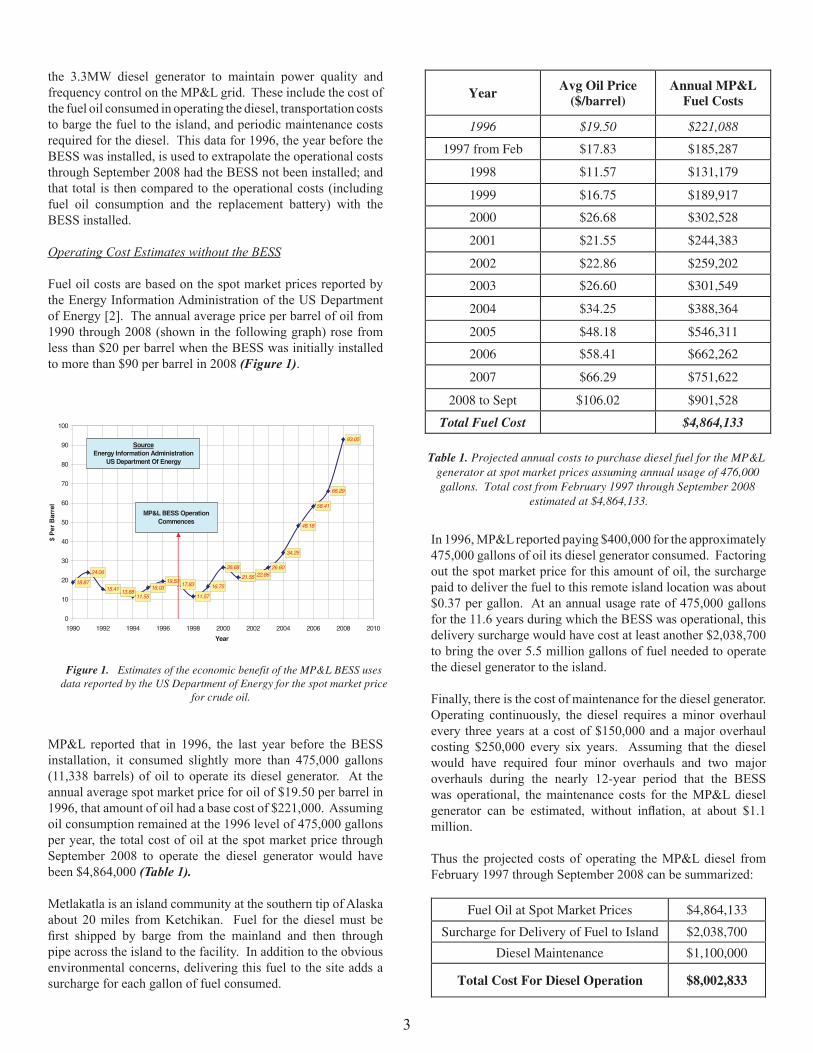
Fuel oil costs are based on the spot market prices reported by the Energy Information Administration of the US Department of Energy [2]. The annual average price per barrel of oil from 1990 through 2008 (shown in the following graph) rose from less than $20 per barrel when the BESS was initially installed to more than $90 per barrel in 2008 (Figure 1).
MP&L reported that in 1996, the last year before the BESS installation, it consumed slightly more than 475,000 gallons (11,338 barrels) of oil to operate its diesel generator. At the annual average spot market price for oil of $19.50 per barrel in 1996, that amount of oil had a base cost of $221,000. Assuming oil consumption remained at the 1996 level of 475,000 gallons per year, the total cost of oil at the spot market price through September 2008 to operate the diesel generator would have been $4,864,000 (Table 1).
Metlakatla is an island community at the southern tip of Alaska about 20 miles from Ketchikan. Fuel for the diesel must be first shipped by barge from the mainland and then through pipe across the island to the facility. In addition to the obvious environmental concerns, delivering this fuel to the site adds a surcharge for each gallon of fuel consumed.
In 1996, MP&L reported paying $400,000 for the approximately 475,000 gallons of oil its diesel generator consumed. Factoring out the spot market price for this amount of oil, the surcharge paid to deliver the fuel to this remote island location was about $0.37 per gallon. At an annual usage rate of 475,000 gallons for the 11.6 years during which the BESS was operational, this delivery surcharge would have cost at least another $2,038,700 to bring the over 5.5 million gallons of fuel needed to operate the diesel generator to the island. Finally, there is the cost of maintenance for the diesel generator. Operating continuously, the diesel requires a minor overhaul every three years at a cost of $150,000 and a major overhaul costing $250,000 every six years. Assuming that the diesel would have required four minor overhauls and two major overhauls during the nearly 12-year period that the BESS was operational, the maintenance costs for the MP&L diesel generator can be estimated, without inflation, at about $1.1 million.
Thus the projected costs of operating the MP&L diesel from February 1997 through September 2008 can be summarized:
Figure 1. Estimates of the economic benefit of the MP&L BESS uses data reported by the US Department of Energy for the spot market price
for crude oil.
Year Avg Oil Price ($/barrel)
Annual MP&L Fuel Costs
1996 $19.50 $221,088
1997 from Feb $17.83 $185,287
1998 $11.57 $131,179
1999 $16.75 $189,917
2000 $26.68 $302,528
2001 $21.55 $244,383
2002 $22.86 $259,202
2003 $26.60 $301,549
2004 $34.25 $388,364
2005 $48.18 $546,311
2006 $58.41 $662,262
2007 $66.29 $751,622
2008 to Sept $106.02 $901,528
Total Fuel Cost $4,864,133
Table 1. Projected annual costs to purchase diesel fuel for the MP&L generator at spot market prices assuming annual usage of 476,000 gallons. Total cost from February 1997 through September 2008
estimated at $4,864,133.
18.87
24.06
15.41 13.8811.55
16.0319.50 17.83
11.57
16.75
26.68
21.55 22.8626.60
34.25
48.18
58.41
66.29
93.05
0
10
20
30
40
50
60
70
80
90
100
1990 1992 1994 1996 1998 2000 2002 2004 2006 2008 2010Year
$ P
er B
arre
l
SourceEnergy Information Administration
US Department Of Energy
MP&L BESS Operation Commences
Fuel Oil at Spot Market Prices $4,864,133
Surcharge for Delivery of Fuel to Island $2,038,700
Diesel Maintenance $1,100,000
Total Cost For Diesel Operation $8,002,833
Year Avg Oil Price ($ per Barrel)
Annual Fuel Cost With BESS
1997 from Feb $17.83 $7,004 1998 $11.57 $4,959 1999 $16.75 $7,179 2000 $26.68 $11,436 2001 $21.55 $9,238 2002 $22.86 $9,798 2003 $26.60 $11,399
2004 $34.25 $14,680 2005 $48.18 $20,651 2006 $58.41 $25,034 2007 $66.29 $28,411
2008 to Sept $106.02 $34,078
Total Fuel Cost $183,865
Table 2. Estimated annual cost to purchase fuel for the MP&L dieseloperating with the BESS from February 1997 through September 2008.
Battery Replacement Cost $681,890
Fuel Oil at Spot Market Prices $183,865
Surcharge for Delivery of Fuel to Island $78,000
Diesel Operation During Battery Change $20,875
Diesel Maintenance $400,000
Total Cost of Operating Diesel and Battery Powered BESS
$1,364,630
3

Operating Cost Estimates with the BESS Because this economic analysis is focused on the operating cost benefits of the BESS versus the diesel generator at MP&L, neither the initial costs for the installation of the generator set or the battery and the associated electronic conversion equipment are considered. However, because the battery can be considered to be consumed over time in operation, the cost of a replacement battery is included. In April 2008, the community of Metlakatla received a grant (AS 37.05.317) from the Alaska Commerce, Community and Economic Development Agency for $681,890 to replace the battery of the BESS at the community owned and operated Metlakatla Power & Light Company [3]. The funding provided for the replacement of the battery including all new replacement battery modules, shipping to Metlakatla, labor of two installers to lead, complete, inspect and test the installation, and shipping and recycling of the spent battery. This effort was completed on September 29, 2008 with the BESS being off-line for only six days. Although the 3.3MW MP&L diesel generator is now essentially relegated to emergency standby use, it is operated routinely for periodic battery equalization charging, planned BESS battery and inverter maintenance, and regularly scheduled checks on diesel and generator operation and function. On average, this occasional use is about 15 days per year. It is estimated that the MP&L diesel consumes about 50 gallons of fuel per hour (i.e., 1,200 gallons per day); and in 15 days, the diesel would consume 18,000 gallons – the equivalent of 429 barrels of oil. Using the method described previously, it can be estimated that the total cost of operating the diesel over the entire period when the BESS was installed is only $183,865 (Table 2).
Using the same methodology as in the previous analysis, the surcharge to transport and deliver the 208,800 gallons of fuel to
the island needed to operate the diesel generator with the BESS over the 11.6 years during which the BESS was installed and operating is estimated at about $78,000. And, the additional cost to operate the diesel during the six days that the BESS was off-line to replace the battery is estimated to be $20,875 using the factors applied in the previous analyses. Since the diesel was relegated to standby use, the routine overhauls have been virtually eliminated within the life period of a single battery installation; however, to be conservative in this cost benefit analysis, one minor overhaul and one major overhaul are included at a total cost of $400,000. The projected costs of operating the MP&L diesel with the BESS having the primary function for power quality and frequency regulation from February 1997 through September 2008 are:
Thus, the Exide ABSOLYTE® VRLA battery-powered BESS provided the Metlakatla community with a cash savings of over $6.6 million in the almost 12 years it has been operating compared to continuing to use the diesel generator to provide frequency regulation and achieve desired power quality. In a community with an 80% unemployment rate, this savings to the community’s residents was welcome indeed. Environmental Benefit of the MP&L BESS In addition to the obvious reduction in noise pollution achieved by not operating the diesel and the avoided risk for spillage by not having to transport and store more than 5.3 million gallons of diesel fuel, the environmental benefit can be assessed by the carbon footprint reduction realized in operating the BESS. By going from burning 475,000 gallons of diesel fuel per year to less than 18,000 gallons, MP&L’s CO2 emissions were reduced from 5,272 tons per year to less than 200 tons per year – a reduction of almost 59,000 tons of CO2 since the BESS was installed [4]. These were all factors cited by the community of Metlakatla in receiving the grant from the Alaska Commerce, Community and Economic Development Agency (AS 37.05.317) to replace the battery and continue operating the Battery Energy Storage System at MP&L.
Fuel Oil at Spot Market Prices $4,864,133
Surcharge for Delivery of Fuel to Island $2,038,700
Diesel Maintenance $1,100,000
Total Cost For Diesel Operation $8,002,833
Year Avg Oil Price ($ per Barrel)
Annual Fuel Cost With BESS
1997 from Feb $17.83 $7,004 1998 $11.57 $4,959 1999 $16.75 $7,179 2000 $26.68 $11,436 2001 $21.55 $9,238 2002 $22.86 $9,798 2003 $26.60 $11,399
2004 $34.25 $14,680 2005 $48.18 $20,651 2006 $58.41 $25,034 2007 $66.29 $28,411
2008 to Sept $106.02 $34,078
Total Fuel Cost $183,865
Table 2. Estimated annual cost to purchase fuel for the MP&L dieseloperating with the BESS from February 1997 through September 2008.
Battery Replacement Cost $681,890
Fuel Oil at Spot Market Prices $183,865
Surcharge for Delivery of Fuel to Island $78,000
Diesel Operation During Battery Change $20,875
Diesel Maintenance $400,000
Total Cost of Operating Diesel and Battery Powered BESS
$1,364,630
4

The MP&L BESS Battery
Perhaps as remarkable as the economic and environmental benefits realized from the BESS installation is the operation and performance of the Exide ABSOLYTE® Valve-Regulated Lead-Acid battery in this installation.
The BESS Configuration
The battery installed at the MP&L BESS facility in 1996 (Figure 2) consisted of 378 Exide ABSOLYTE® IIP 100A75 modules arranged in a single series-connected string providing the system with a nominal 756-volt rating. The 100A75 module has a nominal C/8 capacity rating of 3,600 Ampere-hours; its rating at the intended 90-minute discharge rate for this application is approximately 2,000Ah / 3.87kWh. The entire battery system is rated at 1.4MWh at a 1.0MW discharge rate. Each 100A75 module is comprised of three individual 100A25 cells connected in parallel within the module’s container, thus providing a statistical population base of 1,134 individual cells. The cells were warranted by Exide to have an 8-year service life.
The battery connects to a General Electric Power Conversion System (PCS), based on gate-turn-off (GTO) thyristors, that can support a continuous load of 800kVA and pulse loads of up to 1200kVA. The PCS allows bi-directional power flow between the AC equipment and the battery in less than a quarter-cycle.
A 900kVA filter bank removes harmonics and compensates the voltage of the electrical signal. The BESS connects to the MP&L grid at the 12.47kV substation. The battery is housed in a 40 x 70-ft steel Butler building that sits on a concrete pad at the substation. An automatic generation control (AGC) system provides computerized control and dispatch of MP&L’s hydro and diesel units as well as the BESS for optimum efficiency. The AGC was configured to allow remote access to monitor the status of the battery bank.
The battery’s 378 modules were arranged in two back-to-back rows, each row comprised of twelve stacks of ABSOLYTE® modular trays eight high, separated by an aisle. The battery was positioned to minimize cable runs between rows of battery stacks and to the power conversion equipment. Pilot cell voltage and temperature measurements are made at locations strategically positioned throughout the battery bank. A fan was installed to circulate air in the building and to maintain a consistent temperature. A heater is used to warm the facility during the colder winter months and to reduce humidity.
System Operation
The BESS was designed to be connected continuously to the MP&L grid and to maximize utilization of the utility’s hydroelectric generation capacity. The strategy in operating the BESS was to allow the BESS to provide the short-term load demand “peaks” on the grid while the hydroelectric units supplied the “average” base load on the system. Thus it was important that the BESS battery be capable of being discharged
Figure 2. The battery at the MP&L BESS consists of 378 Exide ABSOLYTE® IIP 100A75 modulesconnected in series rated to deliver 1.4MWh at a 1.0MW discharge rate at a nominal 756 volts.
5
efficiently at relatively high discharge rates while maintaining its voltage; and, being able to accept the excess power in the system as recharge without causing overcharge conditions in the battery when demand on the system decreased. Based on the understanding of the characteristics of its ABSOLYTE® VRLA batteries, Exide proposed a rather unconventional mode of operation for the battery in this application.
From a fully charged condition, the battery is first discharged to about an 80% state-of-charge (SOC). The BESS PCS inverters discharge the battery by drawing power from the battery to instantaneously satisfy any load demand greater than that which the hydroelectric units can handle. After reaching 80% SOC, the control algorithm gradually adjusts the output of the hydroelectric units to allow the battery to accept recharge from the grid when load demand is less than the output of the hydroelectric units, thus maintaining the battery at about 60-80% SOC. In this partial state-of-charge state, the battery is at its lowest internal resistance allowing for efficient discharge, generating the least amount of ohmic heating and operating at a relatively high nominal voltage. Additionally, at this partial state-of-charge, the ABSOLYTE® VRLA battery’s charge acceptance is essentially 100%, allowing the control algorithm to be based on “counting” ampere-hours in/out of the battery to balance and maintain its SOC over time.
The battery is continuously operated in this partial state-of-charge condition for periods of up to six months. Twice each year, the battery is provided an equalization charge to bring it back to a fully charged condition, and to reset the control algorithm state-of-charge counter. It was these long periods of operation in this partially discharged condition that was of greatest interest and concern, particularly relating to its effect on battery life and ongoing performance.
To allay these concerns somewhat, Exide and Sandia National Laboratories completed an ageing and surveillance examination of several cells sampled from the MP&L installation after 30 months of operation [5]. A detailed examination of the cells described the condition of the cells as being “unremarkable”, showing no unusual conditions that would signal any early degradation of the cells’ components. Positive and negative active material composition was consistent with the estimated state-of-charge of the cells when sampled, and active material structure was essentially in an “as new” condition. At that time there was no indication of accelerated positive grid corrosion, nor were there any indications of electrolyte stratification or concentration variations that would suggest excessive self-discharge of the cell or water loss from the cell. Hard lead components within the cell (i.e., straps, plate lugs and terminal posts) were in pristine condition and showed no evidence whatsoever of any unusual corrosive attack. The only anomaly observed was a cracking of a few terminal post bushings – the terminal post insert molded into the cell’s plastic cover. This
cracking was subsequently associated with the manufacture of a particular lot of castings and not attributed to the way in which the cells were being operated.
Based on confidence from these early examinations, the operational lifetime for the battery at the MP&L BESS was extended 25% to 10 years. No changes in its mode of operation were recommended. The battery was finally “shut down” on September 23, 2008, after nearly 12 years of operation, in preparation for the replacement battery set.
Battery Replacement
In April 2008, MP&L submitted a Capital Improvement Project to the Commerce, Community and Economic Development Agency of Alaska proposing to replace the battery at its BESS installation. In their petition MP&L justified the project stating that by the time the battery would be replaced it would have been operational for 12 years, and during that period had handled over one million voltage swings and several power outages. Because of the BESS the island’s 3.3MW diesel generator had been relegated to reserve duty, and millions of dollars in fuel oil would have been consumed assuming that they did not have the BESS. They further stated that the BESS has performed the functions for which it was designed and has proven itself as an economic benefit to MP&L, its customers and the community of Metlakatla. The project was identified through a public review process at the local level as a community priority.
Receiving approval from the state of Alaska for the project, MP&L ordered the replacement battery from GNB Industrial Power, a Division of Exide Technologies, replicating the configuration of the BESS installed at the MP&L facility in 1996. Exide coordinated manufacture, shipment, delivery and installation of the new battery with the de-installation of the original BESS battery set utilizing as much of the original hardware as possible, and minimizing the amount of time the system would be shutdown. To maintain quality of power on the system during this battery replacement, MP&L would have to operate the 3.3-MW diesel consuming approximately 1,200 gallons of diesel fuel per day.
Working 8 to 10 hours each day, two Exide installers and four MP&L employees completed the battery change out, disconnecting and removing the old battery set and reinstalling, connecting and testing the replacement battery set, in 6 days. Exide’s unique modular structure, which allows battery units to be stacked one atop another expedited the installation process. The old battery modules were repacked into the same crates in which the replacement battery was shipped to the site for transport off of the island to an Exide recycling facility. Because both the old battery and the replacement battery are based on Exide’s ABSOLYTE® “absorbed electrolyte” technology, issues with electrolyte acid handling, spillage and disposal were avoided.
6

Observations of the physical condition of the battery set made during the decommissioning indicated that the battery had been well maintained – battery surfaces were clean and dry, and electrical connections were properly tightened.
With the battery replacement completed, the MP&L BESS battery was put on charge on September 28th, and the BESS returned to service the following day.
Cell Evaluation and Examination
During the MP&L BESS battery replacement, a total of 36 individual cells were selected for electrical testing and physical examinations at Exide’s laboratories. The objectives of these tests and examinations were to determine if long-term continuous operation in a partially charged state had any serious operational or life effects on the battery cells and to characterize the condition of the various materials and components internal to the cell. Because the MP&L BESS battery operated 50% longer than its initial life projection suggests that partial state-of-charge operation was not harmful; however, these analyses will allow for better estimates of battery lifetime in this type of application and more accurate calculations to justify battery energy storage investments in both customer and utility applications.
The testing plan for the cells sampled from the MP&L BESS includes: (i) determining the actual state of charge of the cells as removed from operation at the end of a typical semi-annual BESS cycle; (ii) demonstrating the “recovery” of cells operated for long periods of time in a partial state-of-charge with appropriate charging; (iii) characterizing the performance capabilities of these “aged” MP&L BESS cells over a wide range of discharge rates; and (iv) analyzing the internal materials and components of the cells to determine the “ageing” effects of partial state-of-charge operation.
Initial Cell Inspection and Performance
The MP&L BESS was shutdown on September 23, 2008 near the end of a typical 6-month operations cycle. The control algorithm for the BESS attempts to maintain the battery at between 60 and 80% state-of-charge by counting ampere-hours of capacity discharged and returned to the battery and adjusting the recharge parameters appropriately. The sample cells, as removed in the partial state-of-charge condition, were shipped from Metlakatla, Alaska to Exide’s testing laboratories in Ft. Smith, Arkansas arriving on October 24, 2008.
Upon receipt the open circuit voltage and internal impedance (resistance) of all the cells was measured. This “as received” data is summarized in Table 3, and histograms of the data are shown as Figures 3a and 3b.
Table 3. Open Circuit Voltage and Internal Impedance of MP&L BESS cells
“as received” after being replaced during a partial state-of-charge operations cycle.
Figure 3a. Histogram of “As Received” Open Circuit Voltage of cells
returned from the MP&L BESS.
Figure 3b. Histogram of “As Received” Internal Impedance of cells returned from the MP&L BESS
The measured open circuit voltages were consistent with a partial state-of-charge condition as was anticipated; the voltage of a fully charged ABSOLYTE® VRLA cell should be 2.15 – 2.17 volts. The measured impedance values were not abnormally high. Furthermore, both measures, OCV and impedance, were “normally” distributed around the average, indicating a reliable statistical sampling of the MP&L BESS battery set.
OCV (V) Impedance (mΩ)Sample Size 36 36Average 2.069 0.330 High Value 2 0..108 384 Low Value 2.038 0.241 Range 0.070 0.143 Standard Deviation 0.014 0.030
Table 3. Open Circuit Vol d Internal Im of MP&L BESS cells “as received” after being replaced
Figure 3a. Histogram of “As Received” Open Circuit Voltage of cells returne from the MP&L BESS
Figure 3b. Histogram of “As ernal Impedance of cells returned fro the MP&L BESS
tage an pedance
during a partial state-of-charge operations cycle.
0
2
4
6
8
10
12
14
16
18
20
2.00 2.01 2.02 2.03 2.04 2.05 2.06 2 .07 2.08 2 .09 2.10 2.11 2 .12 M oreO pen C ircu it V o ltage
Nu
mb
er
Average = 2 .069 vo ltsS tandard D ev = 0 .014 vo lts
d
0
2
4
6
8
10
12
14
16
18
0.20 0.22 0.24 0.26 0.28 0.30 0.32 0.34 0.36 0.38 0.40 0.42 0.44 M oreIn ternal Im pedance (m -Ohm )
Nu
mb
er
Average = 0.33 m O hmStandard Deviation = 0.03 m O hm
Received” Intm
7
A visual inspection of the cells showed no signs of bulging, distorted cell covers or broken cover-to-case seals, which would indicate positive grid growth that occasionally appears as lead-acid batteries age and near end of life. A few cells showed a small amount of corrosion at the terminal posts but not serious enough to cause any deterioration of the electrical circuit.
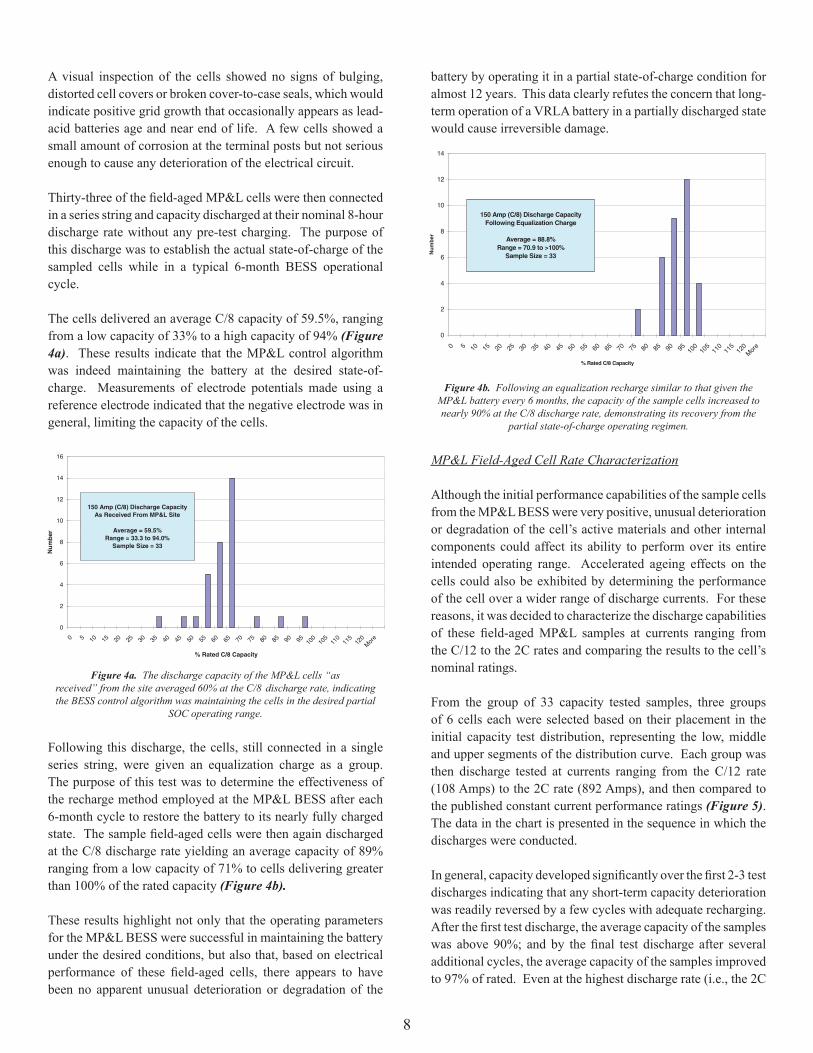
Thirty-three of the field-aged MP&L cells were then connected in a series string and capacity discharged at their nominal 8-hour discharge rate without any pre-test charging. The purpose of this discharge was to establish the actual state-of-charge of the sampled cells while in a typical 6-month BESS operational cycle. The cells delivered an average C/8 capacity of 59.5%, ranging from a low capacity of 33% to a high capacity of 94% (Figure 4a). These results indicate that the MP&L control algorithm was indeed maintaining the battery at the desired state-of-charge. Measurements of electrode potentials made using a reference electrode indicated that the negative electrode was in general, limiting the capacity of the cells.
Figure 4a. The discharge capacity of the MP&L cells “as received” from the site averaged 60% at the C/8 discharge rate, indicating the BESS control algorithm was maintaining the cells in the desired partial
SOC operating range.
Following this discharge, the cells, still connected in a single series string, were given an equalization charge as a group. The purpose of this test was to determine the effectiveness of the recharge method employed at the MP&L BESS after each 6-month cycle to restore the battery to its nearly fully charged state. The sample field-aged cells were then again discharged at the C/8 discharge rate yielding an average capacity of 89% ranging from a low capacity of 71% to cells delivering greater than 100% of the rated capacity (Figure 4b).
These results highlight not only that the operating parameters for the MP&L BESS were successful in maintaining the battery under the desired conditions, but also that, based on electrical performance of these field-aged cells, there appears to have been no apparent unusual deterioration or degradation of the
battery by operating it in a partial state-of-charge condition for almost 12 years. This data clearly refutes the concern that long-term operation of a VRLA battery in a partially discharged state would cause irreversible damage.
Figure 4b. Following an equalization recharge similar to that given the MP&L battery every 6 months, the capacity of the sample cells increased to nearly 90% at the C/8 discharge rate, demonstrating its recovery from the
partial state-of-charge operating regimen. MP&L Field-Aged Cell Rate Characterization
Although the initial performance capabilities of the sample cells from the MP&L BESS were very positive, unusual deterioration or degradation of the cell’s active materials and other internal components could affect its ability to perform over its entire intended operating range. Accelerated ageing effects on the cells could also be exhibited by determining the performance of the cell over a wider range of discharge currents. For these reasons, it was decided to characterize the discharge capabilities of these field-aged MP&L samples at currents ranging from the C/12 to the 2C rates and comparing the results to the cell’s nominal ratings.
From the group of 33 capacity tested samples, three groups of 6 cells each were selected based on their placement in the initial capacity test distribution, representing the low, middle and upper segments of the distribution curve. Each group was then discharge tested at currents ranging from the C/12 rate (108 Amps) to the 2C rate (892 Amps), and then compared to the published constant current performance ratings (Figure 5). The data in the chart is presented in the sequence in which the discharges were conducted. In general, capacity developed significantly over the first 2-3 test discharges indicating that any short-term capacity deterioration was readily reversed by a few cycles with adequate recharging. After the first test discharge, the average capacity of the samples was above 90%; and by the final test discharge after several additional cycles, the average capacity of the samples improved to 97% of rated. Even at the highest discharge rate (i.e., the 2C
Figure 4a. The discharge capacity of the MP&L cells “as received” from the site averaged 60% at the C/8 discharge
rate, indicating the BESS control algorithm was maintaining the cells in the desired partial SOC operating range.
0
2
4
6
8
10
12
14
0 5 10 15 20 25 30 35 40 45 50 55 60 65 70 75 80 85 90 95 100
105
110
115
120
More
% Rated C/8 Capacity
Nu
mb
er
150 Amp (C/8) Discharge CapacityFollowing Equalization Charge
Average = 88.8%Range = 70.9 to >100%
Sample Size = 33
Figure 4b. Following an equalization recharge similar to that given the MP&L battery every 6 months, the capacity of
the sample cells increased to nearly 90% at the C/8 discharge rate, demonstrating its recovery from the partial
state-of-charge operating regime.
0
2
4
6
8
10
12
14
16
0 5 10 15 20 25 30 35 40 45 50 55 60 65 70 75 80 85 90 95 100
105
110
115
120
More
% Rated C/8 Capacity
Nu
mb
er
150 Amp (C/8) Discharge CapacityAs Received From MP&L Site
Average = 59.5%Range = 33.3 to 94.0%
Sample Size = 33
8

rate at 892 Amps), the samples all delivered well over 100% of rated.
Figure 5. Characterization discharges of the MP&L samples indicate an
overall better than 95% of rated capacity over the entire range.
Figure 6a. Voltage of MP&L cells during final C/8 rate test discharge is consistent and strong.
Figure 6b. Even at the higher C/1 discharge rate (624 Amps), cell voltage is strong and consistent.
The cell voltages during these discharges were “strong” and typical for the rate at which the cells were being discharged (Figures 6a and 6b).
Individual electrode potentials measured using a reference electrode showed the limiting electrode changing from the negative initially, to either the positive electrode or both electrodes as anticipated by the cell’s design (Figure 6c).
Figure 6c. With cycling over the course of the rate characterization tests, the limiting electrode was determined to change from the negative to
either both electrodes or the positive electrode as would be expected by cell design.
From these electrical performance tests, it is obvious that these 12-year old field-aged cells are performing at very near full rated capability. These tests clearly demonstrate that operating the cells in a partial state-of-charge for long periods of time has not caused any permanent performance deterioration and show that these VRLA cells are ideally suited for a wide variety of operating conditions compatible with all sources of renewable energy.
Cell Teardown and Examination
Based on the electrical testing conducted on the sample cells taken from the MP&L BESS battery after 12 years of operation, it could be implied that the condition of the cell’s active materials, internal components and construction should be very good to excellent. A cell teardown and examination would verify and quantify that estimation. A total of seven cells – one each from each of the rate characterization groups, two from the initial capacity test group and two in the “as removed” condition from the MP&L site – were selected for this examination. Observations, measurements and analyses are reported and discussed for each material or component of interest examined.
Figure 5. Characterization discharges of the MP&L samples indicate an overall better than 95% of rated
capacity over the entire range.
Figure 6a. Voltage of MP&L cells during final C/8 rate test discharge is consistent and strong.
Figure 6b. Even at the higher C/1 discharge rate (624 Amps), cell voltage is strong and consistent.
0
20
40
60
80
100
120
140
160
C/12 C/8 C/6 C/5 C/3 C/2 C/1 2C C/8Discharge Rate
Per
cen
t R
ated
Grp A Grp B Grp C
-1.50
-1.00
-0.50
0.00
0.50
1.00
1.50
2.00
2.50
0 10 20 30 40 50 60 70 80Time (Minutes)
Vo
lts
90
Cell #7 Pos Cell #7 Neg Cell #7 Total Cell #23 Pos Cell #23 Neg Cell #23 Total
Limiting Electrode
Cell #7: Both Positive and NegativeCell #23: Positive
1.60
1.65
1.70
1.75
1.80
1.85
1.90
1.95
2.00
2.05
2.10
2.15
2.20
0.0 1.0 2.0 3.0 4.0 5.0 6.0 7.0 8.0 9.0Time (Hours)
Cel
l Vo
ltag
e
Cell #2 Cell #4 Cell #7 Cell #16 Cell #23 Cell #27
Final 150-Amp (C/8) Discharge - Group A
String Avg = 1127.4AH / 7.52 Hrs / 93.9%
Cell Avg = 1158.6AH / 7.72 Hrs / 96.6%
Figure 6c. With cycling over the course of the rate characterization tests, the limiting electrode was determined to change from the negative to either both electrodes or the
positive electrode as would be expected by cell design.
1.50
1.55
1.60
1.65
1.70
1.75
1.80
1.85
1.90
1.95
2.00
0 10 20 30 40 50 60 70 80Time (Minutes)
Cel
l Vo
ltag
e
90
Cell #2 Cell #4 Cell #7 Cell #16 Cell #23 Cell #27
624-Amp (C/1) Discharge - Group A
String Average = 674.1AH / 1.08 Hrs / 108.0%
Cell Average = 687.1AH / 1.10 Hrs / 110.1%
9
External Appearance
The external appearance of the cells was normal but somewhat “aged”. There was no obvious damage to the cell containers or covers. The heat seal joint between the cell container and cover on all cells was completely intact. There were no signs of any case distortion or bulging that would indicate the possibility of positive plate growth. All cells (except one in which a hole was drilled to insert a reference electrode) released gas pressure as the pressure relief vent was loosened and removed.
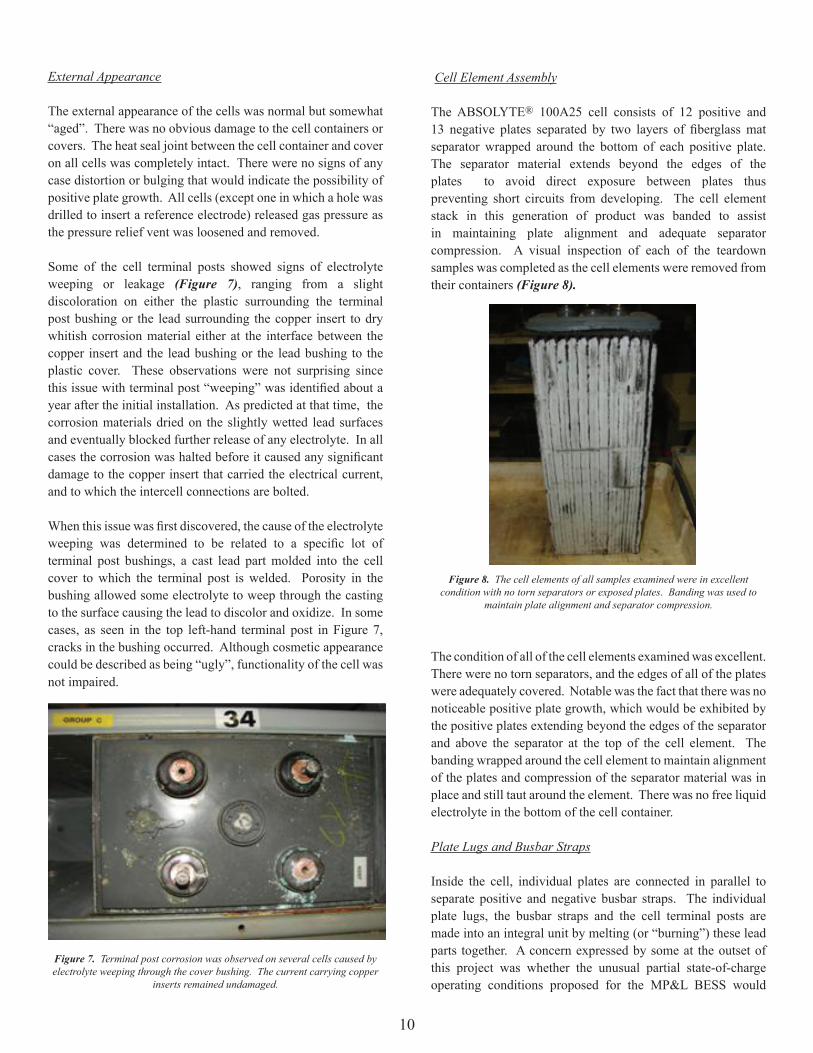
Some of the cell terminal posts showed signs of electrolyte weeping or leakage (Figure 7), ranging from a slight discoloration on either the plastic surrounding the terminal post bushing or the lead surrounding the copper insert to dry whitish corrosion material either at the interface between the copper insert and the lead bushing or the lead bushing to the plastic cover. These observations were not surprising since this issue with terminal post “weeping” was identified about a year after the initial installation. As predicted at that time, the corrosion materials dried on the slightly wetted lead surfaces and eventually blocked further release of any electrolyte. In all cases the corrosion was halted before it caused any significant damage to the copper insert that carried the electrical current, and to which the intercell connections are bolted.
When this issue was first discovered, the cause of the electrolyte weeping was determined to be related to a specific lot of terminal post bushings, a cast lead part molded into the cell cover to which the terminal post is welded. Porosity in the bushing allowed some electrolyte to weep through the casting to the surface causing the lead to discolor and oxidize. In some cases, as seen in the top left-hand terminal post in Figure 7, cracks in the bushing occurred. Although cosmetic appearance could be described as being “ugly”, functionality of the cell was not impaired.
Figure 7. Terminal post corrosion was observed on several cells caused by electrolyte weeping through the cover bushing. The current carrying copper
inserts remained undamaged.
Cell Element Assembly
The ABSOLYTE® 100A25 cell consists of 12 positive and 13 negative plates separated by two layers of fiberglass mat separator wrapped around the bottom of each positive plate. The separator material extends beyond the edges of the plates to avoid direct exposure between plates thus preventing short circuits from developing. The cell element stack in this generation of product was banded to assist in maintaining plate alignment and adequate separator compression. A visual inspection of each of the teardown samples was completed as the cell elements were removed from their containers (Figure 8).
Figure 8. The cell elements of all samples examined were in excellent condition with no torn separators or exposed plates. Banding was used to
maintain plate alignment and separator compression.
The condition of all of the cell elements examined was excellent. There were no torn separators, and the edges of all of the plates were adequately covered. Notable was the fact that there was no noticeable positive plate growth, which would be exhibited by the positive plates extending beyond the edges of the separator and above the separator at the top of the cell element. The banding wrapped around the cell element to maintain alignment of the plates and compression of the separator material was in place and still taut around the element. There was no free liquid electrolyte in the bottom of the cell container.
Plate Lugs and Busbar Straps
Inside the cell, individual plates are connected in parallel to separate positive and negative busbar straps. The individual plate lugs, the busbar straps and the cell terminal posts are made into an integral unit by melting (or “burning”) these lead parts together. A concern expressed by some at the outset of this project was whether the unusual partial state-of-charge operating conditions proposed for the MP&L BESS would
10

induce or accelerate corrosion of the cell’s negative plates, lugs, straps and other metallic lead components used on the cell’s negative plate assembly. The theory that was put forth was that long term exposure of the metallic lead components used in the negative plate assembly to oxygen present in VRLA-type cells along with lower negative plate potentials and reduced sulfuric acid concentrations would create conditions conducive to accelerated oxidation and corrosion of these lead metal parts.
Although Exide’s experience with its ABSOLYTE® product refuted this theory, an inspection of the internal hardware from these MP&L battery cells operating under these aggravating conditions for 12 years is warranted and necessary (Figure 9).
Figure 9. Examination of the cell’s internal lead hardware shows no
indications whatsoever of corrosion.
Both the positive and the negative busbar assemblies were in excellent, almost like new, condition. The negative assembly had a slight dull gray coloration on its surface indicative of some oxidation and sulfation, which was only on its surface. All of the lug welds were firmly connected. The positive assembly had a brownish coloration on its surface indicative of some lead dioxide formation. Again this oxidation was only on the immediate surface of the lead; a light scraping revealed clean, bright lead metal just below the surface of this oxidation. It was quite obvious that these busbar assemblies would have been suitable for many more years of use.
Positive Plates and Grids
By design, the capacity of the ABSOLYTE® cell is defined by the positive electrode. During discharge, the cell’s positive active material is converted from lead dioxide to lead sulfate. The color of the lead dioxide of a fully charged positive plate is a dark chocolate brown. The color of a discharged positive plate containing some amount of lead sulfate is more of a reddish brown and may have areas on the surface of the plate
that are gray to white. Because of the way the samples for these teardown examinations were selected, it is expected that both charged and partially discharged positive plates would be observed. Cells examined include samples that have been cycled (most fully charged), given only an equalization charge cycle (less fully charged), and in the as removed from the site condition (least charged).
Positive plates from the rate characterization cells, which received up to ten discharge-recharge cycles, had a very dark chocolate brown color. There was no surface sulfate. There were no loose active material pellets and the pellets were solid throughout. The active material was moist but not soft. Overall the condition of these positive plates was excellent (Figure 10a).
Figure 10a. Positive plate from a cycled MP&L sample cell has a dark brown
color and is in excellent condition.
Positive plates from sample cells that only received an equalization charge-discharge cycle also had a dark brown coloration. Some of the active material pellets however, were loose and were relatively easy to dislodge from the grid. It was possible to crack individual active material pellets in half showing that they were more brittle and friable.
Positive plates that were removed from the cells that had not been charged or tested at Exide’s labs, but were in the same condition as they had been removed from the MP&L site, were still a very dark brown color. However, on some of the plates there were small patches of white surface sulfate (Figure 10b), which could be easily scraped away to reveal dark brown active material below. A few of the pellets were loose and were easily pushed out of the grid. Pellets were brittle and could be cracked in half.
11

Figure 10b. Positive plate from an MP&L cell as removed from the site shows a small amount of white surface sulfate, even though it has a mostly
dark brown coloration.
Measurements of the width of examined positive plates were made at several locations from the top to the bottom of the plate to assess the amount of positive plate growth the samples may have experienced. The average measured width was 5.67 inches; the nominal “as cast” width dimension for this type cell is 5.65 inches. This difference is considered to be minimal, and may even be within the tolerance for the cell’s design. Therefore, based on grid width measurements, and suspected from purely visual observations of the cell’s positive plates, it can be said that virtually no positive grid growth occurred in these cells over the 12 years of operation of these cells in the MP&L BESS.
Samples of the positive active materials from each of the examined cells were submitted for chemical analysis. Results of these analyses are provided in the following table.
Table 4. Results of analysis of the positive active material from the MP&L cells show that the samples quickly recovered from the partially
discharged state.
As anticipated, the positive active material analyzed from cells as they were returned from the MP&L site have a higher percentage of lead sulfate, the discharged form of the positive active material. This is because the normal mode of operation in the MP&L BESS was to maintain the battery in a partially discharged state so as to be able to accept recharge pulses as
well as to provide power to the utility grid. The composition of the positive active material in these cells is consistent with the initial “as received” discharge capacity tests, which indicated the returned cells to be about 40% discharged.
These chemical analyses further indicate that the long-term operation of these cells in the partially discharged state did not have any permanent effect on the cell’s active material. The discharged active materials were readily converted back to the charged condition even within just a single charge-discharge-recharge cycle. After a few more cycles, the active material was almost fully recovered to the fully charged state and had the appearance of cells operated under traditional float charge applications. There were no indications whatsoever of any permanent deterioration or “sulfation” of the positive active material, which was cited as a possible issue for a VRLA-type battery under the conditions of use in a BESS application.
Another surprising observation made during these examinations was the overall strength and integrity of the positive plates. Typically the normal ageing process in a lead-acid battery is directly associated with the corrosion of the cell’s positive grid. This corrosion is the chemical and electrochemical oxidation of the lead of which the positive grid is made, and the rate of which is a function of the electrolyte concentration, the potential applied and the amount of charge that the cell has received. As corrosion progresses, the cross sectional area of the wires in the positive grid becomes smaller, the grid becomes weaker and more fragile, and cracks in the grid’s structure cause sections of the plate to break apart. About half way through the life of a lead-acid battery, it is not uncommon for the positive grid to exhibit this fragile condition and to break apart when lifted from the cell assembly stack. None of this occurred during the examination of the MP&L samples; the plates appeared as if they were removed from a much newer cell than the actual 12-year age of these MP&L samples (Figures 11a and 11b).
Figure 11a. Positive grid removed from an MP&L BESS cell after 12 years of operation is still fully intact. It is typical at this age for positive
grids to have become brittle and fragile, and to easily crumble with handling.
Cell State Lead Dioxide (Charged Matl)
Lead Sulfate (Discharged Matl)
As Returned 81.2% 18.2%
Single Cycle 89.8% 9.5%
Multiple Cycles 90.8% 8.4%
Table 4. Results of analysis of the positive active material from the MP&L cells show that the samples quickly
recovered from the partially discharged state.
12

Figure 11b. Close-up view of upper section of the grid shows the grid wires and frames free of cracks and breaks that would typically appear in a cell after
12 years of operation.
Separator and Electrolyte
Most of the electrolyte in a VRLA cell is absorbed in the fiberglass mat separator used in this type of cell. Issues that could be of concern in the long-term operation of a VRLA battery in an application such as the MP&L BESS are water loss and separator dry out, and stratification within the separator causing variations of either electrolyte concentration or volume. During the teardown examinations, electrolyte samples were taken and measured from sections of the separator cut from the top, middle and bottom of the cell element (i.e., relative to cell’s terminals). Because the cells in the MP&L BESS were installed in a horizontal configuration, that is, with the cell on its side, electrolyte stratification was not anticipated to be an issue. The electrolyte specific gravity measurements are recorded in the following table.
Table 5. Electrolyte specific gravity measurements made on electrolyte
samples taken from the top, middle and bottom sections of separator from the MP&L BESS cells.
Electrolyte specific gravity measurements made on the MP&L cells in the “as returned” condition are consistent with cells that are in a partially discharged state; and the values are consistent with an ABSOLYTE® cell at about 50% state-of-charge. The measurements made on the cells that were only
given an equalization charge and a capacity discharge show the range of capacity recovery corresponding to the actual capacity delivered – the cell that recovered nearly its full capacity has a higher specific gravity (almost near normal), while the cell that only partially recovered still has a lower specific gravity. The electrolyte specific gravity measurements made on the cycled and rate tested samples indicate that these cells have nearly fully recovered. These specific gravity measurements are in excellent correlation with the actual discharge capacities delivered by these cells, which was nearly 100% of rated. A fully charged ABSOLYTE® cell has a nominal electrolyte concentration of 1.310-1.315 specific gravity. The data shows there is essentially no concentration stratification, and by observation, the separators were uniformly wetted from top to bottom.
Negative Plates
Based on the reference electrode measurements made during the capacity testing of some of the MP&L cells, it was expected that the examination of the negative plates would show a variety of conditions ranging from fully charged to partially discharged. The three cells that had been cycled and rate tested were the most nearly fully recovered and fully charged. The negative plates examined from these cells all had a dark gray coloration and provided a metallic sheen when scraped with a flat blade. The plates were moist with electrolyte over the entire surface. All of these observations are indicative of a fully charged negative plate and correspond with the reference electrode readings taken during the electrical capacity tests.
The negatives of the untested, “as returned” cells as well as the cells that received only an equalization charge and a capacity discharge showed signs of being partially discharged as expected. Their coloration was a lighter gray and the surface was somewhat gritty. The bottom 2-3 inches of these negative plates was drier and harder. During the electrical testing, the reference electrode measurements indicated that almost all of the cells in these groups were being capacity limited by the negative plates.
Because negative plates rapidly oxidize when exposed to air, an accurate chemical analysis of the composition of the negative plate is extremely difficult. However, the observations made during these examinations combined with the reference electrode measurements are consistent with the electrical performance achieved by these cells. The overall condition of these negatives was excellent.
Estimates of MP&L Battery Ageing
From practical history, it is known that the MP&L BESS battery had been installed and operated for 11 years, 7 months and 20 days – well beyond the 8-year life used to justify its installation.
Top Middle Bottom As Retuned #1 1.210 1.211 1.212 As Returned #2 1.196 1.195 1.195 Initial Capacity
Test - Low 1.206 1.211 1.212
Initial Capacity Test - High 1.289 1.291 1.290
Cycled Group A 1.285 1.286 1.288 Cycled Group B 1.306 1.310 1.311 Cycled Group C 1.290 1.292 1.288
Table 5. Electrolyte specific gravity measurements made on electrolyte samples taken from the top, middle and bottom
sections of the MP&L BESS cells.
13

The “design” lifetime of a battery however is based on its operational history – the number of ampere-hours of charge and discharge accumulated, (i.e., throughput), for an application in which the battery is routinely cycled, or the total overcharge, corrected for temperature in a standby application where the battery is on continuous float charge.
Battery life consumed or used up in a particular application can also be estimated by examination of the cell’s positive grid, and measuring the amount of corrosion that has occurred. A certain amount of the grid member cross sectional area, typically 40-50%, must be remaining for the battery to function acceptably at the C/3 rate and higher, and slightly less to function acceptably at about the C/6 to C/8 discharge rates. These methods are used to estimate the “operational” age of this Exide ABSOLYTE® battery at the MP&L BESS site.
Battery Age Based on Discharge Throughput
The design lifetime “throughput” for the ABSOLYTE® 100A75 module utilized in the MP&L BESS, assuming a cycle life of 1200 cycles at the C/8 rate to 80% depth-of-discharge is 3,456,000AH. Typically when a lead-acid battery reaches its end-of-life based on throughput, the positive active material becomes very soft and mushy, the positive grid is severely corroded and the positive plate has experienced significant plate growth.
Data points collected from the MP&L control computer after 32 and 47 months of operation indicated a monthly average discharge throughput of 25,500AH. At that monthly discharge rate, the MP&L BESS would have accumulated 3,562,350AH of discharge throughput while in operation for the 139.7 months to September 23, 2008, the date the battery system was shutdown. However, none of the characteristics associated with end-of-life due to throughput were observed when the MP&L cells were examined after almost 12 years of operation.
Although lifetime was originally based on discharge throughput, the Exide ABSOLYTE® battery installed at the MP&L BESS provided 103.1% of its design lifetime, and it was still capable of delivering greater than 95% of its rated capacities even up to the 2C discharge rate. Furthermore, its positive plates were still in very good condition.
Battery Age Based on Total Overcharge
The design overcharge lifetime for the ABSOLYTE® 100A75 module utilized in the MP&L BESS, assuming a 20-year float life at 25°C at a float voltage of 2.25vpc and a float current of 45mA/100AH capacity is 283,824AH. The mode of operation at the MP&L BESS however, was to maintain the battery at
less than full charge, thus making this mode of calculation to estimate battery age irrelevant.
Data collected from the MP&L control computer after 32 months of operation indicated a net overcharge of only 5,733AH or 179AH per month. Extrapolation at this rate to the BESS shutdown date yields a net overcharge of only 25,000AH, less than 10% of the overcharge that the battery would receive in a typical float-charge standby installation. If these overcharge criteria were to be applied to estimate battery age in that typical standby installation, it would predict a severe undercharge and premature battery failure.
Battery Age Based on Positive Grid Corrosion
The design lifetime for the ABSOLYTE® product is based on a positive grid corrosion rate of 0.0025-0.0030 inch per year under recommended float charge conditions. With consideration of the load currents under which the MP&L BESS would be operated, it was estimated that the positive grids should have 40-50% of the cross sectional area of the grid’s members remaining at the end of the battery’s life. For this analysis, cross sections of vertical members (the direction of current flow) of positive grids taken from the replaced MP&L cells were potted, polished and examined using a metallurgical microscope (Figure 12a). In total, 120 measurements of the thickness of the corrosion layer on 30 grid sections from 6 sample cells were made.
Figure 12a. Photomicrograph of positive grid cross section from cell replaced at the MP&L BESS after 11.6 years of operation, showing the
corrosion layer uniformly surrounding the hard lead metal center.
As comparison, Figure 12b is a photomicrograph of a similar section of a positive grid from a cell removed from the MP&L BESS in October 1999 and analyzed after only 30 months of operation as part of a Sandia National Laboratories / DOE funded study.
14

Figure 12b. Photomicrograph of a similar positive grid section examined after only 30 months of operation.
Although the corrosion layer is noticeably thicker after 11.6 years of operation, there is still a very large cross section of hard lead metal still remaining in the grid member. These photomicrographs and the following analysis indicate grid corrosion not to be limiting life in this application. The short distance internal radius of an ABSOLYTE® grid member is approximately 0.070 inches, yielding a calculated cross sectional area of 0.015 square inches. Assuming that there should be 45% cross sectional area remaining at the end of life in the BESS application, the end-of-life cross sectional area is calculated to be 0.007 square inches leaving a hard metal radius of 0.047 inches. Thus, the estimated corrosion layer thickness at the end of life should be 0.023 inches. At the corrosion rate of 0.0025-0.0030 inches per year typical in a “float” charge application, it would take approximately 8.3 years to develop the corrosion layer thickness calculated for end of life. This was the basis for Exide’s 8-year warranty on cells in this application. The measurements made after 30 months of operation showed a corrosion layer thickness of 0.006 inches, yielding a corrosion rate of 0.0024 inches per year. This calculates to an end of life based on the measured corrosion layer of about 10 years. It was these measurements that supported the decision to continue to operate the MP&L BESS beyond its original “design” life. Now, based on the most recent corrosion layer thickness measurements of 0.0104 inches and a measured corrosion rate of 0.0009 inches per year, one would predict a lifetime approaching 20 years before reaching the predicted end-of-life corrosion layer thickness. These calculations are summarized in the following table.
Table 6. Summary of calculations used to estimate life in the MP&L BESS application using positive grid corrosion criteria. Data clearly indicates that
positive grid corrosion was not the life-limiting factor in this application.
Summary The Battery Energy Storage System (BESS) installed at Metlakatla Power & Light has proven itself to be a success – economically, environmentally and technically. All of the concerns expressed at the start of this project have been addressed and have been definitively shown not to be an issue. All of the equipment installed at the BESS operated flawlessly. The Exide ABSOLYTE® Valve-Regulated Lead-Acid battery surpassed all expectations. Not only did the battery meet all of the anticipated challenges of the installation, it even supported the entire system during several unexpected local power blackouts. Battery life exceeded the estimates used to justify the system by 50%, operating acceptably for nearly 12 years versus the initially anticipated 8 years. Testing and examination of cells following the battery’s replacement indicate that they were in excellent condition and may have been able to operate even longer with appropriate conditioning charging. Indeed, the BESS has shown itself to be industrially robust and able to be operated and maintained just like any other piece of industrial equipment. Best of all for the small Indian community of Metlakatla has been the economic benefits realized. Over the twelve years that the BESS has been installed and operating, the community has saved over $6.6 million. By taking the action to replace the battery, the citizens of Metlakatla will
New Grid Small Radius 0.0697 in
New Grid Cross Sectional Area 0.0153 sq in
% Area At End Of Life 45 %
Cross Sectional Area At End Of Life 0.0069 sq in
End Of Life Hard Metal Radius 0.0468 in
Corrosion Thickness 0.0230 in
Design Life Basis
Float (2.25vpc / 25C) Corrosion Rate 0.0028 in/yr
Life To Desired Remaining Hard Metal 8.3 year
Measurements At 30 Months (2.5 Year)
Corrosion Thickness 0.0059 in
Corrosion Rate 0.0024 in/yr
Life To Desired Remaining Hard Metal 9.7 year
Measurements At Replacement (11.6 yr)
Corrosion Thickness 0.0104 in
Corrosion Rate 0.0009 in/yr
Life To Desired Remaining Hard Metal 24 year
Table 6. Summary of calculations used to estimate life in the MP&L BESS application using positive grid corrosion criteria. Data clearly indicates that positive grid corrosion
was not the life-limiting factor in this application.
15

continue to accrue these savings well into the future ensuring stable and efficient electric service using predominantly renewable sources.
Battery Energy Storage is totally viable, and can now be considered part of an environmentally friendly energy system in utility, industrial and even residential applications. Exide’s ABSOLYTE® VRLA batteries are a “carbon-free” power source and have been proven with renewable sources like solar, wind, geothermal and hydroelectric where energy storage is a critical element. And since ABSOLYTE® batteries are manufactured using recycled lead, plastic and other materials, and are completely recyclable at the end of their life, they too can be considered to be renewable. This technology is available now and systems can be up and operating in a matter of months, not years. References [1] Demarest, M., et al., “Battery Storage All But Eliminates Diesel Generator” Electrical World, June 1997 [2] “Weekly United States Spot Price FOB Weighted By Estimated Import Volume” Energy Information Administration, http://tonto.eia.doe.gov/dnav/pet/hist/wtotusaw.htm [3] “Metlakatla – Emergency Battery Energy Storage System Replacement” Alaska Commerce, Community and Economic Development Agency, Grants to Unincorporated Communities (AS 37.05.317), April 2008 [4] “Average Carbon Dioxide Emissions Resulting From Gasoline and Diesel Fuel” United States Environmental Protection Agency, Office of Transportation and Air Quality,EPA420-F-05-001, February 2005 [5] Szymborski, J., et al., “Examination of VRLA Cells Sampled from a Battery Energy Storage System after 30-Months of Operation” Proceedings of the Conference on Electric Energy Storage Applications and Technologies (EESAT) 2000, September 2000
16

GNB Industrial Power, a division of Exide Technologies is aglobal leader in stored electrical energy solutions for all majorcritical reserve power applications and needs. Network powerapplications include communication/data networks, UPSsystems for computers and control systems, electrical powergeneration and distribution systems, as well as a wide range ofother industrial standby power applications. With a strongmanufacturing base in both North America and Europe and atruly global reach (operations in more than 80 countries) insales and service, GNB Industrial Power is best positioned tosatisfy your back up power needs locally as well as all over the world.
Based on over 100 years of technological innovation theNetwork Power Division leads the industry with the mostrecognized global brands such as ABSOLYTE®,SONNENSCHEIN®, MARATHON®, SPRINTER®, RELAY GEL®
and GNB FLOODED CLASSIC™. They have come to symbolize quality, reliability, performance and excellence in all themarkets served.
Exide Technologies takes pride in its commitment to a betterenvironment. Its Total Battery Management program, anintegrated approach to manufacturing, distributing andrecycling of lead acid batteries, has been developed to ensurea safe and responsible life cycle for all of its products.
®
Powered by
Exide Technologies Industrial EnergyUSA - Tel: 888.898.4GNB (4462)Canada - Tel: 800.268.2698
www.exide.com
GB4129 2009-08
Exide Technologies – The Industry Leader.
®
LITHIUM-ION BATTERIES
™