abs ved дьяконов дмитрий оборотный капитал working capital inventory
TRANSCRIPT

Оборотный капиталABC & VED анализ
Дьяконов Дмитрий

Содержание
• Определение• Структура• Воздействующие факторы• Цели• Управление запасами• ABC• VED• Заключение

Определение и структура
• Оборотным капиталом является значение разности всех существующих активов и всех существующих обязательств

Определение и структура
Типы:1. Валовый о.к. & Чистый о.к.2. Постоянный о.к. & Временный о.к.3. Положительный о.к. & Отрицательный
о.к.

Определение и структура
Метод подсчета1. Традиционный метод Выводимые и выводимые средства
Упор делается на ликвидность и ее показатели
2. Метод операционного цикла Он учитывает производство и
другие операции Упор делается на прибыль и ликвидность

Факторы, воздействующие на структуру и требования к оборотному капиталу
1. Природа бизнеса2. Цикл производства3. Процесс производства4. Факторы внешней среды5. Сезонные факторы6. Объем производства7. Требования к запасам8. Кредитные требования9. Доступность кредитаИ многие другие факторы

Цели
• Управление запасами• Управление денежными средствами• Управления дебиторской и кредиторской
задолженностью

Цели
1. Стимулирование продаж, благодаря грамотному управлению дебиторской и кредиторской задолженностью и хранения товара
2. Уменьшение затрат на продукты3. Обеспечить надежность и относительную
низкую стоимость потоков финансирования4. Достигнуть 3 вышеперечисленных цели,
при этом не сократив свободные денежные средства до опасного значения

Управление запасами
Цели-1. Для организации постоянного предложения и
бесперебойного производства2. Уменьшение затрат и потрь3. Внедрение инновационных научных решений в
управлении запасов4. Уменьшение затраты на хранение и
окончательную стоимость продукта5. Уменьшение отклонений бухгалтерских и
фактических остатков запасов

Инструменты управления запасами
1. Фиксирование уровней- Максимальный ур. Минимальный ур. Уровень повтор. заказа Опасный уровень2. Фиксирование EOQ- 2AO÷C3. ABC анализ4. VED анализ5. FSN /FNSD анализ6. Постоянна информационная система7. Показатели оборота запаса8. JIT анализ

ABC анализ
ABC анализ заключается в классификации наших запасов на предприятии
Always Best Control

ABC анализ
• The origin of ABC analysis is PARETO’S 80 – 20 rule. • This rule says that 80 % of country’s economy is
controlled by 20% of the people.• If we apply this rule to verify its correctness, the results
say that it is correct.
Example: • List out all the expenses we do over a period of time and
arrange them in the order from highest to lowest. Find the total of expenses and workout percentage of each with respect to the total. We see that only 20 % of items consume 80% of our expenses.

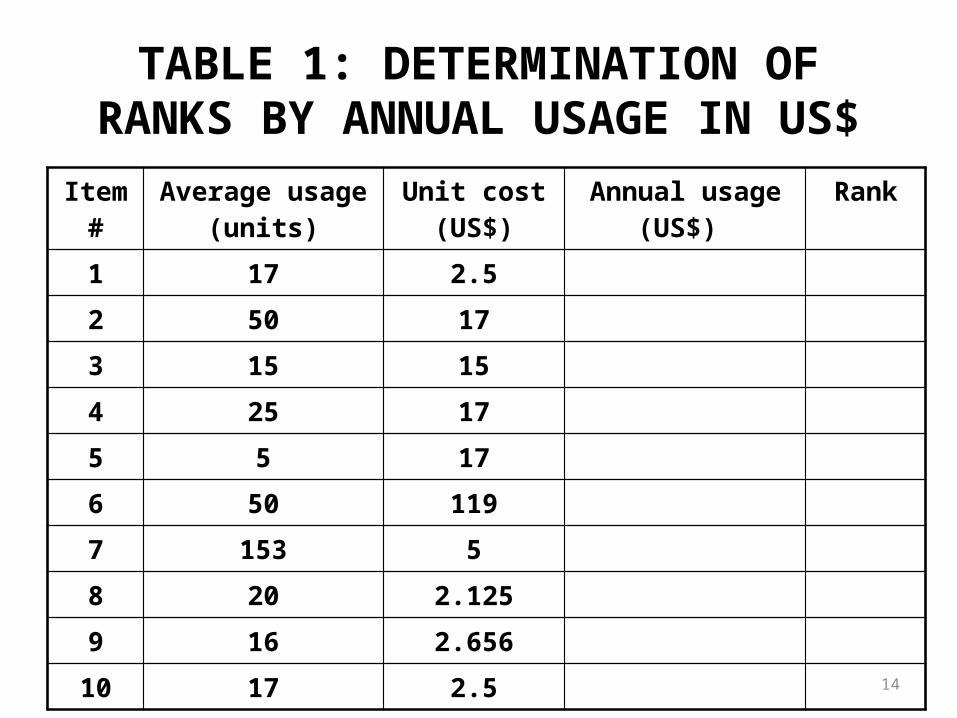
ШАГИ ABC анализThe steps in computing ABC analysis are: a Determine the annual usage in units for each item for
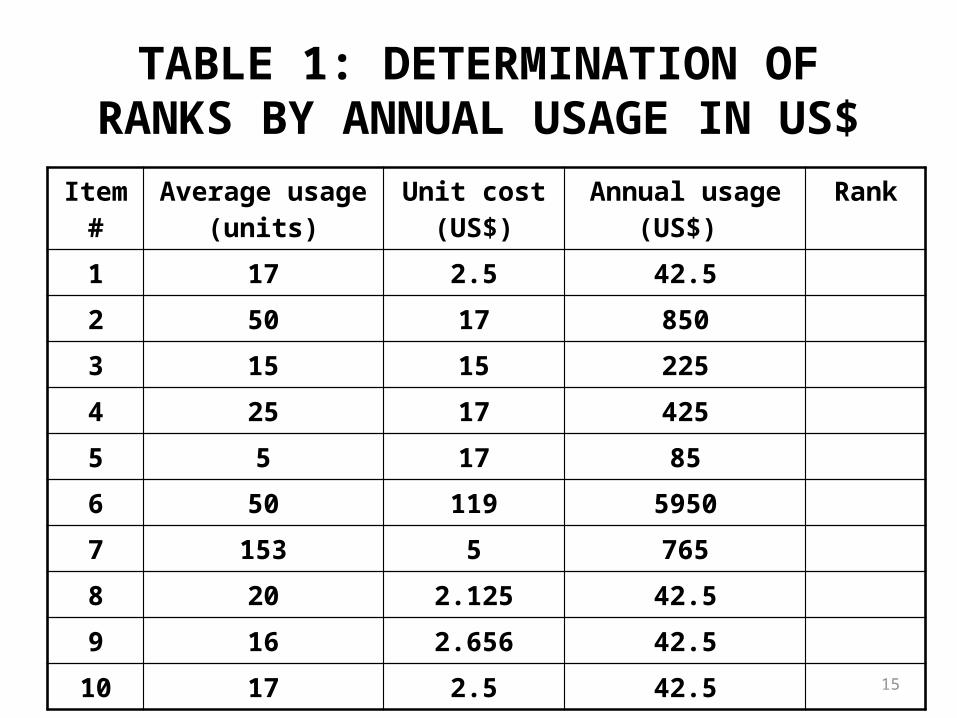
the past one-year.b. Multiply the annual usage quantity with the average unit
price of each item to calculate the annual usage in US$ for each item.
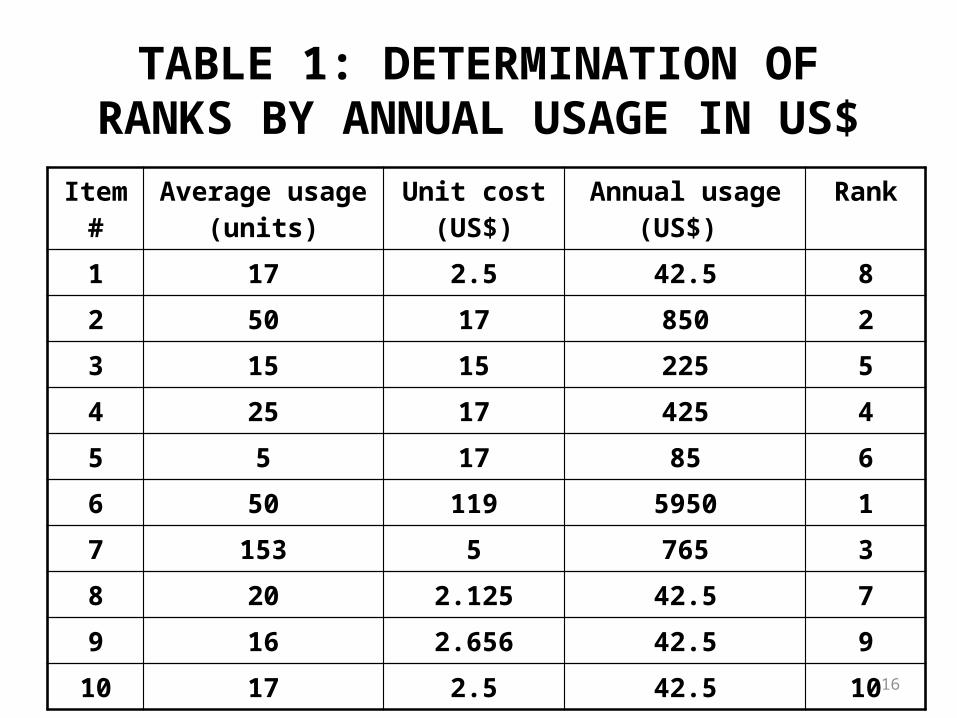
c. Item with highest dollar usage annually is ranked first. Then the next lower annual usage item is listed till the lowest item is listed in the last.
d. Table 1 shows ranks of the items according to the annual usage in US$. for 10 items.
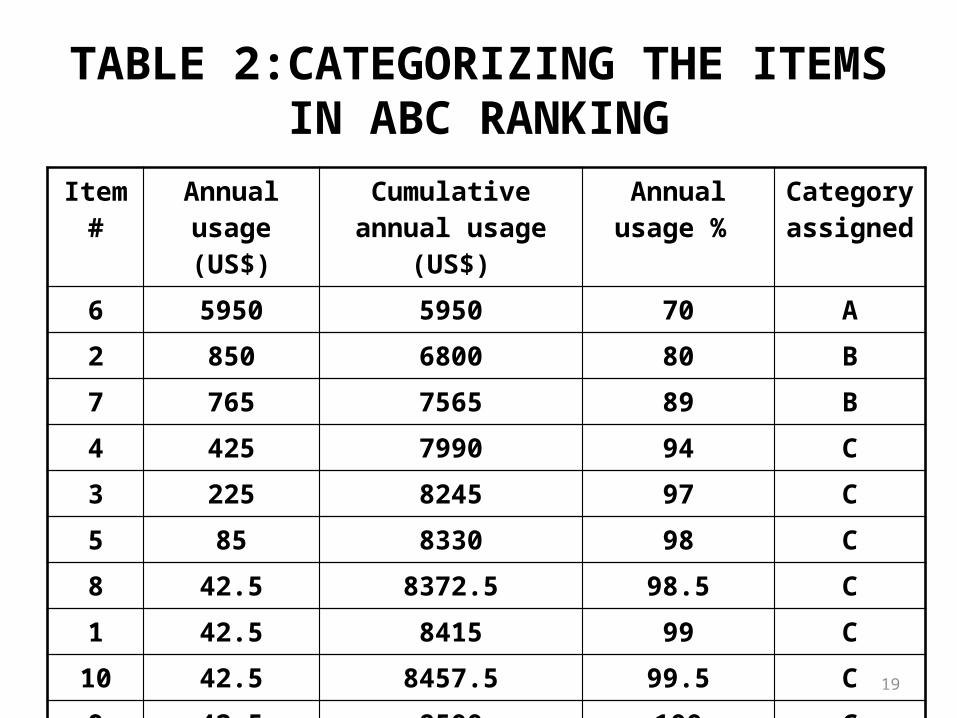
e. Arrange the items in the inventory by cumulative annual usage (dollars) and by cumulative percentage. Categorize the items in A, B , and C categories.
14
TABLE 1: DETERMINATION OF RANKS BY ANNUAL USAGE IN US$
Item #
Average usage (units)
Unit cost (US$)
Annual usage (US$)
Rank
1 17 2.5
2 50 17
3 15 15
4 25 17
5 5 17
6 50 119
7 153 5
8 20 2.125
9 16 2.656
10 17 2.5
15
TABLE 1: DETERMINATION OF RANKS BY ANNUAL USAGE IN US$
Item #
Average usage (units)
Unit cost (US$)
Annual usage (US$)
Rank
1 17 2.5 42.5
2 50 17 850
3 15 15 225
4 25 17 425
5 5 17 85
6 50 119 5950
7 153 5 765
8 20 2.125 42.5
9 16 2.656 42.5
10 17 2.5 42.5
16
TABLE 1: DETERMINATION OF RANKS BY ANNUAL USAGE IN US$
Item #
Average usage (units)
Unit cost (US$)
Annual usage (US$)
Rank
1 17 2.5 42.5 8
2 50 17 850 2
3 15 15 225 5
4 25 17 425 4
5 5 17 85 6
6 50 119 5950 1
7 153 5 765 3
8 20 2.125 42.5 7
9 16 2.656 42.5 9
10 17 2.5 42.5 10

17
TABLE 2:CATEGORIZING THE ITEMS IN ABC RANKING
Item #
Annual usage (US$)
Cumulative annual usage (US$)
Annual usage %
Category assigned
6 5950 5950
2 850 6800
7 765 7565
4 425 7990
3 225 8245
5 85 8330
8 42.5 8372.5
1 42.5 8415
10 42.5 8457.5
9 42.5 8500
Total 8500

18
TABLE 2:CATEGORIZING THE ITEMS IN ABC RANKING
Item #
Annual usage (US$)
Cumulative annual usage (US$)
Annual usage %
Category assigned
6 5950 5950 70
2 850 6800 80
7 765 7565 89
4 425 7990 94
3 225 8245 97
5 85 8330 98
8 42.5 8372.5 98.5
1 42.5 8415 99
10 42.5 8457.5 99.5
9 42.5 8500 100
Total 8500
19
TABLE 2:CATEGORIZING THE ITEMS IN ABC RANKING
Item #
Annual usage (US$)
Cumulative annual usage (US$)
Annual usage %
Category assigned
6 5950 5950 70 A
2 850 6800 80 B
7 765 7565 89 B
4 425 7990 94 C
3 225 8245 97 C
5 85 8330 98 C
8 42.5 8372.5 98.5 C
1 42.5 8415 99 C
10 42.5 8457.5 99.5 C
9 42.5 8500 100 C
Total 8500

20
TABLE 3: ABC CATEGORY - SUMMARY
category Item# % of items in inventory
$ in the category
% $ in the category
A 6 10 5950 70
B 2, 7 20 1615 19
C 1, 3, 4,5,8,9,10 70 935 11
Total 10 100 8500 100
VED анализ
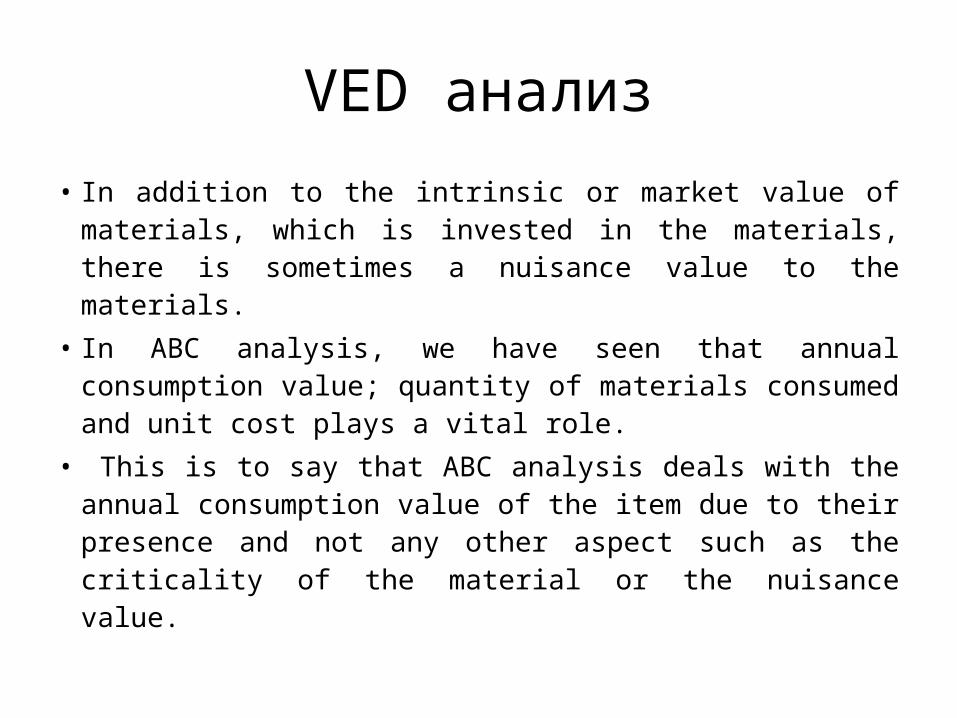
• In addition to the intrinsic or market value of materials, which is invested in the materials, there is sometimes a nuisance value to the materials.
• In ABC analysis, we have seen that annual consumption value; quantity of materials consumed and unit cost plays a vital role.
• This is to say that ABC analysis deals with the annual consumption value of the item due to their presence and not any other aspect such as the criticality of the material or the nuisance value.
VED анализ
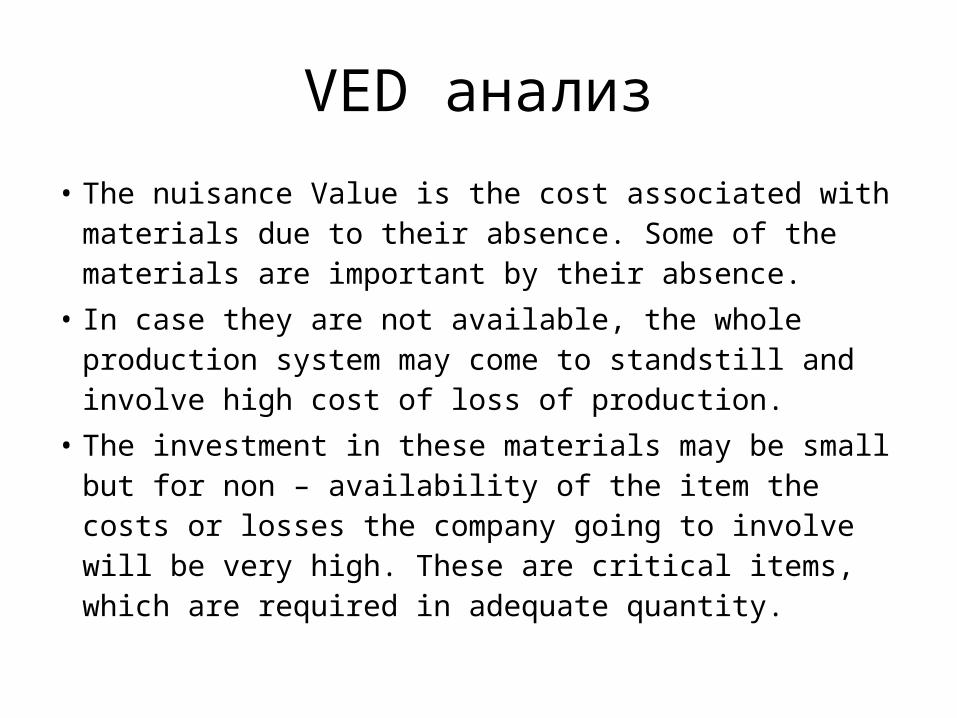
• The nuisance Value is the cost associated with materials due to their absence. Some of the materials are important by their absence.
• In case they are not available, the whole production system may come to standstill and involve high cost of loss of production.
• The investment in these materials may be small but for non – availability of the item the costs or losses the company going to involve will be very high. These are critical items, which are required in adequate quantity.
VED анализ
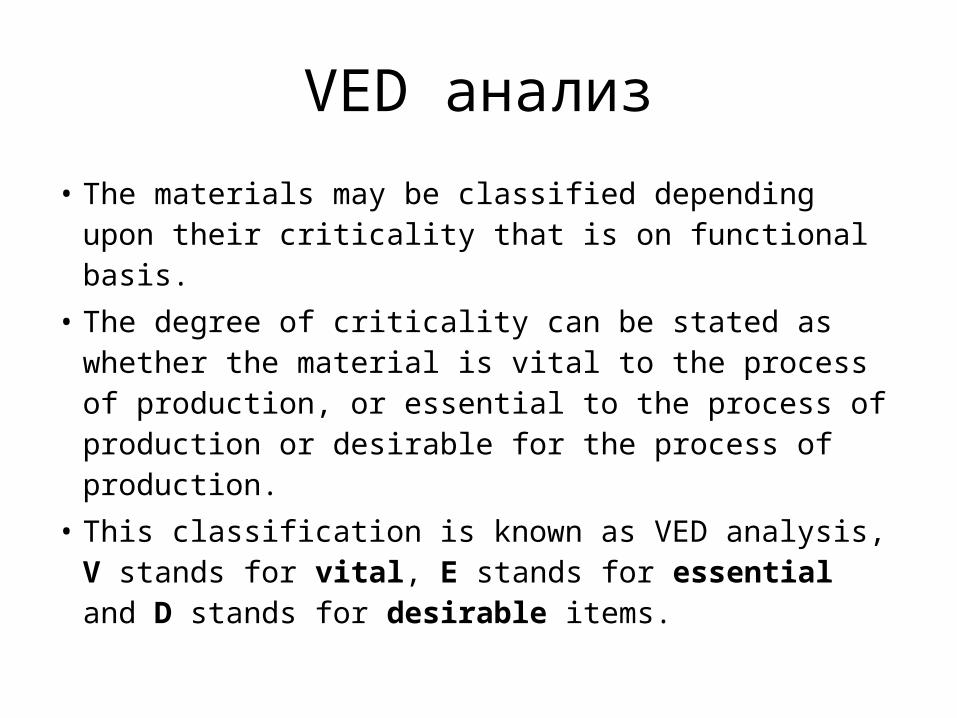
• The materials may be classified depending upon their criticality that is on functional basis.
• The degree of criticality can be stated as whether the material is vital to the process of production, or essential to the process of production or desirable for the process of production.
• This classification is known as VED analysis, V stands for vital, E stands for essential and D stands for desirable items.

VED анализ
• The materials may be classified depending upon their criticality that is on functional basis.
• The degree of criticality can be stated as whether the material is vital to the process of production, or essential to the process of production or desirable for the process of production.
• This classification is known as VED analysis, V stands for vital, E stands for essential and D stands for desirable items.

V E D
A AV AE AD
B BV BE BD
C CV CE CD
ABC & VED анализ

Заключение
После проведения этих 2 анализов становится понятно, каким именно образом нужно расставить приоритеты по разным товарам и запасам в вопросе общего количества остатка на складе, конкретного местоположения на складе, а также способе хранения.
Данные 2 анализа проводятся в обязательном порядке на ранней стадии загрузки склада, а также периодически, для проверки рациональности соотношений и показателей.

Спасибо