abrams industries, inc. atlanta, georgia 30339 … georgia 30339-2029 770.953.0304 fax 770.953.9922 ...
TRANSCRIPT

ABRAMS INDUSTRIES, INC.
1945 THE EXCHANGE, SUITE 300
ATLANTA, GEORGIA 30339-2029
770.953.0304
FAX 770.953.9922
WWW.ABRAMSINDUSTRIES.COM
ANNUAL REPORT

4ANNUAL REPORT
Established in 1925, Abrams Industries, Inc. (the “Company”),
operating through its wholly owned subsidiaries, provides energy
engineering services and maintenance and service request solutions
for facilities; implements energy saving lighting programs and
provides other energy services, including facility-related
improvements; and engages in real estate investment and
development. Servidyne Systems, LLC provides energy engineering
services and maintenance and service request solutions that assist
its commercial office, hospitality, institutional, and other customers
in reducing building operating costs by lowering energy
consumption, increasing work efficiency, and improving occupant
satisfaction. In early 2004, Servidyne Systems was presented the
ENERGY STAR® Sustained Excellence Award by the U.S.
Environmental Protection Agency, marking the fourth consecutive
year that Servidyne has received the ENERGY STAR Partner of
the Year award.The Wheatstone Energy Group, LLC provides
turnkey implementation of energy saving lighting programs and
energy-related services that reduce energy consumption and
operating costs to commercial, industrial, and institutional facilities.
Abrams Properties, Inc. engages in the acquisition, development,
redevelopment, leasing, asset management, ownership, and sale
of shopping centers and office buildings. The Company currently
owns or controls approximately 1.1 million square feet of shopping
centers in the Midwest and Southeast and more than 200,000
square feet of office properties in metropolitan Atlanta, Georgia.
ANNUAL MEETING
The annual meeting of Shareholders of Abrams Industries, Inc. will
be held at 11:00 a.m. on Wednesday, August 25, 2004, at the Corporate
Headquarters, 1945 The Exchange, Suite 300, Atlanta, Georgia.
CONTENTS
LETTER TOSHAREHOLDERS
FORM 10-K
DIRECTORS,OFFICERS AND
DIRECTORY
1
3
Inside Back Cover
FOUNDERAlfred R. Abrams(1899-1979)
FORMER CHAIRMANBernard W. Abrams(1925-2001)
CHAIRMAN EMERITUSEdward M. Abrams
BOARD OF DIRECTORSAlan R. Abrams (E)Co-Chairman of the BoardChief Executive Officer and PresidentAbrams Industries, Inc.
J. Andrew Abrams (E)Co-Chairman of the BoardVice President-Business DevelopmentAbrams Industries, Inc.
David L. AbramsPresidentSilver Star Management Corp.
Samuel E. Allen (A) (C) (N)Chairman and Chief Executive OfficerGlobalt, Inc.
Gilbert L. Danielson (A) (C) (N)Executive Vice President, Chief Financial OfficerAaron Rents, Inc.
Melinda S. Garrett (E)Vice President and SecretaryAbrams Industries, Inc.Chief Executive Officer and PresidentAbrams Properties, Inc.
Robert T. McWhinney, Jr. (C) (N)Chief Executive Officer and PresidentDouglass, McCarthy and McWhinney
Felker W. Ward, Jr. (A) (N)Chairman of the BoardPinnacle Investment Advisors, LLC
OFFICERS OF ABRAMS INDUSTRIES, INC.AND SUBSIDIARIES
Alan R. Abrams
J. Andrew Abrams
Barry C. Abramson
Carrie L. Billiam
Melinda S. Garrett
Stephen D. Hassett
M. Todd Jarvis
Jo Toney Mundy
Rick A. Paternostro
Jim Poulos
Mark J. Thomas
Claire J. Wiggill
Paul M. Williams
PARENT COMPANY
ABRAMS INDUSTRIES, INC.
1945 The Exchange
Suite 300
Atlanta, Georgia 30339-2029
(770) 953-0304
(770) 953-9922 (fax)
www.abramsindustries.com
ENERGY AND FACILITIES SOLUTIONS SEGMENT
SERVIDYNE SYSTEMS, LLC
1945 The Exchange
Suite 325
Atlanta, Georgia 30339-2029
(770) 933-4200
(770) 933-4201 (fax)
www.servidyne.com
ENERGY SERVICES SEGMENT
THE WHEATSTONE ENERGY GROUP, LLC
1945 The Exchange
Suite 320
Atlanta, Georgia 30339-2029
(770) 916-7111
(770) 916-7112 (fax)
www.wheatstoneenergy.com
REAL ESTATE SEGMENT
ABRAMS PROPERTIES, INC.
1945 The Exchange
Suite 400
Atlanta, Georgia 30339-2029
(770) 953-1777
(770) 953-9922 (fax)
Committees:
A-Audit C-Compensation E-Executive N-Nominating
TRANSFER AGENT
SunTrust Bank
Post Office Box 4625
Atlanta, Georgia 30302

In fiscal 2004, we remained true to our strategic
objective of repositioning earning assets in activities
that we believe will produce more consistent and
improved financial results. Because of this focus, we
believe Abrams Industries is a stronger company.
1
D e a r F e l l o w S h a r e h o l d e r s

2
BuildingPerformance Engineers
BPE

SECURITIES AND EXCHANGE COMMISSIONWASHINGTON, D.C. 20549
FORM 10-KANNUAL REPORT
Pursuant to Section 13 or 15(d) of the Securities Exchange Act of 1934
For the fiscal year ended April 30, 2004
Commission file number 0-10146
ABRAMS INDUSTRIES, INC.(Exact name of registrant as specified in its charter)
Georgia 58-0522129(State or other jurisdiction of (I.R.S. Employerincorporation or organization) Identification No.)
1945 The Exchange, Suite 300, Atlanta, GA 30339-2029(Address of principal executive offices) (Zip Code)
Registrant’s telephone number, including area code: (770) 953-0304
SECURITIES REGISTERED PURSUANT TO SECTION 12(b) OF THE ACT:
Name of each exchange onTitle of each class: which registered:
None None
SECURITIES REGISTERED PURSUANT TO SECTION 12(g) OF THE ACT:
Common Stock, $1.00 Par Value Per Share(Title of Class)
Indicate by check mark whether the registrant (1) has filed all reports required to be filed by Section 13 or 15(d) of the SecuritiesExchange Act of 1934 during the preceding 12 months (or for such shorter period that the registrant was required to file suchreports), and (2) has been subject to such filing requirements for the past 90 days.
YES � NO
Indicate by check mark if disclosure of delinquent filers pursuant to Item 405 of Regulation S-K is not contained herein, and will not be contained to the best of the Registrant’s knowledge, in definitive proxy or information statements incorporated byreference in Part III of this Form 10-K or any amendment to this Form 10-K. �
Indicate by check mark whether the registrant is an accelerated filer (as defined in Exchange Act 12b-2).
YES NO �
The aggregate market value of Common Stock held by nonaffiliates of the registrant as of October 31, 2003 was $5,575,967. See Pa rt IIIfor a definition of nonaffiliates. The number of shares of Common Stock of the registrant outstanding as of April 30, 2004, was 3,180,340.
DOCUMENTS INCORPORATED BY REFERENCE
The information called for by Part III (Items 10, 11, 13 and 14) is incorporated herein by reference to the registrant’s definitiveproxy statement for the 2004 Annual Meeting of Shareholders which is to be filed pursuant to Regulation 14A.

PART I
ITEM 1 | BUSINESSAbrams Industries, Inc. (i) provides energy engineering services andd e velops, implements and supports maintenance and service re q u e s tsolutions for facilities; (ii) implements energy saving lighting pro g r a m sand provides other energy services, including facility-re l a t e di m p rovements that reduce energy and operating costs; and (iii) engages inreal estate investment and development.
As used herein, the term "Company" refers to Abrams In d u s t r i e s ,Inc. and its subsidiaries and predecessors, unless the context indicateso t h e rwise, and the term “Pa re n t” or “Pa rent Company” refers solely toAbrams Industries, Inc.
The Company historically provided commercial construction andgeneral contracting services. Construction re venues in fiscal 2004continued to decrease significantly from prior years due to the Company’sdecision to reduce re venue volume rather than contract at prices thato f f e red the Company unacceptable levels of potential profit re l a t i ve to thei n h e rent risks. During fiscal 2004, the Company continued to see an on-going lack of attractive project opportunities, in a competitivem a rketplace, that would meet its risk/rew a rd re q u i rements. Ac c o rd i n g l y,the Company has elected to discontinue its operations as a multi-purposegeneral contractor.
The Company’s strategy is to continue to add new service offeringsthat are expected to generate lower gross re venues, but at higher pro f i tmargins, than general contracting. The Company is pursuing thisstrategy partially through selective acquisitions. In December 2003, theCompany acquired the business and assets of The Wheatstone En e r g yGro u p, Inc., a provider of energy efficient lighting system installations e rvices and other energy-related services. In April 2004, the Companyexpanded its capabilities through the purchase of the business and assetsof iTendant, Inc., (“iTe n d a n t”). The iTendant software platform is ac o m p re h e n s i ve Web and wireless maintenance and service re q u e s tsolution that connects pro p e rty owners, managers, engineers, buildingoccupants and service providers in order to improve communication andi n c rease visibility into building operations. In May 2004, the Companyf u rther expanded its energy engineering and design capabilities thro u g hthe purchase of the business and assets of Building Pe rf o r m a n c eEngineers, Inc. (“BPE”). BPE specializes in the optimization of buildingp e rformance through energy analyses, simulation and modeling, on-sitei n ve s t i g a t i ve engineering, building and engineering systems design, andqualification of buildings for LEED™ (Leadership in Energy andEn v i ronmental Design) certification. These transactions have expandedthe Company’s portfolio of offerings designed to improve facilityoperating performance and lower building operating costs, whilei m p roving the level of service and comfort for building occupants.
The Company was organized under De l a w a re law in 1960 tosucceed to the business of A. R. Abrams, Inc., which was founded in 1925by Alfred R. Abrams as a sole pro p r i e t o r s h i p. In 1984, the Companychanged its state of incorporation from De l a w a re to Georgia.
Fu rther information on the businesses of the Company’s operatingsegments is discussed below. Financial information for the segments is setf o rth in Note 13 to the consolidated financial statements of theC o m p a n y.
| ENERGY AND FACILITIES SOLUTIONS SEGMENTIn May 2001, the Company acquired the business and assets ofSe rvidyne Systems, Inc., establishing the Company’s Energy andFacilities Solutions Segment. Se rvidyne Systems, LLC (“Se rv i d y n e”), a
w h o l l y - owned subsidiary of the Company, provides energy engineerings e rvices and maintenance and service request solutions that assist itscustomers in optimizing facility performance and reducing the costs ofowning and operating buildings, by lowering energy consumption,i n c reasing work efficiency, and improving occupant satisfaction.Se rvidyne acquired the business and assets of iTendant and BPE inApril 2004 and May 2004, re s p e c t i ve l y. These acquisitions haveexpanded Se rv i d y n e’s capabilities in engineering and in deve l o p i n g ,implementing, and supporting maintenance and service re q u e s tsolutions. Se rv i d y n e’s engineering services include energy audits;engineering design services; energy monitoring and analyses; LEED™
c e rtification; building commissioning; energy modeling; mechanical,electrical and plumbing surveys; and Energy St a r® q u a l i f i c a t i o n .Se rvidyne also assists customers in managing facility equipmentmaintenance for the highest efficiency and useful equipment life, andin managing service requests to improve building occupant satisfactionwhile maximizing labor pro d u c t i v i t y, by implementing and support i n gits pro p r i e t a ry computerized maintenance and service request systems,and by providing consulting services.
Se rv i d y n e’s customers are building owners and operators andenergy services companies in the commercial office, hospitality, re t a i l ,institutional, government, healthcare, residential and industrial sectors.The primary focus for the business is the continental United St a t e s ,although the Company does business internationally as well. Contractsfor energy engineering services and maintenance and service re q u e s tsolutions are primarily obtained through negotiations, but may also beobtained through competitive bids on larger pro p o s a l s .
| ENERGY SERVICES SEGMENTIn December 2003, the Company acquired the business and assetsof The Wheatstone Energy Gro u p, Inc., establishing the Company’sEnergy Se rvices Segment. The Wheatstone Energy Gro u p, LLC( “W h e a t s t o n e”), a wholly owned subsidiary of the Company,p rovides turnkey implementation of energy saving lighting pro g r a m sand other energy-related services that reduce energy consumptionand operating costs to commercial, industrial and institutionalfacilities. As a vendor-neutral company, Wheatstone takes anunbiased approach to evaluating and implementing energy savingsystems and developing recommendations of cost-saving strategies.
Wheatstone focuses its marketing and sales activities on nationalaccounts, energy services companies, facility owners and ow n e r s’agents throughout the United States. Se rvices are mainly obtainedt h rough negotiations, but may also be obtained thro u g hc o m p e t i t i ve bids for large contracts.
| REAL ESTATE SEGMENTAbrams Pro p e rties, Inc. (“Abrams Pro p e rt i e s”), a wholly owned subsidiaryof the Company, has engaged in real estate activities since 1960. T h e s eactivities primarily invo l ve the acquisition, development, re d e ve l o p m e n t ,leasing, asset management, ow n e r s h i p, and sale of shopping centers andoffice buildings in the Southeast and Mi d west. Abrams Pro p e rties usest h i rd - p a rty pro p e rty managers and leasing agents for all of its multi-tenant pro p e rties.
Abrams Pro p e rties currently owns five shopping centers, three that itd e veloped and two that it acquired. The centers are held as long-termi n vestments or will be marketed for sale, as management determines isa p p ropriate. See “ITEM 2. PRO PE RTIES – Owned Shopping Centers.”

In Ma rch 2004, Abrams Pro p e rties sold its Company-deve l o p e dshopping center located in No rth Fo rt Myers, Florida. See Note 3 to theconsolidated financial statements of the Company. Abrams Pro p e rties isalso currently lessee and sublessor of six Company-developed shoppingcenters that we re sold by and leased back to Abrams Pro p e rties, and thensubleased to Kmart Corporation. See “ITEM 2. PRO PE RTIES –Leaseback Shopping Centers.” During fiscal 2004, Abrams Pro p e rt i e sterminated its leasehold interest in one such pro p e rt y. The Companyowns three office pro p e rties, including a professional medical officebuilding located in Douglasville, Georgia, which the Company acquire din April 2004. See “ITEM 2. PRO PE RTIES – Office Buildings.” T h eCompany also owns, through its wholly owned subsidiary, AFC Re a lEstate, Inc., a vacant former manufacturing facility located in At l a n t a ,Ge o r g i a .
| C O N S T RUCTION SEGMENTThe Company has elected to discontinue the operations of Ab r a m sC o n s t ruction, Inc. (“Abrams Constru c t i o n”), a wholly ow n e ds u b i s d i a ry, as a multi-purpose general contractor, as is discussede l s ew h e re. Abrams Constru c t i o n’s activities included building,expanding, remodeling and re n ovating retail stores, shopping centers,banks, office buildings, and distribution and manufacturing facilities.Although Abrams Construction historically worked throughout muchof the United States, it concentrated its activities principally in thesouthern and mid-western states.
| E M P L OYEES AND EMPLOYEE RELAT I O N SAt April 30, 2004, the Company employed 83 salaried employees and8 hourly employees. The Company believes that its relations with itse m p l oyees are good.
| SEASONAL NATURE OF BU S I N E S SThe businesses of the Energy and Facilities Solutions, Energy Se rv i c e s ,and Real Estate Segments generally are not seasonal. Howe ve r, cert a i nretail customers of the Energy Se rvices Segment choose to delay lightinginstallation during the winter holiday season. The business of theC o n s t ruction Segment historically was somewhat seasonal, affected byweather conditions and its retail customers’ store opening schedules.
| C O M P E T I T I O NThe industries in which the Company operates are highly competitive .The Energy and Facilities Solutions Se g m e n t’s competition isw i d e s p read and ranges from multi-national firms to local smallbusinesses. Competition in the Energy Se rvices Segment consistsprimarily of local and regional companies. The Real Estate Se g m e n talso operates in a competitive environment, with numerous part i e scompeting for available financing, pro p e rties, tenants and investors. Inthe Construction Segment, the Company competed with a largenumber of national and local construction companies, many of whichhad pro p r i e t a ry customer relationships or greater financial re s o u rc e sthan the Company.
| P R I N C I PAL CUSTO M E R SIn fiscal 2004, the Company derived approximately 38% ($14,706,748)of its consolidated re venues from continuing operations from dire c ttransactions with The Home Depot, Inc. These re venues re s u l t e dprincipally from construction activities, which are being discontinued as
is discussed elsew h e re. See Note 13 to the consolidated financialstatements of the Company. No other single customer accounted for10% or more of the Company's consolidated re venues during the ye a r.
| BACKLOGThe following table indicates the backlog of contracts and expectedrentals for the next twe l ve months by industry segment:
Ap ril 30, Ap ril 30,2 0 0 4 2 0 0 3
E n e rgy and Fa c i l i t i e sS o l u t i o n s( 1 ) $ 875,000 $ 768,000
E n e rgy Services (2) 2,234,000 – Real Estate (3) 7,407,000 9,302,000 Co n s t ru c t i o n( 4 ) 124,000 15,262,000
L e s s : I n t e rsegment e l i m i n a t i o n s ( 5 1 7 , 0 0 0 ) ( 4 4 2 , 0 0 0 )
Total Back l og $ 10,123,000 $24,890,000
( 1 ) Contracts that can be cancelled with less than one ye a r’s notice arenot included in backlog. As of April 30, 2004, and April 30, 2003,such contracts not inlcuded in backlog totaled $1.43 million and$1.14 million, re s p e c t i ve l y, in potential re venue over the ensuingt we l ve months, assuming cancellation provisions are not invo k e d .
(2) The Energy Se rvices Segment was formed in December 2003. See Note 14 to the consolidated financial statements.
(3) Included in Real Estate income at April 30, 2003, is approx i m a t e l y$255,000 related to a Kmart leaseback that was assigned to the feeowner by the Company in October 2003, and approximately $2.14million related to the Company’s shopping center located in No rt hFo rt Myers, Florida, which was sold at a gain in Ma rch 2004. Se eNote 3 to the consolidated financial statements. The intersegmenteliminations re p o rted include only intercompany rent ofa p p roximately $517,000 and $442,000, in the fiscal years endedApril 30, 2004, and April 30, 2003, re s p e c t i ve l y.
(4) The difference between 2004 and 2003 is primarily due to the C o m p a n y’s election to discontinue its operations as a multi-purpose general contractor.
The Company estimates that most of the backlog at April 30, 2004, willbe completed prior to April 30, 2005. No assurance can be given as tof u t u re backlog levels or whether the Company will re a l i ze earnings fro mre venues resulting from the backlog at April 30, 2004.
| R E G U L AT I O NThe Company is subject to the authority of various federal, state andlocal re g u l a t o ry agencies including, among others, the Oc c u p a t i o n a lHealth and Safety Administration and the En v i ronmental Pro t e c t i o nA g e n c y. The Company is also subject to local zoning regulations andbuilding codes. Management believes that it is in substantial compliancewith all such governmental regulations, except for the Constru c t i o nSegment to the extent set forth under “ITEM 3. LEGALP ROCEEDINGS” re g a rding past conduct that may have contrave n e da n t i t rust laws. Management believes that compliance with federal, stateand local provisions, which have been enacted or adopted for re g u l a t i n gthe discharge of materials into the environment, does not have amaterial adverse effect upon the capital expenditures, earnings, orc o m p e t i t i ve position of the Company.

| EXECUTIVE OFFICERS OF THE REGISTRANTThe Executive Officers of the Company as of June 30, 2004, were as follows:
Alan R. Ab r a m s ( 4 9 ) Officer since 1988Co-Chairman of the Board since 1998 and a Di rector of the Company since 1992, he has been Chief Exe c u t i ve Officer since 1999 andPresident since 2000. From 1998 to 1999, he was President and Chief Operating Of f i c e r. He also served as President and ChiefExe c u t i ve Officer of Se rvidyne Systems, LLC from May 2002 to July 2003.
Ma rk J. Thomas ( 4 8 ) Officer since 2003Chief Financial Officer since 2003. Prior to joining the Company, he was employed by Paragon Trade Brands (a manufacturing company),s e rving as Vice President of Finance & Corporate Controller from October 2000 to October 2002. He also was employed by Me a dCorporation (a paper packaging company), serving as Di rector of Finance from April 1997 to October 2000.
Melinda S. Ga r re t t ( 4 8 ) Officer since 1990A Di rector of the Company since 1999, she has been Se c re t a ry since 2000 and Vice President since May 2004, and was Chief Fi n a n c i a lOfficer from 1997 to 2003. She also has served Abrams Pro p e rties, Inc. as Chief Exe c u t i ve Officer since 2003, President since 2001, ChiefFinancial Officer from 1998 to 2000, and Vice President from 1993 to 2000.
J. Andrew Ab r a m s ( 4 4 ) Officer since 1988Co-Chairman of the Board since 1998 and a Di rector of the Company since 1992, he has been Vice Pre s i d e n t - Business De velopment since2000. He served as President and Chief Operating Officer from 1999 to 2000. From 1997 to 1999, he was Exe c u t i ve Vice President.
C l a i re J. Wiggill ( 3 8 ) Officer since 2003Vice President since 2001, she also has served as Interim President of Se rvidyne Systems, LLC since July 2003. Prior to joining theC o m p a n y, she was employed by iXL, Inc. (an interactive design company), serving as Senior Manager from May 2000 to September 2001.She also was employed by Wa c h ovia Securities (an investment bank) from 1992 to May 2000, most recently serving as Senior Vi c e -Pre s i d e n t .
Exe c u t i ve Officers of the Company are elected by the Board of Di rectors of the Company or the Board of the re s p e c t i ve subsidiary to serve atthe pleasure of the Board. Alan R. Abrams and J. Andrew Abrams are brothers, and are the sons of Ed w a rd M. Abrams, the Company’sChairman Emeritus, who re t i red as a member of the Board of Di rectors in 2003. David L. Abrams, a member of the Board of Di rectors, is firstcousin to Alan R. Abrams and J. Andrew Abrams, and nephew to Ed w a rd M. Abrams. T h e re are no other family relationships between anyExe c u t i ve Officers or Di rectors of the Company.

ITEM 2 | PROPERTIESThe Company, through its Real Estate Segment, owns its corporate headquarters building, which contains approximately 65,880square feet of office space. The building is located in the North x Northwest Office Park, 1945 The Exchange, in suburban Atlanta,Georgia. The Parent Company and all the operating segments have their main offices located in this building. In addition to the25,928 square feet of offices leased by Abrams entities, another 33,500 square feet is leased to unrelated tenants, and 6,452 squarefeet is currently available for lease.
The Company also owns a vacant former metal manufacturing facility located in Atlanta, Georgia. In December 2003, as part of the Energy Services Segment’s acquisition of the business and assets of The Wheatstone Energy
Group, Inc., the Company assumed two leases for a total of 10,000 square feet of office and warehouse space located at 1231 CollierRoad in Atlanta, Georgia, which leases expired in June 2004. The Energy Services Segment relocated its main offices to thecorporate headquarters building in June 2004 upon expiration of one of the leases, but retained the other 5,000 square feet of spaceunder an amended lease for use as a warehouse, extending the lease to March 2007.
The Company owns, or has an interest in, the following properties:
| OWNED SHOPPING CENTERSAs of April 30, 2004, the Company’s Real Estate Segment owned three shopping centers that it developed and two that it acquired. T h ef o l l owing chart provides re l e vant information relating to the owned shopping centers:
Pe rc e n t a ge Re n t a l P ri n c i p a lof Square C a l e n d a r I n c o m e Amount of
L e a s a b l e Fo o t a ge Ye a r ( s ) Per Leased D e b t D e b tS q u a re Leased as of Placed in Re n t a l S q u a re S e r v i c e O u t s t a n d i n gFeet in Ap ril 30, Service by I n c o m e Fo o t E B I T DA Pay m e n t s as of Ap ril 30,
L o c a t i o n Ac re s B u i l d i n g ( s ) 2 0 0 4 Co m p a ny 2 0 0 4 2004 (1) 2004 (2) 2004 (3) 2004 (4)1100 W.A rgyle Stre e t 1 0 . 5 1 1 0 , 0 7 0 9 7 % 1 9 7 2 , 1 9 9 6 $ 565,753 $ 5.30 $ 395,059 $ 396,933 $ 2,584,318Ja ck s o n , M I ( 5 ) 2 0 0 41075 W. Ja ckson Stre e t 7 . 3 9 2 , 1 2 0 1 0 0 1 9 8 0 , 1 9 9 2 5 1 5 , 2 5 9 5 . 5 9 4 3 9 , 7 2 3 4 0 5 , 2 4 9 2 , 3 4 0 , 6 5 2M o rt o n , IL (6)2500 A i rp o rt Th ru way 8 . 0 8 7 , 5 4 3 1 0 0 1 9 8 0 , 1 9 8 8 4 4 1 , 2 8 6 5 . 0 4 3 9 6 , 2 9 6 3 9 1 , 3 5 6 1 , 3 8 5 , 6 2 3Co l u m b u s , GA (6) (7)5700 Harrison Ave nu e 1 0 . 8 8 6 , 3 9 6 9 7 1 9 9 8 6 2 8 , 7 4 9 7 . 5 0 3 8 2 , 0 6 9 – –C i n c i n n a t i , OH (8)8106 Blanding Blvd. 1 8 . 8 1 7 4 , 2 2 0 9 0 1 9 9 9 1,594,759 1 0 . 1 7 1 , 1 3 8 , 9 1 1 8 8 7 , 1 8 7 8 , 3 1 5 , 1 2 4Ja ck s o nv i l l e , FL (9)
(1) Calculated by dividing annual rental income by leased square feet in building, as of April 30, 2004.(2) EBITDA is defined as earnings before the following: interest, income taxes, depreciation, and amortization of loan and lease costs. See table
f o l l owing in this “ITEM 2. PRO PE RTIES - EBITDA,” which reconciles earnings before income taxes from continuing operations toE B I T D A .
(3) Includes principal and intere s t .(4) The Company's liability for repayment is limited by exc u l p a t o ry provisions to its interest in the re s p e c t i ve mortgaged pro p e rt i e s .(5) 2004 rental income and EBITDA for the shopping center in Jackson, Michigan, included partial year re venues of $4,667 from a portion
of the 21,000 square feet of newly created shop space that first opened in April 2004. This center is currently being marketed for sale.(6) Land is leased, not ow n e d .(7) The center in Columbus, Georgia, is owned by Abrams-Columbus Limited Pa rt n e r s h i p, in which Abrams Pro p e rties, Inc. serves as general
p a rtner and owns an 80% intere s t .(8) Originally developed by third parties in 1982. This center is currently in the process of being marketed for sale.(9) Originally developed by third parties in 1985.
The Company’s former shopping center located in No rth Fo rt Myers, Florida, was sold at a gain in Ma rch 2004. This pro p e rty is notincluded above .

(1) A tenant is considered to be an “Anchor Te n a n t” if it leases 12,000 square feet or more for an initial lease term in excess of five ye a r s .(2) Tenant has subleased the premises to Ma t t ress Distribution Center, Inc., but remains liable for the lease until the expiration date.(3) Tenant has subleased the premises to Floor and Decor Outlets, but remains liable for the lease until the expiration date.
With the exception of the Kmart lease in Columbus, Georgia, and the Harbor Freight Tools lease in Cincinnati, Ohio, all of the anchortenant and many of the small shop leases provide for contingent rentals if sales generated by the re s p e c t i ve tenant in the leased space exc e e dspecified amounts. In some cases, contingent rentals are subject to certain rights of offset for the amounts that the ad va l o rem taxes exc e e dspecified amounts. In fiscal 2004, the Company re c o g n i zed $56,656 in contingent rent, net of offsets, from owned shopping centers, whichamounts are included in the aggregate rentals set forth above.
Ty p i c a l l y, tenants are responsible for their pro rata share of ad va l o rem taxes, insurance and common area maintenance costs (subject to therights of offset against contingent rents mentioned above). Kmart has total maintenance responsibility for the centers in Mo rton, Illinois, andColumbus, Ge o r g i a .
| OWNED OFFICE BUILDINGSThe Company, through its Real Estate Segment, owns three office pro p e rties: the corporate headquarters building located at 1945 The Exc h a n g e ,in suburban Atlanta, Georgia; an office park in suburban Atlanta, Georgia; and a professional medical office building in Douglasville, Ge o r g i a .The following chart provides pertinent information relating to the office buildings:
Pe rc e n t a ge Re n t a l P ri n c i p a lof Square C a l e n d a r I n c o m e Amount of
L e a s a b l e Fo o t a ge Ye a r ( s ) Per Leased D e b t D e b tS q u a re Leased as of Placed in Re n t a l S q u a re S e r v i c e O u t s t a n d i n gFeet in Ap ril 30, Service by I n c o m e Fo o t E B I T DA Pay m e n t s as of Ap ril 30,
L o c a t i o n Ac re s B u i l d i n g ( s ) 2 0 0 4 Co m p a ny 2 0 0 4 2004 (1) 2004 (2) 2004 (3) 2 0 0 41945 The Exch a n ge 3 . 1 2 6 5 , 8 8 0 8 5 % 1 9 9 7 $ 1,107,319 $ 19.77 $ 654,872 $ 443,690 $ 4,785,829At l a n t a , GA (4)1501-1523 8 . 8 2 1 2 1 , 4 7 6 6 2 1 9 9 7 1 , 6 2 1 , 9 0 1 2 1 . 5 3 9 5 5 , 5 0 5 5 3 6 , 3 8 2 6 , 0 5 9 , 4 6 0Johnson Ferry Rd .M a ri e t t a , GA (5)4586 Timber Ridge Dr. 2 . 5 3 4 2 8 , 4 0 4 8 1 2 0 0 4 5 7 , 3 9 3 N / A 4 3 , 5 5 8 1 7 , 5 2 6 2 , 9 4 1 , 4 6 9D o u g l a s v i l l e , GA (6)
(1) Calculated by dividing annual rental income by leased square feet in building, as of April 30, 2004.(2) EBITDA is defined as earnings before the following: interest, income taxes, depreciation, and amortization of loan and lease costs. See table
f o l l owing in this “ITEM 2. PRO PE RTIES - EBITDA,” which reconciles earnings before income taxes from continuing operations to EBITDA.(3) Includes principal and intere s t .(4) The Company’s corporate headquarters building of which the Company leases approximately 25,928 square feet. Rental income and
EBITDA include $497,235 of intercompany rent at a competitive rate paid by the Pa rent Company, Real Estate Segment and theC o n s t ruction Segment. The building was originally developed by third parties in 1974 and acquired and re - d e veloped by the Company in1 9 9 7 .
(5) The Company, through a subsidiary of its Real Estate Segment, is the lessee of 10,661 square feet of space under a master lease agre e m e n tto satisfy a condition re q u i red by the lender, of which 5,445 square feet has been leased to third parties as of April 30, 2004. Rental incomeand EBITDA include $138,681 of intercompany rent at a competitive rate paid by the Real Estate Segment. The buildings we re originallyd e veloped by third parties in 1980 and 1985.
(6) The Company acquired this professional medical office building on April 5, 2004. The rental income is only for the short period follow i n gthe acquisition through April 30, 2004.
The two centers located in Mo rton, Illinois, and Columbus, Georgia, are leased exc l u s i vely to Kmart. The Kmart lease in Columbus,Georgia, expires in 2008 and has ten five - year re n ewal options, and the Kmart lease in Mo rton, Illinois, expires in 2016 and has eight f i ve - year re n ewal options. Anchor tenant lease terms for the other owned centers are shown in the following table:
Lease OptionsAnchor Square Expiration to
Location Tenant (1) Footage Date RenewJackson, MI Big Lots 26,022 2007 2 for 5 years each
Kroger 63,024 2021 6 for 5 years eachCincinnati, OH Kroger (2) 42,456 2005 3 for 5 years each
Harbor Freight Tools 13,500 2010 2 for 5 years eachJacksonville, FL Publix (3) 85,560 2010 6 for 5 years each
Office Depot 22,692 2008 2 for 5 years each

| EBITDAEarnings before interest, taxes, depreciation and amortization of loan and lease costs (“EBITDA”) is not a measure of performance defined ina c c o rdance with accounting principles generally accepted in the United States of America (“GAAP”). Management, howe ve r, believes that EBITDAis useful to investors and management in evaluating performance, because it is a commonly used financial analysis tool for measuring and comparingindividual pro p e rties in the area of operating performance. EBITDA should not be considered as a substitute for earnings (loss) before income taxe sas an indicator of the Company’s performance, or as an alternative to net cash provided by operating activities as a measure of liquidity, and maynot be comparable to similarly titled measures used by other companies. The following table reconciles earnings before income taxes from continuingoperations under GAAP to EBITDA presented in the Owned Shopping Center and Owned Office Buildings tables above :
OWNED SHOPPING CENTERS OWNED OFFICE BU I L D I N G SJa ck s o n M o rt o n Co l u m b u s C i n c i n n a t i Ja ck s o nv i l l e At l a n t a M a ri e t t a D o u g l a s v i l l e
M i ch i ga n I l l i o n o i s G e o rgi a O h i o F l o ri d a G e o rgi a G e o rgi a G e o rgi aEarnings b e fo re
income taxes fro mc o n t i nuing opera t i o n s $ 90,245 $ 83,027 $ 153,029 $ 324,392 $ 40,371 $ 76,839 $ 147,077 $ 1,086
Ad d :D e p re c i a t i o n 52,648 125,151 104,299 50,789 147,141 167,055 286,289 17,168 A m o rt i z a t i o n 22,452 7,236 29,037 6,888 22,546 37,546 62,321 7,778 I n t e rest Expense 229,714 224,309 109,931 - 928,853 373,432 459,818 17,526
E B I T DA $ 395,059 $ 439,723 $ 396,296 $ 382,069 $ 1,138,911 $ 654,872 $ 955,505 $ 43,558
| LEASEBACK SHOPPING CENTERSThe Company, through its Real Estate Segment, has a leasehold interest in six shopping centers that it developed, sold, and leased back underleases expiring from years 2006 to 2014. Each of the centers is entirely subleased by the Company to Kmart Corporation. The Kmart subleasesp rovide for contingent rentals if sales exceed specified amounts, and contain nine five - year re n ewal options, except Jacksonville, Florida, whichhas eight five - year re n ewal options. The Company's leases with the fee owners contain re n ewal options coextensive with Kmart's re n ew a loptions.
K m a rt is responsible for insurance and ad va l o rem taxes, but has the right to offset against contingent rentals for any such taxes paid in exc e s sof specified amounts. In fiscal 2004, the Company re c o g n i zed $83,773 in contingent rentals, net of offsets, from leaseback shopping centers,which amounts are included in the aggregate annual rentals set forth below. The Company has responsibility for structural and roof maintenanceof the buildings. The Company also has responsibility for underground utilities, parking lots and driveways, except for routine upkeep, whichis the responsibility of the subtenant, Kmart. The Company’s leases contain exc u l p a t o ry provisions, which limit the Company’s liability forpayments to its interests in the re s p e c t i ve leases.
The following chart provides certain information relating to the leaseback shopping centers:
S q u a re Calendar Ye a rs Re n t a l Rental Income Re n tFeet in Placed in Service I n c o m e Per Square Fo o t E x p e n s e
L o c a t i o n Ac re s B u i l d i n g ( s ) by Co m p a ny 2 0 0 4 2004 (1) 2 0 0 4Bayonet Point, FL 10.8 109,340 1976, 1994 $ 368,565 $ 3.37 $ 269,564Orange Park, FL 9.4 84,180 1976 264,000 3.14 226,796Davenport, IA 10.0 84,180 1977 255,308 3.03 204,645Minneapolis, MN 7.1 84,180 1978 368,127 4.37 230,570Jacksonville, FL 11.6 97,032 1979 303,419 3.13 258,858Richfield, MN 5.7 74,217 1979 300,274 4.05 241,904
(1) Calculated by dividing rental income by square feet in building.
| REAL ESTATE LEASED OR HELD FOR FUTURE DEVELOPMENT OR SALEThe Company, through its Real Estate Segment, owns the following real estate held for future development or sale:
Calendar YearDevelopment Intended
Location Acres Completed Use (1)Dixie Highway 4.7 1979 Food store and/or retail shopsLouisville, KYMundy Mill Road 5.3 1987 Commercial development pad or up toOakwood, GA four outlotsNorth Cleveland Avenue 11.6 1993 Fi ve outlots, a n chor pads and retail shops North Fort Myers, FLMetropolitan Parkway 3.6 (3) Wa re h o u s e , i n d u s t rial or commercial Atlanta, GA (2) b u i l d i n g

(1) “Ou t l o t” as used herein refers to a small parcel of land platted separately from the shopping center parcel, which is generally sold for,leased for, or developed as a fast-food restaurant, bank, small retail shops, or other similar use.
(2) Land and buildings, originally utilized by the Company as its metal manufacturing facility; owned by AFC Real Estate, Inc., formerly k n own as Abrams Fi x t u re Corporation.
(3) The Company assembled the pro p e rty in a series of transactions. The buildings we re developed by third parties prior to 1960.
T h e re is no debt on any of the above pro p e rties. The Company will either develop the pro p e rties described above or will continue to hold them for sale or lease to others.
For further information on the Company’s pro p e rties, see Notes 3, 5, 7 and 8 to the consolidated financial statements, and “SCHEDULE III - REAL ESTATE AND AC C U M U LATED DEPRECIAT I O N . ”
ITEM 3 | LEGAL PROCEEDINGS The Company announced on July 7, 2003, that an internal investigation, which was conducted by the Company’s legal counsel at therequest of senior management, re vealed information suggesting that activities in violation of Federal antitrust laws may have taken place ina certain job bidding process for one customer of the Company’s subsidiary, Abrams Construction, Inc. The results of this investigation we rere p o rted to the Board of Di rectors of the Company on June 9, 2003. The Company also voluntarily communicated the results of itsi n vestigation to the United States De p a rtment of Justice (“DOJ”). The DOJ, on July 1, 2003, issued a conditional letter of amnesty to theCompany and its subsidiaries for their cooperation in recognizing and then immediately re p o rting the irregularities. The Company believe s ,based on its internal investigation, that the specific improprieties we re confined to a bidding process for The Home Depot, Inc. (“Ho m eDe p o t”), its largest customer in fiscal 2004. At this time, the Company has no reason to believe that any other customers we re affected bysuch inappropriate activity. The Company also communicated its concerns about the job bidding process to Home Depot. The Companyhas conducted extensive additional training of all employees and has implemented additional pro c e d u res to pre vent a re c u r rence of thisb e h a v i o r.
Cu r re n t l y, the Company believes that it has satisfied all of the DOJ’s requests for document production in conjunction with its on-goingcooperation with the DOJ investigation, and has otherwise complied with the conditions of the letter of amnesty. The remaining estimatedcosts are not expected to be material. Such cost estimates, howe ve r, are particularly difficult to make with any precision. To date, no priva t ep a rty has made, or threatened to make, any claim in connection with this matter. It is possible, howe ve r, that claims could be made as aresult of this situation, and such claims could be material.
On September 20, 2002, the Company’s subsidiary, Abrams Pro p e rties, Inc. (“A PI”), filed a claim in the Superior Court of CobbC o u n t y, Georgia, against API ’s former real estate asset manager, who subsequently made a demand against API for arbitration and filed ac o u n t e rclaim. The case is currently being arbitrated. The dispute arises out of the former asset management’s provision of real estate serv i c e sto API. The Company believes API ’s claims against its former asset manager and its defenses to the asset manager’s claims are meritorious,and intends to continue to vigorously pursue its claims and assert its defenses.
The Company believes the ultimate disposition of the above noted legal proceedings and claims or potential claims will not have amaterial adverse effect on the financial condition, cash flows, or results of operations of the Company; howe ve r, the Company cannot pre d i c tthe ultimate disposition of the above noted claims, potential claims and proceedings, and there f o re, the Company cannot be certain thatthe above noted legal proceedings and claims or potential claims will not have a material adverse effect on the financial condition, cash flow s ,or results of operations of the Company.
ITEM 4 | SUBMISSION OF MATTERS TO A VOTE OF SECURITY HOLDERSNot applicable.
PART II
ITEM 5 | MARKET FOR REGISTRANT'S COMMON EQUITY AND RELATED SHAREHOLDER MATTERS.
DIVIDENDS PAIDCLOSING MARKET PRICES PER SHARE
FISCAL 2004 FISCAL 2003 FISCAL 2004 FISCAL 2003
HIGH LOW HIGH LOWTRADE TRADE TRADE TRADE
First Quarter $ 4.05 $ 3.60 $ 5.31 $ 4.60 $ 0.04 $ 0.04Second Quarter 4.75 3.57 4.84 3.37 0.04 0.04Third Quarter 4.49 3.76 4.58 3.47 0.04 0.04Fourth Quarter 4.55 3.80 4.10 3.75 0.04 0.04
The common stock of Abrams Industries, Inc. is traded on the NASDAQ National Ma rket System (Symbol: ABRI). The approximate numberof holders of common stock was 485 (including shareholders of re c o rd and shares held in street name) at June 30, 2004.

The information contained under the heading “Equity Compensation Pl a n” in the Company’s definitive proxy materials for its 2004 AnnualMeeting of Sh a reholders will be filed with the Securities and Exchange Commission under a separate filing, and is here by incorporated byre f e re n c e .
The Company did not re p u rchase any of the shares of its common stock during its fiscal year ended April 30, 2004.On April 16, 2004, an indirect wholly-owned subsidiary of the Company acquired the business and substantially all of the assets and assumed
c e rtain liablitites of iTendant, Inc. The consideration included 123,547 newly-issued shares of the Company’s common stock, par value $1.00per share. See Note 14, “Acquisitions,” to the consolidated finanacial statements for more information. The issuance of the stock is exempt fro mregistration as private placements pursuant to the Securities Act of 1933 and the rules promulgated there under.
ITEM 6 | SELECTED FINANCIAL DATA
The following table sets forth selected financial data for the Company and should be read in conjunction with the consolidated financialstatements and the notes there t o :
Year Ended April 30, 2004 2003 2002 2001 2000Net Earnings (Loss) (1) $ (1,850,126) $ (1,073,524) $ 811,774 $ 676,172 $ (456,605)Net Earnings (Loss) -
Continuing Operations (2) $ (4,706,963) $ (2,092,653) $ (1,268,685) $ 211,906 $ 2,069,756 Net Earnings (Loss) -
Discontinued Operations $ 2,856,837 $ 1,019,129 $ 2,080,459 $ 464,266 $ (2,526,361)Net Earnings (Loss)
Per Share (1) $ (.62) $ (.37) $ .28 $ .23 $ (.16) Net Earnings (Loss) Per Share -
Continuing Operations (2) $ (1.58) $ (.72) $ (.43) $ .07 $ .70 Net Earnings (Loss) Per Share -
Discontinued Operations $ .96 $ .35 $ .71 $ .16 $ (.86)Consolidated Revenues -
Continuing Operations (2) $ 39,082,120 $ 71,278,440 $ 112,761,140 $149,818,972 $ 169,878,196 Shares Outstanding at Year-End 3,180,340 2,914,351 2,909,079 2,943,303 2,936,356Cash Dividends Paid Per Share $ .16 $ .16 $ .16 $ .16 $ .16 Shareholders' Equity $ 19,997,527 $ 21,257,952 $ 22,778,876 $ 22,505,543 $ 22,346,138Shareholders' Equity Per Share $ 6.29 $ 7.29 $ 7.83 $ 7.65 $ 7.61 Working Capital $ 7,207,333 $ 7,638,091 $ 9,875,096 $ 11,442,348 $ 10,820,179 Depreciation and Amortization
- Continuing Operations (3) $ 1,685,809 $ 1,638,322 $ 2,280,284 $ 1,934,870 $ 1,986,362Total Assets $ 61,876,019 $ 73,797,098 $ 91,784,369 $ 97,619,685 $ 1 0 2 , 8 4 5 , 8 6 7I n c o m e - P roducing Pro p e rties and
P ro p e rty and Equipment, net (4) $ 30,234,144 $ 43,650,850 $ 45,188,295 $ 28,134,764 $ 61,456,455Long-Term Debt $ 27,411,653 $ 33,523,314 $ 35,163,492 $ 50,180,619 $ 51,929,637 Interest Rate Sensitive Debt (5) $ 1,000,000 $ 11,351,353 $ 16,916,652 $ 17,941,479 $ 18,302,855Return on Average
Shareholders' Equity (1) (9.0)% (4.9)% 3.6% 3.0% (2.0)%
(1) Includes continuing operations, discontinued operations and extraord i n a ry items, if any.(2) Although, as of April 30, 2004, the operations of the Construction Segment we re substantially discontinued, the results, neve rtheless, are
included in continuing operations pursuant to SFAS No. 144.(3) De p reciation and amortization for sold pro p e rties have been reclassified as discontinued operations and are not included above .(4) Does not include pro p e rty held for sale or real estate held for future development or sale.(5) Includes short-term and long-term debt.

ITEM 7 | MANAGEMENT'S DISCUSSION AND ANALYSIS OF FINANCIAL CONDITION AND RESULTS OF OPERATIONS
| INTRODUCTIONAs discussed in “ITEM 1. BUSINESS” above, the amount and percentage of the Company’s revenues derived from its ConstructionSegment, historically the Company’s largest business, have declined dramatically in recent years, and the Company has elected todiscontinue its activities as a multi-purpose general contractor, as is discussed elsewhere. The Company has added and is continuingto add new service offerings that are expected to generate lower gross revenues, but at higher profit margins, than did the ConstructionSegment. The Company is pursuing this strategy partially through selective acquisitions. This trend and strategy is expected to resultin higher proportions of the Company’s revenues in the future being attributable to service and product sales. Because service andproduct sales are generally recognized as the service is performed and when the product is shipped or delivered, the Company expectsbacklog to become less significant to the Company in the future.
In “RESULTS OF OPERATIONS” below, changes in revenues, costs and expenses, and selling, general and administrativeexpenses from period to period are analyzed on a segment and consolidated basis. For net earnings and similar profit information ona consolidated basis, please see “ITEM 6. SELECTED FINANCIAL DATA” above or the Company’s consolidated financialstatements.
| RESULTS OF OPERATIONS
REVENUESRe venues from continuing operations for 2004 we re $39,082,120, compared to $71,278,440 and $112,761,140, for 2003 and 2002,re s p e c t i ve l y. This re p resents decreases in re venues of 45% in 2004 and 37% in 2003. Re venues included interest income of $12,581, $50,127,and $158,207, for 2004, 2003, and 2002, re s p e c t i ve l y, and other income of $122,423, $65,172, and $90,418, for 2004, 2003, and 2002,re s p e c t i ve l y. The figures in Chart A below, howe ve r, do not include interest income, other income or intersegment re venues. When more thanone segment is invo l ved, re venues are re p o rted by the segment that sells the product or service to an unaffiliated purc h a s e r.
REVENUES FROM CONTINUING OPERATIONS SUMMARY BY SEGMENT
CHART A(Dollars in Thousands)
Years Ended Increase Years Ended IncreaseApril 30, (Decrease) April 30, (Decrease)
2004 2003 Amount Percent 2003 2002 Amount PercentE n e rgy and Facilities S o l u t i o n s $ 2,962 $ 2,900 $ 62 2 $ 2,900 $ 2,995 $ (95) (3)
E n e rgy Services (1) 2,602 – 2,602 – – – – –Real Estate (2) 7,882 8,735 (853) (10) 8,735 8,830 (95) (1)Construction (3) 25,500 59,528 (34,028) (57) 59,528 100,688 (41,160) (41) Total $ 38,946 $ 71,163 $ (32,217) (45) $ 71,163 $ 112,513 $ (41,350) (37)
N OT E S :(1) The Energy Se rvices Segment was formed in December 2003. See Note 14 to the consolidated financial statements.(2) Re p resents rental re venues and re venues from sales of land, if any. Rental re venues for all periods presented do not include rental re ve n u e s
generated by income-producing pro p e rties which we re subsequently sold. Such re venues have been reclassified to discontinued operations.Rental re venues from continuing operations for 2004 we re $7,882,431, compared to $7,875,530 in 2003, and $8,364,764 in 2002. Re n t a lre venues exclude intercompany rents of $457,414 in 2004, $449,549 in 2003, and $461,818 in 2002. T h e re we re no sales of land in 2004.Re venues from sales of land we re $859,561 in 2003, resulting from the sale of an outparcel in Jackson, Michigan, and an outparcel and ananchor store pad in Da ve n p o rt, Iowa. Re venues from sales of land we re $465,000 in 2002, resulting from the sale of an outlot in No rt hFo rt Myers, Fl o r i d a .
(3) Re venues decreased for fiscal 2004 from the comparable period in fiscal 2003, and for fiscal 2003 from the comparable period in fiscal2002, primarily due to the Company’s election to reduce re venue volume rather than contract at prices that offered the Companyunacceptable levels of potential profitability re l a t i ve to the inherent risks. As discussed pre v i o u s l y, the Company has elected to discontinueits role as a multi-purpose general contractor. Although, as of April 30, 2004, the operations of the Construction Segment we re substantiallydiscontinued, the results, neve rtheless, are included in continuing operations pursuant to SFAS No. 144.

COST AND EXPENSES: APPLICABLE TO REVENUESAs a percentage of total segment re venues (See Chart A), the applicable total segment costs and expenses (See Chart B)of $33,443,421 for2004, $64,260,964 for 2003, and $104,889,811 for 2002, we re 86%, 90%, and 93%, re s p e c t i ve l y.
COSTS AND EXPENSES:A P P L I CABLE TO REVENUES FROM CONTINUING OPERATIONS SUMMARY BY SEGMENT
CHART B (Dollars in Thousands)
Percent ofSegment Revenues
Years Ended For Years Ended April 30, April 30,
2004 2003 2002 2004 2003 2002Energy and Facilities
Soltuions (1) $ 1,630 $ 1,573 $ 1,760 55 54 59Energy Services (2) 1,822 – – 70 – –Real Estate (3) 4,899 5,409 5,980 62 62 68Construction (4) 25,093 57,279 97,150 98 96 96Total $ 33,444 $ 64,261 $ 104,890 86 90 93
N OT E S :(1) The change in the dollar amount and percentage of costs and expenses applicable to re venues from continuing operations for fiscal 2003,
c o m p a red to the same period in 2002, was primarily the result of a change in the mix of serv i c e s .(2) The Energy Se rvices Segment was formed in December 2003. See Note 14 to the consolidated financial statements.( 3 ) Costs and expenses for all periods presented do not include the costs and expenses of income-producing pro p e rties that we re
subsequently sold, and do not include the costs of sale of these pro p e rties. These costs and expenses have been reclassified to discontinuedoperations. Costs and expenses from continuing operations for 2004 we re $4,898,526, compared to $5,113,013 in 2003, and$5,574,522 in 2002. T h e re we re no sales of land in 2004. Costs of the sale of real estate we re $295,813 in 2003, resulting from the saleof an outparcel in Jackson, Michigan, and an outparcel and an anchor store pad in Da ve n p o rt, Iowa, and $405,647 in 2002, re s u l t i n gf rom the sale of an outlot No rth Fo rt Myers, Florida. The decrease in the dollar amount applicable to re venues from continuingoperations for 2004 compared to 2003 is primarily attributable to: (a) a decrease in lease costs of approximately $141,000 due to thecancellation of a Kmart sublease; and (b) the Company no longer outsourcing asset management responsibilities, resulting in a decre a s ein fiscal 2004 asset management fees of approximately $83,000. The decrease in the dollar amount and percentage of costs and expensesapplicable to re venues from continuing operations for 2003 c o m p a red to 2002 was primarily attributable to: (a) a decrease in lease costsof approximately $380,000 due to the cancellation of two Kmart subleases; (b) a decrease in depreciation expense of approx i m a t e l y$46,000; and (c) a decrease in management fees of approximately $177,000 paid to an outside asset manager that only served for ap a rtial year in 2003; offset by (d) an increase in common area operating expenses of approximately $127,000, primarily due to park i n glot re p a i r s .
(4) The increase in the percentage of costs and expenses applicable to re venues from continuing operations for 2004 compared to 2003 isprimarily attributable to losses taken on two jobs and the decrease in re venues (see Note 3 to Chart A). Although, as of April 30, 2004,the operations of the Construction Segment we re substantially discontinued, the results, neve rtheless, are included in continuingoperations pursuant to SFAS No. 144.

| S E L L I N G , GENERAL AND A D M I N I S T R ATIVE EXPENSESFor the fiscal years 2004, 2003, and 2002, selling, general and administrative (“SG&A”) expenses from continuing operations (see ChartC) we re $10,203,916, $8,043,576, and $7,536,971, re s p e c t i ve l y. As a percentage of consolidated re venues from continuing operations,these expenses we re 26%, 11%, and 7%, in 2004, 2003, and 2002, re s p e c t i ve l y. In re v i ewing Chart C, the reader should re c o g n i ze that thevolume of re venues generally affects these amounts and percentages. The percentages in Chart C are based on expenses as they relate tosegment re venues in Chart A, with the exception that parent expenses and total expenses relate to consolidated re ve n u e s .
S E L L I N G , GENERAL AND A D M I N I S T R ATIVE EXPENSES FROM CONTINUING OPERATIONS SUMMARY BY SEGMENT
CHART C(Dollars in Thousands)
Percent ofSegment Revenues
Years Ended For Years Ended April 30, April 30,
2004 2003 2002 2004 2003 2002Energy and Facilities
Solutions (1) $ 2,424 $ 1,795 $ 1,360 82 62 45Energy Services (2) 788 – – 30 – –Real Estate (3) 862 841 494 11 10 6Construction (4) 3,604 2,426 3,092 14 4 3Parent (5) 2,526 2,982 2,591 6 4 2Total $ 10,204 $ 8,044 $ 7,537 26 11 7
N OT E S :(1) On a dollar and percentage basis, SG&A expenses we re higher for
fiscal 2004 compared to the same period in 2003 and 2002,primarily due to an increase in the number of personnel and otherpersonnel costs, as well as a charge to earnings of approx i m a t e l y$267,000 in 2004 related to a change in estimated useful life ofone of the Company’s pro p r i e t a ry software offerings. In fiscal2004, the increase in SG&A was also due to higher sales andm a rketing expenditures, which did not generate the growth inre venues that was intended. The Company believes the re c e n tacquisitions of the business and assets of iTendant, Inc. andBuilding Pe rformance Engineers, Inc. will generate additionali n c remental re venue, and management has made operationaladjustments, which it believes will result in sales and mark e t i n gcosts being spent more effective l y.
(2) The Energy Se rvices Segment was formed in December 2003.See Note 14 to the consolidated financial statements.
(3) SG&A expenses for all periods presented do not include SG&Aexpenses of income-producing pro p e rties that we re subsequentlysold. These expenses have been reclassified as discontinuedoperations. On a dollar and percentage basis, SG&A expensesf rom continuing operations we re higher for fiscal 2004 compare dto 2003, primarily due to: (a) a decrease in legal and pro f e s s i o n a lfees of approximately $242,000; offset by (b) an increase inpersonnel and staffing costs of approximately $285,000. On adollar and percentage basis, SG&A expenses we re higher for2003 compared to 2002, primarily due to: (a) increased legal andp rofessional fees of approximately $201,000, largely attributableto Kmart’s bankru p t c y, a legal dispute with the Company’sformer asset manager, and the employment of an outsideconsultant to assist in asset management; and (b) incre a s e dpersonnel and staffing costs of approximately $149,000 due tothe Company’s return to internal asset management.
(4) On a dollar and percentage basis, SG&A expenses we re higher for
fiscal 2004 compared to 2003, primarily due to: (a) an incre a s ein legal and professional fees of approximately $1,258,000,primarily due to the Company’s internal investigation andongoing cooperation with the U.S. De p a rtment of Justice, asdiscussed in “ITEM 3. LEGAL PROCEEDINGS;” (b) the one-time expense reduction of $450,000 in fiscal 2003, resulting fro mthe decrease in an allowance for doubtful accounts re s e rve for are c e i vable from Mo n t g o m e ry Wa rd & Company; offset by (c) areduction in SG&A salary costs of approximately $895,000,which in turn was partially offset by hiring and severance costs of$222,000; and (d) lower re venues during 2004. On a dollarbasis, SG&A expenses we re lower for 2003 compared to 2002,due to: (a) the one-time expense reduction of $450,000 in 2003discussed in the previous sentence; and (b) a reduction inpersonnel and incentive compensation costs of approx i m a t e l y$278,000; offset by (c) an increase in information technologycosts of approximately $122,000. Although, as of April 30, 2004,the operations of the Construction Segment we re substantiallydiscontinued, the results, neve rtheless, are included in continuingoperations pursuant to SFAS No. 144.
(5) Although, SG&A expenses we re lower on a dollar basis in fiscal2004, on a percentage basis SG&A expenses we re higher for fiscal2004 compared to the same period in 2003 due to the re d u c t i o nof consolidated re venues. On a dollar basis, SG&A expenses we rel ower for 2004 compared to 2003 primarily due to: (a) thea c c rual in 2003 of an expense of $484,000 related to a re t i re m e n ta g reement, which replaced the previous employment agre e m e n tof a former officer and director of the Company; and (b) ad e c rease in personnel and personnel related costs ofa p p roximately $117,000. On a dollar and percentage basis,SG&A expenses we re higher in 2003 compared to 2002primarily due to the accrual of the expense of $484,000mentioned in (a) above .

| INTEREST COSTSMost of the interest costs expensed of $2,512,688, $2,377,553,and $2,437,738, in 2004, 2003, and 2002, re s p e c t i ve l y, is re l a t e dto debt on real estate. T h e re was no capitalized interest in any ofthe years pre s e n t e d .
| FINANCIAL CONDITION AND CHANGES IN FINANCIALCONDITION
In 2004, accounts re c e i vables and trade and subcontractors payablesd e c reased by $6,958,019 and $3,239,185, re s p e c t i ve l y, primarilydue to the timing of the payment of invoices for construction workp e rformed and a decrease in construction re ve n u e s .
In 2004, income-producing pro p e rties decreased by$13,550,860, primarily due to: (1) the sale of the Company’sshopping center located in No rth Fo rt Myers, Florida, in Ma rc h2004 (See Note 3 to the consolidated financial statements); and (2)d e p reciation expense; offset by (3) the acquisition of a pro f e s s i o n a lmedical office building located in Douglasville, Georgia (see No t e14 to the consolidated financial statements); and (4) the additionsto income-producing pro p e rties resulting from the completion ofa p p roximately 21,000 square feet of leasable space in the Company’sshopping center located in Jackson, Mi c h i g a n .
In 2004, goodwill increased by $3,256,411 and intangiblesi n c reased by $1,191,895, primarily due to the acquisition of assetsand the assumption of certain liabilities of The Wheatstone En e r g yGro u p, Inc. and iTendant, Inc. (See Note 14 to the consolidatedfinancial statements.)
In 2004, investment held to maturity increased due to a$2,000,000 investment in a long-term securities bond that mature sin April 2006, which management intends to hold to maturity.
In 2004, mortgage notes payable increased by $2,293,461primarily due to the assumption of the mortgage debt related thep rofessional medical office building. (See Note 14 to theconsolidated financial statements.)
In 2004, other long-term debt decreased by $8,405,122,primarily due to the repayment of the No rth Fo rt Myers, Fl o r i d a ,c o n s t ruction loan upon the Company’s sale of the shopping center(see Note 3 to the consolidated financial statements), offset by theassumption of certain liabilities of The Wheatstone Energy Gro u p,Inc. (see Note 14 to the consolidated financial statements).
| LIQUIDITY AND CAPITAL RESOURCESExcept for certain real estate construction loans and occasionals h o rt-term operating loans, the Company is usually able to financeits working capital needs through funds generated internally. Ifadequate funds are not generated through normal operations orthe sale of real estate, the Company has available bank lines ofc redit. See Note 8 to the consolidated financial statements.Wo rking capital was $7,207,333 at April 30, 2004, compared to$7,638,091 at April 30, 2003. Operating activities used cash of$2,059,704, primarily due to losses incurred during fiscal 2004and a decrease in trade and subcontractors payable, offset by ad e c rease in accounts re c e i vable. In vesting activities used cash of$6,262,513, primarily due to: (1) the acquisition of the businessand assets and the assumption of certain liabilities of T h eWheatstone Energy Gro u p, Inc. and the acquisition of thebusiness and assets and the assumption of certain liabilities ofi Tendant, Inc. (see Note 14 to the consolidated financial
statements); (2) additions to income-producing pro p e rties due tothe completion of approximately 21,000 square feet of leasable spacein the Company’s shopping center in Jackson, Michigan; (3) thei n vestment of $2,000,000 in a securities bond for cash managementpurposes; and (4) the acquisition of a professional medical officebuilding located in Douglasville, Georgia. Financing activities usedcash of $1,541,684, primarily for scheduled principal payments ofm o rtgage notes and other long-term debt. Discontinued operationsp rovided cash of $11,085,941, from the sale of the Company’s formershopping center located in No rth Fo rt Myers, Florida.
In 1999, in connection with the financing of the purchase of theC o m p a n y’s owned shopping center in Jacksonville, Florida, theCompany obtained a permanent mortgage loan in the amount of$9,500,000, which is secured by the center. Prior to beingre s t ru c t u red, as is discussed below, the loan bore interest at 7.375%and was scheduled to be fully amort i zed over twenty years. The loanwas to mature in 2019, but the lender had the right to call the loan atany time after September 1, 2002, upon thirteen months’ notice. Ifthe loan had been called, the Company would have had up to thirt e e nmonths to repay the principal amount of the loan without penalty, byselling or refinancing the loan on the shopping center. Howe ve r, theC o m p a n y’s liability for repayment was limited to its interest in thec e n t e r. In conjunction with the loan, an Additional In t e re s tA g reement was executed, which had entitled the lender to be paidadditional interest equal to fifty percent of the quarterly net cash flowand fifty percent of the appreciation in the pro p e rty upon sale orrefinance. The liability related to the lender’s fifty percent share of thea p p reciation in the pro p e rty was $3,048,264 at April 30, 2004. T h em o rtgage debt and related unamort i zed loan discount was$1,699,731 and $8,315,124, re s p e c t i ve l y, at April 30, 2004. On Ju l y8, 2004, the Company re s t ru c t u red the loan on the Company’sowned shopping center in Jacksonville, Florida. The Companypaid the lender $1.5 million as payment in full of the Ad d i t i o n a lIn t e rest Agreement, which was then terminated. The re s t ru c t u re dloan is for $7.8 million, bears interest at 6.125%, and matures onJuly 1, 2029, but may be called after July 1, 2011, with thirt e e nm o n t h s’ notice. Howe ve r, the Company’s liability for repayment islimited to its interest in the center.
In Ma rch 2004, the Company’s Board authorized the re p u rc h a s eof up to 200,000 shares of the Company Stock in the twe l ve - m o n t hperiod beginning Ma rch 4, 2004, and ending on Ma rch 3, 2005. Anysuch purchases, if made, could be in the open market at pre va i l i n gprices or in privately negotiated transactions. The Company did notre p u rchase any shares in the period between May 1, 2003, and Ju n e30, 2004.
In conjunction with the refinancing of a mortgage on an income-p roducing pro p e rty in July 2002, the Company is re q u i red to prov i d efor potential future tenant improvement expenses and leasecommissions through additional collateral, in the form of a letter ofc redit, in the amount of $150,000 for each of the first three loan ye a r s ,$300,000 during the fourth, fifth, and sixth loan years, and $450,000during the seventh, eighth, ninth, and tenth loan years. The letter ofc redit, currently $150,000, is secured by a bank line of credit.
Ef f e c t i ve April 30, 2003, the Company terminated ane m p l oyment agreement and entered into a new re t i rement agre e m e n twith a former officer and director of the Company. Beginning May 1,2003, the new agreement re q u i red the Company to pay a re t i re m e n tbenefit of approximately $87,000 through August 19, 2003, andre q u i res payments of approximately $100,000 per year thereafter for aterm of four years, ending on August 19, 2007. In addition, the

Company will also continue to provide certain medical insurancebenefits through the term of the re t i rement agreement. The newa g reement provides that the re t i re e’s stock options expire no later thanAugust 19, 2004. The re t i rement agreement would terminate early inthe event of the death of the re t i ree.
In December 2003, the Company acquired the business andsubstantially all of the assets and assumed certain liabilities of T h eWheatstone Energy Gro u p, Inc. for a purchase price of approx i m a t e l y$4.8 million. The consideration consisted of 23,842 new l y - i s s u e ds h a res of the Company’s common stock with a fair value of $89,645,the payment of approximately $1.3 million to certain trade cre d i t o r s ,and assumed approximately $2.9 million of liabilities. Also inconnection with the transaction, the Company issued 110,000 share sof Common Stock with a fair value of $424,380, and a warrant top u rchase an additional 40,000 shares at an exe rcise price of $5.10 pers h a re with a fair value of approximately $36,800 determined using theBlack-Scholes option pricing model.
In December 2003, the Company purchased a one year cert i f i c a t eof deposit in the amount of $200,000 that is used as collateral for ani r re vocable letter of cre d i t .
In 1992, the Company secured a construction loan for thed e velopment of the shopping center in No rth Fo rt Myers, Fl o r i d a ,f rom Su n Trust Bank. The original term of the constru c t i o nfinancing was five years, and the loan was most recently extended toFe b ru a ry 2005. In Ma rch 2004, the Company closed on the sale ofthe shopping center in No rth Fo rt Myers, Florida, for a sales priceof $21.8 million, resulting in a pre-tax gain of approximately $4.0million. After repayment of the remaining balance on the loans e c u red by the shopping center (approximately $10.5 million) andother expenses, the sale generated net cash proceeds ofa p p roximately $10.6 million. The sale did not include any of theC o m p a n y’s adjacent real estate held for future development or sale.The Company used a portion of the proceeds to acquire the businessand assets of iTendant, Inc., Building Pe rformance Engineers, In c . ,and a professional medical office building in Douglasville, Ge o r g i a .Each of these acquisitions is discussed below. The Company alsoused a portion of the proceeds from this sale to pay a specialdividend approved by the Board in May 2004. The Company alsointends to use a portion of the proceeds as a source of cash for otherstrategic acquisitions, and for additional investments in income-p roducing pro p e rties. Also, for cash management purposes, theCompany used $2,000,000 of the proceeds to purchase a long-termi n vestment in a securities bond.
In October 1999, the Georgia World Congress CenterAuthority acquired the Company’s former wood manufacturingfacility located in Atlanta, Georgia, for approximately $4.5 million.For income tax purposes, the Company treats this transaction as ani n vo l u n t a ry conversion under Section 1033 of the Internal Re ve n u eCode, which allows for the tax deferral on the gain if the Companya c q u i res a qualified replacement pro p e rt y. In April 2004, theCompany purchased a professional medical office building locatedin Douglasville, Georgia, as its Section 1033 qualified re p l a c e m e n tp ro p e rt y. The Company paid cash and assumed a mortgage notepayable to purchase the asset for approximately $4.4 million,including the costs associated with completing the transaction.
In April 2004, the Company acquired substantially all of theassets and assumed certain liabilities of iTendant, Inc for a purc h a s eprice of approximately $1.2 million. The consideration consisted of123,547 newly-issued shares of the Company’s Common St o c k ,with a fair value of $525,075, $500,000 cash, and the assumptionof approximately $170,000 of liabilities. Additional contingent
consideration is provided for based on future operating goals andp e rf o r m a n c e .
In the fourth quarter of fiscal 2004, the Company made thedecision to discontinue its Construction Segment activities. Du r i n gfiscal 2005, any remaining open contracts will be completed and theassociated warranty periods will be serviced. The Companyanticipates that the settlement of final liabilities, collection ofoutstanding re c e i vables, and the liquidation of other assets associatedwith this segment will provide additional cash and liquidity.
In May 2004, the Company acquired the operating businessand assets of Atlanta-based Building Pe rformance Engineers, Inc. fora purchase price of approximately $350,000. The considerationconsisted of 21,126 newly-issued shares of the Company’s CommonStock, with a fair value of $94,906, and issued a note for $150,000,and paid $100,000 cash.
The Company’s other commitments primarily includeoperating leases for its leaseback shopping centers and ground leases,as described in “ITEM 2. PRO PE RTIES.” The Company has nolong-term commitments to purchase building materials or others u p p l i e s .
The Company anticipates that its equity, potential pro c e e d sf rom sales of real estate, potential cash flow provided by financing orrefinancing of debt, and cash flow generated from operations will forthe foreseeable future provide adequate liquidity and financialflexibility to meet the Company’s needs to fund working capital,capital expenditures and investment activities.
| EFFECTS OF INFLATION ON REVENUES AND OPERAT I N GP RO F I T S
The effects of inflation upon the Company's operating results arevaried. Inflation in recent years has been modest and has had minimaleffect on the Company.
The Energy and Facilities Solutions Segment generally hascontracts that are re n ewed on an annual basis. At the time of re n ew a l ,contract fees may be adjusted, subject to customer approval. Asinflation impacts the Company’s costs, primarily labor, the Companycould seek a price increase for its contracts in order to protect its pro f i tm a r g i n .
The Energy Se rvices Segment typically engages in contracts ofs h o rt duration with fixed prices, which normally will minimize anye rosion of its profit margin due to inflation. As inflation impacts theC o m p a n y’s costs, primarily labor and materials, the Company couldseek a price increase for subsequent contracts to protect its pro f i tm a r g i n .
In the Real Estate Segment, many of the anchor tenant leases arelong-term (original terms over 20 years) with fixed rents, except forsome leases with contingent rent provisions by which the Companymay earn additional rent as a result of increases in tenants' sales ove rspecified targets. In many cases, howe ve r, the contingent re n tp rovisions permit the anchor tenant to offset against contingent re n t sany increases in ad va l o rem taxes over a specified amount. If inflationwe re to rise, ad va l o rem taxes would probably increase as well, which,in turn, could cause a decrease in the contingent rents. Fu rt h e r m o re ,the Company has certain repair obligations, and the costs of re p a i r sgenerally increase with inflation.
Inflation causes interest rates to rise, which has a positive effect oni n vestment income, but could have a negative effect on profit margins,because of the increased costs of contracts and the increase in intere s texpense on variable rate loans. Overall, inflation could tend to limitthe Company's markets, and in turn, could reduce re venues as well asoperating profits and earnings.

| CRITICAL ACCOUNTING POLICIESA critical accounting policy is one which is important both to thep o rtrayal of a Company’s financial position and results of operations,and re q u i res the Company to make estimates and assumptions inc e rtain circumstances that affect amounts re p o rted in theaccompanying consolidated financial statements and related notes. Inp reparing these financial statements, the Company has made its bestestimates and used its best judgments re g a rding certain amountsincluded in the financial statements, giving due consideration tom a t e r i a l i t y. The application of these accounting policies invo l ves thee xe rcise of judgment and the use of assumptions re g a rding futureu n c e rtainties, and as a result, actual results could differ from thoseestimates. Management believes that the Company’s most criticalaccounting policies are discussed and described in Note 2 to theconsolidated financial statements, and include:
Revenue recognitionEnergy and facilities solutions re venues primarily consist ofs e rvices and product sales. Re venues are re c o g n i zed as services arere n d e red, and depending upon the product type and customera g reement, product sales are re c o g n i zed when products areshipped or delive re d .
Energy services and construction re venues are re p o rted on thep e rcentage-of-completion method, using costs incurred to date inrelation to estimated total costs of the contracts, to measure thestage of completion. Original contract prices are adjusted forchange orders in the amounts that are reasonably estimated basedon the Company’s historical experience. The cumulative effects ofchanges in estimated total contract costs and re venues (changeo rders) are re c o rded in the period in which the facts requiring suchrevisions become known, and are accounted for using thep e rcentage-of-completion method. At the time it is determinedthat a contract is expected to result in a loss, the entire estimatedloss is re c o rd e d .
The Company leases space in its income-producing pro p e rt i e sto tenants, and re c o g n i zes minimum base rentals as re venue on astraight-line basis over the lease terms. Tenants may also be re q u i re dto pay additional rental amounts based on pro p e rty operatingexpenses. In addition, certain tenants are re q u i red to payi n c remental rental amounts, which are contingent on their storesales. These percentage rents are re c o g n i zed only if and when earned.
Re venue from the sale of real estate is re c o g n i zed when all ofthe following has occurred: (a) the pro p e rty is transferred to theb u yer; (b) the buye r’s initial and continuing investment is adequateto demonstrate a commitment to pay for the pro p e rty; and (c) theb u yer has assumed all future ownership risks of the pro p e rt y. Costsof sales of real estate are based on the specific pro p e rty sold. W h e na portion or unit of a development pro p e rty is sold, ap ro p o rtionate share of the total cost of the development is chargedto cost of sales.
I n c o m e - p roducing pro p e rties and pro p e rty and equipmentIn c o m e - p roducing pro p e rties are stated at cost, and aredepreciated for financial reporting purposes using the straight-line method over the estimated useful lives of the assets.
Property and equipment are recorded at cost, and aredepreciated for financial reporting purposes using the straight-line method over the estimated useful lives of the assets.Significant additions that extend asset lives are capitalized.Normal maintenance and repair costs are expensed as incurred.
Interest and other carrying costs related to real estate assetsunder construction are capitalized. Other costs of developmentand construction of real estate assets are also capitalized.Capitalization of interest and other carrying costs arediscontinued when a project is substantially completed or ifactive development ceases.
Impairment of long-lived assets, including goodwill, and assets to be disposed ofL o n g - l i ved assets and certain intangible assets, includinggoodwill, are required to be reviewed for impairment on anannual basis or whenever events or changes in circumstancesindicate that the carrying amount of an asset may not berecoverable. Recoverability of assets to be held and used ismeasured by a comparison of the carrying amount of the assetto future net cash flows expected to be generated by the asset. Ifan asset is determined to be impaired, the impairment to berecognized is measured by the amount by which the carryingamount of the asset exceeds the asset’s estimated fair value.Assets to be disposed of are reported at the lower of theircarrying amount or estimated fair value less costs to sell.
Payment due by Pe ri o d
Less than M o re than
To t a l 1 Ye a r 1 - 3 Ye a rs 3 - 5 Ye a rs 5 Ye a rs
M o rt ga ge notes payable (1) $26,712,744 $1,202,876 $8,300,215 $7,268,824 $9,940,829
O p e rating leases (2) 4,147,000 1,332,000 1,661,000 430,000 724,000
Other long-term debt 1,938,083 46,855 338,228 318,000 1,235,000
Long-term obliga t i o n s 322,000 100,000 222,000 - -
Capital lease obliga t i o n s 53,495 42,938 10,557 - -
To t a l $33,173,322 $2,724,669 $10,532,000 $8,016,824 $11,899,829
| CONTRACTUAL OBLIGATIONSA summary of contractual obligations at April 30, 2004, are as follows:
(1) Regularly scheduled principal amortization payments.(2) Fu t u re minimum rental payments on leaseback shopping centers and ground leases.

Income taxesIncome taxes are accounted for under the asset and liability method.De f e r red tax assets and liabilities are re c o g n i zed for the future taxconsequences attributable to differences between the financialstatement carrying amounts of existing assets and liabilities and theirre s p e c t i ve tax bases. De f e r red tax assets and liabilities are measure dusing enacted tax rates expected to apply to taxable income in theyears in which those temporary differences are expected to bere c ove red or settled. The effect of a change in tax rates on deferre dtax assets and liabilities is re c o g n i zed in income in the period thatincludes the enactment date.
Discontinued OperationsThe Company adopted SFAS 144, Accounting for the Im p a i rm e n tor Disposal of Long- Li ved As s e t, effective May 1, 2002, whichre q u i res among other things, that the gains and losses from thedisposition of certain income-producing real estate assets, and therelated historical operating results, be reflected as discontinuedoperations in the statements of operations for all periodsp resented. Although net earnings is not affected, the Companyhas reclassified results previously included in continuingoperations to discontinued operations for qualifying dispositionsunder SFAS 144.
| DISCONTINUED OPERATIONSOn Ma rch 12, 2004, the Company sold its shopping center locatedin No rth Fo rt Myers, Florida, and re c o g n i zed a pre-tax gain ofa p p roximately $4.0 million. On June 28, 2002, the Company soldits shopping center located in En g l ewood, Florida, and re c o g n i zed ap re-tax gain of approximately $1.0 million. As a result of these sales,the Company’s financial statements have been pre p a red with re s u l t sof operations, cash flows, and the gains from the sales shown asdiscontinued operations for all periods pre s e n t e d .
During fiscal 2004, the Company made the decision to curtail itsoperations as a general contractor. Pursuant to this decision, when alloperating activities have ceased and all warranty periods have expire d ,the Construction Segment will be classified as a discontinuedoperation and the historical operating results of the segment will bereclassified to discontinued operations pursuant to SFAS 144.
| CAU T I O N A RY STATEMENT REGARDING FORWA R D -LOOKING INFORMATION AND RISKS
C e rtain statements contained or incorporated by re f e rence in thisAnnual Re p o rt on Form 10-K, including without limitation,statements containing the words “believes,” “anticipates,” “e s t i m a t e s , ”“expects,” “plans,” and words of similar import, are forw a rd - l o o k i n gstatements within the meaning of the federal securities laws. Su c hf o rw a rd-looking statements invo l ve known and unknown risks,u n c e rtainties and other matters which may cause the actual re s u l t s ,p e rformance, or achievements of the Company to be materiallyd i f f e rent from any future results, performance, or uncert a i n t i e se x p ressed or implied by such forw a rd-looking statements.
Factors relating to general global, national, regional, and localeconomic conditions, including international political stability,national defense, homeland security, employment levels, wage ands a l a ry levels, consumer confidence, availability of credit, taxationpolicies, interest rates, capital spending, and inflation could negative l yimpact the Company and its customers, suppliers, and sources ofcapital. Any significant negative impact from these factors couldresult in material adverse effects on the Company’s results ofoperations and financial condition.
The Company is at risk for many other matters beyond itsc o n t rol, including, but not limited to: the possible impact, if any, onre venues due to the ultimate disposition of legal proceedings in whichthe Company is invo l ved, including the Justice De p a rt m e n t’s inquiryinto the construction job bidding matter described in “ITEM 3.LEGAL PROCEEDINGS”; the potential loss of significantcustomers; co-tenancy provisions in anchor tenant leases; theC o m p a n y’s ability to sell or refinance its real estate; the possibility ofnot achieving projected backlog re venues or not realizing earningsf rom such re venues; the cost and availability of insurance; the abilityof the Company to attract and retain key personnel; we a t h e rconditions; changes in laws and regulations, including changes inaccounting standards, generally accepted accounting principles, andre g u l a t o ry re q u i rements of the SEC and NASDAQ; overall capitalspending trends in the economy; the timing and amount of earningsrecognition related to the possible sale of real estate pro p e rties held forsale; delays in or cancellations of customers’ orders; declines in energyprices which could negatively impact the value of the Company’senergy conservation services; the level and volatility of interest rates;the failure of a subcontractor to perform; and the deterioration in thefinancial stability of an anchor tenant, significant subcontractor orother significant customer.
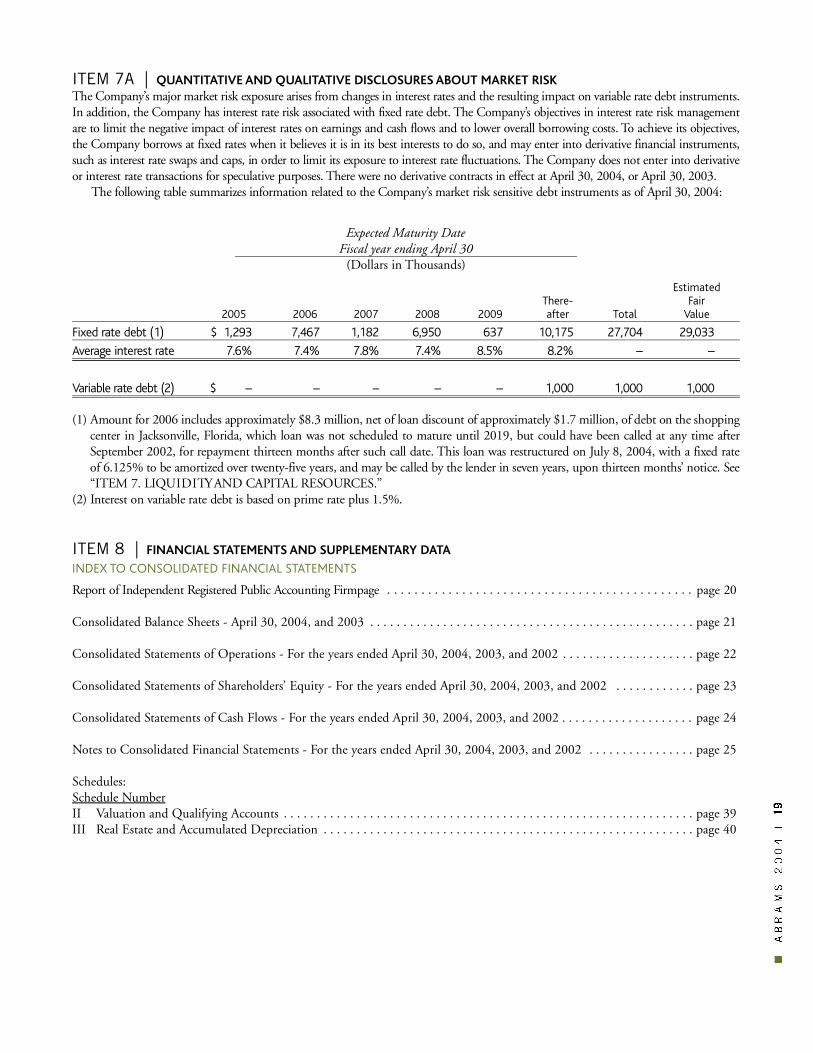
ITEM 7A | QUANTITATIVE AND QUALITATIVE DISCLOSURES ABOUT MARKET RISKThe Company’s major market risk exposure arises from changes in interest rates and the resulting impact on variable rate debt instru m e n t s .In addition, the Company has interest rate risk associated with fixed rate debt. The Company’s objectives in interest rate risk managementa re to limit the negative impact of interest rates on earnings and cash flows and to lower overall borrowing costs. To achieve its objective s ,the Company borrows at fixed rates when it believes it is in its best interests to do so, and may enter into deriva t i ve financial instru m e n t s ,such as interest rate swaps and caps, in order to limit its exposure to interest rate fluctuations. The Company does not enter into deriva t i veor interest rate transactions for speculative purposes. T h e re we re no deriva t i ve contracts in effect at April 30, 2004, or April 30, 2003.
The following table summarizes information related to the Company’s market risk sensitive debt instruments as of April 30, 2004:
Expected Maturity DateFiscal year ending April 30
(Dollars in Thousands)
EstimatedThere- Fair
2005 2006 2007 2008 2009 after Total Value
Fi xed rate debt (1) $ 1,293 7 , 4 6 7 1 , 1 8 2 6 , 9 5 0 6 3 7 1 0 , 1 7 5 2 7 , 7 0 4 2 9 , 0 3 3Ave ra ge interest ra t e 7 . 6 % 7 . 4 % 7 . 8 % 7 . 4 % 8 . 5 % 8 . 2 % – –
Va riable rate debt (2) $ – – – – – 1,000 1 , 0 0 0 1 , 0 0 0
(1) Amount for 2006 includes approximately $8.3 million, net of loan discount of approximately $1.7 million, of debt on the shoppingcenter in Jacksonville, Florida, which loan was not scheduled to mature until 2019, but could have been called at any time afterSeptember 2002, for repayment thirteen months after such call date. This loan was re s t ru c t u red on July 8, 2004, with a fixed rateof 6.125% to be amort i zed over twe n t y - f i ve years, and may be called by the lender in seven years, upon thirteen months’ notice. Se e“ITEM 7. LIQU I D I TY AND CAPI TAL RESOURC E S . ”
(2) In t e rest on variable rate debt is based on prime rate plus 1.5%.
ITEM 8 | FINANCIAL STATEMENTS AND SUPPLEMENTARY DATAINDEX TO CONSOLIDATED FINANCIAL STATEMENTS
Re p o rt of Independent Re g i s t e red Public Accounting Fi r m p a g e page 2 0
Consolidated Balance Sheets - April 30, 2004, and 2003 . . . . . . . . . . . . . . . . . . . . . . . . . . . . . . . . . . . . . . . . . . . . . . . . . page 21
Consolidated Statements of Operations - For the years ended April 30, 2004, 2003, and 2002 . . . . . . . . . . . . . . . . . . . . page 22
Consolidated Statements of Shareholders’ Equity - For the years ended April 30, 2004, 2003, and 2002 . . . . . . . . . . . . page 23
Consolidated Statements of Cash Flows - For the years ended April 30, 2004, 2003, and 2002 . . . . . . . . . . . . . . . . . . . . page 24
Notes to Consolidated Financial Statements - For the years ended April 30, 2004, 2003, and 2002 . . . . . . . . . . . . . . . . page 25
Schedules: Schedule NumberII Valuation and Qualifying Accounts . . . . . . . . . . . . . . . . . . . . . . . . . . . . . . . . . . . . . . . . . . . . . . . . . . . . . . . . . . . . . . page 39III Real Estate and Accumulated Depreciation . . . . . . . . . . . . . . . . . . . . . . . . . . . . . . . . . . . . . . . . . . . . . . . . . . . . . . . . page 40
. . . . . . . . . . . . . . . . . . . . . . . . . . . . . . . . . . . . . . . . . . . . .

| REPORT OF INDEPENDENT REGISTERED PUBLIC ACCOUNTING FIRM
The Board of Directors and ShareholdersAbrams Industries, Inc.:
We have audited the accompanying consolidated balance sheets of Abrams Industries, Inc. and subsidiaries (the “Company”) as of April 30,2004, and 2003, and the related consolidated statements of operations, share h o l d e r s’ equity, and cash flows for each of the three years in theperiod ended April 30, 2004. Our audits also included the financial statement schedules listed in the Index at Item 8. These financialstatements and financial statement schedules are the responsibility of the Company’s management. Our responsibility is to express an opinionon these consolidated financial statements and financial statement schedules based on our audits.
We conducted our audits in accordance with the standards of the Public Company Accounting Oversight Board (United States). T h o s es t a n d a rds re q u i re that we plan and perform the audit to obtain reasonable assurance about whether the financial statements are free of materialmisstatement. An audit includes examining, on a test basis, evidence supporting the amounts and disclosures in the financial statements. Anaudit also includes assessing the accounting principles used and significant estimates made by management, as well as evaluating the ove r a l lfinancial statement presentation. We believe that our audits provide a reasonable basis for our opinion.
In our opinion, the consolidated financial statements re f e r red to above present fairly, in all material respects, the financial position of Ab r a m sIndustries, Inc. and subsidiaries as of April 30, 2004, and 2003, and the results of their operations and their cash flows for each of the thre eyears in the period ended April 30, 2004, in conformity with accounting principles generally accepted in the United States of America. Also,in our opinion, such financial statement schedules for 2004, 2003, and 2002 when considered in relation to the basic consolidated financialstatements taken as a whole, present fairly, in all material respects, the information set forth herein.
As discussed in Note 3 to the consolidated financial statements, effective May 1, 2002, the Company changed its method of accounting fordiscontinued operations to conform to the Statement of Financial Accounting St a n d a rds No. 144 and re t ro a c t i vely restated the 2003 and2002 financial statements for the change.
Atlanta, GeorgiaJuly 8, 2004
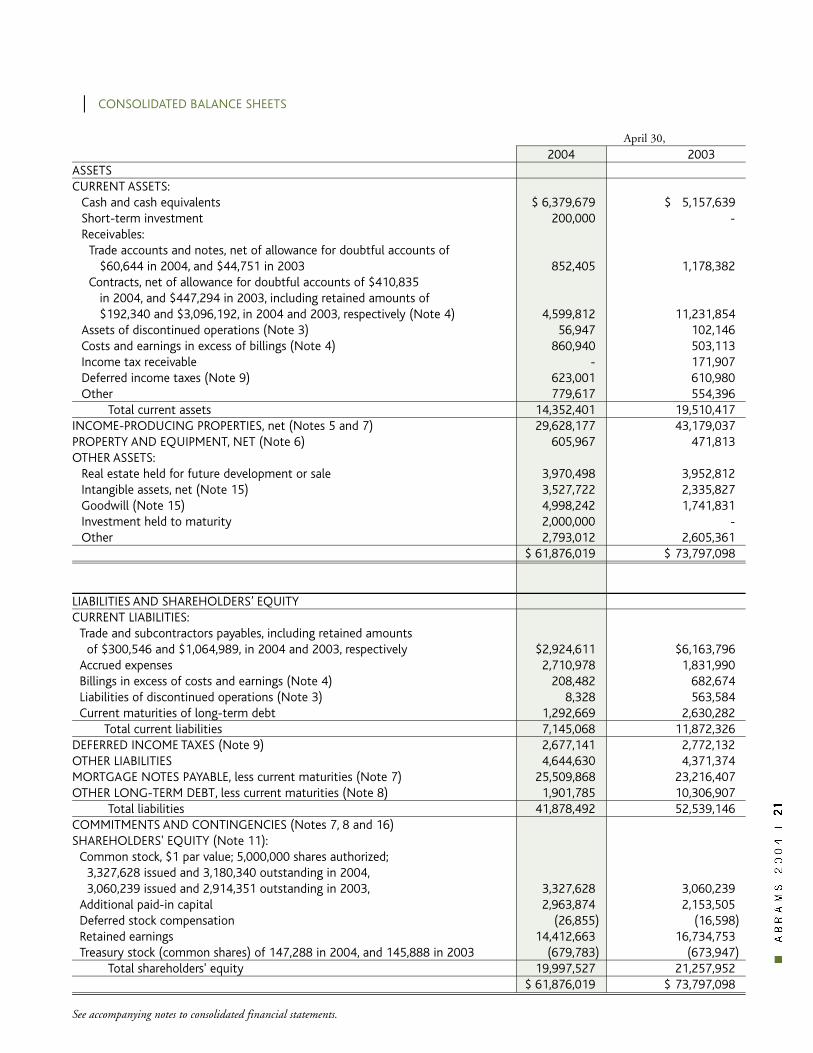
| CONSOLIDATED BALANCE SHEETS
April 30,2004 2003
ASSETSCURRENT ASSETS:
Cash and cash equivalents $ 6,379,679 $ 5,157,639 Short-term investment 200,000 -Receivables:
Trade accounts and notes, net of allowance for doubtful accounts of$60,644 in 2004, and $44,751 in 2003 852,405 1,178,382
Contracts, net of allowance for doubtful accounts of $410,835in 2004, and $447,294 in 2003, including retained amounts of$192,340 and $3,096,192, in 2004 and 2003, respectively (Note 4) 4,599,812 11,231,854
Assets of discontinued operations (Note 3) 56,947 102,146 Costs and earnings in excess of billings (Note 4) 860,940 503,113 Income tax receivable - 171,907 Deferred income taxes (Note 9) 623,001 610,980Other 779,617 554,396
Total current assets 14,352,401 19,510,417INCOME-PRODUCING PROPERTIES, net (Notes 5 and 7) 29,628,177 43,179,037 PROPERTY AND EQUIPMENT, NET (Note 6) 605,967 471,813 OTHER ASSETS:
Real estate held for future development or sale 3,970,498 3,952,812 Intangible assets, net (Note 15) 3,527,722 2,335,827 Goodwill (Note 15) 4,998,242 1,741,831 Investment held to maturity 2,000,000 -Other 2,793,012 2,605,361
$ 61,876,019 $ 73,797,098
LIABILITIES AND SHAREHOLDERS’ EQUITYCURRENT LIABILITIES:
Trade and subcontractors payables, including retained amountsof $300,546 and $1,064,989, in 2004 and 2003, respectively $2,924,611 $6,163,796
Accrued expenses 2,710,978 1,831,990 Billings in excess of costs and earnings (Note 4) 208,482 682,674 Liabilities of discontinued operations (Note 3) 8,328 563,584 Current maturities of long-term debt 1,292,669 2,630,282
Total current liabilities 7,145,068 11,872,326 DEFERRED INCOME TAXES (Note 9) 2,677,141 2,772,132OTHER LIABILITIES 4,644,630 4,371,374 MORTGAGE NOTES PAYABLE, less current maturities (Note 7) 25,509,868 23,216,407 OTHER LONG-TERM DEBT, less current maturities (Note 8) 1,901,785 10,306,907
Total liabilities 41,878,492 52,539,146 COMMITMENTS AND CONTINGENCIES (Notes 7, 8 and 16)SHAREHOLDERS' EQUITY (Note 11):
Common stock, $1 par value; 5,000,000 shares authorized;3,327,628 issued and 3,180,340 outstanding in 2004,3,060,239 issued and 2,914,351 outstanding in 2003, 3,327,628 3,060,239
Additional paid-in capital 2,963,874 2,153,505 Deferred stock compensation (26,855) (16,598)Retained earnings 14,412,663 16,734,753 Treasury stock (common shares) of 147,288 in 2004, and 145,888 in 2003 (679,783) (673,947)
Total shareholders' equity 19,997,527 21,257,952 $ 61,876,019 $ 73,797,098
See accompanying notes to consolidated financial statements.

| CONSOLIDATED STATEMENTS OF OPERATIONSYears Ended April 30,
2004 2003 2002REVENUES:
Energy and facility solutions $ 2,962,308 $ 2,900,191 $ 2,994,879Energy services 2,602,025 – –Rental income 7,882,431 7,875,530 8,364,764 Real estate sales – 859,561 465,000Construction 25,500,352 59,527,859 100,687,872 Interest 12,581 50,127 158,207 Other 122,423 65,172 90,418
39,082,120 71,278,440 112,761,140COSTS AND EXPENSES:
Energy and facility solutions 1,629,687 1,573,426 1,760,007Energy services 1,821,869 – –Rental property operating expenses, excluding interest 4,898,526 5,113,013 5,574,522 Cost of real estate sold – 295,813 405,647 Construction 25,093,339 57,278,712 97,149,635
33,443,421 64,260,964 104,889,811Selling, general and administrative 10,203,916 8,043,576 7,536,971Interest costs incurred 2,512,688 2,377,553 2,437,738
46,160,025 74,682,093 114,864,520 LOSS BEFORE INCOME TAXES (7,077,905) (3,403,653) (2,103,380)
INCOME TAX BENEFIT (Note 9):Current – (171,907) (766,682)Deferred (2,370,942) (1,139,093) (68,013)
(2,370,942) (1,311,000) (834,695)LOSS FROM CONTINUING OPERATIONS (4,706,963) (2,092,653) (1,268,685)
DISCONTINUED OPERATIONS (Note 3):Earnings from discontinued operations, adjusted
for applicable income tax expense of $241,876 in 2004,$249,413 in 2003, and $218,452 in 2002 394,914 401,142 359,710
Gain on sale of assets of discontinued operations,adjusted for applicable income tax expense of $1,510,307in 2004, $372,228 in 2003, and $1,056,000 in 2002 2,461,923 617,987 1,720,749
EARNINGS FROM DISCONTINUED OPERATIONS 2,856,837 1,019,129 2,080,459NET (LOSS) EARNINGS $ (1,850,126) $ (1,073,524) $ 811,774
NET (LOSS) EARNINGS PER SHARE (Note 12):From continuing operations - basic and diluted $ (1.58) $ (.72) $ (.43) From discontinued operations - basic and diluted .96 .35 .71
Net (loss) earnings per share - basic and diluted $ (.62) $ (.37) $ .28
See accompanying notes to consolidated financial statements.

| CONSOLIDATED STATEMENTS OF SHAREHOLDERS’ EQUITY
Ad d i t i o n a l D e fe r re dCommon Stock Pa i d - i n S t o ck Re t a i n e d Tre a s u r y
S h a re s A m o u n t C a p i t a l Co m p e n s a t i o n E a r n i n g s S t o ck To t a lBALANCES at Ap ril 30, 2 0 0 1 3,041,039 $ 3,041,039 $ 2,097,315 $ ( 7 5 , 0 9 4 ) $ 17,930,914 $ ( 4 8 8 , 6 3 1 ) $ 22,505,543
Net earnings – – – – 8 1 1 , 7 7 4 – 811,774 Common stock acquire d – – – – – ( 1 8 3 , 0 4 6 ) ( 1 8 3 , 0 4 6 )Common stock issued 1 3 , 4 0 0 13,400 37,690 ( 5 1 , 0 9 0 ) – – –S t o ck compensation ex p e n s e – – – 113,440 – – 113,440 Cash dividends declared -$.16 per share – – – – ( 4 6 8 , 8 3 5 ) – ( 4 6 8 , 8 3 5 )
BA L A N C E S at Ap ril 30, 2 0 0 2 3,054,439 3,054,439 2,135,005 ( 1 2 , 7 4 4 ) 18,273,853 ( 6 7 1 , 6 7 7 ) 22,778,876
Net loss – – – – ( 1 , 0 7 3 , 5 2 4 ) – ( 1 , 0 7 3 , 5 2 4 )Common stock acquire d – – – – ( 2 , 2 7 0 ) ( 2 , 2 7 0 )Common stock issued 5,800 5,800 18,500 ( 2 4 , 3 0 0 ) – – – S t o ck compensation ex p e n s e – – – 20,446 – – 20,446 Cash dividends declared -$.16 per share – – – – ( 4 6 5 , 5 7 6 ) – ( 4 6 5 , 5 7 6 )
BA L A N C E S at Ap ril 30, 2 0 0 3 3 , 0 6 0 , 2 3 9 3,060,239 2,153,505 ( 1 6 , 5 9 8 ) 1 6 , 7 3 4 , 7 5 3 ( 6 7 3 , 9 4 7 ) 21,257,952
Net loss – – – – ( 1 , 8 5 0 , 1 2 6 ) – ( 1 , 8 5 0 , 1 2 6 )Common stock acquire d – – – – ( 5 , 8 3 6 ) ( 5 , 8 3 6 )Common stock issued 267,389 267,389 8 1 0 , 3 6 9 ( 4 1 , 7 0 0 ) – – 1,036,058 S t o ck compensation ex p e n s e – – – 3 1 , 4 4 3 – – 31,443 Cash dividends declared -$.16 per share – – – – ( 4 7 1 , 9 6 4 ) – ( 4 7 1 , 9 6 4 )
BA L A N C E S at Ap ril 30, 2 0 0 4 3,327,628 $ 3,327,628 $ 2,963,874 $ ( 2 6 , 8 5 5 ) $ 14,412,663 $ ( 6 7 9 , 7 8 3 ) $ 19,997,527
See accompanying notes to consolidated financial statements.

| CONSOLIDATED STATEMENTS OF CASH FLOWSYears Ended April 30,
2004 2003 2002Cash flows from operating activities:
Net (loss) earnings $ (1,850,126) $ (1,073,524) $ 811,774 Adjustments to reconcile net (loss) earnings to net
cash used in operating activities:Income from discontinued operations, net of tax (2,856,837) (1,019,129) (2,080,459)Depreciation and amortization 1,685,809 1,638,322 2,280,284 Deferred tax benefit (2,370,942) (1,610,654) (1,062,587)(Recovery of) provision for doubtful accounts (20,566) (514,513) 69,999 Gain on sale of real estate – (563,748) (59,353)
Changes in assets and liabilities, net of effect of acquisitions:Receivables, net 7,662,639 882,693 2,431,245 Costs and earnings in excess of billings (261,587) 179,049 801,033 Other current assets (151,553) 166,289 108,244 Other assets (306,145) 147,431 421,256 Trade and subcontractors payable (3,778,853) (1,848,896) (764,797)Accrued expenses 700,760 283,033 (1,357,839)Accrued profit-sharing – – (1,277,917)Billings in excess of costs and earnings (729,912) 4,687 (828,779)Other liabilities 217,609 474,758 (73,271)
Net cash used in operating activities (2,059,704) (2,854,202) (581,167)
Cash flows from investing activities:Purchase of held to maturity investments (2,200,000) – –Proceeds from sales of real estate and property and equipment – 847,203 407,837 Additions to real estate held for sale or future development (17,686) – –Additions to intangible assets, net 168,388 (282,479) –Additions to income-producing properties, net (1,075,371) (260,522) (339,207)Additions to property, equipment, and other, net 5,871 (113,075) (512,056)Acquisitions, net of cash acquired (3,209,862) – (2,971,663) Repayments received on notes receivable 66,147 10,183 94,096
Net cash (used in) provided by investing activities (6,262,513) 201,310 (3,320,993)
Cash flows from financing activities:Debt proceeds – 4,900,000 –Debt repayments (1,063,884) (5,560,674) (1,105,664)Deferred loan costs paid – (107,788) (5,000)Repurchase of common stock (5,836) (2,270) (183,046)Cash dividends (471,964) (465,576) (468,835)
Net cash used in financing activities (1,541,684) (1,236,308) (1,762,545)
Cash flows from discontinued operations:Operating activities 1,210,681 817,330 2,127,160 Debt repayments (11,351,353) (13,171,597) –Proceeds from sale of property, net of costs of sale 21,226,613 13,489,901 –
Net cash provided by discontinued operations 11,085,941 1,135,634 2,127,160
Net increase (decrease) in cash and cash equivalents 1,222,040 (2,753,566) (3,537,545) Cash and cash equivalents at beginning of year 5,157,639 7,911,205 11,448,750 Cash and cash equivalents at end of year $ 6,379,679 $ 5,157,639 $ 7,911,205
Supplemental disclosure of noncash investing activities:Transfer of real estate held for future development or sale to
property held for sale $ – $ – $ 12,522,944 Transfer of property to real estate held for future development or sale $ – $ – $ 321,710 Transfer of property held for sale to income-producing property $ – $ – $ 19,362,643
Supplemental disclosure of noncash financing activities:Issuance of common stock under Stock Award Plan $ 41,700 $ 24,300 $ 51,090
Supplemental schedule of cash flow information:Cash paid during the year for interest $ 2,457,694 $ 2,967,042 $ 4,092,065 Cash (refunded) paid during the year for income taxes, net $ (186,094) $ (351,871) $ 202,716
See accompanying notes to consolidated financial statements.

Notes to Consolidated Financial StatementsAPRIL 30, 2004, 2003, AND 2002
1 | ORGANIZATION AND BUSINESSAbrams Industries, Inc. and subsidiaries (the “Company”) waso r g a n i zed under De l a w a re law in 1960. In 1984, the Companychanged its state of incorporation from De l a w a re to Georgia. T h eCompany (i) provides energy engineering services and deve l o p s ,implements and supports maintenance and service re q u e s tsolutions for facilities; (ii) implements energy savings lightingp rograms and provides other energy services, including facilityrelated improvements that reduce energy and operating costs; and(iii) engages in real estate investment and development. T h eCompany also historically provided commercial constru c t i o ns e rvices as a general contractor. The Company’s wholly ow n e dsubsidiaries include Se rvidyne Systems, LLC, (the “Energy andFacilities Solutions Se g m e n t”); The Wheatstone Energy Gro u p,L LC (the “Energy Se rvices Se g m e n t”); Abrams Pro p e rties, In c .and subsidiaries, and AFC Real Estate, Inc. and its subsidiary (the“ Real Estate Se g m e n t”); and Abrams Construction, Inc. (the“ C o n s t ruction Se g m e n t” ) .
2 | SUMMARY OF SIGNIFICANT ACCOUNTING POLICIES(a) Principles of consolidation and basis of presentationThe consolidated financial statements include the accounts ofAbrams Industries, Inc., its wholly owned subsidiaries, and its80% investment in Abrams-Columbus Limited Pa rt n e r s h i p. Allsignificant intercompany balances and transactions have beeneliminated in consolidation.
(b) Use of estimatesThe preparation of financial statements in conformity withaccounting principles generally accepted in the United States ofAmerica re q u i res the Company to make estimates andassumptions that affect the re p o rted amounts of assets andliabilities, disclosure of contingent assets and liabilities at the dateof the financial statements, and the re p o rted amounts of re ve n u e sand expenses during the period. Actual results could differ fro mthose estimates.
(c) Revenue recognitionEnergy and facilities solutions re venues primarily consist ofs e rvices and product sales. Re venues are re c o g n i zed as services arere n d e red, and depending upon the product type and customera g reement, product sales are re c o g n i zed when products areshipped or delive re d .
Energy services and construction re venues are re p o rted on thep e rcentage-of-completion method, using costs incurred to date inrelation to estimated total costs of the contracts to measure thestage of completion. Original contract prices are adjusted forchange orders in the amounts that are reasonably estimated basedon the Company’s historical experience. The cumulative effects ofchanges in estimated total contract costs and re venues (changeo rders) are re c o rded in the period in which the facts requiring suchrevisions become known, and are accounted for using thep e rcentage-of-completion method. At the time it is determinedthat a contract is expected to result in a loss, the entire estimatedloss is re c o rd e d .
The Company leases space in its income-producing pro p e rties totenants, and re c o g n i zes minimum base rentals as re venue on astraight-line basis over the lease terms. Tenants may also be re q u i re dto pay additional rental amounts based on pro p e rty operatingexpenses. In addition, certain tenants are re q u i red to payi n c remental rental amounts, which are contingent on their storesales. These percentage rents are re c o g n i zed only if and when earned.
Revenue from the sale of real estate is recognized when all of thefollowing has occurred: (a) the property is transferred to thebuyer; (b) the buyer’s initial and continuing investment isadequate to demonstrate a commitment to pay for the property;and (c) the buyer has assumed all future ownership risks of theproperty. Costs of sales related to real estate are based on thespecific property sold. When a portion or unit of a developmentproperty is sold, a proportionate share of the total cost of thedevelopment is charged to cost of sales.
(d) Cash and cash equivalents and short - t e rminvestmentsCash and cash equivalents include money market funds andother financial instruments. The Company considers all highlyliquid financial instruments with original maturities of threemonths or less to be cash equivalents. The Company considersfinancial instruments with original maturities of three monthsto one year to be a short-term investment.
(e) Property held for saleProperty held for sale is expected to be sold in the near term andis carried at the lower of cost or fair value less costs to sell.
(f) Income-producing pro p e rties and pro p e rty andequipmentIn c o m e - p roducing pro p e rties are stated at cost, and aredepreciated for financial reporting purposes using the straight-line method over the estimated useful lives of the properties andrelated assets. Property and equipment are recorded at cost, andare depreciated for financial reporting purposes using thestraight-line method over the estimated useful lives of the assets.Significant additions, which extend asset lives, are capitalized.Normal maintenance and repair costs are expensed as incurred.Interest and other carrying costs related to real estate assetsunder construction are capitalized. Other costs of developmentand construction of real estate assets are also capitalized.Capitalization of interest and other carrying costs arediscontinued when a project is substantially completed or ifactive development ceases.
(g) Real estate held for future development or saleReal estate held for future development or sale is carried at thelower of cost or fair value less costs to sell.
(h) Deferred loan costsCosts incurred to obtain loans have been deferred and are beingamortized over the terms of the related loans.

(i) Impairment of long-lived assets and assets to bedisposed ofThe Company re v i ews its long-lived assets and cert a i nintangible assets for impairment whenever events or changes incircumstances indicate that the carrying amount of an asset maynot be recoverable. Recoverability of assets to be held and usedis measured by a comparison of the carrying amount of the assetto future net cash flows expected to be generated by the asset. Ifan asset is determined to be impaired, the impairment to berecognized is measured by the amount by which the carryingamount of the asset exceeds the asset’s fair value. Assets to bedisposed of are reported at the lower of their carrying amountor fair value less costs to sell.
(j) Income taxesIncome taxes are accounted for under the asset and liabilitymethod. De f e r red tax assets and liabilities are re c o g n i zed for thef u t u re tax consequences attributable to differences between thefinancial statement carrying amounts of existing assets andliabilities and their re s p e c t i ve tax bases. De f e r red tax assets andliabilities are measured using enacted tax rates expected to apply totaxable income in the years in which those temporary differe n c e sa re expected to be re c ove red or settled. The effect of a change intax rates on deferred tax assets and liabilities is re c o g n i zed inincome in the period that includes the enactment date.
(k) Fair value of financial instrumentsManagement believes that the carrying amounts of cash and cashe q u i valents, short-term investments, re c e i vables, other assets,accounts payable, accrued expenses, and the current portion ofdebt instruments are reasonable approximations of their fair va l u e ,because of the short-term nature of these instru m e n t s .
Management believes that the carrying amount of long-terminvestments in debt securities approximates fair value due tomanagement’s intent to hold the investments to maturity.
The fair value of the Company’s debt instruments is estimatedby discounting the future cash flows of each instrument at ratescurrently offered to the Company by the Company’s bankers forsimilar debt instruments of comparable maturities. Based onthis valuation methodology, the carrying amount and estimatedfair value of the debt instruments as of April 30, 2004, are$28,704,332 and $30,032,704, respectively.
(l) Intangible assetsIntangible assets primarily consist of a trademarks, computersoftware, customer relationships, proprietary customer softwaresolutions, lease costs, and deferred loan costs. The trademarksare unamortized intangible assets as they have indefinite lives.Howe ve r, the computer software, pro p r i e t a ry computersoftware solutions, lease costs, and deferred loan costs areamortized using the straight-line method over the followingestimated useful lives:
Computer software . . . . . . . . . . . . . . . . . . . . . . . . . . . . . .3 ye a r sPro p r i e t a ry customer software solutions . . . . . . . . . . . . . .5 ye a r sCustomer relationships . . . . . . . . . . . . . . . . . . . . . . . . . . .5 ye a r sLease costs . . . . . . . . . . . . . . . . . . . . . .Over the term of the leaseLoan costs . . . . . . . . . . . . . . . . . . . . . .Over the term of the loan
The Company tested goodwill and intangibles assets, related to itsEnergy and Facilities Solutions Segment, with indefinite useful live sas of April 30, 2004, for impairment, as re q u i red by SFAS 142,utilizing the expected present value of future cash flows. The analysisdid not result in an impairment for fiscal 2004. As of April 30, 2004,the Company does not believe any of its goodwill or long-lived assetsa re impaired. The Company will test goodwill and intangibles assetswith indefinite useful lives, related to its Energy Se rvices Se g m e n t ,that we re acquired in December 2003 at the earlier of one year fro mthe acquisition date or the occurrence of an event or circ u m s t a n c ethat would indicate impairment.
(m) Derivative instruments and hedging activitiesThe Company accounts for deriva t i ve and hedging activities ina c c o rdance with Statement of Financial Accounting St a n d a rd s( “ S FAS”) 133, Accounting for De r i va t i ve In s t ruments and He d g i n gAc t i v i t i e s, as amended. Under SFAS 133, deriva t i ve instruments arere c o g n i zed in the balance sheet at fair value, and changes in the fairvalue of such instruments are re c o g n i zed currently in earnings unlessspecific hedge accounting criteria are met. At April 30, 2004, and2003, the Company had no deriva t i ve instru m e n t s .
(n) Discontinued OperationsThe Company adopted SFAS 144, Accounting for the Im p a i rment orDisposal of Long- Li ved As s e t, effective May 1, 2002, which re q u i re samong other things, that the gains and losses from the disposition ofc e rtain income-producing real estate assets, and the related historicaloperating results, be reflected as discontinued operations in thestatements of operations for all periods presented. Although netearnings are not affected, the Company has reclassified re s u l t sp reviously included in continuing operations to discontinuedoperations for qualifying dispositions under SFAS 144.
(o) Stock CompensationIn December 2002, SFAS 148, Accounting for Stock-BasedCompensation – Transition and Disclosure, was issued. Thisstatement amends SFAS 123, Accounting for St o c k - Ba s e dCompensation, to provide alternative methods of transition foran entity that voluntarily changes to the fair value based methodof accounting for stock-based employee compensation. It alsoamends the disclosure provisions of that statement to requireprominent disclosure about the effects on reported net incomeof an entity’s accounting policy decisions with respect to stock-based employee compensation. The Company elected to adoptthis standard as of January 31, 2003, resulting in additionaldisclosures related to its stock-based compensation plan. Forpurposes of the pro forma disclosures required by SFAS 123, theCompany has computed the value of all stock and stock optionawards granted during fiscal 2004, 2003, and 2002, using theBlack-Scholes option pricing model.

If the Company had accounted for its stock-based compensation awards in accordance with SFAS 123, pro forma results would have beenas follows for the years ended April 30:
2004 2003 2002Net (loss) earnings, as reported $ (1,850,126) $ (1,073,524) $ 811,774 Deduct: Total stock-based compensation
expense as determined under fair valuebased method for all awards, net ofrelated tax effects (191,890) (165,411) (46,963)
Add: Forfeitures, net of related tax effects 124,997 2,064 94Pro forma net (loss) earnings $ (1,917,019) $ (1,236,871) $ 764,905
Net (loss) earnings per share:Basic and diluted - as reported $ (.62) $ (.37) $ .28 Basic and diluted - pro forma $ (.65) $ (.42) $ .26
A summary of the options activity for the fiscal years ended April 30, 2004, 2003, and 2002, is as follow s :
2004 2003 2002Weighted Weighted WeightedAverage Average AverageExercise Exercise Exercise
Shares Price Shares Price Shares PriceOutstanding at beginning of year 671,884 $ 4.97 150,250 $ 4.00 150,616 $ 4.00 Granted 206,000 5.10 609,000 5.10 - -Forfeited (179,294) 4.65 (87,366) 4.21 (366) 4.00 Exercised - - - - - -Outstanding at end of year 698,590 5.09 671,884 4.97 150,250 4.00
Exercisable at end of year 296,592 $ 5.08 74,759 $ 4.00 75,125 $ 4.00
The fair value for each option grant was estimated on the grant date using the Black-Scholes option-pricing model with the following we i g h t e da verage assumptions:
2004 2003 2002Expected life (years) 10 5 and 10 5Dividend yield 4.01% 3.68% 4.16%Expected stock price volatility 32% 33% 42%Risk-free interest rate 4.52% 3.22% and 4.65% 4.93%
Using these assumptions, the weighted average fair value per share of options granted is $0.92, $1.18, and $1.05, for 2004, 2003,and 2002, respectively.
3 | DISCONTINUED OPERATIONSThe Company is in the business of creating long-term value by periodically realizing gains through the sale of existing real estate assets,and then re d e p l oying its capital by re i n vesting the proceeds from such sales. Ef f e c t i ve May 1, 2002, the Company adopted St a t e m e n tof Financial Accounting St a n d a rds (“SFAS”) No. 144, Accounting for the Im p a i rment or Disposal of Long-Li ved As s e t s, which re q u i re s ,among other things, that the operating results of certain income-producing assets, sold subsequent to April 30, 2002, be included indiscontinued operations in the statements of operations for all periods presented. The Company classifies an asset as held for sale whenthe asset is under a binding sales contract with minimal contingencies, and the buyer is materially at risk if the buyer fails to completethe transaction. Howe ve r, each potential transaction is evaluated based on its separate facts and circumstances. Pursuant to this standard ,as of April 30, 2004, the Company had no current assets that we re classified as held for disposition or sale.

On Ma rch 12, 2004, the Company sold its shopping center located in No rth Fo rt Myers, Florida, and re c o g n i zed a pretax gain of approx i m a t e l y$4.0 million. On June 28, 2002, the Company sold its shopping center located in En g l ewood, Florida, and re c o g n i zed a pretax gain ofa p p roximately $1.0 million. In June 1999, the Company re c e i ved notice from the Georgia State Pro p e rties Commission that the Georgia Wo r l dC o n g ress Center Authority had made the determination to acquire the Company’s former manufacturing segment’s wood manufacturing facilityin Atlanta, Georgia. In October 1999, a Special Master appointed by the court awarded the Company $4.5 million for the pro p e rt y, which waspaid to the manufacturing segment. Both the State and the Company appealed the award amount. During the year ended April 30, 2002, theCompany reached a settlement with the State and re c o g n i zed an after-tax gain of $1,720,749 on the transaction.
As a result of these transactions, the Company’s financial statements have been pre p a red with these pro p e rt i e s’ results of operations, cashf l ows, and the gains from the sales shown as discontinued operations. All historical statements have been restated in accordance with SFA S144. Su m m a r i zed financial information for discontinued operations for the fiscal years ended April 30 is as follow s :
2004 2003 2002Rental income revenues $2,565,036 $3,146,080 $4,836,547
Rental property operating expenses 932,055 1,031,688 1,465,522 Depreciation 571,581 797,605 833,872 Interest Expense 424,610 666,232 1,958,991
Total rental property expenses 1,928,246 2,495,525 4,258,385
Earnings from discontinued operations 636,790 650,555 578,162 Income tax expense (241,876) (249,413) (218,452)Earnings from discontinued operations, net of tax 394,914 401,142 359,710
Gain on disposition of discontinued operations 3,972,230 990,215 2,776,749 Income tax expense (1,510,307) (372,228) (1,056,000)Gain on sale of assets of discontinued operations, net of tax 2,461,923 617,987 1,720,749
Earnings from discontinued operations, net of tax $2,856,837 $1,019,129 $2,080,459
Balances atAssets of discontinued operations: April 30, 2004 April 30, 2003Receivables $ 42,577 $ 57,020 Other 14,370 45,126
$ 56,947 $ 102,146
Balances atLiabilities of discontinued operations: Ap ril 30, 2 0 0 4 April 30, 2003Income taxes $ – $ 476,635 Accrued expenses 8,328 86,949
$ 8,328 $ 563,584
4 | CONTRACTS IN PROGRESSAssets and liabilities related to contracts in pro g ress, including contracts re c e i vable, are included in current assets and current liabilities asthey will be liquidated in the normal course of contract completion, which is expected to occur within one ye a r. Amounts billed and costsand earnings re c o g n i zed on contracts in pro g ress at April 30 we re :
Costs and earnings in excess of billings: 2004 2003Accumulated costs and earnings $ 2,702,357 $ 16,324,508 Amounts billed 1,841,417 15,821,395
$ 860,940 $ 503,113
Billings in excess of costs and earnings:Amounts billed $ 3,495,268 $ 17,349,809 Accumulated costs and earnings 3,286,786 16,667,135
$ 208,482 $ 682,674

5 | INCOME-PRODUCING PROPERTIESIn c o m e - p roducing pro p e rties and their estimated useful lives at April 30 we re as follow s :
Estimateduseful lives 2004 2003
Land N/A $ 9,109,422 $ 13,777,053 Buildings and improvements 7-39 years 31,937,313 46,294,096
41,046,735 60,071,149
Less - accumulated depreciation and amortization 11,418,558 16,892,112$ 29,628,177 $ 43,179,037
De p reciation expense from continuing operations for the years ended April 30, 2004, 2003, and 2002, was $936,138, $952,884, and$983,211, re s p e c t i ve l y.
6 | PROPERTY AND EQUIPMENTThe major components of property and equipment and their estimated useful lives at April 30 were as follows:
Estimateduseful lives 2004 2003
Building and improvements 3-39 years $ 254,796 $ 434,024 Equipment 3-10 years 974,173 845,553Vehicles 399,442 672,534
1,628,411 1,952,111
Less - accumulated depreciation 1,022,444 1,480,298$ 605,967 $ 471,813
De p reciation expense from continuing operations for the years ended April 30, 2004, 2003, and 2002, was $218,773, $269,026, and$366,739, re s p e c t i ve l y.
7 | MORTGAGE NOTES PAYABLE AND LEASESAs of April 30, 2004, the Company owned five shopping centers, two office buildings, an office park, and a former manufacturing facility.Of the owned pro p e rties, four of the five shopping centers and the office pro p e rties we re pledged as collateral on related mortgage notespayable. Exc u l p a t o ry provisions of the mortgage notes limit the Company’s liability for repayment to its interests in the re s p e c t i ve mort g a g e dp ro p e rties. As of April 30, 2004, Kmart was a tenant in two of the five Company-owned shopping centers. The owned shopping centersa re leased to tenants for terms expiring on various dates from fiscal years 2005 to 2021, while leases on the office pro p e rties expire fro mfiscal years 2005 to 2012.
The Company also leases six shopping centers under leaseback arrangements expiring on various dates between fiscal years 2005 to 2015.The Company’s leases contain exc u l p a t o ry provisions that limit the Company’s liability for payment to its interests in the re s p e c t i ve leases.All of the leaseback centers are subleased to the Kmart Corporation. The subleases on the leaseback shopping centers either are the same as,or may be extended to correspond to, the leaseback periods. All leases are operating leases. The owned shopping center leases typically re q u i rethat the tenants make fixed rental payments over a five to twe n t y - f i ve year period, and may provide for re n ewal options and for contingentrentals, if the tenant’s sales volume in the leased space exceeds a predetermined amount. In most cases, the shopping center leases prov i d ethat the tenant bear its share of the cost of insurance, repairs, maintenance, and taxe s .
Base rental re venues re c o g n i zed from owned shopping centers and office pro p e rties in 2004, 2003, and 2002, we re approx i m a t e l y$5,209,000, $5,049,000, and $5,044,000, re s p e c t i ve l y. Base rental re venues re c o g n i zed from leaseback shopping centers in 2004, 2003, and2002, we re approximately $1,904,000, $2,031,000, and $2,497,000, re s p e c t i ve l y. Contingent rental re venues on all shopping centers in2004, 2003, and 2002, we re approximately $138,000, $181,000, and $174,000, re s p e c t i ve l y.
Ap p roximate future minimum annual rental receipts from all rental pro p e rties are as follow s :
Year ending April 30, Owned Leaseback2005 $ 5,001,000 $ 1,651,000 2006 4,608,000 1,476,000 2007 3,871,000 888,000 2008 3,448,000 618,000 2009 2,243,000 303,000 Thereafter 8,611,000 1,543,000
$ 27,782,000 $ 6,479,000

The expected future minimum principal and interest payments on mortgage notes payable on the owned rental properties, and theapproximate future minimum rentals expected to be paid on the leaseback centers, are as follows:
Owned Rental Properties LeasebackMortgage Payments Centers Rental
Year ending April 30, Principal Interest Payments2005 $ 1,202,876 $ 1,625,388 $ 1,332,000 2006 7,280,267 1,500,664 1,146,000 2007 1,019,948 1,419,158 515,000 2008 6,672,095 1,197,903 287,000 2009 596,729 843,873 143,000 Thereafter 9,940,829 4,415,986 724,000
$ 26,712,744 $ 11,002,972 $ 4,147,000
The mortgage notes payable are due at various dates between Ja n u a ry 1, 2008, and Ja n u a ry 1, 2026, and bear interest at rates ranging fro m7.25% to 9.25%. At April 30, 2004, the weighted average rate for all outstanding debt was 7.7%, including other long-term debt and cre d i tfacilities (see Note 8). In conjunction with the origination of a mortgage on an income-producing pro p e rt y, an Additional In t e re s tA g reement was executed, which prior to the loan being re s t ru c t u red on July 8, 2004, entitled the lender to participate in fifty percent of theq u a rterly net cash flow and fifty percent of the appreciation in the pro p e rty upon sale or refinance, as defined in the Agreement. T h ea p p reciation participation liability, which is included in other liabilities, was $3,048,264 and $2,721,448, at April 30, 2004, and 2003,re s p e c t i ve l y. The related unamort i zed loan discount was $1,699,731 and $1,732,647, at April 30, 2004, and 2003, re s p e c t i ve l y. T h eprincipal amount of approximately $6.3 million associated with this loan is included in the year 2006 in the table above (See No t e 1 7re g a rding the loan re s t ru c t u r i n g ) .
8 | OTHER LONG-TERM DEBT AND CREDIT FACILITIESOther long-term debt at April 30 was as follows:
2004 2003
Real estate construction loan bearing interest at the prime rate plus .375%; paid offin March 2004 $ – $7,249,849
Amendment to the construction loan shown above, permitting borrowings of up to $4,942,419; bearing interest at the prime rate plus .375%; paid off in March 2004 – 4,101,504
Note payable bearing interest at the prime rate plus 1.5% (5.5% at April 30, 2004);interest only payments due monthly; matures December 18, 2011; secured by all general assets of The Wheatstone Energy Group, LLC 1,000,000 –
Note payable bearing interest at 6.0%; interest due annually on January 31, and principal payments due in installments as defined in the agreement commencing on January 31, 2006; matures on January 31, 2008 516,000 –
Note payable bearing interest at 6.8%; interest due annually on December 31,beginning December 31, 2004, and principal payments due annually in installments as defined in the agreement commencing on December 19, 2008;matures on December 19, 2011 295,000 –
Note payable with an imputed interest rate of 6.0%; principal payments due annually in installments as defined in the agreement commencing on December 26, 2004; matures on December 26, 2006 79,000 –
Captial lease obligation; monthly payments of $3,578 ending in July 2005 53,495 –
Various notes payable with interest rates ranging from 8.3% to 10.75%;maturity dates ranging from September 2005 to November 2005 48,083 –
Total other long-term debt 1,991,578 11,351,353
Less current maturities 89,793 1,044,446
Total other long-term debt, less current maturities $ 1,901,785 $10,306,907

The future minimum principal payments due on other long-term debt are as follows:
Year Ending April 30,2005 $ 89,793 2006 186,785 2007 162,000 2008 278,000 2009 40,000 Thereafter 1,235,000
Total $1,991,578
At April 30, 2004, the Company had commitments from a bank for unsecured lines of credit totaling $7.5 million, of which atotal of $150,000 is restricted as it secures a letter of credit described below. These lines of credit bear interest at the prime rate orLIBOR plus 2%, and have a commitment fee of 0.375% on any unused portion. The lines of credit expire on October 30, 2004.At April 30, 2004, no amounts were outstanding under these lines of credit.
In conjunction with terms of a real estate loan, the Company is required to provide for potential future tenant improvement costsand lease commissions at that property through additional collateral, in the form of a letter of credit in the amount of $150,000for each of the first three loan years, $300,000 during the fourth, fifth, and sixth loan years, and $450,000 during the seventh,eighth, ninth and tenth loan years. The $150,000 letter of credit is secured by one of the bank lines of credit, as discussed above.
9 | INCOME TAXES
The benefit for income taxes from continuing operations consists of the following:
Current Deferred TotalYear ended April 30, 2004Federal $ – $ (1,996,583) $(1,996,583)State and local – (374,359) ( 3 7 4 , 3 5 9 )
$ – $ (2,370,942) $ ( 2 , 3 7 0 , 9 4 2 )Year ended April 30, 2003Federal $ (171,907) $ (965,506) $(1,137,413)State and local – (173,587) (173,587)
$ (171,907) $ (1,139,093) $(1,311,000)Year ended April 30, 2002Federal $ (700,847) $ (65,462) $ (766,309) State and local (65,835) (2,551) (68,386)
$ (766,682) $ (68,013) $ (834,695)
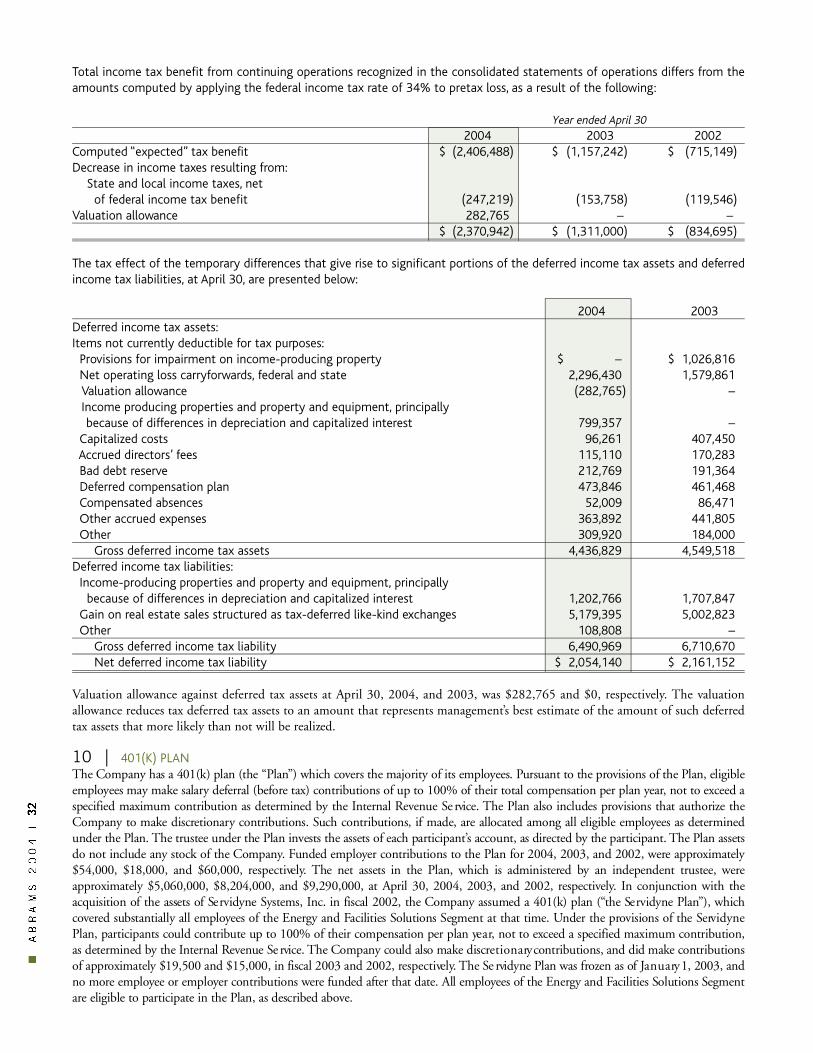
Total income tax benefit from continuing operations recognized in the consolidated statements of operations differs from theamounts computed by applying the federal income tax rate of 34% to pretax loss, as a result of the following:
Year ended April 302004 2003 2002
Computed “expected” tax benefit $ (2,406,488) $ (1,157,242) $ (715,149)Decrease in income taxes resulting from:
State and local income taxes, netof federal income tax benefit (247,219) (153,758) (119,546)
Valuation allowance 282,765 – –$ (2,370,942) $ (1,311,000) $ (834,695)
The tax effect of the temporary differences that give rise to significant portions of the deferred income tax assets and deferredincome tax liabilities, at April 30, are presented below:
2004 2003Deferred income tax assets:Items not currently deductible for tax purposes:
Provisions for impairment on income-producing property $ – $ 1,026,816Net operating loss carryforwards, federal and state 2,296,430 1,579,861Valuation allowance (282,765) –Income producing properties and property and equipment, principallybecause of differences in depreciation and capitalized interest 799,357 –
Capitalized costs 96,261 407,450Accrued directors’ fees 115,110 170,283Bad debt reserve 212,769 191,364Deferred compensation plan 473,846 461,468Compensated absences 52,009 86,471Other accrued expenses 363,892 441,805Other 309,920 184,000
Gross deferred income tax assets 4,436,829 4,549,518Deferred income tax liabilities:
Income-producing properties and property and equipment, principallybecause of differences in depreciation and capitalized interest 1,202,766 1,707,847
Gain on real estate sales structured as tax-deferred like-kind exchanges 5,179,395 5,002,823Other 108,808 –
Gross deferred income tax liability 6,490,969 6,710,670Net deferred income tax liability $ 2,054,140 $ 2,161,152
Valuation allowance against deferred tax assets at April 30, 2004, and 2003, was $282,765 and $0, respectively. The valuationallowance reduces tax deferred tax assets to an amount that represents management’s best estimate of the amount of such deferredtax assets that more likely than not will be realized.
10 | 401(K) PLANThe Company has a 401(k) plan (the “Pl a n”) which covers the majority of its employees. Pursuant to the provisions of the Plan, eligiblee m p l oyees may make salary deferral (before tax) contributions of up to 100% of their total compensation per plan ye a r, not to exceed aspecified maximum contribution as determined by the Internal Re venue Se rvice. The Plan also includes provisions that authorize theCompany to make discre t i o n a ry contributions. Such contributions, if made, are allocated among all eligible employees as determinedunder the Plan. The trustee under the Plan invests the assets of each part i c i p a n t’s account, as directed by the participant. The Plan assetsdo not include any stock of the Company. Funded employer contributions to the Plan for 2004, 2003, and 2002, we re approx i m a t e l y$54,000, $18,000, and $60,000, re s p e c t i ve l y. The net assets in the Plan, which is administered by an independent trustee, we rea p p roximately $5,060,000, $8,204,000, and $9,290,000, at April 30, 2004, 2003, and 2002, re s p e c t i ve l y. In conjunction with theacquisition of the assets of Se rvidyne Systems, Inc. in fiscal 2002, the Company assumed a 401(k) plan (“the Se rvidyne Pl a n”), whichc ove red substantially all employees of the Energy and Facilities Solutions Segment at that time. Under the provisions of the Se rv i d y n ePlan, participants could contribute up to 100% of their compensation per plan ye a r, not to exceed a specified maximum contribution,as determined by the Internal Re venue Se rvice. The Company could also make discre t i o n a ry contributions, and did make contributionsof approximately $19,500 and $15,000, in fiscal 2003 and 2002, re s p e c t i ve l y. The Se rvidyne Plan was fro zen as of Ja n u a ry 1, 2003, andno more employee or employer contributions we re funded after that date. All employees of the Energy and Facilities Solutions Se g m e n ta re eligible to participate in the Plan, as described above .

11 | SHAREHOLDERS’ EQUITYIn August 2000, the shareholders approved the 2000 Stock Aw a rd Plan (the “Aw a rd Pl a n”). The Aw a rd Plan permits the grant of incentiveand non-qualified stock options, non-restricted, restricted and performance stock awards, and stock appreciation rights to dire c t o r s ,e m p l oyees, independent contractors, advisors, or consultants to the Company, as determined by the Compensation Committee of the Boardof Di rectors. The term and vesting re q u i rements for each award are determined by the Compensation Committee, but in no event may theterm exceed ten years. In c e n t i ve Stock Options under the Aw a rd Plan provide for the purchase of the Company’s common stock at not lessthan fair market value on the date the option is issued. The total number of shares originally available for grant under the Aw a rd Plan was1,000,000 shares. T h rough April 30, 2004, the Company has made the following grants of restricted share s :
RestrictedShares
Date Granted General Vesting Period for Restricted SharesJanuary 19, 2001 28,100 One installment, on January 19, 2002May 18, 2001 7,600 One installment, on May 18, 2002November 28, 2001 5,000 One installment, on November 28, 2002July 29, 2002 1,100 One installment, on July 29, 2003March 11, 2003 4,700 One installment, on March 11, 2004January 6, 2004 10,000 One installment, on January 6, 2005
During fiscal years 2004, 2003, and 2002, forf e i t u res of restricted shares, which we re not vested, totaled 1,400 shares, 400 shares, and 2,300s h a res, re s p e c t i ve l y.
The Company re c o g n i zes compensation expense ratably over the vesting period. Stock award compensation expense for the years endedApril 30, 2004, 2003, and 2002, was $31,443, $20,446, and $113,440, re s p e c t i ve l y. As of April 30, 2004, after forf e i t u res during the ye a r,t h e re we re 9,200 shares outstanding under restricted stock award grants that we re not yet vested.
In fiscal 2000, the Company’s Board of Di rectors authorized the re p u rchase of up to 200,000 shares of Common Stock during the twe l ve -month period beginning Fe b ru a ry 25, 2000, and ending Fe b ru a ry 24, 2001. In Fe b ru a ry 2002, Fe b ru a ry 2003, and most recently Ma rc h2004, the Company’s Board re a u t h o r i zed additional re p u rchases of up to 200,000 shares of Common Stock in each of the subsequentt we l ve-month periods, the most recent to end on Ma rch 3, 2005. During fiscal 2002 and 2003, the Company re p u rchased 44,524 share sand 128 shares, re s p e c t i ve l y, of Common Stock. T h e re we re no shares re p u rchased during fiscal 2004.
12 | NET EARNINGS (LOSS) PER SHAREEarnings per share are calculated in accordance with SFAS 128, Ea rnings Per Sh a re, which re q u i res dual presentation of basic and dilutedearnings per share on the face of the income statement for all entities with complex capital stru c t u res. Basic and diluted we i g h t e d - a ve r a g es h a re differences result solely from dilutive common stock options. Basic earnings per share are computed by dividing net earnings by theweighted average shares outstanding during the re p o rting period. Di l u t i ve potential common shares are calculated in accordance with thet re a s u ry stock method, which assumes that the proceeds from the exe rcise of all options are used to re p u rchase common shares at the curre n tm a rket value. The number of shares remaining after the exe rcise proceeds are exhausted re p resents the potentially dilutive effect of theoptions. The dilutive number of common shares for the fourth quarter 2004 and 2003, we re 3,077,686 and 2,912,659, re s p e c t i vely; andfor the fiscal year ended 2004 and 2003, we re 2,971,172 and 2,919,203, re s p e c t i ve l y. Since the Company had losses from continuingoperations for all periods presented, all stock equivalents we re antidilutive during these periods, and are there f o re excluded from we i g h t e da verage shares outstanding.
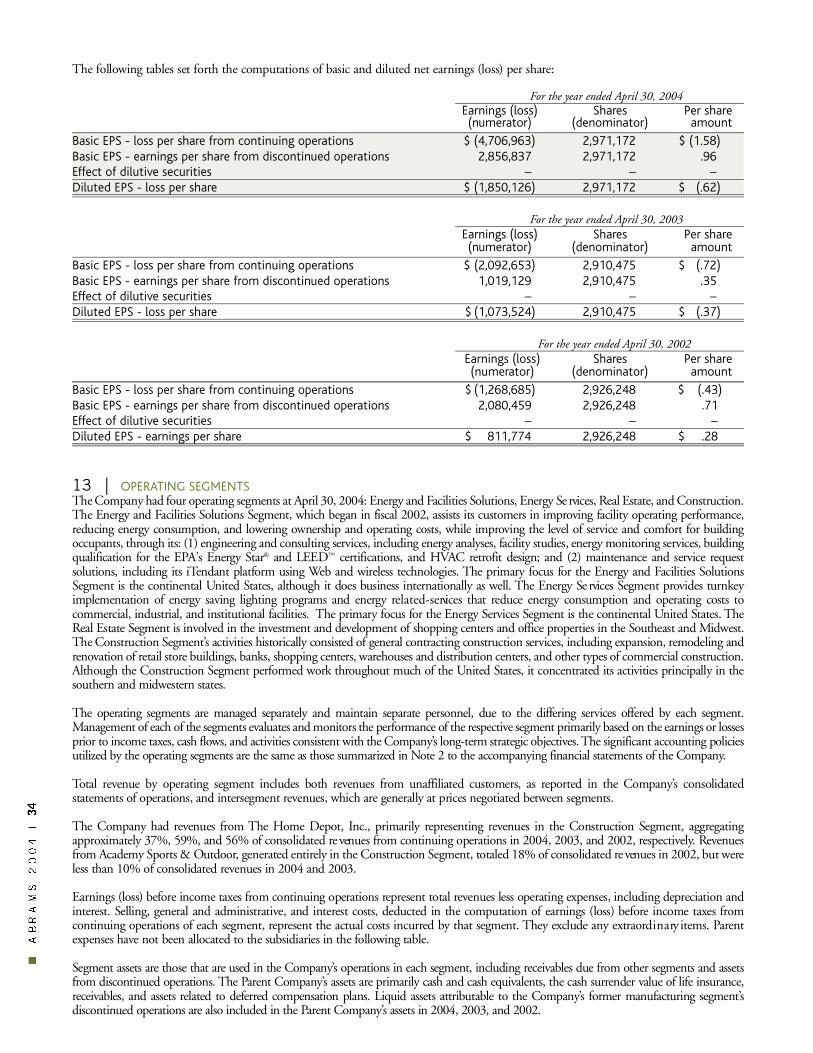
The following tables set forth the computations of basic and diluted net earnings (loss) per share :
For the year ended April 30, 2004Earnings (loss) Shares Per share(numerator) (denominator) amount
Basic EPS - loss per share from continuing operations $ (4,706,963) 2,971,172 $ (1.58)Basic EPS - earnings per share from discontinued operations 2,856,837 2,971,172 .96Effect of dilutive securities – – –Diluted EPS - loss per share $ (1,850,126) 2,971,172 $ (.62)
For the year ended April 30, 2003Earnings (loss) Shares Per share(numerator) (denominator) amount
Basic EPS - loss per share from continuing operations $ (2,092,653) 2,910,475 $ (.72)Basic EPS - earnings per share from discontinued operations 1,019,129 2,910,475 .35 Effect of dilutive securities – – –Diluted EPS - loss per share $ (1,073,524) 2,910,475 $ (.37)
For the year ended April 30, 2002Earnings (loss) Shares Per share(numerator) (denominator) amount
Basic EPS - loss per share from continuing operations $ (1,268,685) 2,926,248 $ (.43) Basic EPS - earnings per share from discontinued operations 2,080,459 2,926,248 .71 Effect of dilutive securities – – –Diluted EPS - earnings per share $ 811,774 2,926,248 $ .28
13 | OPERATING SEGMENTSThe Company had four operating segments at April 30, 2004: Energy and Facilities Solutions, Energy Se rvices, Real Estate, and Constru c t i o n .The Energy and Facilities Solutions Segment, which began in fiscal 2002, assists its customers in improving facility operating perf o r m a n c e ,reducing energy consumption, and lowering ownership and operating costs, while improving the level of service and comfort for buildingoccupants, through its: (1) engineering and consulting services, including energy analyses, facility studies, energy monitoring services, buildingqualification for the EPA's Energy St a r® and LEED™ c e rtifications, and HVAC re t rofit design; and (2) maintenance and service re q u e s tsolutions, including its iTendant platform using Web and wireless technologies. The primary focus for the Energy and Facilities So l u t i o n sSegment is the continental United States, although it does business internationally as well. The Energy Se rvices Segment provides turnkeyimplementation of energy saving lighting programs and energy re l a t e d - s e rvices that reduce energy consumption and operating costs toc o m m e rcial, industrial, and institutional facilities. The primary focus for the Energy Se rvices Segment is the continental United States. T h eReal Estate Segment is invo l ved in the investment and development of shopping centers and office pro p e rties in the Southeast and Mi d we s t .The Construction Se g m e n t’s activities historically consisted of general contracting construction services, including expansion, remodeling andre n ovation of retail store buildings, banks, shopping centers, warehouses and distribution centers, and other types of commercial constru c t i o n .Although the Construction Segment performed work throughout much of the United States, it concentrated its activities principally in thesouthern and midwestern states.
The operating segments are managed separately and maintain separate personnel, due to the differing services offered by each segment.Management of each of the segments evaluates and monitors the performance of the re s p e c t i ve segment primarily based on the earnings or lossesprior to income taxes, cash flows, and activities consistent with the Company’s long-term strategic objectives. The significant accounting policiesu t i l i zed by the operating segments are the same as those summarized in Note 2 to the accompanying financial statements of the Company.
Total re venue by operating segment includes both re venues from unaffiliated customers, as re p o rted in the Company’s consolidatedstatements of operations, and intersegment re venues, which are generally at prices negotiated between segments.
The Company had re venues from The Home Depot, Inc., primarily re p resenting re venues in the Construction Segment, aggre g a t i n ga p p roximately 37%, 59%, and 56% of consolidated re venues from continuing operations in 2004, 2003, and 2002, re s p e c t i ve l y. Re ve n u e sf rom Academy Sp o rts & Ou t d o o r, generated entirely in the Construction Segment, totaled 18% of consolidated re venues in 2002, but we reless than 10% of consolidated re venues in 2004 and 2003.
Earnings (loss) before income taxes from continuing operations re p resent total re venues less operating expenses, including depreciation andi n t e rest. Selling, general and administrative, and interest costs, deducted in the computation of earnings (loss) before income taxes fro mcontinuing operations of each segment, re p resent the actual costs incurred by that segment. They exclude any extraord i n a ry items. Pa re n texpenses have not been allocated to the subsidiaries in the following table.
Segment assets are those that are used in the Company’s operations in each segment, including re c e i vables due from other segments and assetsf rom discontinued operations. The Pa rent Company’s assets are primarily cash and cash equivalents, the cash surrender value of life insurance,re c e i vables, and assets related to deferred compensation plans. Liquid assets attributable to the Company’s former manufacturing segment’sdiscontinued operations are also included in the Pa rent Company’s assets in 2004, 2003, and 2002.

13 | OPERATING SEGMENTS continued
Energy Energyand Facilities Services Real
Solutions (Note 14) Estate Construction Parent Eliminations Consolidated
2004
Revenues from unaffiliated
customers $ 2,962,308 $ 2,602,025 $ 7,882,431 $ 25,500,352 $ – $ – $ 38,947,116
Interest and other income - 13,445 92,046 1,728 27,785 – 135,004
Intersegment revenue 13,600 32,044 470,008 889,188 3,076 (1,407,916) –
Total revenues from
continuing operations $ 2,975,908 $ 2,647,514 $ 8,444,485 $ 26,391,268 $ 30,861 $ (1,407,916) $ 39,082,120
Operating earnings (loss) from
continuing operations $ (1,092,673) $ (64,621) $ 521,279 $ (3,536,780) $ (2,725,528) $ (179,582) $ (7,077,905)
Segment assets $ 4,842,959 $ 5,746,891 $ 45,935,012 $ 7,674,876 $ 19,726,643 $(22,050,362) $ 61,876,019
Goodwill $ 1,963,248 $ 3,034,994 $ – $ – $ – $ – $ 4,998,242
Interest expense $ 1,491 $ 44,750 $ 2,445,570 $ 2,319 $ 18,558 $ – $ 2,512,688
Depreciation and amortization $ 229,772 $ 45,374 $ 1,227,866 $ 132,719 $ 64,514 $ (14,436) $ 1,685,809
Capital expenditures $ 18,233 $ 9,282 $ 1,075,371 $ 13,921 $ 110,107 $ – $ 1,226,914
Energy Energyand Facilities Services Real
Solutions (Note 14) Estate Construction Parent Eliminations Consolidated
2003
Revenues from unaffiliated
customers $ 2,900,191 $ – $ 8,735,091 $ 59,527,859 $ – $ – $ 71,163,141
Interest and other income – – 89,360 9,903 22,342 (6,306) 115,299
Intersegment revenue – – 449,549 – – (449,549) –
Total revenues from
continuing operations $ 2,900,191 $ – $ 9,274,000 $ 59,537,762 $ 22,342 $ (455,855) $ 71,278,440
Operating earnings (loss) from
continuing operations $ (476,283) $ – $ 652,159 $ (432,894) $ (3,162,250) $ 15,615 $ (3,403,653)
Segment assets $ 3,624,372 $ – $ 54,413,919 $ 15,073,267 $ 13,043,446 $(12,357,906) $ 73,797,098
Goowill $ 1,741,831 $ – $ – $ – $ – $ – $ 1,741,831
Interest expense $ 7,912 $ – $ 2,357,412 $ 942 $ 11,287 $ – $ 2,377,553
Depreciation and amortization $ 222,155 $ – $ 1,133,322 $ 246,783 $ 50,498 $ (14,436) $ 1,638,322
Capital expenditures $ 31,810 $ – $ 264,986 $ 67,050 $ 18,404 $ – $ 382,250
Energy Energyand Facilities Services Real
Solutions (Note 14) Estate Construction Parent Eliminations Consolidated
2002
Revenues from unaffiliated
customers $ 2,994,879 $ – $ 8,829,764 $100,687,872 $ – $ – $ 112,512,515
Interest and other income – – 143,138 60,537 55,188 (10,238) 248,625
Intersegment revenue – – 461,818 – – (461,818) –
Total revenues from
continuing operations $ 2,994,879 $ – $ 9,434,720 $100,748,409 $ 55,188 $ (472,056) $ 112,761,140
Operating earnings (loss) from
continuing operations $ (135,945) $ – $ 531,842 $ 243,344 $ (2,785,300) $ 42,679 $ (2,103,380)
Segment assets $ 3,452,921 $ – $ 67,143,652 $ 18,011,119 $ 12,843,051 $ (9,666,373) $ 91,784,370
Goodwill $ 1,741,831 $ – $ – $ – $ – $ – $ 1,741,831
Interest expense $ 10,431 $ – $ 2,414,127 $ 5,255 $ 7,925 $ – $ 2,437,738
Depreciation and amortization $ 201,399 $ – $ 1,618,143 $ 348,137 $ 127,041 $ (14,436) $ 2,280,284
Capital expenditures $ 39,154 $ – $ 624,801 $ 14,655 $ 13,769 $ – $ 692,379

14 | ACQUISITIONS
Acquisition of The Wheatstone Energy Group, Inc.On December 19, 2003, The Wheatstone Energy Gro u p, LLC, ani n d i rect wholly-owned subsidiary of the Company, acquire dsubstantially all of the assets and assumed certain liabilities of T h eWheatstone Energy Gro u p, Inc. (“TWEG”) for a purchase price ofa p p roximately $4.8 million. TWEG was engaged in the business ofp roviding energy efficient lighting system installation services andother related energy conservation services, and the Companyintends to continue to offer these services. The considerationconsisted of 23,842 newly-issued shares of the Company’s commonstock, with a fair value of $89,645, the payment of approx i m a t e l y$1.3 million to certain trade creditors of TWEG from available cash,and the assumption of approximately $2.9 million of TW E G ’sliabilities. Also in connection with the transaction, the Companyissued 110,000 newly-issued shares of the Company’s commonstock, with a fair value of $424,380, and a warrant to purchase anadditional 40,000 shares of the Company’s common stock at ane xe rcise price of $5.10 per share, with a fair value of approx i m a t e l y$36,800 determined using the Black-Scholes option pricing model,to a lender of TWEG. The amount and type of consideration wasdetermined by negotiation among the parties.
The Company’s subsidiary acquired substantially all of the assets ofTWEG, including cash, accounts re c e i vable, inve n t o ry, personalp ro p e rty and equipment, pro p r i e t a ry information, intellectualp ro p e rt y, and TW E G ’s right, title and interest to assigned contracts.Only specified liabilities of TWEG we re assumed, including exe c u t o ryobligations under disclosed assigned contracts, current balance sheetliabilities, and certain debt for borrowed funds from two lenders ofTW E G .
The following table summarizes the estimated fair values of theassets acquired and liabilities assumed at the date of acquisition.
OperationsAcquired from Estimated
TWEG LifeCurrent assets $ 933,982 Property, furniture andequipment, net 336,117 Various (3-5)
Customer relationships 218,000 5 yearsTrademark 280,000 IndefiniteNon-competes 3,000 2 yearsWebsite/Software 42,438 3 yearsGoodwill 3,034,994 IndefiniteTotal assets acquired 4,848,531
Current liabilities 1,032,404 Long term liabilities 1,890,000
2,922,404
Net assets acquired $1,926,127
The trademarks and goodwill are not subject to amortizationand the amount assigned to goodwill is not deductible for taxpurposes. The goodwill amount has been assigned to the Energy
Services Segment. The acquired assets, the assumed liabilities,and the results of operations have been included in theCompany’s financial statements since the date of acquisition.
Acquisition of Prestley Mill Forest Medical Office BuildingOn April 5, 2004, Prestley Mill, LLC, a wholly-ow n e dsubsidiary of the Company acquired a professional medicaloffice building located in Douglasville, Georgia. The Companyused available cash and assumed a mortgage note payable topurchase the asset for approximately $4.4 million, including thecosts associated with completing the transaction.
The following table summarizes the estimated fair values of theassets and liabilities acquired at the date of acquisition:
OperationsAcquired from EstimatedPrestley Mill Life
Land $ 609,000 Building 2,569,575 39 yearsTenant improvements 725,592 Over life of
lease termLease costs 470,833 Over life of
lease termTotal assets acquired 4,375,000
Mortgage note payable 2,941,469
Net assets acquired $ 1,433,531
The assets, mortgage note payable, and results of operations ofPrestley Mill have been included in the Company’s financialstatements since the date of acquisition.
Acquisition of iTendant, Inc. On April 16, 2004, Se rvidyne Systems, LLC, a wholly-ow n e ds u b s i d i a ry of the Company, acquired substantially all of the assetsand assumed certain liabilities of iTendant, Inc. (“iTEN”) for ap u rchase price of approximately $1.3 million. iTEN was engagedin the provision of pro p e rty services and maintenance solutionsthat automate service requests and maintenance managementusing the internet and wireless hand held devices, and theCompany intends to continue this business. The considerationconsisted of 123,547 newly-issued shares of the Company’scommon stock, with a fair value of $252,075, the payment of$500,000 cash, and the assumption of approximately $170,000 ofi T E N ’s liabilities. Additional contingent consideration is prov i d e dfor based on future operating goals and perf o r m a n c e .Consideration was determined by negotiation among the part i e s .
The Company’s subsidiary acquired substantially all of the assetsof iTEN, including cash, accounts re c e i vable, personal pro p e rt yand equipment, pro p r i e t a ry information, intellectual pro p e rt y,s o f t w a re, and iTEN’s right, title, and interest to assigned contracts.Only specified liabilities of iTEN we re assumed, includinge xe c u t o ry obligations under disclosed assigned contracts andc u r rent balance sheet liabilities.

The following table summarizes the estimated fair values of theassets acquired and liabilities assumed at the date of acquisition:
OperationsAcquired from Estimated
iTEN LifeCurrent assets $ 64,599 Property, furniture and Various equipment, net 22,560 (2-5 years)Software 854,879 5 yearsNon-competes 7,247 2 yearsAssembled workforce 217,622 IndefiniteTrademark 106,399 IndefiniteTotal assets acquired 1,273,306
Current liabilities 174,136
Net assets acquired $ 1,099,170
The acquired assets, assumed liabilities and results of operationshave been included in the Company’s financial statements sincethe date of acquisition as part of the Energy Services Segment.
ProformasThe following table summarizes the results of the Company ona pro forma basis, as if the acquisition of TWEG, Prestley Mill,and iTEN had occurred at the beginning of each period. Theseresults do not purport to represent what the results of operationsfor the Company actually would have been or to be indicativeof the future results of operations of the Company (inthousands, except per share amounts).
( U n a u d i t e d)For the year ended Ap ril 30,
2 0 0 4 2 0 0 3Reve nu e s $ 4 3 , 0 8 7 $ 7 9 , 1 6 1Net loss ( 3 , 2 5 5 ) ( 3 , 5 4 4 )Net loss per share -
basic and diluted $ (1.10) $ (1.22)
15 | GOODWILL AND OTHER INTANGIBLE ASSETSThe gross carrying amounts and accumulated amortization forall of the Company’s intangible assets are as follows:
April 30, 2004Gross Carrying Accumulated
Amortized intangible assets Amount AmortizationProprietary customer
software solutions $ 1,284,586 $ 296,638Computer software 384,276 311,821Real estate lease costs 1,821,682 699,212Customer relationships 218,000 14,533Deferred loan costs 946,954 539,022Other 39,033 9,099
$ 4,694,531 $ 1,870,325
U n a m o rt i zed intangible assetsTra d e m a r k $ 703,516 $ –
April 30, 2003Gross Carrying Accumulated
Amortized intangible assets Amount AmortizationProprietary customer
software solutions $ 960,419 $ 386,440Computer software 349,016 282,995Real estate lease costs 1,850,252 957,674Deferred loan costs 947,979 482,918Other 28,660 5,733
$ 4,136,326 $ 2,115,760
U n a m o rt i zed intangible assetsTra d e m a r k $ 315,261 $ –
A gg re gate amortization expense for all amort i zed intangible assetsFor the year ended Ap ril 30, 2004 $ 4 6 5 , 2 9 9For the year ended A ril 30, 2 0 0 3 4 9 9 , 2 6 8
Estimated amortization expense for all amortized intangibleassets for the fiscal year ended April 3 0 ,
2005 $ 581,9892006 462,5472007 434,8552008 405,7122009 348,635
The changes in the carrying amount of goodwill is as follows:
Balance as of April 30, 2002 $ 1,741,831Goodwill acquired during the year –Balance as of April 30, 2003 1,741,831 Goodwill acquired during the year 3,256,411 Balance as of April 30, 2004 $ 4,998,242
In fiscal 2004, the Company changed the estimated useful lifeof one of the proprietary customer software offerings resultingin a charge to earnings of approximately $267,000. Thisexpense is re c o rded in selling, general and administrativeexpenses in the accompanying statement of operations for theEnergy and Facilities Solutions Segment.
16 | COMMITMENTS AND CONTINGENCIESEf f e c t i ve April 30, 2003, the Company terminated an employ m e n ta g reement and entered into a new re t i rement agreement with aformer officer and director of the Company. Beginning May 1,2003, the new agreement re q u i red the Company to pay a re t i re m e n tbenefit of approximately $87,000 through August 19, 2003, anda p p roximately $100,000 per year thereafter for a term of four ye a r sending on August 19, 2007. In addition, the Company will alsocontinue to provide certain medical insurance benefits through theterm of the re t i rement agreement. The new agreement re q u i res thatthe re t i re e’s stock options expire no later than August 19, 2004. T h ere t i rement agreement would terminate early in the event of thedeath of the re t i ree.
The Company announced on July 7, 2003, that an internali n vestigation, which was conducted by the Company’s legal counselat the request of senior management, re vealed information
suggesting that activities in violation of Federal antitrust laws mayh a ve taken place in a certain job bidding process for one customerof the Company’s subsidiary, Abrams Construction, Inc. The re s u l t sof this investigation we re re p o rted to the Board of Di rectors of theCompany on June 9, 2003. The Company vo l u n t a r i l ycommunicated the results of its investigation to the United St a t e sDe p a rtment of Justice (“DOJ”). On July 1, 2003, the DOJ issueda conditional letter of amnesty to the Company and its subsidiariesfor their cooperation in recognizing and then immediately re p o rt i n gthe irregularities. The Company believes, based on its internali n vestigation, that the specific improprieties we re confined to abidding process for The Home Depot, Inc. (“Home De p o t”). Atthis time, the Company has no reason to believe that any othercustomers we re affected by such inappropriate behavior. T h eCompany also communicated its concerns about the job biddingp rocess to Home Depot.
The Company believes that it has satisfied all of the DOJ’s re q u e s t sfor document production, in conjunction with its on-goingcooperation with the DOJ investigation, and has otherw i s ecomplied with the conditions of the letter of amnesty. T h eremaining estimated costs associated with this matter are notexpected to be material. Such cost estimates, howe ve r, arep a rticularly difficult to make with any precision. To date, nop r i vate party has made, or threatened to make, any claim inconnection with this matter. It is possible, howe ve r, that claimscould be made as a result of this situation, and such claims couldbe material.
On September 20, 2002, the Company’s subsidiary, Ab r a m sPro p e rties, Inc. (“A PI”), filed a claim in the Superior Court ofCobb County, Georgia, against API ’s former real estate assetm a n a g e r, who subsequently made a demand against API forarbitration and filed a counterclaim. The case is currently beingarbitrated. The dispute arises out of the former asset manager’sp rovision of real estate services to API. The Company believe s
A PI ’s counter claims against its former asset manager and itsdefenses to the asset manager’s claims are meritorious and intendsto continue to vigorously pursue its claims and assert its defenses.
The Company believes the ultimate disposition of the above notedlegal proceedings and claims or potential claims will not have amaterial adverse affect on the financial condition, cash flows, orresults of operations of the Company; howe ve r, the Companycannot predict the ultimate disposition of the above noted claims,potential claims, and proceedings, and there f o re, the Companycannot be certain that the above noted legal proceedings andclaims or potential claims will not have a material adverse effect onthe financial condition, cash flows, or results of operations of theC o m p a n y. The Company is subject to other various legalp roceedings and claims that arise in the ord i n a ry course ofbusiness. While the resolution of these matters cannot be pre d i c t e dwith cert a i n t y, the Company believes that the final outcome ofthese matters will not have a material adverse effect on theC o m p a n y’s financial position or results of operations.
1 7 | S U B S E QUENT EVENTSIn May 2004, the Company acquired the operating business andassets of Atlanta-based Building Pe rformance Engineers, Inc. for ap u rchase price of approximately $350,000. The considerationconsisted of 21,126 newly-issued shares of the Company’scommon stock, with a fair value of $94,906, issued a note for$150,000, and paid $100,000 cash.
In July 2004, the Company re s t ru c t u red the loan on theC o m p a n y’s owned shopping center in Jacksonville, Florida. T h eCompany paid the lender $1.5 million as payment in full of theAdditional In t e rest Agreement, which was then terminated. T h ere s t ru c t u red loan is for $7.8 million, bears interest at 6.125%, andm a t u res on July 1, 2029, but may be called after July 1, 2011, witht h i rteen months’ notice. Howe ve r, the Company’s liability forrepayment is limited to its interest in the center.

18 | QUARTERLY FINANCIAL INFORMATION (UNAUDITED)Qu a rterly financial information for the fiscal years ended April 30, 2004, and 2003 (dollars in thousands, except per share amounts):
Fiscal Year Ended April 30, 2004
First Quarter Second Quarter Third Quarter Fourth Quarter
Total reve nu e s $ 13,730 $ 13,069 $ 5,562 $ 6 , 7 2 1G ross pro fi t 1 , 5 0 2 1 , 3 9 7 1 , 0 5 7 1 , 6 8 3Net (loss) earnings (948) ( 1 , 0 5 7 ) ( 8 8 3 ) 1,038 Net (loss) earnings per share - basic and diluted ( . 3 3 ) ( . 3 6 ) ( . 3 0 ) . 3 7
Fiscal Year Ended April 30, 2003
First Quarter Second Quarter Third Quarter Fourth Quarter
Total reve nu e s $ 17,066 $ 22,803 $ 1 4 , 9 9 1 $ 1 6 , 4 1 8G ross pro fi t 1 , 0 8 2 1 , 5 4 4 1 , 5 7 8 2 , 8 1 3Net earnings (l o s s ) 164 ( 5 4 3 ) ( 6 0 3 ) (92) Net earnings (loss) per share - basic and diluted .06 ( . 1 8 ) ( . 2 1 ) ( . 0 4 )
| SCHEDULE II — VALUATION AND QUALIFYING ACCOUNTS
Additions
Balance at Charged to Charged toBeginning Costs and Other Balance at
of Year Expenses Accounts Deductions* End of Year
Description
A l l owance for doubtful accounts
Year ended Ap ril 30, 2 0 0 4 $ 492,045 $ 40,084 $ – $ 60,650 $ 471,479
Year ended Ap ril 30, 2 0 0 3 1,031,460 84,727 – 6 2 4 , 1 4 2 492,045
Year ended Ap ril 30, 2 0 0 2 961,461 203,687 – 1 3 3 , 6 8 8 1,031,460
* Allowance for doubtful accounts deductions resulted from the subsequent write-off and/or re c ove ry of the related re c e i va b l e .
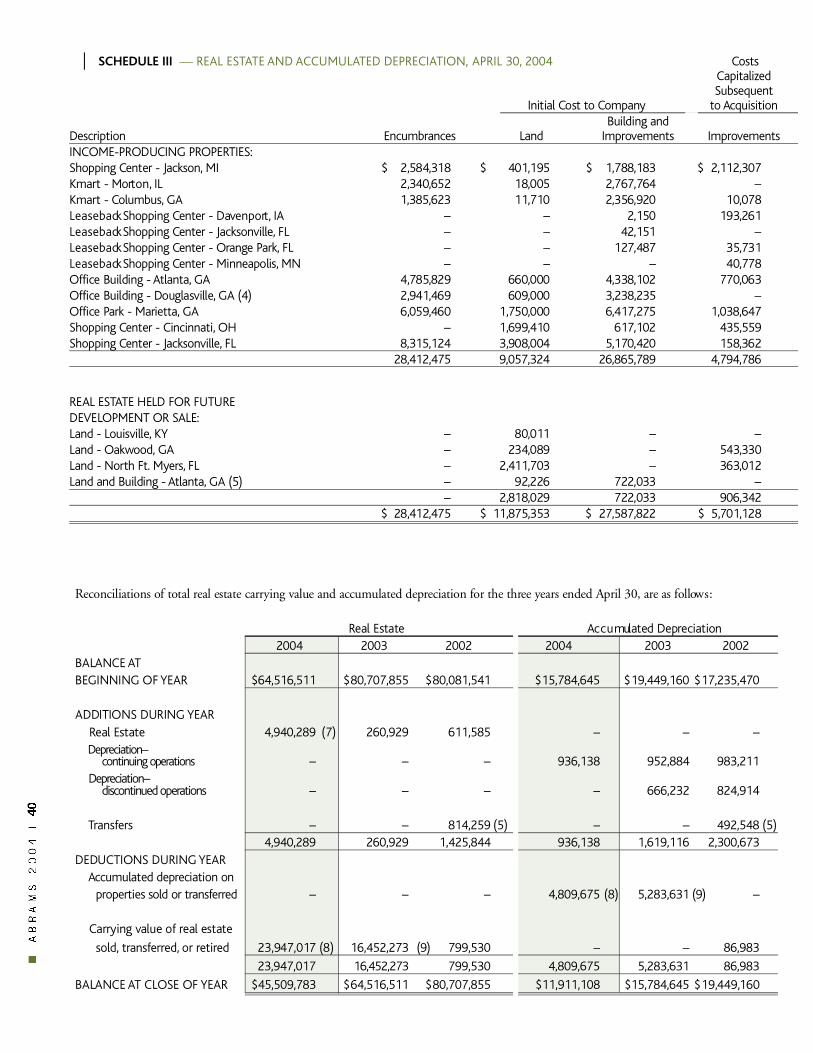
| SCHEDULE III — REAL ESTATE AND ACCUMULATED DEPRECIATION, APRIL 30, 2004 Co s t sC a p i t a l i ze dS u b s e q u e n t
Initial Cost to Co m p a ny to Ac q u i s i t i o nBuilding and
D e s c ri p t i o n E n c u m b ra n c e s L a n d I m p rove m e n t s I m p rove m e n t sI N C O M E - P RODUCING PRO P E RT I E S :Shopping Center - Ja ck s o n , M I $ 2,584,318 $ 401,195 $ 1,788,183 $ 2 , 1 1 2 , 3 0 7K m a rt - Mort o n , I L 2,340,652 18,005 2,767,764 – K m a rt - Co l u m b u s , G A 1 , 3 8 5 , 6 2 3 11,710 2,356,920 10,078 L e a s e b a ck Shopping Center - Dave n p o rt , I A – – 2,150 193,261 L e a s e b a ck Shopping Center - Ja ck s o nv i l l e , F L – – 42,151 – L e a s e b a ck Shopping Center - Ora n ge Pa r k , F L – – 127,487 35,731 L e a s e b a ck Shopping Center - Minneapolis, M N – – – 40,778 O ffice Building - At l a n t a , G A 4,785,829 660,000 4,338,102 770,063 O ffice Building - Douglasville, GA (4) 2,941,469 609,000 3 , 2 3 8 , 2 3 5 –O ffice Park - Mari e t t a , G A 6,059,460 1,750,000 6,417,275 1 , 0 3 8 , 6 4 7Shopping Center - Cincinnati, O H – 1,699,410 617,102 4 3 5 , 5 5 9Shopping Center - Ja ck s o nv i l l e , F L 8 , 3 1 5 , 1 2 4 3,908,004 5,170,420 158,362
2 8 , 4 1 2 , 4 7 5 9 , 0 5 7 , 3 2 4 2 6 , 8 6 5 , 7 8 9 4 , 7 9 4 , 7 8 6
REAL ESTATE HELD FOR FUTURE DEVELOPMENT OR SALE:Land - Louisville, K Y – 80,011 – – Land - Oakwo o d , G A – 234,089 – 543,330 Land - North Ft. M ye rs , F L – 2,411,703 – 363,012 Land and Building - At l a n t a , GA (5) – 92,226 722,033 –
– 2,818,029 722,033 9 0 6 , 3 4 2$ 28,412,475 $ 11,875,353 $ 2 7 , 5 8 7 , 8 2 2 $ 5,701,128
Reconciliations of total real estate carrying value and accumulated depreciation for the three years ended April 30, are as follow s :
Real Estate Ac c u mulated Depreciation 2 0 0 4 2 0 0 3 2 0 0 2 2 0 0 4 2 0 0 3 2 0 0 2
BALANCE AT BEGINNING OF Y E A R $ 6 4 , 5 1 6 , 5 1 1 $8 0 , 7 0 7 , 8 5 5 $8 0 , 0 8 1 , 5 4 1 $1 5 , 7 8 4 , 6 4 5 $1 9 , 4 4 9 , 1 6 0 $1 7 , 2 3 5 , 4 7 0
ADDITIONS DURING Y E A RReal Estate 4 , 9 4 0 , 2 8 9 ( 7 ) 2 6 0 , 9 2 9 6 1 1 , 5 8 5 – – –D e p re c i a t i o n –
c o n t i nuing opera t i o n s – – – 9 3 6 , 1 3 8 9 5 2 , 8 8 4 9 8 3 , 2 1 1D e p re c i a t i o n –
d i s c o n t i nued opera t i o n s – – – – 6 6 6 , 2 3 2 8 2 4 , 9 1 4
Tra n s fe rs – – 8 1 4 , 2 5 9 ( 5 ) – – 4 9 2 , 5 4 8 ( 5 )4 , 9 4 0 , 2 8 9 2 6 0 , 9 2 9 1 , 4 2 5 , 8 4 4 9 3 6 , 1 3 8 1 , 6 1 9 , 1 1 6 2 , 3 0 0 , 6 7 3
DEDUCTIONS DURING Y E A RAc c u mulated depreciation on
p ro p e rties sold or tra n s fe r re d – – – 4 , 8 0 9 , 6 7 5 ( 8 ) 5 , 2 8 3 , 6 3 1 ( 9 ) –
Carrying value of real estates o l d , t ra n s fe r re d , or re t i re d 23,947,017 (8) 1 6 , 4 5 2 , 2 7 3 ( 9 ) 7 9 9 , 5 3 0 – – 8 6 , 9 8 3
2 3 , 9 4 7 , 0 1 7 1 6 , 4 5 2 , 2 7 3 7 9 9 , 5 3 0 4 , 8 0 9 , 6 7 5 5 , 2 8 3 , 6 3 1 8 6 , 9 8 3BALANCE AT CLOSE OF Y E A R $ 4 5 , 5 0 9 , 7 8 3 $6 4 , 5 1 6 , 5 1 1 $8 0 , 7 0 7 , 8 5 5 $ 1 1 , 9 1 1 , 1 0 8 $ 1 5 , 7 8 4 , 6 4 5 $19,449,160

NOTES: (1) The aggregated cost for land, buildings and improvements for federal income tax purposes at April 30, 2004,
is $31,275,615.(2) Developed by others in 1974, redeveloped by the Company in 1997.(3) Developed by others.(4) Acquired in 2004.(5) Vacant; former manufacturing facility.(6) Original building constructed by others prior to 1960.(7) Primarily represents the acquisition of the professional medical office building in Douglasville, Georgia.(8) Primarily represents the sale of a shopping center in North Fort Myers, Florida.(9) Primarily represents the sale of a shopping center in Englewood, Florida.
Life on WhichDepreciation
Gross Amounts at Which in LatestCarried at Close of Year Earnings
Building and Capitalized Net Accumulated Date(s) of Date StatementL a n d Improvements Interest Total (1) Depreciation Construction Acquired is Computed
$ 453,293 $ 3,848,392 $ 89,866 $ 4,391,551 $ 2,194,418 1 9 7 2 , 1 9 9 6 , 2 0 0 4 – 39 years18,005 2,767,764 – 2,785,769 2,657,125 1980, 1992 – 25 years11,710 2,366,998 238,970 2,617,678 2,454,360 1980, 1988 – 25 years
– 195,411 – 195,411 185,872 1995 – 7 years– 42,151 – 42,151 19,389 1994 – 25 years– 163,218 – 163,218 163,218 1995 – 7 years– 40,778 – 40,778 14,692 1997 – 15 years
660,000 5,108,165 – 5,768,165 1,255,566 1974, 1997 (2) 1997 39 years609,000 3,238,235 – 3,847,235 17,168 2000 (3) 2004 39 years
1,750,000 7,455,922 – 9,205,922 1,581,153 1980, 1985 (3) 1997 39 years1,699,410 1,052,661 – 2,752,071 202,274 1982 (3) 1998 39 years3,908,004 5 , 3 2 8 , 7 8 2 – 9,236,786 673,323 1 9 8 5 ( 3 ) 1 9 9 9 39 years9 , 1 0 9 , 4 2 2 3 1 , 6 0 8 , 4 7 7 328,836 4 1 , 0 4 6 , 7 3 5 1 1 , 4 1 8 , 5 5 8
80,011 - - 80,011 - - 1979 -777,419 - 16,644 794,063 - - 1987 -
2,774,715 - - 2,774,715 - - 1993 -92,226 722,033 - 814,259 492,550 ( 6 ) 1 9 6 0 , 1 9 6 8 -
3,724,371 722,033 16,644 4,463,048 492,550 $ 12,833,793 $ 32,330,510 $ 3 4 5 , 4 8 0 $ 45,509,783 $ 11,911,108

ITEM 9 | CHANGES IN AND DISAGREEMENTS WITH INDEPENDENT AUDITORS ON ACCOUNTING ANDFINANCIAL DISCLOSUREThe information re q u i red by this item has been previously re p o rted on Cu r rent Re p o rts on Form 8-K filed October 30, 2001, and Ma y28, 2002.
ITEM 9A | CONTROLS AND PROCEDURESManagement has evaluated the Company’s disclosure and controls and pro c e d u res as defined by Rules 13a-15(e) and 15d-15(e) under theSecurities Exchange Act of 1934, as amended, as of the end of the period cove red by this re p o rt. This evaluation was carried out with thep a rticipation of the Company’s Chief Exe c u t i ve Officer and Chief Financial Of f i c e r. No system of controls, no matter how well designed andoperated, can provide absolute assurance that the objectives of the system of controls are met, and no evaluation of controls can prov i d eabsolute assurance that the system of controls has operated effectively in all cases. The Company’s disclosure controls and pro c e d u res, howe ve r,a re designed to provide reasonable assurance that the objectives of disclosure controls and pro c e d u res are met.
Based on management’s evaluation, the Chief Exe c u t i ve Officer and Chief Financial Officer concluded that the Company’s disclosure contro l sand pro c e d u res we re effective as of the end of the period cove red by this re p o rt to provide reasonable assurance that the objectives of disclosurec o n t rols and pro c e d u res are met.
T h e re was no change in the Company’s internal control over financial re p o rting that occurred during the Company’s fourth fiscal quarter forits fiscal year ended April 30, 2004, which has materially affected, or is reasonably likely to materially affect, the Company’s internal contro lover financial re p o rt i n g .
PART III
ITEMS 10-14The information required by Part III of this Form 10-K will be included in the Company’s definitive proxy materials for its 2004Annual Meeting of Shareholders, to be filed with Securities and Exchange Commission, under the headings “Election of Directors,”“Meetings and Committees of the Board of Directors,” “Nomination of Directors,” “Principal Holders of the Company’s Securitiesand Holdings by Executive Officers and Directors,” “Section 16A Beneficial Ownership Reporting Compliance,” “Compensationof Executive Officers,” “Equity Compensation Plan,” “Compensation of Directors,” “Information Concerning the Company’sIndependent Auditor” and “Corporate Governance and Communicating with the Board,” and is hereby incorporated herein byreference. Information related to Executive Officers of the Company is included in Item 1 of this report.
For purposes of determining the aggregate market value of the Company’s voting stock held by nonaffiliates, shares benefically owned dire c t l yor indirectly by all Di rectors and Exe c u t i ve Officers of the Company have been excluded. The exclusion of such shares is not intended to, andshall not, constitute a determination as to which persons or entities may be “a f f i l i a t e s” of the Company, as defined by the Securities andExchange Commission.

PART IV
ITEM 16 | EXHIBITS, FINANCIAL STATEMENT SCHEDULES, AND REPORTS ON FORM 8-K(A) The following documents are filed as part of this Annual Report on Form 10-K:
1. Financial Statements:Report of Independent Registered Public Accounting FirmConsolidated Balance Sheets at April 30, 2004, and 2003Consolidated Statement of Operations for the Years Ended April 30, 2004, 2003, and 2002Consolidated Statements of Shareholders’ Equity for the Years Ended April 30, 2004, 2003, and 2002Consolidated Statements of Cash Flows for the Years Ended April 30, 2004, 2003, and 2002Notes to Consolidated Financial Statements
2. Financial Statement Schedules:Schedule II - Valuation and Qualifying AccountsSchedule III - Real Estate and Accumulated Depreciation
3. Exhibits:Exhibit No.2a. Agreement and Plan of Reorganization Among Abrams Industries, Inc., WEGI Acquisition, LLC, The Wheatstone Energy Group, Inc. and the Shareholders of The Wheatstone Energy Group, Inc., dated as of December 19, 2003 (1)2b. Asset Purchase Agreement Among Abrams Industries, Inc., Servidyne Systems, LLC and iTendant, Inc., dated as of April 16, 2004 (2)3a. Articles of Incorporation (3)3b. Restated Bylaws (4), Amendments to Bylaws (7)10a. Directors Deferred Compensation Plan (5)#10b. Edward M. Abrams Split Dollar Life Insurance Agreements dated July 29, 1991 (6)#10c. Edward M. Abrams Employment Agreement dated November 18, 1998 (8)#10d. 2000 Stock Award Plan (9)#10e. E. Milton Bevington Employment Agreement dated May 9, 2001 (10)#10f. Alan R. Abrams Split Dollar Life Insurance Agreement dated May 31, 2001 (10)#10g. J. Andrew Abrams Split Dollar Life Insurance Agreement dated May 31, 2001 (10)#10h. Edward M. Abrams Retirement Agreement dated July 22, 2003 (11)#21. List of the Company’s Subsidiaries23a. Consent of Deloitte & Touche LLP31.1 Certification of the CEO31.2 Certification of the CFO32.1 Section 906 Certification of the CEO32.2 Section 906 Certification of the CFO
Explanation of Exhibits(1) This exhibit is incorporated by reference to the Company’s Form 8-K filed January 5, 2004.(2) This exhibit is incorporated by reference to the Company’s Form 8-K filed May 3, 2004.(3) This exhibit is incorporated by reference to the Company’s Form 10-K for the year ended April 30, 1985.(4 This exhibit is incorporated by reference to the Company’s Form 10-K for the year ended April 30, 1997.(5 This exhibit is incorporated by reference to the Company’s Form 10-K for the year ended April 30, 1991.(6) This exhibit is incorporated by reference to the Company’s Form 10-K for the year ended April 30, 1993.(7) This exhibit is incorporated by reference to the Company’s Form 10-K for the year ended April 30, 1998.(8) This exhibit is incorporated by reference to the Company’s Form 10-K for the year ended April 30, 1999.(9) This exhibit is incorporated by reference to the Company’s Form S-8 filed September 29, 2000.(10)This exhibit is incorporated by reference to the Company’s Form 10-K for the year ended April 30, 2001.(11)This exhibit is incorporated by reference to the Company’s Form 10-K for the year ended April 30, 2003.# Management compensatory plan or arrangement.
(B) Reports on Form 8-K: See Current Reports on Form 8-K, filed March 29, 2004, and on Form 8-K/A, filed March 3,2004,reporting acquisitions pursuant to Items 2 and 7 thereof.
(C) The Company hereby files as exhibits to this Annual Report on Form 10-K the exhibits set forth in Item 15(A)3 hereof.(D) The Company hereby files as financial statement schedules to this Annual Report on Form 10-K the financial statement
schedules set forth in Item 15(A)2 hereof.

| SIGNATURESPursuant to the requirements of Section 13 or 15(d) of the Securities Exchange Act of 1934, the registrant has duly caused thisreport to be signed on its behalf by the undersigned, thereunto duly authorized.
ABRAMS INDUSTRIES, INC.
Dated: July 19, 2004 By: /s/ Alan R. AbramsAlan R. AbramsChief Executive Officer
Pursuant to the requirements of the Securities Exchange Act of 1934, this report has been signed below by the following personson behalf of the registrant and in the capacities and on the dates indicated.
Dated: July 19, 2004 /s/ Alan R. AbramsAlan R. AbramsCo-Chairman of the Board of Directors,Chief Executive Officer
Dated: July 19, 2004 /s/ J. Andrew AbramsJ. Andrew Abrams
Co-Chairman of the Board of Directors
Dated: July 19, 2004 /s/ David L. Abrams David L. Abrams Director
Dated: July 19, 2004 /s/ Samuel E. AllenSamuel E. AllenDirector
Dated: July 19, 2004 /s/ Gilbert L. DanielsonGilbert L. DanielsonDirector
Dated: July 19, 2004 /s/ Melinda S. GarrettMelinda S. GarrettDirector
Dated: July 19, 2004 /s/ Robert T. McWhinney, Jr.Robert T. McWhinney, Jr.Director
Dated: July 19, 2004 /s/ Mark J. ThomasMark J. ThomasChief Financial Officer
Dated: July 19, 2004 /s/ Felker W. Ward, Jr.Felker W. Ward, Jr.Director

4ANNUAL REPORT
Established in 1925, Abrams Industries, Inc. (the “Company”),
operating through its wholly owned subsidiaries, provides energy
engineering services and maintenance and service request solutions
for facilities; implements energy saving lighting programs and
provides other energy services, including facility-related
improvements; and engages in real estate investment and
development. Servidyne Systems, LLC provides energy engineering
services and maintenance and service request solutions that assist
its commercial office, hospitality, institutional, and other customers
in reducing building operating costs by lowering energy
consumption, increasing work efficiency, and improving occupant
satisfaction. In early 2004, Servidyne Systems was presented the
ENERGY STAR® Sustained Excellence Award by the U.S.
Environmental Protection Agency, marking the fourth consecutive
year that Servidyne has received the ENERGY STAR Partner of
the Year award.The Wheatstone Energy Group, LLC provides
turnkey implementation of energy saving lighting programs and
energy-related services that reduce energy consumption and
operating costs to commercial, industrial, and institutional facilities.
Abrams Properties, Inc. engages in the acquisition, development,
redevelopment, leasing, asset management, ownership, and sale
of shopping centers and office buildings. The Company currently
owns or controls approximately 1.1 million square feet of shopping
centers in the Midwest and Southeast and more than 200,000
square feet of office properties in metropolitan Atlanta, Georgia.
ANNUAL MEETING
The annual meeting of Shareholders of Abrams Industries, Inc. will
be held at 11:00 a.m. on Wednesday, August 25, 2004, at the Corporate
Headquarters, 1945 The Exchange, Suite 300, Atlanta, Georgia.
CONTENTS
LETTER TOSHAREHOLDERS
FORM 10-K
DIRECTORS,OFFICERS AND
DIRECTORY
1
3
Inside Back Cover
FOUNDERAlfred R. Abrams(1899-1979)
FORMER CHAIRMANBernard W. Abrams(1925-2001)
CHAIRMAN EMERITUSEdward M. Abrams
BOARD OF DIRECTORSAlan R. Abrams (E)Co-Chairman of the BoardChief Executive Officer and PresidentAbrams Industries, Inc.
J. Andrew Abrams (E)Co-Chairman of the BoardVice President-Business DevelopmentAbrams Industries, Inc.
David L. AbramsPresidentSilver Star Management Corp.
Samuel E. Allen (A) (C) (N)Chairman and Chief Executive OfficerGlobalt, Inc.
Gilbert L. Danielson (A) (C) (N)Executive Vice President, Chief Financial OfficerAaron Rents, Inc.
Melinda S. Garrett (E)Vice President and SecretaryAbrams Industries, Inc.Chief Executive Officer and PresidentAbrams Properties, Inc.
Robert T. McWhinney, Jr. (C) (N)Chief Executive Officer and PresidentDouglass, McCarthy and McWhinney
Felker W. Ward, Jr. (A) (N)Chairman of the BoardPinnacle Investment Advisors, LLC
OFFICERS OF ABRAMS INDUSTRIES, INC.AND SUBSIDIARIES
Alan R. Abrams
J. Andrew Abrams
Barry C. Abramson
Carrie L. Billiam
Melinda S. Garrett
Stephen D. Hassett
M. Todd Jarvis
Jo Toney Mundy
Rick A. Paternostro
Jim Poulos
Mark J. Thomas
Claire J. Wiggill
Paul M. Williams
PARENT COMPANY
ABRAMS INDUSTRIES, INC.
1945 The Exchange
Suite 300
Atlanta, Georgia 30339-2029
(770) 953-0304
(770) 953-9922 (fax)
www.abramsindustries.com
ENERGY AND FACILITIES SOLUTIONS SEGMENT
SERVIDYNE SYSTEMS, LLC
1945 The Exchange
Suite 325
Atlanta, Georgia 30339-2029
(770) 933-4200
(770) 933-4201 (fax)
www.servidyne.com
ENERGY SERVICES SEGMENT
THE WHEATSTONE ENERGY GROUP, LLC
1945 The Exchange
Suite 320
Atlanta, Georgia 30339-2029
(770) 916-7111
(770) 916-7112 (fax)
www.wheatstoneenergy.com
REAL ESTATE SEGMENT
ABRAMS PROPERTIES, INC.
1945 The Exchange
Suite 400
Atlanta, Georgia 30339-2029
(770) 953-1777
(770) 953-9922 (fax)
Committees:
A-Audit C-Compensation E-Executive N-Nominating
TRANSFER AGENT
SunTrust Bank
Post Office Box 4625
Atlanta, Georgia 30302

ABRAMS INDUSTRIES, INC.
1945 THE EXCHANGE, SUITE 300
ATLANTA, GEORGIA 30339-2029
770.953.0304
FAX 770.953.9922
WWW.ABRAMSINDUSTRIES.COM
ANNUAL REPORT