about this chapter
DESCRIPTION
About this Chapter. Diffusion and solubility of gases Gas exchange in lungs and tissues Gas transport in the blood Regulation of ventilation. Overview. O 2. CO 2. Airways. Alveoli of lungs. O 2. CO 2. 6. CO 2 exchange at alveolar-capillary interface. Oxygen exchange - PowerPoint PPT PresentationTRANSCRIPT

Copyright © 2007 Pearson Education, Inc., publishing as Benjamin Cummings
About this Chapter
Diffusion and solubility of gases
Gas exchange in lungs and tissues
Gas transport in the blood
Regulation of ventilation

Copyright © 2007 Pearson Education, Inc., publishing as Benjamin Cummings
CO2 O2
Alveoli of lungs
Airways
CO2
CO2
O2
O2
Pulmonarycirculation
CO2 O2
Cellularrespiration
ATPNutrients
Cells
Systemiccirculation
CO2 O2
Oxygen exchange at cells
Oxygen transport
CO2 exchangeat alveolar-capillaryinterface
Oxygen exchangeat alveolar-capillaryinterface
CO2 exchange at cells
CO2 transport
1
2
34
5
6
Overview
Overview of oxygen and carbon dioxide exchange and transport
Figure 18-1

Copyright © 2007 Pearson Education, Inc., publishing as Benjamin Cummings
Diffusion and SolubilityDiffusion Rate : Surface area x Concentration Gradient x Membrane Permeability
Membrane Thickness
Surface area
Constant
Concentration gradient
Most important factor
Membrane thickness
Constant
Diffusion distance
Constant
Thus, Diffusion Rate is proportional to Concentration Gradient

Copyright © 2007 Pearson Education, Inc., publishing as Benjamin Cummings
Movement of Gases Pressure gradient
Solubility of gas in liquid
Temperature (in body, relatively constant)

Copyright © 2007 Pearson Education, Inc., publishing as Benjamin Cummings Figure 18-2a–c
Behavior of Gases in Solution
PO2 = 100 mm Hg
PO2 = 0 mm Hg
PO2 = 100 mm Hg
[O2] = 5.20 mmol/L
PO2 = 100 mm Hg
[O2] = 0.15 mmol/L
(a) (b) (c)Initial state:no O2 in solution
Oxygen dissolves. At equilibrium, PO2 in air and water is equal. Low O2 solubility means concentrations are not equal.

Copyright © 2007 Pearson Education, Inc., publishing as Benjamin Cummings Figure 18-2a–c (1 of 3)
Behavior of Gases in Solution
PO2 = 100 mm Hg
PO2 = 0 mm Hg
(a) Initial state:no O2 in solution

Copyright © 2007 Pearson Education, Inc., publishing as Benjamin Cummings Figure 18-2a–c (2 of 3)
Behavior of Gases in Solution
PO2 = 100 mm Hg
PO2 = 0 mm Hg
(a) (b)Initial state:no O2 in solution
Oxygen dissolves.

Copyright © 2007 Pearson Education, Inc., publishing as Benjamin Cummings Figure 18-2a–c (3 of 3)
Behavior of Gases in Solution
PO2 = 100 mm Hg
PO2 = 0 mm Hg
PO2 = 100 mm Hg
[O2] = 5.20 mmol/L
PO2 = 100 mm Hg
[O2] = 0.15 mmol/L
(a) (b) (c)Initial state:no O2 in solution
Oxygen dissolves. At equilibrium, PO2 in air and water is equal. Low O2 solubility means concentrations are not equal.

Copyright © 2007 Pearson Education, Inc., publishing as Benjamin Cummings Figure 18-2c–d
Behavior of Gases in Solution

Copyright © 2007 Pearson Education, Inc., publishing as Benjamin Cummings Figure 18-3
Gas Exchange at the Alveoli and Cells
Animation: Respiratory System: Gas ExchangePLAY

Copyright © 2007 Pearson Education, Inc., publishing as Benjamin Cummings
Partial Pressures

Copyright © 2007 Pearson Education, Inc., publishing as Benjamin Cummings
Gas Exchange

Copyright © 2007 Pearson Education, Inc., publishing as Benjamin Cummings
Causes of Low Alveolar PO2
Inspired air has abnormally low oxygen content Altitude
Alveolar ventilation is inadequate Decreased lung compliance
Increased airway resistance
Overdose of drugs

Copyright © 2007 Pearson Education, Inc., publishing as Benjamin Cummings Figure 18-4a
Alveolar Ventilation
Pathological conditions that reduce alveolar ventilation and gas exchange

Copyright © 2007 Pearson Education, Inc., publishing as Benjamin Cummings Figure 18-4b
Alveolar Ventilation

Copyright © 2007 Pearson Education, Inc., publishing as Benjamin Cummings Figure 18-4c
Alveolar Ventilation

Copyright © 2007 Pearson Education, Inc., publishing as Benjamin Cummings Figure 18-4d
Alveolar Ventilation

Copyright © 2007 Pearson Education, Inc., publishing as Benjamin Cummings Figure 18-4e
Alveolar Ventilation

Copyright © 2007 Pearson Education, Inc., publishing as Benjamin Cummings Figure 18-5
Gas Exchange
Oxygen diffuses across alveolar epithelial cells and capillary endothelial cells to enter the plasma

Copyright © 2007 Pearson Education, Inc., publishing as Benjamin Cummings
Gas Exchange
Pathological changes Decrease in amount of alveolar surface area
Increase in thickness of alveolar membrane
Increase in diffusion distance between alveoli and blood

Copyright © 2007 Pearson Education, Inc., publishing as Benjamin Cummings Figure 18-6
Oxygen Transport
Summary of oxygen transport in the blood
O2
O2
O2 dissolved in plasma (~ PO2) < 2%
O2 dissolved in plasma
O2 + Hb Hb•O2
> 98%
Hb + O2Hb•O2
ARTERIAL BLOOD
Alveolar membrane
Alveolus
Capillaryendothelium
Transportto cells
Red blood cell
Cells
Used incellular
respiration

Copyright © 2007 Pearson Education, Inc., publishing as Benjamin Cummings Figure 18-7a
Oxygen Transport
The role of hemoglobin in oxygen transport

Copyright © 2007 Pearson Education, Inc., publishing as Benjamin Cummings Figure 18-7b
Oxygen Transport

Copyright © 2007 Pearson Education, Inc., publishing as Benjamin Cummings Figure 18-7c
Oxygen Transport

Copyright © 2007 Pearson Education, Inc., publishing as Benjamin Cummings Figure 18-8
The Hemoglobin Molecule
The amount of oxygen bound to hemoglobin depends on the PO2 of plasma

Copyright © 2007 Pearson Education, Inc., publishing as Benjamin Cummings Figure 18-9
Oxygen-Hemoglobin Dissociation Curve

Copyright © 2007 Pearson Education, Inc., publishing as Benjamin Cummings Figure 18-10a
Oxygen Binding
Physical factors alter hemoglobin’s affinity for oxygen

Copyright © 2007 Pearson Education, Inc., publishing as Benjamin Cummings Figure 18-10b
Oxygen Binding

Copyright © 2007 Pearson Education, Inc., publishing as Benjamin Cummings Figure 18-10c
Oxygen Binding

Copyright © 2007 Pearson Education, Inc., publishing as Benjamin Cummings Figure 18-11
2,3-diphosphoglycerate (intermediate in glycolysis pathway) lowers Hb binding affinity
2,3-DPG alters hemoglobin’s affinity for oxygen

Copyright © 2007 Pearson Education, Inc., publishing as Benjamin Cummings Figure 18-12
Oxygen Binding
Differences in oxygen-binding properties of maternal and fetal hemoglobin

Copyright © 2007 Pearson Education, Inc., publishing as Benjamin Cummings Figure 18-13
Oxygen Binding
Factors contributing to the total oxygen content of arterial blood

Copyright © 2007 Pearson Education, Inc., publishing as Benjamin Cummings
Carbon Dioxide Transport
Dissolved: 7%
Converted to bicarbonate ion in rbc: 70%
Bound to hemoglobin: 23% Hemoglobin also binds H+,
Hb and CO2: carbaminohemoglobin

Copyright © 2007 Pearson Education, Inc., publishing as Benjamin Cummings Figure 18-14
Carbon Dioxide Transport in the Blood
CO2
CO2
Dissolved CO2
(7%)
Dissolved CO2 Dissolved CO2
CO2 + Hb
Hb + CO2
Hb•CO2 (23%)
Hb•CO2
CO2 + H2O
H2O + CO2H2CO3
HCO3–
HCO3–
HCO3– in
plasma (70%)
HCO3–
inplasma
H+ + Hb Hb•H
H+ + HbHb•H
Cl–
Cl–
Cellularrespiration
inperipheral
tissues
VENOUS BLOOD
Alveoli
Transportto lungs
Red blood cell
Capillaryendothelium
Cell membrane
CA
H2CO3
CA

Copyright © 2007 Pearson Education, Inc., publishing as Benjamin Cummings Figure 18-14 (1 of 17)
Carbon Dioxide Transport in the Blood
CO2
Cellularrespiration
inperipheral
tissues
VENOUS BLOOD
Alveoli
Capillaryendothelium
Cell membrane

Copyright © 2007 Pearson Education, Inc., publishing as Benjamin Cummings Figure 18-14 (2 of 17)
Carbon Dioxide Transport in the Blood
CO2 Dissolved CO2
(7%)Cellular
respirationin
peripheraltissues
VENOUS BLOOD
Alveoli
Capillaryendothelium
Cell membrane

Copyright © 2007 Pearson Education, Inc., publishing as Benjamin Cummings Figure 18-14 (3 of 17)
Carbon Dioxide Transport in the Blood
CO2 Dissolved CO2
(7%)
CO2
Cellularrespiration
inperipheral
tissues
VENOUS BLOOD
Alveoli
Red blood cell
Capillaryendothelium
Cell membrane

Copyright © 2007 Pearson Education, Inc., publishing as Benjamin Cummings Figure 18-14 (4 of 17)
Carbon Dioxide Transport in the Blood
CO2 Dissolved CO2
(7%)
CO2 + Hb Hb•CO2 (23%)
Cellularrespiration
inperipheral
tissues
VENOUS BLOOD
Alveoli
Red blood cell
Capillaryendothelium
Cell membrane

Copyright © 2007 Pearson Education, Inc., publishing as Benjamin Cummings Figure 18-14 (5 of 17)
Carbon Dioxide Transport in the Blood
CO2 Dissolved CO2
(7%)
CO2 + Hb Hb•CO2 (23%)
CO2 + H2O
Cellularrespiration
inperipheral
tissues
VENOUS BLOOD
Alveoli
Red blood cell
Capillaryendothelium
Cell membrane
H2CO3
CA

Copyright © 2007 Pearson Education, Inc., publishing as Benjamin Cummings Figure 18-14 (6 of 17)
Carbon Dioxide Transport in the Blood
CO2 Dissolved CO2
(7%)
CO2 + Hb Hb•CO2 (23%)
CO2 + H2OHCO3
–
H+ + Hb
Cellularrespiration
inperipheral
tissues
VENOUS BLOOD
Alveoli
Red blood cell
Capillaryendothelium
Cell membrane
H2CO3
CA

Copyright © 2007 Pearson Education, Inc., publishing as Benjamin Cummings Figure 18-14 (7 of 17)
Carbon Dioxide Transport in the Blood
CO2 Dissolved CO2
(7%)
CO2 + Hb Hb•CO2 (23%)
CO2 + H2OHCO3
–
H+ + Hb Hb•H
Cellularrespiration
inperipheral
tissues
VENOUS BLOOD
Alveoli
Red blood cell
Capillaryendothelium
Cell membrane
H2CO3
CA

Copyright © 2007 Pearson Education, Inc., publishing as Benjamin Cummings Figure 18-14 (8 of 17)
Carbon Dioxide Transport in the Blood
CO2 Dissolved CO2
(7%)
CO2 + Hb Hb•CO2 (23%)
CO2 + H2OHCO3
– HCO3– in
plasma (70%)H+ + Hb Hb•H
Cl–
Cellularrespiration
inperipheral
tissues
VENOUS BLOOD
Alveoli
Red blood cell
Capillaryendothelium
Cell membrane
H2CO3
CA

Copyright © 2007 Pearson Education, Inc., publishing as Benjamin Cummings Figure 18-14 (9 of 17)
Carbon Dioxide Transport in the Blood
CO2 Dissolved CO2
(7%)
CO2 + Hb Hb•CO2 (23%)
CO2 + H2OHCO3
– HCO3– in
plasma (70%)H+ + Hb Hb•H
Cl–
Cellularrespiration
inperipheral
tissues
VENOUS BLOOD
Alveoli
Transportto lungs
Red blood cell
Capillaryendothelium
Cell membrane
H2CO3
CA

Copyright © 2007 Pearson Education, Inc., publishing as Benjamin Cummings Figure 18-14 (10 of 17)
Carbon Dioxide Transport in the Blood
CO2
CO2
Dissolved CO2
(7%)
Dissolved CO2 Dissolved CO2
CO2 + Hb Hb•CO2 (23%)
CO2 + H2OHCO3
– HCO3– in
plasma (70%)H+ + Hb Hb•H
Cl–
Cellularrespiration
inperipheral
tissues
VENOUS BLOOD
Alveoli
Transportto lungs
Red blood cell
Capillaryendothelium
Cell membrane
H2CO3
CA

Copyright © 2007 Pearson Education, Inc., publishing as Benjamin Cummings Figure 18-14 (11 of 17)
Carbon Dioxide Transport in the Blood
CO2
CO2
Dissolved CO2
(7%)
Dissolved CO2 Dissolved CO2
CO2 + Hb
Hb + CO2
Hb•CO2 (23%)
Hb•CO2
CO2 + H2OHCO3
– HCO3– in
plasma (70%)H+ + Hb Hb•H
Cl–
Cellularrespiration
inperipheral
tissues
VENOUS BLOOD
Alveoli
Transportto lungs
Red blood cell
Capillaryendothelium
Cell membrane
H2CO3
CA

Copyright © 2007 Pearson Education, Inc., publishing as Benjamin Cummings Figure 18-14 (12 of 17)
Carbon Dioxide Transport in the Blood
CO2
CO2
Dissolved CO2
(7%)
Dissolved CO2 Dissolved CO2
CO2 + Hb
Hb + CO2
Hb•CO2 (23%)
Hb•CO2
CO2 + H2OHCO3
– HCO3– in
plasma (70%)H+ + Hb Hb•H
Cl–
Cellularrespiration
inperipheral
tissues
VENOUS BLOOD
Alveoli
Transportto lungs
Red blood cell
Capillaryendothelium
Cell membrane
H2CO3
CA

Copyright © 2007 Pearson Education, Inc., publishing as Benjamin Cummings Figure 18-14 (13 of 17)
Carbon Dioxide Transport in the Blood
CO2
CO2
Dissolved CO2
(7%)
Dissolved CO2 Dissolved CO2
CO2 + Hb
Hb + CO2
Hb•CO2 (23%)
Hb•CO2
CO2 + H2OHCO3
–
HCO3–
HCO3– in
plasma (70%)
HCO3–
inplasma
H+ + Hb Hb•H
Cl–
Cl–
Cellularrespiration
inperipheral
tissues
VENOUS BLOOD
Alveoli
Transportto lungs
Red blood cell
Capillaryendothelium
Cell membrane
H2CO3
CA

Copyright © 2007 Pearson Education, Inc., publishing as Benjamin Cummings Figure 18-14 (14 of 17)
Carbon Dioxide Transport in the Blood
CO2
CO2
Dissolved CO2
(7%)
Dissolved CO2 Dissolved CO2
CO2 + Hb
Hb + CO2
Hb•CO2 (23%)
Hb•CO2
CO2 + H2OHCO3
–
HCO3–
HCO3– in
plasma (70%)
HCO3–
inplasma
H+ + Hb Hb•H
H+ + HbHb•H
Cl–
Cl–
Cellularrespiration
inperipheral
tissues
VENOUS BLOOD
Alveoli
Transportto lungs
Red blood cell
Capillaryendothelium
Cell membrane
H2CO3
CA

Copyright © 2007 Pearson Education, Inc., publishing as Benjamin Cummings Figure 18-14 (15 of 17)
Carbon Dioxide Transport in the Blood
CO2
CO2
Dissolved CO2
(7%)
Dissolved CO2 Dissolved CO2
CO2 + Hb
Hb + CO2
Hb•CO2 (23%)
Hb•CO2
CO2 + H2O
H2CO3
HCO3–
HCO3–
HCO3– in
plasma (70%)
HCO3–
inplasma
H+ + Hb Hb•H
H+ + HbHb•H
Cl–
Cl–
Cellularrespiration
inperipheral
tissues
VENOUS BLOOD
Alveoli
Transportto lungs
Red blood cell
Capillaryendothelium
Cell membrane
H2CO3
CA

Copyright © 2007 Pearson Education, Inc., publishing as Benjamin Cummings Figure 18-14 (16 of 17)
Carbon Dioxide Transport in the Blood
CO2
CO2
Dissolved CO2
(7%)
Dissolved CO2 Dissolved CO2
CO2 + Hb
Hb + CO2
Hb•CO2 (23%)
Hb•CO2
CO2 + H2O
H2O + CO2H2CO3
HCO3–
HCO3–
HCO3– in
plasma (70%)
HCO3–
inplasma
H+ + Hb Hb•H
H+ + HbHb•H
Cl–
Cl–
Cellularrespiration
inperipheral
tissues
VENOUS BLOOD
Alveoli
Transportto lungs
Red blood cell
Capillaryendothelium
Cell membrane
H2CO3
CA
CA

Copyright © 2007 Pearson Education, Inc., publishing as Benjamin Cummings Figure 18-14 (17 of 17)
Carbon Dioxide Transport in the Blood
CO2
CO2
Dissolved CO2
(7%)
Dissolved CO2 Dissolved CO2
CO2 + Hb
Hb + CO2
Hb•CO2 (23%)
Hb•CO2
CO2 + H2O
H2O + CO2H2CO3
HCO3–
HCO3–
HCO3– in
plasma (70%)
HCO3–
inplasma
H+ + Hb Hb•H
H+ + HbHb•H
Cl–
Cl–
Cellularrespiration
inperipheral
tissues
VENOUS BLOOD
Alveoli
Transportto lungs
Red blood cell
Capillaryendothelium
Cell membrane
H2CO3
CA
CA

Copyright © 2007 Pearson Education, Inc., publishing as Benjamin Cummings Figure 18-15
Gas Transport: Summary
Animation: Respiratory System: Gas TransportPLAY

Copyright © 2007 Pearson Education, Inc., publishing as Benjamin Cummings
Reflex Control of Ventilation
Figure 18-16

Copyright © 2007 Pearson Education, Inc., publishing as Benjamin Cummings
Regulation of Ventilation
Respiratory neurons in medulla control inspiration and expiration
Neurons in the pons modulate ventilation
Rhythmic pattern of breathing arises from a network of spontaneously discharging neurons
Ventilation is subject to modulation by chemoreceptor-linked reflexes and by higher brain centers

Copyright © 2007 Pearson Education, Inc., publishing as Benjamin Cummings Figure 18-17
Regulation of Ventilation
Neural activity during quiet breathing

Copyright © 2007 Pearson Education, Inc., publishing as Benjamin Cummings
Regulation of Ventilation
Peripheral chemoreceptors Located in carotid and aortic arteries
Specialized glomus cells
Sense changes in PO2, pH, and PCO2
Central chemoreceptors
Changes in CO2
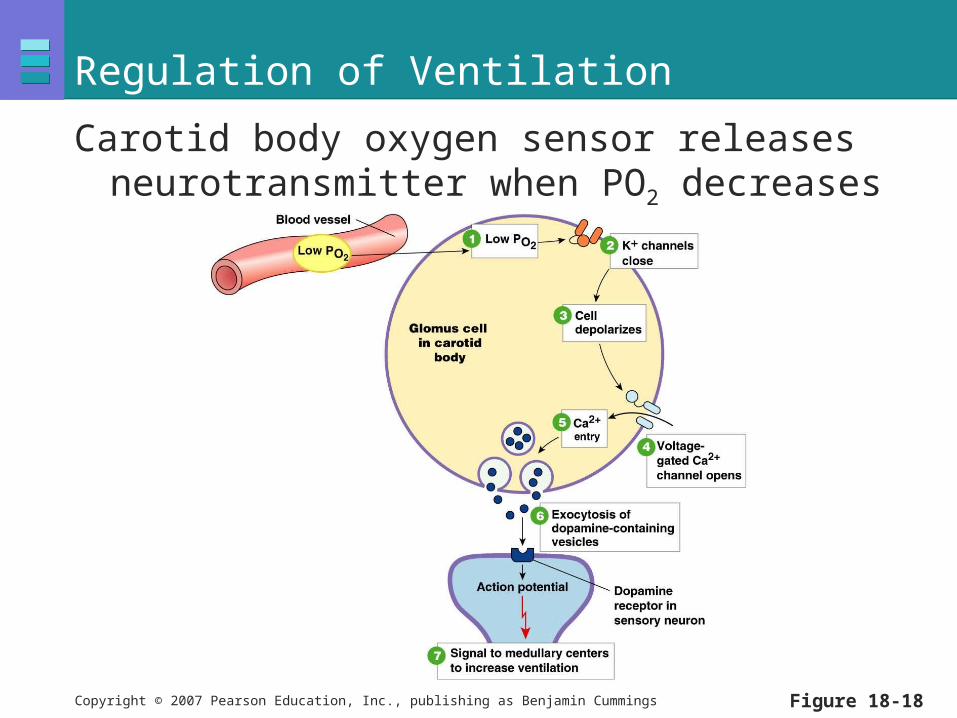
Copyright © 2007 Pearson Education, Inc., publishing as Benjamin Cummings Figure 18-18
Regulation of Ventilation
Carotid body oxygen sensor releases neurotransmitter when PO2 decreases

Copyright © 2007 Pearson Education, Inc., publishing as Benjamin Cummings Figure 18-19
Regulation of Ventilation
Central chemoreceptors monitor CO2 in cerebrospinal fluid

Copyright © 2007 Pearson Education, Inc., publishing as Benjamin Cummings
Regulation of Ventilation
Chemoreceptor response to increased PCO2
Figure 18-20
Animation: Respiratory System: Control of RespirationPLAY

Copyright © 2007 Pearson Education, Inc., publishing as Benjamin Cummings
Regulation of Ventilation
Protective reflexes Irritant receptors
Bronchoconstriction
Sneezing
Coughing
Hering-Breuer inflation reflex

Copyright © 2007 Pearson Education, Inc., publishing as Benjamin Cummings
Summary
Diffusion and solubility of gases
Gas exchange
Gas transport Transport of oxygen and carbon dioxide
Factors affecting oxygen-hemoglobin binding
Carbonic anhydrase and chloride shift

Copyright © 2007 Pearson Education, Inc., publishing as Benjamin Cummings
Summary
Regulation of ventilation Central pattern generator
Dorsal versus ventral respiratory groups
Peripheral versus central chemoreceptors