about the wisconsin policy forum · 20/02/2018 · about the wisconsin policy forum . the wisconsin...
TRANSCRIPT


A b o u t t h e W i s c o n s i n P o l i c y F o r u m The Wisconsin Policy Forum was created on January 1, 2018, by the merger of the Milwaukee-based Public Policy Forum and the Madison-based Wisconsin Taxpayers Alliance. Throughout their lengthy histories, both organizations engaged in nonpartisan, independent research and civic education on fiscal and policy issues affecting state and local governments and school districts in Wisconsin. The Wisconsin Policy Forum is committed to those same activities and to that spirit of nonpartisanship.
P r e f a c e a n d A c k n o w l e d g m e n t s
This report was undertaken to provide citizens and policymakers in the Milwaukee region with an understanding of the condition of parks, recreational, and cultural assets owned by Milwaukee County, as well as the county’s financial capacity to finance capital repairs and improvements to those assets in the near-term future. We hope that policymakers and community leaders will use the report’s findings to inform discussions during upcoming policy debates and budget deliberations at the local and state levels. Report authors would like to thank officials and staff from the Milwaukee County Department of Parks, Recreation, and Culture, the Milwaukee County Zoo, the Milwaukee County Department of Administrative Services, and the private nonprofit entities that operate various county-own cultural facilities. We sincerely appreciate their assistance in providing information on infrastructure condition and financial matters, and for patiently answering our questions. In addition, we wish to acknowledge and thank the several entities that are providing financial support for our series of reports on local infrastructure condition and need. They are the Herzfeld Foundation, Wisconsin Housing and Economic Development Authority, MMSD, City of Milwaukee, Fund for Lake Michigan, and Brico Fund. We also thank the Northwestern Mutual Foundation and the Rockwell Automation Charitable Corporation for their long-standing support of our local government finance research.

DELAY OF GAME An analysis of repair and replacement needs for Milwaukee County’s parks, recreational facilities,
and cultural institutions
September 2018
Study authors: Larry Sandler, Researcher
Ben Juarez, Researcher Rob Henken, President

2
Table of Contents Introduction .................................................................................................................................................. 3
Data and Methodology ................................................................................................................................ 5
Capital Asset Management ......................................................................................................................... 6
A Brief Overview ....................................................................................................................................... 6
Capital Asset Management of Parks and Cultural Institutions ............................................................. 7
Condition of County-Owned Cultural Assets ............................................................................................ 11
Milwaukee County Zoo – Condition: Fair ............................................................................................ 13
Milwaukee Public Museum – Condition: Fair to Poor ........................................................................ 14
War Memorial Center/Milwaukee Art Museum – Condition: Good ................................................... 16
Marcus Center for the Performing Arts – Condition: Fair to Good .................................................... 17
Milwaukee County Historical Society – Condition: Fair to Poor ........................................................ 18
Charles Allis Art Museum/Villa Terrace Decorative Arts Museum – Condition: Fair ....................... 20
Condition of County Parks and Recreation Assets ................................................................................. 22
Buildings ................................................................................................................................................ 23
Paved assets ......................................................................................................................................... 26
Other Assets .......................................................................................................................................... 29
Capital Finance ......................................................................................................................................... 31
A Brief Overview .................................................................................................................................... 31
Capital Finance in Milwaukee County .................................................................................................. 32
Financial Capacity to Address Parks, Recreational, and Cultural Infrastructure Needs ...................... 35
Capital Finance Environment ............................................................................................................... 35
Future Cultural Infrastructure Needs vs. Available Capacity .............................................................. 37
Future Parks and Recreational Infrastructure Needs vs. Available Capacity .................................... 39
Summary ............................................................................................................................................... 40
Conclusion ................................................................................................................................................. 43

3
Introdu ct ion It’s not hard to find testimonials to how much parks, recreational opportunities, and cultural attractions mean to Greater Milwaukee’s residents and visitors alike.
In ranking Milwaukee among its top 100 places to live in the United States earlier this year, U.S. News & World Report mentioned the city’s “lakefront museums ... a thriving music and arts scene ... and an array of cultural events.”i Travel + Leisure magazine found “the city’s unique museums and art venues are ... compelling points of interest for travelers — not to mention the residents themselves.”ii And when Milwaukee Magazine recently asked its contributing writers to list reasons why they love Milwaukee, 23 of 25 writers mentioned the area’s parks, recreational, or cultural offerings.iii
Yet, despite their glamor and acclaim, the condition of the region’s most prominent parks, recreational, and cultural facilities has been a topic of passionate debate among policymakers, civic leaders, and concerned citizens in recent years. Their concerns stem, in part, from Milwaukee County’s ownership of many of these facilities, which subjects these quality-of-life assets to some of the same fiscal constraints as roads, buses, and other, more mundane forms of public infrastructure.
Those constraints are an issue for local officials nationwide. A U.S. Conference of Mayors survey showed "aging and unfunded infrastructure is the greatest challenge confronting mayors." A recent joint white paper from the International City/County Management Association and Government Finance Officers Association noted that "local governments across the United States are facing a serious infrastructure deficit and are exploring new ways to finance needed expansion, upgrades, and repairs."iv Yet another report from the National League of Cities observed that the ability of many local governments to meet their growing infrastructure obligations is restricted by statutory limitations on the amounts of local tax revenues they can raise.v
The Wisconsin Policy Forum has embarked on a comprehensive research project to determine how this challenge is playing out locally. Our intent is to assess whether the largest local governments in Greater Milwaukee are effectively addressing their infrastructure needs, and to determine whether they have the financial capacity to meet their infrastructure challenges going forward. The research is being released through a multi-part series of reports on local government infrastructure in metro Milwaukee.
Our first report (A Fork in the Road?vi), released in September 2016, focused on transportation infrastructure owned by Milwaukee County and the City of Milwaukee. In our second report (Beneath the Streetsvii), released in May 2017, we addressed water, sewer, and wastewater infrastructure owned by the Milwaukee Metropolitan Sewerage District, the Milwaukee Water Works, and the City of Milwaukee. Our third report (Cracks in the Foundationviii), released in September 2017, examined buildings owned by the City of Milwaukee and Milwaukee County. We found formidable challenges associated with all of these forms of capital assets, resulting not only from their age and needed upgrades, but also from limited borrowing capacity and the competing capital needs of other governmental functions.

4
In this report – our fourth in the series – we explore parks, recreational, and cultural infrastructure owned by Milwaukee County,1 focusing on the following research questions:
● How does the county identify and assess its parks, recreational, and cultural infrastructure needs, and what is the general condition of that infrastructure?
● How is the county financing its parks, recreational, and cultural capital projects and what is the current status of its debt load and overall finances?
● How much would it cost to fully fund identified repairs, improvements, and replacements over the next several years, and what is the county’s capacity to cover future costs while complying with capital budgeting and debt management pressures and policies?
Many of the assets we cover in this report are well-known to residents of Greater Milwaukee. Visits to the Milwaukee County Zoo and the Milwaukee Public Museum are a common part of growing up or raising children here. The lakefront parks and beaches, the War Memorial Center, the Milwaukee Art Museum, and the Mitchell Park Horticultural Conservatory (the Domes) are iconic features of the cityscape. County parks offer free or relatively low-cost options for hiking, bicycling, swimming, wading, sailing, and playing a wide variety of sports, from golf and tennis to baseball and basketball. The Marcus Center for the Performing Arts is a primary regional venue for music, theater, and dance.
Other assets are less visible but no less vital. The Milwaukee County Historical Society, the Charles Allis Art Museum, and the Villa Terrace Decorative Arts Museum play an important role in preserving our region’s cultural heritage. The Parks Department’s maintenance buildings, service yards, and parking lots are utilitarian but necessary to maintain the parks and provide access to them.
We previously examined the condition of the county’s parks, recreational facilities, and cultural institutions in a December 2013 report, Pulling Back the Curtain.ix That report identified a daunting set of infrastructure needs and funding challenges. Almost five years later, this report finds those needs and challenges no less daunting.
The full series of reports will conclude with a wrap-up piece that will provide policy options and recommendations.x Our overall intent is to catalogue and describe the infrastructure challenges of the major local governments in our region and to assess the resulting financial implications. We hope this research will be used as a tool for policymakers and civic leaders as they consider local government spending priorities and the larger revenue structure that is used to support local governments in Wisconsin.
1 We originally intended to include the 64 playgrounds owned by the City of Milwaukee in this report. We ultimately chose not to do so, however, because the city already has embarked on an active program to address its playgrounds’ capital needs through the MKE Plays initiative, https://city.milwaukee.gov/CommonCouncil/mkeplays#.W3seI62ZNmA

5
Data and Metho dology
All of the data utilized for this report were provided by Milwaukee County staff or publicly available financial documents. We conducted no original research or inspections related to the state of parks, recreational, and cultural infrastructure, facilities, or equipment. While this limited our analysis of current asset condition and future needs to those identified and communicated to us by the county government, the fact that we are policy researchers – and not facilities professionals – restricted us in this regard.
For the purposes of this report, parks, recreational, and cultural infrastructure is defined as capital assets owned by Milwaukee County and utilized to provide recreational and cultural services to the public. Capital assets in this definition include the buildings and grounds of the Milwaukee County parks system, including the Mitchell Park Horticultural Conservatory (the Domes) and Boerner Botanical Garden; the Milwaukee County Zoo; and county-owned cultural facilities.
It is important to note that our analysis represents a "snapshot in time." The conclusions we reach on the condition of Milwaukee County parks, recreational, and cultural assets will change as additional needs are identified and/or project work is completed.
Finally, in assessing Milwaukee County’s needs with regard to its parks, recreational, and cultural assets, we focus on "capital" needs, as opposed to minor repair and maintenance needs that would be addressed in operating budgets. Capital needs typically refer to major repairs, rehabilitation, reconstruction, or replacement of facilities or equipment, and projects associated with those needs typically have a useful life of several years (and often several decades). In contrast, minor repairs and maintenance projects are included in annual operating budgets and typically include relatively inexpensive and short-term projects, like painting, light replacements, pothole patching, etc.

6
Cap ital Asset Ma nagement
A B r ief O verv iew
This report considers best practices cited by the Government Finance Officers Association (GFOA) on asset maintenance and replacement to understand and assess the manner in which Milwaukee County is managing the capital needs of its parks and cultural institutions. We often use documented best practices prescribed by respected organizations like the GFOA to serve as a measuring stick when assessing the performance of local governments.
GFOA defines capital assets as "major facilities, infrastructure, equipment, and networks that enable delivery of public sector services."xi Effectively managing capital assets involves rigorous and time-consuming effort to continuously assess their condition; plan for their maintenance, repair, and replacement; and develop sustainable financial mechanisms to assure that needed work is conducted on a timely basis.
The GFOA issued a "best practice" memo on asset maintenance and replacement in 2010. That memo describes a series of practices that local governments should establish for assessing and managing their capital assets, including the following:
● Inventory – Local governments should keep useful inventories of capital assets that include a regular assessment of the condition of each asset. GFOA suggests that a formal policy be developed to spell out inventory requirements and how the physical condition of assets will be measured. Condition ratings should be updated every one to three years.
● Reporting – Regular and effective communication on the state of capital assets is an integral part of effective management. In order to allocate funding for necessary projects, decision-makers must be fully aware of infrastructure needs. An effective reporting structure and strategy ensures that policymakers and the public have up-to-date information and understanding of capital assets’ states of repair.
● Capital planning and budgeting practices – GFOA suggests local governments prepare multi-year capital plans and establish ongoing sources of funds for asset-related needs. Capital plans and annual budgets should include sufficient funds not only for new projects and major repairs/replacement, but also for condition assessment and preventative maintenance.
GFOA Best Practice Description
Capital inventory A catalog(s) of publicly owned capital assets containing information describing the type of asset, value, costs, rating, usage, useful life, etc.
Reporting Structure and plan to report current conditions to elected officials.
Capital planning/budgeting A plan that budgets for capital projects in a span of several years in order to maintain infrastructure at useful and safe levels.
Financial policies Dedicated fees or other revenues solely for capital projects.

7
C ap ital Asset M an ag em ent o f P ark s an d Cu ltu ral In st i tu t io ns
Milwaukee County’s recreational and cultural asset portfolio is diverse and expansive. The county owns and manages most of the parks and trails within its borders and owns or supports numerous cultural institutions as well. The county’s Facilities Management Division catalogs all capital assets and maintains a portion of them.2
Some cultural institutions, such as the Milwaukee County Zoo and the Mitchell Park Horticultural Conservatory (the Domes), are owned and operated by the county. Other institutions may be owned by the county and operated by a nonprofit, such as the War Memorial Center and the Marcus Center for the Performing Arts. Those institutions in the latter category receive financial support for both capital needs and operations from the county, although the county does not provide all of their funding for those purposes.3
County assets are divided into separate categories that require different types of condition assessment. Parks, trails, and recreational assets are assessed with various tools to gauge the quality of their pavement, playgrounds, and green space, while buildings are evaluated using the county’s Facility Condition Index (FCI) and Replacement Index (RI). The RI reflects a building’s replacement value (RV), which is the amount it would cost to demolish and rebuild it based on its current physical structure and use.
Because the Milwaukee County parks comprise so many different types of assets, several different assessment methodologies are used by parks officials to determine the condition of their assets and the need for repairs or replacement. Below, we summarize those methodologies for Department of Parks, Recreation, and Culture (Parks Department) and cultural assets covered in this report.
Buildings
Milwaukee County’s Facility Condition Index (FCI) calculations help engineers and facilities professionals compare the general condition of the buildings they manage, which is essential for prioritizing needs and recommending how to allocate resources. Outstanding capital needs for a given building are aggregated and divided by the building’s replacement value to develop an FCI rating, which is meant to convey the current condition of the building to managers and policymakers.xii
2 Many of the county's cultural institutions are operated by independent nonprofit organizations that are responsible for building maintenance as well as programming. The zoo, a county department, also maintains its own facilities. 3 In 2016, the Milwaukee Art Museum took ownership of its buildings – including its portion of the War Memorial Center – and of O’Donnell Park, while the county retained ownership of the land. This arrangement is described in more detail later in this report. In addition, two nonprofit cultural institutions housed in county-owned buildings, the Milwaukee County Historical Society and the Marcus Center, separately own other property. Those properties (two historic sites and the Marcus Center parking garage) are not part of this report.

8
Table 1 shows how FCI ratings are distributed across the categories of "good," "fair," and "poor." A building in good condition has very few capital needs; a building in fair condition has moderate or some major capital needs; and a building in poor condition has extensive capital needs to the point where building replacement should be considered.
Table 1: FCI ratings by condition description category Condition description FCI
Good 0.0 – 0.049
Fair 0.05 – 0.1 Poor > 0.1
At times, the nature of needed building repairs may suggest the need for full replacement, but resources are not sufficient to allow for such action. In those cases, smaller capital projects may be identified that are deemed sufficient to keep the building in working condition. If that is the case, then the FCI can provide an incomplete picture of the building’s true condition, as it only will reflect the cost of the smaller capital repair projects as a percentage of the full replacement cost, and not the need for larger projects or full replacement.
At Milwaukee County, the FCI is used more as a planning tool than as a tool for assessing building condition.4 Often, the county’s version of FCI does not include the full range of projects needed to
4 The county uses an International Facility Management Association (IFMA) approved version of FCI for its own planning and maintenance purposes.
What i s cu ltu ral func t ion al ity?
In our last report, we found that one of the most difficult conditions for county leaders to assess is a building’s functionality. This assessment goes beyond the general condition of an asset to try to understand how well it is serving its intended function or purpose. The future use of the building also must be considered. Future efficiencies (and current inefficiencies) cannot be estimated with a high degree of confidence, especially when considering the possible costs to improve or replace an asset as large and costly as a mission-critical county building.
In this report, we find that cultural assets raise the degree of difficulty in determining building functionality. For these assets, we must also consider cultural functionality. Cultural facilities are judged on how well they can deliver their intended experience. Because county cultural facilities in a metropolitan area the size of Milwaukee are in competition not only with other venues in this region, but also with cultural venues in other regions of similar size, the leaders of these institutions must consider multiple factors, including:
• Does the facility meet current industry standards? • How does the facility rank among similar facilities in the area/region/country? • How effective is the current facility at attracting patrons and new revenue?
9
maintain the building's functionality, but only includes those needed to keep the building habitable until such time as replacement can occur.
To supplement the FCI, county engineers also use a Replacement Index (RI), which is a more thorough calculation of upcoming costs due to aging systems, typically within a 10- to 20-year window. Again, the cost of identified projects is divided by the building's replacement value to calculate the RI score. If the cost of identified future projects exceeds 50% of the building's replacement value in a 10- to 20-year window (i.e. it receives a score of 0.5 or above), then building replacement should be considered.
Milwaukee County conducts extensive record-keeping with regard to the condition of public buildings located within its parks, and of county-owned cultural facilities. Nevertheless, we observe some weaknesses with regard to capital asset management best practices, including the following:
● As noted above, the FCI does not serve as a reliable tool to assess the future capital repair and replacement needs of county buildings due to its primary use as a project planning tool. Consequently, if FCI scores are reported to policymakers, county staff should clarify that purpose in order to avoid confusion about building conditions.
● Neither FCI nor RI scores are regularly shared with policymakers, which means that budget staff and elected officials only learn about building-related capital needs through capital project requests or when major issues emerge.
● The nature and cost of major building repair projects often are not identified and/or shared with
policymakers if it appears that the building soon will need to be abandoned or replaced. This can skew decision-making regarding the need for and/or timeliness of building replacement. In addition, this gap in knowledge can preclude appropriate consideration during the five-year planning process of capital expenditures that may be required to keep the building operational in the near-term, particularly if building replacement decisions are delayed.
● Assessments are valid for up to five years after they are conducted, and as noted above, GFOA best practices call for updates every one to three years. But some buildings have not been assessed since 2002, if ever. This lack of up-to-date information negates the usefulness of FCI and RI ratings for these buildings and, as noted below, also presented challenges to us in compiling this report.

10
Paved assets
Parkways, park walkways, trails, parking lots, basketball courts, tennis courts, and service yards are assessed based on their pavement quality.5 The Parks Department uses a modified version of PASER, which is a pavement rating system generally used for county trunk highways. Paved surfaces are rated through visual inspections using PASER standards. When necessary, drainage assessments also are conducted and included in an overall rating.
Table 2 provides a brief overview of the rating system. Lower scores reflect more deteriorated conditions. Milwaukee County’s rating system for parks infrastructure helps to determine capital project priority by setting expectations for maintaining or reconstructing assets, based on the rating range into which they fall.
Table 2: Parks paved asset ratings by condition description category
Rating range Description
0-40 Reconstruct ASAP
41-60 Reconstruct 2 - 4 years
61-80 Reconstruct 5 - 10 years
81-90 Normal maintenance
91-100 Excellent condition
5 Paved off-road bicycle and pedestrian trails are part of the Oak Leaf Trail system, which also includes about 16 miles of paved off-road trails owned by other entities, 26 miles of bicycle routes on county parkways and 26 miles of bicycle routes on municipal streets. County parks feature another 51 miles of unpaved hiking trails, known as the Forked Aster Trail system. As used in this report, the term “Oak Leaf Trails” refers only to those paved off-road segments for which the county is responsible.

11
Condit ion of Cou nty-Owned Cultura l Assets County engineers provided data from their most recent condition assessments for 39 cultural assets. We only used condition assessment data for infrastructure assessed after 2012 and also filtered out structures of less than 1,000 square feet. That left 28 assets, including the most prominent Milwaukee County Zoo buildings, the Milwaukee Public Museum, Marcus Center for the Performing Arts, and a large portion of Historical Society buildings. Unfortunately, after filtering, our list did not include the War Memorial Center, the Milwaukee Art Museum, the Villa Terrace Decorative Arts Museum, or the Charles Allis Art Museum.
Consequently, for those county-owned cultural assets for which recent condition assessments were not available – and to supplement the available condition assessment data we did have – we gathered qualitative data through interviews with officials from each major organization. We also analyzed public documents outside of the budget and Comprehensive Annual Financial Report (CAFR), including reports from county departments and from consultants hired to assess facilities or advise on possible projects.
Table 3 shows the list of county-owned or county-supported cultural facilities covered in this report and the types of data we used to assess the condition of each.
Table 3: Data sources for cultural facilities
Facility Current FCI/RI available
Qualitative data collected
Milwaukee County Zoo Yes Yes
Milwaukee Public Museum Yes Yes
War Memorial Center No Yes
Milwaukee Art Museum No Yes
Marcus Center Yes Yes
Villa Terrace Decorative Arts Museum No Yes
Charles Allis Art Museum No Yes
Historical Center Yes Yes
Trimborn Farm Yes Yes
In the pages that follow, we summarize our condition assessments for each of the cultural facilities shown in the table. The War Memorial Center/Milwaukee Art Museum and Historical Center/Trimborn Farm each are considered under one subsection.

12
Snapshot: Condit ion of County-Owned Cultural Assets
Mi lwaukee County Zoo
FCI and RI ratings for major zoo buildings raise some concern, but a long-term capital plan that is already being implemented will produce significant physical and functional improvements. Also, previous long-term facility plans have resulted in relatively recent major investments in zoo assets.
Mi lwaukee Pub l ic Museum
Despite receiving nearly $10 million for repairs and updates in the past five years, the MPM building faces $30 million in deferred maintenance. Officials say upgrading the current building to meet their needs would cost $200 million, prompting a search for a new site.
War Memoria l Center & Mi lwaukee Art Museum
Since 2013, $15.5 million in county funds, plus private donations, have produced major improvements to the physical condition and functionality of both the WMC and MAM buildings. An additional $3.3 million in infrastructure investment at the WMC is needed from 2019 to 2022, however.
Marcus Center for the Performing Arts
The Marcus Center has seen nearly $12 million in county-funded capital investment since 2013, which has improved the physical condition of key buildings. Concerns remain, however, about the facility’s cultural functionality and needed investments to bring it up to the standards of a modern performing arts center.
Mi lwaukee County Historica l Society
Despite more than $10 million in capital investment in the society’s downtown historical center since 2002, including a major interior renovation, additional capital needs remain for the building’s exterior, and it is not sufficient to achieve all of the society’s goals. Separately, the county-owned and society-operated Trimborn Farm historical site is in poor condition.
Charles Allis/Villa Terrace Museums
Neither museum has seen county-funded capital improvements in the past three years, and both have significant deferred capital needs, including leaks that have required emergency repairs. The county has included several CAVT projects in its five-year capital plan, however.

13
M il wauk ee Co un ty Zo o – C ond it ion : Fa ir to goo d
The Milwaukee County Zoo has been operating at its current Bluemound Road location since 1958, but its roots date back to the late 19th century, when it first opened as the West Park Zoo in Milwaukee’s Washington Park. It expanded in the 1960s, when its major habitat exhibits were constructed. Other significant expansions have continued through the years, often as part of an overall renovation master plan. The zoo now consists of 145 buildings, with about 545,000 square feet of exhibit space, on a 190-acre site.
The Zoological Society of Milwaukee, established in 1910, has played a major role in the zoo’s development. The society is a nonprofit that, among other activities, raises funds to help meet the zoo’s capital and operating needs.xiii That has included two major capital campaigns in 1985 and 1999 that have been critical to upgrading the zoo’s infrastructure by raising a combined total of $56.5 million (split between the society and the county) to renovate old exhibits and add new attractions. Although other institutions have “friends” groups, the scope of the relationship between the zoo and the society sets the zoo apart from other publicly owned cultural institutions in Milwaukee County.
In response to our request, the county provided FCI/RI data on what it termed the 19 ”primary” zoo buildings, all from assessments completed within the last two years.6 For the 126 “secondary” structures, county officials indicated assessments were either more than 15 years old or, in the case of the newest buildings, had never been conducted. After screening out one building of less than 1,000 square feet, we were left with 18 buildings, with a combined replacement value of nearly $76.2 million.
Based on the FCI ratings, 46% of these structures are in good condition, 15% in fair condition, and 39% in poor condition. But by RI ratings, just 2% are in good condition and 98% should be considered for replacement within the next decade. Only the US Bank Gathering Place is rated good on both scales. Zoo leadership disputes some of these ratings and does not believe they accurately represent the impact of prior capital investments in five of these buildings (the Animal Health Center, Big Cats Feline Building, Giraffe Building, Katz Education Center, and Peck Welcome Center), but agrees that other buildings have issues that should be addressed.
Furthermore, according to Milwaukee County Zoo leadership, some of the zoo’s facilities need upgrades to improve cultural functionality. With both physical and cultural needs in mind, the zoo, in partnership with the society, in 2013 developed a new 25-year facility master plan, accompanied by a 10-year capital investment strategy. This is the zoo’s third such plan, and like the first two, it serves as a blueprint for major capital upgrades and renovations. The plan’s goal is not only to help the zoo remain sustainable in coming years, but also to increase its cultural functionality, allowing it to stay competitive and increase revenue.
6 In several cases, connected structures are counted and assessed as separate buildings, although they may appear to visitors as parts of a larger complex.

14
In the plan, the zoo has set a goal of raising $86 million from 2014 to 2023. Zoo leadership hopes the society and county each will provide 50% of the funding over those 10 years, as they did in the first two plans, although each project in the plan will require separate approval from each party. So far, the society has committed to raise a 50% share of all three phases of the Adventure Africa project, which will result in major renovations to the elephant, hippo, and rhino exhibits. The county has committed to the elephant phase and the zoo will request funding for the subsequent two phases in 2019 and future capital budgets. Overall, in the four years since the plan took effect, the zoo has spent $36.3 million on major capital projects, or 42% of the projected 10-year total.
With recent and ongoing capital improvements and what zoo leadership considers an attainable funding goal for the near future, the zoo’s infrastructure should receive substantial upgrades over the next several years. Nevertheless, issues raised by the recent FCI and RI ratings remain a source of concern. Considering the tough decisions that have faced the county in recent capital budgets, it is also possible that competing capital needs could make it harder to sustain the 10-year plan. County policymakers must weigh those costs against the investment in cultural functionality that zoo leadership believes is needed to remain competitive with other regional attractions.
M il wauk ee Pu bl ic M useum – C ond it ion : Fa ir to Poo r
The Milwaukee Public Museum (MPM) traces its history back to the founding of a natural history society at the German-English Academy in the mid-19th century. After the society outgrew its space, it donated its collection of artifacts and specimens to the City of Milwaukee. The city opened the public museum in 1884 in the Industrial Exposition Building, Milwaukee’s first convention center, then moved it to the Milwaukee Public Library in 1899 and to its current home in 1962. That building has grown several times since it was transferred to the county in 1976. Notable expansions were the 1995 addition of a wing to house the Discovery World museum,7 the 1996 opening of an IMAX theater and planetarium, and the 2000 opening of a two-story, glass-enclosed butterfly exhibit.
Today the MPM building totals more than 450,000 square feet and houses 17 permanent exhibits and 4.5 million specimens and artifacts. In addition to its permanent exhibits, the museum hosts traveling exhibits made possible through its accreditation by the American Alliance of Museums. While the county owns the building and the collection, the not-for-profit Milwaukee Public Museum Inc. operates the museum and curates the collection.
Severe financial troubles hit the MPM in the 2000s. A combination of excessive debt from the IMAX and butterfly wing projects; rising personnel and utility costs; and waning financial support from donors and the county led to deficits in the $7 million range in 2004 and 2005, followed by revelations that former leaders had depleted the museum’s endowment to pay day-to-day expenses. To pull out of the red, the MPM obtained $6 million in county-backed bank loans, reduced its staff by 45%, and sold its Tirimbina rainforest property in Costa Rica.8 Subsequently, to ensure its long-term
7 Discovery World moved to its own building on the lakefront in 2006. Its former space in the MPM building remains vacant. 8 The rainforest property was used for research purposes.

15
financial stability, the museum entered into a 2007 agreement with the county and its two main lenders to restructure and repay its debt, accompanied by 10 years of operating support and five years of capital support from the county.9
The museum has spent $9.8 million on a series of significant repairs and updates in the past five years, including $2.9 million on safety upgrades, $1.8 million to finish major electrical system work initiated in 2010, and $1.3 million for slab replacement in the Pioneer Village area. However, severe issues remain in the museum’s storage of specimens and artifacts, where the collection is threatened by leaking pipes, a lack of climate control, and outdated technology. Failure to address these issues could threaten the MPM’s re-accreditation by the museum alliance in 2020, and losing accreditation would end the traveling exhibits that have generated needed revenue.
MPM leadership also believes the current building no longer meets its needs for cultural functionality. More than 80% of exhibits are more than 30 years old, few incorporate modern technology such as touchscreens, and only 4% of the collection is on display. Moreover, despite the limited collection on display, the building is twice as large as MPM leadership believes it needs, especially considering the higher maintenance and operation costs that come with a larger facility.
Given the choice between renovating the current facility and finding a new home, MPM leadership has opted for the latter. County officials have identified $30 million in immediate deferred maintenance in the existing building, and the 2015 condition assessment projected total spending of $89 million from 2019 through 2038 to maintain the facility in its current condition. MPM leadership estimates that temporarily moving the collection to a more secure storage facility would add another $10 million to $20 million, and that upgrading the current building to meet all of the museum’s needs would bring the grand total to $200 million or more, in contrast to the $150 million to $200 million price tag of a new building. The search for a new site is now underway.
Plans for the move have led the MPM to seek changes in its financial relationship with the county. A 2013 agreement called for the county to continue paying MPM operating support of $3.5 million a year through at least 2022, but also provided for that amount to decrease if the museum did not meet certain financial criteria, which included raising $5 million for capital improvements. With the support of the county executive, MPM has asked the County Board to modify that provision to allow the museum to move forward with planning and fundraising for a new building while addressing the current building’s most immediate needs and finding a place to safely store its collection.
Even with the current planning effort and a capital campaign announced in 2017, however, major uncertainties remain. MPM leadership believes its fundraising goal can be attained only with substantial financial support from the State of Wisconsin, and potentially the county. Given that the state lacks a history of providing such support or of authorizing new funding mechanisms for locally owned cultural facilities, and given the county’s other infrastructure issues, the museum could face significant challenges in financing a new facility. Without a new building, the future of the public museum is in grave jeopardy.
9 The museum also launched a capital campaign that raised the money to repay its 2005 loan and replenish its endowment.

16
War M em or ial Cen ter/Milwauk ee Art M u seu m – C ond it ion : Go od
Milwaukee County’s War Memorial Center, completed in 1957, was designed by architect Eero Saarinen and built with $2.7 million in private funds. But the Milwaukee Art Museum’s roots date back to 1888, when Frederick Layton opened Milwaukee’s first permanent art gallery.xiv The gallery and a related organization, the Milwaukee Art Institute, later merged to become the Milwaukee Art Museum (MAM) and moved into the War Memorial when it opened.
The museum raised more than $7 million in private donations to build an addition, designed by architect David Kahler, that opened in 1975, more than doubling the size of the structure. Since then, the museum has expanded not only through the Kahler building addition, but also through the Quadracci Pavilion, designed by architect Santiago Calatrava and opened in 2001, and the east atrium, built in 2015.
Until recently, the land and the building (both the Saarinen and Kahler wings) were owned by Milwaukee County and operated by the nonprofit Milwaukee County War Memorial Inc. (WMI). The county provided operating and capital funds to WMI for more than two decades. The MAM, which had helped raise money for the Saarinen building and donated the Kahler addition to the county, directly owned the Quadracci Pavilion and leased the remainder of the museum space from the county at no cost.
Agreements reached in 2013 and 2016 dramatically changed the relationship between the county, WMI, and the MAM. In 2013, WMI and the MAM became distinct entities with their own governing bodies. Both entered into agreements with the county to establish lines of responsibility – including separate leases for their respective portions of the complex – and funding streams. One agreement obligates the county to provide no less than $1.9 million annually for WMI’s and MAM’s operating and capital costs through 2023.xv
Also in 2013, the county, the MAM, and WMI reached an agreement on repairs and improvements identified in a 2011 report by county auditors. The county agreed to provide $10 million for needed capital improvements funding for both WMI and MAM over five years, while the MAM agreed to raise $15 million to pay for the atrium project, which it subsequently donated to the county.
In 2016, the county, the MAM, and the WMI reached an agreement to transfer to MAM ownership of the Kahler addition, the atrium, the portions of the Saarinen building used by MAM, and the O’Donnell Park parking structure.xvi That agreement also transferred ownership of the portions of the Saarinen building occupied by the War Memorial to WMI.10 As part of the agreement, the MAM assumed responsibility for capital improvements, which are currently projected at $28.8 million, for those portions of the building it owns. It also plans to honor the agreement between the county and the Betty Brinn Children’s Museum, which is leasing the 10 The county retains ownership of the remaining areas of the Saarinen building, as well as all of the land beneath the buildings owned by the MAM and WMI. In addition, any structures owned by the City of Milwaukee on the premises were transferred to MAM, with the land still belonging to the city.

17
Miller Pavilion space atop the O’Donnell Park structure through 2028. The county also agreed to continue operations funding for the War Memorial from 2024 to 2033, although at a slightly reduced level.
Since the 2013 agreement, the county has provided more than $15.5 million in capital funding for the War Memorial and MAM, supplemented by more than $2 million contributed by WMI. Of that money, approximately $6 million has gone toward projects in the spaces occupied by the MAM in the Kahler addition and parts of the Saarinen building. The War Memorial projects have addressed such major repairs as upgrading the facility’s HVAC, structural improvements (to the concrete, exterior stairs, and substructure), and a roof replacement. Although the 2018 capital budget does not include any War Memorial projects, additional improvements estimated at $3.3 million are projected in the 2019-2022 plan.
Given all of the repairs to the War Memorial and the MAM over the past five years, we consider both facilities to be in good condition. The 2015 East Atrium addition has increased the MAM’s functionality, while many of the War Memorial’s structural and systems challenges have been addressed.
M arcu s C en ter for the perform ing arts – C ond it ion : Fa ir to Goo d
The Marcus Center for the Performing Arts was developed with $12.7 million in private funds and deeded to Milwaukee County, opening in 1969 as the Performing Arts Center. A capital campaign in the mid-1990s raised $26.5 million in private and county funds, with the largest single donation coming from the Marcus Corporation Foundation, after which the center was renamed for the corporation’s founder, Ben Marcus, and his wife, Ceil. The nearly 50-year-old complex is run by a nonprofit bearing the same name as the building. Arts groups such as the Milwaukee Symphony Orchestra,11 the Milwaukee Ballet, the Florentine Opera, and First Stage regularly perform in the center. The center also serves as a venue for Broadway and off-Broadway musicals, weddings, and special events. The center hosts more than 2,300 events annually.
Although the main building is in good condition, with no deferred major capital repair projects, Marcus Center officials view the building’s cultural functionality as adequate but not up to the standards of a modern performing arts center. They are considering future capital projects that would enhance cultural functionality with a more open design, an investment that would require a major boost in private fundraising. It also should be noted that the most recent assessment, in 2016, rated the outdoor Peck Pavilion in poor condition by both FCI and RI standards. However, Marcus Center leadership disagrees with these ratings and does not believe they accurately represent the impact of previous capital investments in the pavilion.
From 2013 to 2017, the county aided the Marcus Center with bond funding for a $7.2 million upgrade to the center’s HVAC system, $1.1 million in Uihlein Hall elevator work, and $1.6 million of a $2.6 million Vogel Hall renovation. The 2018 capital budget includes $1.9 million to renovate the 11 The Milwaukee Symphony Orchestra currently is constructing its own performance venue in Milwaukee’s downtown and will perform there when the renovated building is completed.

18
center’s Uihlein Hall stage lifts, one of a few infrastructure projects in a budget with a sharp decline in capital spending on parks, recreation, and culture.
In 2015, state legislation authorizing public funding for the new Milwaukee Bucks arena (now the Fiserv Forum) mandated that the Marcus Center be transferred to the Wisconsin Center District, subject to approval by the district’s board. This became an issue for county funding of the Marcus Center, as the County Board delayed appropriating money to complete the HVAC project while the building’s future ownership was in question.
In 2016, the County Board reached a new agreement with the Marcus Center, providing $7.3 million in operating funds and $9.8 million in capital funds over 10 years, including a $3.6 million capital improvements contribution in 2017.12 However, that agreement also provided that the county would cease all operating and capital payments to the Marcus Center if the district took ownership of the building. Because district leadership did not believe the district was in a financial position to take on operating and capital support for the Marcus Center, and because Marcus Center leadership saw the legislation as an impediment to long-term lease negotiations with the county, the Legislature repealed the takeover requirement in 2018.
Following the repeal, the county and the Marcus Center have negotiated a 99-year lease that will give the nonprofit a larger role in capital funding after the completion of the projects in the 10-year capital plan. The county will retain responsibility for utilities on the outside of the building and for the adjacent section of the Riverwalk. Previously, the county provided most capital funding, occasionally supplemented by private donations, while the nonprofit was responsible for day-to-day maintenance. The Marcus Center plans to launch a capital campaign in the near future to raise the funds needed to meet its expanded responsibilities.
M il wauk ee Co un ty H isto r ic al So ciety – C ond it ion : Fa ir to Poo r
The Milwaukee County Historical Society was founded in 1935 as a repository for county records, as well as other items relevant to local history. Its collection now consists of more than one million documents, about 1.5 million photographs, and more than 60,000 artifacts.
xviii
xvii Under state law, the nonprofit society is legally responsible for maintaining the county’s older records, although the records themselves are officially the property of the society, rather than the county. The society’s Research Center provides public access to these records.
For its first three decades, the society was housed in the Courthouse, but it outgrew its space there in the early 1960s. In 1965, the society moved to a new home, the former Second Ward Savings Bank, built in 1913 and donated to the county by First Wisconsin Bank.
Now known as the Milwaukee County Historical Center, that building was renovated at a cost of roughly $8 million in a project completed in 2011, with the expense funded about equally by the county and private donations. While this major project focused primarily on the historic building’s interior, significant capital issues remained on the exterior – a point underscored when a piece of 12 This amount was increased to $4.1 million in the 2017 adopted budget.

19
masonry fell off in 2012, prompting the county to spend $274,000 on emergency repairs and planning for long-term improvements. However, the county did not budget for cornice repair until 2016, when $2 million was appropriated, and work did not start until 2018. The county also appropriated $150,000 for grate work in 2016, but again work did not start until 2018.
Even with this investment of more than $10 million since 2002, society leadership estimates the Historical Center still has about $750,000 in deferred repair needs. Many remaining issues stem from the building’s location near the Milwaukee River, with a hollow sidewalk that is sinking, foundation pilings that must be kept wet, and mechanical systems located underground. A 2015 assessment rated the building as “fair” on the FCI scale, but with an RI score indicating it should be considered for replacement.
Furthermore, society leadership believes the building is not culturally functional and never will be. Only a small fraction of the society’s collection is on display there, but devoting more space to permanent exhibits would interfere with renting the building for weddings and other events, and those rentals provide a needed revenue stream for the society. This has led the society to explore options for displaying parts of its collection off-site, such as its Brew City MKE beer history exhibit at the Shops of Grand Avenue.
Until 2016, the county was responsible for the building’s exterior and its mechanical systems, but the society took over financial responsibility for all infrastructure projects (except for the county’s portion of the previously budgeted cornice project) under a new lease signed in February of that year. The county continues to own and insure the building, and is paying the society $54,000 a year for five years to assist with infrastructure costs.
The society is storing most of the county’s older records off-site in leased warehouse space. Society leadership considers that space inadequate for its needs, but says the current county operating contribution of about $200,000 a year is insufficient to either cover its current record-related costs (including Research Center operations) or to move the collection to a more suitable location. In response, the 2018 county budget set aside an additional $50,616 to address storage issues.
In addition to the county-owned Historical Center, the society operates four historical sites: Trimborn Farm and the Jeremiah Curtin House in Greendale, Kilbourntown House in Shorewood, and the Lowell Damon House in Wauwatosa. The county owns Trimborn Farm and Kilbourntown House, while the society owns the other two sites.
Trimborn Farm was built as a lime quarry and kiln by the Werner Trimborn family on a 10-acre site in 1851. In 1866, the family purchased the neighboring Curtin House, the first stone building in what was then the Town of Greenfield. Parts of the grounds were later used for dairy and sod farming, housing, an airstrip, and a riding stable. The society acquired the Curtin House in 1952, while the parks system acquired the rest of the farm as a historical park in 1980 and then turned it over to society management in 2004.xix
Society leadership is gravely concerned about the future of Trimborn Farm, where it estimates deferred maintenance and repairs at $2 million and where a 2014 assessment shows the Stone Barn in extremely poor condition. The county razed the property’s two silos after one of the

20
structures had deteriorated and was no longer structurally sound. County officials have not appropriated any money for Trimborn Farm in the past five years, while society leadership is reluctant to spend donors’ money on capital projects there in the absence of a lease. The county’s 2019-2022 plan projects $1.2 million in spending on the farm, primarily for Bunkhouse restoration and Stone Barn roof replacement.
By contrast, society leadership considers Kilbourntown House to be in excellent condition, thanks to the efforts of volunteers since a 2014 assessment rated the site “poor” by both FCI and RI standards. Carpenter Benjamin Church built the house in 1844 as his family’s home in Milwaukee. It was restored and moved to county-owned land in Estabrook Park by the federal Works Progress Administration in 1938.xx Under a pending lease, the county would be responsible only for the building’s foundation and mechanical systems, while the society would be responsible for the remainder of the building.
C harl es All is Art Mu seu m/V il l a Terrac e D eco rat ive Arts Mu seu m – C ond it ion : Fa ir
The Charles Allis Art Museum (CAAM) was completed in 1911 as a mansion for Charles Allis, the first president of Allis-Chalmers Co., and his wife, Sarah. According to the CAAM’s written history, the mansion was built specifically to house the Allis art collection and to eventually become a museum for the benefit of the public.xxi After the deaths of Charles and Sarah Allis, the mansion was donated to the city and operated by the Milwaukee Public Library until it was transferred to the county as an art museum in 1979.
The Villa Terrace Decorative Arts Museum (VTM) was completed in 1923 as the home of Lloyd Smith, president of the A.O. Smith Corp., and his wife, Agnes. In 1966, 22 years after Lloyd Smith’s death, his widow donated the mansion to the county to serve as a public decorative arts museum.xxii
Both the VTM and the CAAM were originally part of the Milwaukee County War Memorial Corp., but the jointly operated museums now have their own board of directors with one executive director and a small staff. They formed a separate nonprofit organization, Charles Allis and Villa Terrace Museums Inc. (CAVT), in 2012.
In the last five years, the county has appropriated $961,000 for capital improvements at the CAAM, all of it in 2014 and 2015, with no capital funds going to the VTM. The county’s five-year capital improvements plan includes $4.4 million in anticipated CAVT projects, with $4 million (90%) of that total to be used for the CAAM. The list of future projects includes façade repair and roof replacement for the CAAM and roof repairs at the VTM.
Despite these recent and planned appropriations for capital projects, current funding may not be enough to take care of the capital needs of the CAAM and the VTM. County engineers have been using outdated condition assessment information to plan capital projects. Without current

21
assessment information, it is difficult for county officials to properly determine the funding needed for projects in the pipeline.13
Additionally, major capital projects for the CAAM have been deferred in prior years, including 2018, when projects totaling more than $2.5 million were moved to 2019. The adopted 2018 county operating budget notes that this deferral has taken a toll, forcing CAVT to use operating funds to repair critical leak damage, address safety hazards, and upgrade air conditioning systems at both museums. More unbudgeted work is needed in 2018 to deal with leak damage at the CAAM.
Beyond their structural needs, both museums face the question of how to improve their cultural functionality. As is the case with most cultural institutions owned by the county, the CAAM and VTM need to remain competitive with the region’s similar venues. In such historic buildings, the capital costs could be relatively high if these institutions are to maintain their historical integrity while also upgrading their infrastructure to keep up with changing art museum standards and technology.
13 2003 was the last year that county staff conducted condition assessments for the CAAM and VTM.

22
Condit ion of Cou nty Park s and Recreat i on Asset s
Milwaukee County’s parks system is 110 years old, dating to the establishment of the Milwaukee County Park Commission on August 20, 1907.xxiii Parks and recreational facilities occupy 15,325 acres of county-owned land, including 158 parks and 11 parkways.
Snapshot: Condit ion of County Parks and Recreation Assets
The Domes
A recent report cited $20 million to $30 million of deferred repairs at the Domes, and permanent solutions still have not been identified for issues that caused a temporary closure in 2016. A task force is considering options ranging from major renovation to complete reconstruction or full replacement.
Parkways
More than 16.5 of the county’s 63 miles of parkways are in need of immediate reconstruction, while another 29 miles need reconstruction within the next decade. Parkway reconstruction can cost more than $1 million per mile.
Park ing Lots
Approximately 39% of parking lots (by square footage) should be considered for reconstruction immediately, while another 46% need reconstruction in the next two to 10 years. An exception is McKinley Marina, where significant parking lot reconstruction has occurred.
Park Walkways
About 12% of the 108 miles of park walkways are in need of immediate reconstruction, while another 65% need reconstruction in the next two to 10 years. The county has not appropriated capital funds for walkways in either of the past two years.
Basketball & Tennis Courts
About 48% of the county’s 95 tennis courts and 54% of its 82 basketball courts need reconstruction within the next decade. The county has not appropriated capital funds for tennis or basketball courts in either of the past two years.

23
The system includes a wide variety of paved assets, including parkways, pedestrian and bicycle trails, tennis and basketball courts, and parking lots. Its unpaved assets include traditional parks, golf courses, dog parks, beaches, playing fields, waterways, and playgrounds. The system also operates hundreds of buildings and other structures, as well as regional cultural/educational attractions (Boerner Botanical Gardens, Wehr Nature Center, and the Domes), marinas, water parks, swimming pools, and splash pads. The county’s parks/recreation infrastructure is operated and maintained by its Parks Department, with an annual operating budget averaging $42.4 million over the past five years.
In this section, we discuss the condition of assets maintained by the Parks Department. Condition assessments for these assets generally are conducted by the county’s Facilities Management Division, which is part of the Department of Administrative Services. In response to our request for assessment data, the county provided two sets: one for buildings and the other for paved surfaces. Data were unavailable, incomplete, or not current for several other types of assets, specifically water parks, pools, splash pads, unpaved assets, and marina infrastructure (other than buildings and parking lots).
b uil d ing s
Within its parks system, the county owns 443 buildings, most of which are smaller than 1,000 square feet. After filtering the county-provided list to include only those buildings larger than 1,000 square feet that have been assessed since 2012, our list was reduced to 95 buildings.14 Together, these 95 buildings have a total replacement value of $112 million.
As shown in Chart 1, the identified park buildings in poor condition by FCI rating – i.e., those in need of immediate repair or replacement – total almost $60 million in replacement value (RV), while those in fair condition account for another $14 million worth of RV, yielding a combined total of nearly $74 million in RV for larger park buildings in fair and poor condition.
The results are similar when we look at the replacement index (RI), which helps county facilities professionals quantify how much money would be needed to replace facilities in future capital projects. Eighteen of the buildings on our list should be considered for replacement, at a total value of approximately $54.2 million (as also shown in Chart 1). Another seven buildings are nearing replacement, with a combined value of $14.8 million, for a total of $69 million worth of facilities that need replacement now or in the near future. The remaining 70 larger buildings, with a total replacement value of $43 million, are in good condition and should not be considered for replacement anytime soon.
14 Although the Domes has not been assessed since 2004, we included it in our list because of the likelihood that it must be renovated or replaced soon. We also included the Kosciuszko Park Community Center, which is in need of $4 million worth of repairs in the next five years, mainly for HVAC replacement.

24
Chart 1: Replacement value of county parks buildings by condition (in millions)
Source: Milwaukee County * $39.6 million of the RV for poorly rated facilities is attributed to one facility: the Domes.
In both cases, however, it should be noted that a single major facility – the Domes – accounts for $39.6 million of the RV for park buildings in fair or poor condition, or needing replacement now or in the near future. If we remove the Domes from the list, a majority of the RV of larger park buildings would be in good condition, and we would rate the overall condition of all 94 such buildings as fair. In light of recent concerns about the Domes’ future, we take a more detailed look below at that facility’s specific issues.
As stated earlier in this report, the FCI does not take a facility’s functionality into account. But if some of its facilities were to be replaced, the county likely would consider functional upgrades in the form of better technology, newer materials, and more effective designs, all of which can carry substantial capital costs.15 While many parks facilities are utilitarian storage and maintenance structures, cultural functionality is an important consideration for those that directly serve the public, such as the Domes, the Boerner Botanical Gardens Education and Visitors Center, the Wehr Nature Center, the Milwaukee County Sports Complex, and the community centers.
Over the past five years, the county has appropriated $6.5 million for capital projects at park buildings other than the Domes. Most of this money was spent in 2015 and 2016, when the largest projects were a $1.9 million replacement of the HVAC system at the Sherman Park Boys and Girls Club and $913,000 in work on the Washington Park Bandshell.
15 Capital improvements can affect operating budgets in different ways. Upgrading functionality often leads to efficiencies that can reduce costs and/or increase revenue, but expanding a facility also may increase operating costs.
$38.1
$14.0
$59.9*
$43.0
$14.8
$54.2*
Good Fair Poor
FCI
RI

25
Mitchell Park Horticultural Conservatory (The Domes) – Condition: Poor
Construction of the Mitchell Park Horticultural Conservatory, also known as “The Domes,” started in 1959 and was completed in 1967, at a cost of $4.5 million. It took longer than most other building projects, largely because the county opted to build it in stages to avoid bonding. The conservatory’s roots go back to 1898, when a greenhouse stood where the Domes stand now. That building was used until 1955, when the county determined that it had deteriorated beyond repair, and demolished it.xxiv
The county’s last condition assessment of the Domes was in 2004, when the facility’s FCI and RI ratings were both poor. Since then, the county has invested $600,000 in 2006 and $700,200 in 2009 to repair structural deterioration and increase cultural functionality, respectively.16 Also, following a 2006 explosion at the nearby Falk Corp. plant, 750 glass panels were replaced at a cost of $2.6 million. The last major improvements to the conservatory were completed in 2008-2009, when LED lighting was installed atop the Domes. The lighting installation, funded by $500,000 in private donations, was coupled with a handful of county-funded capital projects that enhanced circulation and visuals. The county also appropriated $390,049 for electrical system work in 2015.
However, additional capital projects have been pushed back over the years. A recent report by HGA Inc. and ConsultEcon Inc. identified between $20 million to $30 million in deferred repair work. Since 2012, cracked glass and loose concrete have forced a series of short-term repairs, culminating in a temporary closure of the Domes for much of 2016, when the county installed protective wire mesh netting to protect visitors from falling chunks of concrete. This crisis led the county to appoint a task force to consider the long-term future of the facility, with the active involvement of the conservatory’s nonprofit support group, the Friends of the Domes.
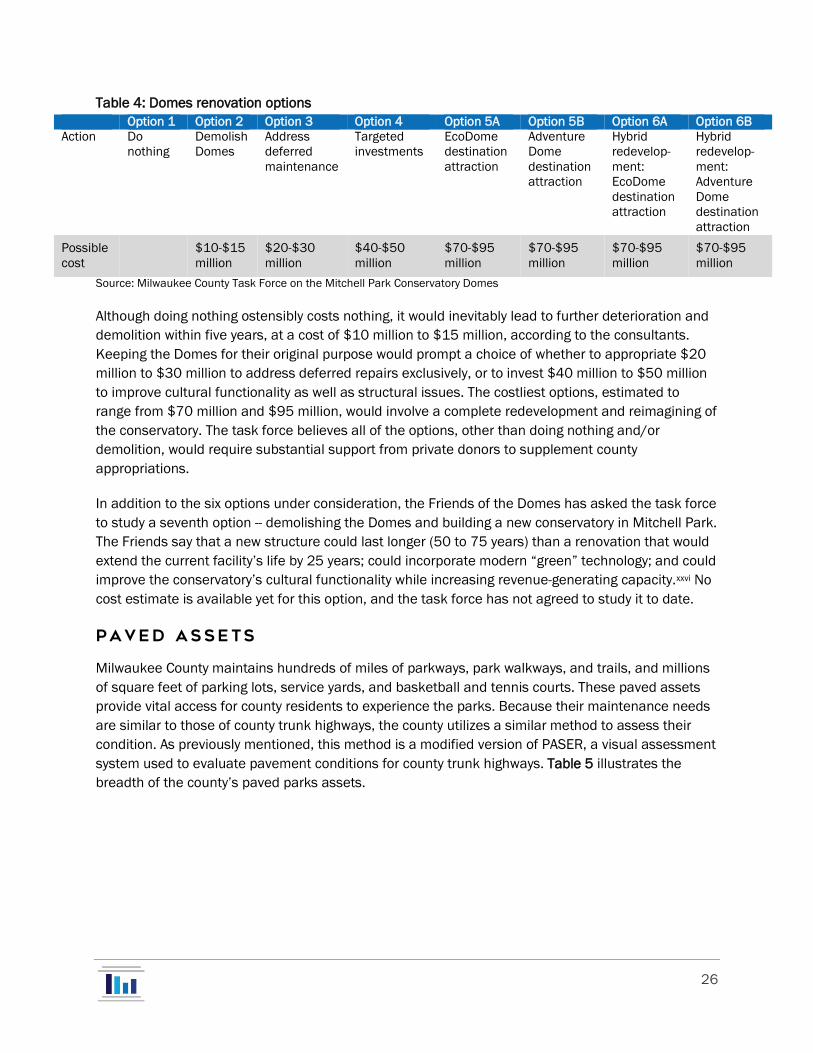
That study suggests that the conservatory is in need of major renovation, a complete reconstruction, or full replacement. The county is considering six options, shown in Table 4, which include doing nothing, demolition, or reinvestment. The potential costs of these choices would range from $10 million to $95 million.17 During a February 20, 2018, meeting of the Milwaukee County Task Force on the Mitchell Park Conservatory Domes, members informally voted on each option, scoring the dramatic overhauls of Options 5 and 6 as their top-ranked choices, followed by the targeted investments of Option 4. Options 1 (do nothing) and 2 (demolition) received no votes.xxv
16 The 2009 investment shows up in Milwaukee County’s 2010 Adopted Capital Budget, but is not in the 2009 Adopted Capital Budget. 17 The task force notes these are “order of magnitude” estimates only, because the options have not been defined and studied in detail.
26
Table 4: Domes renovation options
Option 1 Option 2 Option 3 Option 4 Option 5A Option 5B Option 6A Option 6B Action Do
nothing Demolish Domes
Address deferred maintenance
Targeted investments
EcoDome destination attraction
Adventure Dome destination attraction
Hybrid redevelop-ment: EcoDome destination attraction
Hybrid redevelop-ment: Adventure Dome destination attraction
Possible cost $10-$15
million $20-$30 million
$40-$50 million
$70-$95 million
$70-$95 million
$70-$95 million
$70-$95 million
Source: Milwaukee County Task Force on the Mitchell Park Conservatory Domes
Although doing nothing ostensibly costs nothing, it would inevitably lead to further deterioration and demolition within five years, at a cost of $10 million to $15 million, according to the consultants. Keeping the Domes for their original purpose would prompt a choice of whether to appropriate $20 million to $30 million to address deferred repairs exclusively, or to invest $40 million to $50 million to improve cultural functionality as well as structural issues. The costliest options, estimated to range from $70 million and $95 million, would involve a complete redevelopment and reimagining of the conservatory. The task force believes all of the options, other than doing nothing and/or demolition, would require substantial support from private donors to supplement county appropriations.
In addition to the six options under consideration, the Friends of the Domes has asked the task force to study a seventh option -- demolishing the Domes and building a new conservatory in Mitchell Park. The Friends say that a new structure could last longer (50 to 75 years) than a renovation that would extend the current facility’s life by 25 years; could incorporate modern “green” technology; and could improve the conservatory’s cultural functionality while increasing revenue-generating capacity.xxvi No cost estimate is available yet for this option, and the task force has not agreed to study it to date.
P aved assets
Milwaukee County maintains hundreds of miles of parkways, park walkways, and trails, and millions of square feet of parking lots, service yards, and basketball and tennis courts. These paved assets provide vital access for county residents to experience the parks. Because their maintenance needs are similar to those of county trunk highways, the county utilizes a similar method to assess their condition. As previously mentioned, this method is a modified version of PASER, a visual assessment system used to evaluate pavement conditions for county trunk highways. Table 5 illustrates the breadth of the county’s paved parks assets.

27
Table 5: Milwaukee County paved parks assets Capital Asset Quantity
Parkways 63 miles
Parking Lots 6.4 million ft2
Park Walkways 108 miles
Oak Leaf Trails 60.3 miles
Service Yards 0.7 million ft2
Tennis Courts 95 courts
Basketball Courts 82 courts Source: Milwaukee County Parks Department
Parkways – Condition: Fair to Poor
Milwaukee County must maintain approximately 63 miles of parkways to keep its parks accessible to both residents and maintenance crews. More than 16.5 miles of parkways have been designated as immediate reconstruction targets, while another 29 miles may need reconstruction in the coming two to 10 years. As shown in Chart 2, that amounts to 73% of parkways that should be considered for reconstruction within the next decade. Another 26% are either in excellent condition or only require normal maintenance, while the remaining 1% have not been rated.
Chart 2: Percentage of parks paved assets needing reconstruction within 10 years
Source: Milwaukee County Parks Department
Paying for reconstruction and rehabilitation of nearly three-quarters of the county’s parkway system over the next 10 years could pose a formidable challenge. For example, in 2017, the county issued $823,000 in bonds to rebuild less than half a mile of the Kinnickinnic River Parkway. From 2013 through 2017, the county appropriated an average of $2.8 million annually for parkway
85% 85%
75% 73%
54% 54%48%
Parking Lots Service Yards Park Walkways Parkways Oak Leaf Trails BasketballCourts
Tennis Courts

28
reconstruction and rehabilitation, with just three parkways (KK River, Milwaukee River, and Menomonee River) accounting for 94% of the $14.1 million spent in those five years. No parkway capital funds were budgeted for 2018.
Parking Lots – Condition: Poor
A major subject of contention in recent months was a county proposal to charge a parking fee in county parks. Although the proceeds from the fee would not have been earmarked for parking lots alone, and the proposal ultimately was withdrawn after public outcry, it is noteworthy that the county still needs to find millions of infrastructure dollars to preserve these lots and the access they provide to the parks.
As shown in Chart 2, nearly 85% of the parks system’s parking lots (by square footage) may need reconstruction in the coming years. Specifically, more than 2.5 million square feet should be considered for reconstruction as soon as possible, and another 2.9 million square feet should be considered for reconstruction within the next decade, for a total of 5.4 million square feet of paved surface in potential need of reconstruction.
However, this total square footage may be reduced to 4.4 million by marina lot projects. In the last five years, including 2018, the county spent a total of $3.7 million on parking lots in the parks. While nothing was appropriated for these assets in 2014 or 2015, subsequent years saw a significant investment in the two marinas’ parking lots, with $1.2 million for the South Shore Park/Marina lot and $2.5 million for the McKinley Marina lots. Projections call for spending about $7 million more on the McKinley lots from 2019 through 2022. Although the McKinley Marina lots are the largest in the parks system, at more than 815,000 square feet combined, and the South Shore lot is almost 182,000 square feet, these two marina lot projects together still represent less than 19% of the parks system’s parking lot reconstruction needs, at a total cost of more than $12 million.
Park Walkways – Condition: Fair
Milwaukee County maintains 108 miles of park walkways, which are extensively utilized by parks visitors. As Chart 2 shows, maintenance issues loom for more than three-quarters of this highly visible infrastructure within the next decade.
Forty-three miles (40%) of park walkways are projected to need reconstruction in the next five to 10 years; another 27.4 miles (25%) are projected to need reconstruction in the next two to four years; and 12.4 miles (12%) currently need attention. Almost a quarter of park walkways (22%) are in excellent condition or need only normal maintenance in the years to come. From 2014 through 2018, the county appropriated $1.75 million for park walkway projects, an average of less than $350,000 a year, with all of the spending concentrated in 2014 and 2016.

29
Oak Leaf Trails – Condition: Fair to Good
Much of the biking and hiking in Milwaukee County’s parks takes place on its 60.3 miles of Oak Leaf Trails, 48.3 miles of which have been assessed.18 These assets are currently in good condition, but with looming reconstruction needs in the next five to 10 years. As shown in Chart 2, the county projects 54% of rated trails will need reconstruction within the next decade. Over the past five years, the county has appropriated $3.1 million for trail projects, none of it in 2017 or 2018. Because that total included $1.1 million for expansion, spending on reconstruction averaged $406,000 a year.
Service Yards – Condition: Poor
Milwaukee County’s parks service yards are utilized primarily by county employees to service and store capital assets, such as Parks Department vehicles. As Chart 2 shows, 85% of the county’s service yards will need reconstruction in the next decade. Of particular concern is that 524,529 square feet (73%) of its 707,544 square feet of service yards currently should be considered for reconstruction. The county has appropriated only $106,000 for service yard projects in the past five years, and all of that money was spent in 2015.
Tennis Courts – Condition: Fair
Milwaukee County has 95 tennis courts throughout its parks system. Chart 2 shows that slightly less than half (46) are going to need reconstruction within the next decade. That includes 19% (18) that are in need of reconstruction as soon as possible. Almost one-third of the courts (31) are in excellent condition and 19% (18) are only in need of normal maintenance. Over the past five years, the county has appropriated $553,600 for tennis court projects, all in 2014 and 2015.
Basketball Courts – Condition: Fair
Milwaukee County has 82 basketball courts throughout its parks system. As we see in Chart 2, slightly more than half are going to need reconstruction within the next decade. Almost one-third of the courts (25.5) may need reconstruction in five to 10 years, while another 23% (19) of courts need reconstruction in two years or less. By contrast, 21 courts are in excellent condition and 16.5 courts only require normal maintenance. The county has appropriated $690,600 for basketball court projects over the past five years, with all of that money spent in 2014 and 2016.
O ther Assets
In addition to the buildings and paved assets discussed above, the county’s vast parks system includes numerous other assets for which current condition assessments are incomplete or unavailable, if indeed they were ever conducted at all. As previously noted, this includes water parks, pools, splash pads, unpaved assets, and marina infrastructure other than buildings and parking lots.
18 Condition ratings are not available for newer trail segments or for those paved in concrete, rather than asphalt.

30
However, this lack of condition assessments has not precluded the county from spending money on these assets. While some unpaved assets, such as green space and beaches, often require only normal maintenance, other assets have been the subject of millions of dollars in capital projects.
One prominent example would be the county’s aquatic assets: water parks, swimming pools, and splash pads. They have been the focus of extensive budget debates over the years, as county policymakers have weighed operating costs and potential capital expenditures against attendance and revenue; adjusted fees and hours; closed some pools, expanded others into water parks and downgraded still others to splash pads. In the past five years alone, the county has appropriated $3.7 million for pool and water park projects, all in 2014 and 2015. Yet no current FCI/RI data on the pools’ physical condition has informed this high-profile and often heated public debate.
Similarly, in the five most recent capital budgets, the county has appropriated $5.7 million for park bridges, with nothing spent in 2014 or 2016; $2.4 million for golf courses, all in 2015; $1.7 million for playgrounds, none of it in 2018 (although $185,000 was appropriated through the carryover process that year for the Cathedral Square playground); another $1.7 million for marina infrastructure, all in 2014 and 2015; $1.1 million for river projects, all in 2016 and 2017; $524,400 for baseball diamonds, all in 2016; and $500,000 for a 2015 lighting project.
Total capital spending on these miscellaneous parks assets, therefore, totals $17.5 million over the past five years. For comparison purposes, this sum is more than twice the $7.2 million spent on park buildings, and nearly three-quarters as large as the $23.7 million spent on parks paved assets in the same period.

31
Cap ital F inance
A B r ief O verv iew
Most local governments that own large inventories of physical assets maintain separate capital budgets and rely on financing strategies to support those assets that are distinct from the budgets and strategies used to support general operations. The key distinction is the use of borrowing – typically in the form of issuing General Obligation bonds19 – to ensure that investment in asset creation, repair, or replacement can be paid off over multiple years.
Many governments have several reasons why they maintain separate processes for planning, budgeting, and financing capital projects – and why they engage in borrowing to support those projects. One is that the costs of capital projects can be prohibitive if addressed in a single payment in an annual operating budget. In addition, because capital assets have useful lives that can extend for decades, the use of multi-year forms of financing can ensure that those benefiting from the assets in the years following their creation or replacement share in their costs.
In determining how often to issue debt and how much debt is affordable to issue, local governments take into account a variety of considerations, including the size of their tax base and the ability of annual operating budgets to accommodate principal and interest payments. Often, the ability to issue new debt in a given year is predicated by the amount of old debt that is retired in that year. Also, in many jurisdictions – including municipalities and counties in Wisconsin – state law prescribes debt limits for local governments.
19 General Obligation (G.O.) bonds are municipal bonds commonly used by local governments that are secured by the government's pledge to use its taxing power to repay bond holders. These differ from "revenue bonds" in that they are not secured with a specific form or revenue (such as fees from users of the capital project), but instead are backed with the government's general credit and taxing authority.
What i s a c ap ital project?
Confusion often arises about when an infrastructure repair project is deemed a "capital" project and when it is deemed a "maintenance" project. This is an important distinction, because capital projects appear in capital improvements budgets and often are financed through borrowing, while maintenance projects typically appear in operating budgets and are funded with annual departmental appropriations.
Generally speaking, capital projects are those that involve construction, expansion, renovation, or replacement of a new or existing facility; purchase of a major piece of equipment that has a useful life of several years; or a major maintenance or rehabilitation project that has an economic life of several years. In each of these cases, the definition often includes a dollar threshold (e.g., the project or equipment purchase has to exceed $10,000 or, as is typically the case for Milwaukee County, $100,000). Conversely, "maintenance" projects typically involve relatively minor repairs such as fixture replacement or painting.

32
Capacity for future borrowing often is gauged with multi-year capital plans and budgetary forecasts, which catalog future capital needs and project how they will need to be financed. Borrowing projections can be compared to projections of future debt service payments and the amount of debt that is scheduled to come off the government's books. Borrowing capacity also can be affected by the interest rates associated with G.O. bonds and other forms of debt, as those determine the affordability of annual debt service payments.
C ap ital F in an c e in M ilwau k ee Co un ty
Capital Budget Process & Policies
Every year, the Milwaukee County executive recommends a Capital Improvements Budget (CIB) for County Board consideration and approval. The county’s CIB is a distinct document from its operating budget. It includes not only the recommended budget for the upcoming year, but also an updated five-year capital improvements plan.
The process begins with submission of requested capital projects by county departments. Those requests are considered first by the county’s Capital Improvements Committee (CIC), which consists of three members of the County Board, two department heads, the county comptroller, and two municipal officials appointed by the Intergovernmental Cooperation Council. The CIC recommends projects for inclusion in the county executive’s recommended budget, but he is not required to adhere to those recommendations. The county's capital budgeting process is depicted in Figure 1.
Figure 1: Milwaukee County capital improvements budgeting process
County Departments
Capital Improvements Committee
County Executive County Board
County Executive

33
Departmental capital requests are judged by the CIC based on specific criteria and a scoring system that prioritizes immediate need and public safety. Other criteria include annual impact on operating costs; impact on deferred maintenance; whether the project is necessary to address Americans with Disabilities Act (ADA) requirements and/or building code violations; the availability of non-county funding to initiate and complete the project; and whether the requested project is a continuation of a project initiated in a prior year.
Milwaukee County must adhere to debt limits stipulated by the Wisconsin Statutes. The statutes prescribe both a limit on overall G.O. debt, which cannot exceed 5% of the county's property value, and on the annual amount of property tax levy that can be used to support G.O. debt. At the end of 2016, the county's $609 million of net outstanding G.O. debt amounted to only 20% of its $3 billion debt limit.xxvii
More important than statutory limitations on the county’s capacity to engage in capital financing is a policy established by County Board resolution that establishes an annual bonding cap. That cap dictates that the bonding amount in a given year not exceed a 3% increase over the previous year's amount. If that policy is followed, Milwaukee County will be able to issue about $43.6 million of G.O. debt in 2019, with that number rising to about $48 million by 2022.
2018 Milwaukee County Capital Budget
Milwaukee County’s capital budget totals $92.4 million in 2018. Of that amount, $38.8 million is for General Mitchell International Airport, which functions as an enterprise fund. While the county pays for capital projects and issues debt on behalf of the airport, debt service is paid by the airlines that use GMIA as part of their lease agreements, and cash-financed projects are fully reimbursed through federal and state sources and passenger fees.
The remaining $53.6 million for non-airport capital projects is financed with a mix of G.O. bonds, grants or contributions from other governmental or private entities, a small portion of the revenues collected from the county's $30 vehicle registration fee, and sales and property tax revenue. Chart 3 shows the budgeted sources of funds for the county's 2017 and 2018 CIBs. G.O. bonds comprise the biggest portion of the county's capital revenue mix, totaling $39.6 million in 2018 (74% of the total budget). “Outside contributions” decrease significantly in 2018 because the 2017 budget included an anticipated $18 million federal contribution for bus rapid transit.20
20 Outside Contributions are a combination of federal, state, and private contributions that go toward capital projects.

34
Chart 3: Sources of funding in 2017 and 2018 Milwaukee County capital improvements budgets
Source: Milwaukee County 2017 and 2018 Capital Budgets
The county breaks down its capital budget by functional category, with parks projects grouped together and cultural projects divided by institution. The county’s 2018 CIB appropriates a combined $8.6 million in cultural and parks projects. The three cultural projects will replace a fire panel ($2.7 million) and the Pioneer Village slab ($1.3 million) at the Milwaukee Public Museum and modernize Uihlein Hall stage lifts at the Marcus Center for the Performing Arts ($1.9 million), all financed through G.O. bonds. For the parks, the county is borrowing $2.1 million to rebuild McKinley Marina’s parking lots and spending $575,077 on three smaller projects that involve planning for the future of the Domes, and bridge and electrical work at other parks.
$0
$5
$10
$15
$20
$25
$30
$35
$40
$45
Bonds OutsideContributions
Sales Tax Property Tax Vehicle RegistrationFee
Mill
ions
2017
2018

35
F inanc ia l Capac ity to Ad dress Parks , R ecreat io nal , and Cultura l Infras tructur e Needs In this section, we analyze recent capital spending by Milwaukee County on the assets covered in this report; and we use that context – as well as a review of the county’s current capital budgeting climate and its multi-year capital plans – to assess its fiscal capacity to address its future parks, recreational, and cultural infrastructure needs. The boxes below summarize our findings.21
Snapshot: County Fiscal Capacity to Address Cultural Asset Capita l Needs
The county should be spending $9.5 million annually from 2019 to 2022 to address identified cultural asset capital needs, which appears manageable given the average of $10.8 million budgeted from 2013 to 2018. However, the 2018 budgeted amount was the low point for the period and would have to nearly double in 2019 to satisfy existing requests. Also, future spending may need to increase significantly, depending on the outcome of the Milwaukee Public Museum’s efforts to identify a site and secure state and private contributions for a new building.
Snapshot: County Fiscal Capacity to Address Parks & Recreation Capital Needs
The county should be spending about $39 million annually from 2019 to 2022 to address identified parks & recreation capital needs, or almost four times more than it budgeted during the preceding six years and 16 times the 2018 budgeted amount. Also, that projected amount includes $20.5 million for the Domes, which is far lower than the $40 million to $95 million cost of some of the renovation/replacement options being considered by a special task force.
C ap ital F in an c e En v ironm en t
The county's ability to finance its parks, recreational, and cultural infrastructure needs is jeopardized by an extremely challenging capital finance environment. The primary contributing factors are its self-imposed bonding cap and the fierce competition among its various departmental capital needs.
As discussed above, the county's bonding cap dictates that non-airport G.O. bonding will not increase by more than 3% annually from the previous year. The cap was established to ensure that G.O. debt
21 It is important to note that our assessment of financial capacity is limited to our analysis of fiscal issues, and does not reflect the county’s human resource capacity to perform needed infrastructure work.

36
service obligations would not threaten the county's ability to sufficiently finance its operational needs. As noted above, the county's non-airport G.O. bonding cap will be $43.6 million for 2019.
xxviii
22 The county has a related policy goal to provide a 20% cash match to G.O. bonding amounts. If the county meets that goal in 2019, then it would cash finance an additional $10.9 million on non-airport capital projects, for a total of $54.5 million in locally generated capital financing capacity.
The inadequacy of that capacity – both in 2019 and in future years – becomes clear when measured against the county's capital needs. Chart 4 shows the county’s anticipated annual non-airport capital funding totals, based on projects requested for the 2018-2022 Capital Improvements Plan, and compares those amounts with the county's capital financing capacity (as defined by the bonding limit each year plus a 20% cash match). As indicated in the chart, the county's projected local financing needs greatly exceed its available capacity in each of the four years remaining in that five-year period. Also, this chart may understate the magnitude of the challenge, as it is possible that new capital projects identified in the intervening years will widen the gap between now and 2022.
Chart 4: County’s anticipated annual non-airport capital funding totals (in millions)
Source: Milwaukee County budget documents The huge increase in spending for requested projects in 2022 (as well as about $20 million in spending in 2021) results from a single project: a plan to demolish the decaying Safety Building and replace it with a new criminal courthouse facility, the cost of which is estimated to exceed $250 million.xxix But even before that project is initiated, the chart shows that the county’s capital budget climate will be fiercely competitive in the next two years, because the totality of its infrastructure needs will far exceed its available local borrowing and cash financing capacity. In particular, as has been documented in our previous research, addressing the infrastructure needs of county buildings, buses, and roads will pose stiff competition for county parks, recreational, and cultural facilities.xxx
22 In 2017, after the zoo’s Adventure Africa exhibit progressed more quickly than anticipated, the county moved up $2.7 million in bonding authority from 2018 to 2017. The 2018 bonding cap was reduced by a corresponding amount to $39.4 million, but the 2019 cap is still calculated from the original $42.3 million.
$148.5$114.8 $101.1
$335.0
$0
$50
$100
$150
$200
$250
$300
$350
$400
2019 2020 2021 2022
Mill
ions
Capital Requests Available Financing

37
Fu ture Cul tural In frastru c tu re N eeds vs . Ava il abl e C ap ac ity
Chart 5 shows county budgeted capital spending on cultural institutions from 2013 through 2018, as well as the amounts requested for the following four years in the 2018-2022 capital improvement plan. During the past six years, the county budgeted an average of $10.8 million annually on those assets, ranging from a high of $15.5 million in 2017 to a low of $6.2 million in 2018. Over the next four years, that amount would need to average $9.5 million annually, based on existing capital requests.
Chart 5: County capital spending on cultural institutions (in millions)
Source: Milwaukee County budget documents
At first glance, this average spending would appear to be well within the county’s capacity and past spending patterns. However, we see several factors that could complicate the outlook.
First, 2018 budgeted capital spending on cultural institutions was the lowest in six years, and several projects have been deferred to 2019. As a result, the county’s cultural capital spending would have to more than double in 2019 to satisfy existing capital requests for that year. This suggests that cultural institutions, as discretionary programs, could be at a competitive disadvantage when county policymakers weigh their needs against those of programs that the county is legally mandated to operate, such as corrections, public safety, and human services.
Perhaps in recognition of this competitive challenge, cultural institutions are moving increasingly toward greater independence from county capital support. This trend is exemplified by the 2016 agreement for the Milwaukee Art Museum to take ownership of its buildings; the revised leases (in 2016 and 2018, respectively) that expanded the capital responsibilities of the Marcus Center for the Performing Arts and the Milwaukee County Historical Society for their downtown buildings; and, most dramatically, the realization by the Milwaukee Public Museum’s leadership that the museum’s future
$6.4
$14.7$15.5
$6.2
$13.9
$8.3
2013 2014 2015 2016 2017 2018 2019 2020 2021 2022

38
lies outside of a publicly owned building for the first time in 134 years. As this trend continues, the county will, over time, be able to reduce its capital spending for the affected institutions.
It is important to note that these institutions are not entirely dependent on county support for their capital needs. Each has its own base of supporters and donors, whose contributions supplement county capital dollars. But the levels of both county support and private donations vary widely among these institutions, partly because each of them separately negotiates its own leases and funding agreements with the county, and partly because of the differences in their ability to raise funds from private sources.
The result has been a division between the “haves” and “have-nots” of county cultural institutions. At one end of the spectrum is the Milwaukee County Zoo, the only county department in this group, which has an active and generous partner in the nonprofit Zoological Society. In each of the zoo’s multi-year capital initiatives, the society has agreed to raise half the cost of improvements that total tens of millions of dollars, a commitment that has leveraged equally substantial matching investments from the county.
At the other end of the spectrum are the Charles Allis Art Museum, the Villa Terrace Decorative Arts Museum, and the Historical Society’s Trimborn Farm. While their needs are far more modest than those of the zoo, the county has deferred funding for critical projects, resulting in deterioration that has forced a series of short-term fixes at all three facilities. As noted previously, Historical Society leadership fears the county’s only historical park could be at risk for a catastrophic loss, but at the same time it feels it cannot commit donor dollars to the farm in the absence of a lease. If this trend continues, the county’s less-visible cultural institutions will remain at a competitive disadvantage not only to mandated programs, but to their higher-profile cultural cousins as well.
Finally, a note of caution is in order when we consider the public museum’s plan for a new building. If the plan works, it could ensure the museum’s future and potentially relieve the county of capital costs for the current location – although the latter point depends heavily on what county policymakers decide to do with the existing county-owned building after the museum moves out. But as previously noted, museum leadership views state financial aid as a critical piece of its fundraising plan, and the state has no history of providing such aid to local cultural institutions.
If the plan for a new building falters for lack of state or private support, county policymakers could be confronted with a choice between appropriating major capital dollars for this project or watching the collapse of a beloved local institution. Furthermore, that choice would come at virtually the same time that they may need to ramp up spending for the county’s costliest capital need, a new criminal courthouse, and finance a new plan for the Domes, as discussed below.

39
Fu ture P arks and Rec reat ion al In frastruc tu re N eed s vs . Ava il abl e C ap ac ity
Chart 6 shows budgeted county capital spending on parks and recreation from 2013 through 2018, followed by the amounts requested for the next four years in the 2018-2022 capital improvement plan. Over the past six years, the county appropriated an average of $9 million annually for those assets, ranging from a high of $20.3 million in 2015 to a low of $2.4 million in 2018. In the next four years, that sum would need to average $39 million annually to satisfy existing capital requests.
Chart 6: County capital spending on parks and recreation (in millions)
Source: Milwaukee County budget documents
That is a formidable gap between past spending and future needs. Not only is the average annual need for the next four years almost twice as large as the highest budgeted amount in the past six years, but requested spending for 2019 is nearly 10 times greater than the 2018 budgeted amount. If the cultural institutions -- as discretionary programs operated through public-private partnerships -- are at a disadvantage in competing with the capital needs of mandated programs, it would seem that the county-owned and -operated parks are proportionately at an even greater disadvantage.
Unlike the cultural institutions, the parks may not find it politically feasible to move toward greater independence from county capital funding. One exception was the O’Donnell Park parking garage, which was transferred to the Milwaukee Art Museum as part of the agreement described earlier in this report. But that 2016 deal came only after several years of debate, punctuated by the County Board’s 2014 rejection of a sale to Northwestern Mutual.
Also unlike the major cultural institutions, the parks have not been able to leverage substantial private donations. While the horticultural facilities (the Domes and Boerner Botanical Garden) and some traditional parks have “friends” groups, capital financing has come almost exclusively from
$6.4
$20.3
$2.4
$42.5
$49.2
2013 2014 2015 2016 2017 2018 2019 2020 2021 2022

40
county taxpayers. In the past six years, the only private funding donated for parks capital projects has been $100,000 for work at Pulaski Park.
Lake Park’s Ravine Bridge illustrates this fundraising difference. The historic concrete arch bridge over Ravine Road has been closed since 2016 (after a previous temporary closure in 2014), because of concerns that its deterioration could pose a safety hazard. The 2017 adopted capital budget included a $2.5 million renovation project, funded by $500,000 from county bonds and $2 million in private contributions. However, those donations have not materialized, work has not started, and the county recently obtained a $2 million state grant to help finance the project.
The feasibility of donor funding is a crucial issue with regard to the future of the Domes. The 2018-2022 capital plan includes $20.5 million for Domes renovation, representing the low end of the estimated cost to address deferred maintenance alone. However, the task force studying the conservatory’s future has indicated its preference for improvements that could bring the total estimated cost to anywhere between $40 million and $95 million.
Task force members have acknowledged these options would be possible only with substantial private donations. As a result, the destiny of the Domes could be determined by its supporters’ ability to raise tens of millions of dollars at the same time that major capital campaigns are under way to build a new home for the Milwaukee Public Museum, renovate the Milwaukee County Zoo, and remodel the Warner Grand Theater into a new concert hall for the Milwaukee Symphony Orchestra.
This daunting backlog of capital needs for parks assets is not a new issue. In a 2008 report, we cited a county assessment of parks system assets that found an estimated need for $277 million in capital improvements spending.
xxxii
xxxi And, in a December 2009 report, the county’s Department of Audit estimated that the dollar value of the capital repair and replacement backlog “likely exceeds $200 million, overwhelms available resources, and is rising.” Given that parks capital spending hit a six-year low in 2018, the short-term outlook for reversing this trend does not appear favorable.
Su mm ary
We can assess the county’s ability to pay for requested capital improvements in two ways: By comparing projected spending with past budgeted amounts, and by weighing the parks, recreational, and cultural spending requests against all of the other spending requests competing for the limited financing available under current county policy.
Chart 7 shows total parks, recreational, and cultural budgeted capital spending for the past four years in comparison with requests for the next four years. Although the 2019-2022 projection of $38.2 million for cultural institutions alone is less than the budgeted spending of $44 million for 2015-2018, the combined total would have to increase 135%, from $82.6 million to $194.1 million, to satisfy all spending requests when parks and recreation projects are included. That’s a four-year gap of $111.5 million between past budgeted amounts and future requests. This is nearly proportionate to the five-year gap of $143 million that we identified in a 2013 report, indicating little net gain from the county’s efforts to address its pre-existing backlog of parks, recreational, and cultural capital projects while also addressing additional recently identified needs.

41
Chart 7: Total parks, recreational, and cultural capital spending (in millions)
Source: Milwaukee County budget documents
Chart 8 shows requested 2019-2022 capital spending for parks/recreation and cultural assets, in relationship to each other, to all other non-airport county capital spending requests for those years, and to the county’s capital financing capacity. We see that annual requested parks, recreational, and cultural capital spending ranges from 17% of all non-airport capital requests for 2022 to 50% in 2021, but fulfilling all parks, recreational, and cultural requests would use from 68% of county capital financing capacity (in 2019) to 97% (in 2022).
Chart 8: Requested 2019-2022 county capital spending
Source: Milwaukee County 2018 Capital Improvements Budget
$12.8
$34.2
$17.2
$8.6
$36.9
$57.6
2013 2014 2015 2016 2017 2018 2019 2020 2021 2022
$0
$50
$100
$150
$200
$250
$300
$350
$400
2019 2020 2021 2022
Mill
ions
All Other Parks & Rec Cultural Institutions Available Financing

42
In other words, if county policymakers chose to satisfy all parks, recreational, and cultural capital requests – and if they abided by existing self-imposed annual borrowing limits – they would have scant financing capacity available for bus purchases or for renovating and replacing county highways and buildings used for other purposes, most notably a new criminal courthouse. Conversely, in three of the next four years, the county could use all of its capital financing capacity for its other building and transportation needs – without satisfying all of those requests – and have nothing left for parks, recreational, and cultural assets.
While both extremes are unlikely choices, the figures illustrate the scope of the problem: When pitted against the needs of mandated programs and transportation infrastructure in a competition for capital dollars sharply limited by current policy, the county’s parks, recreational, and cultural assets face a substantial challenge.
As noted above, some cultural institutions are simply withdrawing from the competition. The Milwaukee Art Museum has largely ended its reliance on county capital funding, while the Milwaukee Public Museum and the Marcus Center for the Performing Arts are pursuing courses their leaders hope will reduce or eliminate their need for county capital dollars. By contrast, the Milwaukee County Zoo continues to leverage substantial county investment through its donors’ willingness to provide half the funding for capital improvements.
However, the other cultural institutions and the county parks lack either a clear path to financial independence or a history of obtaining donations for a large proportion of capital financing. If current trends continue, the outlook for satisfying their capital needs will remain bleak.

43
Conclusion
Our analysis of parks, recreational, and cultural infrastructure owned by Milwaukee County finds that both parks and recreational assets and cultural institutions face significant repair and replacement needs in the next several years. Yet, while the nature of these challenges is similar, the outlook for addressing them is quite different.
Like other publicly owned infrastructure, both parks system assets and the cultural institutions are confronting a combination of aging facilities and financial constraints stemming from borrowing limitations and the competing capital needs of other governmental functions.
Unlike other forms of local government infrastructure, however, some county-owned cultural institutions have demonstrated the ability to supplement public funding with substantial contributions from private donors. The Milwaukee County Zoo stands out in this regard, with the nonprofit Zoological Society’s commitment to raise half of the projected $86 million needed to finance the zoo’s 10-year capital plan. This is the third time in three decades the society has taken on a commitment of that magnitude.
Other cultural institutions are moving toward greater independence from county capital support. The most visible examples of this trend are the Milwaukee Art Museum’s agreement to take ownership of its buildings and the Milwaukee Public Museum’s search for a new home.
However, these paths do not appear to be viable options for the parks or for the smallest county-owned cultural institutions. They must compete against the county’s mandated programs and transportation needs for limited capital dollars from taxpayers. As discretionary programs, they are at a disadvantage in this competition.
Specific key findings arising from our review of parks, recreational, and cultural infrastructure owned by Milwaukee County include the following:
• The county’s facility assessment practices could be improved. Although the county keeps extensive records on the condition of its public buildings and other infrastructure, it should continue to refine and improve the manner in which it uses building and pavement ratings to convey capital spending needs to budget officials and policymakers. Also, formal assessments are out of date – or never were conducted – for some cultural buildings and several categories of parks infrastructure, limiting the quality of information available for capital planning.
• Two major facilities – the public museum and the Domes – must be replaced or fully renovated within the next few years. The museum is seeking more than $100 million from private donors, the State of Wisconsin, and possibly the county to construct a new building downtown. Meanwhile, a task force studying the conservatory’s future is considering a dramatic overhaul that could require $40 million to $95 million in private and county funds. As a result, the facilities’ supporters could be competing with each other and with other cultural institutions for major donations. If either or both fail to meet their fundraising goals, or if the public museum does not obtain unprecedented capital support from the state, county policymakers would be

44
under pressure to fund survival plans for these local icons at the same time they are trying to finance a new criminal courthouse.
• Almost every form of parks infrastructure has pressing needs. The list of parks assets that the county must replace within the next 10 years includes 85% of parking lots and service yards, 75% of walkways, 73% of parkways, 54% of rated Oak Leaf Trails and of basketball courts, 48% of tennis courts, and (measured by replacement value) 47% of large buildings other than the Domes. Current condition ratings are lacking for other infrastructure types, but the county has identified additional needs for park bridges, water parks, swimming pools, golf courses, and playgrounds, among others.
• Infrastructure issues are particularly acute at the county’s lower-profile cultural institutions. Critical leak damage is threatening the buildings and collections of the Charles Allis Art Museum and the Villa Terrace Decorative Arts Museum, while the Milwaukee County Historical Society’s leadership fears a catastrophic loss at Trimborn Farm, the county’s only historical park. Although the cost of addressing these problems would be less than that of some of the county’s other infrastructure needs, decisions to defer capital projects have forced spending on short-term repairs.
• The county lacks the capacity to finance the capital needs of its parks, recreational, and cultural assets if it wishes to stay within its self-imposed bonding limits and address its other capital needs. To meet existing capital requests, the county would need to more than double budgeted spending on cultural institutions (from $6.2 million to $13.9 million) and increase spending nearly tenfold on parks (from $2.4 million to $23 million) in 2019 alone. Fulfilling all of the parks, recreational, and cultural capital requests for the next four years would require a 135% increase, from $82.6 million to $194.1 million, over budgeted spending of the past four years. Moreover, doing so would consume from 68% of the county’s financing capacity in 2019 to 97% in 2022 under current policy.
By limiting general obligation borrowing for non-airport projects to a 3% increase from the prior year, the county has sharply restricted its capital financing capacity. Yet, it is important to understand that meeting the county’s capital needs would not be as simple as repealing the current policy and issuing bonds to fund all requested projects.
For one thing, the state also has imposed legal limits on how much local governments can borrow. While the county is well within the state debt limit now, it could begin to approach that limit if county policymakers attempted to address all of their capital needs through bond financing. Such a sizable increase in borrowing also could have a detrimental impact on bond ratings.
Even more important are the policy goals behind the county’s internal borrowing limits: To prevent debt service obligations from interfering with the county’s ability to pay its operating expenses, and to ease the burden on future taxpayers required to repay debts incurred in prior years.
These are legitimate policy objectives that have led to unintended consequences. As the cost of maintaining aging infrastructure has risen beyond the county’s capacity to address it in any single

45
year, policymakers repeatedly have deferred capital projects to future years, creating a seemingly insurmountable backlog of repair and replacement needs.
For the parks system and the county-owned cultural institutions, the quality of their infrastructure directly affects the quality of their service. The Domes, the public museum, Trimborn Farm, Charles Allis, Villa Terrace, and numerous parks facilities may not be able to serve the public in the future unless their infrastructure needs are addressed. As a result, the continuing deferral of capital projects is interfering with the very operations that the county’s debt policy seeks to protect.
In football, delay of game incurs a five-yard penalty. For Milwaukee County’s parks, recreational, and cultural infrastructure, the penalty for delaying solutions could be far more severe.
This report, the fourth in our series on local government infrastructure, concludes our general assessment of capital assets. The final report in our series will turn to the question of what new policies or strategies might be considered to address the challenges we have uncovered.

46
Endnotes
i “Milwaukee, Wisconsin: #70 in Best Places to Live,” 2018, https://realestate.usnews.com/places/wisconsin/milwaukee ii “37 Things to Do in Milwaukee, Wisconsin,” Dec. 20, 2017, https://www.travelandleisure.com/trip-ideas/city-vacations/things-to-do-in-milwaukee iii Archive, Milwaukee Magazine website, https://www.milwaukeemag.com/?s=reasons+i+love+milwaukee iv "Infrastructure Financing: A Guide for Local Government Managers," January 2017, https://icma.org/documents/infrastructure-financing-guide-local-government-managers v "Paying for Local Infrastructure in a New Era of Federalism," National League of Cities, May 2016, https://www.nlc.org/sites/default/files/2016-12/NLC_2016_Infrastructure_Report.pdf vi “A Fork in the Road?” can be found at https://publicpolicyforum.org/research/fork-road-outlook-transportation-infrastructure-city-and-county-milwaukee vii “Beneath the Streets” can be found at https://publicpolicyforum.org/research/beneath-streets-outlook-metro-milwaukees-largest-water-and-sewer-infrastructure-assets viii “Cracks in the Foundation” can be found at https://publicpolicyforum.org/research/cracks-foundation-analysis-building-repair-and-replacement-needs-city-and-county-milwaukee ix “Pulling Back the Curtain” can be found at https://publicpolicyforum.org/research/pulling-back-curtain-assessing-needs-major-arts-cultural-recreational-and-entertainment x At the request of the Milwaukee County Department of Administrative Services, we produced an additional report, “The Jury is Out,” exploring options for financing a new criminal courthouse, the largest capital need identified in “Cracks in the Foundation.” “The Jury is Out,” released in May 2018, can be found at https://publicpolicyforum.org/research/jury-out-options-financing-new-milwaukee-county-justice-center. We also examined options for funding the county’s parks, recreational, and cultural assets in an earlier report, “The Show Must Go On?” That report, released in March 2014, can be found at https://publicpolicyforum.org/research/show-must-go-exploring-dedicated-funding-possibilities-milwaukee’s-cultural-and xi "Best Practice: Asset Maintenance and Replacement," GFOA, 2010, http://www.gfoa.org/asset-maintenance-and-replacement xii Facility Condition Index, Asset Insights, http://www.assetinsights.net/Glossary/G_Facility_Condition_Index.html xiii About, Zoological Society of Milwaukee website, http://www.zoosociety.org/About/Mission.php xiv History, Milwaukee Art Museum website, https://mam.org/info/history.php xv 2013 lease agreement, attached to Milwaukee County Board File 13-647. xvi 2016 Milwaukee County Board resolution, File No. 16-229. xvii About MCHS, Milwaukee County Historical Society website, https://milwaukeehistory.net/about/ xviii Wisconsin Statutes 44.09(1) xix History, Trimborn Farm website, https://www.trimbornfarm.com/history xx Historic Sites, Milwaukee County Historical Society website, https://milwaukeehistory.net/visit/historic-sites-2/#curtain xxi About The Mansion, Charles Allis website, https://www.charlesallis.org/the_allis_story/the_mansion/ xxii Lloyd and Agnes Smith, Villa Terrace website, https://www.villaterrace.org/our_story/the_smiths/ xxiii History of the Parks, Milwaukee County website, http://county.milwaukee.gov/HistoryoftheParks16572.htm?docid=16572 xxiv History of the Domes, Milwaukee County website, http://county.milwaukee.gov/ConstructionoftheDom10361.htm xxv Milwaukee County Task Force on the Mitchell Park Conservatory Domes meeting minutes. xxvi Future of the Domes: Option 7, Friends of the Domes website, https://milwaukeedomes.org/domes-future-options

47
xxvii Milwaukee County 2016 Comprehensive Annual Financial Report, p. 214. xxviiiMemo from Milwaukee County Office of Performance, Strategy and Budget to Milwaukee County Board, April 10, 2018, https://county.milwaukee.gov/files/county/administrative-services/PSB/BudgetsCopy-1/2019-Budget/2019CapitalBudgetProcessandFunding. xxix We analyzed financing options for a new criminal courthouse in “The Jury Is Out,” https://wispolicyforum.org/research/the-jury-is-out-options-for-financing-a-new-milwaukee-county-justice-center/ xxx These reports can be found at https://wispolicyforum.org/research/a-fork-in-the-road-the-outlook-for-transportation-infrastructure-in-the-city-and-county-of-milwaukee/ and https://wispolicyforum.org/research/cracks-in-the-foundation-an-analysis-of-building-repair-and-replacement-needs-at-the-city-and-county-of-milwaukee/. xxxi “Milwaukee County-Funded Parks and Cultural Institutions: A Fiscal Assessment, 2000-2008 and Beyond,” https://publicpolicyforum.org/research/milwaukee-county-funded-parks-and-cultural-institutions xxxii Milwaukee County Department of Audit, “A Tale of Two Systems,” https://county.milwaukee.gov/ImageLibrary/Groups/cntyAudit/report0916.pdf