about the cover - department of energy · about the cover. power development ... erc energy...
TRANSCRIPT

POWERING THE NATION
This Power Development Plan serves as the path in powering the nation from 2016 and beyond. The cover depicts the invaluable role of the electric power industry in fuelling and sustaining the country’s economic growth and development.
The Department of Energy (DOE) envisions for the Philippine energy industry to be globally competitive in utilizing energy in Filipino communities through clean, efficient, robust and sustainable systems in order to create wealth and transform the lives of the Filipinos. Recognizing its role, the DOE reaffirms its commitment - to ensure quality, reliability, security, and affordabiliity of the supply of electric power.
Through an integrated approach, the Power Development Plan 2016-2040 encompasses all subsectors - generation, transmission, distribution and supply; as well as the development of the market, other institutional support mechanisms and electrification roadmaps.
ABOUT THE COVER

POWER DEVELOPMENT PLAN2016 - 2040

The Department of Energy (DOE) is honored to present its Power Development Plan (PDP) 2016-2040. This blueprint will shape and
redefine the future of the Philippine electric power industry.
In line with the country’s long term national vision to be a middle-class society contained in the AmBisyon 2040, the PDP exemplifies the DOE’s aspiration to be a globally-competitive agency powering up Filipino communities through clean, efficient, robust and sustainable energy systems. The DOE aims to create wealth, propel industries and transform the lives of men and women and the future generations.
The power demand and supply outlook discussed in the PDP will guide investors, economic planners and stakeholders of the power sector’s future landscape in terms of electricity consumption, demand and capacity requirements in the advent of an industrialization-driven economic growth and development. Anchored on the DOE’s mandate to ensure quality, reliable, accessible, sustainable and reasonably-priced energy, the DOE envisions to implement the policies embodied and programs identified in this PDP over the short-, medium- and long-term horizons.
Holistic on its approach, the DOE formulated the power sector roadmaps encompassing the generation, transmission, distribution and supply subsectors infused with market development and institutional support mechanisms. As a result, electrification roadmaps to increase energy access down to households, off-grid and missionary areas are also embraced in this plan.
Widening and diversifying the supply base of the country to satisfy the growing demand for electricity remains the DOE’s priority. This entails the upscale of power generation capacities in Luzon, Visayas and Mindanao which must be primarily complemented by the Transmission Development Plan covering in detail the expansion and upgrading of the transmission system and its connection to the Distribution Development Plan that provides the distribution infrastructure.
Thus, the DOE envisions the transformation of the current system into an integrated, climate-resilient, technologically-advanced and fully competitive electric power industry. It will resolve concomitant issues and challenges, foster stronger ties with its attached agencies, the energy regulator, the private sector, the government agencies and other stakeholders. The DOE will likewise engage in international collaborations to realize the plans and programs in the PDP.
By 2016 and beyond, the electric power industry will boost the necessary changes in firming up the Philippines’ growth and development momentum.
POWER DEVELOPMENT PLAN, 2016-2040i
MESSAGE FROM THE SECRETARY
ALFONSO G. CUSISECRETARY
ALFONSO G. CUSISecretary

ii
POWER DEVELOPMENT PLAN, 2016-2040
CONTENTS
01
02
03
Message from the Secretary i
Contents ii
Tables iv
Figures v
Annexes vi
Abbreviations vii
Overview and Executive Summary 1
Philippine Electricity Pro�le 3
Peak Demand, Electricity Consumption and Installed Capacity 4
Power Generation Mix 5
Power Rates 5
Industry Structure, Development Challenges and Key Policies 6
Five-Year Performance Assessment, 2011-2015 7
Demand 8
Electricity Sales and Consumption 8
Peak Demand 11
Supply 11
Capacity 11
Generation 16
Age and Economic Life of Power Generating Plants 18
Significant Incidents 19
2011 19
2012 20
2013 20
2014 22
2015 23
Challenges and Key Policies and Programs 25
MESSAGE FROM THE SECRETARY

iii
POWER DEVELOPMENT PLAN, 2016-2040
Power Sector Roadmap 48
Generation 49
Transmission 51
Distribution and Supply 52
Market Development 53
Institutional and Support Mechanism 55
Missionary Electrification 55
Electrification 57
ANNEXES 60
05
06
Demand-Supply Outlook, 2016-2040 39
Electricity Demand Forecasting Methodology and Assumptions 40
1. Data Collection 40
2. Electricity Sales and Peak Demand Forecasts 41
3. Peak Demand Forecasting 41
Supply Expansion Plan 43
Supply Expansion Plan Methodology and Assumptions 43
Power Demand-Supply Outlook, 2016-2040 43
04
iv
POWER DEVELOPMENT PLAN, 2016-2040
TABLES
Table 1. ASEAN-6 Peak Demand, Installed Capacity and Electricity Consumption 5
Table 2. 2015 ASEAN Electricity Rates, in Peso/kWh 6
Table 3. Electricity Sales and Consumption by Sector, 2011-2015 (in GWh) 9
Table 4. Electricity Sales and Consumption by Grid, 2011-2015 (in GWh) 10
Table 5. Luzon Additional Capacities, 2011-2015 (in MW) 13
Table 6. Visayas Additional Capacities, 2011-2015 (in MW) 14
Table 7. Mindanao Additional Capacities, 2011-2015 (in MW) 15
Table 8. Age of Power Generating Plants per Technology 19
Table 9. Bombed and Toppled Transmission Towers in Mindanao for 2015 25
Table 10. Status Report of Mindanao Modular Generator Set Program 27
Table 11. Installed and Dependable Capacity and Peak Demand in SIIGs, as of December 2015 29
Table 12. NPC-SPUG Increase in Operating Hours 30
Table 13. Missionary Areas with New Power Providers, as of December 2015 30
Table 14. NPC Electrified Areas, 2012-2015 30
Table 15. Household Electrification Level by Region, as of July 2016 32
Table 16. Sitio Electrification Program (SEP) Roadmap 33
Table 17. Benchmark Tariff for Solar Home System (SHS) 35
Table 18. Energy and Economic Growth Assumptions by Grid, 2016-2030 41
Table 19. SU/TL and Load Factor Assumptions 41
Table 20. Grid Peak Demand Forecast, 2016-2040 (in MW) 42
Table 21. Philippines Required Power System Capacity Addition, 2016-2040 43
Table 22. Luzon Required Annual Capacity Addition, 2016-2040 45
Table 23. Visayas Required Annual Capacity Addition, 2016-2040 46
Table 24. Mindanao Required Annual Capacity Addition, 2016-2040 47
Table 25. Household Electrification Sub-Programs and Targets for 2016-2017 59

v
POWER DEVELOPMENT PLAN, 2016-2040
FIGURES
Figure 1. Installed Capacity per capita (in KW) vs. GDP per capita 4
Figure 2. Electricity Consumption per capita (in KW) vs. GDP per capita 4
Figure 3. ASEAN-6 Power Generation Mix 5
Figure 4. Electric Power Industry Structure, ASEAN-6 6
Figure 5. Peak Demand, 2011-2015 (in MW) 11
Figure 6. Philippines Installed, Dependable and Available Capacity by Plant Type, 2011-2015 (in MW) 12
Figure 7. Luzon Installed, Dependable and Available Capacity by Plant Type, 2011-2015 (in MW) 13
Figure 8. Visayas Installed, Dependable and Available Capacity by Plant Type, 2011-2015 (in MW) 14
Figure 9. Mindanao Installed, Dependable and Available Capacity by Plant Type, 2011-2015 (in MW) 15
Figure 10. Philippine Power Generation Mix, 2011-2015 (in GWh) 16
Figure 11. Luzon Power Generation Mix, 2011-2015 (in GWh) 16
Figure 12. Visayas Power Generation Mix, 2011-2015 (in GWh) 17
Figure 13. Mindanao Power Generation Mix, 2011-2015 (in GWh) 18
Figure 14. Electricity Sales and Peak Demand Forecast 40
Figure 15. Philippines Demand-Supply Outlook, 2016-2040 44
Figure 16. Luzon Demand-Supply Outlook, 2016-2040 45
Figure 17. Visayas Demand-Supply Outlook, 2016-2040 46
Figure 18. Mindanao Demand-Supply Outlook, 2016-2040 47
Figure 19. Power Sector Roadmap 2017-2040, Generation 50
Figure 20. Power Sector Roadmap 2017-2040, Transmission 51
Figure 21. Power Sector Roadmap 2017-2040, Distribution and Supply 53
Figure 22. Power Sector Roadmap 2017-2040, Market Development and Institutional Support Mechanism 54
Figure 23. Power Sector Roadmap 2017-2040, Missionary Electrification 56
Figure 24. Power Sector Roadmap 2017-2040, Electrification Roadmap 58

vi
POWER DEVELOPMENT PLAN, 2016-2040
ANNEXES
Annex 1. Philippine Historical Electricity Consumption and Peak Demand to GDP Elasticity, 2004-2015 61
Annex 2. Luzon Historical Electricity Consumption and Peak Demand to GRDP Elasticity, 2004-2015 62
Annex 3. Visayas Historical Electricity Consumption and Peak Demand to GRDP Elasticity, 2004-2015 63
Annex 4. Mindanao Historical Electricity Consumption and Peak Demand to GRDP Elasticity, 2004-2015 64
Annex 5. Electricity Sales and Consumption by Sector, 2003-2015 (in GWh) 65
Annex 6. Electricity Sales and Consumption by Sector, per Grid, 2003-2015 (in GWh) 66
Annex 7. Annual System Peak Demand per Grid, 1985-2015 (in MW) 67
Annex 8. Visayas Annual System Peak Demand per Sub-Grid, 1995-2015 (in MW) 68
Annex 9. Luzon Monthly System Peak Demand, 2001-2015 (in MW) 69
Annex 10. Visayas Monthly System Peak Demand, 2001-2015 (in MW) 70
Annex 11. Mindanao Monthly System Peak Demand, 2001-2015 (in MW) 71
Annex 12. Philippine Installed and Dependable Capacity by Plant Type, 2003-2015 (in MW) 72
Annex 13. Luzon Installed and Dependable Capacity by Plant Type, 2003-2015 (in MW) 73
Annex 14. Visayas Installed and Dependable Capacity by Plant Type, 2003-2015 (in MW) 74
Annex 15. Mindanao Installed and Dependable Capacity by Plant Type, 2003-2015 (in MW) 75
Annex 16. Philippine Gross Generation by Plant Type, 2003-2015 (in GWh) 76
Annex 17. Luzon, Visayas and Mindanao Gross Generation by Plant Type, 2003-2015 (in GWh) 77
Annex 18. Visayas Subgrid Gross Generation by Plant Type, 2003-2015 (in GWh) 78
Annex 19. Gross Power Generation by Ownership, 2003-2015 (in GWh) 80
vii
POWER DEVELOPMENT PLAN, 2016-2040
ABBREVIATIONSAAGR Annual Average Growth RateAJCEPA ASEAN-Japan Comprehensive Economic Partnership AgreementAKFTA ASEAN-Korea Free Trade AgreementANECO Agusan del Norte Electric Cooperative, Inc.ASEAN Association of South East Asian NationBPO Business Process OutsourcingBSP Bangko Sentral ng PilipinasCAPEX Capital ExpenditureCC Contestable CustomersCSP Competitive Selection ProcessDANECO Davao del Norte Electric Cooperative, Inc.DBCC Development Budget Coordination CommitteeDBM Department of Budget and ManagementDC Department CircularDDPs Distribution Development PlansDOE Department of EnergyDOF Department of FinanceDOST Department of Science and TechnologyDU Distribution UtilitiesECs Electric CooperativesEGAT Electricity Generating Authority of ThailandEMA Energy Market Authority-SingaporeEPC Engineering, Procurement and ConstructionEPIRA Electric Power Industry Reform ActERAV Electricity Regulatory Authority of VietnamERC Energy Regulatory CommissionGDP Gross Domestic ProductGenCos Generation CompaniesGHG Greenhouse gasGOU Government Owned UtilityGRDP Gross Regional Domestic ProductGST Goods and Services TaxGW GigawattGWh Gigawatt HourIEA International Energy AgencyILP Interruptible Load ProgramIMEM Interim Mindanao Electricity MarketIMF International Monetary FundIMO Independent Market OperatorIPP Independent Power ProducerskW KilowattkWh Kilowatt HourLGU Local Government Unit

viii
POWER DEVELOPMENT PLAN, 2016-2040
MEF Missionary Electrification FundMEIH Malaysian Energy Information HubMERALCO Manila Electric CompanyMFSR Monthly Financial and Statistical ReportMOR Monthly Operations ReportMORESCO I Misamis Oriental - I Rural Electric Service Cooperative, Inc.MORESCO II Misamis Oriental II Electric Service Cooperative, Inc.MW MegawattMWh Megawatt HourNEA National Electrification AdministrationNEDA National Economic and Development AuthorityNGCP National Grid Corporation of the PhilippinesNMMS New Market Management SystemsNPC National Power CorporationNPP New Power ProviderNSCB National Statistical Coordination BoardOP Office of the PresidentOTEC Ocean thermal energy conversionPC Participating CustomersPDP Power Development PlanPEMC Philippine Electricity Market CorporationPLN Perusahaan Listrik Negara/National Electric CompanyPNRI Philippine Nuclear Research InstitutePSA Philippine Statistics AuthorityPSA Power Supply AgreementPSALM Power Sector Assets and Liabilities ManagementPV PhotovoltaicRCOA Retail Competition and Open AccessRD&D Research, Development and DemonstrationRE Renewable EnergyRES Retail Electricity SupplierROW Right of WayRPS Renewable Portfolio StandardsSIS System Impact StudySPUG Small Power Utilities GroupSU Station UseSURNECO Surigao del Norte Electric Cooperative, Inc.TDP Transmission Development PlanTL Transmission LossesTransCo National Transmission CorporationTWG Technical Working GroupWESM Wholesale Electricity Spot MarketZAMCELCO Zamboanga City Electric Cooperative, Inc.
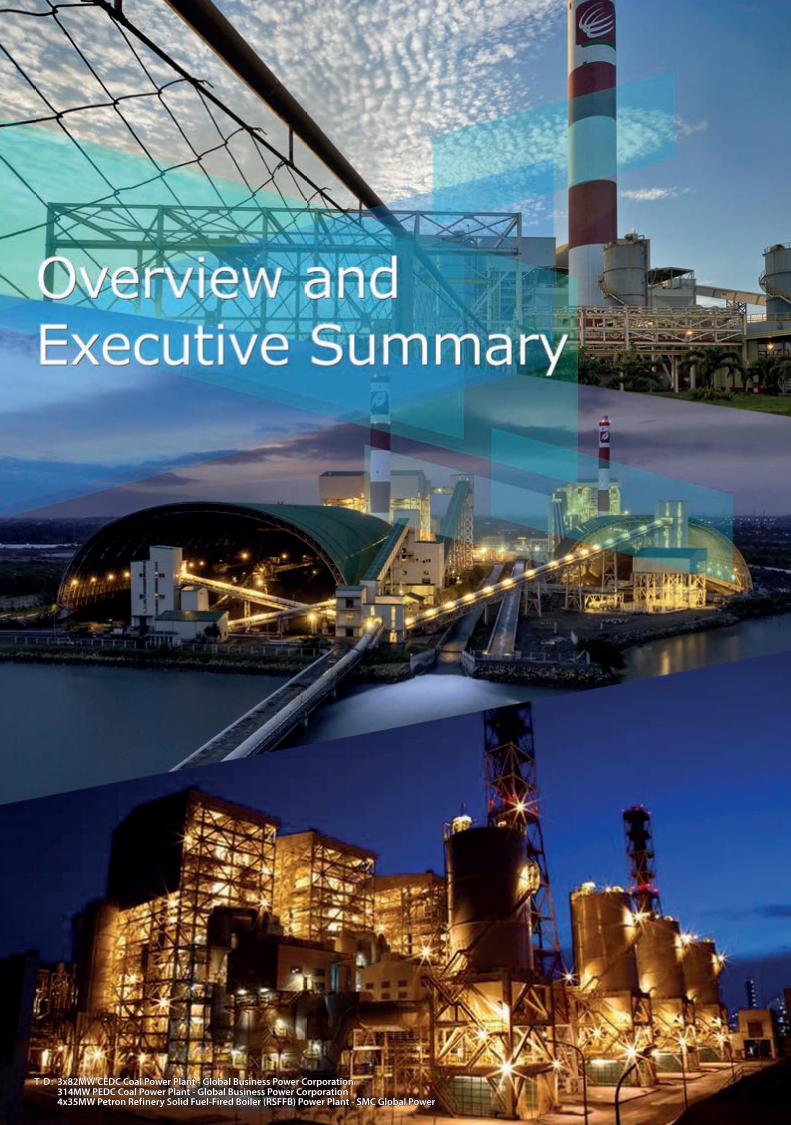
3x82MW CEDC Coal Power Plant - Global Business Power Corporation314MW PEDC Coal Power Plant - Global Business Power Corporation4x35MW Petron Refinery Solid Fuel-Fired Boiler (RSFFB) Power Plant - SMC Global Power
T-D:

The 2016-2040 Power Development Plan
(PDP) provides the long-term outlook on
the demand and supply requirements in
the three major Grids, namely: Luzon, Visayas and
Mindanao. The PDP also presents the holistic power
sector roadmaps for the short-, medium- and long-
term planning horizons. These roadmaps:
• Draw their foundation on the DOE’s
mandate to ensure the delivery of
sustainable, stable, secure, sufficient, and
accessible energy;
• Accord themselves with the DOE
vision towards a globally-competitive
energy industry that powers up Filipino
communities through clean, efficient,
robust and sustainable energy systems
that will create wealth, propel industries
and transform the lives of men and
women and the generations to come;
• Encompass programs and policies for
the generation, transmission, distribution
and supply subsectors as well as market
development and institutional support
mechanisms outlined in the Power Sector
Roadmap, 2016-2040 (Chapter IV); and,
• Align their plans with the national vision
contained in the Ambisyon 20401 that
the Philippines shall be a prosperous,
predominantly middle-class society
where no one is poor; hence, a “Matatag,
Maginhawa at Panatag na Buhay” (strongly
rooted, comfortable, and secure life).
The Missionary Electrification Development Plan
and the Household Electrification Development
Plan likewise form part of the roadmaps in
order to present a more comprehensive
perspective in the power development sector.
The realization of these roadmaps require the
implementation of the policy thrusts and strategic
directions of the DOE which are geared towards
the full restructuring and reform in the electric
power industry under RA 9136 [otherwise known
as the Electric Power Industry Reform Act of 2001
(EPIRA)].
The PDP provides an analysis of the Philippine
electric power industry in relation to other
ASEAN countries (Chapter II); an assessment of
the Philippines’ five-year performance from 2011-
2015 in terms of power statistics, challenges, and
programs and policies implemented prior to the
planning horizon (Chapter III). The Power Demand-
Supply Outlook and Power Sector Roadmap from
2016 to 2040 and the roadmaps are presented in
detail in Chapters IV and V.
Ambisyon Natin 2040 provides the long-term vision for the Philippines formulated by the National Economic and Development Authority (NEDA). Accessible at http://2040.neda.gov.ph/
1
Ove
rvie
w a
nd E
xecu
tive
Sum
mar
y
2
POWER DEVELOPMENT PLAN, 2016-2040
The 2016-2040 Power Development Plan (PDP)
provides the long-term outlook on the demand and supply requirements in the three
major Grids, namely: Luzon, Visayas and Mindanao. The
PDP also presents the holistic power sector roadmaps for the short-, medium- and long-term
planning horizons.

Philippine Electricity Pro�lePhilippine Electricity Pro�le
430MW San Gabriel Combined-Cycle Power Plant - First NatGas Power Corp.500MW San Lorenzo Combined-Cycle Power Plant - FGP Corp.1200MW Ilijan Combined-Cycle Power Plant - KEPCO Ilijan Corp.
T-D:

POWER DEVELOPMENT PLAN, 2016-2040
Phili
ppin
e El
ectr
icity
Pro
�le
4
The Association of Southeast Asian Nations
(ASEAN), including the Philippines,
embarks on enhancing the generation,
transmission, distribution and supply side as part
of its national priorities because it recognizes its
role in having a secured power demand-supply
chain towards the attainment of economic and
development objectives. As the ASEAN gears
towards regional integration, it envisions an
integrated electric power industry among its
member-countries in terms of power demand and
consumption structures, supply infrastructures,
energy policy directions and regulations.
PEAK DEMAND, ELECTRICITY CONSUMPTION AND INSTALLED CAPACITY2
The direct and positive relationship between income,
as measured by GDP per capita3, and electricity
consumption is established for the case of the ASEAN
countries. In a similar manner, the installed capacity
per unit of population also follows an increasing trend
as the countries’ income increase (Figures 1 and 2).
The Philippines, despite having a higher GDP per
capita over Vietnam, has the lowest consumption
and installed capacity per unit of population among
the ASEAN. Meanwhile, the highly developed
economy of Singapore places itself as the lead
in terms of (high) income level, consumption
and installed capacity per capita despite its
limited natural resources and small land area.
On the other hand, the Philippines has higher
supply margin by 34% over its peak demand with
a 6,122 MW difference based on installed capacity.
This margin is higher compared to Thailand and
Vietnam with 22% and 28%, respectively. The
Philippines, however, has a lower available capacity
over installed capacity at 28%, thus resulting to a net
supply margin of 8%. These margins are reflective of
the ASEAN’s need for continuous capacity addition
to be able to meet future electricity demand which
is projected to grow thrice as much by 20404.
a.) Analysis are based on 2014 figures due to available data, except for Vietnam which is based on 2013 valuesb.) Electricity Data Sources: Philippine Department of Energy (DOE), Electricity Generating Authority of Thailand (EGAT), Ministry of Energy and Mineral Resources/Perusahaan Listrik Negara/ National Electric Company (PLN), Malaysian Energy Information Hub (MEIH)/ Economic Planning Unit, Ministry of Industry and Trade General Directorate of Energy Energy/Electricity Regulatory Authority of Vietnam (ERAV), Energy Market Authority-Singapore (EMA)GDP per capita = GDP/Population, data on population sourced from Asian Development Bank (ADB)International Energy Agency (IEA), Southeast Asia Energy Outlook 2015
2
3
4
3Department of Energy (DOE)Power Development Plan 2016 - 2040
Table 1. ASEAN-6 Peak Demand, Installed Capacity and Electricity Consumption
CountryPopulationin million
PeakDemand*
In MW
ElectricityConsumption
in GWh
Installed Capacityin MW
Installed Capacity
per capitain kW
ElectricityConsumption
per capitain kWh
Philippines 99.88 11,822 77,261 17,944 0.18 774Thailand 67.00 26,942 168,620 34,668 0.52 2,591Indonesia 252.16 33,321 221,296 53,066 0.21 878Malaysia 30.26 19,845 128,418 30,875 1.02 4,244Vietnam 89.70 19,772 118,942 27,323 0.30 1,326Singapore 5.47 6,869 46,403 12,863 2.35 8,483
* Total non-coincident peak
Figure 1. Installed Capacity per capita (in KW) vs. GDP per capita
Figure 2. Electricity Consumption per capita (in KW) vs. GDP per capita
0
0.5
1
1.5
2
2.5
0 10,000 20,000 30,000 40,000 50,000 60,000Inst
alle
d Ca
paci
ty p
er c
apita
in k
W
GDP Per Capita in USD
Philippines
Thailand
Indonesia
Malaysia
Vietnam
Singapore
0
1,000
2,000
3,000
4,000
5,000
6,000
7,000
8,000
9,000
0 10,000 20,000 30,000 40,000 50,000 60,000
Cons
umpt
ion
perc
apita
in k
Wh
GDP per capita in USD
Philippines
Thailand
Indonesia
Malaysia
Vietnam
Singapore
Figure 1. Installed Capacity per capita (in KW) vs. GDP per capita
3Department of Energy (DOE)Power Development Plan 2016 - 2040
Table 1. ASEAN-6 Peak Demand, Installed Capacity and Electricity Consumption
CountryPopulationin million
PeakDemand*
In MW
ElectricityConsumption
in GWh
Installed Capacityin MW
Installed Capacity
per capitain kW
ElectricityConsumption
per capitain kWh
Philippines 99.88 11,822 77,261 17,944 0.18 774Thailand 67.00 26,942 168,620 34,668 0.52 2,591Indonesia 252.16 33,321 221,296 53,066 0.21 878Malaysia 30.26 19,845 128,418 30,875 1.02 4,244Vietnam 89.70 19,772 118,942 27,323 0.30 1,326Singapore 5.47 6,869 46,403 12,863 2.35 8,483
* Total non-coincident peak
Figure 1. Installed Capacity per capita (in KW) vs. GDP per capita
Figure 2. Electricity Consumption per capita (in KW) vs. GDP per capita
0
0.5
1
1.5
2
2.5
0 10,000 20,000 30,000 40,000 50,000 60,000Inst
alle
d Ca
paci
type
rcap
ita in
kW
GDP Per Capita in USD
Philippines
Thailand
Indonesia
Malaysia
Vietnam
Singapore
0
1,000
2,000
3,000
4,000
5,000
6,000
7,000
8,000
9,000
0 10,000 20,000 30,000 40,000 50,000 60,000
Cons
umpt
ion
perc
apita
in k
Wh
GDP per capita in USD
Philippines
Thailand
Indonesia
Malaysia
Vietnam
Singapore
3Department of Energy (DOE)Power Development Plan 2016 - 2040
Table 1. ASEAN-6 Peak Demand, Installed Capacity and Electricity Consumption
CountryPopulationin million
PeakDemand*
In MW
ElectricityConsumption
in GWh
Installed Capacityin MW
Installed Capacity
per capitain kW
ElectricityConsumption
per capitain kWh
Philippines 99.88 11,822 77,261 17,944 0.18 774Thailand 67.00 26,942 168,620 34,668 0.52 2,591Indonesia 252.16 33,321 221,296 53,066 0.21 878Malaysia 30.26 19,845 128,418 30,875 1.02 4,244Vietnam 89.70 19,772 118,942 27,323 0.30 1,326Singapore 5.47 6,869 46,403 12,863 2.35 8,483
* Total non-coincident peak
Figure 1. Installed Capacity per capita (in KW) vs. GDP per capita
Figure 2. Electricity Consumption per capita (in KW) vs. GDP per capita
0
0.5
1
1.5
2
2.5
0 10,000 20,000 30,000 40,000 50,000 60,000Inst
alle
d Ca
paci
type
rcap
ita in
kW
GDP Per Capita in USD
Philippines
Thailand
Indonesia
Malaysia
Vietnam
Singapore
0
1,000
2,000
3,000
4,000
5,000
6,000
7,000
8,000
9,000
0 10,000 20,000 30,000 40,000 50,000 60,000
Cons
umpt
ion
per c
apita
in k
Wh
GDP per capita in USD
Philippines
Thailand
Indonesia
Malaysia
Vietnam
Singapore
Figure 2. Electricity Consumption per capita(in KW) vs. GDP per capita
The Association of Southeast Asian Nations (ASEAN),
including the Philippines, embarks on enhancing the generation, transmission,
distribution and supply side as part of its national priorities.

Philippine Electricity Pro�le
POWER DEVELOPMENT PLAN, 2016-2040
5
Table 1. ASEAN-6 Peak Demand, Installed Capacity and Electricity Consumption
Country Populationin million
Peak Demand*
in MW
Electricity Consumption
in GWh
Installed Capacity
in MW
Installed Capacity
per capitain kW
Electricity Consumption
per capitain kWh
Philippines 99.88 11,822 77,261 17,944 0.18 774Thailand 67.00 26,942 168,620 34,668 0.52 2,591Indonesia 252.16 33,321 221,296 53,066 0.21 878Malaysia 30.26 19,845 128,418 30,875 1.02 4,244Vietnam 89.70 19,772 118,942 27,323 0.30 1,326Singapore 5.47 6,869 46,403 12,863 2.35 8,483
* Total non-coincident peak
POWER GENERATION MIX
Among the ASEAN-6 countries, the Philippines
and Indonesia have the most diverse power
generation mix with the majority coming from
coal, followed by natural gas, oil, and renewable
energy (which include hydro, geothermal, wind,
solar and biomass among others).
Natural gas and oil-based sources are present
in the power generation mix of all ASEAN countries
with varying shares. Natural gas is next to coal for
being the major fuel source of power generation
for the Philippines. The huge share of natural gas
in the power generation mix of the ASEAN can
be attributed to the abundance and availability
Gas Turbine and Combined Cycle are classified under Natural Gas
Figure 3. ASEAN-6 Power Generation Mix5
in the region aside from its lesser emission by-
product relative to fossil-based fuels like coal.
In contrast, oil-based sources constitute a meager
share in the power generation mix of the ASEAN
which only ranges from 0.3 to 10 percent.
In terms of renewable energy, electricity generated
from hydro sources accounted for the highest
average share among other renewables at 12
percent due to its abundance and availability in the
region. Vietnam has the highest share of RE at 45
percent with majority coming from hydro sources
(41 percent). Philippines follows Vietnam having a
26 percent RE share.
DEPARTMENT OF ENERGY (DOE), POWER DEVELOPMENT PLAN
Phili
ppin
e Elec
tricit
y Pro
�le
6
Figure 3. ASEAN-6 Power Generation Mix5
4
Figure 3. ASEAN-6 Power Generation Mix5
Power Generation Mix
Among the ASEAN-6 countries, the Philippines and Indonesia have the most diverse power generation mix with the majority coming from coal, followed by natural gas, oil, and renewable energy (which include hydro, geothermal, wind, solar and biomass amongothers).
Natural gas and oil-based sources are present in the power generation mix of all ASEANcountries with varying shares. Natural gas is next to coal for being the major fuel source ofpower generation for the Philippines. The huge share of natural gas in the power generation
5 Gas Turbine and Combined Cycle are classified under Natural Gas
43
20
53
37
21
7
1
10
4
0
1
24
65
25
49
33
95
12
3
7 9
41
13
4 1
0
0
5
0 4
0 7
0 1 4
0%
10%
20%
30%
40%
50%
60%
70%
80%
90%
100%
Philippines Thailand Indonesia* Malaysia Vietnam Singapore
Imports
OtherRE
Geo
Hydro
NatGas
Oil-Based
Coal
Power Generation Mix
Among the ASEAN-6 countries, the Philippines
and Indonesia have the most diverse power
generation mix with the majority coming from
coal, followed by natural gas, oil, and renewable
energy (which include hydro, geothermal, wind,
solar and biomass among others).
Natural gas and oil-based sources are present
in the power generation mix of all ASEAN countries
with varying shares. Natural gas is next to coal for
being the major fuel source of power generation
for the Philippines. The huge share of natural gas
in the power generation mix of the ASEAN can
be attributed to the abundance and availability
in the region aside from its lesser emission by-
product relative to fossil-based fuels like coal.
In contrast, oil-based sources constitute a meager
share in the power generation mix of the ASEAN
which only ranges from 0.3 to 10 percent.
5 Gas Turbine and Combined Cycle are classified under Natural Gas
POWER RATES6
Philippine power rates across the three sectors
are among the highest in the ASEAN but
at par with the level of Singapore. A major
reason for these higher prices is the absence
of government subsidies. Thailand, Indonesia,
and Malaysia arguably have subsidies.
In addition, taxes, fees, and other charges are
also levied on the power industry sectors
composed of the generation, transmission,
and distribution levels which constitute a
portion on electricity rates in the Philippines.
In view of this, greater transparency of having
Sources: Philippines: Manila Electric Company, September 2015; Thailand: Metropolitan Electricity Authority, March 2016 Tariff Calculator; Indonesia: GSI Indonesia Energy Brief, January 2015; Malaysia: Tenaga Nasional Berhad, 1 January 2014, Singapore: Singapore Power, January 2016
6
5

POWER DEVELOPMENT PLAN, 2016-2040
Phili
ppin
e El
ectr
icity
Pro
�le
6
reasonably-priced electricity rates through more
unbundling of items in the energy supply chain
remains part of the major thrusts of the DOE, its
attached agencies, and the Energy Regulatory
Commission.
In view of the prevailing market structure,
transforming the electric power industry into a
fully competitive one by encouraging greater
private sector participation and the establishment
of competitive markets remains a major platform
for the ASEAN countries. In anticipation of the
rapid increase in electricity demand, efficiency
improvements in the entire network from
generation, transmission and distribution still
remains a priority for ASEAN energy agencies.
Initiatives for region-wide interconnection thru
the ASEAN power Grid that enables cross-border
power trading is continuously being discussed,
developed and improved.
Further, the inherent concerns on power
security, fuel price availability and volatility and
environmental considerations allow the ASEAN
to continually intensify its efforts towards fuel
mix diversification by reducing dependence on
fossil fuels and expanding the share of renewable
energy sources. Similarly, the ASEAN considers all
technologies, including nuclear energy, as a source
of power to augment supply especially in the long
run and to provide baseload capacities at a more
competitive cost.
INDUSTRY STRUCTURE, DEVELOPMENT CHALLENGES AND KEY POLICIES
Majority of the ASEAN electric power industry is
characterized by a vertically-integrated structure
where the ownership, control, and management
of the generation, transmission, and distribution
networks are within the jurisdiction of the state.
Although there are several private independent power
producers (IPPs), state-owned power generation
plants continue to dominate the generation sector for
Thailand, Indonesia, Malaysia, and Vietnam. Likewise,
the transmission and distribution systems for these
countries, being natural monopolies, remain to be
owned and operated by the state.
On the other hand, only Philippines and Singapore
have a horizontally integrated power industry with
the unbundling of the generation, transmission, and
distribution systems in the 1990s. Moreover, only the
Philippines and Singapore established its wholesale
electricity market and are gearing towards retail and
electricity future markets in pursuit of attaining full
competition in the power industry. Vietnam is also
heading towards a more competitive environment
as it develops its wholesale electricity market.
Country Industry Commercial DomesticPhilippines 5.84 7.49 8.90Thailand 5.37 5.37 5.52Indonesia 1.66 2.15 1.29Malaysia 4.71 4.97 6.02Singapore 5.84 7.27 7.27
Table 2. 2015 ASEAN Electricity Rates, in Peso/kWh
*Note: Rates include GST (Tax)
6
Regulatory FrameworkGovernment Owned and Controlled
with some IPPs(Generation, Transmission and
Distribution)
Wholesale Spot Market
Retail Competition
Electricity Future Market
Figure 4. Electric Power Industry Structure, ASEAN-67
Industry Structure, Development Challenges and Key Policies
Majority of the ASEAN electric power industry is characterized by a vertically-integrated structure where the ownership, control, and management of the generation, transmission,and distribution networks are within the jurisdiction of the state. Although there are severalprivate independent power producers (IPPs), state-owned power generation plantscontinue to dominate the generation sector for Thailand, Indonesia, Malaysia, and Vietnam.Likewise, the transmission and distribution systems for these countries, being natural monopolies, remain to be owned and operated by the state.
7 Adopted from Somani 2015 published under KPMG Report entitled “Overview of the Power Sector in the SEARegion” sourced from IMF World Economic Outlook 2014
Increasingly Competitive Electric Power Industry
6
Regulatory FrameworkGovernment Owned and Controlled
with some IPPs(Generation, Transmission and
Distribution)
Wholesale SpotMarket
Retail Competition
Electricity Future Market
Figure 4. Electric Power Industry Structure, ASEAN-67
Industry Structure, Development Challenges and Key Policies
Majority of the ASEAN electric power industry is characterized by a vertically-integrated structure where the ownership, control, and management of the generation, transmission,and distribution networks are within the jurisdiction of the state. Although there are severalprivate independent power producers (IPPs), state-owned power generation plantscontinue to dominate the generation sector for Thailand, Indonesia, Malaysia, and Vietnam.Likewise, the transmission and distribution systems for these countries, being natural monopolies, remain to be owned and operated by the state.
7 Adopted from Somani 2015 published under KPMG Report entitled “Overview of the Power Sector in the SEARegion” sourced from IMF World Economic Outlook 2014
Increasingly Competitive Electric Power Industry
6
Regulatory FrameworkGovernment Owned and Controlled
with some IPPs(Generation, Transmission and
Distribution)
Wholesale Spot Market
Retail Competition
Electricity Future Market
Figure 4. Electric Power Industry Structure, ASEAN-67
Industry Structure, Development Challenges and Key Policies
Majority of the ASEAN electric power industry is characterized by a vertically-integrated structure where the ownership, control, and management of the generation, transmission,and distribution networks are within the jurisdiction of the state. Although there are severalprivate independent power producers (IPPs), state-owned power generation plantscontinue to dominate the generation sector for Thailand, Indonesia, Malaysia, and Vietnam.Likewise, the transmission and distribution systems for these countries, being natural monopolies, remain to be owned and operated by the state.
7 Adopted from Somani 2015 published under KPMG Report entitled “Overview of the Power Sector in the SEARegion” sourced from IMF World Economic Outlook 2014
Increasingly Competitive Electric Power Industry
Figure 4. Electric Power Industry Structure, ASEAN-67
Adopted from Somani 2015 published under KPMG Report entitled “Overview of the Power Sector in the SEA Region” sourced from IMF World Economic Outlook 2014
7
Government Owned andControlled with some IPPs(Generation, Transmission
and Distribution)
Wholesale Spot Market
Increasingly Competitive Electric Power Industry
Regulatory Framework
Retail Competition
Electricity Future Market

Five Year Performance A
ssessment, 2011-2015
Five Year Performance A
ssessment, 2011-2015
52MW Trans-Asia Diesel Power Plant - Trans-Asia Power Generation Corp.18.6MW Tarlac Diesel Power Plant - Tarlac Power Corp.103MW MPC Iligan Diesel Power Plant - Mapalad Power Corp.
T-D:

POWER DEVELOPMENT PLAN, 2016-2040
Five
Yea
r Per
form
ance
Ass
essm
ent,
2011
-201
5
8
DEMAND
Electricity Sales and Consumption
Despite the country’s increased exposure to global
risks and uncertainties including the detrimental
impacts of natural calamities such as major
typhoons, namely Sendong (2011), Pablo (2012),
and Yolanda (2013), Bohol Earthquake (2013),
and El Niño Phenomenon (2015-2016), electricity
consumption grew by 19.14 percent from 69,176
GWh in 2011 to 82,413 GWh in 2015 or an annual
average growth rate of 4.49 percent.
The increase is attributed to the impressive
performance of the economy from 2010 to 2015
driven by the robust growth of the services,
industrial and agriculture sectors, among others.
Similarly, improvements in the supply side,
specifically in the entry of power generation plants
which augmented the total installed capacity of
the country, is strongly linked with this demand-
side expansion.
Sectoral Share
The share of each of the sectors comprising the
total electricity consumption remained stable
during the five-year period. The electricity-
intensive industrial sector and the residential
sector’s share to total electricity consumption
remained the largest with an average share
of 27 percent. Meanwhile, the “others” sector
which include public buildings, street lights,
irrigation and others which are not elsewhere
classified constitute the smallest share at 2.56
percent. The share of “own-use” consumption
of power plants and distribution utilities and
the power losses are maintained at an average
share of 8 and 10 percent, respectively.
Sectoral Growth Rate
Positive growth rates of electricity sales and
consumption were observed from 2011 to 2015.
The aggressive performance of the residential
sector resulted to 5.06 percent annual average
growth rate. This growth level overtook the
industrial and commercial sectors at 3.88 and
4.87 percent, respectively. The increasing access
to electricity of the population and the rising
real income per capita8 over the years which
raised the capacities of households to buy basic
commodities including electricity, led to the
increase in consumption on the residential level.
Rising income levels in the country were
driven by the remittances from OFWs, growth
of household-based MSMEs (Micro, Small, and
Medium Enterprises) and higher employment
rates9 along with the government’s poverty
reduction programs and policies among others.
Moreover, the Philippines’ Free Trade Agreements
(FTAs) and economic partnerships with the ASEAN
and other non-ASEAN countries which reduced
import taxes and tariff restrictions10 contributed
to the domestic penetration and availability
of low-cost and high-powered technology
gadgets, appliances and the like that further
boosted electricity sales and consumption at the
household level.
Despite the country’s increased exposure to global
risks and uncertainties, electricity consumption grew by 19.14 percent from 69,176 GWh in 2011 to 82,413 GWh
in 2015 or an annual average growth rate of 4.49 percent.
BSPBSPDepartment of Trade and Industry. Other Trade Agreements include ASEAN-Australia-New Zealand Free Trade Agreement (AANZFTA),ASEAN-China Free Trade Agreement (ACFTA), ASEAN-India Free Trade Agreement (AIFTA) ASEAN-Japan Comprehensive Economic Partnership Agreement (AJCEPA) and ASEAN-Korea Free Trade Agreement (AKFTA)
8
9
10

POWER DEVELOPMENT PLAN, 2016-2040
Five Year Performance A
ssessment, 2011-2015
9
On the other hand, the industry sector’s
electricity sales growth was elevated by the
strong performance of both the domestic and
export manufacturing of electronic, automotive,
metal, pharmaceutical, paper, plastic, textile and
food products.11 Likewise, the increase in private
and public construction and mining activities
contributed to the growth of the industrial
sector from 2011 to 2015.12
The growth of the commercial sector is attributed
to the robust performance of the services sector
which has evolved to be the major contributor to
the country’s economic growth. The commercial
and services sectors include transport and
communication, real estate (condominiums,
shopping malls, casinos, hotel, resort and
restaurants) and business activities (BPOs,
financial intermediary, trading), among others.
Despite having the smallest share to total
electricity consumption, the “others” sector
posted the highest five-year annual average
growth rate at 14.26 percent. This growth was
largely propelled by the increase in government
spending especially in 2015 for the provision of
goods and services to stimulate the country’s
economic growth. In addition, the increase in
farm mechanization and adoption of modern
technologies in the agriculture and fisheries
sector also contributed to the growth of electricity
sales for the “others” sector.
Meanwhile, the annual average growth rate of
power generation and utilities’ “own use” at 7.30
percent can be attributed to the massive entry of
private power generation plants over the years,
backed by the intensified efforts and policies of
the government towards the improvement of
the country’s investment climate.
Significantly, power losses recorded a negative
annual average growth rate at 0.43 percent
from 2011-2015. Annually, power losses posted
negative growth rates, due to the improved
performance of the generation, transmission and
distribution systems, except in 2012 and 2015.
This was accomplished due to the continued and
collaborative efforts of government and the private
sector to enhance the efficiency of the network.
Electricity Sales and Consumption by Grid
On a per grid basis, Luzon, the country’s center
for commerce, business activities and major
economic developments, sustained its major share
Foreign Trade Statistics, PSANEDA
11
12
Sector2011 2015 2011-2015
GWh % Share GWh % Share Di�erence Average Share AAGR
Residential 18,694 27.02 22,747 27.60 4,053 27.23 5.06
Commercial 16,624 24.03 20,085 24.37 3,461 24.28 4.86
Industrial 19,334 27.95 22,514 27.32 3,180 27.60 3.88
Others 1,446 2.09 2,462 2.99 1,016 2.56 14.26
Total Sales 56,098 81.09 67,808 82.28 11,710 81.67 4.87
Utilities Own Use 5,398 7.80 7,124 8.64 1,726 8.06 7.30
Power Losses 7,680 11.10 7,481 9.08 (199) 10.27 (0.43)
Total Consumption 69,176 100.00 82,413 100.00 13,237 100.00 4.49
Table 3. Electricity Sales and Consumption by Sector, 2011-2015 (in GWh)
POWER DEVELOPMENT PLAN, 2016-2040
Five
Yea
r Per
form
ance
Ass
essm
ent,
2011
-201
5
10
NEDA, Western Visayas Regional Development Plan 2011-2016NSCB
13
14
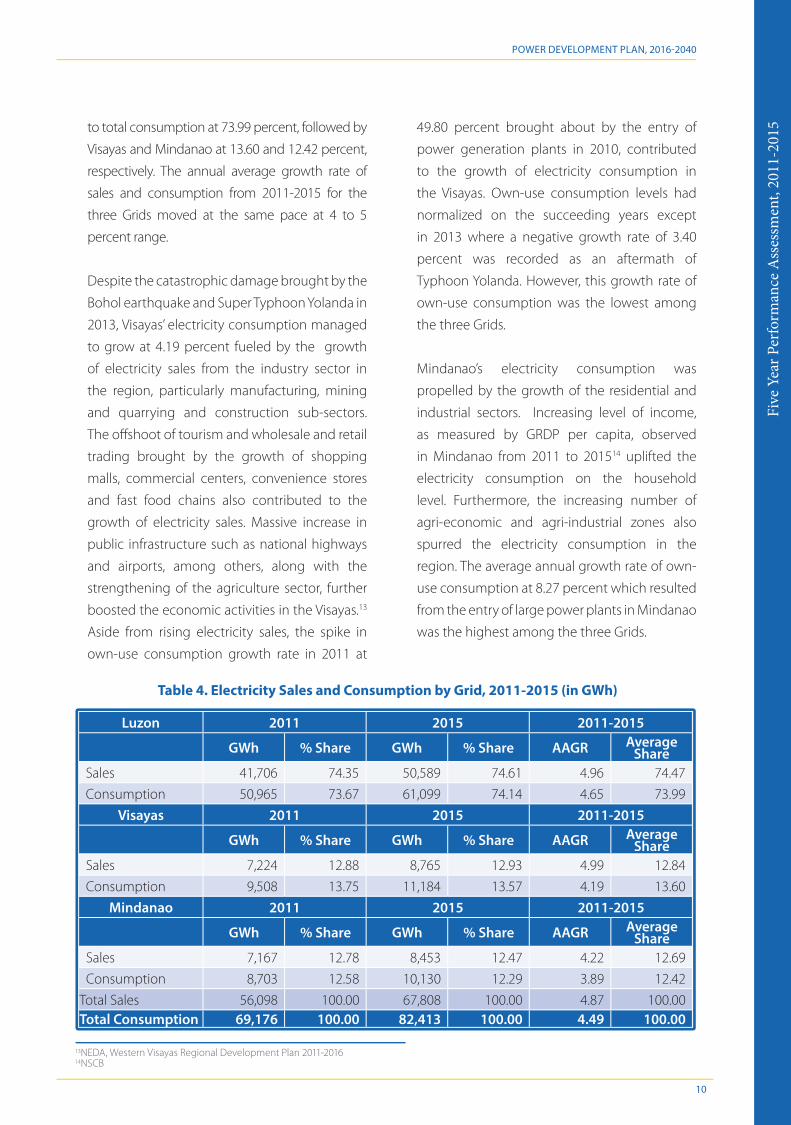
to total consumption at 73.99 percent, followed by
Visayas and Mindanao at 13.60 and 12.42 percent,
respectively. The annual average growth rate of
sales and consumption from 2011-2015 for the
three Grids moved at the same pace at 4 to 5
percent range.
Despite the catastrophic damage brought by the
Bohol earthquake and Super Typhoon Yolanda in
2013, Visayas’ electricity consumption managed
to grow at 4.19 percent fueled by the growth
of electricity sales from the industry sector in
the region, particularly manufacturing, mining
and quarrying and construction sub-sectors.
The offshoot of tourism and wholesale and retail
trading brought by the growth of shopping
malls, commercial centers, convenience stores
and fast food chains also contributed to the
growth of electricity sales. Massive increase in
public infrastructure such as national highways
and airports, among others, along with the
strengthening of the agriculture sector, further
boosted the economic activities in the Visayas.13
Aside from rising electricity sales, the spike in
own-use consumption growth rate in 2011 at
49.80 percent brought about by the entry of
power generation plants in 2010, contributed
to the growth of electricity consumption in
the Visayas. Own-use consumption levels had
normalized on the succeeding years except
in 2013 where a negative growth rate of 3.40
percent was recorded as an aftermath of
Typhoon Yolanda. However, this growth rate of
own-use consumption was the lowest among
the three Grids.
Mindanao’s electricity consumption was
propelled by the growth of the residential and
industrial sectors. Increasing level of income,
as measured by GRDP per capita, observed
in Mindanao from 2011 to 201514 uplifted the
electricity consumption on the household
level. Furthermore, the increasing number of
agri-economic and agri-industrial zones also
spurred the electricity consumption in the
region. The average annual growth rate of own-
use consumption at 8.27 percent which resulted
from the entry of large power plants in Mindanao
was the highest among the three Grids.
Table 4. Electricity Sales and Consumption by Grid, 2011-2015 (in GWh)
Luzon 2011 2015 2011-2015
GWh % Share GWh % Share AAGR Average Share
Sales 41,706 74.35 50,589 74.61 4.96 74.47
Consumption 50,965 73.67 61,099 74.14 4.65 73.99
Visayas 2011 2015 2011-2015
GWh % Share GWh % Share AAGR Average Share
Sales 7,224 12.88 8,765 12.93 4.99 12.84
Consumption 9,508 13.75 11,184 13.57 4.19 13.60
Mindanao 2011 2015 2011-2015
GWh % Share GWh % Share AAGR Average Share
Sales 7,167 12.78 8,453 12.47 4.22 12.69
Consumption 8,703 12.58 10,130 12.29 3.89 12.42
Total Sales 56,098 100.00 67,808 100.00 4.87 100.00Total Consumption 69,176 100.00 82,413 100.00 4.49 100.00

POWER DEVELOPMENT PLAN, 2016-2040
Five Year Performance A
ssessment, 2011-2015
11
Peak Demand
The annual average growth rates of peak demand
for Luzon and Visayas are in the 4 percent level
while Mindanao moved at the slowest pace at only
3 percent.
Due to its already matured and highly industrialized
economy, Luzon’s peak demand has been
recorded the highest for the whole country from
2011-2014. Peak demand for Luzon occurred during
the summer months of April, May and June and is
triggered by the increase in the usage of cooling
and air-conditioning units due to high temperature.
Visayas peak demand was uplifted by the increase
in supply starting in 2010 brought by the entry of
new power plants which provided a leeway for
the increase in electricity demand in the region.
Moreover, the increase in industrial and commercial
activities and socio-economic developments in
the Visayas from 2011-2015 also contributed to
its consistently rising peak demand despite the
catastrophic damage and economic disruption
brought by Typhoon Yolanda in November
2013 that resulted to physical damage to power
generation plants as well as the transmission and
distribution networks.
Despite having supply shortfalls, Mindanao’s annual
average peak demand growth rate managed to
grow at 3.10 percent. In contrast with Luzon, peak
demand in Mindanao occurred during the rainy
season from November to December where the
hydroelectric power plants were operating at full
capacity due to the abundance of water supply.
SUPPLY
Capacity
Increasing installed capacity15 is a good economic
reference that the power sector is improving and
adapting to the growing demand of the country.
In the past five years, the country’s total installed
capacity grew by 16.10 percent from 16,162
MW in 2011 to 18,765 MW in 2015 or an annual
average growth rate of 3.81 percent. This huge
growth is associated to the increased installation
of large coal-fired power plants, such as 651 MW
GNPower Mariveles, 140 MW Petron Refinery Solid
Fuel-Fired Boiler (RSFFB), 200 MW KEPCO-Salcon
Power Corporation (KSPC), 246 MW Cebu Energy
Development Corporation (CEDC) and 164 MW
Panay Energy Development Corporation (PEDC),
as baseload capacities are much needed in Luzon
and Visayas for stable and reliable power supply. In
2015, coal plants were about 5,963 MW compared
to 4,917 MW in 2011.
Moreover, the installed capacity of Renewable
Energy (RE), both the conventional type such
as geothermal, hydroelectric and biomass, and
the variable RE such as solar and wind grew
significantly at the end of 2015. This is due to the
Figure 5. Peak Demand, 2011-2015 (in MW)
7,5527,889
8,305
8,7178,928
1,481 1,551 1,572 1,636 1,768
1,346 1,3211,428 1,469 1,517
0
1,000
2,000
3,000
4,000
5,000
6,000
7,000
8,000
9,000
10,000
2011 2012 2013 2014 2015
Peak
D e
man
d (M
W)
Luzon Visayas Mindanao
AAGR=4.28%
AAGR=4.56%
AAGR=3.10%
13Department of Energy (DOE)Power Development Plan 2016 – 2040
Figure 5. Peak Demand, 2011-2015 (in MW)
7,5527,889
8,305
8,7178,928
1,481 1,551 1,572 1,636 1,768
1,346 1,3211,428 1,469 1,517
0
1,000
2,000
3,000
4,000
5,000
6,000
7,000
8,000
9,000
10,000
2011 2012 2013 2014 2015
Peak
Dem
and
(MW
)
Luzon Visayas Mindanao
AAGR=4.28%
AAGR=4.56%
AAGR=3.10%
13Department of Energy (DOE)Power Development Plan 2016 – 2040
Figure 5. Peak Demand, 2011-2015 (in MW)
Installed Capacity – The full-load continuous gross capacity of a unit under the specified conditions, as calculated from the electric generator nameplate based on the rated power factor (source: IEEE Standard 762-2006)
15
Year

POWER DEVELOPMENT PLAN, 2016-2040
Five
Yea
r Per
form
ance
Ass
essm
ent,
2011
-201
5
12
continuous promotion and encouragement of the
DOE to RE developers through fiscal and non-
fiscal incentives, such as the Feed-In Tariff (FIT)
and Must/Priority Dispatch System. From 5,282
MW in 2011, RE installed capacity increased in
2015 at about 6,221 MW.
Following this trend, the total dependable
capacity16 also grew by 13.50 percent from
14,477 MW in 2011 to 15,620 in 2015 or an annual
average growth rate of 3.23 percent. However,
the average available capacity17 moved at a
faster pace at 14 percent from 12,070 MW in
2011 to 13,778 MW in 2015 or an annual average
growth rate at 9 percent. The average available
capacity is based on the actual daily operations
of power plants. It excluded planned and forced
outages as well as major grid disturbances such
as typhoon and system-wide blackouts which
resulted to zero capacities.
Luzon
In Luzon, total installed capacity rose to 13,668
MW while total dependable capacity grew to
12,179 MW in 2015, associated with 16.4 percent
and 12.51 percent growth from 2011-2015.
About 25 percent of this increase came from
the operation of the new large coal plants. The
recommissioning of 242 MW Therma Mobile
Power Barges (Former Duracom) in Navotas
and the 116 MW Subic Diesel fuel-fired Power
Plant were also added to the total capacity
of Luzon. Recently, Hopewell Gas Turbine
was turned over to Millennium Energy, Inc.
(MEI) and the successful recommissioning of
the 100 MW Gas turbine in Navotas in May
2015 commenced. The commercial operation
of the 20 MW Maibarara geothermal plant
in Batangas, recommissioning of 130 MW
Bacman geothermal plant in Sorsogon and
uprating of 132 MW Binga Hydroelectric plant
also increased the capacity of geothermal and
hydro plants from 2011-2015.
The growth rate of new RE plants remained
stagnant up to 2013 until new wind farms were
added to the existing 33 MW Bangui Wind
Farm. These included the 18.9 MW Bangui
Phase 3 wind farm, 150 MW EDC Burgos Wind,
DEPARTMENT OF ENERGY (DOE), POWER DEVELOPMENT PLAN
Five
Year
Perfo
rman
ce A
ssessm
ent, 2
011-
2015
16
15Department of Energy (DOE)Power Development Plan 2016 – 2040
Figure 6. Philippines Installed, Dependable and Available Capacity by Plant Type, 2011-2015 (in MW)
LUZON
In Luzon, total installed capacity rose to 13,668 MW while total dependable capacity grew to12,179 MW in 2015, associated with 16.4 percent and 12.51 percent growth from 2011-2015. About 25 percent of this increase came from the operation of the new large coal plants. The recommissioning of 242 MW Therma Mobile Power Barges (Former Duracom) inNavotas and the 116 MW Subic Diesel fuel-fired Power Plant were also added to the totalcapacity of Luzon. Recently, Hopewell Gas Turbine was turned over to Millennium Energy,Inc. (MEI) and the successful recommissioning of the 100 MW Gas turbine in Navotas in May2015 commenced. The commercial operation of the 20 MW Maibarara geothermal plant inBatangas, recommissioning of 130 MW Bacman geothermal plant in Sorsogon and upratingof 132 MW Binga Hydroelectric plant also increased the capacity of geothermal and hydroplants from 2011-2015
The growth rate of new RE plants remained stagnant up to 2013 until new wind farms wereadded to the existing 33 MW Bangui Wind Farm. These included the 18.9 MW Bangui Phase3 wind farm, 150 MW EDC Burgos Wind, 81 MW NLREC Caparispisan which are located inIlocos Region, and the 54 MW Pililia Wind in Rizal.
NS
NB
B
NS
NB
B
NS
NB
B
NS
NB
B
NS
NB
B
Geothermal Coal Biomass Natural Gas Hydro Oil-based Wind Solar
Figure 6. Philippines Installed, Dependable and Available Capacity by Plant Type, 2011-2015 (in MW)
LUZON
In Luzon, total installed capacity rose to 13,668 MW
while total dependable capacity grew to 12,179
MW in 2015, associated with 16.4 percent and
12.51 percent growth from 2011-2015. About 25
percent of this increase came from the operation
of the new large coal plants. The recommissioning
of 242 MW Therma Mobile Power Barges (Former
Duracom) in Navotas and the 116 MW Subic Diesel
fuel-fired Power Plant were also added to the
total capacity of Luzon. Recently, Hopewell Gas
Turbine was turned over to Millennium Energy,
Inc. (MEI) and the successful recommissioning of
the 100 MW Gas turbine in Navotas in May 2015
commenced. The commercial operation of the
20 MW Maibarara geothermal plant in Batangas,
recommissioning of 130 MW Bacman geothermal
plant in Sorsogon and uprating of 132 MW Binga
Hydroelectric plant also increased the capacity of
geothermal and hydro plants from 2011-2015.
The growth rate of new RE plants remained
stagnant up to 2013 until new wind farms were
added to the existing 33 MW Bangui Wind Farm.
These included the 18.9 MW Bangui Phase 3 wind
farm, 150 MW EDC Burgos Wind, 81 MW NLREC
Caparispisan which are located in Ilocos Region,
and the 54 MW Pililia Wind in Rizal.
Figure 6. Philippines Installed, Dependable and Available Capacity by Plant Type, 2011-2015 (in MW)
Dependable Capacity – The maximum capacity when modified for ambient limitation for a specified period of time, such as a month or a season. (source: IEEE 762-2006)Available Capacity – The dependable capacity, modified for equipment limitation at anytime. (source: IEEE 762-2006)
16
17

POWER DEVELOPMENT PLAN, 2016-2040
Five Year Performance A
ssessment, 2011-2015
13
81 MW NLREC Caparispisan which are located
in Ilocos Region, and the 54 MW Pililia Wind in
Rizal.
Visayas
In 2015, Visayas has a total installed capacity
of 2,683 MW and total dependable capacity
of 2,228 MW. In terms of installed capacity, the
region’s primary energy source is geothermal
having 36.0 percent share followed by coal and
oil based plants at 29.0 and 25.0 percent share,
respectively.
In the past five years, most of the additional
capacities are coal power plants that went online
on 2011 and 2015. These are the 82 MW CEDC
U3, 82 MW PEDC U2, 103 MW KSPC U2, and
83 MW TPC Expansion. In addition, renewable
energy plants were also added into the grid such
as the 15 MW CASA Bagasse-Fired Cogeneration
that started exporting into the grid last March
2011, the 22 MW SACASOL I - A & B solar farm
that started its commercial operation on May
and August 2014 respectively, the 49.8 MW
Nasulo GPP that went online on September
2014, and the 54 MW TAREC wind farm that
Figure 7. Luzon Installed, Dependable and Available Capacity by Plant Type, 2011-2015 (in MW)
Table 5. Luzon Additional Capacities, 2011-2015 (in MW)
Plant Type 2010 Installed Capacity (MW) 2011 2012 2013 2014 2015
Coal 3,849 0 0 651.6 0 141
Oil Based 1,984 116 0 242 12.7 100
Natural Gas 2,861 0 0 0 0 0
Geothermal 899 0 0 0 20 0
Hydro 2,346 105 0 0 0 13.2
Wind 33 0 0 0 249.9 54
Biomass 9 4.2 10.2 0 12 31
Solar 0 0 0 0 0 70
Total 11,981 225.2 10.2 893.6 294.6 409.2
DEPARTMENT OF ENERGY (DOE), POWER DEVELOPMENT PLAN
17
Five Year Performance Assessm
ent, 2011-2015
16Department of Energy (DOE)Power Development Plan 2016 – 2040
Figure 7. Luzon Installed, Dependable and Available Capacity by Plant Type,2011-2015 (in MW)
Table 5. Luzon Additional Capacities, 2011-2015 (in MW)
PLANT TYPE
2010 Installed Capacity
(MW)
2011 2012 2013 2014 2015
Coal 3,849
GN Power Mariveles
(651.6 MW)
SLTEC Puting Bato Coal U1
(135 MW)Sinoma WHR
(6 MW)
Oil Based 1,984 Subic DPP *(116 MW)
TMO PowerBarges 3, 4, 5,
6(242 MW)
La Farge DPP(12.7 MW)
MilleniumGas (100 MW)
Natural Gas 2,861
Geothermal 844Maibarara
GPP(20MW)
Hydro 2,346Ambuklao
HEPP *(105 MW)
Linao-Cawayan(Lower
Cascade)
SabanganHEPP
(13.2 MW)
NS
NB
B
NS
NB
B
NS
NB
B
NS
NB
B
NS
NB
B
Geothermal Coal Biomass Natural Gas Hydro Oil-based Wind Solar
Figure 7. Luzon Installed, Dependable and Available Capacity by Plant Type, 2011-2015 (in MW)
Table 5. Luzon Additional Capacities, 2011-2015 (in MW)
PLANT TYPE
2010 Installed Capacity
(MW)
2011 2012 2013 2014 2015
Coal 3,849
GN Power Mariveles
(651.6 MW)
SLTEC Puting Bato Coal U1
(135 MW)Sinoma WHR
(6 MW)
Oil Based 1,984Subic DPP * (116 MW)
TMO Power Barges 3, 4,
5, 6(242 MW)
La Farge DPP(12.7 MW)
Millenium Gas (100 MW)
Natural Gas 2,861
Geothermal 844Maibarara GPP
(20MW)
Hydro 2,346Ambuklao
HEPP *(105 MW)
Linao-Cawayan
(Lower Cascade)
HEPP (2.10 MW)
Sabangan HEPP
(13.2 MW)*Note: There were power generating units that became non-operational over the five-year period.

POWER DEVELOPMENT PLAN, 2016-2040
Five
Yea
r Per
form
ance
Ass
essm
ent,
2011
-201
5
14
started its operation last December 2014.
Adding to the list of renewable energy plants are
the 30 MW SOLEQ and 23 MW SACASOL I – C &
D solar farms, the 36 MW Nabas wind farm, the
46 MW URC, the 8 MW HPCo, and the 3 MW VMC
Biomass Cogeneration plants.
It can also be noted that there are power
plants in the Visayas grid that have been
decommissioned. These are the 106.8 MW
Cebu TPP 1 and 2, the 1.08 MW Ton-ok and
the 0.81 NW Hinabian HEPPs, and the 49 MW
Northern Negros GPP. The Power Barge 103 is
still on shutdown and was recently privatized
by PSALM. The Cebu Land-Based GT owned
by SPC Island Power Corporation and located
within the Naga complex is also on economic
shutdown and under preservation since 2011.
Mindanao
For Mindanao, the total installed capacity in
2015 is at 2,414 MW while the total dependable
capacity is at 2,025 MW with corresponding
growth rates from 2011 to 2015 at 4.57% percent
and 5.87% percent, respectively. Power supply in
Figure 8. Visayas Installed, Dependable and Available Capacity by Plant Type, 2011-2015 (in MW)
Plant Type 2010 Installed Capacity (MW) 2011 2012 2013 2014 2015
Coal 542 264 0 0 0 0
Oil Based 615 0 0 0 0 82
Natural Gas 0 0 1 0 0 0
Geothermal 964 0 0 0 50 0
Hydro 13 0 0 0 0 0
Wind 0 0 0 0 0 36
Solar 0 0 0 0 22 46
Biomass 30 0 0 0 0 52
Total 2,164 264 1 0 72 216
Table 6. Visayas Additional Capacities, 2011-2015 (in MW)
DEPARTMENT OF ENERGY (DOE), POWER DEVELOPMENT PLAN
VISAYAS
19Department of Energy (DOE)Power Development Plan 2016 – 2040
Figure 8. Visayas Installed, Dependable and Available Capacity by Plant Type,2011-2015 (in GW)
Table 6. Visayas Additional Capacities, 2011-2015 (in MW)
PLANT TYPE
2010 Installed Capacity
(MW)
2011 2012 2013 2014 2015
Coal 542
PEDC(82 MW)
CEDC(82 MW)
KSPC(100 MW)
Oil Based 615Toledo PowerCorporation
(82 MW)
Natural GasDesco
Natural Gas(1MW)
Geothermal 964 Nasulo GPP(50MW)
Hydro 13Wind Petrowind
NS
NB
B
NS
NB
B
NS
NB
B
NS
NB
B
NS
NB
B
Geothermal Coal Biomass Natural Gas Hydro Oil-based Wind Solar
Figure 8. Visayas Installed, Dependable and Available Capacity by Plant Type,2011-2015 (in MW)
*Note: There were power generating units that became non-operational over the five-year period.

POWER DEVELOPMENT PLAN, 2016-2040
Five Year Performance A
ssessment, 2011-2015
15
Mindanao is still highly dependent on the hydro
resources of the Agus and Pulangi Hydro Power
Plants. The recommissioning of the former Iligan
Diesel Power Plant with an installed capacity
at 103 MW by the Mapalad Power Corporation
formed a significant role in securing the supply
of Mindanao for 2013. For the last quarter of 2015,
the power supply in Mindanao also improved
due to the commissioning of the Therma South
Coal Unit 1.
In addition, the increase in capacity for the
Mindanao Grid is attributed to the influx of
embedded diesel power plants with a total of 30.7
MW for 2012, 37.6 MW for 2013, 92.9 MW for 2014
and 34.6 MW for 2015. There are also run-off river
type hydropower plants which are embedded to
the DUs such as 9.2 MW Cabulig HEP and 2 units
from Tudaya HEP which have a total of 13.6 MW
of installed capacity. These embedded power
plants are important to the DUs especially during
peak hours as these generators fill the deficiency
in supply.
Lastly, there are two (2) solar power plants that
have been commissioned in Mindanao for the
year 2015. These are the 6.2 MW Centralla Solar
and 12.5 MW Kirahon Solar.
Figure 9. Mindanao Installed, Dependable and Available Capacity by Plant Type, 2011-2015 (in MW)
Table 7. Mindanao Additional Capacities, 2011-2015 (in MW)
MINDANAO
21Department of Energy (DOE)Power Development Plan 2016 – 2040
Lastly, there are two (2) solar power plants that have been commissioned in Mindanao forthe year 2015. These are the 6.2 MW Centralla Solar and 12.5 MW Kirahon Solar.
Figure 9. Mindanao Installed, Dependable and Available Capacity by Plant Type,2011-2015 (in GW)
Table 7. Mindanao Additional Capacities, 2011-2015 (in MW)
PLANT TYPE
2010 Installed Capacity
(MW)
2011 2012 2013 2014 2015
Coal 232
ThermaSouth Unit 1
(150 MW)
Oil Based 594
Minergy(27.5 MW)
KEGI Bukidnon(3.2 MW)
KEGI Misamis Oriental
(10.6 MW)
MPC Koronadal (12MW)
EEI Power(15MW)
SO Energy(19 MW)
MPC Digos(15 MW)
KEGI Panaon(15 MW)
KEGI Tandag
PEAK POWER SSOCSARGEN
(20.9 MW)
PEAK POWER ASELCO
(5.9 MW)
King Energy -Maramag
NS
NB
B
NS
NB
B
NS
NB
B
NS
NB
B
NS
NB
B
Geothermal Coal Biomass Natural Gas Hydro Oil-based Wind Solar
Figure 9. Mindanao Installed, Dependable and Available Capacity by Plant Type, 2011-2015 (in GW)
MINDANAO
21Department of Energy (DOE)Power Development Plan 2016 – 2040
Lastly, there are two (2) solar power plants that have been commissioned in Mindanao forthe year 2015. These are the 6.2 MW Centralla Solar and 12.5 MW Kirahon Solar.
Figure 9. Mindanao Installed, Dependable and Available Capacity by Plant Type,2011-2015 (in GW)
Table 7. Mindanao Additional Capacities, 2011-2015 (in MW)
PLANT TYPE
2010 Installed Capacity
(MW)
2011 2012 2013 2014 2015
Coal 232
ThermaSouth Unit 1
(150 MW)
Oil Based 594
Minergy(27.5 MW)
KEGI Bukidnon(3.2 MW)
KEGI Misamis Oriental
(10.6 MW)
MPC Koronadal (12MW)
EEI Power(15MW)
SO Energy(19 MW)
MPC Digos(15 MW)
KEGI Panaon(15 MW)
KEGI Tandag
PEAK POWER SSOCSARGEN
(20.9 MW)
PEAK POWER ASELCO
(5.9 MW)
King Energy -Maramag
NS
NB
B
NS
NB
B
NS
NB
B
NS
NB
B
NS
NB
B
Geothermal Coal Biomass Natural Gas Hydro Oil-based Wind Solar
Figure 9. Mindanao Installed, Dependable and Available Capacity by Plant Type, 2011-2015 (in GW)Plant Type 2010 Installed
Capacity (MW) 2011 2012 2013 2014 2015
Coal 232 0 0 0 0 150
Oil Based 594 0 30.7 140.6 92.9 34.6
Natural Gas 0 0 0 0 0 0
Geothermal 103 0 0 0 0 0
Hydro 1,041 0 9.2 0 13.6 0
Wind 0 0 0 0 0 0
Biomass 0 0 35.9 0 0 0
Solar 1 0 0 0 0 18.7
Total 1,971 0 75.8 140.6 106.5 203.3*Note: There were power generating units that became non-operational over the five-year period.

POWER DEVELOPMENT PLAN, 2016-2040
Five
Yea
r Per
form
ance
Ass
essm
ent,
2011
-201
5
16
Generation
As new generating capacities were added to
the existing supply, generation or production of
electricity also grew in the past five years which
manifested the improvements in the generation
sector of the Philippine Power Industry. Generation
in 2011 at 69,176 GWh rose up to 82,413 GWh after
five years with substantial 19.14 percent growth, as
shown in Figure 10.
Coal generation also increased in the past five
years and became the most dominant and
most utilized source in the generation mix.
This is because coal plants provide low-cost
generation and a stable operation. From 25,342
GWh in 2011 coal generation escalated to
36,686 GWh or boasting 44.76 percent growth
in just five years.
Luzon
The Luzon Grid has the largest generation
among the three grids since almost three-
fourths of the total generating facilities
are from this grid. Starting 2011, Luzon has
generated 50,017 GWh of energy and it grew
with an average annual growth rate of 4.71
percent. Majority of the increase is attributed
to the increase of new coal-fired power plants
in the grid. In 2011, there were only 19,681
GWh coming from coal plants and eventually,
coal generation increased by about 50 percent
due to the operation of new plants such as the
651 MW GNPower Mariveles and the 140 MW
Petron RSFFB.
Generation from Natural Gas Power Plants
remained almost at 20,000 MWh except in 2013
due to the 2013 and 2015 Malampaya Scheduled
Maintenance Shutdown (SMS). In those years,
the off-shore gas facility cut off its supply for 30
days to the three large natural gas-fired power
plants such as 1,200 MW Ilijan, 1,000 MW Sta. Rita
and 500 MW San Lorenzo plants. These plants
used alternate fuels to continue their operation
during the maintenance of Malampaya.
Generation
23Department of Energy (DOE)Power Development Plan 2016 – 2040
Generation
As new generating capacities were added to the existing supply, generation or production ofelectricity also grew in the past five years which manifested the improvements in thegeneration sector of the Philippine Power Industry. Generation in 2011 at 69,176 GWh roseup to 82,413 GWh after five years with substantial 19.14 percent growth, as shown in Figure10.
Coal generation also increased in the past five years and became the most dominant andmost utilized source in the generation mix. This is because coal plants provide low-costgeneration and a stable operation. From 25,342 GWh in 2011 coal generation escalated to36,686 GWh or boasting 44.76 percent growth in just five years.
Figure 10. Philippine Power Generation Mix, 2011-2015 (in GWh)
LUZON
The Luzon Grid has the largest generation among the three grids since almost three-fourthsof the total generating facilities are from this grid. Starting 2011, Luzon has generated50,017 GWh of energy and it grew with an average annual growth rate of 4.71 percent.Majority of the increase is attributed to the increase of new coal-fired power plants in thegrid. In 2011, there were only 19,681 GWh coming from coal plants and eventually, coal generation increased by about 50 percent due to the operation of new plants such as the651 MW GNPower Mariveles and the 140 MW Petron RSFFB.
Geothermal Coal Natural Gas Hydro Wind Biomass Solar Oil-based
Figure 10. Philippines Power Generation Mix, 2011-2015 (in GWh)Figure 11. Luzon Power Generation Mix, 2011-
2015 (in GWh)
Figure 11. Philippines Power Generation Mix, 2011-2015 (in GWh)
24Department of Energy (DOE)Power Development Plan 2016 – 2040
Generation from Natural Gas Power Plants remained almost at 20,000 MWh except in 2013due to the 2013 and 2015 Malampaya Scheduled Maintenance Shutdown (SMS). In thoseyears, the off-shore gas facility cut off its supply for 30 days to the three large natural gas-fired power plants such as 1,200 MW Ilijan, 1,000 MW Sta. Rita and 500 MW San Lorenzoplants. These plants used alternate fuels to continue their operation during themaintenance of Malampaya.
Figure 11. Luzon Power Generation Mix, 2011-2015 (in GWh)
VISAYAS
The Visayas Grid remains primarily dependent on the energy generated by geothermal andcoal power plants. Coal generation in the region grew by 16.5 percent from 2011 to 2012due to the various coal power projects that went online. On the other hand, it can beobserved that the generation from diesel-fired power plants for the past five years (2011-2015) have been stable and were relatively lower compared to the years before significantnumber of baseload capacities were introduced in the area.
As seen in Figure 8, total generation in Visayas for 2013 and 2014 were lower compared to2012. This can be attributed to the recent calamities that struck the region, such as theOctober 2013 magnitude 7.2 earthquake in Bohol and the November 2013 Super TyphoonYolanda that caused heavy damage to the Visayas that included various generating facilitiesand the transmission and distribution lines and equipment.
0
10,000
20,000
30,000
40,000
50,000
60,000
70,000
2011 2012 2013 2014 2015
GW
h
Geothermal Coal Biomass Natural Gas Hydro Wind Solar Oil-based
VISAYAS
Figure 10. Philippine Power Generation Mix, 2011-2015 (in GWh)
Generation
23Department of Energy (DOE)Power Development Plan 2016 – 2040
Generation
As new generating capacities were added to the existing supply, generation or production ofelectricity also grew in the past five years which manifested the improvements in thegeneration sector of the Philippine Power Industry. Generation in 2011 at 69,176 GWh roseup to 82,413 GWh after five years with substantial 19.14 percent growth, as shown in Figure10.
Coal generation also increased in the past five years and became the most dominant andmost utilized source in the generation mix. This is because coal plants provide low-costgeneration and a stable operation. From 25,342 GWh in 2011 coal generation escalated to36,686 GWh or boasting 44.76 percent growth in just five years.
Figure 10. Philippine Power Generation Mix, 2011-2015 (in GWh)
LUZON
The Luzon Grid has the largest generation among the three grids since almost three-fourthsof the total generating facilities are from this grid. Starting 2011, Luzon has generated50,017 GWh of energy and it grew with an average annual growth rate of 4.71 percent.Majority of the increase is attributed to the increase of new coal-fired power plants in thegrid. In 2011, there were only 19,681 GWh coming from coal plants and eventually, coal generation increased by about 50 percent due to the operation of new plants such as the651 MW GNPower Mariveles and the 140 MW Petron RSFFB.
Geothermal Coal Natural Gas Hydro Wind Biomass Solar Oil-based
Figure 10. Philippines Power Generation Mix, 2011-2015 (in GWh)
Generation
23Department of Energy (DOE)Power Development Plan 2016 – 2040
Generation
As new generating capacities were added to the existing supply, generation or production ofelectricity also grew in the past five years which manifested the improvements in thegeneration sector of the Philippine Power Industry. Generation in 2011 at 69,176 GWh roseup to 82,413 GWh after five years with substantial 19.14 percent growth, as shown in Figure10.
Coal generation also increased in the past five years and became the most dominant andmost utilized source in the generation mix. This is because coal plants provide low-costgeneration and a stable operation. From 25,342 GWh in 2011 coal generation escalated to36,686 GWh or boasting 44.76 percent growth in just five years.
Figure 10. Philippine Power Generation Mix, 2011-2015 (in GWh)
LUZON
The Luzon Grid has the largest generation among the three grids since almost three-fourthsof the total generating facilities are from this grid. Starting 2011, Luzon has generated50,017 GWh of energy and it grew with an average annual growth rate of 4.71 percent.Majority of the increase is attributed to the increase of new coal-fired power plants in thegrid. In 2011, there were only 19,681 GWh coming from coal plants and eventually, coal generation increased by about 50 percent due to the operation of new plants such as the651 MW GNPower Mariveles and the 140 MW Petron RSFFB.
Geothermal Coal Natural Gas Hydro Wind Biomass Solar Oil-based
Figure 10. Philippines Power Generation Mix, 2011-2015 (in GWh)
90,000
80,000
70,000
60,000
50,000
40,000
30,000
20,000
10,000
02011 2012 2013 2014 2015
GW
h
Generation
23Department of Energy (DOE)Power Development Plan 2016 – 2040
Generation
As new generating capacities were added to the existing supply, generation or production ofelectricity also grew in the past five years which manifested the improvements in thegeneration sector of the Philippine Power Industry. Generation in 2011 at 69,176 GWh roseup to 82,413 GWh after five years with substantial 19.14 percent growth, as shown in Figure10.
Coal generation also increased in the past five years and became the most dominant andmost utilized source in the generation mix. This is because coal plants provide low-costgeneration and a stable operation. From 25,342 GWh in 2011 coal generation escalated to36,686 GWh or boasting 44.76 percent growth in just five years.
Figure 10. Philippine Power Generation Mix, 2011-2015 (in GWh)
LUZON
The Luzon Grid has the largest generation among the three grids since almost three-fourthsof the total generating facilities are from this grid. Starting 2011, Luzon has generated50,017 GWh of energy and it grew with an average annual growth rate of 4.71 percent.Majority of the increase is attributed to the increase of new coal-fired power plants in thegrid. In 2011, there were only 19,681 GWh coming from coal plants and eventually, coal generation increased by about 50 percent due to the operation of new plants such as the651 MW GNPower Mariveles and the 140 MW Petron RSFFB.
Geothermal Coal Natural Gas Hydro Wind Biomass Solar Oil-based
Figure 10. Philippines Power Generation Mix, 2011-2015 (in GWh)
Generation
23Department of Energy (DOE)Power Development Plan 2016 – 2040
Generation
As new generating capacities were added to the existing supply, generation or production ofelectricity also grew in the past five years which manifested the improvements in thegeneration sector of the Philippine Power Industry. Generation in 2011 at 69,176 GWh roseup to 82,413 GWh after five years with substantial 19.14 percent growth, as shown in Figure10.
Coal generation also increased in the past five years and became the most dominant andmost utilized source in the generation mix. This is because coal plants provide low-costgeneration and a stable operation. From 25,342 GWh in 2011 coal generation escalated to36,686 GWh or boasting 44.76 percent growth in just five years.
Figure 10. Philippine Power Generation Mix, 2011-2015 (in GWh)
LUZON
The Luzon Grid has the largest generation among the three grids since almost three-fourthsof the total generating facilities are from this grid. Starting 2011, Luzon has generated50,017 GWh of energy and it grew with an average annual growth rate of 4.71 percent.Majority of the increase is attributed to the increase of new coal-fired power plants in thegrid. In 2011, there were only 19,681 GWh coming from coal plants and eventually, coal generation increased by about 50 percent due to the operation of new plants such as the651 MW GNPower Mariveles and the 140 MW Petron RSFFB.
Geothermal Coal Natural Gas Hydro Wind Biomass Solar Oil-based
Figure 10. Philippines Power Generation Mix, 2011-2015 (in GWh)
90,000
80,000
70,000
60,000
50,000
40,000
30,000
20,000
10,000
02011 2012 2013 2014 2015
GW
h

POWER DEVELOPMENT PLAN, 2016-2040
Five Year Performance A
ssessment, 2011-2015
17
As seen in Figure 12, total generation in Visayas
for 2013 and 2014 were lower compared to 2012.
This can be attributed to the recent calamities
that struck the region, such as the October
2013 magnitude 7.2 earthquake in Bohol and
the November 2013 Super Typhoon Yolanda
that caused heavy damage to the Visayas
that included various generating facilities and
the transmission and distribution lines and
equipment.
With the current push for renewable energy, the
contribution of renewable energy resources such
as solar, wind, and biomass to the generation
mix of the region is becoming more significant.
The power generated from these resources grew
by 194 percent from 2014 to 2015. This growth
is still expected to increase in the coming years
since most of the capacities that are expected
to be in operation are renewable energy plants.
Mindanao
The Mindanao Grid generated 10,129,866 MWH
of energy for 2015 and it grew with an average
annual growth rate of 3.89% percent from 2011.
This growth is attributed to the addition of
embedded generators (diesel and run-off river
hydro plants) and the commercial operation of the
Therma South Coal Unit 1.
Hydro power plants retained its largest share
in the generation mix of Mindanao for the past
years despite the frequent maintenance and
outages of the Agus and Pulangi hydroelectric
power plants. There are also a number of run-
off river types of hydroelectric power plants that
were commissioned from 2011 to 2015 which are
embedded to distribution utilities. These power
plants have contributed to the share of hydro
sources to the power generation mix of Mindanao.
On the other hand, coal-fired generation in
Mindanao from 2011-2013 has been stable
except in 2014, where coal generation declined
due to the Mindanao Wide Blackout that occurred
on February 2014. This damaged the units of the
STEAG Mindanao Coal Fired Power Plant and
caused the power plant to undergo maintenance
for at least two months. For 2015, the generation
from coal increased due to the commercial
operation of Therma South Coal Unit 1.Figure 12. Visayas Power Generation Mix, 2011-
2015 (in GWh)
25
25Department of Energy (DOE)Power Development Plan 2016 – 2040
With the current push for renewable energy, the contribution of renewable energyresources such as solar, wind, and biomass to the generation mix of the region is becomingmore significant. The power generated from these resources grew by 194 percent from2014 to 2015. This growth is still expected to increase in the coming years since most of thecapacities that are expected to be in operation are renewable energy plants.
Figure 12. Visayas Power Generation Mix, 2011-2015 (in GWh)MINDANAO
The Mindanao Grid generated 10,129,866 MWH of energy for 2015 and it grew with anaverage annual growth rate of 3.89% percent from 2011. This growth is attributed to theaddition of embedded generators (diesel and run-off river hydro plants) and the commercialoperation of the Therma South Coal Unit 1.
Hydro power plants retained its largest share in the generation mix of Mindanao for the pastyears despite the frequent maintenance and outages of the Agus and Pulangi hydroelectricpower plants. There are also a number of run-off river types of hydroelectric power plantsthat were commissioned from 2011 to 2015 which are embedded to distribution utilities.These power plants have contributed to the share of hydro sources to the power generationmix of Mindanao.
On the other hand, coal-fired generation in Mindanao from 2011-2013 has been stableexcept in 2014, where coal generation declined due to the Mindanao Wide Blackout thatoccurred on February 2014. This damaged the units of the STEAG Mindanao Coal Fired
0
2,000
4,000
6,000
8,000
10,000
12,000
14,000
2011 2012 2013 2014 2015
GW
h
Geothermal Coal Biomass Natural Gas Hydro Wind Solar Oil-based
Figure 12. Visayas Power Generation Mix, 2011-2015 (in GWh)
MINDANAO
Visayas
The Visayas Grid remains primarily dependent
on the energy generated by geothermal and
coal power plants. Coal generation in the region
grew by 16.5 percent from 2011 to 2012 due to
the various coal power projects that went online.
On the other hand, it can be observed that the
generation from diesel-fired power plants for
the past five years (2011-2015) have been stable
and were relatively lower compared to the years
before significant number of baseload capacities
were introduced in the area.
Generation
23Department of Energy (DOE)Power Development Plan 2016 – 2040
Generation
As new generating capacities were added to the existing supply, generation or production ofelectricity also grew in the past five years which manifested the improvements in thegeneration sector of the Philippine Power Industry. Generation in 2011 at 69,176 GWh roseup to 82,413 GWh after five years with substantial 19.14 percent growth, as shown in Figure10.
Coal generation also increased in the past five years and became the most dominant andmost utilized source in the generation mix. This is because coal plants provide low-costgeneration and a stable operation. From 25,342 GWh in 2011 coal generation escalated to36,686 GWh or boasting 44.76 percent growth in just five years.
Figure 10. Philippine Power Generation Mix, 2011-2015 (in GWh)
LUZON
The Luzon Grid has the largest generation among the three grids since almost three-fourthsof the total generating facilities are from this grid. Starting 2011, Luzon has generated50,017 GWh of energy and it grew with an average annual growth rate of 4.71 percent.Majority of the increase is attributed to the increase of new coal-fired power plants in thegrid. In 2011, there were only 19,681 GWh coming from coal plants and eventually, coal generation increased by about 50 percent due to the operation of new plants such as the651 MW GNPower Mariveles and the 140 MW Petron RSFFB.
Geothermal Coal Natural Gas Hydro Wind Biomass Solar Oil-based
Figure 10. Philippines Power Generation Mix, 2011-2015 (in GWh)
Generation
23Department of Energy (DOE)Power Development Plan 2016 – 2040
Generation
As new generating capacities were added to the existing supply, generation or production ofelectricity also grew in the past five years which manifested the improvements in thegeneration sector of the Philippine Power Industry. Generation in 2011 at 69,176 GWh roseup to 82,413 GWh after five years with substantial 19.14 percent growth, as shown in Figure10.
Coal generation also increased in the past five years and became the most dominant andmost utilized source in the generation mix. This is because coal plants provide low-costgeneration and a stable operation. From 25,342 GWh in 2011 coal generation escalated to36,686 GWh or boasting 44.76 percent growth in just five years.
Figure 10. Philippine Power Generation Mix, 2011-2015 (in GWh)
LUZON
The Luzon Grid has the largest generation among the three grids since almost three-fourthsof the total generating facilities are from this grid. Starting 2011, Luzon has generated50,017 GWh of energy and it grew with an average annual growth rate of 4.71 percent.Majority of the increase is attributed to the increase of new coal-fired power plants in thegrid. In 2011, there were only 19,681 GWh coming from coal plants and eventually, coal generation increased by about 50 percent due to the operation of new plants such as the651 MW GNPower Mariveles and the 140 MW Petron RSFFB.
Geothermal Coal Natural Gas Hydro Wind Biomass Solar Oil-based
Figure 10. Philippines Power Generation Mix, 2011-2015 (in GWh)
12,000
10,000
8,000
6,000
4,000
2,000
02011 2012 2013 2014 2015
GW
h
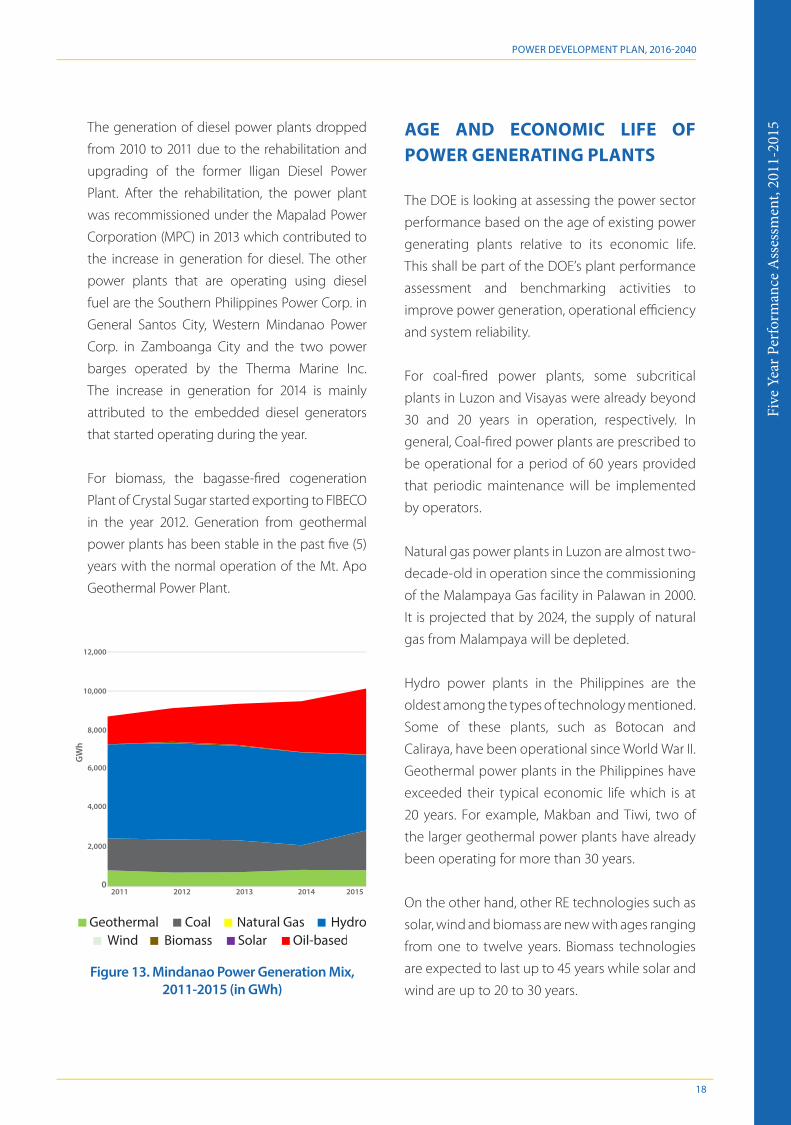
POWER DEVELOPMENT PLAN, 2016-2040
Five
Yea
r Per
form
ance
Ass
essm
ent,
2011
-201
5
18
Generation
23Department of Energy (DOE)Power Development Plan 2016 – 2040
Generation
As new generating capacities were added to the existing supply, generation or production ofelectricity also grew in the past five years which manifested the improvements in thegeneration sector of the Philippine Power Industry. Generation in 2011 at 69,176 GWh roseup to 82,413 GWh after five years with substantial 19.14 percent growth, as shown in Figure10.
Coal generation also increased in the past five years and became the most dominant andmost utilized source in the generation mix. This is because coal plants provide low-costgeneration and a stable operation. From 25,342 GWh in 2011 coal generation escalated to36,686 GWh or boasting 44.76 percent growth in just five years.
Figure 10. Philippine Power Generation Mix, 2011-2015 (in GWh)
LUZON
The Luzon Grid has the largest generation among the three grids since almost three-fourthsof the total generating facilities are from this grid. Starting 2011, Luzon has generated50,017 GWh of energy and it grew with an average annual growth rate of 4.71 percent.Majority of the increase is attributed to the increase of new coal-fired power plants in thegrid. In 2011, there were only 19,681 GWh coming from coal plants and eventually, coal generation increased by about 50 percent due to the operation of new plants such as the651 MW GNPower Mariveles and the 140 MW Petron RSFFB.
Geothermal Coal Natural Gas Hydro Wind Biomass Solar Oil-based
Figure 10. Philippines Power Generation Mix, 2011-2015 (in GWh)
Generation
23Department of Energy (DOE)Power Development Plan 2016 – 2040
Generation
As new generating capacities were added to the existing supply, generation or production ofelectricity also grew in the past five years which manifested the improvements in thegeneration sector of the Philippine Power Industry. Generation in 2011 at 69,176 GWh roseup to 82,413 GWh after five years with substantial 19.14 percent growth, as shown in Figure10.
Coal generation also increased in the past five years and became the most dominant andmost utilized source in the generation mix. This is because coal plants provide low-costgeneration and a stable operation. From 25,342 GWh in 2011 coal generation escalated to36,686 GWh or boasting 44.76 percent growth in just five years.
Figure 10. Philippine Power Generation Mix, 2011-2015 (in GWh)
LUZON
The Luzon Grid has the largest generation among the three grids since almost three-fourthsof the total generating facilities are from this grid. Starting 2011, Luzon has generated50,017 GWh of energy and it grew with an average annual growth rate of 4.71 percent.Majority of the increase is attributed to the increase of new coal-fired power plants in thegrid. In 2011, there were only 19,681 GWh coming from coal plants and eventually, coal generation increased by about 50 percent due to the operation of new plants such as the651 MW GNPower Mariveles and the 140 MW Petron RSFFB.
Geothermal Coal Natural Gas Hydro Wind Biomass Solar Oil-based
Figure 10. Philippines Power Generation Mix, 2011-2015 (in GWh)
Figure 13. Mindanao Power Generation Mix, 2011-2015 (in GWh)
Figure 13. Mindanao Power Generation Mix, 2011-2015 (in GWh)
26Department of Energy (DOE)Power Development Plan 2016 – 2040
Power Plant and caused the power plant to undergo maintenance for at least 2 months. For2015, the generation from coal increased due to the commercial operation of Therma SouthCoal Unit 1.
The generation for diesel power plants have dropped from 2010 to 2011 due to the rehabilitation and upgrading of the former Iligan Diesel Power Plant. After the rehabilitation,the power plant was recommissioned under the Mapalad Power Corporation (MPC) in 2013which contributed to the increase in generation for diesel. The other power plants that areoperating using diesel fuel are the Southern Philippines Power Corp in General Santos City,Western Mindanao Power Corp in Zamboanga City and the two power barges operated bythe Therma Marine Inc. The increase in generation for 2014 is mainly attributed to theembedded diesel generators that started operating during the year.
For biomass, the Bagasse-fired Cogeneration Plant of Crystal Sugar started exporting toFIBECO in the year 2012. Generation from geothermal has been stable in the past five (5)years with the normal operation of the Mt. Apo Geothermal Power Plant.
0
2,000
4,000
6,000
8,000
10,000
12,000
2011 2012 2013 2014 2015
GW
h
Geothermal Coal Hydro Biomass Solar Oil-based
AGE AND ECONOMIC LIFE OF POWER GENERATING PLANTS
The DOE is looking at assessing the power sector
performance based on the age of existing power
generating plants relative to its economic life.
This shall be part of the DOE’s plant performance
assessment and benchmarking activities to
improve power generation, operational efficiency
and system reliability.
For coal-fired power plants, some subcritical
plants in Luzon and Visayas were already beyond
30 and 20 years in operation, respectively. In
general, Coal-fired power plants are prescribed to
be operational for a period of 60 years provided
that periodic maintenance will be implemented
by operators.
Natural gas power plants in Luzon are almost two-
decade-old in operation since the commissioning
of the Malampaya Gas facility in Palawan in 2000.
It is projected that by 2024, the supply of natural
gas from Malampaya will be depleted.
Hydro power plants in the Philippines are the
oldest among the types of technology mentioned.
Some of these plants, such as Botocan and
Caliraya, have been operational since World War II.
Geothermal power plants in the Philippines have
exceeded their typical economic life which is at
20 years. For example, Makban and Tiwi, two of
the larger geothermal power plants have already
been operating for more than 30 years.
On the other hand, other RE technologies such as
solar, wind and biomass are new with ages ranging
from one to twelve years. Biomass technologies
are expected to last up to 45 years while solar and
wind are up to 20 to 30 years.
The generation of diesel power plants dropped
from 2010 to 2011 due to the rehabilitation and
upgrading of the former Iligan Diesel Power
Plant. After the rehabilitation, the power plant
was recommissioned under the Mapalad Power
Corporation (MPC) in 2013 which contributed to
the increase in generation for diesel. The other
power plants that are operating using diesel
fuel are the Southern Philippines Power Corp. in
General Santos City, Western Mindanao Power
Corp. in Zamboanga City and the two power
barges operated by the Therma Marine Inc.
The increase in generation for 2014 is mainly
attributed to the embedded diesel generators
that started operating during the year.
For biomass, the bagasse-fired cogeneration
Plant of Crystal Sugar started exporting to FIBECO
in the year 2012. Generation from geothermal
power plants has been stable in the past five (5)
years with the normal operation of the Mt. Apo
Geothermal Power Plant.
12,000
10,000
8,000
6,000
4,000
2,000
02011 2012 2013 2014 2015
GW
h

POWER DEVELOPMENT PLAN, 2016-2040
Five Year Performance A
ssessment, 2011-2015
19
SIGNIFICANT INCIDENTS
Over the five-year period, the electric power
industry encountered several forced outages
and significant incidents which led to major
system disturbances and power interruptions. In
2011, 2013 and 2015, the Malampaya preventive
maintenance activities resulted to supply
deficiency in Luzon due to limited capacity
from Ilijan power plant and the occurrence of
forced outages. Furthermore, this also resulted to
higher power cost by running these combined-
cycle power plants using alternative fuels. Major
blackouts also occurred due to technical issues
such as system faults, transmission line trippings
and cascading forced outages of power plants.
Moreover, the power system was adversely
affected by natural disasters such as the El Niño,
typhoons and a major earthquake causing
damage to energy infrastructure. In Mindanao,
transmission tower bombings caused disruptions
in power delivery of generating plants.
2011
• Plant Outages
In 2011, Luzon and Mindanao posted negative
growth in power generation due to the
planned maintenance outages of major coal
power plants in Luzon such as Calaca Unit
1 (300 MW) since September 2011, Pagbilao
Unit 1 (382 MW) during the whole 4th quarter
of 2011 and Sual Unit 1 since 20 August to 16
October 2011. In Mindanao, Mindanao Coal
Unit 1 (116 MW) was on planned outage since
15 to 24 October 2011 while Mindanao Coal
Unit 2 since 16 to 31 July 2011.
• 20 to 26 October 2011 - MalampayaScheduled Shutdown
Generation from natural gas slightly increased
to about 4 percent in 2011 due to the supply
constraint brought about by the maintenance
Plant Type Economic Life*
Luzon Visayas Mindanao
Max Min Ave Max Min Ave Max Min Ave
Coal
Subcritical Pulvurized 60 33 4 18.5 24 24 24 11 11 11
Circulating Fluidized Bed (CFB)
60 2 1 1.5 7 1 4 2 1 1.5
Oil-based 30 24 3 13.5 39 1 20 23 4 13.5
Natural Gas 30 17 1 9.0
Renewable Energy (RE)
Geothermal 20 38 3 20.5 34 3 18.5 21 21 21
Hydro 100 75 2 38.5 56 1 28.5 64 3 33.5
Wind 20 12 3 7.5 3 2 2.5
Biomass 45 8 1 4.5 10 2 6
Solar 30 2 1 1.5 3 1 2 1 1 1
Table 8. Age of Power Generating Plants per Technology
* Source: National Renewable Energy Laboratory (NREL), 2008

POWER DEVELOPMENT PLAN, 2016-2040
Five
Yea
r Per
form
ance
Ass
essm
ent,
2011
-201
5
20
http://www.gmanetwork.com/news/story/233585/news/nation/typhoon-pedring-exits-luzon-leaves-18-people-dead19
2012
• 04 December 2012 – Typhoon Pablo/Bopha
On 04 November 2012, Typhoon Pablo
(International Name: Bopha) slammed
Mindanao provinces such as Misamis Oriental,
Surigao del Sur, Agusan del Sur, Compostela
Valley, and Davao Oriental as well as Siquijor
province, hitting some of the same cities and
towns still recovering from the havoc suffered
during Typhoon Sendong in 2011. Pablo was
375 miles in diameter and packed gusts up
to 130 mph with torrential rains on average
over one inch per hour. According to the
NDRRMC, as of December 18, the death toll
from Pablo reached 1,046 people with 841 still
missing, and damages to agriculture reaching
$398 million, infrastructure $190.4 million, and
private property $1.2 million. 21
Several transmission lines servicing Mindanao
distribution utilities were cut during the
passage of Typhoon Pablo which brought
down the total grid demand to 791 MW.
2013
• 15 October 2013 – Bohol Earthquake
An earthquake of tectonic origin with a
magnitude of 7.2 occurred in Region VII at
about 8:12 a.m, 15 October 2013 with an
epicenter at Carmen, Bohol Province. This
caused region-wide outages in Bohol, Cebu
and Negros. Power plants such as Central
Azucarera de San Antonio (CASA) and Panay
Energy Development Corporation (PEDC) in
Iloilo as well as the Cebu Thermal Power Plant
2 (CTPP2) and Cebu Energy Development
shutdown of the Malampaya natural gas
pipeline from 20 to 26 October. The effect of
the gas restriction caused the whole plant
of Ilijan (1,200 MW) to be unavailable for the
whole period in parallel with the Malampaya
Natural Gas shutdown.
• 27 September 2011 - Typhoon Pedring
In 2011, Typhoon Pedring (international name:
Nesat) hit Luzon grid on 27 September 2011
and caused damages to the power lines
in many areas in the NCR and the nearby
provinces of Cavite, Batangas, Bulacan suffered
blackouts as strong winds damaged power
lines. It was estimated to 1.9 million or “almost
close to half” of Meralco’s customers were left
without power as the storm swept through
Metro Manila and surrounding provinces.19
Pedring caused power outage in Luzon which
dropped the grid demand to a low 3,732 MW.
• 16 to 18 December 2011 - Tropical StormSendong
On the latter part of 2011, Tropical Storm
Sendong (international name: Washi) was
named the world’s deadliest typhoon that hit
Philippines in 2011 and killed at least 957 people
with hundreds missing according the National
Disaster Risk Reduction and Management
Council (NDRRMC).20 It made its first landfall at
the vicinity of Hinatuan, Surigao del Sur in the
afternoon of 16 December 2011 and traversed
the provinces of Agusan del Sur, Bukidnon and
Misamis Oriental, and the cities of Cagayan
de Oro and El Salvador before midnight. This
caused torrential rains that led to widespread
and catastrophic flooding, including power
outages in major cities in Northern Mindanao
such as Cagayan de Oro and Iligan City.
http://news.abs-cbn.com/nation/12/19/11/sendong-worlds-deadliest-storm-2011http://asiafoundation.org/2012/12/19/typhoon-pablo-batters-typhoon-free-mindanao/
20
21

POWER DEVELOPMENT PLAN, 2016-2040
Five Year Performance A
ssessment, 2011-2015
21
Corporation (CEDC) in Cebu, went on outage
due to destruction caused by the earthquake
but went back on normal operation on the
same day.
Unfortunately, majority of the supply which
was coming from the Leyte grid (mainly from
Unified Leyte Geothermal Power Plant) thru
the submarine cable connecting Bohol and
Leyte was cut off due to the earthquake.
• 08 November 2013 – Super TyphoonYolanda/Haiyan
On November 8, 2013, Super Typhoon Yolanda
(International Name: Haiyan) cut a devastating
path across the central Philippines. It made
a landfall at Guiuan, Eastern Samar. It had a
storm strength of category 5 - highest and
the strongest tropical cyclone to ever make
a landfall. It had sustained wind speed at 195
miles per hour and wind gusts up to 235 miles
per hour. This natural calamity caused severe
damage to the power system in Visayas. In
the transmission sector, NGCP accounted 566
transmission structures (248 towers and 318
poles) that were damaged by the typhoon.
Also there were 7 substations that were
damaged in the area.
Majority of distribution utilities in Visayas,
as well as in Bicol and MIMAROPA regions,
suffered immensely during the devastation
of the typhoon. There were also power plants
that incurred damages from the strong winds
of the typhoon, as follows:
• Tongonan Geothermal and Unified
Leyte (Cooling towers of the Malitbog,
Tongonan and Mahanagdong Power
Plants have sustained damages including
Admin building and control rooms; and
• PB 103 in Estancia, Iloilo (detached
mooring causing damage to hull and oil
spill to the area)
• 11 November to 10 December 2013 –30-day Malampaya O�-shore Gas �eldTurnaround
The Malampaya scheduled maintenance
shutdown was intended for the replacement
of the obsolete Safety Instrumented System
(SIS) and Fire and Gas System on SWP. It
also included additional works such as
implementation of changes to enable
production of new wells for Malampaya
Project 2 and, completion of critical electrical
tie-ins for the depletion compressors.
Original schedule was 01 November to 01
December 2013 but was moved to a new
schedule of 09 November to 08 December
2013. This was further moved to a later date,
11 November to 10 December 2013. The two-
day deferment was caused by the delay in the
shipment of equipment and personnel to the
off-shore gas field during the Super Typhoon
“Yolanda” (Haiyan) that hit Central Visayas on
08 November 2013.
This activity on Malampaya off-shore gas
field caused the tight supply condition in
the Luzon Grid. Ilijan Block A operated at a
limited capacity of 420 MW due to biodiesel
operation then went on planned outage
from 05 to 10 December 2013 due to 5-day
nozzle cleaning in preparation for the gas
operation. On the other hand, Block B was
out for Maintenance from 12 November to
12 December 2013. Available units of Sta.
Rita and San Lorenzo power plants operated
using alternate fuel during the maintenance
shutdown. Aside from these outages of
natural gas power plants, there were other

POWER DEVELOPMENT PLAN, 2016-2040
Five
Yea
r Per
form
ance
Ass
essm
ent,
2011
-201
5
22
outages that occurred within the turnaround
period that aggravated the tightness of
supply in Luzon:
• GNPower Unit 2 (Forced outage from 12 to
19 November 2013 due to turbine vibration
correction)
• Calaca Unit 1 (Forced outage from 26 October
to 15 November 2013 due to low condenser
vacuum)
• Pagbilao Unit 2 (Planned outage from
31 August to 26 November 2013)
Several coal-fired generating units also
suffered boiler tube leak during the latter
part of the turnaround causing severe supply
shortage in the Luzon grid and high offer price
of peaking power plants in the Wholesale
Electricity Spot Market (WESM). The coal-fired
power plants that went on forced outage due
to boiler tube leak are as follows:
• GNPower Unit 2 (Forced outage from 27
November to 08 December 2013);
• Pagbilao Unit 1 (Forced outage from 28
November to 12 December 2013);
• Pagbilao Unit 2 (Forced outage from 28
November to 13 December 2013); and
• Masinloc Unit 1 (Forced outage from 06
to 08 December 2013)
With these outages, the electricity price for
November and December of MERALCO was
greatly affected. The rate of Meralco, which
comprises almost 70 percent demand in Luzon,
in December spiked on account of higher
generation charge for power purchased from
WESM. Meralco had to buy more power from
the spot market due to tight supply brought
about by the Malampaya maintenance and
the simultaneous outages of some power
plants.
The average WESM price ballooned to P33.216
per kilowatt hour (kWh) in November and
P36.08 per kWh in December, against only
P13.74 per kWh in October. The Supreme Court
(SC) issued a Temporary Restraining Order
(TRO) on Meralco’s record high price increase
in its December generation charge of P3.44
per kilowatt-hour to P9.10 per kWh.
In effect, the SC ordered Meralco to revert to
its old generation charge of P5.67 per kWh.
With the rate hike of over P4 per kWh on hold,
Meralco faces roughly P10 billion in payables
to energy suppliers, through the Philippine
Electricity Market Corp., the operator of the
WESM.
2014
• 27 February 2014 – Mindanao Blackout
On 27 February 2014, Mindanao experienced a
grid-wide blackout due to a demand and supply
imbalance causing under-frequency (UFR). This
was caused by a combination of events like the
unwanted loss of generation of 2 x 10⁵ MW
STEAG Mindanao Coal-fired Power Plant caused
by unprecedented plant control system trouble,
defective equipment of Agus 1 Hydroelectric
power plant and insufficient Automatic Load
Drop (ALD) at Off-Peak scenario.
Repair of Unit 1 (105 MW) was completed on
08 May 2014 and Unit 2 (105 MW) went online
on 01 June 2014.
• 12 July 2014 – PIGging activity for IlijanPipeline
Due to the compromised integrity of the Ilijan
pipeline supplying natural gas, the National
Power Corporation, in coordination with the

POWER DEVELOPMENT PLAN, 2016-2040
Five Year Performance A
ssessment, 2011-2015
23
other stakeholders such as Shell Philippines
Exploration B.V, KEILCO, DOE, NGCP, PSALM
conducted a “PIGging” activity to check
if there were abnormalities such as leaks,
malformation or dents within the pipeline.
An instrument called PIG, which stands for
Pipeline Intelligence Gauge, was inserted in
the pipeline and traveled from Tabangao on-
shore gas facility to the Ilijan power plant.
This activity was the first PIGging of the said
pipeline after it was constructed 12 years ago.
The PIGging activity for Ilijan pipeline was
finalized on scheduled on 11 July 2014 (2200H)
to 13 July 2014 (2200H) for the purpose of
inspecting its integrity, and to clean the debris
in the pipeline. Due to this activity, the Luzon
grid experienced Red alert on 12 July 2014,
Saturday, due to generation deficiency caused
by limited capacity of Ilijan, and the outages of
Masinloc Unit 1, Calaca Unit 2, Pagbilao Unit 1
and GN Power Unit 2.
• 15 to 16 July 2014 – Typhoon Glenda/Rammasun
Typhoon Glenda (International Name:
Rammasun) hit the Luzon particularly Bicol
region, Southern and Central Luzon as well as
Metro Manila. It had 250 kph wind and caused
Php 38 billion damages to agriculture and
infrastructure .22
Power supply from power plants such as the
coal plants of Pagbilao and QPPL as well as the
natural gas plants like Ilijan, Sta Rita and San
Lorenzo were affected by the typhoon. Around
90% of Meralco’s franchise area experienced
power outage brought about by downed
poles, lines and outages of transmission lines
according to NGCP.
2015
• 19 February 2015 – Visayas Partial Blackout
There was a widespread system disturbance
in Visayas grid which occurred last 19 February
2016 at around 1:45 AM due to a fault caused by
the explosion of Potential Transformer (PT) at the
138 kV side of Cebu Diesel Power Plant 1 (CDPP1)
Generator Transformer No. 2 connected to the
NGCP Old Naga substation. Power restoration
was completed at 9:09 AM of the same date.
• 15 March to 13 April 2015 – 2015Malampaya Turnaround
In the advent of a projected power shortage
in the Luzon grid in Summer 2015, Shell
Philippines Exploration B.V. conducted their
30-day maintenance of the Malamapaya to
give way for the coupling of the newly built
Malampaya Phase 3 platform to the existing
platform. The purpose was to increase the
capability to retrieve the indigenous gas
supply in SC-38. With this maintenance, gas
supply for natural gas has been cut out.
Contingency plan during this event is the
operation of 1,500 MW Sta. Rita and San
Lorenzo Natural gas-fired power plant in
Batangas using condensate as alternative
fuel. This is more expensive compared to the
natural gas from Malampaya. For the 1,200
MW Ilijan plant, also in Batangas, Block A
(600 MW) was operated using biodiesel at a
limited capacity of 420 MW while Block B was
scheduled for maintenance.
• 5 April 2015 – Mindanao Blackout
At 1:01 AM of 5 April 2015, Mindanao grid
experienced a system blackout. A fault
occurred on Line 2 of Agus 7 138 KV which
Data gathered from the last update by National Disaster Risk Reduction and Management Council (NDRRMC) as of September 16, 201422

POWER DEVELOPMENT PLAN, 2016-2040
Five
Yea
r Per
form
ance
Ass
essm
ent,
2011
-201
5
24
was caused by the failure of the insulator of
Agus 7 138 kV double circuit line 2 Phase A
due to severe corrosion of the suspension
insulator shank. The sequence of events led
to the tripping of the transmission lines and
power plants followed by the splitting of
the Mindanao grid into two sub-grids - the
Northern and Southern part, then resulted in
total system collapse. The system collapse was
due to the lack of supply during that time to
support the demand.
All Area Control Centers (ACC) sub-grids were
interconnected and all NGCP substations were
fully energized at 7:52 AM of 5 April 2015.
• June 2015 – Fire incident that a�ected theoperations of KSPC
A fire incident happened last 31 May 2015
within the compound of the coal plant of
KSPC which affected the coal conveyors of the
generating facilities. Both units were out from
31 May to 03 June 2015 that put the Visayas
grid on Red Alert status. KSPC Unit 1 (103 MW)
went online on 4 June 2015 while KSPC Unit
2 (103 MW) was on unplanned maintenance
from 31 May to 14 June 2015.
• October 2015 – Typhoon Lando
On 12 October 2015, a typhoon was detected
in the Pacific Ocean named “Lando” with an
international name “Koppu”. It entered the
Philippine Area of Responsibility (PAR) on
14 October 2016 and made its landfall on 18
October 2016 over Casiguran, Aurora with a
maximum speed of 185 kph and gustiness of
220 kph. There were four (4) 500 kV lines, twelve
(12) 230 kV lines, and forty-two (42) 69 kV lines
that were affected during the passage of the
said typhoon. Typhoon Lando dissipated on 21
October 2015 as it entered from Aurora, crossed
Nueva Ecija, Nueva Viscaya, Benguet, Ilocos Sur,
and exited Ilocos Norte leaving 13 provinces
with full or partially province-wide power
outages due to the affected transmission lines.
• 2015 El Niño Phenomenon23
Philippine Atmospheric, Geophysical and
Astronomical Services Administration
(PAGASA) declared the state of El Niño
in 2015 characterized by unusually warm
ocean surface temperatures in the central
and eastern equatorial Pacific. This resulted
to a period of long dry spell to drought
characterized by below to way below
normal rainfall conditions. From weak to
moderate conditions in the early months of
2015, strong El Niño evolved starting fourth
quarter of 2015 affecting most parts of the
country. This phenomenon persisted until
June 2016 which resulted to high system
demand and low water level of reservoirs
and weirs, especially in Mindanao.
• Bombed and Toppled Transmission Towers in Mindanao for 2015
In 2015, there were occurrences of transmission
tower bombings in Mindanao which caused
the interruption in the power delivery of
power plants. A series of investigations and
coordination meetings in Congress, under the
House Committee on Energy, were held to seek
resolutions on the issue as well as to resolve
any peace and security concerns to prevent
future bombings of the power industry assets
such as transmission towers, substations, and
others. Following were the towers bombed in
2015:
PAGASA El Niño Advisories23

POWER DEVELOPMENT PLAN, 2016-2040
Five Year Performance A
ssessment, 2011-2015
25
CHALLENGES AND KEY POLICIES AND PROGRAMS
Ensuring power supply security in the three
Grids, especially in Mindanao, has been the
forefront concern over the recent years. These
challenges encompass not only the supply and/
or technical constraints in the whole system
but also involve institutional and regulatory
concerns. Among others, below are the major
challenges which have been encountered over
the five-year period:
Luzon, Visayas and Mindanao
1. Bureaucratic processes involved in the
issuance of various permits, clearances and
certificates
2. Higher occurrence of Forced Outages
3. Apparent Poor Maintenance of Power Facilities
4. Unresponsive Protective Relays
5. Line Congestions
6. Delays in the completion of generation and
transmission projects
7. Impacts of Climate Change/Natural Calamities
(Typhoons, Earthquake and El Niño)
8. Malampaya Gas Turnaround and Restrictions
A�ected Transmission line Tower No. Date of BombingDate of
Temporary Restoration
Date of Permanent Restoration
Kabacan-Sultan Kudarat 138kV Line 26 13 January 2015 13 October 2015
Kabacan-Sultan Kudarat 138kV Line 41 18 January 2015 03 October 2015
Kibawe - Tacurong 138kV Line 155 26 January 2015 21 December 2015
Kabacan-Sultan Kudarat 138kV Line
25 (IED unexploded) 27 January 2015
Kibawe – Sultan Kudarat 138kV Line 44, 45 09 October 2015 17 October 2015
Kabacan-Sultan Kudarat 138 kV Line
110 (IED unexploded) 18 October 2015
Agus 2 – Kibawe 138 kV Line 20 29 October 2015 16 December 2015
Agus 2 – Kibawe 138 kV Line 19 29 October 2015 09 November 2015
Agus 2 – Kibawe 138 kV Line 21 (not toppled) 29 October 2015 01 November 2015
Agus 2 – Kibawe 138 kV Line 13 (not toppled) 06 November 2015 09 November 2015
Kibawe-Tacurong 138 kV Line 69(IED unexploded) 13 November 2015
Kibawe – Sultan Kudarat 138kV 68 10 December 2015 16 December 2015
Kibawe – Sultan Kudarat 138kV 168 (not toppled) 18 December 2015 20 December 2015
Kibawe – Tacurong 138kV Line 153 (not toppled) 23 December 2015 28 December 2015
Agus 2-Kibawe 138 kV Lines 1 and 2 25 24 December 2015
Restoration works were
suspended since 29 December 2015
Kibawe-Sultan Kudarat 138 kV Line 95 (not toppled) 24 December 2015 27 December 2015
Balo-i-Agus 2 138 kV Lines 1 and 2 4 (not toppled) 28 December 2015 29 December 2015
Table 9. Bombed and Toppled Transmission Towers in Mindanao for 2015

POWER DEVELOPMENT PLAN, 2016-2040
Five
Yea
r Per
form
ance
Ass
essm
ent,
2011
-201
5
26
9. Right of Way Issues
10. Need for a well-defined treatment of
embedded generation in the market system
Speci�c for Mindanao
1. Insufficient capacities and over dependence
on hydro power
2. Decreasing capability of the aging power
plants of Agus and Pulangui Hydro Complex
3. Timely commissioning of needed capacities
have not materialized due to various technical,
commercial, institutional and regulatory issues
and environmental concerns raised by Local
Government Units (LGU) and communities
4. Insufficient power supply contracts of some
distribution utilities
5. Peace and order (Bombing of Transmission
Facilities)
6. Intentional planting of vegetation and
construction of structures under transmission
facilities
To address these, the DOE, in coordination with its
attached agencies, the Energy Regulatory Commission
(ERC) and electric power industry participants, has
undertaken the following initiatives, policy issuances
and programs to ensure supply security, foster
competition, and increase energy access.
Interruptible Load Program (ILP)
In 2015, the country experienced “yellow” and
“red” alert statuses due to thin reserves and forced
outages of power plants. As part of the counter
measures, the DOE and the Energy Regulatory
Commission (ERC) implemented the Interruptible
Load Program (ILP).24 Under this program,
Distribution Utilities (DU) and its Participating
Customers (PCs) enter into an agreement for a
voluntary full or partial de-loading of the PC during
a mutually agreed period of time. PCs with stand-
by generation capacities that are requested by the
DU to participate in the ILP during instances of
power supply deficits will be compensated should
they use their own generating facilities.
To date, there are about 3,612 MW of Self-Generating
capacities that can be tapped to participate in the
ILP excluding those SGFs owned by firms that are
directly connected to the grid. There are about
979 MW SGF capacities committed to participate
in the ILP in Luzon, Visayas, and Mindanao with
792.65 MW in Luzon for its Captive Customers
and contestable customers within DUs’ franchise
areas. The Visayan Electric Company is the lone
implementer in the Visayas with 63.70 MW while
seven (7) DUs in Mindanao have implemented the
ILP involving 48 SGFs with combined capacity of
58.40 MW.
Mindanao Modular Generator Set Program25
This program was implemented to provide the
needed additional power supply to electricity
end-users in Mindanao. Through Executive Order
137, the Department of Budget and Management
(DBM) was directed to release the amount of
Four Billion Five Hundred Million Pesos (PhP 4.5
Billion) sourced from the Malampaya Fund for the
implementation of the said modular generator
sets program. Under the Program, a loan facility
is extended to participating electric cooperatives
(ECs) in Mindanao for the acquisition of the
modular gensets as an immediate relief to supply
the needed power in the franchise areas of ECs.
The ECs have the option to eventually retain the
generator sets or return the generator sets to the
Government when the power supply in Mindanao
has already stabilized after the entry of new power
generation projects. Following are the ECs that
availed the Program as of December 2016:
ERC Resolution No. 8, Series of 2010 and amended by Resolution No. 8, Series of 2013Executive Order No. 137 Series of 2013
24
25

POWER DEVELOPMENT PLAN, 2016-2040
Five Year Performance A
ssessment, 2011-2015
27
Interim Mindanao Electricity Market (IMEM)
The IMEM was intended to augment supply by
serving as a venue for transparent and efficient
utilization of all the available capacities in the
Mindanao Grid. The program started commercial
operations on 3 December 2013; however, due
to system wide blackout, the Mindanao System
Operator declared an IMEM intervention starting
27 February 2014. On 07 May 2014, the DOE issued
Department Circular No. DC 2014-05-0010 entitled,
“Amending the Interim Mindanao Electricity Market
Rules and Providing for Transitory Arrangements.”
Currently, the market intervention issued by the
Mindanao System Operator has not yet been lifted.
The DOE is reviewing the appropriate market
mechanisms for Mindanao and the issues on the
outstanding IMEM settlement are being resolved.
Competitive Selection Process (CSP)
To institutionalize a transparent system of power
supply contracting that ensure provision of adequate
and reliable supply of electricity to all end-users, the
DOE issued on 11 June 2015, Department Circular
No. DC2015-06-0008, “Mandating All Distribution
Utilities to Undergo Competitive Selection Process
in Securing Power Supply Agreements (PSAs).”
To implement the policy, the DOE and ERC jointly
issued Resolution No. 1, “A Resolution Enjoining
All Distribution Utilities to Conduct CSP in the
Procurement of Supply for Their Captive Market” in
October 2015. Further, ERC issued Resolution No. 13
Series of 2015, “A Resolution Directing All Distribution
Utilities (DUs) to Conduct a Competitive Selection
Process (CSP) in the Procurement of Their Supply to
the Captive Market” and ERC Resolution No. 1 Series
of 2016, “A Resolution Clarifying the Effectivity of
ERC Resolution No. 13, Series of 2015.” To date, the
Technical Working Group (TWG) was created to
work on drafting the implementing guidelines on
the CSP Policy.
Privatization of Government’s Power Sector Assets
The privatization of the government’s power
facilities is one of the key features of EPIRA and a
prerequisite to the establishment of a level playing
field in the power industry. The period 2010 to
2016 saw the turn-over of majority of the National
Power Corporation’s major generation assets, IPP
contracts and transmission assets.
To institutionalize a transparent system of power supply contracting that ensure
provision of adequate and reliable supply of electricity to all end-users, the DOE issued on 11 June 2015, Department Circular No. DC2015-06-0008, “Mandating All Distribution
Utilities to Undergo Competitive Selection Process
in Securing Power Supply Agreements (PSAs).”
Mindanao ECs Capacity (MW) Status
ZAMCELCO 16Tested and
Commissioned. On-going COC application.
MORESCO I 2 In Commercial Operation.
MORESCO II 10 On-going Civil and Electric Works.
DANECO 3Tested and
Commissioned. On-going COC application.
ANECO 10 On-going Site Preparation.
SURNECO 10Tested and
Commissioned. On-going COC Application.
Total 51
Table 10. Status Report of Mindanao Modular Generator Set ProgramAs of 15 December 2016
POWER DEVELOPMENT PLAN, 2016-2040
Five
Yea
r Per
form
ance
Ass
essm
ent,
2011
-201
5
28
seventy-nine (79) Bulk users, and five (5) Wholesale
Aggregators.
On the other hand, to ensure the competitiveness
of the WESM, the DOE promulgated policies and
continue on closely supervising its operations and
governance. As of November 2016, the DOE has
provided the policies for the implementation of
new WESM Design primarily the change from the
one (1) – hour trading interval to five (5) minutes
trading interval, the removal of minimum stable
loading constraints, preparation for the reserve
market and automation of several features of the
Market Management System (MMS) to improve
transparency and competition in the WESM.
The Philippine Electricity Market Corporation
(PEMC) is already in the process of determining
appropriateness and compliance of the New
Market Management Systems (NMMS) to the
rules of the new WESM design. The DOE on the
other hand has promulgated amendments to the
WESM Rules for this purpose.
Retail Competition and Open Access (RCOA)
The implementation of RCOA is pursuant to
Section 31 of Republic Act No. 9136 or the EPIRA
where Contestable Customers (CC) will be allowed
to source their supply of electricity from a Retail
Electricity Supplier (RES) by allowing the use
of transmission and distribution systems and
As of September 2016, the privatization level
of NPC generating assets in Luzon and Visayas
reached 93.5 percent while for total Philippines,
it stood at 71.8 percent having privatized a total
of 4,473 MW out 6,234 MW. With respect to IPP
contracts, privatized capacities include the
contracted capacities for Sual and Pagbilao coal-
fired thermal power plants, San Roque, Bakun,
and Benguet mini hydroelectric power plants
and the Ilijan Natural Gas Combined Cycle Power
Plant, and Unified Leyte GPP-Strips of Energy. This
is equivalent to 77.46 percent of the total NPC
contracted energy output in Luzon and Visayas
thereby marking the completion of the five
preconditions for the implementation of RCOA.
Wholesale Electricity Spot Market (WESM)
The establishment of WESM is part of the
package of electric power industry reforms
mandated by EPIRA where trading of electricity
through a transparent and competitive process
can be made. Following several months of trial
operations, the WESM commenced commercial
operations in the Luzon grid in 2016 while WESM
officially commenced operations in the Visayas
grid in 2010.
The need of further augmenting the power
supply in the Visayas region necessitated the
integration of the Visayas in the WESM. Further,
Luzon and Visayas provide market signals to
potential investors in the region making it more
efficient and a competitive power trading system,
and would allow for the optimization of the
energy flow between the two regions. As of 25
September 2016, the integrated WESM (Luzon
and Visayas) has a total of two hundred seventy-
six (276) registered participants comprised of one
hundred five (105) generation companies and one
hundred seventy-one (171) customers comprised
of sixteen (16) Private DUs, seventy-one (71) ECs,
The establishment of WESM is part of the package of electric
power industry reforms mandated by EPIRA where
trading of electricity through a transparent and competitive
process can be made.
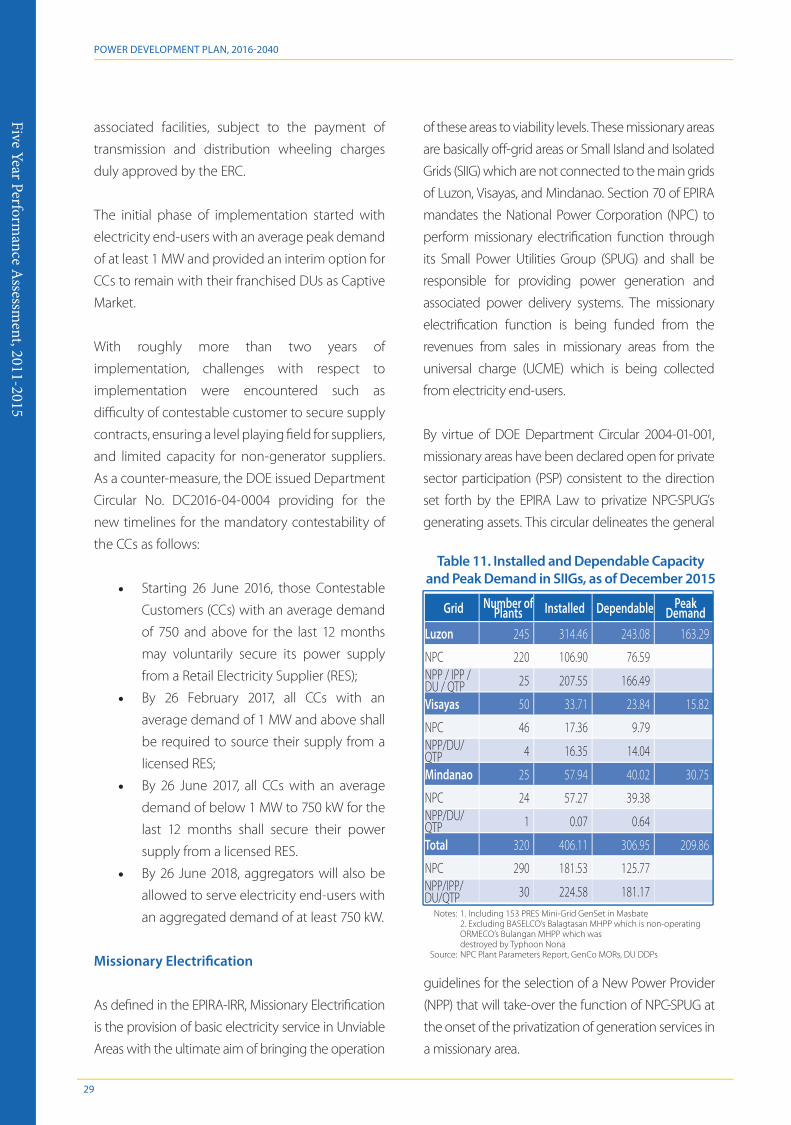
POWER DEVELOPMENT PLAN, 2016-2040
Five Year Performance A
ssessment, 2011-2015
29
associated facilities, subject to the payment of
transmission and distribution wheeling charges
duly approved by the ERC.
The initial phase of implementation started with
electricity end-users with an average peak demand
of at least 1 MW and provided an interim option for
CCs to remain with their franchised DUs as Captive
Market.
With roughly more than two years of
implementation, challenges with respect to
implementation were encountered such as
difficulty of contestable customer to secure supply
contracts, ensuring a level playing field for suppliers,
and limited capacity for non-generator suppliers.
As a counter-measure, the DOE issued Department
Circular No. DC2016-04-0004 providing for the
new timelines for the mandatory contestability of
the CCs as follows:
• Starting 26 June 2016, those Contestable
Customers (CCs) with an average demand
of 750 and above for the last 12 months
may voluntarily secure its power supply
from a Retail Electricity Supplier (RES);
• By 26 February 2017, all CCs with an
average demand of 1 MW and above shall
be required to source their supply from a
licensed RES;
• By 26 June 2017, all CCs with an average
demand of below 1 MW to 750 kW for the
last 12 months shall secure their power
supply from a licensed RES.
• By 26 June 2018, aggregators will also be
allowed to serve electricity end-users with
an aggregated demand of at least 750 kW.
Missionary Electri�cation
As defined in the EPIRA-IRR, Missionary Electrification
is the provision of basic electricity service in Unviable
Areas with the ultimate aim of bringing the operation
of these areas to viability levels. These missionary areas
are basically off-grid areas or Small Island and Isolated
Grids (SIIG) which are not connected to the main grids
of Luzon, Visayas, and Mindanao. Section 70 of EPIRA
mandates the National Power Corporation (NPC) to
perform missionary electrification function through
its Small Power Utilities Group (SPUG) and shall be
responsible for providing power generation and
associated power delivery systems. The missionary
electrification function is being funded from the
revenues from sales in missionary areas from the
universal charge (UCME) which is being collected
from electricity end-users.
By virtue of DOE Department Circular 2004-01-001,
missionary areas have been declared open for private
sector participation (PSP) consistent to the direction
set forth by the EPIRA Law to privatize NPC-SPUG’s
generating assets. This circular delineates the general
guidelines for the selection of a New Power Provider
(NPP) that will take-over the function of NPC-SPUG at
the onset of the privatization of generation services in
a missionary area.
Grid Number of Plants Installed Dependable Peak
DemandLuzon 245 314.46 243.08 163.29
NPC 220 106.90 76.59NPP / IPP / DU / QTP 25 207.55 166.49
Visayas 50 33.71 23.84 15.82
NPC 46 17.36 9.79NPP/DU/QTP 4 16.35 14.04
Mindanao 25 57.94 40.02 30.75
NPC 24 57.27 39.38NPP/DU/QTP 1 0.07 0.64
Total 320 406.11 306.95 209.86
NPC 290 181.53 125.77NPP/IPP/DU/QTP 30 224.58 181.17
Table 11. Installed and Dependable Capacity and Peak Demand in SIIGs, as of December 2015
1. Including 153 PRES Mini-Grid GenSet in Masbate2. Excluding BASELCO’s Balagtasan MHPP which is non-operating ORMECO’s Bulangan MHPP which was destroyed by Typhoon Nona NPC Plant Parameters Report, GenCo MORs, DU DDPs
Notes:
Source:
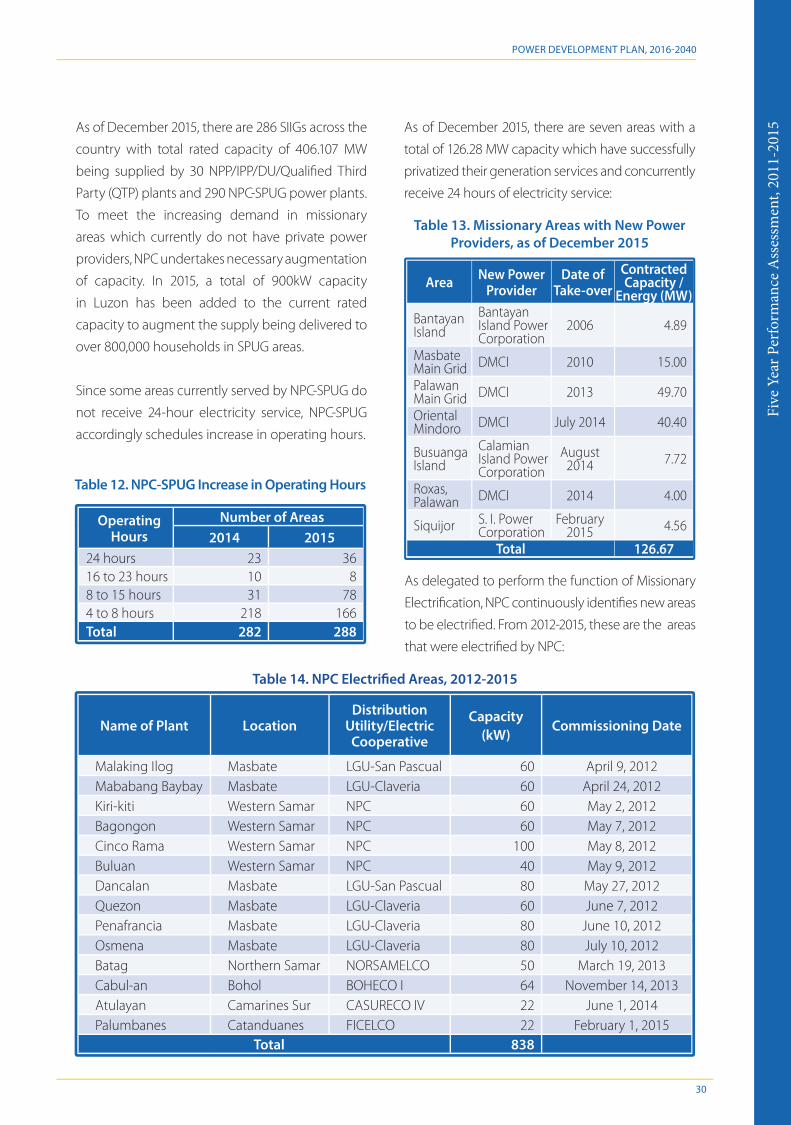
POWER DEVELOPMENT PLAN, 2016-2040
Five
Yea
r Per
form
ance
Ass
essm
ent,
2011
-201
5
30
As of December 2015, there are 286 SIIGs across the
country with total rated capacity of 406.107 MW
being supplied by 30 NPP/IPP/DU/Qualified Third
Party (QTP) plants and 290 NPC-SPUG power plants.
To meet the increasing demand in missionary
areas which currently do not have private power
providers, NPC undertakes necessary augmentation
of capacity. In 2015, a total of 900kW capacity
in Luzon has been added to the current rated
capacity to augment the supply being delivered to
over 800,000 households in SPUG areas.
Since some areas currently served by NPC-SPUG do
not receive 24-hour electricity service, NPC-SPUG
accordingly schedules increase in operating hours.
As of December 2015, there are seven areas with a
total of 126.28 MW capacity which have successfully
privatized their generation services and concurrently
receive 24 hours of electricity service:
As delegated to perform the function of Missionary
Electrification, NPC continuously identifies new areas
to be electrified. From 2012-2015, these are the areas
that were electrified by NPC:
Table 13. Missionary Areas with New Power Providers, as of December 2015
Area New Power Provider
Date of Take-over
Contracted Capacity /
Energy (MW)
Bantayan Island
Bantayan Island Power Corporation
2006 4.89
Masbate Main Grid DMCI 2010 15.00
Palawan Main Grid DMCI 2013 49.70
Oriental Mindoro DMCI July 2014 40.40
Busuanga Island
Calamian Island Power Corporation
August 2014 7.72
Roxas, Palawan DMCI 2014 4.00
Siquijor S. I. Power Corporation
February 2015 4.56
Total 126.67
As delegated to perform the function of Missionary
Electrification, NPC continuously identifies new
areas to be electrified. From 2012-2015, these are
the areas that were electrified by NPC:
Operating Hours
Number of Areas2014 2015
24 hours 23 3616 to 23 hours 10 88 to 15 hours 31 784 to 8 hours 218 166Total 282 288
Table 12. NPC-SPUG Increase in Operating Hours
Name of Plant LocationDistribution
Utility/Electric Cooperative
Capacity (kW)
Commissioning Date
Malaking Ilog Masbate LGU-San Pascual 60 April 9, 2012Mababang Baybay Masbate LGU-Claveria 60 April 24, 2012Kiri-kiti Western Samar NPC 60 May 2, 2012Bagongon Western Samar NPC 60 May 7, 2012Cinco Rama Western Samar NPC 100 May 8, 2012Buluan Western Samar NPC 40 May 9, 2012Dancalan Masbate LGU-San Pascual 80 May 27, 2012Quezon Masbate LGU-Claveria 60 June 7, 2012Penafrancia Masbate LGU-Claveria 80 June 10, 2012Osmena Masbate LGU-Claveria 80 July 10, 2012Batag Northern Samar NORSAMELCO 50 March 19, 2013Cabul-an Bohol BOHECO I 64 November 14, 2013Atulayan Camarines Sur CASURECO IV 22 June 1, 2014Palumbanes Catanduanes FICELCO 22 February 1, 2015
Total 838
Table 14. NPC Electri�ed Areas, 2012-2015

POWER DEVELOPMENT PLAN, 2016-2040
Five Year Performance A
ssessment, 2011-2015
31
Electri�cation
The government in partnership with various
stakeholders is committed to bring electricity
access to energy-poverty stricken areas in the
country. As a conduit to progress, electricity
access is interlinked with advancing the quality
of life, delivering the basic and essential services,
improving productivity and fostering economic
prosperity. It also directly impacts
education as children and youth in
unelectrified areas are able to reap
the benefits of electricity access
by having longer study hours in
their homes. This has been the
Government’s guiding framework
in its electrification efforts and
initiatives that covers barangays,
households and sitios.
For the 2017-2040 planning horizon,
the electrification goals that will
serve as guideposts for the sector
are: (i) 90 percent household
electrification by 2017; (ii) 100
percent electrification of targeted
and identified household accessible to grid (based
on 2015 Census) and accomplishment of off-grid
targets by 2022; (iii) Electrification of all targeted
and identified households (household beyond
2015 Census) and 100 percent electrification of
target household in off-grid areas within the
period 2023-2040 and (iv) total electricity access
by 2040.
Consistent with the electrification goals of the
PEP, the energy sector is also guided with the
nine (9)-point program of the Administration to
pursue 100 percent electrification of targeted
and identified households in all three major
islands.
Status of Electrification
The barangay was the starting point for the
program but focus shifted on energizing
households in 2010.26 Electrification
at the household level increased
from 79.7 percent in 2010 to 89.6
percent in July 2016.27 This shows
that 20,360,334 out of the potential
22,721,430 households are already
enjoying electricity access.
Electrification on a grid level
shows the Luzon has the highest
household electrification level at
94.8 percent followed by Visayas
at 92.4 percent and Mindanao
with 72.4 percent. On a per region
basis, National Capital Region
(NCR) has the highest household
electrification level at 98.3
percent (3,451,303 out of the 3,512,439 potential
households already with electricity access).
In Visayas and Mindanao, Region 7 (Central
Visayas) and Region XIII (CARAGA) registered
the highest electrification levels at 95.9 percent
and 93.8 percent respectively. ARMM remains
as the least electrified region in the country in
terms of households having only 38.7 percent
electrification level or 199,373 energized
households out of the potential 514,592 as
shown in the Table 15.
The shift to electrification at the household level from the barangay was one of the objectives stated under DC No. 2003-04-004 signed by then DOE Secretary Vincent S. Perez.DOE adopted NEA’s total potential households from 2011 – 2015 thus adjustments were made for the said period particularly the potential and served households covered by electric cooperatives (EC). The adjustment resulted to having 22,310,084 total potential households in 2015 which is higher than the 22,247,154 total potential households specified in the HEDP Accelerated Scenario. The harmonization with NEA’s is also in line with Sen. Osmeña’s inquiry to both DOE and NEA on the budgetary requirements for achieving 100 percent household electrification. The data sourced for the computation of Household Electrification Level are the NEA Status of Energization Reports for the case of Electric Cooperatives and the Distribution Development Plan (DDP) 2016-2025 submitted to DOE for the case of Private Investor Owned Utilities (PIOUs) and Local Goverment Unit Owned Utilities (LGUOUs).
26
27
The barangay was the starting point for the program but focus shifted
on energizing households in 2010.
Electri�cation at the household level increased from 79.7 percent in 2010 to
89.6 percent in July 2016.
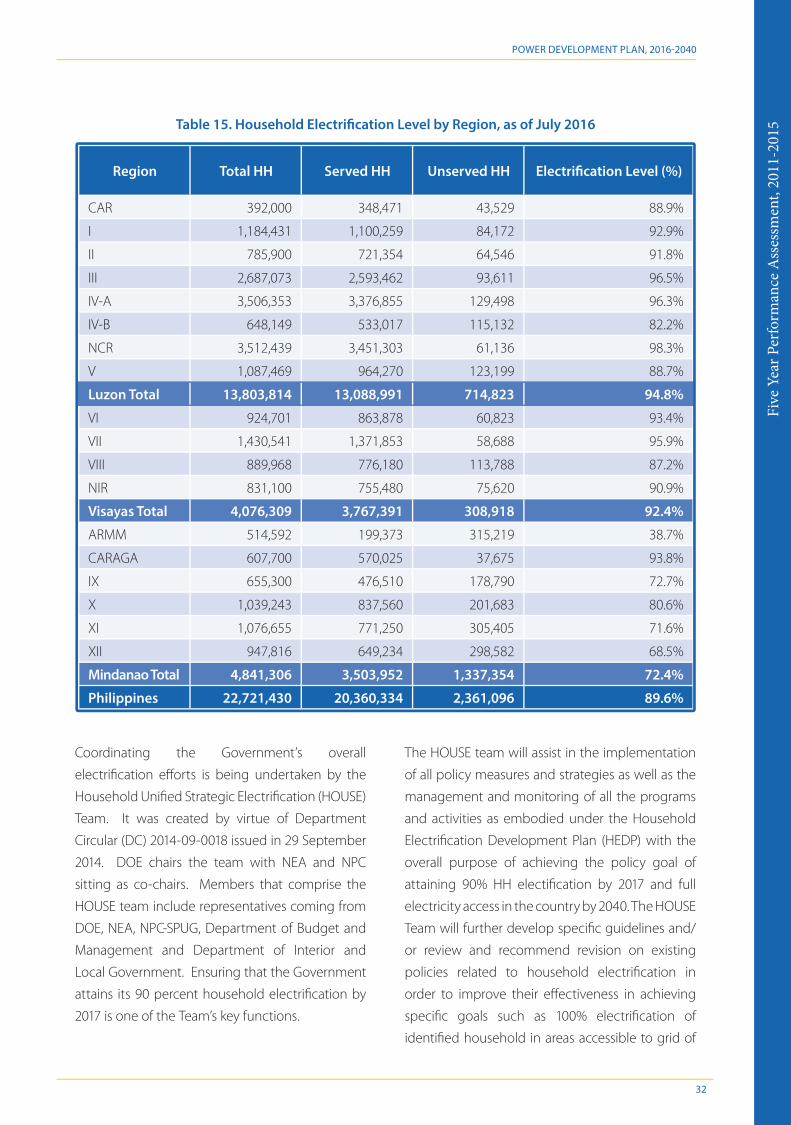
POWER DEVELOPMENT PLAN, 2016-2040
Five
Yea
r Per
form
ance
Ass
essm
ent,
2011
-201
5
32
Table 15. Household Electri�cation Level by Region, as of July 2016
Region Total HH Served HH Unserved HH Electri�cation Level (%)
CAR 392,000 348,471 43,529 88.9%
I 1,184,431 1,100,259 84,172 92.9%
II 785,900 721,354 64,546 91.8%
III 2,687,073 2,593,462 93,611 96.5%
IV-A 3,506,353 3,376,855 129,498 96.3%
IV-B 648,149 533,017 115,132 82.2%
NCR 3,512,439 3,451,303 61,136 98.3%
V 1,087,469 964,270 123,199 88.7%
Luzon Total 13,803,814 13,088,991 714,823 94.8%
VI 924,701 863,878 60,823 93.4%
VII 1,430,541 1,371,853 58,688 95.9%
VIII 889,968 776,180 113,788 87.2%
NIR 831,100 755,480 75,620 90.9%
Visayas Total 4,076,309 3,767,391 308,918 92.4%
ARMM 514,592 199,373 315,219 38.7%
CARAGA 607,700 570,025 37,675 93.8%
IX 655,300 476,510 178,790 72.7%
X 1,039,243 837,560 201,683 80.6%
XI 1,076,655 771,250 305,405 71.6%
XII 947,816 649,234 298,582 68.5%
Mindanao Total 4,841,306 3,503,952 1,337,354 72.4%
Philippines 22,721,430 20,360,334 2,361,096 89.6%
Coordinating the Government’s overall
electrification efforts is being undertaken by the
Household Unified Strategic Electrification (HOUSE)
Team. It was created by virtue of Department
Circular (DC) 2014-09-0018 issued in 29 September
2014. DOE chairs the team with NEA and NPC
sitting as co-chairs. Members that comprise the
HOUSE team include representatives coming from
DOE, NEA, NPC-SPUG, Department of Budget and
Management and Department of Interior and
Local Government. Ensuring that the Government
attains its 90 percent household electrification by
2017 is one of the Team’s key functions.
The HOUSE team will assist in the implementation
of all policy measures and strategies as well as the
management and monitoring of all the programs
and activities as embodied under the Household
Electrification Development Plan (HEDP) with the
overall purpose of achieving the policy goal of
attaining 90% HH electification by 2017 and full
electricity access in the country by 2040. The HOUSE
Team will further develop specific guidelines and/
or review and recommend revision on existing
policies related to household electrification in
order to improve their effectiveness in achieving
specific goals such as 100% electrification of
identified household in areas accessible to grid of
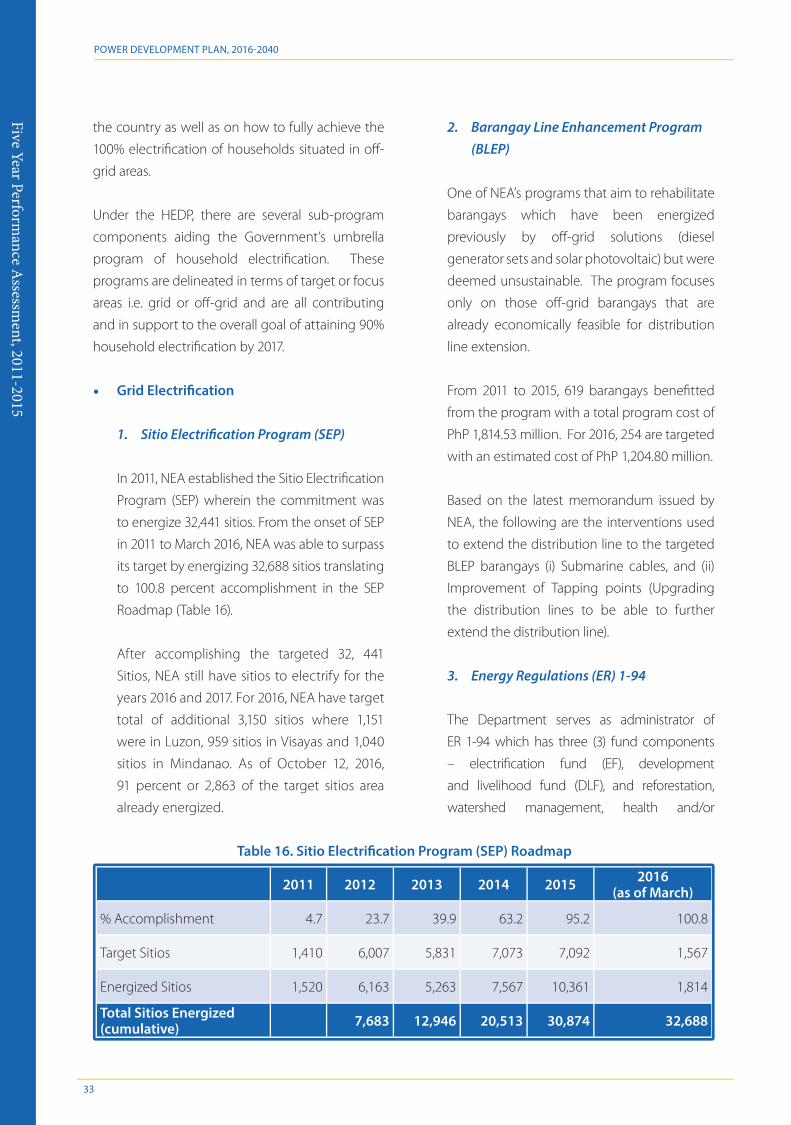
POWER DEVELOPMENT PLAN, 2016-2040
Five Year Performance A
ssessment, 2011-2015
33
the country as well as on how to fully achieve the
100% electrification of households situated in off-
grid areas.
Under the HEDP, there are several sub-program
components aiding the Government’s umbrella
program of household electrification. These
programs are delineated in terms of target or focus
areas i.e. grid or off-grid and are all contributing
and in support to the overall goal of attaining 90%
household electrification by 2017.
• Grid Electri�cation
1. Sitio Electri�cation Program (SEP)
In 2011, NEA established the Sitio Electrification
Program (SEP) wherein the commitment was
to energize 32,441 sitios. From the onset of SEP
in 2011 to March 2016, NEA was able to surpass
its target by energizing 32,688 sitios translating
to 100.8 percent accomplishment in the SEP
Roadmap (Table 16).
After accomplishing the targeted 32, 441
Sitios, NEA still have sitios to electrify for the
years 2016 and 2017. For 2016, NEA have target
total of additional 3,150 sitios where 1,151
were in Luzon, 959 sitios in Visayas and 1,040
sitios in Mindanao. As of October 12, 2016,
91 percent or 2,863 of the target sitios area
already energized.
2. Barangay Line Enhancement Program(BLEP)
One of NEA’s programs that aim to rehabilitate
barangays which have been energized
previously by off-grid solutions (diesel
generator sets and solar photovoltaic) but were
deemed unsustainable. The program focuses
only on those off-grid barangays that are
already economically feasible for distribution
line extension.
From 2011 to 2015, 619 barangays benefitted
from the program with a total program cost of
PhP 1,814.53 million. For 2016, 254 are targeted
with an estimated cost of PhP 1,204.80 million.
Based on the latest memorandum issued by
NEA, the following are the interventions used
to extend the distribution line to the targeted
BLEP barangays (i) Submarine cables, and (ii)
Improvement of Tapping points (Upgrading
the distribution lines to be able to further
extend the distribution line).
3. Energy Regulations (ER) 1-94
The Department serves as administrator of
ER 1-94 which has three (3) fund components
– electrification fund (EF), development
and livelihood fund (DLF), and reforestation,
watershed management, health and/or
2011 2012 2013 2014 2015 2016(as of March)
% Accomplishment 4.7 23.7 39.9 63.2 95.2 100.8
Target Sitios 1,410 6,007 5,831 7,073 7,092 1,567
Energized Sitios 1,520 6,163 5,263 7,567 10,361 1,814
Total Sitios Energized (cumulative) 7,683 12,946 20,513 30,874 32,688
Table 16. Sitio Electri�cation Program (SEP) Roadmap
POWER DEVELOPMENT PLAN, 2016-2040
Five
Yea
r Per
form
ance
Ass
essm
ent,
2011
-201
5
34
environment enhancement fund (RWMHEEF) –
utilized for host communities to promote growth
and advancement in their respective areas.
For the electrification program, DOE shall
effectively administer Electrification Fund of ER
1-94 in bringing electricity to all households,
prioritizing the host cities/municipalities
by implementing both grid and off-grid
electrification projects.
The DOE is currently
undertaking the “ER
1-94 Rationalization of
Electrification Fund Leading
towards 100% Electrification
of Host Community Targets
(ER 1-94 REFLECT Program).”
The objective of the program
is to conduct technical and
financial viability assessment
of potential electricity service
solutions that will result to
provision of electrification
projects funded under
ER 1-94 EF for the rural
development of Host
Communities of the country.
At total of 259 Host Communities (144 in Luzon,
53 in Visayas and 62 in Mindanao) were already
identified based on the current list of installed
generation facilities in the country.
As for the completed projects funded under
ER 1-94 EF, around 1,258 (1,218 are grid
and 40 are off-grid) sitios/barangays with
an equivalent household connection of
30,332 were energized from 2011 – July 2015.
The total approved project cost for these
sitios/barangays was at PhP1,408.5 million.
The Department targets to complete the
electrification projects and benefits annually
at least 3,000HH within the host communities.
4. Nationwide Intensi�cation of HouseholdElectri�cation (NIHE)
The NIHE is one of DOE’s locally-funded
projects (LFP). Approved in 2014, the project
will run for three (3) years (2015-2017). It has the
objective of developing and implementing
specific measures and financial incentives
(i.e. grant assistance) to mobilize DU’s in fast-
tracking connections of their remaining
unelectrified households.
For the grant assistance, the
program shall provide house-
wiring subsidy amounting to
Php 3,750 to poor and qualified
household situated to areas/
sitios where the distribution lines
of the DU is physically available.
For 2015, the DOE approved
a total of 30,512 Household
beneficiaries with a total amout
of PhP 114.42 million and will be
implemented by 22 participating
distribution utilities. For 2016, the
DOE approved a total of 116,592
Household beneficiaries with a
total amout of PhP 437.9 million
and will be implemented by 20 participating
distribution utilities. For 2017 another 183,000
household beneficiaries is target by the
program.
Also, the DOE have successfully conducted
a 9-Leg series of NIHE Project Development
Workshop with Luzon, Visayas and Mindanao
DUs. The said workshop provided the interested
DUs the information to effectively implement
the program in their franchise areas.
Aside from the grant assistance provided to
qualified household beneficiaries, the NIHE
programs also aims to provide the following
The NIHE is one of DOE’s locally-funded
projects (LFP). It has the objective
of developing and implementing
speci�c measures and �nancial incentives
(i.e. grant assistance) to mobilize DU’s in fasttracking connections of their remaining
unelectri�ed households.

POWER DEVELOPMENT PLAN, 2016-2040
Five Year Performance A
ssessment, 2011-2015
35
Technical assistance (i) Streamlining of
connection process; (ii) LGU-DU partnership
for assistance in connection permits; and (iii)
Policy support to address the issue of slum
electrification and flying connections, among
others.
• O�-Grid Electri�cation
1. Household Electri�cation Program (HEP) using renewable energy (RE) systems
The HEP involves the energization of off-grid
households using mature RE technologies which
include photovoltaic solar home system (PV-SHS),
PV streetlights and micro-hydro systems. From
2011 to 2015, a total of 22,904 off-grid households
gained electricity access thru the program.
2. Solar PV Mainstreaming (under Accessto Sustainable Energy Program or ASEP)
This PVM project is co-financed by the EU-
Philippines “Access to Sustainable Energy
Programme” (ASEP), DOE, participating Electric
Cooperatives and the recipient households.
It targets 40,500 households for the next
three (3) years to be provided with solar PV
electrification as a utility service offering by
the Electric Cooperatives. To date, eight (8) ECs
have committed to participate in the Project.
Activities undertaken over the past months
include (a) market segmentation through
remote sensing and geo-tagging of potential
households beneficiaries, (b) firming up the
service packages and technical specifications of
the products to be offered to the households;
(c) establishing the PV supply chain; and (d)
creation of the Solar Business Unit (SBUs) within
the ECs organizational structure.
Of recent events, ASEP through the World
Bank and Global Partnership on Output-based
Aid (GPOBA), organized the first Philippines
Offgrid Electrification Expo held at SMX MOA,
Pasay City from September 21-23, 2016 and
participated in by international and local PV
suppliers. The participants of this Expo had
the opportunities to learn more about the
incentive program demonstrate their off-grid
products, network with international off-grid
industry leaders (e.g., distributors of Lighting
Global certified products and 2015-16 Global
LEAP Awards Winners and Finalists), meet with
local electricity cooperatives to explore ways
to conduct business in the growing off-grid
market.
Meanwhile, the Energy Regulatory Commission
(ERC) approved in 25 October 2016, the
benchmark tariff for SHS to be adopted by the
ECs as follows:
SHS Capacity Zone A Zone B Zone C
50 Wp 207 215 222
30 Wp 180 187 195
Table 17. Benchmark Tari� for Solar Home System (SHS)
The Benchmark SHS Tariff is the best
approximation of the operating costs an EC
incurs in providing electricity service to all SHS
Customers, including the cost of maintaining
and replacing the SHS components as
necessary, and both direct and indirect
overhead costs (ie., salaries, transportation
cost, etc).
The costs of servicing SHS for more remote
and difficult to reach areas shall be considered
through an incremental cost adjustment that
will apply to SHS Customers in such areas.
This adjustment will be common across

POWER DEVELOPMENT PLAN, 2016-2040
Five
Yea
r Per
form
ance
Ass
essm
ent,
2011
-201
5
36
sales. To date, overall installed capacity is
1.10MW covering the highest recorded peak
demand of 660kW. The average system loss
is 10%.
To date, there were 680 remaining
unelectrified households which can be
classified as informal settlers as they do
not have permanent residencies. PSPI is
coordinating with the LGU and DOE on how
to provide electricity to these households.
In regard to the Biomass Plant, testing and
commissioning was completed last February
2016 and now operating with a dependable
capacity of 10 kW. There are modifications
still to be made on the gasifier to meet the
target output of 50 kW due to the very low
output. Gasifier is undergoing upgrading
including the purchase of blower with
a higher capacity to supply enough gas
required by the gas engine to operate at
100% load.
In order to provide efficient and reliable
service and serve more customers,
PSPI completed the following activities,
namely: a) Extension of line in Kinurong;
b) Commissioning of 350 kW in April
2016; c) Macadam Road pole relocation in
September 2016; and d) replacement of
overloaded distribution transformer and
splitting of transformer load to achieve a
balanced system for system improvement.
b. Malapascua QTP Project in MalapascuaIsland, Logon, DaanBantayan, Cebu
PSPI continues to operate its existing
generating facility in the island. For the
reporting period, the average net electricity
generation was 170,501 kWh per month and
the average electricity sales was 159,872
all ECs serving SHS Customers in the same
defined zones, referring to the distance of
SHS customers from the EC’s main office, the
farthest (Zone C) as the highly mountainous
areas and islands/islets.
3. Quali�ed Third Party (QTP) Program
Under Sec. 59 of EPIRA, areas deemed unviable
and waived by the DUs may be offered to
QTPs as part of the missionary electrification
program. There is now a growing interest
among private sector to enter into QTP
operations with the entry of the renewables
in offgrid electrification. Said interest was
generated by the various incentives offered
to private sector among which is the
cash generation based incentive per kWh
generated, equivalent to 50% of the Universal
Charge (UC) in the area where it operates.
Hence, the program anticipates the future
development of mini-grid and micro-grid
electrification projects using solar, biomass,
wind and other renewable energy sources by
other proponents that may also adopt QTP
approach.
Following are the updates on the QTP Program
being spearheaded by the DOE:
a. Rio Tuba QTP Project in Bataraza,Palawan
PowerSource Philippines, Inc. (PSPI)
continues to operate as QTP in Barangay Rio
Tuba. For the reporting period, the average
monthly electricity generation reached
295,599 kWh and the average monthly
electricity sales is 264,647 kWh, indicating an
increase of about 7.69% & 7.0% respectively
as compared with the last year’s report
(for 6 months period from March 2015 to
September 2015) electricity generation and

POWER DEVELOPMENT PLAN, 2016-2040
Five Year Performance A
ssessment, 2011-2015
37
kWh. There was a significant increase of
about 18.12% in generation and 22.82% in
sales showing the continuous growth of
demand in the area. In June 2016, a new
genset was installed with a capacity 500 kW
in replacement of genset no.3. The installed
capacity now is 1.2 MW. Highest recorded
peak demand is 440kW and the average
system loss is 6.26%.
For the reporting period, 40 additional
households were electrified, a 3.26% increase
in the past six (6) months. Based on the
barangay records, out of 1,227 households in
the island, 1,007 are connected to the mini
grid system, achieving 82.07% electrification
level. The remaining 220 households are
targeted to the connected to the grid within
the next 2-3 years.
In June 2016, the final decision with regard
to PSPI’s application for Malapascua was
issued by ERC. On the Su bsidized Approved
Retail Rate (SARR), the ERC granted a 2-tier
tariff as follows:
• For consumers with monthly
consumption of 40kWh or lower, the
SARR is PhP12/kWh.
• For consumers with monthly
consumption higher than 40kWh, the
SARR is Php15kWh.
On August 2016, PSPI has complied with NPC’s
Subsidy Protocol Payment with the installation
of NPC Billing Meter on project site.
c. Liminangcong, Taytay, Palawan
The mini-grid systems in these barangays
were funded by the Provincial Government
of Palawan (PGP) and operated by a
Barangay Power Association from 1995-
2012. In February 2013, a Master Agreement
was signed between PGP and PSPI to take-
over the management and operations in
nine (9) areas including. Consequently, an
Alliance with Palawan Electric Cooperative,
Inc. (PALECO) was signed in November
2013 for the electrification of remote and
unviable areas through the QTP Program of
which these areas were also included.
On August 2016, PSPI received the ERC’s
order for the Provisional Authority (PA).
In the Order, the ERC granted the SARR
equivalent to PhP9.12/kWh.
Currently, the total number of customers is
705 which results to 78% electrification level
and expected to increase due to upcoming
line extensions. The installed capacity is 310
kW and has a recorded peak demand of
80 kW with an average loss is 13.63%. PSPI
has an on-going replacement of defective
household kilowatt-hour meters and
upgrading of distribution system to reduce
the losses.
From March to September 2016, the average
monthly net electricity generation is 21,953
kWh and the average monthly electricity
sale is 18,960 kWh.
The operating hours was gradually increased
from 8-12-14 hours and now reaching the
20 hour operation (6AM to 2AM). PSPI is
expecting a 24/7 operation on the fourth
quarter of 2016 as soon as the new gensets
are installed and commissioned.
d. Brgy. Cabayugan , Puerto Princesa City
On 05 October 2016, ERC approved the: (i)
application of Sabang Renewable Energy
Corporation (SREC) for Authority to Operate

POWER DEVELOPMENT PLAN, 2016-2040
Five
Yea
r Per
form
ance
Ass
essm
ent,
2011
-201
5
38
(ATO) as a Qualified Third Party (QTP) in
Barangay Cabayugan, Puerto Princesa City,
Palawan and (ii) correspondingly, its QTP
Service and Subsidy Agreement (QSSA)
with the National Power Corporation (NPC).
The Project comprises a 1.404 (Solar
PV), 2.363 (battery), and 1.280 (four (4)
gensets@320kW diesel) to be installed
in year 1 and additional capacities to be
installed in succeeding years as the energy
demand increases in the area.
e. Other QTP Projects:
ERC still has to issue its approval on the
application of PowerSource Philippines,
Inc. (PSPI) for the following QTP Projects: (a)
Balut Island comprising seven (7) barangays
in Sarangani, Davao Occidental; and, (b)
Brgy. Candawaga and Culasian, Municipality
of Rizal, Palawan.
On the other hand, the DOE expects to
receive the technical and financial proposals
for the potential QTPs for the following areas:
• Sixty-six (66) Sitios in the Province of
Apayao;
• Lahuy Island, Municipality of
Caramoan, Camarines Sur (with
4 barangays, namely Gata, Oring,
Daraga, and Gogon);
• Haponan Island in the same
Municipality;
• Quinasalag Island in the Municipality
of Garchitorena, Camarines Sur (with
8 barangays, as follows: Dangla,
Binagasbasan, Burabod, Cagamutan,
Mansangat, Tamiawon, Cagnipa, and
Sumaoy); and,
• Semirara Island in the Municipality of
Caluya, Antique (with 3 barangays)

Dem
and-Supply Outlook, 2016-2040
Dem
and-Supply Outlook, 2016-2040
Angat Hydroelectric Power Plant - Angat Hydropower Corp.739.2MW Kalayaan Pumped Storage Hydroelectric Power Plant - Electric Power Development Co., Ltd.42.6MW Sibulan Hydroelectric Power Plant - HEDCOR Sibulan, Inc.
T-D:

Dem
and-
Supp
ly O
utlo
ok, 2
016-
2040
POWER DEVELOPMENT PLAN, 2016-2040
40
ELECTRICITY DEMAND FORECASTING METHODOLOGY AND ASSUMPTIONS
The preparation of an accurate and acceptable
electricity demand forecast is crucial in power
system planning and development as this load
forecast will determine the country’s future
power requirements as well as the necessary
generation investments and distribution and
transmission reinforcements to meet future
demand. High demand projection could lead to
over investments especially on the generation
sector thereby entailing wastes and inefficiency,
while under projection could result to capacity
shortfalls when demand would exceed supply.
To address these shortcomings requires
the use of accurate input data, appropriate
methodology and valid assumptions. Figure
14 shows the steps in coming up with the
electricity sales and peak demand forecasts for
the three main grids.
Figure 14. Electricity Sales and Peak Demand Forecast
Private Utilities
New Industry / Customers
Electric Cooperatives
Non-utility customers
Distribution Development
Plan
DU’s Monthly Operations
Report / MFSR
Embedded Generators
New Industry / Customers
Power Market Assessment
• Historical Salesof each utility
• HistoricalGeneration
• Load Factor• System Peak• NGCP• Power Delivery
/ Statistics• Forecast of
each utility
System Sales Forecast
Energy Generation Forecast
System Peak Demand Forecast
1. Data Collection
Actual 2015 data on the following were
collected to serve as the reference forecast
scenario for 2016-2040:
A. Power Generation submitted by
Generation Companies (GenCos) through
their Monthly Operations Report (MOR);
B. Power Delivered by the National Grid
Corporation of the Philippines (NGCP)
to Distribution Utilities (DUs), Non-Utility
Customers or directly-connected industries,
Economic Zones, Government Owned
Utility (GOU) and Generation Customers;
C. Electricity Sales and Consumption sourced
from the MOR submitted by private DUs
and Monthly Financial and Statistical Report
(MFSR) submitted by Electric Cooperatives
(ECs) thru the National Electrification
Administration (NEA); and

Dem
and-Supply Outlook, 2016-2040
POWER DEVELOPMENT PLAN, 2016-2040
41
By 2040, peak demand is expected to increase
by about four times from 12,213 MW in 2015 to
49,287 MW in 2040 under the high GDP growth
scenario. This increase is translated to a 6 percent
annual average growth rate from 2016 to 2040.
On a per grid basis, Mindanao is projected to have
the highest annual average growth at 8 percent,
followed by Visayas at 7 percent and Luzon at 5
percent.
Grid YearHigh GDP
Growth Rate (%)
Electricity-to-GRDP Elasticity
Luzon
2017 7.00 0.7
2018 - 2020 8.00 0.7
2021 - 2040 7.50 0.7
Visayas
2017 7.00 1.0
2018 - 2020 8.00 1.0
2021 - 2040 7.50 1.0
Mindanao
2017 7.00 1.0
2018 - 2020 8.00 1.0
2021 - 2040 7.50 1.0
DBCC is composed of the Department of Budget and Management (DBM), Department of Finance (DOF), National Economic and Development Authority (NEDA) and Office of the President (OP)Ratio of electricity consumption and GRDP growth rate
28
29
Table 18. Energy and Economic Growth Assumptions by Grid, 2016-2030
Table 19. SU/TL and Load Factor Assumptions
Grid SU/TL (%) Load Factor (%)Luzon 7.15 74.6
Visayas 5.88 71.6
Mindanao 3.84 72.6
By 2040, peak demand is expected to increase by about
four times from 12,213 MW in 2015 to 49,287 MW in 2040 under the high GDP growth
scenario.
D. Other relevant data such as station use,
transmission losses, peak demand and
load factor gathered by the DOE.
2. Electricity Sales and Peak DemandForecasts
The high GDP growth projection of the
Development Budget Coordination Committee
(DBCC)28 at 7 to 8 percent and the electricity
consumption to gross regional domestic product
(GRDP)29 of Luzon, Visayas and Mindanao based
on historical trend were used and applied to the
actual 2015 electricity sales to come up with the
baseline electricity sales forecasts. This high GDP
growth forecast is aligned with the long-term goal
towards industrialization and increase in income
per capita which lead to higher electricity demand.
The historical average of 2004 to 2015 actual
electricity-to-GRDP elasticity was used for Luzon
and Visayas30 while the elasticity adopted for
Mindanao is pegged at 1.0 to account for the
suppressed electricity demand and insufficient
supply during the previous years. This elasticity
level is also fixed at 1.0 in anticipation of demand
side expansion in the region for the coming years
brought by the commercial operation of large
power generation plants starting 2015.
3. Peak Demand Forecasting
From the energy sales forecasts, the actual 2015
Station Use (SU) and transmission Losses (TL) are
added to come up with the gross generation. From
this gross generation, the peak demand forecasts
are derived using the load factor approach which is
also based on the actual load factor for 2015.
30 Some annual values were not included in the computation to isolate the effects of extreme weather occurrences such as El Niño and Typhoon Yolanda and Global Financial Crisis

Dem
and-
Supp
ly O
utlo
ok, 2
016-
2040
POWER DEVELOPMENT PLAN, 2016-2040
42
Table 20. Grid Peak Demand Forecast, 2016-2040 (in MW)
Year Luzon Visayas Mindanao Philippines
ACTUAL
2011 7,552 1,481 1,346 10,379
2012 7,889 1,551 1,321 10,761
2013 8,305 1,572 1,428 11,305
2014 8,717 1,636 1,469 11,822
2015 8,928 1,768 1,517 12,213
FORECAST
2016 9,726* 1,878* 1,786 13,390
2017 9,870 1,997 1,911 13,778
2018 10,368 2,143 2,064 14,575
2019 10,895 2,298 2,229 15,422
2020 11,451 2,465 2,407 16,323
2021 12,000 2,633 2,588 17,221
2022 12,579 2,812 2,782 18,173
2023 13,187 3,004 2,990 19,181
2024 13,828 3,209 3,215 20,252
2025 14,501 3,427 3,456 21,384
2026 15,210 3,661 3,715 22,586
2027 15,955 3,910 3,993 23,858
2028 16,739 4,176 4,293 25,208
2029 17,564 4,461 4,615 26,640
2030 18,432 4,765 4,961 28,158
2031 19,342 5,089 5,333 29,764
2032 20,298 5,436 5,733 31,467
2033 21,301 5,806 6,163 33,270
2034 22,353 6,202 6,625 35,180
2035 23,457 6,624 7,122 37,203
2036 24,616 7,076 7,656 39,348
2037 25,832 7,558 8,231 41,621
2038 27,108 8,072 8,848 44,028
2039 28,447 8,622 9,512 46,581
2040 29,852 9,210 10,225 49,287
* Actual 2016 Peak Demand as of May 2016
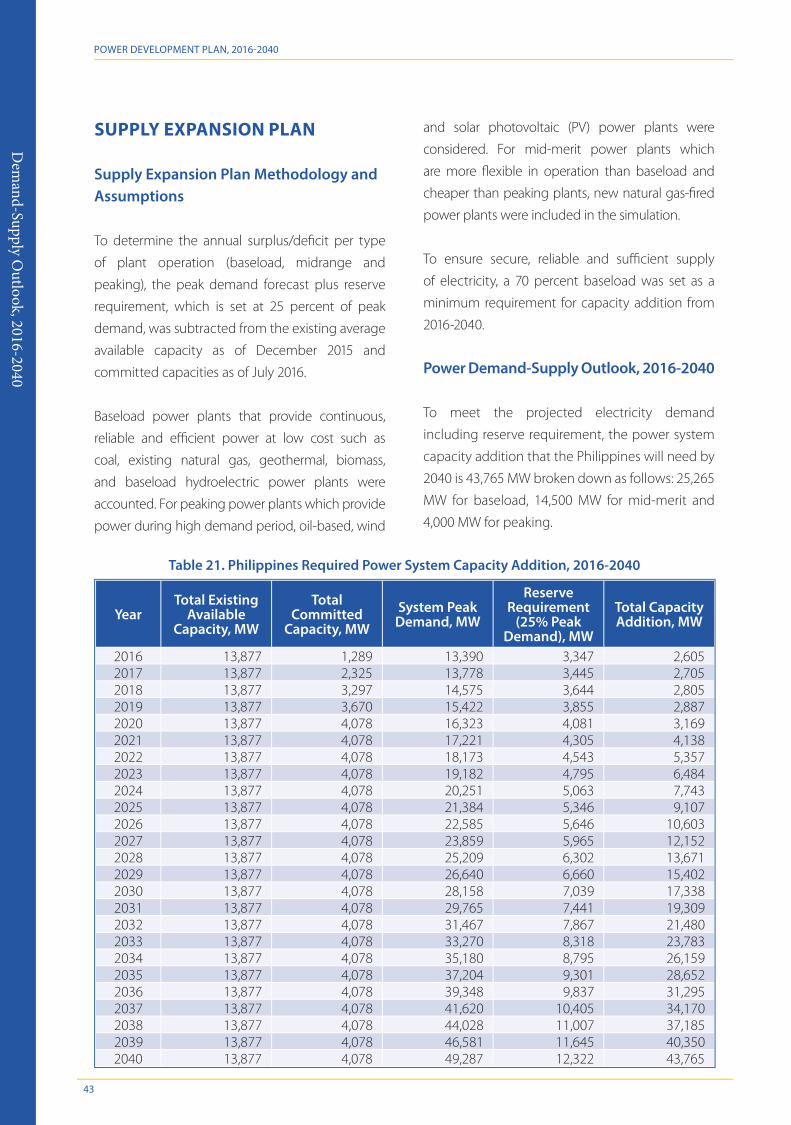
Dem
and-Supply Outlook, 2016-2040
POWER DEVELOPMENT PLAN, 2016-2040
43
Table 21. Philippines Required Power System Capacity Addition, 2016-2040
YearTotal Existing
Available Capacity, MW
Total Committed
Capacity, MWSystem Peak
Demand, MW
Reserve Requirement
(25% Peak Demand), MW
Total Capacity Addition, MW
2016 13,877 1,289 13,390 3,347 2,605 2017 13,877 2,325 13,778 3,445 2,705 2018 13,877 3,297 14,575 3,644 2,805 2019 13,877 3,670 15,422 3,855 2,887 2020 13,877 4,078 16,323 4,081 3,169 2021 13,877 4,078 17,221 4,305 4,138 2022 13,877 4,078 18,173 4,543 5,357 2023 13,877 4,078 19,182 4,795 6,484 2024 13,877 4,078 20,251 5,063 7,743 2025 13,877 4,078 21,384 5,346 9,107 2026 13,877 4,078 22,585 5,646 10,603 2027 13,877 4,078 23,859 5,965 12,152 2028 13,877 4,078 25,209 6,302 13,671 2029 13,877 4,078 26,640 6,660 15,402 2030 13,877 4,078 28,158 7,039 17,338 2031 13,877 4,078 29,765 7,441 19,309 2032 13,877 4,078 31,467 7,867 21,480 2033 13,877 4,078 33,270 8,318 23,783 2034 13,877 4,078 35,180 8,795 26,159 2035 13,877 4,078 37,204 9,301 28,652 2036 13,877 4,078 39,348 9,837 31,295 2037 13,877 4,078 41,620 10,405 34,170 2038 13,877 4,078 44,028 11,007 37,185 2039 13,877 4,078 46,581 11,645 40,350 2040 13,877 4,078 49,287 12,322 43,765
SUPPLY EXPANSION PLAN
Supply Expansion Plan Methodology and Assumptions
To determine the annual surplus/deficit per type
of plant operation (baseload, midrange and
peaking), the peak demand forecast plus reserve
requirement, which is set at 25 percent of peak
demand, was subtracted from the existing average
available capacity as of December 2015 and
committed capacities as of July 2016.
Baseload power plants that provide continuous,
reliable and efficient power at low cost such as
coal, existing natural gas, geothermal, biomass,
and baseload hydroelectric power plants were
accounted. For peaking power plants which provide
power during high demand period, oil-based, wind
and solar photovoltaic (PV) power plants were
considered. For mid-merit power plants which
are more flexible in operation than baseload and
cheaper than peaking plants, new natural gas-fired
power plants were included in the simulation.
To ensure secure, reliable and sufficient supply
of electricity, a 70 percent baseload was set as a
minimum requirement for capacity addition from
2016-2040.
Power Demand-Supply Outlook, 2016-2040
To meet the projected electricity demand
including reserve requirement, the power system
capacity addition that the Philippines will need by
2040 is 43,765 MW broken down as follows: 25,265
MW for baseload, 14,500 MW for mid-merit and
4,000 MW for peaking.
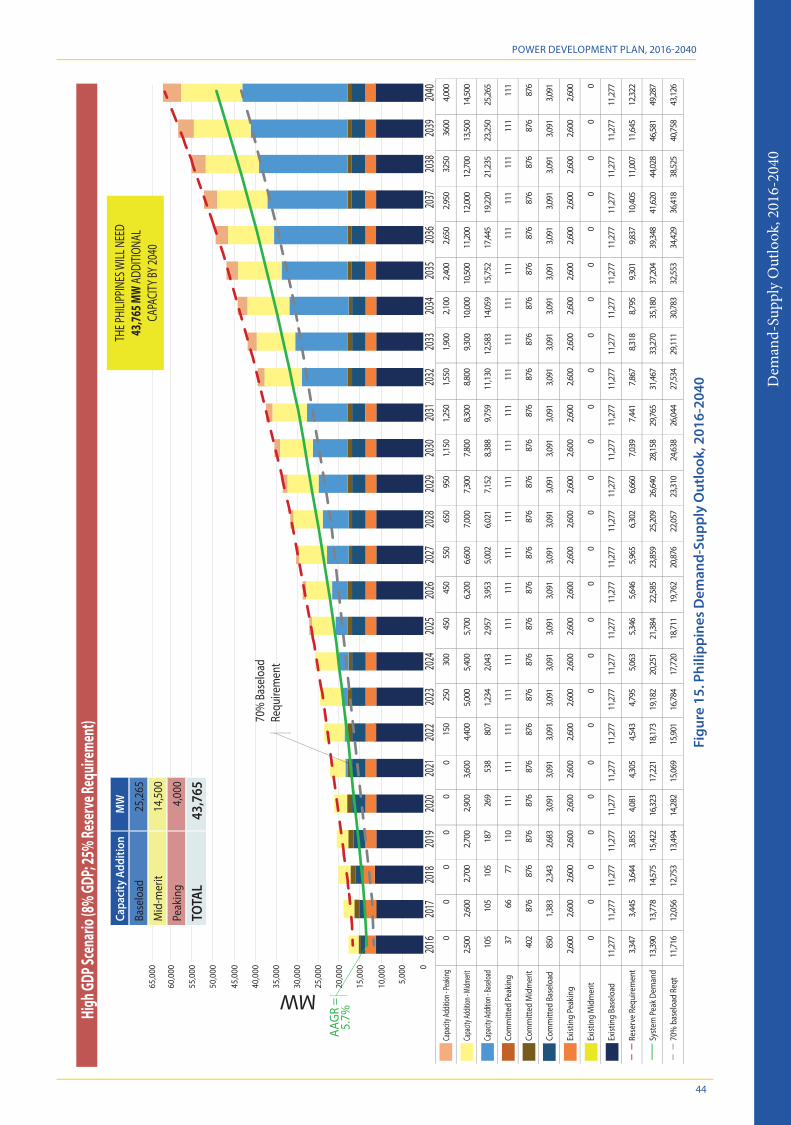
Dem
and-
Supp
ly O
utlo
ok, 2
016-
2040
POWER DEVELOPMENT PLAN, 2016-2040
44
Figu
re 1
5. P
hilip
pine
s D
eman
d-Su
pply
Out
look
, 201
6-20
40
High
GDP S
cena
rio (8
% GD
P; 25
% Re
serve
Requ
ireme
nt)
MW
Capa
city A
dditio
n - Pe
aking
00
00
00
150
250
300
450
450
550
650
950
1,150
1,250
1,550
1,900
2,100
2,400
2,650
2,950
3250
3600
4,000
Capa
city A
dditio
n - M
idmeri
t2,5
002,6
002,7
002,7
002,9
003,6
004,4
005,0
005,4
005,7
006,2
006,6
007,0
007,3
007,8
008,3
008,8
009,3
0010
,000
10,50
011
,200
12,00
0 12
,700
13,50
014
,500
Capa
city A
dditio
n - Ba
seloa
d10
510
510
518
726
953
880
71,2
342,0
432,9
573,9
535,0
026,0
217,1
528,3
889,7
5911
,130
12,58
314
,059
15,75
217
,445
19,22
021
,235
23,25
025
,265
Com
mitt
ed P
eaki
ng37
6677
110
111
111
111
111
111
111
111
111
111
111
111
111
111
111
111
111
111
111
111
111
111
Com
mitt
ed M
idm
erit
402
876
876
876
876
876
876
876
876
876
876
876
876
876
876
876
876
876
876
876
876
876
876
876
876
Com
mitt
ed B
asel
oad
850
1,383
2,343
2,683
3,091
3,091
3,091
3,091
3,091
3,091
3,091
3,091
3,091
3,091
3,091
3,091
3,091
3,091
3,091
3,091
3,091
3,091
3,091
3,091
3,091
Exist
ing
Peak
ing
2,600
2,600
2,600
2,600
2,600
2,600
2,600
2,600
2,600
2,600
2,600
2,600
2,600
2,600
2,600
2,600
2,600
2,600
2,600
2,600
2,600
2,600
2,600
2,600
2,600
Exist
ing
Mid
mer
it0
00
00
00
00
00
00
00
00
00
00
00
00
Exist
ing
Base
load
11,27
711
,277
11,27
711
,277
11,27
711
,277
11,27
711
,277
11,27
711
,277
11,27
711
,277
11,27
711
,277
11,27
711
,277
11,27
711
,277
11,27
711
,277
11,27
711
,277
11,27
711
,277
11,27
7
Rese
rve
Requ
irem
ent
3,347
3,445
3,644
3,855
4,081
4,305
4,543
4,795
5,063
5,346
5,646
5,965
6,302
6,660
7,039
7,441
7,867
8,318
8,795
9,301
9,837
10,40
511
,007
11,64
512
,322
Syst
em P
eak D
eman
d13
,390
13,77
814
,575
15,42
216
,323
17,22
118
,173
19,18
220
,251
21,38
422
,585
23,85
925
,209
26,64
028
,158
29,76
531
,467
33,27
035
,180
37,20
439
,348
41,62
044
,028
46,58
149
,287
70%
bas
eloa
d Re
qt11
,716
12,05
612
,753
13,49
414
,282
15,06
915
,901
16,78
417
,720
18,71
119
,762
20,87
622
,057
23,31
024
,638
26,04
427
,534
29,11
130
,783
32,55
334
,429
36,41
838
,525
40,75
843
,126
60,0
00
65,0
00
55,0
00
50,0
00
45,0
00
40,0
00
35,0
00
30,0
00
25,0
00
20,0
00
15,0
00
10,0
00
5,00
0
2016
2017
2018
020
2520
3320
2620
3420
1920
2720
3520
2020
2820
3620
2120
2920
3720
2220
3020
3820
2320
3120
3920
2420
3220
40
AAG
R =
5.7%
70%
Bas
eloa
dRe
quire
men
t
Capa
city
Add
ition
MW
Base
load
25,2
65
Mid
-mer
it14
,500
Peak
ing
4,00
0
TOTA
L43
,765
THE P
HILIP
PINES
WILL
NEE
D43
,765 M
W A
DDITI
ONAL
CAPA
CITY
BY 20
40

Dem
and-Supply Outlook, 2016-2040
POWER DEVELOPMENT PLAN, 2016-2040
45
Luzon grid’s peak demand by 2040 is expected
to triple from 9,726 MW in 2016 to 29,852 MW
by 2040. With this expected electricity demand
growth, the grid will be needing 13,635 MW
of baseload capacity, 8,300 MW of mid-merit
capacity and 2,450 MW peaking capacity with
a total of 24,385 MW capacity addition in the
grid. Considering the existing available capacity
including the committed capacity up to 2020,
Luzon will start to need additional capacity by
2023.
40,000
Capacity Addition - Peaking Capacity Addition - Midmerit Capacity Addition - Baseload Committed Peaking Committed Midmerit Committed Baseload
Existing Peaking Existing Midmerit Existing Baseload Reserve Requirement System Peak Demand 70% baseload Reqt
24,000
32,000
16,000
6,000
36,000
20,000MW
28,000
12,000
2,000
2016 2024 20322020 2028 20362018 2026 20342022 2030 20382017 2025 20332021 2029 20372019 2027 20352023 2031 2039 2040
38,000
22,000
30,000
14,000
4,000
34,000
18,000
8,000
26,000
10,000
0
Figure 16. Luzon Demand-Supply Outlook, 2016-2040
Table 22. Luzon Required Annual Capacity Addition, 2016-2040
YearTotal Existing
Available Capacity
Total Commited
Capacity, MWSystem Peak
Demand, MW
Reserve Requirements
(25% Peak Demand), MW
Total Capacity Addition, MW
2016 10,361 569 9,726 2,432 1,5002017 10,361 1,442 9,870 2,467 1,5002018 10,361 1,871 10,368 2,592 1,5002019 10,361 2,241 10,895 2,724 1,5002020 10,361 2,650 11,.451 2,863 1,5002021 10,361 2,650 12,000 3,000 2,0002022 10,361 2,650 12,579 3,145 2,7502023 10,361 2,650 13,187 3,297 3,4852024 10,361 2,650 13,828 3,457 4,2752025 10,361 2,650 14,501 3,625 5,1652026 10,361 2,650 15,210 3,802 6,0052027 10,361 2,650 15,955 3,989 6,9802028 10,361 2,650 16,739 4,185 7,9202029 10,361 2,650 17,564 4,391 8,9452030 10,361 2,650 18,432 4,608 10,0702031 10,361 2,650 19,342 4,836 11,1802032 10,361 2,650 20,298 5,074 12,3902033 10,361 2,650 21,301 5,325 13,7002034 10,361 2,650 22,353 5,588 15,0102035 10,361 2,650 23,457 5,864 16,3552036 10,361 2,650 24,616 6,154 17,8002037 10,361 2,650 25,832 6,458 19,3452038 10,361 2,650 27,108 6,777 20,9252039 10,361 2,650 28,447 7,112 22,6052040 10,361 2,650 29,852 7,463 24,385
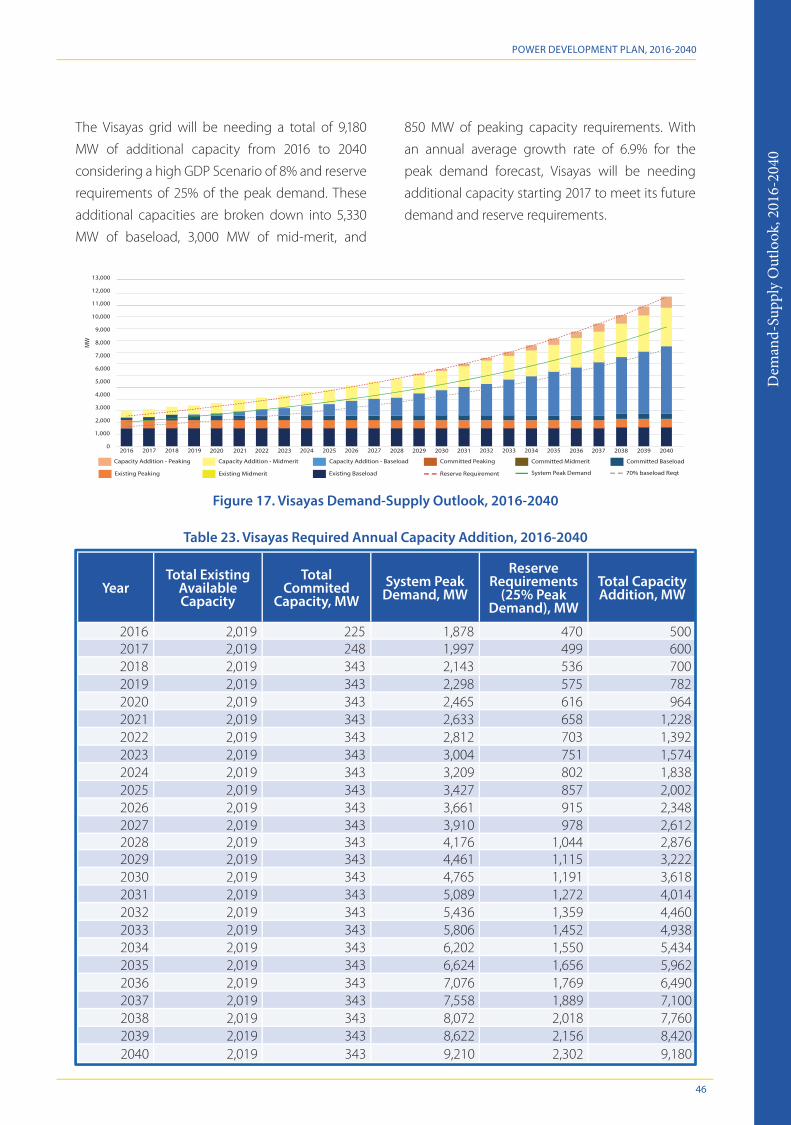
Dem
and-
Supp
ly O
utlo
ok, 2
016-
2040
POWER DEVELOPMENT PLAN, 2016-2040
46
The Visayas grid will be needing a total of 9,180
MW of additional capacity from 2016 to 2040
considering a high GDP Scenario of 8% and reserve
requirements of 25% of the peak demand. These
additional capacities are broken down into 5,330
MW of baseload, 3,000 MW of mid-merit, and
850 MW of peaking capacity requirements. With
an annual average growth rate of 6.9% for the
peak demand forecast, Visayas will be needing
additional capacity starting 2017 to meet its future
demand and reserve requirements.
Table 23. Visayas Required Annual Capacity Addition, 2016-2040
YearTotal Existing
Available Capacity
Total Commited
Capacity, MWSystem Peak
Demand, MW
Reserve Requirements
(25% Peak Demand), MW
Total Capacity Addition, MW
2016 2,019 225 1,878 470 5002017 2,019 248 1,997 499 6002018 2,019 343 2,143 536 7002019 2,019 343 2,298 575 7822020 2,019 343 2,465 616 9642021 2,019 343 2,633 658 1,2282022 2,019 343 2,812 703 1,3922023 2,019 343 3,004 751 1,5742024 2,019 343 3,209 802 1,8382025 2,019 343 3,427 857 2,0022026 2,019 343 3,661 915 2,3482027 2,019 343 3,910 978 2,6122028 2,019 343 4,176 1,044 2,8762029 2,019 343 4,461 1,115 3,2222030 2,019 343 4,765 1,191 3,6182031 2,019 343 5,089 1,272 4,0142032 2,019 343 5,436 1,359 4,4602033 2,019 343 5,806 1,452 4,9382034 2,019 343 6,202 1,550 5,4342035 2,019 343 6,624 1,656 5,9622036 2,019 343 7,076 1,769 6,4902037 2,019 343 7,558 1,889 7,1002038 2,019 343 8,072 2,018 7,7602039 2,019 343 8,622 2,156 8,4202040 2,019 343 9,210 2,302 9,180
Figure 17. Visayas Demand-Supply Outlook, 2016-2040
Capacity Addition - Peaking Capacity Addition - Midmerit Capacity Addition - Baseload Committed Peaking Committed Midmerit Committed Baseload
Existing Peaking Existing Midmerit Existing Baseload Reserve Requirement System Peak Demand 70% baseload Reqt
6,000
10,000
12,000
MW 8,000
13,000
4,000
3,000
2,000
1,000
0
5,000
9,000
11,000
7,000
2016 2024 20322020 2028 20362018 2026 20342022 2030 20382017 2025 20332021 2029 20372019 2027 20352023 2031 2039 2040

Dem
and-Supply Outlook, 2016-2040
POWER DEVELOPMENT PLAN, 2016-2040
47
Table 24. Mindanao Required Annual Capacity Addition, 2016-2040
YearTotal Existing
Available Capacity
Total Commited
Capacity, MWSystem Peak
Demand, MW
Reserve Requirements
(25% Peak Demand), MW
Total Capacity Addition, MW
2016 1,497 495 1,786 446 6052017 1,497 636 1,911 478 6052018 1,497 1,082 2,064 516 6052019 1,497 1,086 2,229 557 6052020 1,497 1,086 2,407 602 7052021 1,497 1,086 2,588 647 9102022 1,497 1,086 2,782 695 1,2152023 1,497 1,086 2,990 748 1,4252024 1,497 1,086 3,215 804 1,6302025 1,497 1,086 3,456 864 1,9402026 1,497 1,086 3,715 929 2,2502027 1,497 1,086 3,993 998 2,5602028 1,497 1,086 293 1,073 2,8752029 1,497 1,086 4,615 1,154 3,2352030 1,497 1,086 4,961 1,240 3,6502031 1,497 1,086 5,333 1,333 4,1152032 1,497 1,086 5,733 1,433 4,6302033 1,497 1,086 6,163 1,541 5,1452034 1,497 1,086 3,325 1,656 5,7152035 1,497 1,086 7,122 1,781 6,3352036 1,497 1,086 7,656 1,914 7,0052037 1,497 1,086 8,231 2,058 7,7252038 1,497 1,086 8,848 2,212 8,5002039 1,497 1,086 9,512 2,378 9,3252040 1,497 1,086 10,225 2,556 10,200
Capacity Addition - Peaking Capacity Addition - Midmerit Capacity Addition - Baseload Committed Peaking Committed Midmerit Committed Baseload
Existing Peaking Existing Midmerit Existing Baseload Reserve Requirement System Peak Demand 70% baseload Reqt
6,000
10,000
12,000
MW
8,000
13,000
4,000
3,000
2,000
1,000
0
5,000
9,000
11,000
7,000
2016 2024 20322020 2028 20362018 2026 20342022 2030 20382017 2025 20332021 2029 20372019 2027 20352023 2031 2039 2040
Figure 18. Mindanao Demand-Supply Outlook, 2016-2040
The capacity used for the simulation is based on
the existing available capacity of the Mindanao
grid as of June 2016. Mindanao will need a total
of 10,200 MW of additional capacity from 2016 to
2040. The additional capacity for Mindanao is di-
vided into 6,300 MW of baseload capacity, 3,200
MW of mid-merit capacity and 700 MW of peak-
ing capacity. With an annual average growth rate
of 7.6% for the demand forecast and with the con-
sideration to the 25% peak demand as reserve re-
quirement, Mindanao will need additional capacity
starting the year 2016.

Pow
er S
ecto
r Roa
dmap
Pow
er S
ecto
r Roa
dmap
45MW SACASOL I Solar Farm - San Carlos Solar Energy, Inc.54MW Pililla Rizal Wind Farm - Alternergy Wind One Corp.6.2MW Centrala Solar Power Plant - NV Vogt Philippines Solar Energy One, Inc.
T-D:

Power Sector Roadm
ap
49
POWER DEVELOPMENT PLAN, 2016-2040
The DOE envisions to implement its policy
thrusts and strategic directions which
are geared towards full restructuring and
reform of the electric power industry by 2040. For
the four major subsectors of the power industry:
generation, transmission, distribution and supply,
the DOE identifies its goals and strategies for
implementation in the short-, medium-, and long-
term planning horizons. Separate roadmaps for
off-grid and missionary areas down to household
electrification are also included in this plan towards
the holistic development of the electric power
industry. These roadmaps embody continuing
policies and programs and future action plans
focusing on ensuring quality, reliable, affordable and
secure supply; expanding access to electricity; and
ensuring a transparent and level playing field in the
power industry.
For the generation subsector, the DOE will remain
firm to its mandate of ensuring power supply security,
reliability, adequacy and sustainability by inducing
more private investments and pursuing new
technologies and emerging power supply sources
consistent with the appropriate power mix policy.
In pursuit of this, the transmission and distribution
subsectors shall provide adequate and reliable
infrastructures to be able to deliver the supply to
end-users. These three sub-sectors are also expected
to utilize advanced and efficient technologies and
build energy-resilient infrastructure taking-off in the
short-term up to the long-term planning horizon.
For the supply subsector, the DOE will push for the
attainment of full power market independence
through the continuous review, issuance and
implementation of policy guidelines on WESM and
RCOA. This aims to increase participants in the supply
sector and clear delineation of the supply between
captive and contestable markets. Institutional and
support mechanisms will be in place to attain
the objectives identified for each subsectors.
Consistent to the mandate of DOE to expand and
accelerate access to electricity services and craft
policies that will redound to a sustainable energy
sector, the roadmap for missionary electrification
aims to present a strategic direction for the
continuous development of missionary areas in
terms of energy security and its associated systems,
private sector investment, institutional partnerships,
and operational efficiency. Lastly, the DOE will
continue to work on expanding electricity access to
all households by 2040 through various programs
and projects embodied under the electrification
roadmap.
GENERATION
The DOE will continue to encourage and facilitate
the timely completion and commercial operation
of power generation projects and increase the
number of merchant power plants by formulating
relevant policies and regulations that will enable
full competition and improved transparency in the
sector. DOE will also facilitate the declaration of
power projects as projects of national significance
under a legislative framework. By doing so, the
tedious process for permitting and approval prior
to the commercial operation of power generation
projects will be streamlined and shortened; hence,
the delivery of the much needed capacities to
meet the country’s growing demand and minimize
transaction costs. It also aims to address tax concerns
of power companies to make the cost of electricity
competitive.
As part of its major policy thrusts, the DOE is also set
to prioritize the institutionalization of the appropriate
power mix policy for power generation towards an
optimal portfolio to meet 24/7 electricity demand
and reserve requirement with spatial and sectoral
dimensions. The DOE will formulate and implement
a fair and transparent rewards-and-penalty
system such as the causers pay policy to enforce
accountability of power industry players for forced

Pow
er S
ecto
r Roa
dmap
50
POWER DEVELOPMENT PLAN, 2016-2040
outages. This ensures more protection to consumers.
Along with these initiatives, the DOE will continue to
enjoin existing generating companies to undertake
rehabilitation and upgrading of their existing
power plants to facilitate maximum operation of
their facilities. The DOE will encourage compliance
to international standards for constructing power
plants and provide support for the accreditation of
contractors.
The DOE has initiated and will continue to conduct
its daily monitoring of power situation along
with regular performance assessment of power
generation companies to determine and remove
bottlenecks and inefficiencies in their operations.
This will serve as the basis for benchmarking
and identification of appropriate policies for the
generation sector.
In the medium to long term, the DOE will
encourage and facilitate the entry of new and
emerging power generation options such as
nuclear technology, energy storage technologies,
fuel cells and ocean thermal energy conversion
(OTEC), among others. To make this happen, the
DOE will establish strong cooperation among
government line agencies such as the Department
of Science and Technology (DOST) and Philippine
Nuclear Research Institute (PNRI) and reinforce
partnership with private research institutions
which undertakes research, development and
demonstration (RD&D) on energy technologies.
From 2017-2040, the DOE will lead in performance
assessment and benchmarking of power
generation facilities in order to review and
develop policies to improve the operation of the
Figure 19. Power Sector Roadmap 2017-2040, Generation
POWER SECTOR ROADMAP Short-Term (2017-2018)
Medium-Term (2019-2022)
Long-Term (2023-2040)
Ensu
re q
ualit
y, re
liabl
e, a
ffor
dabl
e an
d se
cure
sup
ply
Expa
nd a
cces
s to
ele
ctri
city
En
sure
a tr
ansp
aren
t and
fair
pla
ying
fiel
d in
the
pow
erin
dust
ry
OVERALL OBJECTIVES BY
2040
• Facilitate the declaration of Power Projects as Project of National Significance o Exemption from Real
Property Tax and LocalTaxes
o Express grant of business permit and licenses tooperate
• Institute power mix policy for power generation towards optimal* portfolio to meet 24/7 electricity demand and reserve requirements with spatial and sectoral dimension
Generation
* Required Baseload, Mid-Merit and Peaking Capacity at least Cost
• Lead in the Plant Performance Assessment/Benchmarking in order to review and developpolicies to improve power generation
• Encourage Compliance to International Standards for constructing Power Plants and accreditation of contractors
• Review and develop power generation related policies including rewards-and-penalty system • Develop resiliency policies for generating assets • Conduct daily monitoring of power situation • Periodic monitoring of power generation projects • Provision of technical support • Promote investments in power generation including Merchant Power Plants
• Pursue the entry of new and emerging technologies for power generation (e.g. ocean, fuel cells, nuclear, etc.) consistent with the power mix policy.
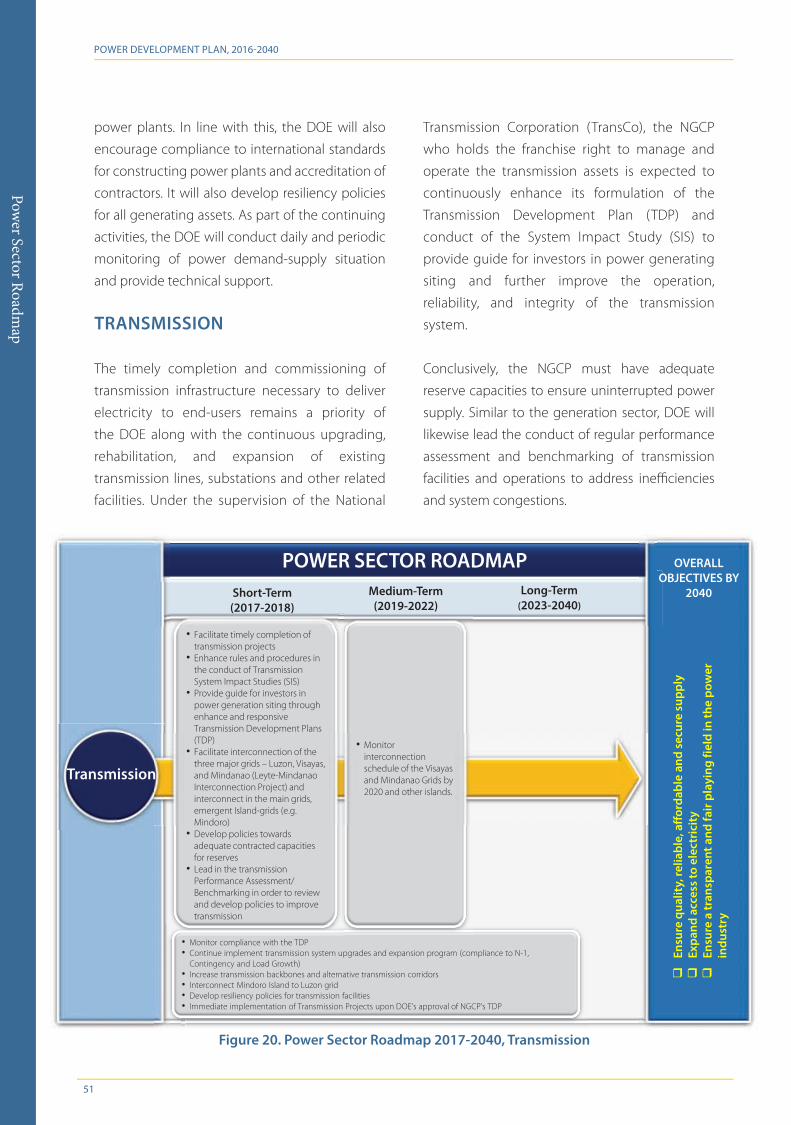
Power Sector Roadm
ap
51
POWER DEVELOPMENT PLAN, 2016-2040
power plants. In line with this, the DOE will also
encourage compliance to international standards
for constructing power plants and accreditation of
contractors. It will also develop resiliency policies
for all generating assets. As part of the continuing
activities, the DOE will conduct daily and periodic
monitoring of power demand-supply situation
and provide technical support.
TRANSMISSION
The timely completion and commissioning of
transmission infrastructure necessary to deliver
electricity to end-users remains a priority of
the DOE along with the continuous upgrading,
rehabilitation, and expansion of existing
transmission lines, substations and other related
facilities. Under the supervision of the National
Transmission Corporation (TransCo), the NGCP
who holds the franchise right to manage and
operate the transmission assets is expected to
continuously enhance its formulation of the
Transmission Development Plan (TDP) and
conduct of the System Impact Study (SIS) to
provide guide for investors in power generating
siting and further improve the operation,
reliability, and integrity of the transmission
system.
Conclusively, the NGCP must have adequate
reserve capacities to ensure uninterrupted power
supply. Similar to the generation sector, DOE will
likewise lead the conduct of regular performance
assessment and benchmarking of transmission
facilities and operations to address inefficiencies
and system congestions.
Figure 20. Power Sector Roadmap 2017-2040, Transmission
POWER SECTOR ROADMAP OVERALL OBJECTIVES BY
2040
• Facilitate timely completion of transmission projects
• Enhance rules and procedures in the conduct of Transmission System Impact Studies (SIS)
• Provide guide for investors in power generation siting through enhance and responsive Transmission Development Plans (TDP)
• Facilitate interconnection of thethree major grids – Luzon, Visayas, and Mindanao (Leyte-Mindanao Interconnection Project) and interconnect in the main grids, emergent Island-grids (e.g. Mindoro)
• Develop policies towards adequate contracted capacities for reserves
• Lead in the transmission Performance Assessment/ Benchmarking in order to review and develop policies to improve transmission
Transmission
Short-Term (2017-2018)
Medium-Term (2019-2022)
Long-Term (2023-2040)
Ensu
re q
ualit
y, re
liabl
e, a
ffor
dabl
e an
d se
cure
sup
ply
Expa
nd a
cces
s to
ele
ctri
city
En
sure
a tr
ansp
aren
t and
fair
pla
ying
fiel
d in
the
pow
erin
dust
ry
• Monitor compliance with the TDP• Continue implement transmission system upgrades and expansion program (compliance to N-1,
Contingency and Load Growth)• Increase transmission backbones and alternative transmission corridors• Interconnect Mindoro Island to Luzon grid • Develop resiliency policies for transmission facilities • Immediate implementation of Transmission Projects upon DOE’s approval of NGCP’s TDP
• Monitor interconnection schedule of the Visayas and Mindanao Grids by 2020 and other islands.

Pow
er S
ecto
r Roa
dmap
52
POWER DEVELOPMENT PLAN, 2016-2040
Apart from the continuing activities underlining
transmission system improvement, TransCo and
NGCP will jointly undertake the identification and
development of new transmission backbones
and alternative transmission corridors to lessen
if not eliminate line congestions in view of
the increasing demand. The DOE will closely
monitor the implementation of the TDP as well
as the Visayas-Mindanao interconnection which is
targeted to be implemented by 2020. Similarly, the
interconnection of the main grids and emergent
island grids such as Mindoro is also envisioned to
be implemented.
In view of the country’s vulnerability to climate
change, the power sector shall be able to cope up
with the increasing incidents of natural calamities
through the development and construction
of energy and climate-resilient transmission
infrastructure and adoption of energy resiliency
policies and programs.
DISTRIBUTION AND SUPPLY
For the short to long-term period, the Department
will continually focus on increasing the capacities
of Distribution Utilities (DUs), particularly Electric
Cooperatives (ECs), in formulating their respective
Distribution Development Plans (DDPs). The
DOE together with the National Electrification
Administration (NEA) will continue to assist and
supervise ECs on their institutional strengthening
programs. The DOE will also continue to strengthen
its coordination with the Energy Regulatory
Commission (ERC) and formulate enabling policies
and joint resolutions to facilitate the timely approval
and implementation of distribution facilities through
CAPEX provisions, among others, to further improve
the services being provided by DUs to their customers
and facilitate economies of scale in their operation.
Likewise, the DOE will develop and monitor the
accountability of DUs towards an improved
operational efficiency and good governance. DUs,
both grid and off-grid, will also be subjected to
regular performance assessment and benchmarking
to address operational and financial inefficiencies and
institutional issues.
The full implementation and conduct of the
Competitive Selection Process (CSP) and aggregation
of DUs shall instill transparency and competition in
securing Power Supply Agreements (PSAs) to ensure
adequacy of supply at the least cost as well as reserves.
In line with this, enhancement in power supply
contracts to include provisions for replacement
power and penalty provisions will be facilitated.
To raise consumer welfare, improved transparency
mechanism in rates and charges along with the
development of policies and regulatory support to
meet the new and emerging needs of customers.
The DOE will continue to process direct connection
applications.
Over the planning horizon, DUs are mandated to
undertake continuous upgrade and expansion
of distribution infrastructure in their respective
franchise areas. The sector shall utilize and
invest in more efficient technologies such as
the smart grid (e.g. prepaid electricity, etc.).
Likewise, the distribution sector shall move
towards the transformation of its current system
and infrastructure to an energy-resilient one by
implementing enabling resiliency policies.
Within the short-term horizon, the mandatory
contestability of electricity end-users having an
average demand of 1 MW and above will be on
26 February 2017 while by end of 2017 for those
electricity end-users with average demand of
below 750 kW and above effective 2017. Retail
aggregation will be implemented as well upon
ERC’s promulgation of the requisite guidelines that
will ensure its proper implementation.

Power Sector Roadm
ap
53
POWER DEVELOPMENT PLAN, 2016-2040
For the medium-term, the integration of the
supply development plan in the PDP is envisioned
considering the transition of the electric power
industry into a market-driven and competitive
sector wherein customers (contestable) are given
the power of choice. The DOE, together with
the ERC, will develop policies for lowering the
threshold to 500 kW including aggregation for the
same threshold.
In the short to long-term, RCOA in Mindanao is
targeted to be pursued by 2018 following the
implementation of WESM in Mindanao.
MARKET DEVELOPMENT
On the enhancement of the WESM design,
while PEMC already completed the systems
development, it will continue to conduct trainings
and capacity building for the market participants
and perform system trials. The NMMS will be fully
operationalized by June 2017 including the features
for demand side bidding and reserve market.
Preparatory activities for the eventual establishment
of a competitive electricity market in Mindanao
are also underway given the need to manage and
address expected dispatch and pricing issues arising
from the full commercial operation of committed
capacities in Mindanao resulting to excess supply
in the grid. The systems requirements for the
Mindanao market will already be part of the NMMS.
The groundwork for the appointment of the
Independent Market Operator (IMO) has been
done, thus, what is needed for the short-term is to
be able to endorse the IMO in collaboration with
Figure 21. Power Sector Roadmap 2017-2040, Distribution and Supply
POWER SECTOR ROADMAP OVERALL OBJECTIVES BY
2040
Develop policies to facilitate: • Mandatory Contestability for 1 MW and up
electricity end-users • Full open access for 750 KW and above
Contestable Customers • Retail aggregation for minimum of 750 kW
aggregated demand • Conduct Market Studies for lowering
Contestability to 500 kW
Formulate Supply Development Plan for integration in the PDP
Develop policies to facilitate: • Open access for 500 KW and
below • Retail aggregation for
minimum aggregated demand of 500 kW
Supply
• Facilitate timely implementation of necessary Distribution Facilities• Enhance Distribution Development Plan (DDP) towards operational and institutional efficiency• Facilitate economies of scale in the Distribution Utilities’ Operation • Provide policy and regulatory support to new and emerging needs of the consumers• Improve transparency mechanism in rates and charges• Ensure adequate power supply contracts and reserves to serve Captive Market through open and
competitive processes• Enhance power supply contracts to include among others replacement power and penalty provisions• Performance Assessment/Benchmarking • Process Direct Connection Application • Develop and monitor accountability of Dus• Continue to implement distribution line upgrades and expansion programs for better services at the
least cost to consumers• Continue improvement in operational efficiency and good governance in the operations and
management of Distribution Utilities• Develop resiliency policies for distribution facilities
Distribution
Short-Term (2017-2018)
Medium-Term (2019-2022)
Long-Term (2023-2040)
Ensu
re q
ualit
y, re
liabl
e, a
ffor
dabl
e an
d se
cure
sup
ply
Expa
nd a
cces
s to
ele
ctri
city
En
sure
a tr
ansp
aren
t and
fair
pla
ying
fiel
d in
the
pow
erin
dust
ry
• Increase transparency in the retail supply contracting. • Develop policies on the implementation of RCOA in Mindanao by 2018

Pow
er S
ecto
r Roa
dmap
54
POWER DEVELOPMENT PLAN, 2016-2040
the electricity power industry participants and in
accordance with the legal framework provided by
the EPIRA. The IMO will assume the functions and
responsibilities of the Autonomous Group Market
Operator (AGMO).
The privatization of the remaining NPC generating
plants, NPP-IPP contracts and decommissioned
assets in will continue to be pursued by PSALM
subject to guidance and directives of the DOE
considering supply-demand situation specifically
in the Mindanao grid. Mindanao Electricity Market
will be implemented in 2017 to establish central
dispatch system to optimize available capacities.
The market will also provide price and other techno-
economic signals that will further encourage
investments in additional capacities in the region.
To complement this, the DOE will also look into
harmonizing policies on embedded generation to
ensure optimal use.
Included in the short-term, the DOE is envisioning:
1) co-optimized reserve and energy market that
would allow more transparent supply and pricing
in the WESM enhancing supply reliability; and 2)
Renewable Energy Market to complement the
implementation Renewable Portfolio Standards
and allow the trading of Green Certificates as a
mechanism for compliance to the RPS.
Also included in the short -term, are policy
developments on 1) Smart Grid to provide
technological support and innovations that would
enhance various market developments; and 2)
Figure 22. Power Sector Roadmap 2017-2040, Market Development and Institutional Support Mechanism
POWER SECTOR ROADMAP OVERALL OBJECTIVES BY
2040
Develop policies and monitor compliance on: • WESM Design Improvements/NMMS • Appoint Independent Market Operator
(IMO) • Privatization of NPC assets• policy for Embedded Generators• Establishment of Mindanao Electricity
Market• Develop Roadmap, Policy Utilization for
Smart Grid and other technologies• Renewable Energy Market (in line with
RPS implementation)• Reserve/Energy Market Co-optimization • Demand Bidding in the WESM• Forwards Market/Financial Transmission
Rights/Day-ahead market/DerivativesMarket
Market Development
• Continue policy development to enhance Electricity Market
• Intensify Information, Education and Communication (IEC) Campaign• Conduct periodic Market Operations Audit and Metering Service Provider Review • Conduct WESM Rules, Market Manual and Retail Rules Review • Establish and maintain DOE Electric Power Database Management System• Monitor Market Operator Performance and conduct review of Standards • Monitor compliance to WESM Rules • Prepare and submit semi-annual EPIRA Status Report to JCPC • Monitor and evaluate EPIRA implementation• Assist and monitor ECs institutional strengthening program• Support to enhance power generation planning through procurement of
generation planning software and transmission planning tools
Institutional and Support Mechanism
Short-Term (2017-2018)
Medium-Term (2019-2022)
Long-Term (2023-2040)
Ensu
re q
ualit
y, re
liabl
e, a
ffor
dabl
e an
d se
cure
sup
ply
Expa
nd a
cces
s to
ele
ctri
city
En
sure
a tr
ansp
aren
t and
fair
pla
ying
fiel
d in
the
pow
erin
dust
ry
Power Sector Roadm
ap
55
POWER DEVELOPMENT PLAN, 2016-2040
demand-side bidding in the WESM. Meanwhile,
policy developments to enhance the electricity
market will be continuously pursued up to the
long-term planning horizon.
INSTITUTIONAL AND SUPPORT MECHANISM
The implementation of institutional and other
support mechanism will continue to be a main pillar
of the DOE’s initiatives to ensure the attainment of
the EPIRA objectives and realize the short-medium-
long term market development goals. Among
others, the priorities are: 1) intensification of IEC
Campaign at the grass roots level, supported by
the different Attached Agencies and the PEMC thru
conduct of focus trainings and fora; 2) continuing
improvements in WESM operations thru rules
review and changes, conduct of WESM audits,
monitoring of Market Operator performance and
compliance to WESM Rules; 3) establishment and
maintenance of the DOE’s Electric Power Database
Management Systems that would support the
various policy initiatives providing analysis and
numerical basis; 4) continuing capacity building
for DOE personnel to be able to cope up with the
dynamic nature of the power industry; 5) enhanced
supply expansion planning using advanced
modeling tools and optimization software and, 6)
ensuring compliance to the various requirements
of the EPIRA and related laws.
MISSIONARY ELECTRIFICATION
As of June 2016, there are already seven (7)
Small Island and Isolated Grids (SIIGs) that have
successfully attained the privatization of its
generation services. The turn-over of generation
function from NPC-SPUG to a New Power Providers
(NPP) will eventually redound to the reduction of
Missionary Electrification (ME) subsidy which in turn
minimizes the cost incurred by the Government
through the NPC-SPUG. It then becomes imperative
for DOE to catapult from this progress and ensure
the continuous and effective development of
this kind of programs that leads to the reduction
of UCME. Thus, DOE will commence a policy
study and convene a focus group to develop and
establish a graduation policy program. DOE will
direct NPC-SPUG to assess, in per area-by-area
basis, the commercial viability of SPUG areas and
determine therein priority areas which may already
qualify for the graduation program as soon as the
policy becomes implemented. This policy action
will also address the intention of DOE to rationalize
and improve the UCME subsidy system and cull
out important concerns that need to be addressed
first before implementing a graduation policy.
The development of resilience policies will also
be prioritized by DOE. Learning from previous
experiences when typhoons have heavily wreaked
havoc on crucial power system facilities, this will
serve as our step forward to ensure continuous
and reliable power supply before, during and
after natural or human-induced calamities. At top
of which, power plants of NPC-SPUG and NPPs
will also be subject to performance assessment
to determine their plant efficiency and further
improve their operations.
DOE will also support NPC in its continuous
determination of new areas for energization which
are being outlined in its Missionary Electrification
Plan (MEP). On the other hand, tourism zones
or eco-zones in missionary areas will also be
determined and included in the Missionary
Electrification Development Plan (MEDP) as these
areas, if thoroughly studied, can pave the way for
an influx of private investment.
An optimal energy mix will also be studied and
implemented to ensure that off-grid areas are also
synchronized with the direction being taken by our
stakeholders from the national grid. The optimal
mix will also take into consideration, among

Pow
er S
ecto
r Roa
dmap
56
POWER DEVELOPMENT PLAN, 2016-2040
others, required RE generation by ECs while also
considering the current infrastructural peculiarity
of off-grid areas.
Institutional cooperation among DOE, NEA and NPC
will also be strengthened to ensure the expeditious
formulation of policies and maximization of
their individual and interdependent roles in
assisting Electric Cooperatives during power
supply contracting especially in the conduct of
Competitive Selection Process (CSP), improving
SPUG power system facilities and associated
delivery systems and bringing the operations in
missionary areas to commercial viability levels.
In the short to long run, we envision to bring
the operations in missionary areas to viability
levels as directed by existing laws and policies.
As government agencies make necessary efforts
to improve the PSP program through policy
formulation and direction, ECs will be capacitated
through various trainings to ensure their
preparedness in contracting power supply for their
franchise areas. This also calls for the improvement
of EC’s distribution utilities to increase their
operational efficiency and eventually reduce
system losses. This will also prepare their facilities
for the entry of an NPP. One way to work on this
intended improvement is the implementation
of various compliance measures prescribed in
the Philippine Small Grid Guidelines (PSGG) in
coordination with the Distribution Management
Committee (DMC) as this will direct ECs to comply
with minimum operational specifications.
Figure 23. Power Sector Roadmap 2017-2040, Missionary Electri�cation
POWER SECTOR ROADMAP OVERALL OBJECTIVES BY
2040
• Conduct policy studies on optimal energy mix for off-grid areas
• Rationalize and improve UCME Subsidy System
• Develop resiliency policiesfor off-grid facilities
• Strengthen institutionalcooperation (DOE, NEA and NPC) to ensure transparent and effective CSP and mutually beneficial supply contractsfor ECs
• Determine new areas for electrification as well as eco-zones for private investment purposes
• Performance Assessmentand benchmarking
• Develop graduation policyfrom UCME
Missionary Electrification
Short-Term (2017-2018)
Medium-Term (2019-2022)
Long-Term (2023-2040)
Ensu
re q
ualit
y, re
liabl
e, a
ffor
dabl
e an
d se
cure
sup
ply
Expa
nd a
cces
s to
ele
ctri
city
En
sure
a tr
ansp
aren
t and
fair
pla
ying
fiel
d in
the
pow
erin
dust
ry
• Develop and maintain Missionary Electrification Database System• Promote the integration of other economic incentives in missionary electrification• Capacitate DUs to improve power supply contracting in off-grid areas • Monitor and enhance the implementation of the privatization of remaining NPC-
SPUG generating assets • Monitor compliance to Philippine Small Grid Guidelines • Expand services and Improve operations of Electric Cooperatives for increased
efficiency and reduction of losses
Power Sector Roadm
ap
57
POWER DEVELOPMENT PLAN, 2016-2040
In line with improvement of the PSP program,
privatization of existing NPC-SPUG generating
assets will also be enhanced either through
policy clarification, establishment of new policy or
amendment of DOE Department Circular 2004-01-
001 to make sure the purchase or lease of the said
assets becomes a priority item. To further attract
private investors, possible economic incentives
to stakeholders engaging in power generation in
missionary areas will be explored in coordination
with the Tourism Infrastructure and Enterprise
Zone Authority and other government agencies
that are involved in the same operation.
Throughout the succeeding years, a Missionary
Electrification Database System will be
implemented that will include, among others,
information from the reportorial requirements of
ECs and Generation Companies as well as relevant
data from NPC and NEA. It will also be imperative
to enjoin ECs in missionary areas to diligently
accomplish their Distribution Development Plan
(DDP) to ensure the completeness and accuracy of
the needed information in the database.
ELECTRIFICATION
The DOE will continue to work on its programs in
order to achieve its goal of attaining the 90 percent
household electrification by 2017.
From 90 percent household electrification level
by 2017, the DOE is looking on attaining 100
percent electrification of targeted and identified
households by 2022. As to how to achieve this goal,
the Household Unified Strategic Electrification
(HOUSE) Team represented by DOE together with its
attached agencies (NEA and NPC) and concerned
stakeholders will undertake the following 1) settle
issues that arose during the implementation of
HEDP in achieving the 90 percent level by 2017; 2)
target and identify household consumers that can
be connected in the distribution system which will
be done by setting a baseline number and target
household per franchise area of the DUs based on
the recent released 2015 National Census; and 3) for
offgrid electrification, separate electrification plan
will be developed to achieve its total household
electrification. This will be done by establishing
an inventory of all the off-grid areas and a well
maintained database of its status of electrification
will help DOE in achieving its 100 percent
household electrification in off grid areas.
The 100 percent electrification of targeted and
identified households accessible to the grid is
target to be attained by 2022 while the 100 percent
electrification of household in off-grid areas are
expected in the long term period (2023-2040).
Accordingly, electricity access to all is expected to
be experienced by all households in the country by
2040. The DOE will work to maintain to electricity
access for the long term and beyond and provide
quality and continuous 24-hour service to all
household situated on identified off-grid areas.
In the short-term, Table 25 highlights the targets on
a per sub-program component of the Household
Electrification Development Plan (HEDP) on how to
attain 90 percent household electrification level by
2017 as part of the DOE short term goal.
To ensure the success of the long-term
electrification goal, the DOE together with the
concerned agencies and stakeholders will carry out
the following strategies, plans and initiatives:
Establish a coordinated monitoring strategy to
ensure the attainment of 90 percent household
electrification by 2017. One of the strategies is the
provision of a monthly accomplishment report to
keep track of program (including sub-program)
accomplishments vs. targets.

Pow
er S
ecto
r Roa
dmap
58
POWER DEVELOPMENT PLAN, 2016-2040
Issue a policy on the definition of electricity access
to clarify issues and concerns on the definition
of energized/electrified households in grid area
and in off-grid areas. The said policy shall provide
guidelines on the minimum requirement on the
number of hours of electricity service for household
connected to grid and the household energized
through interim solutions such as gensets and
individual PV Solar Home System.
Establish an efficient monitoring system such as:
1) household electrification information system
(HEIS) that will address potential duplication of
beneficiaries and 2) nationwide off-grid database
that will serve as baseline and target of all off-grid
electrification program of the Government.
Figure 24. Power Sector Roadmap 2017-2040, Electri�cation Roadmap
In the medium term, the DOE through NEA and the
concerned DUs in Luzon and Visayas will achieve
100 percent household electrification through
implementation of SEP, BLEP, NIHE and ER 1-94 EF
Programs.
Periodic review and revisit of the overall
electrification goal in order to identify measures for
implementation to meet the targets.
Encourage participation and contributions of
Civil Society including NGOs, private foundations,
Corporate Social Responsibility programs of large
corporations and other entities in undertaking the
provision of the basic electricity services especially
in depressed areas of the country.
ELECTRIFICATION ROADMAP
HEDP
TOTA
L EL
ECTR
ICIT
Y A
CCES
S IN
TH
E CO
UN
TRY
OVERALL OBJECTIVE BY
2040
• Process, evaluate andapprove projects that contribute to the attainment of 90% household electrification by 2017 (based on 2010 Census) NIHE ER 1-94 PV Mainstreaming
(EU & GOP ASEP) ASEP QTP
• Monitoring of HEDPprogram REMB HEP using RE NEA BLEP and SEP NPC Electrification
efforts
• Establish off-grid Database Management System (Baseline)
• Develop proposal for NIHE Phase 2
• Process, evaluate and approve projects that contribute to a) the attainment of 100% electrification of targeted and identified households by 2022 accessible to grid (based on 2015 census); and b) the accomplishment of off-grid targets ER 1-94 NIHE (Phase 2) PV Mainstreaming
(EU & GOP ASEP) QTP
• Monitoring of HEDP program REMB HEP using RE NEA BLEP and SEP NPC Electrification efforts
Short-Term (2017-2018)
Medium-Term (2019-2022)
Long-Term (2023-2040)
• Electrification of all targeted and identified households (householdsidentified beyond 2015 Census)
• 100% household electrification of all off-grid areas
• Process, evaluate and approve projects that contribute to the attainment of ruralelectrification ER 1-94 (electrification and support projects under DLF and RWMHEEF) PV Mainstreaming under ER 1-94 QTP

Power Sector Roadm
ap
59
POWER DEVELOPMENT PLAN, 2016-2040
Table 25. Household Electri�cation Sub-Programs and Targets for 2016-2017
HEDP Programs Program Period Implementer
Target Households
2016 2017 Cumulative2016-2017
GRID
Sitio Electrification Program (SEP)
2011-2016 NEA 23,622 23,622
NEA Subsidy fo Sitio Electrification (2016-2017)
2016-2017 NEA 94,500 189,630 284,130
Barangay Line Enhancement Program (BLEP)
2011-2016 NEA 10,160 10,160
Nationwide Intensification of Household Electrification (NIHE)
2015-2017 DOE 177,000 177,000 354,000
E.R. 1-94 EF Annual DOE 3,000 3,000 6,000
DU Regular Connections DOE 57,976 34,626 84,759
Sub-Total 366,258 404,256 762,671OFF-GRID
PV Mainstreaming Program (PVM)
Annual DOE 10,000 19,607
PV Mainstreaming Program - ASEP
2016-2019 DOE 9,735 17,252 26,987
Household Electrification Program (HEP) using RE
2011-2017 DOE 5,600 5,600 11,200
Missionary Electrification Projects in NPC-SPUG Areas
Annual NPC-SPUG 5,100 2,500 7,600
Sub-Total 20,435 35,352 65,394
Total 386,693 441,372 828,065Note: Targets are referenced on the December 2015 HH Electrification Level

AN
NEX
ESA
NN
EXES
49.4MW Nasulo Geothermal Power Plant - Energy Development Corp.458MW Makban Geothermal Power Plant - AP Renewables, Inc.106MW Mindanao Geothermal Production Field - Energy Development Corp.
T-D:
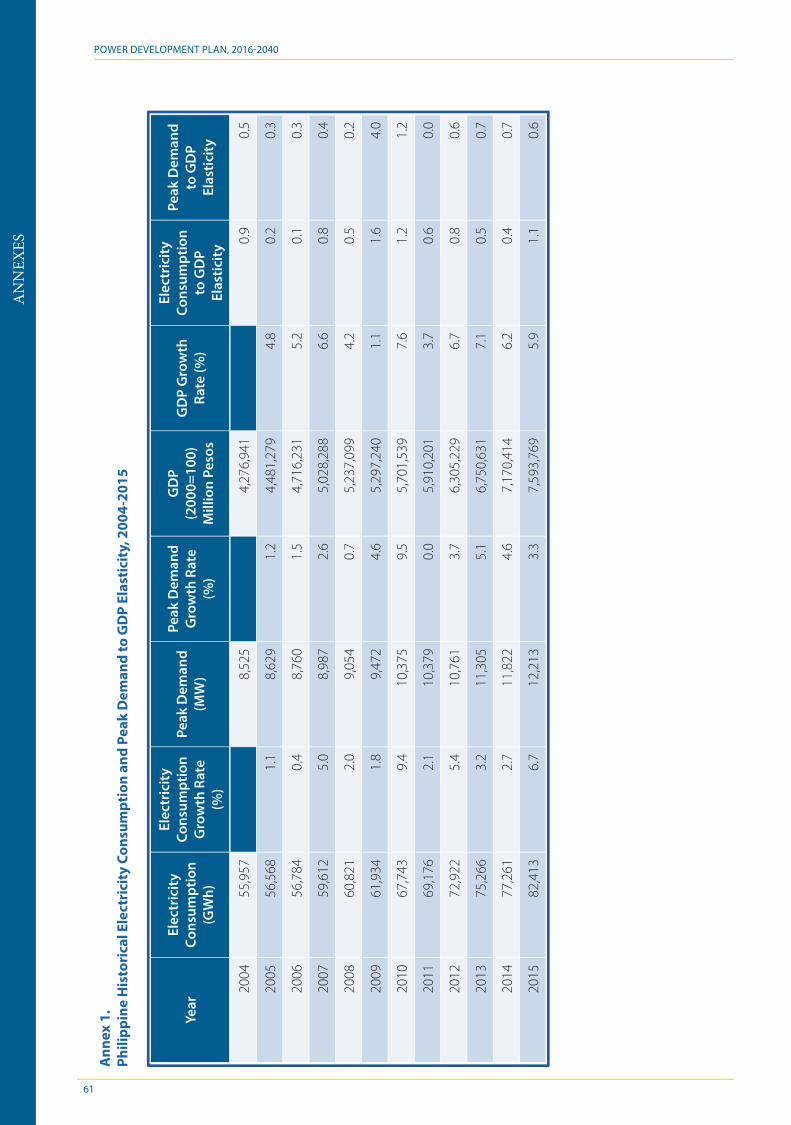
AN
NEX
ES
POWER DEVELOPMENT PLAN, 2016-2040
61
Year
Elec
tric
ity
Cons
umpt
ion
(G
Wh)
Elec
tric
ity
Cons
umpt
ion
Gro
wth
Rat
e (%
)
Peak
Dem
and
(MW
)
Peak
Dem
and
Gro
wth
Rat
e (%
)
GD
P (2
000=
100)
M
illio
n Pe
sos
GD
P G
row
th
Rate
(%)
Elec
tric
ity
Cons
umpt
ion
to G
DP
Elas
ticit
y
Peak
Dem
and
to G
DP
Elas
ticit
y
2004
55,9
578,
525
4,27
6,94
10.
90.
5
2005
56,5
681.
18,
629
1.2
4,48
1,27
94.
80.
20.
3
2006
56,7
840.
48,
760
1.5
4,71
6,23
15.
20.
10.
3
2007
59,6
125.
08,
987
2.6
5,02
8,28
86.
60.
80.
4
2008
60,8
212.
09,
054
0.7
5,23
7,09
94.
20.
50.
2
2009
61,9
341.
89,
472
4.6
5,29
7,24
01.
11.
64.
0
2010
67,7
439.
410
,375
9.5
5,70
1,53
97.
61.
21.
2
2011
69,1
762.
110
,379
0.0
5,91
0,20
13.
70.
60.
0
2012
72,9
225.
410
,761
3.7
6,30
5,22
96.
70.
80.
6
2013
75,2
663.
211
,305
5.1
6,75
0,63
17.
10.
50.
7
2014
77,2
612.
711
,822
4.6
7,17
0,41
46.
20.
40.
7
2015
82,4
136.
712
,213
3.3
7,59
3,76
95.
91.
10.
6
Ann
ex 1
. Ph
ilipp
ine
His
tori
cal E
lect
rici
ty C
onsu
mpt
ion
and
Peak
Dem
and
to G
DP
Elas
tici
ty, 2
004-
2015
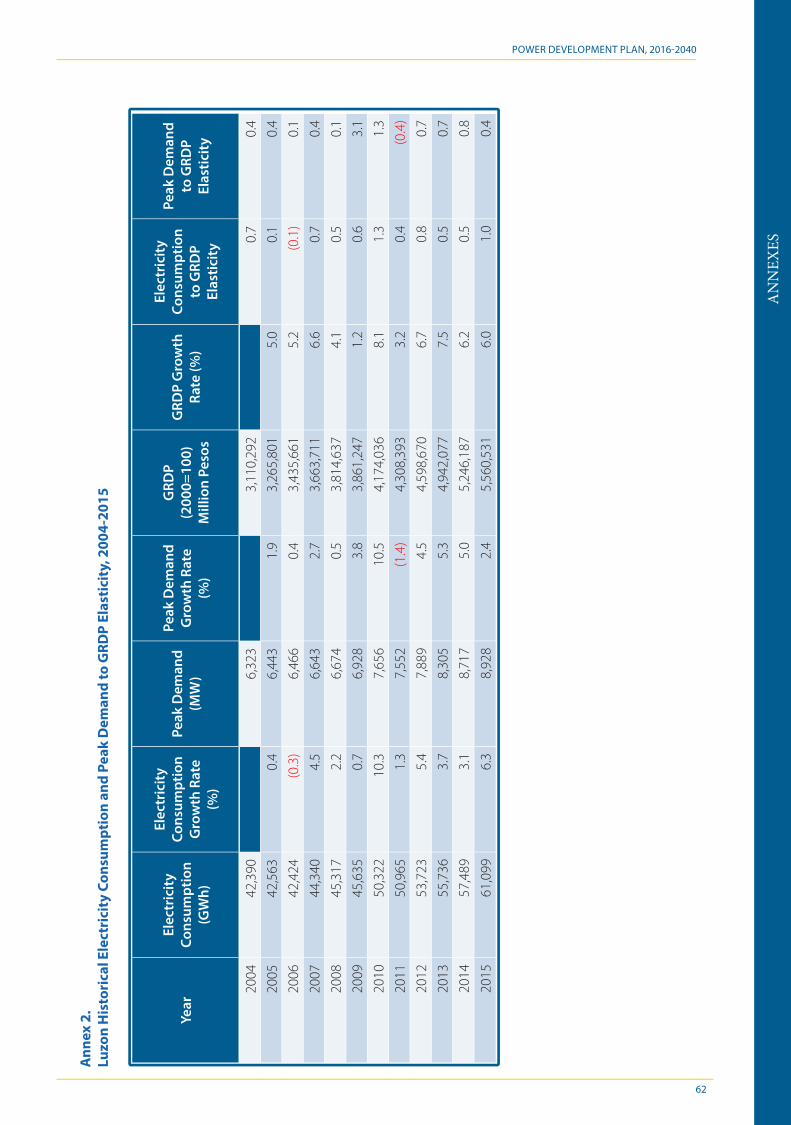
AN
NEX
ES
POWER DEVELOPMENT PLAN, 2016-2040
62
Ann
ex 2
.Lu
zon
His
tori
cal E
lect
rici
ty C
onsu
mpt
ion
and
Peak
Dem
and
to G
RDP
Elas
tici
ty, 2
004-
2015
Year
Elec
tric
ity
Cons
umpt
ion
(G
Wh)
Elec
tric
ity
Cons
umpt
ion
Gro
wth
Rat
e (%
)
Peak
Dem
and
(MW
)
Peak
Dem
and
Gro
wth
Rat
e (%
)
GRD
P (2
000=
100)
M
illio
n Pe
sos
GRD
P G
row
th
Rate
(%)
Elec
tric
ity
Cons
umpt
ion
to G
RDP
Elas
ticit
y
Peak
Dem
and
to G
RDP
Elas
ticit
y
2004
42,3
906,
323
3,11
0,29
20.
70.
4
2005
42,5
630.
46,
443
1.9
3,26
5,80
15.
00.
10.
4
2006
42,4
24(0
.3)
6,46
60.
43,
435,
661
5.2
(0.1
)0.
1
2007
44,3
404.
56,
643
2.7
3,66
3,71
16.
60.
70.
4
2008
45,3
172.
26,
674
0.5
3,81
4,63
74.
10.
50.
1
2009
45,6
350.
76,
928
3.8
3,86
1,24
71.
20.
63.
1
2010
50,3
2210
.37,
656
10.5
4,17
4,03
68.
11.
31.
3
2011
50,9
651.
37,
552
(1.4
)4,
308,
393
3.2
0.4
(0.4
)
2012
53,7
235.
47,
889
4.5
4,59
8,67
06.
70.
80.
7
2013
55,7
363.
78,
305
5.3
4,94
2,07
77.
50.
50.
7
2014
57,4
893.
18,
717
5.0
5,24
6,18
76.
20.
50.
8
2015
61,0
996.
38,
928
2.4
5,56
0,53
16.
01.
00.
4
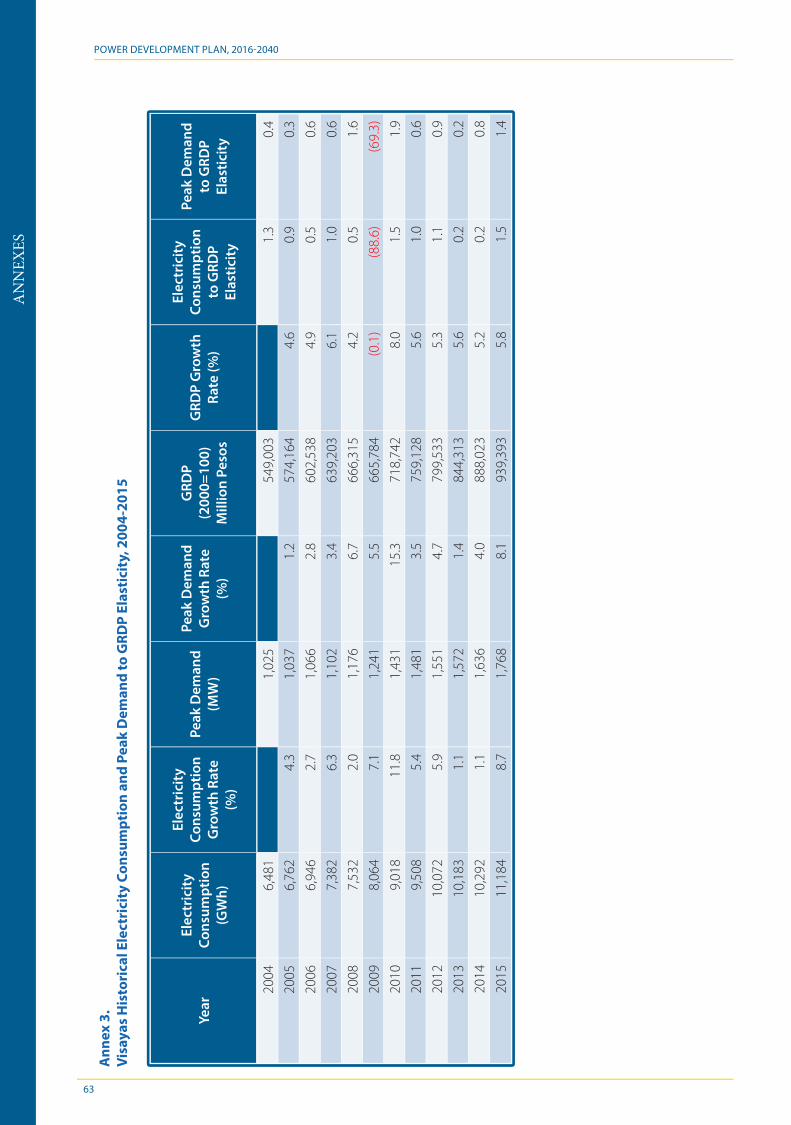
AN
NEX
ES
POWER DEVELOPMENT PLAN, 2016-2040
63
Ann
ex 3
.Vi
saya
s H
isto
rica
l Ele
ctri
city
Con
sum
ptio
n an
d Pe
ak D
eman
d to
GRD
P El
asti
city
, 200
4-20
15
Year
Elec
tric
ity
Cons
umpt
ion
(G
Wh)
Elec
tric
ity
Cons
umpt
ion
Gro
wth
Rat
e (%
)
Peak
Dem
and
(MW
)
Peak
Dem
and
Gro
wth
Rat
e (%
)
GRD
P (2
000=
100)
M
illio
n Pe
sos
GRD
P G
row
th
Rate
(%)
Elec
tric
ity
Cons
umpt
ion
to G
RDP
Elas
ticit
y
Peak
Dem
and
to G
RDP
Elas
ticit
y
2004
6,48
11,
025
549,
003
1.3
0.4
2005
6,76
24.
31,
037
1.2
574,
164
4.6
0.9
0.3
2006
6,94
62.
71,
066
2.8
602,
538
4.9
0.5
0.6
2007
7,38
26.
31,
102
3.4
639,
203
6.1
1.0
0.6
2008
7,53
22.
01,
176
6.7
666,
315
4.2
0.5
1.6
2009
8,06
47.
11,
241
5.5
665,
784
(0.1
)(8
8.6)
(69.
3)
2010
9,01
811
.81,
431
15.3
718,
742
8.0
1.5
1.9
2011
9,50
85.
41,
481
3.5
759,
128
5.6
1.0
0.6
2012
10,0
725.
91,
551
4.7
799,
533
5.3
1.1
0.9
2013
10,1
831.
11,
572
1.4
844,
313
5.6
0.2
0.2
2014
10,2
921.
11,
636
4.0
888,
023
5.2
0.2
0.8
2015
11,1
848.
71,
768
8.1
939,
393
5.8
1.5
1.4
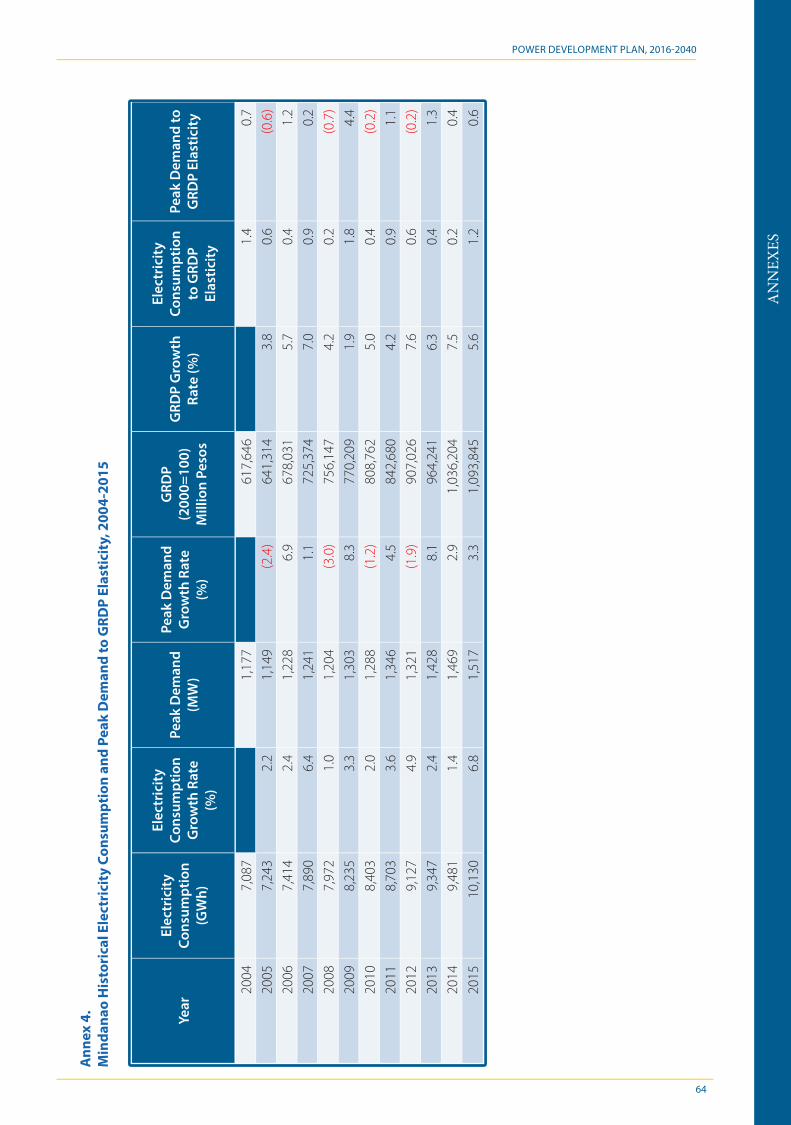
AN
NEX
ES
POWER DEVELOPMENT PLAN, 2016-2040
64
Ann
ex 4
.M
inda
nao
His
tori
cal E
lect
rici
ty C
onsu
mpt
ion
and
Peak
Dem
and
to G
RDP
Elas
tici
ty, 2
004-
2015
Year
Elec
tric
ity
Cons
umpt
ion
(G
Wh)
Elec
tric
ity
Cons
umpt
ion
Gro
wth
Rat
e (%
)
Peak
Dem
and
(MW
)
Peak
Dem
and
Gro
wth
Rat
e (%
)
GRD
P (2
000=
100)
M
illio
n Pe
sos
GRD
P G
row
th
Rate
(%)
Elec
tric
ity
Cons
umpt
ion
to G
RDP
Elas
ticit
y
Peak
Dem
and
to
GRD
P El
astic
ity
2004
7,08
71,
177
617,
646
1.4
0.7
2005
7,24
32.
21,
149
(2.4
)64
1,31
43.
80.
6(0
.6)
2006
7,41
42.
41,
228
6.9
678,
031
5.7
0.4
1.2
2007
7,89
06.
41,
241
1.1
725,
374
7.0
0.9
0.2
2008
7,97
21.
01,
204
(3.0
)75
6,14
74.
20.
2(0
.7)
2009
8,23
53.
31,
303
8.3
770,
209
1.9
1.8
4.4
2010
8,40
32.
01,
288
(1.2
)80
8,76
25.
00.
4(0
.2)
2011
8,70
33.
61,
346
4.5
842,
680
4.2
0.9
1.1
2012
9,12
74.
91,
321
(1.9
)90
7,02
67.
60.
6(0
.2)
2013
9,34
72.
41,
428
8.1
964,
241
6.3
0.4
1.3
2014
9,48
11.
41,
469
2.9
1,03
6,20
47.
50.
20.
4
2015
10,1
306.
81,
517
3.3
1,09
3,84
55.
61.
20.
6

AN
NEX
ES
POWER DEVELOPMENT PLAN, 2016-2040
65
Ann
ex 5
.El
ectr
icit
y Sa
les
and
Cons
umpt
ion
by S
ecto
r, 20
03-2
015
(in G
Wh)
Phili
ppin
es20
0320
0420
0520
0620
0720
0820
0920
1020
1120
1220
1320
1420
15Re
siden
tial
15,3
5715
,920
16,0
3115
,830
16,3
7616
,644
17,5
0418
,833
18,6
9419
,695
20,6
1420
,969
22,7
47Co
mm
erci
al11
,106
11,7
8512
,245
12,6
7913
,470
14,1
3614
,756
16,2
6116
,624
17,7
7718
,304
18,7
6120
,085
Indu
stria
l15
,188
15,0
1215
,705
15,8
8816
,522
17,0
3117
,084
18,5
7619
,334
20,0
7120
,677
21,4
2922
,514
Oth
ers
1,06
91,
359
1,17
71,
275
1,64
11,
395
1,52
31,
596
1,44
61,
668
1,97
12,
186
2,46
2To
tal S
ales
42,7
2044
,076
45,1
5945
,672
48,0
0949
,206
50,8
6855
,266
56,0
9859
,211
61,5
6663
,345
67,8
08O
wn-
Use
3,41
04,
654
4,59
14,
227
3,99
43,
935
3,52
44,
677
5,39
85,
351
5,95
96,
461
7,12
4Sy
stem
Los
s6,
810
7,22
86,
817
6,88
57,
608
7,68
07,
542
7,80
07,
680
8,36
07,
741
7,45
57,
481
Tota
l Con
sum
ptio
n52
,941
55,9
5756
,568
56,7
8459
,612
60,8
2161
,934
67,7
4369
,176
72,9
2275
,266
77,2
6182
,413

AN
NEX
ES
POWER DEVELOPMENT PLAN, 2016-2040
66
Ann
ex 6
.El
ectr
icit
y Sa
les
and
Cons
umpt
ion
by S
ecto
r, pe
r Gri
d, 2
003-
2015
(in
GW
h)
Luzo
n20
0320
0420
0520
0620
0720
0820
0920
1020
1120
1220
1320
1420
15
Res
iden
tial
11,7
9612
,115
12,0
3811
,802
12,1
2912
,236
12,8
0113
,865
13,5
5814
,262
15,0
5615
,304
16,5
28
C
omm
erci
al9,
649
10,1
3810
,495
10,8
6511
,503
12,0
6612
,519
13,6
8413
,975
14,9
0515
,510
16,1
0317
,272
In
dust
rial
10,4
7610
,149
10,6
7010
,563
11,0
3411
,522
11,7
4513
,030
13,3
9414
,086
14,3
7914
,939
15,8
76
O
ther
s54
762
358
971
276
879
279
480
977
981
085
989
591
3
Tota
l Sal
es32
,468
33,0
2533
,791
33,9
4135
,435
36,6
1537
,859
41,3
8941
,706
44,0
6445
,803
47,2
4150
,589
Ow
n-U
se2,
826
3,85
63,
738
3,44
43,
141
3,06
92,
666
3,72
94,
114
3,95
24,
550
5,04
05,
598
Syst
em L
oss
5,19
15,
509
5,03
35,
039
5,76
45,
632
5,11
05,
204
5,14
55,
707
5,38
35,
208
4,91
2
Tota
l Con
sum
ptio
n40
,485
42,3
9042
,563
42,4
2444
,340
45,3
1745
,635
50,3
2250
,965
53,7
2355
,736
57,4
8961
,099
Visa
yas
2003
2004
2005
2006
2007
2008
2009
2010
2011
2012
2013
2014
2015
R
esid
entia
l1,
785
1,87
31,
999
2,03
62,
157
2,20
82,
341
2,52
32,
527
2,66
82,
735
2,77
03,
068
C
omm
erci
al66
678
386
191
01,
003
1,04
41,
094
1,31
21,
324
1,42
61,
446
1,30
21,
418
In
dust
rial
2,02
21,
999
2,10
42,
340
2,40
22,
416
2,56
22,
770
3,03
83,
032
3,13
73,
214
3,26
8
O
ther
s24
537
732
026
545
529
331
343
133
652
155
075
31,
011
Tota
l Sal
es4,
718
5,03
25,
284
5,55
16,
017
5,96
16,
309
7,03
67,
224
7,64
77,
868
8,03
98,
765
Ow
n-U
se48
466
167
960
657
458
956
566
599
61,
092
1,05
51,
049
1,13
1
Syst
em L
oss
742
788
799
788
790
982
1,19
01,
317
1,28
81,
333
1,26
01,
204
1,28
8
Tota
l Con
sum
ptio
n5,
945
6,48
16,
762
6,94
67,
382
7,53
28,
064
9,01
89,
508
10,0
7210
,183
10,2
9211
,184
Min
dana
o20
0320
0420
0520
0620
0720
0820
0920
1020
1120
1220
1320
1420
15
Res
iden
tial
1,77
61,
933
1,99
51,
992
2,08
92,
200
2,36
22,
445
2,60
92,
765
2,82
32,
895
3,15
1
C
omm
erci
al79
186
488
990
496
41,
026
1,14
31,
265
1,32
41,
446
1,34
81,
357
1,39
4
In
dust
rial
2,69
02,
864
2,93
12,
985
3,08
63,
092
2,77
82,
776
2,90
22,
954
3,16
13,
275
3,37
0
O
ther
s27
735
926
929
841
831
141
735
633
233
656
353
853
8
Tota
l Sal
es5,
534
6,02
06,
084
6,17
96,
557
6,63
06,
699
6,84
17,
167
7,50
07,
895
8,06
58,
453
Ow
n-U
se10
013
717
317
827
927
729
328
228
930
635
537
239
5
Syst
em L
oss
877
931
985
1,05
71,
054
1,06
51,
243
1,28
01,
247
1,32
01,
097
1,04
41,
281
Tota
l Con
sum
ptio
n6,
511
7,08
77,
243
7,41
47,
890
7,97
28,
235
8,40
38,
703
9,12
79,
347
9,48
110
,130

AN
NEX
ES
POWER DEVELOPMENT PLAN, 2016-2040
67
Annex 7.Annual System Peak Demand per Grid, 1985-2015 (in MW)
Year Luzon % AAGR Visayas* % AAGR Mindanao % AAGR Total Non-Coincident Peak (Max)
% AAGR
1985 2,311 256 470 3,037
1986 2,435 5.4 284 10.9 484 3.0 3,203 5.5
1987 2,592 6.4 307 8.1 533 10.1 3,432 7.1
1988 2,780 7.3 333 8.5 571 7.1 3,684 7.3
1989 2,938 5.7 354 6.3 617 8.1 3,909 6.1
1990 2,973 1.2 380 7.3 621 0.6 3,974 1.7
1991 3,045 2.4 410 7.9 626 0.8 4,081 2.7
1992 3,250 6.7 472 15.1 573 (8.5) 4,295 5.2
1993 3,473 6.9 512 8.5 691 20.6 4,676 8.9
1994 3,561 2.5 557 8.8 696 0.7 4,814 3.0
1995 3,920 10.1 628 12.7 780 12.1 5,328 10.7
1996 4,306 9.8 647 3.0 828 6.2 5,781 8.5
1997 4,773 10.8 725 12.1 852 2.9 6,350 9.8
1998 4,863 1.9 707 (2.5) 868 1.9 6,438 1.4
1999 4,986 2.5 729 3.1 892 2.8 6,607 2.6
2000 5,450 9.3 749 2.7 939 5.3 7,138 8.0
2001 5,646 3.6 898 19.9 953 1.5 7,497 5.0
2002 5,823 3.1 903 0.6 995 4.4 7,721 3.0
2003 6,149 5.6 995 10.2 1,131 13.7 8,275 7.2
2004 6,323 2.8 1,025 3.0 1,177 4.1 8,525 3.0
2005 6,443 1.9 1,037 1.2 1,149 (2.4) 8,629 1.2
2006 6,466 0.4 1,066 2.8 1,228 6.9 8,760 1.5
2007 6,643 2.7 1,102 3.4 1,241 1.1 8,987 2.6
2008 6,674 0.5 1,176 6.7 1,204 (3.0) 9,054 0.7
2009 6,928 3.8 1,241 5.5 1,303 8.3 9,472 4.6
2010 7,656 10.5 1,431 15.3 1,288 (1.2) 10,375 9.5
2011 7,552 (1.4) 1,481 3.5 1,346 4.5 10,379 0.0
2012 7,889 4.5 1,551 4.7 1,321 (1.9) 10,761 3.7
2013 8,305 5.3 1,572 1.4 1,428 8.1 11,305 5.1
2014 8,717 5.0 1,636 4.1 1,469 2.9 11,822 4.6
2015 8,928 2.4 1,768 8.1 1,517 3.3 12,213 3.3

AN
NEX
ES
POWER DEVELOPMENT PLAN, 2016-2040
68
Ann
ex 8
.Vi
saya
s A
nnua
l Sys
tem
Pea
k D
eman
d pe
r Sub
-Gri
d, 1
995-
2015
(in
MW
)
Year
Cebu
% A
AG
RN
egro
s%
AA
GR
Pana
y%
AA
GR
Leyt
e-Sa
mar
% A
AG
RBo
hol
% A
AG
RTo
tal
Visa
yas
% A
AG
R
1995
248
113
8811
621
586
1996
272
9.73
12
712
.61
957.
03
116
0.30
22
5.69
63
27.
87
1997
291
7.10
14
110
.66
114
20.7
6 15
230
.41
247.
17
722
14.1
5 19
9829
72.
06
136
(3.7
0)11
4(0
.47)
127
(15.
96)
2815
.90
702
(2.7
9)19
9933
312
.16
152
12.0
3 81
(28.
65)
126
(1.1
0)30
8.66
72
22.
97
2000
353
6.04
15
62.
45
843.
45
122
(3.2
5)32
4.98
74
63.
33
2001
377
6.65
15
1(2
.78)
146
73.9
2 15
628
.09
31(3
.39)
861
15.3
3 20
0234
9(7
.40)
178
17.4
5 11
3(2
2.39
)16
23.
91
4030
.88
842
(2.1
6)20
0342
220
.97
179
0.94
10
5(7
.61)
175
7.93
41
3.28
92
39.
54
2004
417
(1.1
4)19
910
.86
122
16.6
8 16
7(4
.52)
4918
.73
955
3.46
20
0543
84.
94
195
(2.0
3)12
0(1
.91)
168
0.65
46
(6.3
3)96
71.
28
2006
458
4.68
19
91.
87
123
2.64
17
11.
43
460.
44
997
3.09
20
0747
74.
12
209
5.11
18
248
.20
186
8.76
49
5.42
1,
102
10.6
1 20
0852
29.
39
218
4.30
20
311
.49
182
(2.2
1)52
6.17
1,
176
6.68
20
0955
97.
07
215
(1.1
3)22
39.
91
188
3.49
56
7.77
1,
241
5.52
20
1067
420
.56
263
22.2
9 24
38.
68
204
8.33
48
(14.
21)
1,43
115
.31
2011
704
4.44
24
5(6
.75)
260
7.25
20
92.
81
6230
.83
1,48
13.
50
2012
747
6.20
25
64.
45
262
0.48
22
15.
65
653.
42
1,55
14.
71
2013
780
4.41
25
3(1
.40)
272
3.82
19
9(1
0.08
)63
(2.2
5)1,
567
1.01
20
1486
210
.45
266
5.38
26
4(2
.72)
181
(8.7
4)62
(2.2
3)1,
636
4.40
20
1585
0(1
.34)
309
15.9
2 30
916
.84
230
26.5
4 70
14.1
8 1,
768
8.09

AN
NEX
ES
POWER DEVELOPMENT PLAN, 2016-2040
69
Ann
ex 9
.Lu
zon
Mon
thly
Sys
tem
Pea
k D
eman
d, 2
001-
2015
(in
MW
)
Mon
thLu
zon
2001
2002
2003
2004
2005
2006
2007
2008
2009
2010
2011
2012
2013
2014
2015
Jan
5,11
95,
212
5,28
25,
511
5,47
15,
619
5,81
95,
972
6,11
86,
407
6,59
47,
027
7,07
97,
121
7,31
5
Feb
5,15
75,
056
5,34
55,
701
5,85
35,
776
6,11
56,
094
6,45
26,
878
6,87
77,
162
7,21
47,
545
7,61
0
Mar
5,38
45,
424
5,70
56,
065
6,21
06,
186
6,15
76,
211
6,64
27,
057
7,00
67,
503
7,72
07,
655
7,87
8
Apr
5,52
35,
589
6,14
96,
218
6,26
66,
222
6,58
16,
663
6,84
57,
305
7,05
67,
885
8,17
88,
267
8,72
7
May
5,64
65,
823
6,10
96,
323
6,44
36,
466
6,64
36,
485
6,82
97,
656
7,53
87,
889
8,30
58,
717
8,92
8
Jun
5,44
75,
750
5,83
15,
978
6,34
86,
339
6,61
96,
674
6,92
87,
646
7,55
27,
709
8,20
88,
607
8,88
1
Jul
5,28
15,
652
5,85
66,
061
6,03
96,
221
6,46
46,
559
6,84
87,
240
7,43
87,
574
8,03
08,
265
8,82
6
Aug
5,31
35,
604
5,81
35,
906
6,10
76,
094
6,36
96,
403
6,86
37,
009
7,20
07,
242
7,75
58,
230
8,88
9
Sep
5,36
45,
559
5,88
56,
097
5,99
86,
195
6,41
66,
496
6,87
37,
057
7,10
77,
293
7,96
68,
005
8,73
8
Oct
5,46
05,
687
5,87
85,
916
5,84
35,
845
6,15
56,
627
6,53
07,
074
7,25
57,
421
7,56
47,
993
8,62
4
Nov
5,31
95,
712
5,95
75,
987
5,88
95,
974
6,13
76,
492
6,66
26,
851
7,22
37,
425
7,48
88,
033
8,49
8
Dec
5,30
55,
707
5,90
45,
900
5,91
05,
813
6,19
56,
376
6,57
56,
946
7,17
87,
395
7,67
07,
996
8,48
7
Max
5,64
65,
823
6,14
96,
323
6,44
36,
466
6,64
36,
674
6,92
87,
656
7,55
27,
889
8,30
58,
717
8,92
8

AN
NEX
ES
POWER DEVELOPMENT PLAN, 2016-2040
70
Ann
ex 1
0.Vi
saya
s M
onth
ly S
yste
m P
eak
Dem
and,
200
1-20
15 (i
n M
W)
Mon
thVi
saya
s20
0120
0220
0320
0420
0520
0620
0720
0820
0920
1020
1120
1220
1320
1420
15Ja
n76
178
179
786
689
090
694
61,
067
1,12
21,
219
1,32
41,
391
1,46
31,
331
1,47
6Fe
b74
776
079
283
989
292
996
91,
069
1,15
91,
199
1,35
61,
386
1,44
61,
362
1,47
9M
ar75
576
582
287
889
994
997
21,
092
1,16
61,
254
1,37
01,
370
1,52
81,
411
1,52
8A
pr79
482
682
888
991
696
41,
007
1,11
21,
193
1,30
81,
431
1,44
71,
548
1,49
91,
630
May
777
842
837
896
928
968
1,01
51,
090
1,20
41,
364
1,40
51,
464
1,57
21,
606
1,61
8Ju
n77
381
885
885
792
696
11,
078
1,08
91,
204
1,34
41,
399
1,44
91,
555
1,63
61,
562
Jul
780
803
817
880
931
977
1,09
01,
105
1,20
11,
323
1,39
81,
440
1,54
31,
511
1,58
4A
ug77
879
383
288
991
995
11,
100
1,12
71,
214
1,31
01,
415
1,48
01,
207
1,57
91,
596
Sep
826
790
834
894
911
976
1,09
41,
128
1,20
61,
341
1,41
41,
456
1,54
71,
528
1,62
5O
ct79
878
085
790
491
796
71,
088
1,17
41,
215
1,33
31,
435
1,48
91,
520
1,51
71,
705
Nov
799
790
897
952
943
984
1,10
11,
176
1,24
11,
402
1,46
21,
502
1,51
81,
610
1,76
8D
ec81
384
292
495
596
799
71,
102
1,16
51,
231
1,43
11,
481
1,55
11,
350
1,52
61,
727
Max
826
842
924
955
967
997
1,10
21,
176
1,24
11,
431
1,48
11,
551
1,57
21,
636
1,76
8

AN
NEX
ES
POWER DEVELOPMENT PLAN, 2016-2040
71
Ann
ex 1
1.M
inda
nao
Mon
thly
Sys
tem
Pea
k D
eman
d, 2
001-
2015
(in
MW
)
Mon
thM
inda
nao
2001
2002
2003
2004
2005
2006
2007
2008
2009
2010
2011
2012
2013
2014
2015
Jan
887
911
946
1,05
81,
082
1,06
21,
108
1,15
81,
143
1,24
01,
250
1,27
01,
284
1,35
41,
387
Feb
900
913
918
1,04
41,
082
1,07
71,
141
1,14
61,
163
1,18
01,
231
1,19
11,
244
1,35
11,
380
Mar
903
900
978
1,02
71,
082
1,08
81,
177
1,16
21,
158
1,02
61,
219
1,24
41,
245
1,34
41,
370
Apr
887
927
985
1,05
11,
087
1,09
01,
167
1,19
01,
186
1,00
91,
253
1,23
21,
226
1,31
01,
406
May
901
920
1,00
11,
099
1,05
51,
118
1,10
91,
159
1,19
41,
211
1,25
31,
301
1,36
61,
339
1,43
8Ju
n89
793
11,
021
1,03
51,
072
1,10
01,
145
1,18
81,
220
1,23
81,
264
1,30
91,
364
1,41
61,
435
Jul
894
924
976
1,02
51,
045
1,09
31,
141
1,16
31,
198
1,21
41,
298
1,28
91,
384
1,39
01,
397
Aug
926
941
980
1,08
61,
061
1,11
91,
141
1,14
71,
208
1,22
11,
290
1,30
61,
326
1,38
61,
446
Sep
947
927
995
1,10
21,
078
1,09
01,
203
1,16
31,
217
1,23
51,
288
1,26
81,
256
1,39
11,
453
Oct
954
950
1,01
91,
134
1,12
21,
130
1,19
31,
156
1,29
21,
263
1,29
01,
319
1,21
91,
441
1,50
7N
ov93
896
51,
051
1,15
51,
149
1,14
71,
158
1,20
41,
303
1,28
61,
326
1,32
11,
397
1,46
91,
517
Dec
933
995
1,13
11,
177
1,10
51,
228
1,24
11,
175
1,28
21,
288
1,34
61,
318
1,42
81,
453
1,51
0M
ax95
499
51,
131
1,17
71,
149
1,22
81,
241
1,20
41,
303
1,28
81,
346
1,32
11,
428
1,46
91,
517

AN
NEX
ES
POWER DEVELOPMENT PLAN, 2016-2040
72
Ann
ex 1
2.Ph
ilipp
ine
Inst
alle
d an
d D
epen
dabl
e Ca
paci
ty b
y Pl
ant T
ype,
200
3-20
15 (i
n M
W)
Phili
ppin
es
Phili
ppin
e In
stal
led
Capa
city
2003
2004
2005
2006
2007
2008
2009
2010
2011
2012
2013
2014
2015
2016
C
oal
3,95
8 3,
967
3,96
7 4,
177
4,21
3 4,
213
4,27
7 4,
867
4,91
7 5,
568
5,56
8 5,
708
5,96
3 7,
419
O
il Ba
sed
3,60
4 3,
669
3,66
3 3,
602
3,61
6 3,
353
3,19
3 3,
193
2,99
4 3,
074
3,35
3 3,
476
3,61
0 3,
616
N
atur
al G
as2,
763
2,76
3 2,
763
2,76
3 2,
834
2,83
1 2,
831
2,86
1 2,
861
2,86
2 2,
862
2,86
2 2,
862
3,43
1
R
enew
able
Ene
rgy
(RE)
4,79
9 5,
149
5,22
6 5,
261
5,27
7 5,
284
5,30
9 5,
438
5,39
1 5,
521
5,54
1 5,
898
6,33
0 6,
958
G
eoth
erm
al1,
932
1,93
2 1,
978
1,97
8 1,
958
1,95
8 1,
953
1,96
6 1,
783
1,84
8 1,
868
1,91
8 1,
917
1,91
6
H
ydro
2,86
7 3,
217
3,22
2 3,
257
3,29
3 3,
291
3,29
1 3,
400
3,49
1 3,
521
3,52
1 3,
543
3,60
0 3,
618
B
iom
ass,
Sola
r, W
ind
0 0
26
26
26
34
64
73
117
153
153
437
812
1,42
4
Tota
l15
,124
15
,548
15
,619
15
,803
15
,941
15
,681
15
,610
16
,359
16
,162
17
,025
17
,325
17
,944
18
,765
21
,423
Ph
ilipp
ine
Dep
enda
ble
Capa
city
2003
2004
2005
2006
2007
2008
2009
2010
2011
2012
2013
2014
2015
2016
C
oal
3,69
1 3,
696
3,43
2 3,
638
3,46
7 3,
412
3,81
3 4,
245
4,65
1 5,
206
5,20
6 5,
378
5,61
3 6,
979
O
il Ba
sed
3,17
5 3,
216
3,04
3 2,
879
2,67
0 2,
702
2,52
8 2,
488
2,57
9 2,
561
2,84
6 2,
705
2,73
4 2,
821
N
atur
al G
as2,
703
2,70
3 2,
703
2,70
3 2,
703
2,56
2 2,
700
2,75
6 2,
770
2,76
0 2,
760
2,76
0 2,
759
3,29
1
R
enew
able
Ene
rgy
(RE)
3,82
8 4,
251
4,41
9 4,
407
4,65
0 4,
370
4,28
5 4,
413
4,47
8 4,
539
4,55
9 4,
789
5,32
5 6,
005
G
eoth
erm
al1,
568
1,56
0 1,
685
1,68
2 1,
667
1,38
7 1,
322
1,35
0 1,
434
1,46
2 1,
482
1,60
7 1,
601
1,68
9
H
ydro
2,26
0 2,
690
2,72
5 2,
715
2,97
3 2,
950
2,91
9 3,
021
2,96
3 2,
983
2,98
3 2,
982
3,07
3 3,
181
B
iom
ass,
Sola
r, W
ind
0 1
10
10
10
34
44
41
80
94
94
201
651
1,13
5
Tot
al13
,397
13
,865
13
,598
13
,627
13
,490
13
,047
13
,326
13
,902
14
,477
15
,066
15
,371
15
,633
16
,432
19
,097

AN
NEX
ES
POWER DEVELOPMENT PLAN, 2016-2040
73
Ann
ex 1
3.Lu
zon
Inst
alle
d an
d D
epen
dabl
e Ca
paci
ty b
y Pl
ant T
ype,
200
3-20
15 (i
n M
W)
Luzo
n
Luzo
n In
stal
led
Capa
city
2003
2004
2005
2006
2007
2008
2009
2010
2011
2012
2013
2014
2015
2016
C
oal
3,76
9 3,
769
3,76
9 3,
769
3,78
3 3,
783
3,84
9 3,
849
3,87
9 4,
531
4,53
1 4,
671
4,81
2 5,
294
O
il Ba
sed
2,51
4 2,
514
2,40
4 2,
333
2,36
3 2,
100
1,98
4 1,
984
1,75
7 1,
778
2,02
0 2,
033
2,13
3 2,
133
N
atur
al G
as2,
763
2,76
3 2,
763
2,76
3 2,
834
2,83
1 2,
831
2,86
1 2,
861
2,86
1 2,
861
2,86
1 2,
861
3,43
0
R
enew
able
Ene
rgy
(RE)
2,76
5 3,
115
3,19
2 3,
226
3,19
4 3,
199
3,19
9 3,
287
3,24
2 3,
358
3,37
8 3,
649
3,86
3 4,
120
G
eoth
erm
al90
7 90
7 95
4 95
4 88
6 88
6 88
6 89
9 75
1 82
4 84
4 84
4 84
4 84
3
H
ydro
1,85
8 2,
208
2,21
3 2,
247
2,28
4 2,
281
2,28
0 2,
346
2,44
0 2,
462
2,46
2 2,
471
2,52
8 2,
537
B
iom
ass,
Sola
r, W
ind
0 0
25
25
25
33
34
42
50
72
71
333
490
740
Tota
l11
,812
12
,162
12
,128
12
,092
12
,174
11
,913
11
,863
11
,981
11
,739
12
,528
12
,790
13
,213
13
,668
14
,977
Luzo
n D
epen
dabl
e Ca
paci
ty20
0320
0420
0520
0620
0720
0820
0920
1020
1120
1220
1320
1420
1520
16
C
oal
3,55
1 3,
551
3,28
7 3,
287
3,11
2 3,
056
3,45
0 3,
531
3,66
4 4,
219
4,21
9 4,
391
4,51
2 4,
970
O
il Ba
sed
2,23
6 2,
236
2,05
9 1,
928
1,71
3 1,
742
1,61
7 1,
586
1,63
3 1,
586
1,73
6 1,
507
1,58
5 1,
655
N
atur
al G
as2,
703
2,70
3 2,
703
2,70
3 2,
703
2,56
2 2,
700
2,75
6 2,
770
2,75
9 2,
759
2,75
9 2,
759
3,29
1
R
enew
able
Ene
rgy
(RE)
2,03
1 2,
381
2,54
7 2,
547
2,78
2 2,
507
2,46
4 2,
626
2,75
7 2,
785
2,80
5 2,
965
3,32
2 3,
684
G
eoth
erm
al60
4 60
4 72
7 72
6 71
4 43
9 43
1 50
0 58
7 58
7 60
7 69
2 69
1 77
7
H
ydro
1,42
8 1,
778
1,81
1 1,
813
2,05
9 2,
035
1,99
9 2,
101
2,12
4 2,
147
2,14
7 2,
131
2,22
4 2,
323
B
iom
ass,
Sola
r, W
ind
0 0
9 9
9 33
34
25
46
52
52
14
2 40
7 58
4
Tot
al10
,521
10
,871
10
,596
10
,466
10
,311
9,
868
10,2
30
10,4
98
10,8
24
11,3
49
11,5
19
11,6
22
12,1
79
13,6
00

AN
NEX
ES
POWER DEVELOPMENT PLAN, 2016-2040
74
Ann
ex 1
4.Vi
saya
s In
stal
led
and
Dep
enda
ble
Capa
city
by
Plan
t Typ
e, 2
003-
2015
(in
MW
)
Visa
yas
Visa
yas
Inst
alle
d Ca
paci
ty20
0320
0420
0520
0620
0720
0820
0920
1020
1120
1220
1320
1420
1520
16
C
oal
189
198
198
198
198
198
196
786
806
806
806
806
769
1,05
4
O
il Ba
sed
530
596
668
678
659
659
615
615
615
670
670
670
670
655
N
atur
al G
as0
00
00
00
00
11
11
1
R
enew
able
Ene
rgy
(RE)
927
927
927
927
976
977
1,00
71,
006
981
971
971
1,04
31,
242
1,57
4
G
eoth
erm
al91
691
691
691
696
496
496
496
492
391
591
596
596
596
5
H
ydro
1212
1212
1213
1313
1311
1111
1120
B
iom
ass,
Sola
r, W
ind
00
00
00
2929
4444
4466
266
590
Tota
l1,
647
1,72
11,
793
1,80
31,
833
1,83
51,
818
2,40
72,
402
2,44
82,
448
2,52
02,
683
3,28
4
Visa
yas
Dep
enda
ble
Capa
city
2003
2004
2005
2006
2007
2008
2009
2010
2011
2012
2013
2014
2015
2016
C
oal
140
145
145
140
155
155
153
501
777
777
777
777
761
1,05
0
O
il Ba
sed
416
507
493
459
479
482
426
464
476
505
505
505
425
434
N
atur
al G
as0
00
00
00
00
11
10
0
R
enew
able
Ene
rgy
(RE)
868
868
868
868
865
862
813
779
784
820
820
877
1,04
21,
329
G
eoth
erm
al85
685
685
685
685
384
979
275
174
577
777
781
781
381
3
H
ydro
1212
1212
1213
1313
1311
1111
1118
B
iom
ass,
Sola
r, W
ind
00
00
00
915
2632
3249
219
498
Tot
al1,
424
1,52
01,
506
1,46
71,
498
1,49
91,
392
1,74
52,
037
2,10
32,
103
2,16
02,
228
2,81
3

AN
NEX
ES
POWER DEVELOPMENT PLAN, 2016-2040
75
Ann
ex 1
5.M
inda
nao
Inst
alle
d an
d D
epen
dabl
e Ca
paci
ty b
y Pl
ant T
ype,
200
3-20
15 (i
n M
W)
Min
dana
o
Min
dana
o In
stal
led
Capa
city
2003
2004
2005
2006
2007
2008
2009
2010
2011
2012
2013
2014
2015
2016
C
oal
00
021
023
223
223
223
223
223
223
223
238
21,
070
O
il Ba
sed
559
559
591
591
594
594
594
594
622
625
663
773
807
828
N
atur
al G
as0
00
00
00
00
00
00
0
R
enew
able
Ene
rgy
(RE)
1,10
61,
106
1,10
71,
107
1,10
71,
107
1,10
31,
145
1,16
81,
192
1,19
21,
206
1,22
51,
264
G
eoth
erm
al10
810
810
810
810
810
810
310
310
810
810
810
810
810
8
H
ydro
998
998
998
998
998
998
998
1,04
01,
038
1,04
71,
047
1,06
11,
061
1,06
1
B
iom
ass,
Sola
r, W
ind
00
11
11
11
2237
3737
5695
Tota
l1,
665
1,66
51,
698
1,90
81,
933
1,93
31,
929
1,97
12,
022
2,04
92,
087
2,21
12,
414
3,16
2
Min
dana
o D
epen
dabl
e Ca
paci
ty20
0320
0420
0520
0620
0720
0820
0920
1020
1120
1220
1320
1420
1520
16
C
oal
0 0
0 21
0 20
0 20
1 21
0 21
2 21
0 21
0 21
0 21
0 34
0 95
9
O
il Ba
sed
524
473
491
491
478
478
485
438
469
470
605
693
724
733
N
atur
al G
as0
0 0
0 0
0 0
0 0
0 0
0 0
0
R
enew
able
Ene
rgy
(RE)
929
1,00
2 1,
005
992
1,00
3 1,
001
1,00
8 1,
008
937
934
934
948
961
993
G
eoth
erm
al10
8 10
0 10
1 10
0 10
0 98
10
0 10
0 10
2 98
98
98
98
10
0
H
ydro
821
901
902
891
902
902
907
907
827
826
826
840
837
840
B
iom
ass,
Sola
r, W
ind
0 1
1 1
1 1
1 1
8 10
10
10
25
53
Tot
al1,
453
1,47
5 1,
496
1,69
4 1,
681
1,68
0 1,
703
1,65
8 1,
616
1,61
4 1,
749
1,85
1 2,
025
2,68
4
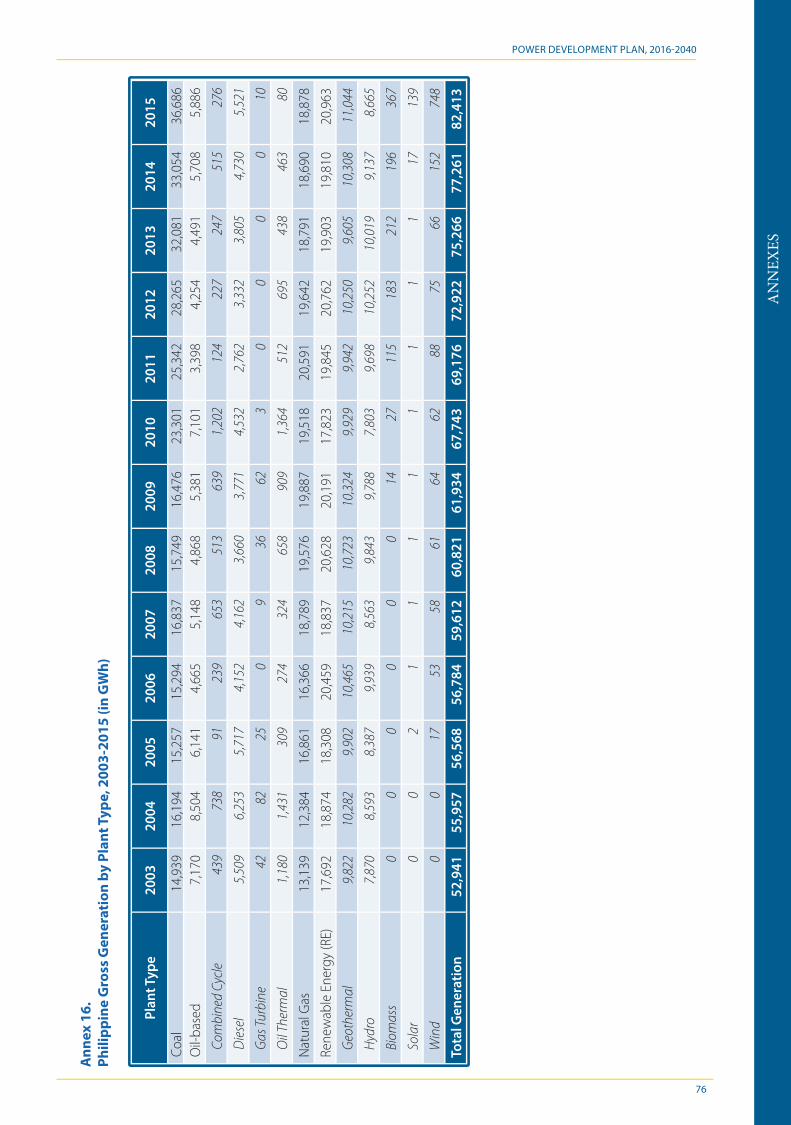
AN
NEX
ES
POWER DEVELOPMENT PLAN, 2016-2040
76
Ann
ex 1
6.Ph
ilipp
ine
Gro
ss G
ener
atio
n by
Pla
nt T
ype,
200
3-20
15 (i
n G
Wh)
Plan
t Typ
e20
0320
0420
0520
0620
0720
0820
0920
1020
1120
1220
1320
1420
15
Coal
14,9
3916
,194
15,2
5715
,294
16,8
3715
,749
16,4
7623
,301
25,3
4228
,265
32,0
8133
,054
36,6
86O
il-ba
sed
7,17
08,
504
6,14
14,
665
5,14
84,
868
5,38
17,
101
3,39
84,
254
4,49
15,
708
5,88
6
Com
bine
d Cy
cle
439
738
9123
965
351
363
91,
202
124
227
247
515
276
Die
sel
5,50
96,
253
5,71
74,
152
4,16
23,
660
3,77
14,
532
2,76
23,
332
3,80
54,
730
5,52
1
Gas
Turb
ine
4282
250
936
623
00
00
10
Oil
Ther
mal
1,18
01,
431
309
274
324
658
909
1,36
451
269
543
846
380
Nat
ural
Gas
13,1
3912
,384
16,8
6116
,366
18,7
8919
,576
19,8
8719
,518
20,5
9119
,642
18,7
9118
,690
18,8
78
Rene
wab
le E
nerg
y (R
E)17
,692
18,8
7418
,308
20,4
59
18,8
3720
,628
20,1
9117
,823
19,8
4520
,762
19,9
0319
,810
20,9
63
Geo
ther
mal
9,82
210
,282
9,90
210
,465
10,2
1510
,723
10,3
249,
929
9,94
210
,250
9,60
510
,308
11,0
44
Hyd
ro7,
870
8,59
38,
387
9,93
98,
563
9,84
39,
788
7,80
39,
698
10,2
5210
,019
9,13
78,
665
Bio
mas
s 0
00
00
014
2711
518
321
219
636
7
Sol
ar0
02
11
11
11
11
1713
9
Win
d0
017
5358
6164
6288
7566
152
748
Tota
l Gen
erat
ion
52,9
4155
,957
56,5
6856
,784
59,6
1260
,821
61,9
3467
,743
69,1
7672
,922
75,2
6677
,261
82,4
13

AN
NEX
ES
POWER DEVELOPMENT PLAN, 2016-2040
77
Ann
ex 1
7.Lu
zon,
Vis
ayas
and
Min
dana
o G
ross
Gen
erat
ion
by P
lant
Typ
e, 2
003-
2015
(in
GW
h)
Luzo
n20
0320
0420
0520
0620
0720
0820
0920
1020
1120
1220
1320
1420
15Co
al14
,351
15,5
4814
,653
14,0
9914
,418
13,5
0414
,091
20,0
4719
,681
21,8
7825
,756
27,3
4629
,680
Oil-
base
d3,
596
4,59
12,
022
1,71
12,
192
1,92
81,
864
3,28
71,
291
1,80
01,
601
2,34
21,
845
Nat
ural
Gas
13,1
3912
,384
16,8
6116
,366
18,7
8919
,576
19,8
8719
,518
20,5
9119
,642
18,7
8318
,686
18,8
78Re
new
able
Ene
rgy
(RE)
6,44
87,
330
7,09
19,
065
8,22
19,
192
9,13
27,
413
8,45
48,
993
8,67
98,
392
9,71
1 G
eoth
erm
al2,
600
3,03
32,
742
3,51
93,
601
3,73
03,
516
3,32
33,
486
3,58
83,
399
3,81
74,
096
Hyd
ro3,
848
4,29
74,
331
5,49
24,
562
5,40
05,
549
4,01
44,
836
5,29
25,
156
4,35
74,
769
Bio
mas
s 0
00
00
03
1444
3760
6518
7 S
olar
00
00
00
00
00
00
66 W
ind
00
1753
5861
6462
8875
6615
259
2To
tal G
ener
atio
n37
,535
39,8
5440
,627
41,2
4143
,620
44,2
0044
,975
50,2
6550
,017
52,3
1254
,820
56,7
6660
,113
Visa
yas
2003
2004
2005
2006
2007
2008
2009
2010
2011
2012
2013
2014
2015
Coal
588
646
604
719
848
746
822
1,52
94,
032
4,70
14,
690
4,44
94,
968
Oil-
base
d1,
861
1,99
81,
800
1,28
21,
477
1,66
51,
864
1,72
768
373
479
676
667
2N
atur
al G
as0
00
00
00
00
08
40
Rene
wab
le E
nerg
y (R
E)6,
394
6,37
36,
295
6,12
85,
776
6,23
96,
038
5,82
05,
740
6,04
75,
606
5,79
46,
530
Geo
ther
mal
6,36
16,
338
6,26
76,
100
5,74
76,
199
5,98
55,
771
5,61
65,
930
5,46
35,
627
6,10
5 H
ydro
3334
2728
2940
4236
5346
3735
38 B
iom
ass
00
00
00
1113
7271
106
117
159
Sol
ar0
00
00
00
00
00
1571
Win
d0
00
00
00
00
00
015
7To
tal G
ener
atio
n8,
842
9,01
68,
698
8,12
98,
102
8,65
08,
724
9,07
510
,456
11,4
8311
,100
11,0
1412
,170
Min
dana
o20
0320
0420
0520
0620
0720
0820
0920
1020
1120
1220
1320
1420
15Co
al0
00
476
1,57
11,
499
1,56
31,
726
1,62
91,
686
1,63
51,
258
2,03
8O
il-ba
sed
1,71
41,
916
2,32
01,
672
1,47
91,
275
1,65
22,
087
1,42
41,
720
2,09
42,
599
3,36
9N
atur
al G
as0
00
00
00
00
00
00
Rene
wab
le E
nerg
y (R
E)4,
850
5,17
14,
923
5,26
64,
841
5,19
75,
020
4,59
05,
650
5,72
15,
618
5,62
44,
723
Geo
ther
mal
861
910
893
846
867
794
823
834
841
731
743
864
842
Hyd
ro3,
989
4,26
24,
028
4,41
93,
972
4,40
24,
196
3,75
44,
808
4,91
34,
827
4,74
53,
858
Bio
mas
s 0
00
00
00
00
7547
1421
Sol
ar0
02
11
11
11
11
12
Win
d0
00
00
00
00
00
00
Tota
l Gen
erat
ion
6,56
47,
087
7,24
37,
414
7,89
07,
972
8,23
58,
403
8,70
39,
127
9,34
79,
481
10,1
30

AN
NEX
ES
POWER DEVELOPMENT PLAN, 2016-2040
78
Ann
ex 1
8.Vi
saya
s Su
bgri
d G
ross
Gen
erat
ion
by P
lant
Typ
e, 2
003-
2015
(in
GW
h)
2005
2006
2007
2008
2009
2010
2011
2012
2013
2014
2015
Cebu
1,71
61,
366
1,56
71,
647
1,90
22,
434
3,65
14,
158
4,19
73,
811
4,15
4Co
al60
471
984
874
682
21,
499
3,24
93,
674
3,65
23,
354
3,86
8O
il-ba
sed
1,10
864
271
489
51,
074
930
395
477
532
448
282
Nat
ural
Gas
00
00
00
00
84
0Re
new
able
Ene
rgy
(RE)
55
56
65
67
54
4 G
eoth
erm
al0
00
00
00
00
00
Hyd
ro5
55
66
56
75
44
Bio
mas
s 0
00
00
00
00
00
Sol
ar0
00
00
00
00
00
Win
d0
00
00
00
00
00
Neg
ros
1,42
31,
379
1,46
01,
344
1,35
61,
425
1,45
21,
600
1,55
21,
743
1,94
0Co
al0
00
00
00
00
00
Oil-
base
d0
00
00
00
00
00
Nat
ural
Gas
00
00
00
00
00
0Re
new
able
Ene
rgy
(RE)
1,42
31,
379
1,46
01,
344
1,35
61,
425
1,45
21,
600
1,55
21,
743
1,94
0 G
eoth
erm
al1,
421
1,37
71,
458
1,34
31,
344
1,41
11,
404
1,57
21,
491
1,65
71,
767
Hyd
ro2
32
21
22
00
00
Bio
mas
s 0
00
011
1347
2862
7013
1 S
olar
00
00
00
00
015
42 W
ind
00
00
00
00
00
0Pa
nay
652
608
728
725
744
787
1,04
31,
266
1,28
41,
393
1,59
7Co
al0
00
00
3078
31,
027
1,03
71,
095
1,10
1O
il-ba
sed
652
608
728
725
744
757
235
197
202
251
312
Nat
ural
Gas
00
00
00
00
00
0Re
new
able
Ene
rgy
(RE)
00
00
00
2543
4446
185
Geo
ther
mal
00
00
00
00
00
0 H
ydro
00
00
00
00
00
0 B
iom
ass
00
00
00
2543
4446
28 S
olar
00
00
00
00
00
0 W
ind
00
00
00
00
00
157
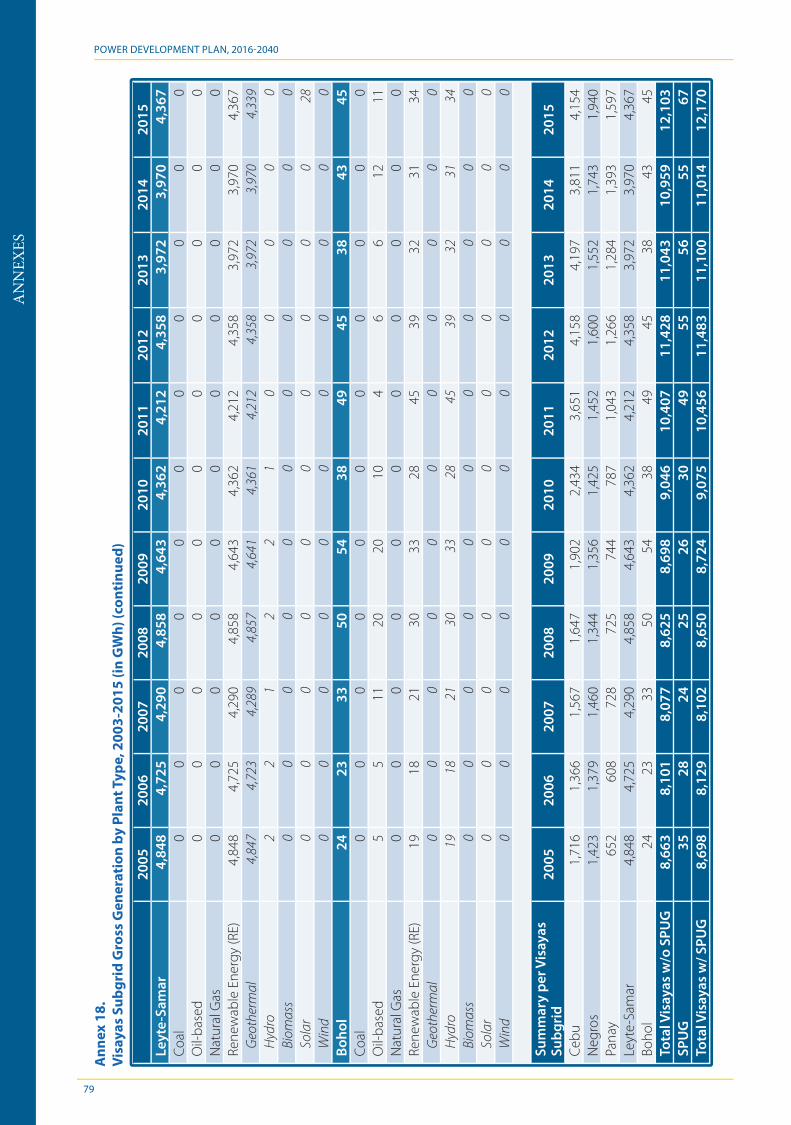
AN
NEX
ES
POWER DEVELOPMENT PLAN, 2016-2040
79
2005
2006
2007
2008
2009
2010
2011
2012
2013
2014
2015
Leyt
e-Sa
mar
4,84
84,
725
4,29
04,
858
4,64
34,
362
4,21
24,
358
3,97
23,
970
4,36
7Co
al0
00
00
00
00
00
Oil-
base
d0
00
00
00
00
00
Nat
ural
Gas
00
00
00
00
00
0Re
new
able
Ene
rgy
(RE)
4,84
84,
725
4,29
04,
858
4,64
34,
362
4,21
24,
358
3,97
23,
970
4,36
7 G
eoth
erm
al4,
847
4,72
34,
289
4,85
74,
641
4,36
14,
212
4,35
83,
972
3,97
04,
339
Hyd
ro2
21
22
10
00
00
Bio
mas
s 0
00
00
00
00
00
Sol
ar0
00
00
00
00
028
Win
d0
00
00
00
00
00
Boho
l24
2333
5054
3849
4538
4345
Coal
00
00
00
00
00
0O
il-ba
sed
55
1120
2010
46
612
11N
atur
al G
as0
00
00
00
00
00
Rene
wab
le E
nerg
y (R
E)19
1821
3033
2845
3932
3134
Geo
ther
mal
00
00
00
00
00
0 H
ydro
1918
2130
3328
4539
3231
34 B
iom
ass
00
00
00
00
00
0 S
olar
00
00
00
00
00
0 W
ind
00
00
00
00
00
0
Sum
mar
y pe
r Vis
ayas
Su
bgri
d20
0520
0620
0720
0820
0920
1020
1120
1220
1320
1420
15
Cebu
1,71
61,
366
1,56
71,
647
1,90
22,
434
3,65
14,
158
4,19
73,
811
4,15
4N
egro
s1,
423
1,37
91,
460
1,34
41,
356
1,42
51,
452
1,60
01,
552
1,74
31,
940
Pana
y65
260
872
872
574
478
71,
043
1,26
61,
284
1,39
31,
597
Leyt
e-Sa
mar
4,84
84,
725
4,29
04,
858
4,64
34,
362
4,21
24,
358
3,97
23,
970
4,36
7Bo
hol
2423
3350
5438
4945
3843
45To
tal V
isay
as w
/o S
PUG
8,66
38,
101
8,07
78,
625
8,69
89,
046
10,4
0711
,428
11,0
4310
,959
12,1
03SP
UG
3528
2425
2630
4955
5655
67To
tal V
isay
as w
/ SPU
G8,
698
8,12
98,
102
8,65
08,
724
9,07
510
,456
11,4
8311
,100
11,0
1412
,170
Ann
ex 1
8.Vi
saya
s Su
bgri
d G
ross
Gen
erat
ion
by P
lant
Typ
e, 2
003-
2015
(in
GW
h) (c
onti
nued
)
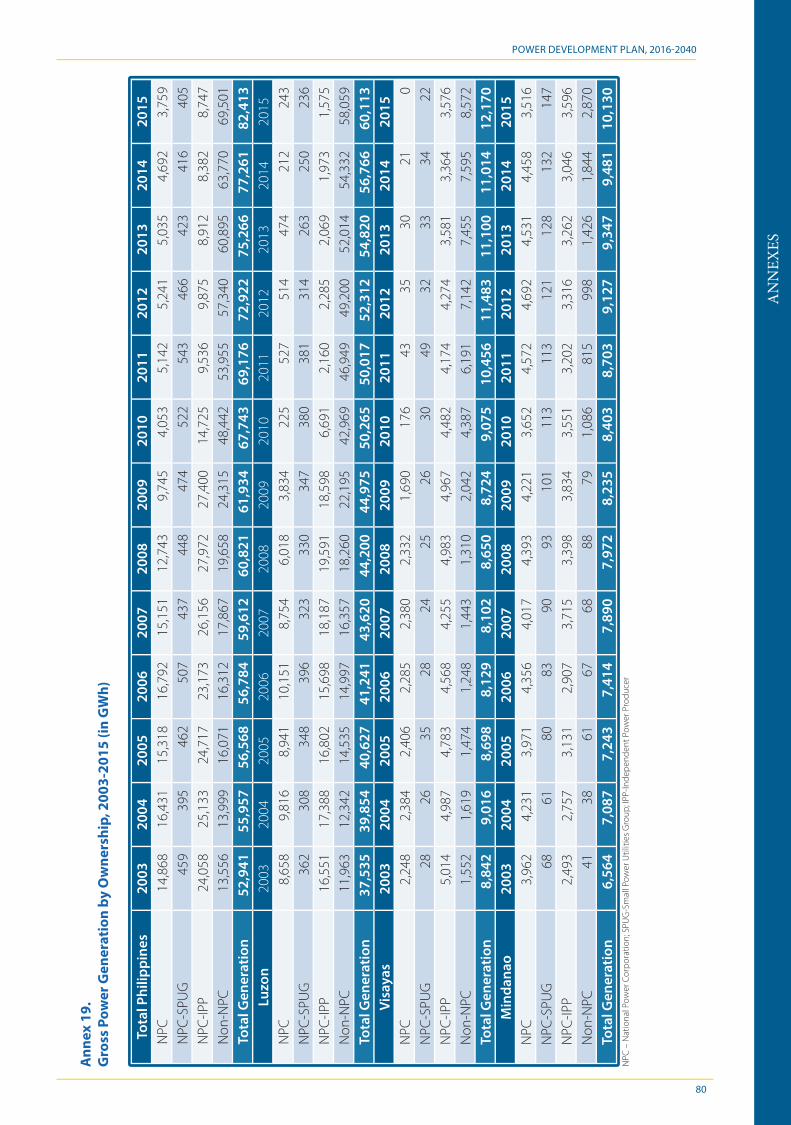
AN
NEX
ES
POWER DEVELOPMENT PLAN, 2016-2040
80
Ann
ex 1
9.G
ross
Pow
er G
ener
atio
n by
Ow
ners
hip,
200
3-20
15 (i
n G
Wh)
Tota
l Phi
lippi
nes
2003
2004
2005
2006
2007
2008
2009
2010
2011
2012
2013
2014
2015
NPC
14,8
6816
,431
15,3
1816
,792
15,1
5112
,743
9,74
54,
053
5,14
25,
241
5,03
54,
692
3,75
9N
PC-S
PUG
459
395
462
507
437
448
474
522
543
466
423
416
405
NPC
-IPP
24,0
5825
,133
24,7
1723
,173
26,1
5627
,972
27,4
0014
,725
9,53
69,
875
8,91
28,
382
8,74
7N
on-N
PC13
,556
13,9
9916
,071
16,3
1217
,867
19,6
5824
,315
48,4
4253
,955
57,3
4060
,895
63,7
7069
,501
Tota
l Gen
erat
ion
52,9
4155
,957
56,5
6856
,784
59,6
1260
,821
61,9
3467
,743
69,1
7672
,922
75,2
6677
,261
82,4
13Lu
zon
2003
2004
2005
2006
2007
2008
2009
2010
2011
2012
2013
2014
2015
NPC
8,65
89,
816
8,94
110
,151
8,75
46,
018
3,83
422
552
751
447
421
224
3N
PC-S
PUG
362
308
348
396
323
330
347
380
381
314
263
250
236
NPC
-IPP
16,5
5117
,388
16,8
0215
,698
18,1
8719
,591
18,5
986,
691
2,16
02,
285
2,06
91,
973
1,57
5N
on-N
PC11
,963
12,3
4214
,535
14,9
9716
,357
18,2
6022
,195
42,9
6946
,949
49,2
0052
,014
54,3
3258
,059
Tota
l Gen
erat
ion
37,5
3539
,854
40,6
2741
,241
43,6
2044
,200
44,9
7550
,265
50,0
1752
,312
54,8
2056
,766
60,1
13Vi
saya
s20
0320
0420
0520
0620
0720
0820
0920
1020
1120
1220
1320
1420
15N
PC2,
248
2,38
42,
406
2,28
52,
380
2,33
21,
690
176
4335
3021
0N
PC-S
PUG
2826
3528
2425
2630
4932
3334
22N
PC-IP
P5,
014
4,98
74,
783
4,56
84,
255
4,98
34,
967
4,48
24,
174
4,27
43,
581
3,36
43,
576
Non
-NPC
1,55
21,
619
1,47
41,
248
1,44
31,
310
2,04
24,
387
6,19
17,
142
7,45
57,
595
8,57
2To
tal G
ener
atio
n8,
842
9,01
68,
698
8,12
98,
102
8,65
08,
724
9,07
510
,456
11,4
8311
,100
11,0
1412
,170
Min
dana
o20
0320
0420
0520
0620
0720
0820
0920
1020
1120
1220
1320
1420
15N
PC3,
962
4,23
13,
971
4,35
64,
017
4,39
34,
221
3,65
24,
572
4,69
24,
531
4,45
83,
516
NPC
-SPU
G68
6180
8390
9310
111
311
312
112
813
214
7N
PC-IP
P2,
493
2,75
73,
131
2,90
73,
715
3,39
83,
834
3,55
13,
202
3,31
63,
262
3,04
63,
596
Non
-NPC
4138
6167
6888
791,
086
815
998
1,42
61,
844
2,87
0To
tal G
ener
atio
n6,
564
7,08
77,
243
7,41
47,
890
7,97
28,
235
8,40
38,
703
9,12
79,
347
9,48
110
,130
NPC
– N
atio
nal P
ower
Cor
por
atio
n; S
PUG
-Sm
all P
ower
Util
ities
Gro
up; I
PP-In
dep
ende
nt P
ower
Pro
duce
r


For inquiries, please contact:
Felix William B. FuentebellaUndersecretary
Mylene C. Capongcol Director, Electric Power Industry Management Bureau
Irma C. Exconde Assistant Director, Electric Power Industry Management Bureau
Power Generation and Supply Monitoring and Development ectio
el a E ercitoOIC-Chief, Power Planning and Development Division
Mark Christian P. MarollanoJhoana R. Bautista-Limbaga
Mary Grace V. GabisNoriel Christopher R. Reyes
Beejee B. DequiñaKenneth Jack P. Muñoz
Jordan M. BallaranArthur Kent M. Holt
Department of Energy Energy Center, Rizal Drive, Bonifacio Global City
(BGC) Taguig City, Philippines 1632 Tel. Nos.: 840-2173; 479-2900 local 386, 202
Website: http://www.doe.gov.phFacebook: http://www.facebook.com/doe.gov.ph
Instagram: @DOE_PH Twitter: @DOE_PH
For inquiries, please contact:
Felix William B. FuentebellaUndersecretary
Redentor E. DelolaAssistant Secretary
Mylene C. CapongcolDirector, Electric Power Industry Management Bureau
Irma C. ExcondeAssistant Director, Electric Power Industry Management Bureau
Electric Power Industry Management Bureau
Thelma B. EjercitoOIC-Chief, Power Planning and Development Division
Luningning G. BaltazarChief, Power Market Development Division
Josue B. BalacuitOIC-Chief, Rural Electrification Administration and Management Division
Mark Christian P. MarollanoJhoana R. Bautista-Limbaga
Mary Grace V. GabisNoriel Christopher R. Reyes
Beejee B. DequiñaGenevieve Dawn Tolentino
Kenneth Jack P. MuñozJordan M. Ballaran
Arthur Kent M. HoltMarc Louie l. Olap
Department of EnergyEnergy Center, Rizal Drive, Bonifacio Global City (BGC)
Taguig City, Philippines 1632Tel. Nos.: 840-2173; 479-2900 local 386, 202
Website: http://www.doe.gov.phFacebook: http://www.facebook.com/doe.gov.ph
Instagram: @DOE_PHTwitter: @DOE_PH