aboriginal and torres strait islander people with coronary
TRANSCRIPT

Aboriginal and Torres Strait Islander people with coronary
heart disease
Further perspectives on health status and treatment

The Australian Institute of Health and Welfare is Australia’s national health and welfare statistics and information agency. The Institute’s mission is better health and wellbeing for Australians through better health and welfare statistics and information.
Please note that as with all statistical reports there is the potential for minor revisions of data in this report over its life. Please refer to the online version at <www.aihw.gov.au>.

CARDIOVASCULAR DISEASE SERIES Number 25
Aboriginal and Torres Strait Islander people with coronary
heart disease
Further perspectives on health status and treatment
Sushma Mathur Lynelle Moon
and Sharon Leigh
September 2006
Australian Institute of Health and Welfare Canberra
AIHW cat. no. CVD 33

© Australian Institute of Health and Welfare 2006 This work is copyright. Apart from any use as permitted under the Copyright Act 1968, no part may be reproduced without prior written permission from the Australian Institute of Health and Welfare. Requests and enquiries concerning reproduction and rights should be directed to the Head, Business Promotion and Media Unit, Australian Institute of Health and Welfare, GPO Box 570, Canberra ACT 2601. This publication is part of the Australian Institute of Health and Welfare’s Cardiovascular Disease Series. A complete list of the Institute’s publications is available from the Business Promotion and Media Unit, Australian Institute of Health and Welfare, GPO Box 570, Canberra ACT 2601, or via the Institute’s website <http://www.aihw.gov.au>. ISSN 1323–9236 ISBN 1 74024 607 1
Suggested citation
AIHW: Mathur S, Moon L, Leigh S 2006. Aboriginal and Torres Strait Islander people with coronary heart disease: further perspectives on health status and treatment. Cardiovascular diseases series no. 25. Cat. no. CVD 33. Canberra: Australian Institute of Health and Welfare.
Australian Institute of Health and Welfare
Board Chair Hon. Peter Collins, AM, QC Director Penny Allbon Any enquiries about or comments on this publication should be directed to: Sushma Mathur Australian Institute of Health and Welfare GPO Box 570 Canberra ACT 2601 Phone: (02) 6244 1067 Published by the Australian Institute of Health and Welfare Printed by
v
Contents
List of tables .......................................................................................................................................vii
List of figures ................................................................................................................................... viii
Acknowledgments.............................................................................................................................. ix
Summary .............................................................................................................................................. xi
1 Introduction ...................................................................................................................................1
2 Methods..........................................................................................................................................3
Data sources....................................................................................................................................3
Data quality ....................................................................................................................................4
Health measures ............................................................................................................................5
Analytical methods........................................................................................................................7
3 Incidence of major coronary events and case fatality............................................................9
Incidence of major coronary events ............................................................................................9
Case fatality ..................................................................................................................................11
4 Coronary procedures in hospital .............................................................................................15
Use of procedures ........................................................................................................................16
5 Case complexity ..........................................................................................................................19
Comorbidities...............................................................................................................................20
Procedure use according to complexity ...................................................................................21
6 Discussion ....................................................................................................................................24
Incidence and case fatality..........................................................................................................24
Coronary procedures in hospital...............................................................................................24
Case complexity ...........................................................................................................................25
Other issues which may influence procedure rates................................................................26
Data issues ....................................................................................................................................27
Conclusion ....................................................................................................................................27

vi
Appendix A: Methods .......................................................................................................................28
Cardiac procedures in hospital..................................................................................................28
Cause of death and hospital diagnosis classification .............................................................28
Rates...............................................................................................................................................29
Inequality measures—worked example...................................................................................30
Appendix B: Statistical tables ..........................................................................................................32
Glossary................................................................................................................................................34
References............................................................................................................................................38

vii
List of tables Table 3.1: Incidence of major coronary events in Qld, WA, SA and NT, 2002–2003 .................10 Table 3.2: Case fatality for major coronary events in Qld, WA, SA and NT, 2002–2003...........12 Table 3.3: Out-of-hospital fatality rates for major coronary events in Qld, WA, SA, and
NT, 2002–2003 ...................................................................................................................13 Table 3.4: In-hospital fatality rates for major coronary events (all ages) in Qld, WA, SA,
and NT, 2002–2003 ...........................................................................................................14 Table 4.1: Use of coronary procedures for those hospitalised with CHD in Qld, WA, SA
and NT, 2002–2003 ...........................................................................................................17 Table 4.2: Inequalities in the use of PCI and CABG procedures for those hospitalised with
a principal diagnosis of CHD in Qld, WA, SA and NT, 2002–2003 ...........................18 Table 5.1: Comorbidities in CHD hospitalisations in Qld, WA, SA and NT, 2002–2003...........20 Table 5.2: CHD hospitalisations with coronary procedures by number of comorbidities in
Qld, WA, SA and NT, 2002–2003 ....................................................................................23 Table A1: Codes for deaths and hospital data used in this report ...............................................29 Table B1: Population estimates for Qld, WA, SA, and NT, 2002–2003 ........................................32 Table B2: Number of hospitalisations with CHD as principal diagnosis by number of
comorbidities in Qld, WA, SA and NT, 2002–2003.......................................................33

viii
List of figures Figure 3.1: Incidence of major coronary events in Qld, WA, SA and NT, 2002–2003.................9 Figure 3.2: Case fatality rates for major coronary events in Qld, WA, SA and NT,
2002–2003 .........................................................................................................................11 Figure 4.1: Proportion of CHD hospitalisations with a coronary procedure (during one
episode of care) in Qld, WA, SA and NT, 2002–2003.................................................16 Figure 5.1: Number of selected comorbidities for CHD hospitalisations in Qld, WA, SA
and NT, 2002–2003.........................................................................................................21 Figure 5.2: Proportion of CHD hospitalisations with coronary procedures by number of
comorbidities, Qld, WA, SA and NT, 2002–2003........................................................22
Figure A1: Hypothetical rates………………………………………..…………………..…………30

ix
Acknowledgments This report was prepared by Ms Sushma Mathur, Ms Lynelle Moon and Ms Sharon Leigh of the Australian Institute of Health and Welfare (AIHW). A number of other AIHW staff provided valuable input during the writing of this report and their time and commitment are greatly appreciated. Dr Paul Magnus provided detailed comments and advice on many of the medical aspects of the report. Ms Jenny Hargreaves, Mr Robert Van der Hoek, Dr Fadwa Al-Yaman and Dr Chris Stevenson are gratefully acknowledged for their constructive comments and editorial suggestions. Significant input from Ms Elizabeth Penm in the development of the summary to this report and in the finalisation of the report is greatly appreciated. In recognition of the importance of the prevention and control of coronary heart disease among Aboriginal and Torres Strait Islander people, an expert working group was convened to provide strategic advice and feedback on the content of this report. We are grateful for the valuable comments and direction provided by Dr Warren Walsh, Dr Ian Ring, Dr Ana Herceg, Dr Alex Brown, Dr Tarun Weeramanthri, Dr Traven Lea and Dr Noel Hayman. We are also grateful to members of the National Cardiovascular Disease Data Working Group for providing valued input to this report. Special thanks go to Professor Andrew Tonkin, Professor Annette Dobson, Professor Michael Hobbs, Dr Mandy Thrift and Mr Colin Nelson for their valuable comments and contributions. Financial assistance from the Australian Government Department of Health and Ageing contributed to the production of this report.

x

xi
Summary
The issues It is well known that Aboriginal and Torres Strait Islander people have much higher death rates from ‘major coronary events’ (often known as heart attacks) than other Australians. But what has not been known is whether this is because they: are much more likely to have a heart attack in the first place; have much lower survival; are more complex cases; or receive less treatment—or some combination of these and other factors.
The study This study used 2002–2003 hospital and mortality records to examine some of these questions for Indigenous Australians. Data were considered adequate for inclusion in the analysis from Queensland, Western Australia, South Australia and the Northern Territory. The study is the first of this scale to take aspects of Indigenous case complexity into account and to measure Indigenous hospital procedure rates in terms of need.
The findings The study found that, compared with other Australians, Aboriginal and Torres Strait Islander people were considerably more likely to suffer a heart attack, to die from it without being admitted to hospital, and to die from it if admitted to hospital. In hospital they were less likely to receive key medical investigations or common procedures such as coronary bypass surgery or angioplasty. It was also found that Indigenous Australians admitted to hospital for coronary heart disease (CHD) were more complex cases, but this does not appear to account for differences in procedure rates. Specifically, compared with other Australians, Indigenous Australians had: • 3 times the rate of major coronary events such as heart attack • 1.4 times the out-of-hospital death rate from CHD. and when in hospital: • more than twice the in-hospital CHD death rate • a 40% lower rate of being investigated by angiography • a 40% lower rate of coronary angioplasty or stent procedures • a 20% lower rate of coronary bypass surgery. The study also outlines some limitations in its underlying data and some other possible reasons for the findings that could not be explored in this report.
The message Even allowing for the study’s limitations, the disparities it found still show a strong pattern that expands the picture of Indigenous disadvantage and poor health. They make a compelling case that ways must be found to eliminate the disparities.

xii
1
1 Introduction Aboriginal and Torres Strait Islander people are greatly disadvantaged compared with other Australians, as measured by a broad range of social indicators (ABS & AIHW 2005). Their health is generally poorer and despite some improvement in mortality over the past decade, the gap between Indigenous and non-Indigenous Australians remains large (ABS & AIHW 2005; Paradies & Cunningham 2002; Ring & Firman 1998). Indigenous Australians develop chronic diseases at a much younger age than non-Indigenous Australians and their average life expectancy is estimated to be 17 years lower than that for the total Australian population (ABS & AIHW 2005). Coronary heart disease (CHD) is the largest single cause of death in Australia, and is also the leading cause of death in Aboriginal and Torres Strait Islander people in Queensland (Qld), Western Australia (WA), South Australia (SA) and the Northern Territory (NT) (ABS 2003a). Indigenous Australians are much more likely to die from CHD than non-Indigenous Australians. In 1999–2003 Indigenous males and females aged 35–54 years died from CHD at 7 and 17 times the rates of non-Indigenous males and females respectively (ABS & AIHW 2005). Indigenous Australians are also more likely to be hospitalised for chronic conditions such as CHD, compared with other Australians. In 2003–04 the hospitalisation rates for CHD were 2 and 4 times as high for Indigenous males and females respectively than for non-Indigenous people (ABS & AIHW 2005). There is a higher prevalence of established CHD risk factors in Indigenous Australians. In 2001 Indigenous people reported higher prevalence of diabetes, smoking, high blood pressure and overweight (AIHW 2004). However, biomedical and behavioural risk factors alone do not account for the very high rates of CHD in the Indigenous population. The determinants of health are multifactorial—cultural, historic, environmental and socioeconomic factors all contribute to the increased risk among Indigenous Australians (Abbot & Close 2002). Various studies have concluded that psychosocial factors (such as depression, social isolation and lack of quality social support) are also substantial independent risk factors for CHD onset and progress (Bunker et al. 2003; Rosengren et al. 2004).
Purpose and structure of this report This report builds on existing information on disparities between Aboriginal and Torres Strait Islander people and other Australians in the health status and treatment of CHD. It is the first study of this scale to analyse data on Indigenous Australians in four key areas: • incidence of major coronary events • case fatality from major coronary events • use of coronary procedures in hospital • case complexity in hospital. This new information enables us to build a more complete picture of the CHD burden among Indigenous Australians, and also furthers our knowledge of disparities in treatment of CHD in relation to need. Information on the incidence of major coronary events and the resulting case fatality have been reported for the total Australian population (AIHW: Mathur 2002; AIHW: Jamrozik et al. 2001). This report presents, for the first time, similar information for Aboriginal

2
and Torres Strait Islander people. There has also been limited information published in the past on the use of procedures in hospital for CHD in Indigenous Australians compared with other Australians (for example, ABS & AIHW 2005; AIHW: Davies 2003; Cunningham 2002). This report extends this information to look at use of procedures relative to need as well as in relation to case complexity. Much of the analysis in this report is focused on different age groups, as it has been well documented that the health disadvantage among Indigenous Australians begins at an early age and continues throughout adult life. The report has six chapters. The second chapter provides an overview of the methods used and data quality issues (further details on methods are outlined in Appendix A). The results are presented in Chapters 3, 4 and 5: • Chapter 3 examines new information on the incidence of major coronary events (non-fatal
hospital admissions for acute myocardial infarction (AMI) and CHD deaths) among Indigenous Australians compared with other Australians. Case fatality—the proportion of major coronary events which are fatal—is examined in this chapter. Differences between out-of-hospital and in-hospital deaths are also examined.
• Chapter 4 examines the use of coronary procedures in hospital, including diagnostic and revascularisation procedures relative to need (defined in this report as hospitalisations for CHD).
• Chapter 5 covers the issue of case complexity, by examining the other health conditions (comorbidities) accompanying CHD in hospitalisations of Indigenous Australians compared with other Australians. The analysis also compares the comorbidity profiles of Indigenous and other Australians receiving procedures.
The main findings and implications are then discussed in Chapter 6. More detailed statistical tables are included in Appendix B.

3
2 Methods This chapter provides an overview of the data sources, data quality and analytical methods used in this report, and details the methods used to estimate the health measures described in this report.
Data sources The main data sources used in this report are the Australian Institute of Health and Welfare (AIHW) National Mortality Database and the AIHW National Hospital Morbidity Database.
Mortality data Information on deaths in this report was obtained from the AIHW National Mortality Database. This database is a record of all deaths in Australia, collected from registration of deaths with Registrars of Births, Deaths and Marriages in each state and territory. Information about the cause of death is recorded by medical practitioners and coroners, from which the underlying and associated causes of death are coded. Only those records where CHD was identified as the underlying cause of death (see Glossary) were included in the analysis (see Appendix A for definition of diseases according to ICD-10 codes). Mortality data in this report have been extracted for all deaths registered in 2002 and 2003, and have been analysed by year of registration of death. While the majority of deaths are registered in the year in which they occur, some of those registered in a given year occurred in previous years. Late death registrations are more common for Indigenous people than non-Indigenous people (for further details see ABS & AIHW 2005).
Hospital data Hospital data were obtained from the AIHW National Hospital Morbidity Database. The data collection is maintained by the AIHW using data supplied by state and territory health authorities. This database includes information on virtually all hospital admissions in Australia, in both public and private hospitals. The database contains demographic, diagnostic, procedural and duration of stay information on episodes of care for patients admitted to hospital. Only those records where CHD was identified as the principal diagnosis (see Glossary) were included in the analysis (See Appendix A for definition of diseases and procedures according to ICD-10-AM codes). Hospital records are based on hospitalisations (episodes of care) rather than individual patients, and as a result patients cannot be tracked between admissions. For example, a single individual who is admitted for CHD, received treatment during the initial admission and is re-admitted for scheduled follow-up treatment cannot be identified in each admission and hence two episodes will be counted. Data in the AIHW National Hospital Morbidity Database are collated on a financial year basis, however in this report hospital data have been presented by calendar year based on date of separation (see Glossary). Hospital data in this report were extracted for the years 2002 and 2003.

4
Data quality Various factors hinder efforts to accurately capture the use of health services among Indigenous Australians over time, or to compare regional variations for Indigenous Australians. These include incomplete and variable Indigenous identification in births, deaths and hospital records across jurisdictions and changes in the extent to which Indigenous people self-identify. The identification of Aboriginal and Torres Strait Islander people is not complete in hospital and mortality data collections (see Box 1). The under-identification of Indigenous Australians in all states and territories affects the counts and calculation of hospitalisation and mortality rates for Indigenous Australians and may underestimate the extent of disparity. Even when Indigenous data have been recorded it is not known how consistently the Indigenous status definition (see the Metadata Online Registry at <http://meteor.aihw.gov.au>) is applied in hospitals or on death registrations. This could result in further numerator/denominator mismatch.
Box 1: Terminology used in this report ‘Aboriginal and Torres Strait Islander people’, ‘Indigenous Australians’, and ‘Indigenous people‘ are used interchangeably when referring to people who have identified as Aboriginal and/or Torres Strait Islander.
‘Other Australians’ is used when referring to people that have not identified as Aboriginal and/or Torres Strait Islander. This group will include those people who have said they are non-Indigenous but may also include either:
(a) Aboriginal and/or Torres Strait Islander people who have chosen not to identify as such or
(b) individuals for whom the relevant information was not collected. At present, there is considerable variation across the states and territories in the completeness of mortality and hospital data for Aboriginal and Torres Strait Islander people. Mortality data for Queensland, Western Australia, South Australia and the Northern Territory are considered to have sufficient level of coverage to produce reliable statistics on Indigenous Australian deaths for the period 1998–2003. A recent AIHW report, examining the quality of Indigenous identification in the National Hospital Morbidity Database, has also recommended that data from only those same jurisdictions should be used for analytical purposes (for further details see AIHW 2005a). For these reasons the mortality and hospital data in this report include data from only Queensland, Western Australia, South Australia and the Northern Territory. Indigenous people in these jurisdictions represent 60% of the total Indigenous population. Even within these jurisdictions, data on Indigenous deaths and hospitalisations vary in their completeness. It should be noted that these data may not be representative of Australia, as the jurisdictions included may differ from those excluded (New South Wales, Victoria, Tasmania and the Australian Capital Territory). Records where Indigenous status is not stated/missing/unknown in mortality and hospital data were included in the other Australians category. This may also lead to underestimation of the extent of the disparity.

5
Health measures This report examines health measures in four key areas: incidence and case fatality of major coronary events, use of coronary procedures in hospital and case complexity in hospital. The methods used for estimating these health measures are detailed below.
Incidence of major coronary events Incidence is defined as the number of new cases of a condition or disease occurring in a population within a specified time period. Australia does not have a national coronary heart disease register or a national patient-based hospital data collection so it is not possible to directly measure the incidence of CHD. Instead, this report examines the incidence of major coronary events, namely those events that result in either admission to hospital for acute myocardial infarction (AMI) or in death from CHD (see Box 2). Similar definitions have been used in a number of other studies (Rapola et al. 1997; Knekt et al. 2001; Robins et al. 2001). This methodology has been used for the whole population in Australia (AIHW: Mathur 2002; AIHW 2004; NHPC 2004), but not previously for the Aboriginal and Torres Strait Islander population.
Case fatality of major coronary events Case fatality is an important outcome measure which quantifies the proportion of cases that are fatal within a specific time period (see Box 2). In this report it is the percentage of major coronary events that were fatal for the period 2002–2003 and includes deaths that occurred both in and out of hospital. Case fatality may be underestimated because an individual may have multiple non-fatal admissions for the same event, resulting in inflation in the denominator (the number of major coronary events).
Coronary procedures in hospital Data on coronary procedures have been obtained from the AIHW National Hospital Morbidity Database for hospitalisations with a principal diagnosis of CHD. The coronary procedures included in this report are: • coronary angiography—a diagnostic procedure which gives a picture of the heart’s arteries • percutaneous coronary intervention (PCI) and coronary artery bypass grafting (CABG)—
specific procedures to ‘revascularise’ the heart by removing or bypassing the blockages, to restore adequate blood flow (see Appendix A for more detailed definitions on coronary procedures).
All coronary angiography, PCI and CABG procedures listed on the hospital record for an episode of care are counted in the analysis.

6
Box 2: Health measures used in this report
Incidence of major coronary events is estimated as the sum of the number of non-fatal hospital admissions for acute myocardial infarction (AMI—see Glossary) and the number of deaths recorded as CHD deaths. Non-fatal hospital admissions for AMI are based on a principal diagnosis of AMI with a length of stay of 3 days or more. The use of a principal diagnosis of AMI, rather than any occurrence of AMI among the additional diagnoses listed for the hospital admission reduces multiple counting of the same coronary event. As only a small proportion of patients with AMI are discharged alive from hospital within 2 days, use of the 3 days or more criterion will reduce counting of mild episodes and transfers between hospitals. It should be noted that this definition of incidence excludes admissions for unstable angina or for coronary revascularisation procedures where the principal diagnosis is not AMI. Case fatality refers to the proportion of cases that result in death. Case fatality for major coronary events is calculated as the number of CHD deaths in the specified population divided by the sum of all CHD deaths and non-fatal hospital admissions for AMI (with length of stay of 3 days or more) for the period 2002–2003. In-hospital fatality rate refers to the proportion of hospitalised cases that die in hospital. In-hospital fatality for CHD used in this report is defined as the number of CHD deaths in hospital in those hospitalisations where CHD is the principal diagnosis divided by the number of hospitalisations with CHD as the principal diagnosis. In-hospital fatality for AMI is also presented and is defined as the number of AMI deaths in hospital in those hospitalisations where AMI is the principal diagnosis divided by the number of hospitalisations with AMI as the principal diagnosis. Out-of-hospital fatality rate refers to the proportion of cases that result in death without admission to hospital or after discharge from hospital. Out-of-hospital fatality used in this report is estimated as the total number of deaths from CHD less the number of CHD deaths in hospital in those hospitalisations where CHD is the principal diagnosis divided by the sum of all CHD deaths and non-fatal hospital admissions for AMI (with length of stay of 3 days or more). It should be noted that deaths occurring in the emergency departments of hospitals are included in this group, as these deaths occur before the formal admission to hospital takes place.
Case complexity The AIHW National Hospital Morbidity Database has been used to examine the issue of case complexity. This database provides data about a patient’s admission to hospital including the principal diagnosis and additional diagnoses. Comorbidities are important factors in case complexity and diagnosis information can be used to measure them. In this report the term comorbidity is used to describe a select list of conditions recorded as additional diagnoses for those with a principal diagnosis of CHD. Plainly, the severity of the coronary event itself is a major factor in case complexity and risk factor levels contribute as well. However, measures of CHD severity cannot be identified using ICD codes, nor is information collected on the presence of individual risk factors in the National Hospital Morbidity Database. The conditions included as comorbidities in this report are: diabetes, hypertensive diseases, high cholesterol, heart failure, chronic kidney failure, chronic obstructive pulmonary disease, chronic rheumatic heart disease or other valve disorders, and cerebrovascular diseases (see Appendix A for definition of diseases according to ICD-10-AM codes). These conditions are comorbidities that are likely to be present on admission. Other diagnoses that may have been complications of treatment during the episode of care are not included.

7
Analytical methods Several analytical concepts have been used to compare the key health measures between Indigenous and other Australians and these are described in this section.
Inequality measures
A number of commonly used measures of health inequality are presented in this report (see Mackenbach & Kunst 1997; AIHW: Draper et al. 2004; NZ MOH 2005):
• Rate difference is an absolute measure of inequality and is calculated as the rate for Indigenous Australians minus the rate for other Australians.
• Rate ratio is a relative measure of inequality and is calculated as the rate for Indigenous Australians divided by the rate for other Australians. For the age-standardised case, it is the ratio of the observed to the expected number of cases had the rates for other Australians applied.
• Excess number of cases is an absolute measure of the impact of inequality calculated as the difference between the observed and expected number of cases. It represents the number of cases that would have been avoided if the rate for the Indigenous population was the same as the rate for other Australians.
• Excess % is a relative measure of the impact of inequality. It is calculated as the excess number of cases as a percentage of all Indigenous cases and is interpreted as the percentage of Indigenous cases that would have been avoided if the rate for the Indigenous population was the same as the rate for other Australians.
Both absolute and relative measures of inequality are important and reflect different aspects of inequality (Mackenback & Kunst 1997; Vagero & Erikson 1997). Absolute measures indicate the magnitude of the inequality, while relative measures indicate the size of the gap in relative terms.
Age standardisation Age standardisation allows comparisons between populations with different age structures to be made more validly. The risk of dying and being hospitalised for CHD varies greatly with age, so even small differences in the age structure of populations may affect crude death rates (defined as total deaths divided by total population). Age standardisation is a method of controlling for the effect of the differences between the age structure of the Indigenous population and that of other Australians, enabling the two populations to be compared on an equal age basis. In this report the method known as indirect age standardisation has been used. This summary measure is a comparison of the number of observed cases compared with the number expected if the age-specific rates of the population of other Australians are applied to the Indigenous population. The rates for other Australians have been used as the standard rates in these analyses (see Appendix A for further details).

8
The incidence data presented in Chapter 3 illustrate the importance of adjusting for age to obtain valid comparisons. The crude incidence rates for all ages show that the incidence of major coronary events is slightly lower in Indigenous Australians than other Australians, while the age-standardised rates indicate that Indigenous Australians are much more likely to have a major coronary event than other Australians. This is because of the different age structures between Indigenous and non-Indigenous Australians, with Indigenous people having a comparatively younger age structure. The high proportion of non-Indigenous people in the older age groups dominates the overall crude incidence rate. For these reasons the report focuses on age-standardised rate ratios, rather than crude rate ratios, to assess the disparities in the reported health measures.
Age-specific rates Age-specific rates have been presented throughout the report because summary measures like age-standardised rate ratios can sometimes mask important patterns. See Appendix A for calculation of age-specific rates.
Statistical significance of comparisons Confidence intervals have been used to determine whether calculated rates for Indigenous and other Australians are meaningfully different from one another, taking into account chance variation. To do this, the ratio of the two rates is calculated and a 95% confidence interval is estimated for this ratio—namely the range (interval) of ratios within which we can be 95% confident that the true ratio lies. Where the confidence interval contains the value 1, then the ratio is not statistically significantly different from 1 and so the two rates are not statistically significantly different from one another. Where the lower bound of the confidence interval is greater than 1 or the upper bound of the confidence interval is less than 1, the ratio is statistically significantly different from 1 and so the rates are deemed to be statistically significantly different from one another. In this case the ratio is said to be statistically significant at the 95% level. The confidence intervals for the rate ratios have been calculated on the basis of the number of observed deaths or hospitalisations using the square root transform described in Breslow and Day (1987). Data for the 2 years 2002 and 2003 have been aggregated throughout these analyses: the larger numbers increase our ability to calculate a more statistically stable rate. The notation used for the pooled data for these two calendar years is 2002–2003.

9
3 Incidence of major coronary events and case fatality
It is well-established that death rates from CHD are significantly higher in Aboriginal and Torres Strait Islander people compared with other Australians. However it is not known how much of this disparity is due to differences in the incidence of major coronary events, and how much to differences in case fatality from these events. This chapter presents comparisons for both of these measures to help us better understand the drivers of mortality disparities. As for all analyses in this report, results here relate only to data from Queensland, Western Australia, South Australia and the Northern Territory. This is because incidence and case fatality measures depend on mortality and hospital data which can only be analysed for Aboriginal and Torres Strait Islander people for these four jurisdictions due to data quality issues (see Chapter 2).
Incidence of major coronary events Aboriginal and Torres Strait Islander people were far more likely to have a major coronary event than other Australians, across all age groups under 75 years in 2002–2003. This is clearly demonstrated in Figure 3.1, where the age-specific rate for Indigenous Australians is markedly higher for all age groups from 25–34 to 65–74. For the 75 years or over age group, the rate of major coronary events was lower in Aboriginal and Torres Strait Islander people than in other Australians.
0
500
1,000
1,500
2,000
2,500
3,000
25–34 35–44 45–54 55–64 65–74 75+
Age groups (years)
Indigenous Australians
Other Australians
Rate per 100,000
Sources: AIHW National Hospital Morbidity Database; AIHW National Mortality Database.
Figure 3.1: Incidence of major coronary events in Qld, WA, SA and NT, 2002–2003
10
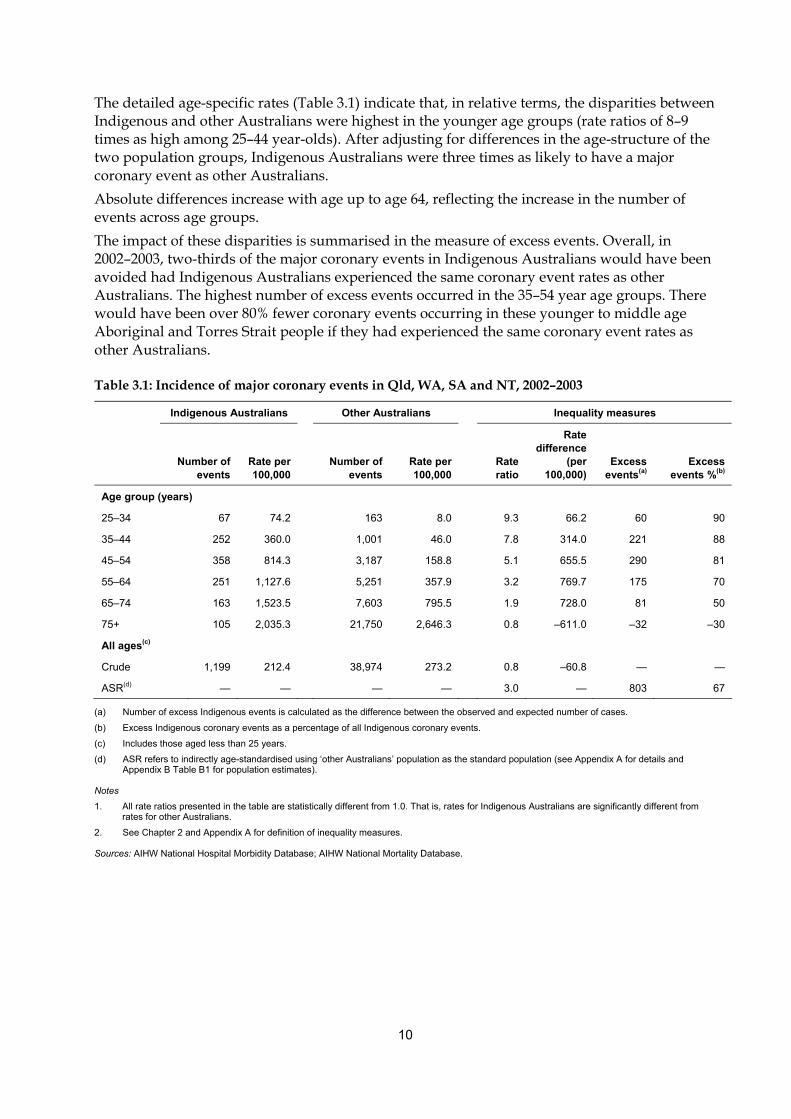
The detailed age-specific rates (Table 3.1) indicate that, in relative terms, the disparities between Indigenous and other Australians were highest in the younger age groups (rate ratios of 8–9 times as high among 25–44 year-olds). After adjusting for differences in the age-structure of the two population groups, Indigenous Australians were three times as likely to have a major coronary event as other Australians. Absolute differences increase with age up to age 64, reflecting the increase in the number of events across age groups. The impact of these disparities is summarised in the measure of excess events. Overall, in 2002–2003, two-thirds of the major coronary events in Indigenous Australians would have been avoided had Indigenous Australians experienced the same coronary event rates as other Australians. The highest number of excess events occurred in the 35–54 year age groups. There would have been over 80% fewer coronary events occurring in these younger to middle age Aboriginal and Torres Strait people if they had experienced the same coronary event rates as other Australians.
Table 3.1: Incidence of major coronary events in Qld, WA, SA and NT, 2002–2003
Indigenous Australians Other Australians Inequality measures
Number of
events Rate per 100,000
Number of events
Rate per 100,000
Rate ratio
Rate difference
(per 100,000)
Excess events(a)
Excess events %(b)
Age group (years)
25–34 67 74.2 163 8.0 9.3 66.2 60 90
35–44 252 360.0 1,001 46.0 7.8 314.0 221 88
45–54 358 814.3 3,187 158.8 5.1 655.5 290 81
55–64 251 1,127.6 5,251 357.9 3.2 769.7 175 70
65–74 163 1,523.5 7,603 795.5 1.9 728.0 81 50
75+ 105 2,035.3 21,750 2,646.3 0.8 –611.0 –32 –30
All ages(c)
Crude 1,199 212.4 38,974 273.2
0.8 –60.8 — —
ASR(d) — — — — 3.0 — 803 67
(a) Number of excess Indigenous events is calculated as the difference between the observed and expected number of cases.
(b) Excess Indigenous coronary events as a percentage of all Indigenous coronary events.
(c) Includes those aged less than 25 years.
(d) ASR refers to indirectly age-standardised using ‘other Australians’ population as the standard population (see Appendix A for details and Appendix B Table B1 for population estimates).
Notes
1. All rate ratios presented in the table are statistically different from 1.0. That is, rates for Indigenous Australians are significantly different from rates for other Australians.
2. See Chapter 2 and Appendix A for definition of inequality measures.
Sources: AIHW National Hospital Morbidity Database; AIHW National Mortality Database.

11
Case fatality An important measure of acute coronary outcomes is case fatality rate. This measure indicates the percentage of major coronary events that are fatal over a specified period. This figure can be calculated at an aggregate level, as well as for out-of-hospital fatality and for in-hospital fatality. Note that deaths occurring in the emergency departments of hospitals are included in the out-of-hospital group, as these deaths occur before formal admission to hospital takes place. Overall case fatality rates were markedly higher for Indigenous Australians than other Australians across all age groups in 2002–2003 (Figure 3.2). This indicates that if an individual had a major coronary event, they were more likely to die if they were an Indigenous Australian.
0
10
20
30
40
50
60
70
80
25–34 35–44 45–54 55–64 65–74 75+
Age group (years)
Per cent
Indigenous Australians
Other Australians
Sources: AIHW National Hospital Morbidity Database; AIHW National Mortality Database.
Figure 3.2: Case fatality rates for major coronary events in Qld, WA, SA and NT, 2002–2003
The extent of these differences in case fatality rates between Aboriginal and Torres Strait Islander people and other Australians is detailed in Table 3.2. Both the relative and absolute differences were highest among 35–44 year-olds (rate ratio of 1.8 and rate difference of 14 percentage points). After taking into account differences in the age structure of the population groups, Indigenous Australians were found to be 1.5 times as likely to die in 2002–2003 after a major coronary event as other Australians. In terms of the impact of these disparities, overall CHD deaths in Indigenous Australians would have been one-third lower had they experienced the same case fatality rates as other Australians. The largest number of excess deaths occurred in the 35–54 year age group. In this age group around 40% of CHD deaths among Indigenous Australians would have been avoided if they had the same case fatality rates for major coronary events as other Australians.

12
Table 3.2: Case fatality for major coronary events in Qld, WA, SA and NT, 2002–2003
Indigenous Australians Other Australians Inequality measures
Number
of deaths Per cent of cases
Number of deaths
Per cent of cases
Rate ratio
Rate difference
Excess deaths(a)
Excess deaths %(b)
Age group (years)
25–34 25 37.3 39 23.9 1.6* 13.4 9 35
35–44 83 32.9 185 18.5 1.8 14.5 36 44
45–54 104 29.1 602 18.9 1.5 10.2 38 36
55–64 96 38.2 1,339 25.5 1.5 12.7 33 35
65–74 81 49.7 2,813 37.0 1.3 12.7 21 27
75+ 71 67.6 13,566 62.4 1.1* 5.2 5 8
All ages(c)
Crude 460 38.4 18,548 47.6
0.8 –9.2 — —
ASR(d) — — — — 1.5 — 145 32
* Rate ratios not statistically different from 1.0. That is, rates for Indigenous Australians are not significantly different from rates for other Australians.
(a) Number of excess Indigenous CHD deaths is calculated as the difference between the observed and expected number of cases.
(b) Excess Indigenous CHD deaths as a percentage of all Indigenous CHD deaths.
(c) Includes those aged less than 25 years.
(d) ASR refers to indirectly age-standardised using ‘other Australians’ population as the standard population (see Appendix A for details).
Note: See Chapter 2 and Appendix A for definition of inequality measures.
Sources: AIHW National Hospital Morbidity Database; AIHW National Mortality Database.
Place of death Using information on deaths in hospital, it is possible to break down the place of death to either being out of hospital or in hospital. • Out-of-hospital fatality rate refers to the proportion of cases that result in death where there
has been no admission to hospital or after discharge from hospital. In this report, out-of-hospital fatality is estimated as the total number of deaths from CHD less the number of CHD deaths in hospital in those hospitalisations where CHD is the principal diagnosis divided by the number of major coronary events.
• In-hospital fatality rate refers to the proportion of cases after admission to hospital that result in death in hospital. In this report, in-hospital fatality for CHD is defined as the number of CHD deaths in hospital in those hospitalisations where CHD is the principal diagnosis divided by the number of hospitalisations with CHD as the principal diagnosis.
The corresponding fatality rates are presented below.

13
Out-of-hospital fatality rates After suffering a major coronary event, Indigenous Australians were more likely to die out of hospital compared with other Australians across almost all age groups in 2002–2003. The age-adjusted out-of-hospital fatality rate for major coronary events was 1.4 times as high for Aboriginal and Torres Strait Islander people compared with other Australians (Table 3.3). There would have been over a quarter fewer out of hospital deaths from CHD had Indigenous Australians had the same out-of-hospital fatality rates for CHD as other Australians. Further analysis shows that the rate ratios and rate differences were highest in the younger age groups, 25–34 and 35–44 years (rate ratio of 1.6 and 1.7 and rate difference of 13 and 11 percentage points, respectively). In terms of the impact of these differences the largest number of excess deaths was in the 45–54 year age group. In age groups under 65 years, deaths from CHD among Indigenous Australians would have been 29–41% lower if they had the same out-of-hospital fatality rates for major coronary events as other Australians.
Table 3.3: Out-of-hospital fatality rates(a) for major coronary events in Qld, WA, SA, and NT, 2002–2003
Indigenous Australians Other Australians Inequality measures
Number of
deaths
Per cent of cases
Number of
deaths
Per cent of cases
Rate ratio
Rate difference
Excess deaths(b)
Excess events %(c)
Age group (years)
25–34 24 35.8 37 22.7 1.6 13.1 9 36
35–44 71 28.2 169 16.9 1.7 11.3 29 41
45–54 92 25.7 535 16.8 1.5 8.9 34 37
55–64 76 30.3 1,159 22.1 1.4 8.2 22 29
65–74 58 35.6 2,314 30.4 1.2* 5.1 9 16
75+ 54 51.4 11,458 52.7 1.0* –1.3 –1 –3
All ages(d)
Crude 375 31.3 15,676 40.2 0.8 –8.9 — —
ASR(e) — — — — 1.4 — 102 27
* Rate ratios not statistically different from 1.0. That is, rates for Indigenous Australians are not significantly different from rates for other Australians.
(a) Out-of-hospital fatality rates are estimated as the total number of deaths from CHD less the number of CHD deaths in hospital in those hospitalisations where CHD is the principal diagnosis divided by the sum of all CHD deaths and non-fatal hospital admissions for AMI (with length of stay of 3 days or more).
(b) Excess Indigenous CHD deaths is calculated as the difference between the observed and expected number of cases.
(c) Excess Indigenous CHD deaths as a percentage of all Indigenous CHD deaths occurring out-of-hospital.
(d) Includes those aged less than 25 years.
(e) ASR refers to indirectly age-standardised using ‘other Australians’ population as the standard population (see Appendix A for details).
Note: See Chapter 2 and Appendix A for definition of inequality measures.
Sources: AIHW National Hospital Morbidity Database; AIHW National Mortality Database.

14
In-hospital fatality rates The relative disparity in fatality rates was even greater for persons admitted to hospital, with age-adjusted in-hospital fatality rates for CHD 2.3 times as high among Indigenous Australians compared with other Australians (Table 3.4). There would have been almost 60% fewer in-hospital deaths for CHD among Indigenous Australians had they experienced the same in-hospital fatality rates as other Australians. Similar results were observed for persons hospitalised for AMI. While the relative inequality was higher for in-hospital fatality than for out-of-hospital fatality, the largest number of excess deaths occurred out-of-hospital.
Table 3.4: In-hospital fatality rates(a) for major coronary events (all ages) in Qld, WA, SA, and NT, 2002–2003
Indigenous Australians
Other Australians
Age-standardised inequality measures(b)
Number of deaths
Per cent of cases
Number of deaths
Per cent of cases
Rate ratio
Excess deaths(c)
Excess deaths %(d)
CHD admissions 85 2.1 2,872 2.5 2.3 49 57
AMI admissions 70 6.0 2,336 7.9 2.2 39 55
(a) In-hospital fatality rates for CHD are defined as the number of CHD deaths in hospital in those hospitalisations where CHD is the principal diagnosis divided by the number of hospitalisations with CHD as the principal diagnosis. In-hospital fatality rates for AMI is the number of AMI deaths in hospital in those hospitalisations where AMI is the principal diagnosis divided by the number of hospitalisations with AMI as the principal diagnosis.
(b) Indirectly age-standardised using ‘other Australians’ population as the standard population (see Appendix A for details).
(c) Excess Indigenous deaths occurring in-hospital is calculated as the difference between the observed and expected number of cases.
(d) Excess Indigenous deaths as a percentage of Indigenous deaths occurring in-hospital.
Notes
1. All rate ratios presented in the table are statistically different from 1.0. That is, rates for Indigenous Australians are significantly different from rates for other Australians.
2. See Chapter 2 and Appendix A for a definition of inequality measures.
3. In-hospital fatality rates have not been presented by age due to the small number of deaths in each of the age groups.
Sources: AIHW National Mortality Database; AIHW National Hospital Morbidity Database.

15
4 Coronary procedures in hospital
The aspect of treatment for CHD analysed in this report is limited to the use of diagnostic procedures (specifically coronary angiograms) and revascularisation procedures (percutaneous coronary intervention (PCI) and coronary artery bypass grafts (CABG)) performed in hospital. For CHD, these diagnostic and therapeutic procedures are very important parts of treatment. Cunningham (2002) concluded from a study of hospitalised patients that patients identified as Indigenous Australian were less likely to have a procedure recorded than other Australians for all diagnoses in Australian public hospitals in 1997–98. Another report concluded that Indigenous Australian males had lower revascularisation rates than other Australian males and Indigenous females had slightly higher revascularisation rates than other Australian females in 1998–01 (AIHW: Davies 2003). None of these reports have taken into account the need for procedures due to differing levels of disease in Indigenous and non-Indigenous populations. This chapter builds on this earlier work and compares Indigenous Australians and other Australians in terms of procedures in hospital per hospitalisation with CHD. The number of CHD hospitalisations is used as a proxy for the number of people in ‘need’ of the procedure. That is, the number of people who have CHD severe enough to warrant hospitalisation is likely to provide an indication of the size of the group in need of a coronary procedure. Thus, the measure used here is the number of hospitalisations with a coronary procedure divided by the number of hospitalisations with CHD as the principal diagnosis (then expressed as a percentage). For the estimated number of CHD hospitalisations used in this report see Appendix B Table B2. As for all analyses in this report, results here relate only to data from Queensland, Western Australia, South Australia and the Northern Territory (see Chapter 2).

16
Use of procedures Unlike previous studies, this study accounts for the differing levels of disease which affects the need for procedures. When rates were examined with adjustment for need by analysing procedure use relative to the number of people with CHD, it is clear that Indigenous Australians underwent these procedures at lower rates than other Australians. In 2002–2003 the use of coronary angiography and revascularisation procedures for people hospitalised for CHD was substantially lower for Aboriginal and Torres Strait Islander people than for other Australians across all age groups (Figure 4.1).
Source: AIHW National Hospital Morbidity Database.
Figure 4.1: Proportion of CHD hospitalisations with a coronary procedure (during one episode of care) in Qld, WA, SA and NT, 2002–2003
The detailed age-specific rates (Table 4.1) indicate that, in both relative and absolute terms, the largest differences for both angiography and revascularisation occurred in the 55–64 and 65–74 year age groups. The rates for other Australians were around double that of Indigenous Australians and the rate difference was over 20 percentage points for angiography and over 10 percentage points for revascularisation. After taking the different population age structures into account, the angiography and revascularisation rate for Aboriginal and Torres Strait Islanders was 40% lower than the rate for other Australians (rate ratio of 0.6 for both).
Coronary revascularisation
0
5
10
15
20
25
30
35
40
45
50
25–34 35–44 45–54 55–64 65–74 75+
Age groups (years)
Indigenous Australians
Other Australians
Per centCoronary angiography
0
5
10
15
20
25
30
35
40
45
50
25–34 35–44 45–54 55–64 65–74 75+
Age group (years)
Per cent

17
Table 4.1: Use of coronary procedures for those hospitalised with CHD in Qld, WA, SA and NT, 2002–2003
Indigenous Australians Other Australians Inequality measures
Number Per cent(a) Number Per cent(a)
Rate ratio Rate
difference
Coronary angiography
25–34 53 23.8 222 39.2 0.6 –15.4
35–44 241 27.7 1,664 39.5 0.7 –11.8
45–54 344 26.1 6,746 44.8 0.6 –18.6
55–64 247 24.4 11,905 45.9 0.5 –21.6
65–74 100 20.7 13,081 42.5 0.5 –21.7
75+ 28 13.4 9,471 25.9 0.5 –12.5
All ages(b)
Crude 1,016 24.6 43,106 38.1
0.6 –13.5
ASR(c) — — — — 0.6 —
Revascularisation (PCI and CABG)
25–34 33 14.8 91 16.0 0.9* –1.3
35–44 135 15.5 954 22.7 0.7 –7.1
45–54 211 16.0 4,036 26.8 0.6 –10.8
55–64 160 15.8 7,153 27.6 0.6 –11.8
65–74 58 12.0 7,688 25.0 0.5 –12.9
75+ 12 5.7 5,379 14.7 0.4 –9.0
All ages(b)
Crude 609 14.8 25,306 22.4
0.7 –7.6
ASR(c) — — — — 0.6 —
* Rate ratios not statistically different from 1.0. That is, rates for Indigenous Australians are not significantly different from rates for other Australians.
(a) Per cent refers to the proportion of hospitalisations with CHD as the principal diagnosis receiving either coronary angiography or coronary revascularisation.
(b) Includes those aged less than 25 years.
(c) ASR refers to indirectly age-standardised using ‘other Australians’ population as the standard population (see Appendix A for details).
Note: See Chapter 2 and Appendix A for definition of inequality measures.
Source: AIHW National Hospital Morbidity Database.
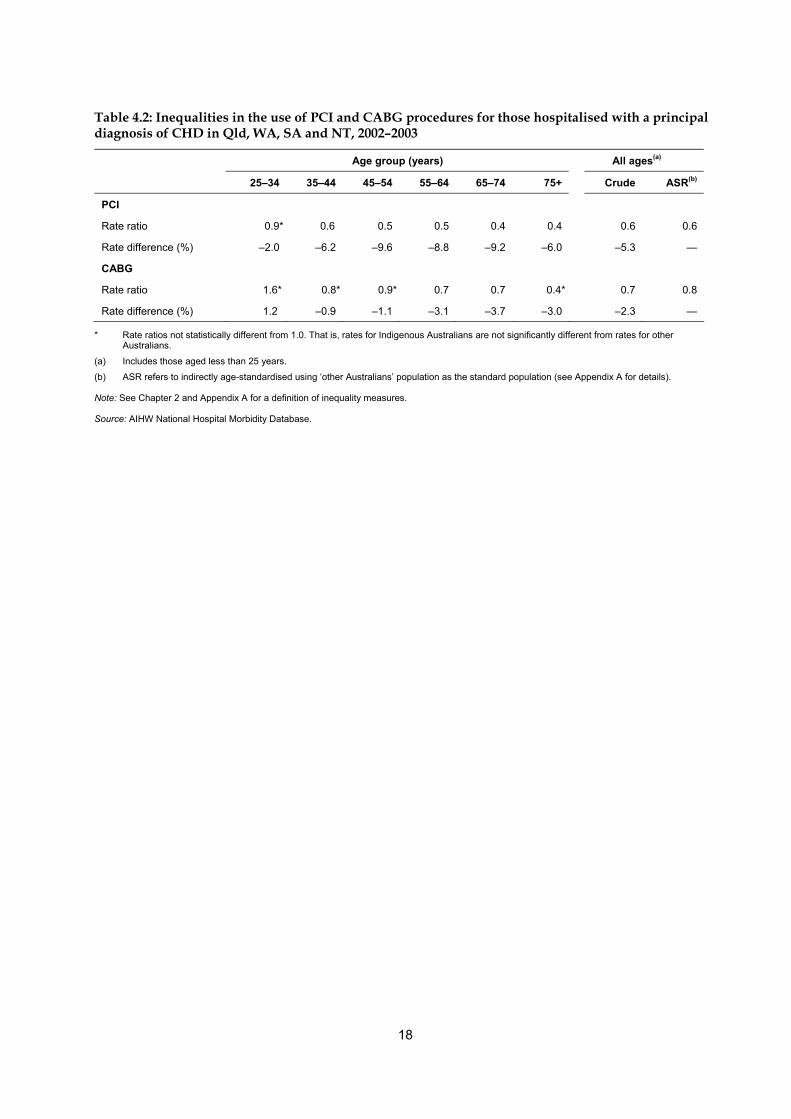
Similar results were observed when PCI and CABG were analysed separately, with Indigenous Australians generally less likely to receive these procedures than other Australians across all age groups for those hospitalised for CHD (Table 4.2). The age-adjusted procedure rate for PCI is around 40% lower than other Australians, while the age-adjusted rate for CABG is 20% lower (age-standardised rate ratio of 0.6 and 0.8 respectively).
18
Table 4.2: Inequalities in the use of PCI and CABG procedures for those hospitalised with a principal diagnosis of CHD in Qld, WA, SA and NT, 2002–2003
Age group (years) All ages(a)
25–34 35–44 45–54 55–64 65–74 75+ Crude ASR(b)
PCI
Rate ratio 0.9* 0.6 0.5 0.5 0.4 0.4 0.6 0.6
Rate difference (%) –2.0 –6.2 –9.6 –8.8 –9.2 –6.0 –5.3 —
CABG
Rate ratio 1.6* 0.8* 0.9* 0.7 0.7 0.4* 0.7 0.8
Rate difference (%) 1.2 –0.9 –1.1 –3.1 –3.7 –3.0 –2.3 —
* Rate ratios not statistically different from 1.0. That is, rates for Indigenous Australians are not significantly different from rates for other Australians.
(a) Includes those aged less than 25 years.
(b) ASR refers to indirectly age-standardised using ‘other Australians’ population as the standard population (see Appendix A for details).
Note: See Chapter 2 and Appendix A for a definition of inequality measures.
Source: AIHW National Hospital Morbidity Database.

19
5 Case complexity Results in the previous chapter showed that use of CHD procedures in hospital was lower among Aboriginal and Torres Strait Islander people than for other Australians. There could be various explanations for this including differing suitability for the procedures, different treatment options being made available to patients by doctors, and different choices being made by patients. Suitability for procedures is affected by case complexity—more complex cases, particularly in terms of other conditions the patient may have, may be less likely to be suitable for a procedure than less complex cases. There has been little analysis in the past on the complexity of CHD hospitalisations for Aboriginal and Torres Strait Islander people compared with other Australians. This chapter firstly compares complexity in terms of the presence of selected additional diagnoses for Indigenous Australians and other Australians hospitalised for CHD. It then examines procedure use for Indigenous Australians compared with other Australians for different levels of complexity to see if complexity helps explain their different rates of use. To compare the number of comorbidities in each population group, a select list of conditions recorded as additional diagnoses in the hospital database were used. The comorbidities included are diabetes, hypertensive diseases, high cholesterol, heart failure, chronic kidney failure, chronic obstructive pulmonary disease (COPD), chronic rheumatic heart disease or other valve disorders, and cerebrovascular diseases (see Glossary and Appendix A for definition of diseases according to ICD-10-AM codes). This list is based on similar approaches taken in other studies (Khaykin et al. 2002; Villareal et al. 2002; Rosenthal et al. 2003). Following these approaches, this chapter focuses on conditions that are comorbidities (and likely to be present on admission) rather than conditions that may be complications of the current CHD event. As for all analyses in this report, results relate only to data from Queensland, Western Australia, South Australia and the Northern Territory. This is because morbidity data can only be analysed for Aboriginal and Torres Strait Islander people for these four jurisdictions due to data quality issues (see Chapter 2). The denominator used in the analysis in this chapter is CHD hospitalisations (see Appendix B Table B2 for CHD hospitalisation estimates).

20
Comorbidities Aboriginal and Torres Strait Islander people admitted to hospital with a principal diagnosis of CHD in 2002–2003 were more likely than other Australians to have at least one of the comorbidities examined. In around two-thirds of hospitalisations for Aboriginal and Torres Strait Islander people at least one of the eight comorbidities investigated was recorded (Table 5.1). The corresponding proportion for other Australians was 59%.
Table 5.1: Comorbidities in CHD hospitalisations in Qld, WA, SA and NT, 2002–2003
Indigenous Australians Other Australians Inequality measures
Crude ASR(a)
Number Per cent Number Per cent Rate ratio Rate
difference
Rate ratio
Number of comorbidities
No comorbidities 1,374 33.3 46,624 41.2 0.8 –7.9 0.7
One or two 2,087 50.6 56,094 49.6 1.0 1.0 1.1
Three or more 665 16.1 10,391 9.2 1.8 6.9 2.5
Individual comorbidities
Diabetes 1,845 44.7 22,240 19.7 2.3 25.1 2.5
Hypertensive diseases 1,613 39.1 41,490 36.7 1.1 2.4 1.2
High cholesterol 780 18.9 20,860 18.4 1.0 0.5 0.9
Heart failure 369 8.9 9,937 8.8 1.0 0.2 2.3
Chronic kidney failure 336 8.1 4,590 4.1 2.0 4.1 4.1
COPD(b) 134 3.2 4,566 4.0 0.8 –0.8 1.8
Chronic RHD or other valve disorders(c) 165 4.0 5,794 5.1 0.8 –1.1 1.4
Cerebrovascular disease 31 0.8 2,094 1.9 0.4 –1.1 0.8*
* Age-standardised rate ratio not statistically different from 1.0. That is, rates for Indigenous Australians are not significantly different from rates for other Australians.
(a) ASR refers to indirectly age-standardised using ‘other Australians’ population as the standard population (see Appendix A for details).
(b) COPD = Chronic obstructive pulmonary disease.
(c) RHD = Rheumatic heart disease.
Note: See Chapter 2 and Appendix A for definition of inequality measures and comorbidities.
Source: AIHW National Hospital Morbidity Database.
Aboriginal and Torres Strait Islander people admitted to hospital with CHD are also more likely to have multiple comorbidities (Figure 5.1). In 2002–2003, 16% of hospitalisations for Indigenous Australians with a principal diagnosis of CHD had three or more comorbidities. This compares with 9% of other Australians having three or more of these comorbidities. After adjusting for age, Indigenous Australians were 1.1 times as likely to have one or two of these comorbidities, and 2.5 times as likely to have three or more of them.

21
Note: Comorbidities studied include diabetes, hypertensive diseases, high cholesterol, heart failure, chronic kidney failure, chronic obstructive pulmonary disease, chronic rheumatic heart disease or other valve disorders, and cerebrovascular disease.
Source: AIHW National Hospital Morbidity Database.
Figure 5.1: Number of selected comorbidities for CHD hospitalisations in Qld, WA, SA and NT, 2002–2003
For the individual comorbidities examined in the four jurisdictions, diabetes was the most commonly recorded—45% of hospitalisations in Indigenous Australians with CHD had this condition recorded, an age-adjusted rate 2.5 times as high as for other Australians (Table 5.1). Heart failure, chronic kidney failure and COPD, while relatively small in number, were also more prevalent as comorbidities among Indigenous Australians than other Australians (1.8–4.1 times as high in Indigenous Australians). The results in this section indicate that Indigenous Australians hospitalised with CHD tended to have more comorbidities than other Australians. This suggests that, on average, Indigenous Australians hospitalised for CHD are more complex cases compared with other Australians hospitalised for CHD. The main conditions that appear to be driving this difference are diabetes, heart failure, chronic kidney failure and COPD.
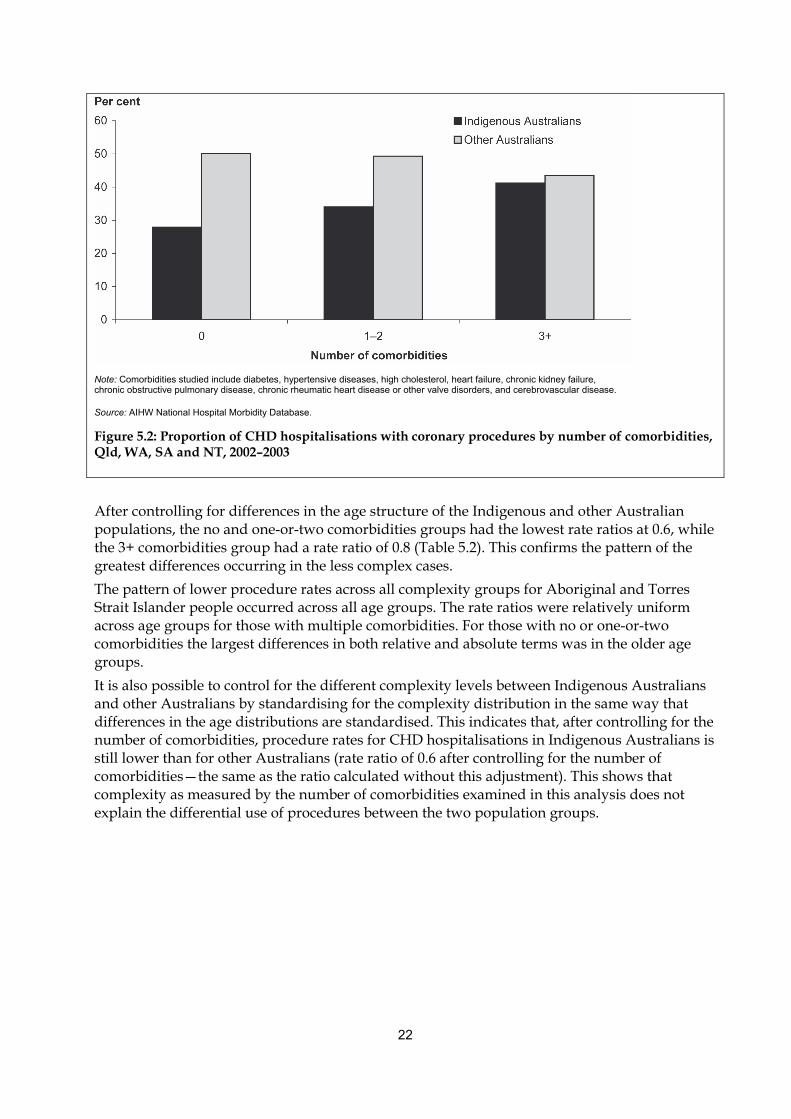
Procedure use according to complexity An examination of the subset of CHD hospitalisations that include a coronary procedure provides extra information on whether those patients undergoing a procedure are of similar complexity. In order to assess the use of procedures by different levels of complexity, this study compared the proportion of CHD hospitalisations with a coronary procedure grouped by the number of comorbidities. The results clearly show that Aboriginal and Torres Strait Islander people are less likely to undergo a procedure across all complexity groups (Figure 5.2). The largest difference is for the group of hospitalisations with no comorbidities, where Indigenous Australians were just over half as likely to have a procedure recorded in 2002–2003. For the most complex group examined (3 or more comorbidities) the difference was much smaller with a rate ratio of 0.9.
22
Note: Comorbidities studied include diabetes, hypertensive diseases, high cholesterol, heart failure, chronic kidney failure, chronic obstructive pulmonary disease, chronic rheumatic heart disease or other valve disorders, and cerebrovascular disease.
Source: AIHW National Hospital Morbidity Database.
Figure 5.2: Proportion of CHD hospitalisations with coronary procedures by number of comorbidities, Qld, WA, SA and NT, 2002–2003
After controlling for differences in the age structure of the Indigenous and other Australian populations, the no and one-or-two comorbidities groups had the lowest rate ratios at 0.6, while the 3+ comorbidities group had a rate ratio of 0.8 (Table 5.2). This confirms the pattern of the greatest differences occurring in the less complex cases. The pattern of lower procedure rates across all complexity groups for Aboriginal and Torres Strait Islander people occurred across all age groups. The rate ratios were relatively uniform across age groups for those with multiple comorbidities. For those with no or one-or-two comorbidities the largest differences in both relative and absolute terms was in the older age groups. It is also possible to control for the different complexity levels between Indigenous Australians and other Australians by standardising for the complexity distribution in the same way that differences in the age distributions are standardised. This indicates that, after controlling for the number of comorbidities, procedure rates for CHD hospitalisations in Indigenous Australians is still lower than for other Australians (rate ratio of 0.6 after controlling for the number of comorbidities—the same as the ratio calculated without this adjustment). This shows that complexity as measured by the number of comorbidities examined in this analysis does not explain the differential use of procedures between the two population groups.

23
Table 5.2: CHD hospitalisations with coronary procedures by number of comorbidities in Qld, WA, SA and NT, 2002–2003
Indigenous Australians Other Australians Inequality measures
Crude ASR(b)
Number Per cent(a) Number Per cent(a) Rate ratio Per cent
difference
Rate ratio
No comorbidities
25–34 27 24.3 135 37.3 0.7 –13.0 —
35–44 112 30.1 1,028 43.5 0.7 –13.4 —
45–54 121 30.0 4,090 54.7 0.5 –24.7 —
55–64 79 27.4 6,645 58.7 0.5 –31.3 —
65–74 33 27.0 6,765 56.5 0.5 –29.4 —
75+ 10 14.7 4,677 35.7 0.4 –21.0 —
All ages(c) 384 27.9 23,357 50.1 0.6 –22.1 0.6
One or two comorbidities
25–34 37 37.8 97 53.6 0.7 –15.8 —
35–44 152 36.7 953 55.7 0.7 –19.0 —
45–54 256 37.1 4,054 59.3 0.6 –22.2 —
55–64 181 33.7 7,812 61.7 0.5 –27.9 —
65–74 71 28.0 8,749 56.1 0.5 –28.2 —
75+ 11 12.1 6,008 31.5 0.4 –19.4 —
All ages(c) 709 34.0 27,675 49.3 0.7 –15.4 0.6
Three or more comorbidities
25–34 8 57.1 18 75.0 0.8 –17.9 —
35–44 40 47.6 75 54.0 0.9 –6.3 —
45–54 100 45.0 448 60.2 0.7 –15.2 —
55–64 80 42.3 1,130 58.4 0.7 –16.1 —
65–74 34 32.1 1,660 51.4 0.6 –19.3 —
75+ 12 24.0 1,189 27.5 0.9 –3.5 —
All ages(c) 274 41.2 4,520 43.5 0.9 –2.3 0.8
(a) Per cent refers to the proportion of hospitalisations with CHD as the principal diagnosis receiving either coronary angiography or coronary revascularisation.
(b) ASR refers to indirectly age-standardised using ‘other Australians’ population as the standard population (see Appendix A for details).
(c) Includes those aged less than 25 years.
Notes
1. Comorbidities studied include diabetes, hypertensive diseases, high cholesterol, heart failure, chronic kidney failure, chronic obstructive pulmonary disease, chronic rheumatic heart disease or other valve disorders, and cerebrovascular disease.
2. All age-standardised rate ratios are statistically different from 1.0. That is, rates for Indigenous Australians are significantly different from rates for other Australians.
3. See Chapter 2 and Appendix A for definition of inequality measures and comorbidities.
Source: AIHW National Hospital Morbidity Database.

24
6 Discussion Aboriginal and Torres Strait Islander people continue to suffer a substantially greater burden of ill health than other Australians. As for Australians overall, CHD is the major contributor to deaths and excess deaths for Indigenous Australians (Brown 2004). In 2000–2002 Indigenous Australian males and females experienced death rates from CHD 2.9 and 2.5 times those of other Australian males and females respectively (AIHW 2004). The results in this report provide further evidence about the poorer health outcomes, greater complexity and lower procedure rates for Indigenous Australians with CHD compared with other Australians in Queensland, Western Australia, South Australia and the Northern Territory.
Incidence and case fatality Indigenous Australians are three times as likely to have a major coronary event as other Australians. Two-thirds of these major coronary events in Indigenous Australians would have been avoided had Indigenous Australians experienced the same coronary event rates as other Australians in 2002–2003. Indigenous Australians aged 35–54 years are particularly affected as there would have been over 80% fewer coronary events occurring in these younger to middle age Aboriginal and Torres Strait people if they had experienced the same coronary event rates as other Australians. It is worth noting that the excess in coronary events is being driven at least in part by CHD occurring at a younger age in Indigenous people (the rate of major coronary events is higher for Indigenous Australians than other Australians at all ages below 75). Aboriginal and Torres Strait Islander people are 1.5 times as likely to die after a major coronary event as other Australians, with these excess deaths accounting for a third of the Indigenous CHD deaths. Among young to middle-aged Indigenous Australians there would have been around 40% fewer deaths from CHD if they had experienced the same case fatality rates for major coronary events as other Australians. After experiencing a major coronary event, Indigenous Australians are more likely to die from it without being admitted to hospital, and to die from it if admitted to hospital compared with other Australians. There would have been almost 60% fewer in-hospital deaths for CHD among Indigenous Australians had they experienced the same in-hospital fatality rates as other Australians. Coory and Walsh (2005) also reported similar results for in-hospital fatality. Comparing the inequality in the incidence of major coronary events with the inequality in case fatality, it is clear that there is more inequality in the former but inequality exists in both measures. As death rates are determined by both incidence and case fatality, this implies that both of these have an impact on inequalities in death rates and further, more of the inequality in mortality comes from incidence than from case fatality. Further work needs to be done to identify and fully understand the issues that influence these patterns.
Coronary procedures in hospital The procedure rate for coronary angiography and revascularisation among Aboriginal and Torres Strait Islander people is lower than other Australians relative to the size of the population hospitalised with CHD—an age-standardised ratio of 0.6 for each.

25
The age-adjusted rate for PCI among Indigenous Australians is around 40% lower (rate ratio of 0.6) than other Australians, while adjusted rates for CABG are more equal—20% lower (rate ratio of 0.8). The finding of more equal rates for CABG than PCI may be influenced by the fact that Indigenous patients are more likely to have complex multivessel disease, which might mean that they are judged to be better candidates for CABG than PCI. Other possible explanations may be that Indigenous Australians are treated at a later stage in the disease process (CGC 2001) which may reduce the choice of procedures that are considered appropriate. Another is that international evidence suggests that new technologies spread to different demographic groups at different rates and that disadvantaged groups, including Indigenous Australians, may be adversely affected (Productivity Commission 2005). Other studies have confirmed disparities in procedure use for the treatment of Aboriginal and Torres Strait Islander people in hospitals. Coory and Walsh (2005) showed that Indigenous Australian patients had lower coronary procedure rates than non-Indigenous patients, after adjusting for age, sex, socioeconomic status, remote residence, hospital characteristics and comorbidities, through a cohort study of public-sector patients using administrative data. The adjusted rates for PCI during the first admission were significantly lower by 39% (rate ratio, 0.61)—similar to the results in this report and for subsequent admissions 28% lower (rate ratio, 0.72). Cunningham (2002) also found that patients identified as Indigenous Australians were less likely to have a principle procedure recorded in public hospitals after adjusting for sex, age, same-day admission, patient accommodation status, hospital category and area of residence. These lower procedure rates were apparent for most diseases and conditions (particularly marked for diseases of the circulatory, digestive and genitourinary systems and for congenital anomalies). Similar racial disparities in the use of cardiac procedures have been reported in the United States, with African Americans about half as likely as non-African Americans to receive interventional therapy for CHD (Ford & Cooper 1995).
Case complexity Aboriginal and Torres Strait Islander people hospitalised in 2002–2003 with CHD tend to have more comorbidities than other Australians and are over twice as likely to have at least three of the eight comorbidities investigated. This suggests that, on average, hospitalisations for Indigenous Australians with CHD are more complex cases compared with other Australians similarly admitted. The main conditions driving this difference are diabetes (age-adjusted rate ratio of 2.5 times as high as for other Australians), heart failure (rate ratio of 2.3), chronic kidney failure (rate ratio of 4.1), and chronic obstructive pulmonary disease (rate ratio of 1.8). Although the method of our analysis was quite different, the results of this report reflect Coory and Walsh’s (2005) findings to some degree. They showed that diabetes, chronic renal failure, pneumonia, valve disorders and chronic rheumatic heart disease were twice as common among Indigenous Australian patients with CHD and chronic bronchitis and emphysema and heart failure were at least 60% more common. Since complexity may have an impact on determining suitability for revascularisation procedures, it could be hypothesised that this may account for the lower procedure rate among Indigenous Australians. There is evidence that doctors generally select lower risk patients for procedures post AMI (Alter et al. 2001). To further examine whether complexity does explain the lower procedure rate for Aboriginal and Torres Strait Islander people, this report compared the use of procedures by different levels of complexity (as indicated by the number of comorbidities present). This study found that Aboriginal and Torres Strait Islander people are less likely to undergo a procedure across all levels of complexity. The largest difference in procedure rates between Indigenous Australians

26
and other Australians occurs in the least complex group (age-adjusted rate ratio of 0.6). Procedure rates for the most complex group were found to be more equal (age-adjusted rate ratio of 0.8). As the largest differences occurred in the least complicated hospitalisations this suggests that other Australians may be receiving these procedures at an earlier stage in the disease process than Indigenous Australians. These procedures are likely to be more preventative, and may have more of a discretional element in whether or not they are offered to patients. Complexity, as measured by the number of comorbidities in our analysis does not explain the differential use of procedures between the two population groups. Other factors that may impact on procedure rates but were beyond the scope of this analysis are discussed below.
Other issues which may influence procedure rates Fisher and Weeramanthri (2002) ask ‘why is our most needy population receiving a different type of inpatient care?’ They raise several factors that may affect levels of procedure use, apart from the presence of comorbidities. These include patient-level factors like stage of presentation; consent; how well they are anticipated to comply with instructions to care for themselves after procedures; access to services (a combination of uptake of services by the patient and provision of services) and clinician factors such as the use of appropriate protocols and procedures for Aboriginal and Torres Strait Islander people. Aboriginal and Torres Strait Islander people are more likely to discharge themselves prematurely from hospital (Gruen et al. 2002). This may be influenced by the cultural appropriateness of services, a factor that has been recognised as fundamental to improving access by Aboriginal and Torres Strait Islander people to health services. Fisher and Weeramanthri (2002) suggest that better communication and treatment options may improve compliance. They suggest that the lack of Aboriginal health workers, liaison officers and interpreter services indicates a lack of appreciation by health institutions of the importance of involving Indigenous patients in decision making. This means that inadequate communication (due to patient–doctor differences in language, culture, priorities and so on) may lead to potentially useful procedures not being performed. The severity and complexity of the CHD would also affect the likelihood of receiving a procedure. However, clinical measures of CHD could not be examined using the data available from the National Hospital Morbidity Database. It has also been suggested that Indigenous Australians may present later in the disease process which may affect whether they receive a procedure (CGC 2001). However, this report found that the largest difference in the likelihood of receiving a procedure between Indigenous Australians and other Australians across different levels of complexity was in the least complex group, which would be expected to represent those presenting earlier in the ‘chronic disease’ process. Our findings also confirm that Aboriginal and Torres Strait Islander people have a much earlier onset of CHD, but also have much lower procedure use at these earlier ages even after controlling for need. The study by Coory and Walsh (2005) found a marked difference between Indigenous and non–Indigenous patients. ‘On average, they were 14 years younger and were more likely to be of low socioeconomic status, come from a remote area, and be admitted to a small hospital, staffed by a non-specialist and without facilities for coronary procedures’. Some of these characteristics may be influencing the results in this report. More investigations are needed to work through these issues to achieve a better understanding of the results.

27
Data issues While the hospital and mortality data collections provide valuable information on various health measures, they have some limitations. The main limitations of the data and analysis for this report are presented below. An important limitation is the problem of completeness of identification of Aboriginal and Torres Strait Islander people in administrative data collections. The identification of Indigenous Australians is not complete in hospital and mortality data collections (ABS & AIHW 2005; AIHW 2005a, 2005b). Data from only four jurisdictions (Queensland, Western Australia, South Australia and the Northern Territory) are considered to have sufficient identification of Indigenous Australians for data analysis. Therefore the data included in this report may not be representative of all Indigenous Australians. While it is possible to identify many aspects of treatment in hospitals, there are limitations with using an episode-based rather than patient-based database. Importantly, it is not possible to track individual patients in the data, which may affect our analysis. For example, rates of admission for AMI may be inflated because of multiple admissions for the same event and transfers. This report also used the number of CHD hospitalisations as a proxy for need. These include both elective and emergency admissions, which may have different profiles for Indigenous Australians and other Australians. In addition, Indigenous Australians may be less likely to be admitted to hospital for CHD (due to differing treatment preferences and also higher case fatality rates) which could mean that this proxy underestimates the need of Indigenous Australians relative to other Australians. For our analysis of case complexity this report used comorbidities as an indicator of complexity. However, as illustrated by other studies (Coory & Walsh 2005; Ford & Cooper 1995), there are other factors that influence the results but have not been examined in this report. These include socioeconomic status, remoteness, hospital characteristics, severity of event, smoking status, patient preferences for intervention, and the supply of cardiologists and cardio-thoracic specialists.
Conclusion This report highlights some of the major health inequalities relating to Aboriginal and Torres Strait Islander people. Indigenous Australians are more likely to have a major coronary event and poorer survival than other Australians. The in-hospital fatality rates and procedure rates of Indigenous Australians are also worse than that of other Australians. Indigenous Australians admitted with CHD are more likely to die while in hospital and less likely to undergo angiography and revascularisation procedures than other Australians relative to the apparent need for such procedures. They tend to have more comorbidities than other Australians although these results may also be influenced by a range of other factors not covered in this report. The results in this report illustrate the need to reduce the inequalities in health status and treatment of CHD experienced by Aboriginal and Torres Strait Islander people. To inform future health services planning and delivery, more work needs to be done to identify and work through the issues that influence these inequalities.

28
Appendix A: Methods
Cardiac procedures in hospital The cardiac procedures examined in this report are coronary angiography, coronary artery bypass grafts and percutaneous coronary intervention (PCI).
Coronary angiography Coronary angiography (also known as coronary arteriography) gives a picture of the heart’s arteries, known as the coronary arteries. It is used to diagnose coronary heart disease and is essential before either coronary artery bypass surgery or PCI.
Coronary artery bypass grafts (CABG) Coronary artery bypass grafting (CABG) usually involves opening a patient’s chest and using blood vessel grafts to bypass blockages in the coronary arteries and restore adequate blood supply to the heart muscle. The graft material is usually taken from the chest wall or veins in the patient’s legs, or both. CABG is a treatment and not a cure for coronary artery disease, and there is a risk of recurrent disease. Re-operations are uncommon within the first 5 years but become more frequent later.
Percutaneous coronary intervention (PCI) Percutaneous coronary intervention (also known as coronary angioplasty), as with coronary artery bypass surgery, is used to restore adequate blood flow through blocked coronary arteries. It involves inserting a catheter with a balloon into a narrowed coronary artery. The catheter is first inserted into a leg (or occasionally, arm) artery through the skin and then is threaded through the vessels back towards the heart and into the coronary arteries to the area of vessel blockage. The balloon is then inflated against the blocked area to create a wider passage for blood flow. The development of other catheter-based techniques, particularly stenting to the vessel wall at the site of the blockage, has reduced early acute closure of the coronary artery and restenosis. PCI avoids the major trauma of CABG surgery because it does not require the opening of the patient’s chest. However, the technique cannot be used to treat all patients with coronary artery obstruction.
Cause of death and hospital diagnosis classification Australia uses the International Statistical Classification of Diseases and Related Health Problems, Tenth Revision (ICD-10) for coding of causes of death. For hospital diagnosis and procedures this international classification has been modified for Australia (ICD-10-AM—International Statistical Classification of Diseases and Related Health Problems, Tenth Revision,

29
Australian Modification). The table below lists the ICD-10 disease and procedure codes used in this report.
Table A1: Codes for deaths and hospital data used in this report
Disease codes ICD-10 and ICD-10-AM codes
Coronary heart disease I20–I25
Acute myocardial infarction I21
Angina I20
Cerebrovascular disease I60–I69
Chronic rheumatic heart disease and other valve disorders
I05–I09, I34–I39
Hypertensive diseases I10–I15
Heart failure I50
Cardiovascular disease I00–I99
High cholesterol E78.0, E78.2
Chronic obstructive pulmonary disease (COPD) J41–J44
Chronic renal failure N18
Diabetes E10–E14
Procedure codes ICD-10-AM codes
Coronary angiography 38215–00, 38218–00, 38218–02 (block: 668)
Coronary angioplasty (without coronary stent) 35304–00, 35305–00 (block: 670)
Coronary artery bypass grafting 38497, 38500, 38503, 90201 (blocks: 672–679)
Coronary stenting 35310 (block: 671)
Rates This report presents age-specific rates, crude rates and age-standardised rate ratios in examining the level of inequality between Indigenous Australians and other Australians. These analytical concepts are described below.
Age-specific rates Age-specific rates were calculated by dividing the number of events (such as incidence, hospitalisations or deaths) occurring in each specified age group by the population at risk for the corresponding age group. The ABS Experimental Projections of the Aboriginal and Torres Strait Islander Population and the Australian Estimated Resident Population for the years 2002 and 2003 were used in calculating population-based rates.
Crude rates Crude rates were calculated by dividing the total number of events (such as incidence, hospitalisations or deaths) by the total population at risk.

30
Age-standardised rate ratios Age-standardised rate ratios for incidence and hospitalisations were used to remove the influence of age when comparing populations with different age structures. Excess number of events and excess % (measures of inequality impact) for all ages have also been age-standardised. In this report, indirect age standardisation has been used, as the Indigenous Australian population is relatively small and there is some uncertainty about the stability of age-specific rates. The ‘other Australians’ population has been used as the standard population and the Aboriginal and Torres Strait Islander population has been used as the study population in these analyses. The method used for indirect age standardisation entails three steps: Step 1: Calculate the age-specific rates for each age group in the standard population. Step 2: Apply these age-specific rates to the number in each age group of the study population and sum to derive the total expected number of cases for the study population. Step 3: Sum the observed cases in the study population and divide this number by the expected number derived in Step 2 to calculate the rate ratio. A rate ratio of 1 indicates the same number of observed cases as were expected, suggesting rates in the study and standard populations are similar. A result greater than 1 indicates more cases than expected. A result less than 1 indicates fewer cases than expected. For example, if there are twice as many deaths as expected (age-standardised rate ratio of 2.0) then the rate of death in Indigenous Australians can be assumed to be twice that of other Australians.
Inequality measures—worked example There are a number of measures that can be used to indicate the level of health inequality between population groups. In this report we use the rate ratio, rate difference, excess and excess %. Further information on how these measures relate to each other and their interpretation are provided in the Chapter 2. Below is a summary of how these are calculated. Figure A1 provides a hypothetical example of rates for a health outcome, where the rate for Aboriginal and Torres Strait Islander people is assumed to be 300 per 100,000 and the rate for other Australians is 100 per 100,000. The hypothetical population sizes are 500,000 for Indigenous Australians, and 10 million for other Australians. Figure A1 is used to explain the various inequality measures presented in this report.
0
50
100
150
200
250
300
350
Aboriginal and Torres Strait Islanders (pop = 500,000) Other Australians (pop = 10 million)
Rate per 100,000
Figure A1: Hypothetical rates
A
B

31
Rate ratio: a ratio to indicate the relative gap Calculation: Rate for Indigenous Australians divided by rate for other Australians = A/B Worked example from hypothetical A/B = 300 per 100,000/100 per 100,000 = 3 Interpretation: the rate for Indigenous Australians is 3 times as high as for other Australians. Rate difference: difference indicates the absolute gap Calculation: Rate for Indigenous Australians minus the rate for other Australians
= A – B Worked example from hypothetical A – B = 300 per 100,000 – 100 per 100,000 = 200 per 100,000 Interpretation: for Indigenous Australians, there are 200 extra cases per 100,000 population compared with other Australians. Excess: the number of cases that would have been avoided if the rate for other Australians applied to the Indigenous Australian population Calculation: Rate difference converted to absolute number of cases = (A – B) * Indigenous population This is equivalent to the observed number of cases for Indigenous Australians minus the expected number that would have occurred if the rate for other Australians had applied = observed cases – expected cases = A * Indigenous population – B * Indigenous population Worked example from hypothetical A * Indigenous pop – B * Indigenous pop = 300/100,000 * 500,000 – 100/100,000 * 500,000 = 1,500 – 500 = 1,000 Interpretation: there were 1,000 cases that would have been avoided if the rate for other Australians had applied to the Indigenous population. Excess %: the per cent of cases among Indigenous Australians that would have been avoided if the rate for other Australians had applied. Calculation: Excess Indigenous cases as a percentage of all Indigenous cases = (A – B) * Indigenous population / (A * Indigenous population) * 100 = (A – B) / A * 100 Worked example from hypothetical (A – B) / A * 100 = (300 per 100,000 – 100 per 100,000)/300 per 100,000 * 100 = 200/300 * 100 = 67% Interpretation: 67% of Indigenous Australian cases would have been avoided if the rate for other Australians had applied to the Indigenous population.

32
Appendix B: Statistical tables
Table B1: Population estimates for Qld, WA, SA, and NT, 2002–2003
Indigenous Australians Other Australians
Age group (years)
25–34 90,311 2,036,915
35–44 70,007 2,176,575
45–54 43,964 2,007,236
55–64 22,260 1,467,362
65–74 10,699 955,713
75+ 5,159 821,899
All ages(a) 564,462 14,264,256
(a) Includes those aged less than 25 years.
Note: Indigenous population has been obtained from the Experimental Projections of the Aboriginal and Torres Strait Islander population at 30 June 2002 and 2003. Other Australians population has been estimated from the difference between the estimated resident population at 30 June 2002 and 2003 and the experimental projections of the Aboriginal and Torres Strait Islander populations (2002 and 2003).
Source: ABS 2003b, 2004a, 2004b.

33
Table B2: Number of hospitalisations with CHD as principal diagnosis by number of comorbidities in Qld, WA, SA and NT, 2002–2003
Number of comorbidities
None One or two Three or more All CHD hospitalisations
Indigenous Australians
25–34 111 98 14 223
35–44 372 414 84 870
45–54 404 690 222 1,316
55–64 288 537 189 1,014
65–74 122 254 106 482
75+ 68 91 50 209
All ages(a) 1,374 2,087 665 4,126
Other Australians
25–34 362 181 24 567
35–44 2,361 1,711 139 4,211
45–54 7,479 6,841 744 15,064
55–64 11,312 12,671 1,935 25,918
65–74 11,975 15,583 3,232 30,790
75+ 13,101 19,100 4,316 36,517
All ages(a) 46,624 56,094 10,391 113,109
(a) Includes those aged less than 25 years.
Note: Comorbidities studied include diabetes, hypertensive diseases, high cholesterol, heart failure, chronic kidney failure, chronic obstructive pulmonary disease, chronic rheumatic heart disease or other valve disorders, and cerebrovascular disease.
Source: AIHW National Hospital Morbidity Database.

34
Glossary Aboriginal A person who identifies as an Aboriginal and is accepted as such by the community in which he or she lives. Aboriginal and Torres Strait Islander people and Indigenous Australians Terms used interchangeably when referring to people who have identified as Aboriginal and/or Torres Strait Islander. Acute myocardial infarction (AMI) A condition where part of a person’s heart muscle dies as a result of a blood clot that completely blocks the flow of blood to that part. Additional diagnosis Conditions or complaints either co-existing with the principal diagnosis or arising during the episode of care. Age standardisation A method of removing the influence of age when comparing populations with different age structures. Indirect age standardisation has been used in this report. A standardised ratio is calculated by comparing the actual number of events with the number expected if the age-specific rates in the ‘other Australians’ population applied to the Indigenous population. A ratio of greater than one indicates more events than expected, whereas a ratio of less than one indicates fewer events than expected. Age-specific rate A rate for a specific age group. The numerator and denominator relate to the same age group. Angina Temporary chest pain or discomfort when the heart’s own blood supply is inadequate to meet extra needs, for example during exercise. Case fatality An important outcome measure which quantifies the proportion of cases that are fatal within a specific time period. Overall case fatality used in this report relates to major coronary events and is calculated as the number of CHD deaths in the specified population divided by the sum of all CHD deaths and non-fatal hospital admissions for AMI (with length of stay of 3 days or more) for the period 2002–2003. Cerebrovascular disease See stroke. Chronic obstructive pulmonary disease (COPD) Serious, progressive and disabling long-term lung disease where damage to the lungs, usually due to both emphysema and chronic bronchitis, obstructs oxygen intake and causes increasing shortness of breath. By far the greatest cause is cigarette smoking. Chronic renal failure Long-term condition where kidney function is lost progressively and irreversibly. End-stage renal disease is the final stage in the progressive deterioration of kidney function. In this situation, a person needs dialysis or a kidney transplant to remain alive. Chronic rheumatic heart disease Long-term damage done to the heart muscle or heart valves by acute rheumatic fever. Acute rheumatic fever is a delayed complication of an untreated throat infection with group A streptococcus (GAS) bacteria. It can affect the heart valves, the heart muscle and its lining, the joints and the brain. Comorbidity In this report this term is used to describe the existence of a select list of conditions recorded as an additional diagnosis on the hospital record. Coronary angiography A diagnostic procedure which gives a picture of the heart’s arteries.

35
Coronary artery bypass grafting (CABG) Surgical procedure using blood vessel grafts to bypass blockages in the coronary arteries and restore adequate blood flow to the heart muscle. Also see percutaneous coronary intervention. Coronary heart disease (CHD) Its primary feature is insufficient blood supply to the heart itself. The two major clinical forms are heart attack (the insufficient blood supply is sudden and extreme) and angina. The underlying problem is atherosclerosis, a complex process where fatty and fibre-like deposits build up on the inner walls of the arteries, often forming plaques. CHD is also known as ischaemic heart disease. Coronary stent A metal mesh tube that is expanded within an artery at a point of narrowing and left there to hold the artery open. Crude rate Calculated by dividing the total number of events (such as incidence and hospitalisations) by the total population at risk. Diabetes (diabetes mellitus) A chronic condition in which the body makes too little of the hormone insulin or cannot use it properly. This raises the blood level of the body’s major energy source, the sugar glucose, and causes other widespread disturbance of the body’s energy processes. Excess number of cases An absolute measure of the impact of inequality calculated as the difference between the observed and expected number of cases. It represents the number of cases that would have been avoided if the rate for other Australians applied to the Indigenous population. Excess % A relative measure of the impact of inequality. It is calculated as the excess number of cases as a percentage of all Indigenous cases and is interpreted as the percentage of Indigenous cases that would have been avoided if the rate for other Australians applied to the Indigenous population. Heart attack Life threatening emergency that occurs when a vessel supplying blood to the heart muscle is suddenly blocked completely by a blood clot. The medical term commonly used for a heart attack is acute myocardial infarction. Heart failure When the heart cannot pump strongly enough to keep the blood circulating around the body at an adequate rate. High blood cholesterol It is the main cause of the process by which the blood vessels that supply the heart and other parts of the body become clogged. Hypertensive disease Disease occurring when high blood pressure (hypertension) is severe or prolonged enough to cause damage to the heart, brain or kidneys. Incidence The number of new cases of a condition or disease occurring in a population within a specified time period. Incidence of major coronary events Estimated as the sum of the number of non-fatal hospital admissions for AMI (with length of stay of 3 days or more) and the number of deaths recorded as CHD deaths. Indigenous A person who identifies as Aboriginal and/or Torres Strait Islander and is accepted as such by the community with which he or she lives. In-hospital fatality rate This refers to the proportion of hospitalised cases that die in hospital. In-hospital fatality for CHD used in this report is defined as the number of CHD deaths in hospital in those hospitalisations where CHD is the principal diagnosis divided by the number of hospitalisations with CHD as the principal diagnosis.

36
International Classification of Diseases The World Health Organization’s internationally accepted classification of death and disease. The 10th Revision (ICD-10) is currently in use. Length of stay Duration of hospital stay, calculated by subtracting the date the patient is admitted from the date of separation. All leave days, including the day the patient went on leave are excluded. A same-day patient is allocated a length of stay of 1 day. Major coronary event An event that results either in an acute admission to hospital for acute myocardial infarction (AMI) with a length of stay of 3 days or more, or in death from CHD. It should be noted that this excludes admissions for unstable angina or for coronary revascularisation procedures where the principal diagnosis is not AMI. Morbidity Refers to ill health in an individual and to levels of ill heath in a population or group. Mortality Death Other Australians This term is used when referring to people that have not identified as Aboriginal and/or Torres Strait Islander. This group will include those people who have said they are non–Indigenous but may also include either Aboriginal and/or Torres Strait Islander people who have chosen not to identify as such or individuals for whom the relevant information was not collected. Out-of-hospital fatality rate This refers to the proportion of cases that result in death without admission to hospital or after discharge from hospital. Out-of-hospital fatality used in this report is estimated as the total number of deaths from CHD less the number of CHD deaths in hospital in those hospitalisations where CHD is the principal diagnosis divided by the sum of all CHD deaths and non-fatal hospital admissions for AMI (with length of stay of 3 days or more). It should be noted that deaths occurring in the emergency departments of hospitals are included in this group, as these deaths occur before the formal admission to hospital takes place. Overweight Defined as a body mass index 25 and over. Percutaneous coronary intervention (PCI) Coronary angioplasty and coronary stenting when used together are referred to as PCI. It is used to restore adequate blood flow to blocked coronary arteries. Coronary angioplasty involves inserting a catheter with a balloon into a narrowed coronary artery. The balloon is then inflated against the blocked area to create a wider passage. Coronary stenting involves expanding a metal mesh tube within the artery to form a supporting structure to hold the artery open at the point where there is narrowing. Also see coronary artery bypass grafting and coronary stent. Principal diagnosis The diagnosis established, after study, to be chiefly responsible for the patient’s episode of care in hospital; that is, the main or primary diagnosis. Rate difference Absolute measure of inequality which is calculated as the rate for Indigenous Australians minus the rate for other Australians. Rate ratio Relative measure of inequality which is calculated as the rate for Indigenous Australians divided by the rate for other Australians. For the age-standardised case, it is the ratio of the observed to the expected number of cases had the rates for other Australians applied. Revascularisation (‘re-vesselling’) Restoring adequate blood flow to the heart or other part of the body, usually after the supply has been reduced or blocked, as in angina or a heart attack. Revascularisation includes methods such as PCI and coronary artery bypass graft surgery. Separation The formal process by which a hospital records the completion of treatment and/or care for an admitted patient.

37
Stroke When an artery supplying blood to the brain suddenly becomes blocked or bleeds. Often causes paralysis of parts of the body normally controlled by that area of the brain, or speech problems and other symptoms. Torres Strait Islander A person who identifies as a Torres Strait Islander and is accepted as such by the community in which he or she lives. Underlying cause of death The condition, disease or injury initiating the sequence of events leading to death, that is, the primary, chief, main or principal cause. Unstable angina A form of angina that is more dangerous than normal angina but less so than a heart attack. It can feature chest pain that occurs at rest; and in someone who already has angina it can be marked by new onset of chest pain with exertion or pain that accelerates by coming on more easily, more often or for longer than previously.

38
References Abbot P & Close G 2002. Vascular health risks in the Aboriginal community: a cultural approach. Australian Family Physician 31: 605–10. Alter DA, Naylor CD, Austin PC & Tu JV 2001. Long-term MI outcomes at hospitals with or without on-site revascularisation. JAMA 285: 2,101–08. Australian Bureau of Statistics (ABS) 2003a. Causes of death. ABS cat. no. 3303.0. Canberra: ABS. ABS 2003b. Population by age and sex. ABS cat. No. 3201.0. Canberra: ABS. ABS 2004a. Experimental projections of the Aboriginal and Torres Strait Islander population, 1996 to 2006. ABS cat. no. 3231.0. Canberra: ABS. ABS 2004b. Population by age and sex. ABS cat. No. 3201.0. Canberra: ABS. Australian Bureau of Statistics & Australian Institute of Health and Welfare (ABS & AIHW) 2005. The health and welfare of Australia’s Aboriginal and Torres Strait Islander peoples. ABS cat. no. 4704.0. Canberra: ABS. Australian Institute of Health and Welfare (AIHW) 2004. Heart, stroke and vascular diseases—Australian facts 2004. AIHW cat. no. CVD 27. Canberra: AIHW and National Heart Foundation of Australia (Cardiovascular Disease Series no. 22). AIHW 2005a. Improving the quality of Indigenous identification in hospital separations data. AIHW cat. no. HSE 101. Canberra: AIHW (Health Services Series no. 25). AIHW 2005b. Australian hospital statistics 2003–04. AIHW cat. no. HSE 37. Canberra: AIHW (Health Services Series no. 23). AIHW: Davies 2003. Coronary revascularisation in Australia, 2000. Bulletin no. 7. AIHW cat. no. AUS 35. Canberra: AIHW. AIHW: Draper G, Turrell G & Oldenburg B 2004. Health inequalities in Australia: mortality. Health Inequalities Monitoring Series no. 1. AIHW cat. no. PHE 55. Canberra: Queensland University of Technology and AIHW. AIHW: Jamrozik K, Dobson A, Hobbs M et al. 2001. Monitoring the incidence of cardiovascular disease in Australia. AIHW cat. no. CVD 16. Canberra: AIHW (Cardiovascular Disease Series No. 17). AIHW: Mathur S 2002. Epidemic of coronary heart disease and its treatment in Australia. AIHW cat. no. CVD 21. Canberra: AIHW (Cardiovascular Disease Series No. 20). Breslow NE & Day NE 1987. Statistical methods in cancer research. Volume 2: The design and analysis of cohort studies. Lyon: International Agency for Research on Cancer. Brown A 2004. The context of indigenous cardiovascular disease. CARPA Newsletter 46 (March). Bunker S J, Colquhoun D M, Esler M D et al. 2003. Position statement. “Stress” and coronary heart disease: psychosocial risk factors, NHFA position statement update. Medical Journal of Australia 178(6): 272–6. Commonwealth Grants Commission (CGC) 2001. Report on Indigenous funding. Canberra: Commonwealth of Australia.

39
Coory MD & Walsh WF 2005. Rates of percutaneous coronary interventions and bypass surgery after acute myocardial infarction in Indigenous patients. Medical Journal of Australia 182: 507–12. Cunningham J 2002. Diagnostic and therapeutic procedures among Australian hospital patients identified as Indigenous. Medical Journal of Australia 176: 58–62. Fisher D & Weeramanthri T 2002. Hospital care for Aboriginals and Torres Strait Islanders: appropriateness and decision making. Medical Journal of Australia 176(2): 49–51. Ford E & Cooper R 1995. Implications of race/ethnicity for health and health care use. Racial/ethnic differences in health care utilization of cardiovascular procedures: a review of the evidence. HSR: Health Services Research 30:1 (April 1995, Part 11): 237–52. Gruen R, Weeramanthri T & Bailie R 2002. Outreach and improved access to specialist services for indigenous people in remote Australia: the requirements for sustainability. Journal of Epidemiology and Community Health 56: 517–21. Khaykin Y, Austin PC, Tu KV & Alter DA. 2002. Utilisation of coronary angiography after acute myocardial infarction in Ontario over time: have referral patterns changed? Heart 88: 460–66. Knekt P, Alfthan G, Aromaa A et al. 2001. Homocysteine and major coronary events: a prospective population study amongst women. Journal of Internal Medicine 249: 461–65. Mackenbach JP & Kunst AE 1997. Measuring the magnitude of socio-economic inequalities in health: an overview of available measure illustrated with two examples from Europe. Social Science and Medicine 44(6): 757–71. National Health Performance Committee (NHPC) 2004. National report on health sector performance indicators 2003. AIHW cat. no. HWI 78. Canberra: AIHW. New Zealand Ministry of Health (NZ MOH) 2005. Decades of disparity II: socioeconomic mortality trends in New Zealand, 1981–1999. Public Health Intelligence Occasional Bulletin no. 25. Wellington: Ministry of Health. Paradies Y & Cunningham J 2002. Placing Aboriginal and Torres Strait Islander mortality in an international context. Australian and New Zealand Journal of Public Health 26: 11–16. Productivity Commission 2005. Impacts of medical technology in Australia. Research report. Melbourne: productivity commission. Rapola JM, Virtamo J, Ripatti S et al. 1997. Randomised trial of α-tocopherola and β-carotene supplements on incidence of major coronary events in men with previous myocardial infarction. Lancet 349: 1,715–20. Ring I & Firman D 1998. Reducing indigenous mortality in Australia: lessons from other countries. Medical Journal of Australia 169: 528–33. Robins SJ, Collins D, Wittes JT et al. 2001. Relation of Gemfibrozil treatment and lipid levels with major coronary events. Journal of the American Medical Association 285: 1,585–91. Rosengren A, Hawken S, Ôunpuu S et al. 2004. Association of psychosocial risk factors with risk of acute myocardial infarction in 11, 119 cases and 13, 648 controls from 52 countries (the INTERHEART study): case-control study. Published online September 3 2004 http://image.thelancet.com/extras/04art8002web.pdf. Rosenthal GE, Sarrazin MV & Hannan EL 2003. In-hospital mortality following coronary artery bypass graft surgery in veterans health administration and private sector hospitals. Medical Care 41(4): 522–35. Vagero D & Erikson R 1997. Comment: Socioeconomic inequalities in morbidity and mortality in western Europe. Lancet 350: 516.

40
Villareal RP, Lee V-V, Elayda MA & Wilson JM 2002. Coronary artery bypass surgery versus contrary stenting: risk-adjusted survival rates in 5,619 patients. Texas Heart Institute Journal 29: 3–9.