abnormal event detection in wireless sensor networks based
TRANSCRIPT

Research ArticleAbnormal Event Detection in Wireless Sensor NetworksBased on Multiattribute Correlation
Mengdi Wang Anrong Xue and Huanhuan Xia
School of Computer Science and Communication Engineering Jiangsu University Zhenjiang 212013 China
Correspondence should be addressed to Anrong Xue xuearujseducn
Received 10 February 2017 Accepted 27 March 2017 Published 6 April 2017
Academic Editor Mengxing Huang
Copyright copy 2017 Mengdi Wang et al This is an open access article distributed under the Creative Commons Attribution Licensewhich permits unrestricted use distribution and reproduction in any medium provided the original work is properly cited
Abnormal event detection is one of the vital tasks inwireless sensor networks However the faults of nodes and the poor deploymentenvironment have brought great challenges to abnormal event detection In a typical event detection technique spatiotemporalcorrelations are collected to detect an event which is susceptible to noises and errors To improve the quality of detectionresults we propose a novel approach for abnormal event detection in wireless sensor networks This approach considers not onlyspatiotemporal correlations but also the correlations among observed attributes A dependency model of observed attributes isconstructed based on Bayesian network In this model the dependency structure of observed attributes is obtained by structurelearning and the conditional probability table of each node is calculated by parameter learning We propose a new concept namedattribute correlation confidence to evaluate the fitting degree between the sensor reading and the abnormal event pattern On thebasis of time correlation detection and space correlation detection the abnormal events are identified Experimental results showthat the proposed algorithm can reduce the impact of interference factors and the rate of the false alarm effectively it can alsoimprove the accuracy of event detection
1 Introduction
Abnormal event detection is one of the main problems inwireless sensor networks [1] In wireless sensor networksabnormal events are usually complex because an eventusually involves multiple observed attributes and it is dif-ficult to describe an abnormal event pattern [2] Existinganomaly detection algorithms detect an abnormal event bycomparing a single attribute threshold [3 4] or by consideringthe spatiotemporal correlations of sensor readings [2 5ndash8]However some important information may be hidden in thecorrelations among different attributes [9]
In [3] an adaptive distributed event detection method isproposed which dynamically adjusts the decision thresholdbased on the trust value of the sensor nodes and uses themoving average filter to tolerate the transient faults of thesensor nodes Although this method is fault-tolerant it isstill possible to misjudge the event nodes into faulty nodesParticularly when the event range is large the accuracy ofdetection will decrease significantly Besides this methodcomputes a trust value for each sensor node so it can only
be applied to univariate applications Paper [5] models theevent region based on Dynamic Markov Random FieldThis method can effectively capture the dynamic changes oflocal area since the method needs to exchange informationof space-time neighbor constantly the detection efficiencyis low Besides the detection of the events lacks a globalperspective which may lead to misjudgment of abnormalevents Paper [6] proposed an event detection scheme basedon spatiotemporal correlations In this method the sensornodes are divided intomultiple working groups the time cor-relation of the sensor data is used to eliminate low frequencyerrors Different working groups cooperate to determinewhether the anomalies represent an event However thismethodonly constructs themodel based on the single sensingattribute and does not consider the relations between themultisensory attribute and the abnormal event
The attributes of the sensor readings usually containtime information sensor topology information and otherattributes directly sensed by the sensor (eg temperaturehumidity and light intensity) When abnormal events occurin the network events often show temporal correlation
HindawiJournal of Electrical and Computer EngineeringVolume 2017 Article ID 2587948 8 pageshttpsdoiorg10115520172587948
2 Journal of Electrical and Computer Engineering
spatial correlation and attributes correlation [9] In mostcases event detection methods that take the spatiotem-poral correlation of the data into account are susceptibleto both sensor failures and external environmental noisesFor observed attributes a simple threshold comparison isinsufficient to determine whether an abnormal event occursFor instance in an indoor fire monitoring application theincrease of the temperature and smoke concentration may becaused by cooking rather than a fire accident
In order to improve the accuracy of abnormal eventdetection in wireless sensor networks withmultiple attributesand reduce the influence of environmental noises and sensorfailures on the event detection results this paper proposes anewmethod calledAbnormal EventDetection based onMul-tiattribute Correlation (MACAED) First considering thatBayesian network can effectively represent the dependenciesamong variables a Bayesian network is used to establishthe dependency model of observed attributes In this modelthe dependency structure of abnormal events is obtainedby structure learning Each node learns the parametersto get a conditional probability table Then the attributecorrelation confidence is introduced to judge whether theattribute correlation mode of the point is an abnormalmode Based on the sliding window model the degree oftemporal correlationwas calculated the spatial similarity wascalculated by using the neighbor node information Finallythe anomaly events were detected by three kinds of attributecorrelation
2 Attribute Dependency Model
In wireless sensor networks abnormal events usually showthe following three characteristics
(1) For a single sensor node the anomaly event willcontinue for a period of time once the event occursthe adjacent time of the data shows a certain degreeof similarity [7] In addition abnormal events willinevitably affect the physical environment of networkmonitoring and the sensor data will change accord-ingly showing a special mode
(2) For a number of sensor nodes sensor nodes inthe event region will exhibit spatial similarity whenabnormal events occur [10] in other words thereadings of adjacent nodes exhibit similar patterns
(3) When the abnormal events occur in the monitoringarea the sensed attributes of the sensor readings showa certain degree of relevance and this correlationappears as probability relations [9]
According to the three kinds of characteristics of abnor-mal events in wireless sensor networks and the experiencethat Bayesian network can effectively represent the probabil-ity relationship among attributes we construct the attributedependency model The attribute correlation confidence isproposed to measure the degree of similarity between themeasured points and the anomalies in observed attributeprobability model
X1
X2X3 X4
X5
Figure 1 An example of attribute dependency model
21 Bayesian Network Bayesian network is a product ofprobability theory and graph theory It is a directed acyclicgraphwith probabilistic annotations which can represent theprobability dependencies among random variables It has asolid mathematical foundation [11] On the one hand theBayesian network can reveal the structure of the problemintuitively by using graph theory On the other hand theBayesian network can utilize the structure of the problemaccording to the principle of probability theory whichreduces the computational complexity of reasoning In viewof this this paper establishes a dependencymodel of observedattributes based on the Bayesian network each attribute isrepresented by a unique node and the probabilistic depen-dencies are represented by arcs between nodes
22 Formal Description The attribute dependency modelis represented by a triplet 119861 = (119863 119866 120579) where 119863 isthe sample dataset that contains observed attributes 119863 =1198891 1198892 119889119898 G denotes a directed acyclic graph whichqualitatively describes the dependencies among attributes119866 = (119883119880) where 119883 is a set of nodes representingobserved attributes corresponding to the elements in119863 and119880 is the directed edge set representing the dependenciesamong the attributes 120579 is the set of conditional probabilitydistributions for each node which quantitatively describesthe dependencies among attributes 120579 = 119875(119883119894 | 120587(119883119894))where 119883119894 is the 119894th node in 119866 and 120587(119883119894) is the set of parentnodes of node 119883119894 Figure 1 is an example of an attributedependency model
23 Structure Learning For WSNs with large number ofvariables and implicit dependencies among variables it isdifficult to obtain a reasonable network structure relying on apriori information and expert knowledge and the probabilityis subjective so we learn the Bayesian network structure fromtraining samples This paper utilizes a strategy of scoring andsearching Specifically we use a scoring function to evaluatethe matching degree between a specific network structureand the training sample and select the appropriate searchstrategy to search the network structure with the highestscoring value
Journal of Electrical and Computer Engineering 3
Given a sample dataset 119863(1198891 1198892 119889119898) let Bayesiannetwork 119866 take all the variables in the node set 119883(11988311198832 119883119898) as nodes and instantiate all the variables of 119883using the attribute value 119889119894 in the sample datasetThe variable119883119894 has 119903119894 possible values (1199091198941 1199091198942 119909119894119903119894) Let the parentvariable set of119883119894 beΠ119894119908119894119895 denotes the 119895th instantiation valueof the parent nodeΠ119894 with respect to119863 and119873119894119895119896 denotes thenumber of instances in which the value119883119894119896 of the variable119883119894is taken and is instantiated into119908119894119895 byΠ119894119873119894119895 = sum119903119894119896=1119873119894119895119896TheBayesian scoring criterion is used to compute the likelihoodratios of the two Bayesian network structures 1198661 and 1198662Since 119901(1198661 | 119863)119901(1198662 | 119863) = 119901(1198661 119863)119901(1198662 119863) we onlyneed to compare the joint probability 119901(1198661 119863) and 119901(1198662 119863)This can be calculated by using the formula [12]
119901 (119866119863) = 119901 (119866) 119901 (119863 | 119866)= 119901 (119866) sdot 119899prod
119894=1
119902119894prod119895=1
(119903119894 minus 1)(119873119894119895 + 119903119894 minus 1) sdot119903119894prod119896=1
119873119894119895119896 (1)
where 119901(119866) is the prior probability and the arrangementorder of Π119894 is (1 119902119894) Maximizing the joint probability119901(119866119863) in (1)
max119866119901 (119866119863)
= 119901 (119866) 119899prod119894=1
maxΠ119894
[[119902119894prod119895=1
(119903119894 minus 1)(119873119894119895 + 119903119894 minus 1)119903119894prod119896=1
119873119894119895119896]] (2)
It can be seen that for each variable119883119894 it is only necessary tomaximize
maxΠ119894
119892 (119894 Π119894) = maxΠ119894
[[119902119894prod119895=1
(119903119894 minus 1)(119873119894119895 + 119903119894 minus 1)119903119894prod119896=1
119873119894119895119896]] (3)
In the initial stage of constructing the network structure it isassumed that each node has no parent nodeThe nodes whichmeet the posterior probability maximization formula arerecursively added to the parent set of nodes When 119901(119866119863)is no longer increased stop adding to the parent node setthen the network structure 1198661015840 is obtained For the currentsample dataset 119863 1198661015840 is the optimal network structure underthe Bayesian scoring standard
24 Parameter Learning According to the trained networkstructure the parameter of each node in the network islearned to get the corresponding conditional probabilitytable The conditional probability table contains the prob-ability relations among the variables Using the maximumlikelihood estimation method suppose (1199091 1199092 119909119899) is aset of possible values of random variable set (1198831 1198832 119883119899)and the probability of (1198831 1198832 119883119899) falling in theneighborhood of (1199091 1199092 119909119899) (119899-dimensional cubes withside length 1198891199091 1198891199092 119889119909119899 resp) is approximated asprod119899119894=1119891(119909119894 120579)119889119909119894 where prod119899119894=1119891(119909119894 120579) is the joint probabilitydensity of (1198831 1198832 119883119899) 120579 is the structural parametersand 120579 isin Θ The maximum likelihood estimation value 120579 of 120579
is calculated throughmax120579isinΘ119871(1199091 119909119899 120579)The conditionalprobability table for each node is obtained from the sampledata and prior knowledge
25 Attribute Correlation Confidence Attribute correlationconfidence is a concept we proposed to measure the fittingdegree between the sensor reading and the abnormal eventpattern It is equal to the ratio of the joint probability distri-bution between the measured point and the abnormal pointLet (1199101 1199102 119910119899) be the sensor reading at the current timeFor an abnormal event 119864119894 the joint probability of all nodevariables119875(1198831 1198832 119883119899 | 119864119894) is calculated according to theBayesian network structure and the conditional probabilitytable Since in Bayesian network not every node has an arcto the all the rest nodes the conditional probability onlydepends on the direct parent node In other words given thevalues of parent variables the probability of nondescendantnode is conditionally independent of the parent node So thecalculation of joint probability 119875(1198831 1198832 119883119899 | 119864119894) can besimplified by using the chain rule [11]
119901 (119909) = 119899prod119894=1
119901 (119909119894 | 119909119901119886(119894)) (4)
in which 119909119901119886(119894) represents the parent node of 119909119894After calculating 119875(1198831 1198832 119883119899 | 119864119894) we can get the
probability pattern of the reading in an event According tothe formula
120572 = max119894isin119868
119875 (1198831 = 1199101 119883119899 = 119910119899)119875 (1198831 = 1199091 119883119899 = 119909119899 | 119864119894) (5)
the attribute correlation confidence 120572 of the tested point iscalculatedThehigher the probability themore the possibilityfor the anomaly to represent an abnormal event
3 Abnormal Event Detection AlgorithmBased on Multiattribute Correlation
In this paper we propose a detection algorithm based onmultiattribute correlation which is divided into three phasesattribute correlation pattern decision temporal similaritydetection and spatial similarity detection
31 Description of Abnormal Event For an abnormal eventdefine event information 119868119899119891119900 = 119879119898 119871119900119888 119860119905119905119903 119875119886119903119898 119864119894where 119879119898 is the time of occurrence of abnormal events 119871119900119888is the location of abnormal events and 119860119905119905119903 is the attributeset that an event involves Parm is the parameter set whichincludes temporal similarity threshold 120576 spatial similaritythreshold 120575 and attribute correlation confidence threshold120593 For different application environments the values of eachitem in Parm can be adjusted to achieve the best detectionresult adaptively 119864119894 represents the event type 119894 = 0means noabnormal events occurred 119894 gt 0means that abnormal eventsoccurred and the higher the value 119894 is the more severity theabnormal event has
4 Journal of Electrical and Computer Engineering
32 Temporal Similarity Detection The data sampling fre-quency of most wireless sensor networks is relatively highand data change range at the adjacent time is relatively smallso the sensor data is time-correlated Combining with slidingwindowmodel and the attribute dependencymodel obtainedcandidate anomalies that may represent abnormal events aredetected
Let 119904 be the size of the sliding window and for eachdata sequence 119905119894 within the window calculate the similaritybetween 119905119894 and the current time series 119905
119902 (119905119894 119905) = 1(1 + radicsum119898119896=1 (119909119905119894119896 minus 119909119905119896)2)
(6)
Considering that the data sequence that is closest to the cur-rent time is most correlated the average similarity betweenthe current time data and the data in the window is calculatedby the weighted summation method
119902 (119905) = sum119908119908119894=1 119908119894119902 (119905119894 119905)119904 (7)
where the weight is 119908119894 = 1(119905 minus 119905119894) If the average similarity issmaller than the threshold 120576 and the confidence degree of theattribute correlation is greater than or equal to the threshold120593 it means that not only does the data sequence of the currenttime significantly deviate from the historical data but also therelationship among the attributes is in accordance with theprobability relation when the abnormal event occurs whichneeds a further spatial correlation detection In other cases itwill be filtered as a noise
33 Spatial Similarity Detection The similarity between thecandidate anomaly and the neighbor nodersquos data sequence iscalculated If the candidate anomaly and the neighbor nodersquosdata sequence satisfy certain similarity degree it indicatesthat the abnormal event occurs in the region where thecandidate anomaly is located and needs to be uploaded to thesink node
The similarity between the candidate anomaly and theneighbor node sequence is calculated according to the follow-ing formula
119902 (119909119905 119910119905) = 1(1 + radicsum119898119896=1 (119909119905119896 minus 119910119905119896)2)
(8)
If the spatial similarity 119902(119909119905 119910119905) is greater than or equal tothe threshold 120575 it indicates that both nodes have detectedan abnormal event at the same time and mark the candi-date anomaly nodes and their neighbor nodes as abnormalevent nodes On the contrary it indicates that no neighbornodes detect abnormal information at this time and thecandidate anomaly belongs to noise data which is also filteredout
34 Description of MACAED Algorithm Based on the calcu-lation of attribute correlation confidence and the detection of
temporal and spatial correlation of sensor data an abnormalevent detection algorithmbased onmultiattribute correlationis proposed The pseudocode of the algorithm is shown inAlgorithm 1
In the pseudocode of Algorithm 1 rows (2)sim(3) trainthe Bayesian network through the scoring-searching methodand choose the network structure119872 with the highest scoreas the observed attribute dependency model rows (4)sim(26)detect abnormal events in real time where rows (9)sim(10)proceed parameter learning for each sensor in order toupdate the probability distribution in attribute dependencymodel rows (10)sim(14) compute the attribute correlationconfidence of observed attributes row (15) calculates theaverage similarity between the current time readings and thereadings within the window row (18) calculates the averagesimilarity between the current node and the adjacent nodereadings and rows (17)sim(24) determine whether the currentreading represents abnormal events readings
35 Time Complexity Analysis Let 119899 be the number ofobserved attributes which corresponds to the number ofnodes in Bayesian network 119898 is the number of instancesthat is the number of readings 119903 is the number of possiblevalues for each observed attribute119873 is the number of nodesin WSN 119904 is the size of sliding window For the structurelearning part the time complexity is 119874(1198981198994119903) [12] Forabnormal event detection part it contains two layers outerlayer loops 119874(119898 minus 119904 minus 1) times and inner loops 119874(119873) timesThe parameter learning consists of a cycle of 119874(119899) times Thetime correlation detection consists of a cycle of 119874(119904) timesThe spatial correlation detection consists of a cycle of 119874(119873)timesThe total time complexity of the algorithm is119874(1198981198994119903)+119874(119898minus119904minus1)119874(119873)119874(119899+119904+119873) Since for most wireless sensornetworks the value of 119899 is small (less than 10) and slidingwindow 119904 and the number of possible values of each attribute119903 are relatively small (in this experiment 119904 = 10 119903 = 9)the influence of these values on the total time complexity canbe ignored so the total time complexity can be simplified to119874(119898) + 119874(1198981198732) = 119874(1198981198732)4 Experimental Results and Analysis
41 Datasets We test the performance of the MACAEDalgorithm by means of conducting simulation experimentson Matlab 2014a The experiments are run on a PC withan Intel Core i3-2120 330GHZ Cpu 4GB memory andWindows 7 operating system For the instance of detectingfire event the performance tests are based on the processeddata of Intel Lab Data [13] from Intel Berkeley Lab Except forthe real data field we insert the fire events and interferenceevents data field into the dataset manually
The experiment dataset contains the records of 54 sensorsdeployed in the IBRL lab during the time span from February28th to April 5th in 2004 The MicaDot sensors collecttemperature humidity light intensity and voltage value every31 seconds Sensor node deployment is shown in Figure 2
Journal of Electrical and Computer Engineering 5
Input WSN data set119863Output Abnormal event Information Info(1) standardize119863 into values between 0 and 1(2) divide119863 into 119870 subsets choose the first set to learn Bayesian network(3) choose the network with highest score as attribute
dependency model119872(4) for 119905 = 119904 + 1 to epochepoch is incremental tick(5) if 119905period = 0period is parameter update period(6) flag = true flag represents update parameter or not(7) end(8) for 119894119889 = 1 to119873119894119889 is the id of WSN119873 is the number of sensors(9) learn parameter for each sensor node(10) if dataPointer [119894119889] lt group_length
prevent the 119894119889 exceed the length of group(11) if groupData_time [119894119889] lt 119905
prevent a break caused by data loss(12) compute 120572 fromM(13) end(14) end(15) compute 119902(119905119894 119905)(16) if 119902(119905119894 119905) lt 120576 ampamp 120572 ge 120593(17) compute 119902(119909119905 119910119905)(18) if 119902(119909119905 119910119905) ge 120575(19) report Info to sink node(20) else(21) filter as noise(22) end(23) end(24) end(25) flag = false(26) end
Algorithm 1 Abnormal event detection algorithm based on multiattribute correlation
1
23
4
5 6
7
8
9
10
11
12
13 14
1516
1718
19
2021
22
23
242526
27
28
29
30
31
32
33
34
35
36
37
38
39
40
4142
4344
45
4647
48
49
50
51
52 53
54
Figure 2 Location of sensor nodes deployed in IBRL lab
42 Data Preprocessing In our experiment we choose therecords within 24 hours in February 28th as our test data wepreprocess the raw data as follows
(1) Since the unit of measurement attributes directlysensed by each sensor is different and the changingrange of different attributes is wide so the raw data
needs to be standardized andmapped to [0 1] in thisway the relative distance can be calculated
(2) Since the change of each attribute value is continuousand periodic in order to facilitate the calculation theexperimental datasets are discretized and the valuesof each attribute are divided into 10 intervals
6 Journal of Electrical and Computer Engineering
1 11
2 2 22
3 3
33
4 4 44
1
Score = 1 Score = 12 Score = 13 Score = 74
Figure 3 Network structure under Bayesian scoring criterion
(3) For some parts of the raw IBRL datasets have missingvalues and the failure nodes (both node 5 and node 15have no records node 28 only has 3 attribute records)the NaN is used in this experiment to fill the missingvalues and these values will be discussed in differentsituations not for computation
(4) In order to verify the performance of our algorithmondetecting abnormal events abnormal readings thatrepresent abnormal events are added in the datasetIn addition the readings of the abnormal events withthe interference are added (eg opening heater in theroom will make the temperature rise)
43 Experimental Parameters Temperature 119879 humidity 119867light intensity119871 and voltage119881 are numberedwith 1 2 3 4 Inorder to obtain relatively stable Bayesian network structurewe set the maximum number of parent nodes in structurelearning max_fan_in = 2 learning step length step = 10 andthe number of instancesncases= 1000Theoptimal parameterlearning cycle period = 600 Bayesian networks with fourdifferent scores are showed in Figure 3 the higher the score isthe more stable the network structure is Thus we choose thestructure whose score = 74 as an attribute dependency modelin this experiment
In this method the sliding window size has a directimpact on the detection results The precision the recall andthe 1198651-measure of anomaly detection under different slidingwindow sizes are experimented The experimental results areshown in Figure 4
From Figure 4 we can find that the recall decreases withthe increase of the sliding windowwidth however the overallchange is not obvious But the precision declines relativelyfaster leading to the quick decrease of 1198651 value This isbecause with the increase of window width the historicaldata increases and the calculated average value declinesceaselessly which means that the possibility of becomingcandidate anomalies is higher Considering that the slidingwindow width is small and the amount of uploaded data issmall so we set the sliding window size 119904 = 10 in this waywe will make full use of historical data
055 10 15 20 25
06
07
08
09
10
Det
ectio
n eff
ect
Window-width
PrecisionRecallF1-measure
Figure 4 Influence of sliding window size on the test results
There are different requirements for the threshold settingswhen the environment of wireless sensor networks differsWe change the value of three different thresholds and testthe accuracy of the anomalies under the change of singlethreshold the results are shown in Figure 5
From Figure 5 it can be concluded that it gets the highestdetection accuracy when temporal similarity threshold 120576 =01 spatial similarity threshold 120575 = 02 and attributecorrelation confidence threshold 120593 = 0544 Contrast Experiment In the contrast experiment we stilluse the IBRL dataset in which the number of sensor nodesis 54 and the deployment of nodes is shown in Figure 2We use (119879 119867 119871 119881) to represent four different attributestemperature humidity light intensity and voltage Sincethere are no interference factors in the dataset we add somefalse abnormal events artificially which are shown in Table 1
The contrast algorithms include the Adaptive Fault-Tolerant Event Detection (AFTED) algorithm proposed in
Journal of Electrical and Computer Engineering 7
01 02 03 04 05 06 07 08 09 10080
085
090
095
100
Prec
ision
Threshold value
Figure 5 Influence of the three thresholds on the test results
Table 1 False abnormal events
Number Event name Attributes Id of nodes1 Cooking 119879119867 119871 119881 2 372 Air-condition 119879119867 119881 5 17 24 36 443 Heater 119879 119881 11 12 134 Bath heater 119879 119871 119881 53 545 Humidifier 119867 27 28 29 30
[3] the Online Dynamic Event Region Detection (ODERD)algorithm proposed in [5] the Real-Time Event Detec-tion Approach based on Temporal-Spatial Correlations(TSCRED) presented in [6] and the Spatiotemporal Correla-tion based Fault-Tolerant Event Detection (STFTED) schemeproposed in [8] And we compare the detection accuracyfalse alarm rate and detection time of abnormal events
In the proposed algorithm we use the same parame-ter settings as the previous experiments In AFTED algo-rithm we set the window size for tolerating transient faults119872AFTED = 4 and the threshold for filtering transient faults120575AFTED = 075 which have been verified to be the mostappropriate in their experiment In ODERD algorithm sincewe only focus on the static abnormal event detection theparameters controlling the shift and deformation of eventregions are set to 0 s To compare these algorithms in anequivalent level we set the sliding window size of TSCREDand STFTED to 10 which is the same as the proposedalgorithm Besides all of the sensor nodes have the samecommunication range 119877 = 4 And each event region isassumed to be a circle with radius 119897 = 2119877
The results of the proposed algorithm compared with theother four algorithms in detection accuracy are shown inFigure 6 It can be seen from Figure 6 that when the nodefailure rate goes from 005 to 03 the detection accuracies ofthe five algorithms are similar reaching 096 or more this isbecausemost of the noise is filtered out in the time correlation
005 010 015 020 025 030 035 040 045 050088
090
092
094
096
098
100
Det
ectio
n ac
cura
cy
Sensor fault probability
AFTEDODERDTSCRED
STFTEDMACAED
Figure 6 Detection accuracy of five algorithms
005 010 015 020 025 030 035 040 045 05000
02
04
06
08
10Fa
lse al
arm
rate
Sensor fault probability
AFTEDODERDTSCRED
STFTEDMACAED
Figure 7 False alarm rate of five algorithms
detection phase When the node failure rate is greater than03 the detection accuracies of the five algorithms decreasesignificantly but the MACAED algorithm is significantlybetter than the other four algorithmsThe reason is that all thefive algorithms have the spatial correlation detection stageWith the increase of the failure rate the faulty nodes areeasily affected by the neighbor nodes which have not detectedthe abnormal events and they are converted into the normalstate thereforemisjudging that no abnormal events occurred
As for the false alarm rate these compared results areshown in Figure 7 It can be seen that MACAED has a signif-icantly lower false alarm rate than the other four algorithmsas the node failure rate increases This is due to the fact thatMACAED fully considers the impact of attribute correlationson abnormal event detection By calculating the attribute
8 Journal of Electrical and Computer Engineering
Table 2 Running time of five algorithms
Algorithms Time(s)AFTED 8381ODERD 7647TSCRED 7435STFTED 10917MACAED 12546
correlation confidence the fitting degree between the datarecords and the abnormal event attribute dependency modelcan be determined so the abnormal event and interferencefactor can be distinguished effectively
The running time of the five algorithms is shown inTable 2
It can be seen from Table 2 that the MACAED algorithmconsumes the longest time The reason is that the MACAEDalgorithm needs to train the network structure at the begin-ning This process takes about 5 s on average If the trainednetwork structure is saved as the known result the detectionphase needs 12546 minus 5 = 7546 s which is very close toTSCRED algorithm and ODRED algorithm
5 Conclusion
In this paper we present a new approach to detect abnormalevents in wireless sensor networks We construct a depen-dency model of observed attributes based on Bayesian net-work and propose a newmethod to measure the dependencyof the attributes Combining with the temporal correlationdetection based on sliding window and the spatial correlationdetection based on neighbor node information the influenceof noise and interference event factors on event detectionresults is effectively reduced Experimental results show thatthe algorithm proposed in this paper can effectively eliminatethe influence of interference events It not only reduces thefalse alarm rate of abnormal events but also improves theaccuracy of event detection compared with the other fouralgorithms
Conflicts of Interest
The authors declare that there are no conflicts of interestregarding the publication of this paper
Acknowledgments
This work is sponsored by Innovative Fund Project of Scienceand Technology Enterprises of Jiangsu Province in China noBC2014212
References
[1] Y Zhang N Meratnia and P Havinga ldquoOutlier detection tech-niques for wireless sensor networks a surveyrdquo IEEE Communi-cations Surveys and Tutorials vol 12 no 2 pp 159ndash170 2010
[2] A De Paola S Gaglio G L Re F Milazzo and M OrtolanildquoAdaptive distributed outlier detection for WSNsrdquo IEEE Trans-actions on Cybernetics vol 45 no 5 pp 888ndash899 2015
[3] S-J Yim and Y-H Choi ldquoAn adaptive fault-tolerant eventdetection scheme for wireless sensor networksrdquo Sensors vol 10no 3 pp 2332ndash2347 2010
[4] Y Wang D Wang F Chen and W Fang ldquoEfficient eventdetection using self-learning threshold for wireless sensornetworksrdquoWireless Networks vol 21 no 6 pp 1783ndash1799 2014
[5] T Wu and Q Cheng ldquoOnline dynamic event region detec-tion using distributed sensor networksrdquo IEEE Transactions onAerospace and Electronic Systems vol 50 no 1 pp 393ndash4052014
[6] F Li and Z Feng ldquoAn efficient real-time event detectionapproach based on temporal-spatial correlations in wirelesssensor networksrdquo in Proceedings of the International Conferenceon Computer Science and Network Technology (ICCSNT rsquo11) pp1245ndash1249 December 2011
[7] J Yin D H Hu and Q Yang ldquoSpatio-temporal event detectionusing dynamic conditional random fieldsrdquo in Proceedings ofthe 21st International Joint Conference on Artificial Intelligence(IJCAI rsquo09) pp 1321ndash1326 IEEE Pasadena Calif USA July2009
[8] K Liu Y Zhuang Z Wang and J Ma ldquoSpatiotemporal cor-relation based fault-tolerant event detection in wireless sensornetworksrdquo International Journal of Distributed Sensor Networksvol 2015 Article ID 643570 2015
[9] C Luo J-G Lou Q Lin et al ldquoCorrelating events with timeseries for incident diagnosisrdquo in Proceedings of the 20th ACMSIGKDD International Conference on Knowledge Discovery andData Mining (KDD rsquo14) pp 1583ndash1592 August 2014
[10] K-Z Liu Y Zhuang S-L Zhou and S-J Liu ldquoEvent detectionmethod based on belief model for wireless sensor networksrdquoJournal of Beijing University of Posts and Telecommunicationsvol 38 no 1 pp 61ndash66 2015
[11] D Heckerman ldquoBayesian networks for data miningrdquo DataMining and Knowledge Discovery vol 1 no 1 pp 79ndash119 1997
[12] G F Cooper and E Herskovits ldquoA Bayesian method forthe induction of probabilistic networks from datardquo MachineLearning vol 9 no 4 pp 309ndash347 1992
[13] IBRL ldquoIntel Lab Data[EBOL]rdquo 2004 httpdblcsmitedulabdatalabdatahtml
RoboticsJournal of
Hindawi Publishing Corporationhttpwwwhindawicom Volume 2014
Hindawi Publishing Corporationhttpwwwhindawicom Volume 2014
Active and Passive Electronic Components
Control Scienceand Engineering
Journal of
Hindawi Publishing Corporationhttpwwwhindawicom Volume 2014
International Journal of
RotatingMachinery
Hindawi Publishing Corporationhttpwwwhindawicom Volume 2014
Hindawi Publishing Corporation httpwwwhindawicom
Journal of
Volume 201
Submit your manuscripts athttpswwwhindawicom
VLSI Design
Hindawi Publishing Corporationhttpwwwhindawicom Volume 201
Hindawi Publishing Corporationhttpwwwhindawicom Volume 2014
Shock and Vibration
Hindawi Publishing Corporationhttpwwwhindawicom Volume 2014
Civil EngineeringAdvances in
Acoustics and VibrationAdvances in
Hindawi Publishing Corporationhttpwwwhindawicom Volume 2014
Hindawi Publishing Corporationhttpwwwhindawicom Volume 2014
Electrical and Computer Engineering
Journal of
Advances inOptoElectronics
Hindawi Publishing Corporation httpwwwhindawicom
Volume 2014
The Scientific World JournalHindawi Publishing Corporation httpwwwhindawicom Volume 2014
SensorsJournal of
Hindawi Publishing Corporationhttpwwwhindawicom Volume 2014
Modelling amp Simulation in EngineeringHindawi Publishing Corporation httpwwwhindawicom Volume 2014
Hindawi Publishing Corporationhttpwwwhindawicom Volume 2014
Chemical EngineeringInternational Journal of Antennas and
Propagation
International Journal of
Hindawi Publishing Corporationhttpwwwhindawicom Volume 2014
Hindawi Publishing Corporationhttpwwwhindawicom Volume 2014
Navigation and Observation
International Journal of
Hindawi Publishing Corporationhttpwwwhindawicom Volume 2014
DistributedSensor Networks
International Journal of
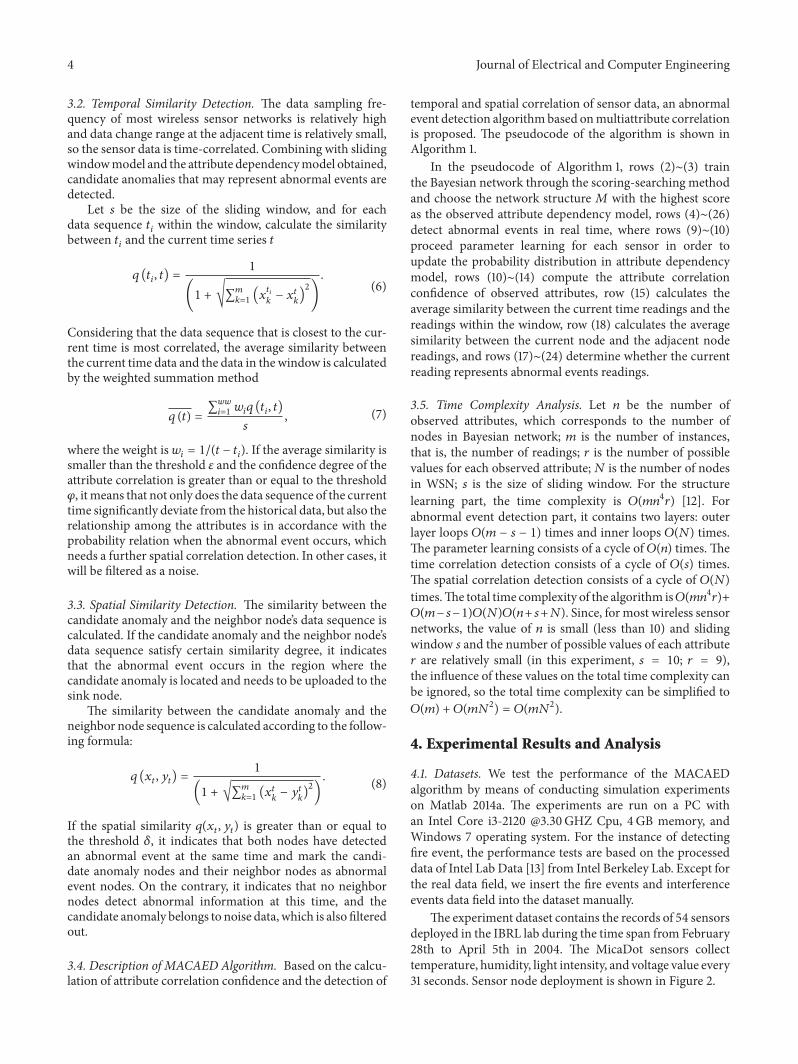
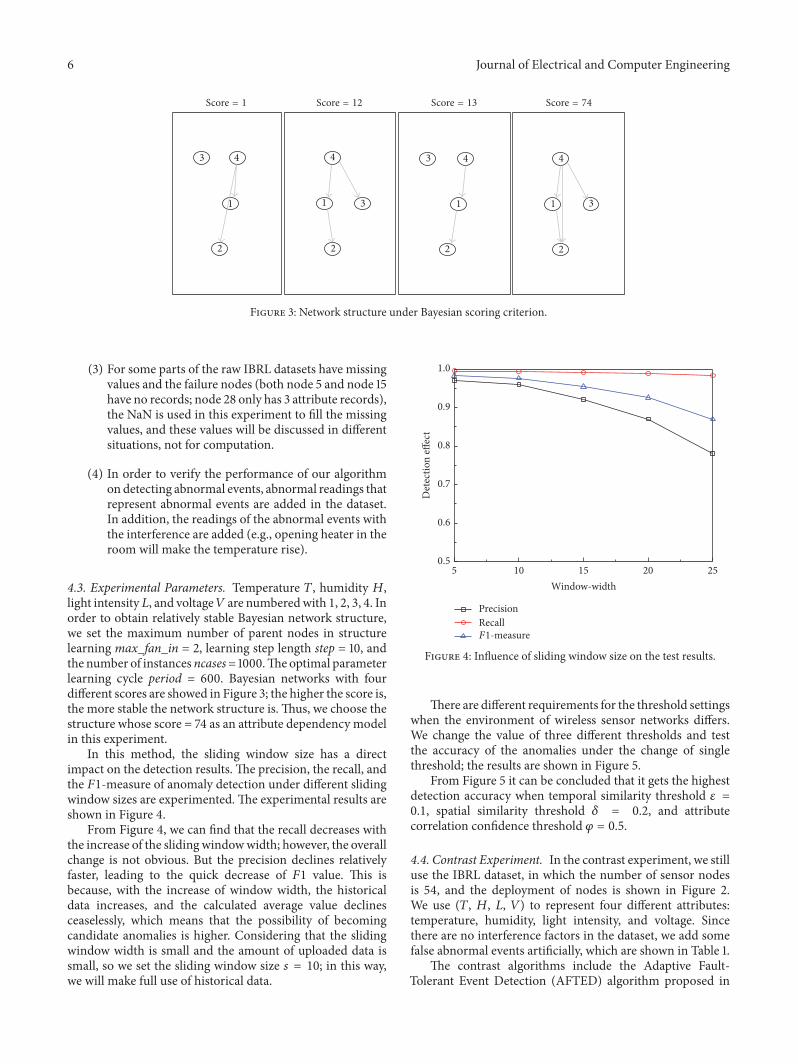
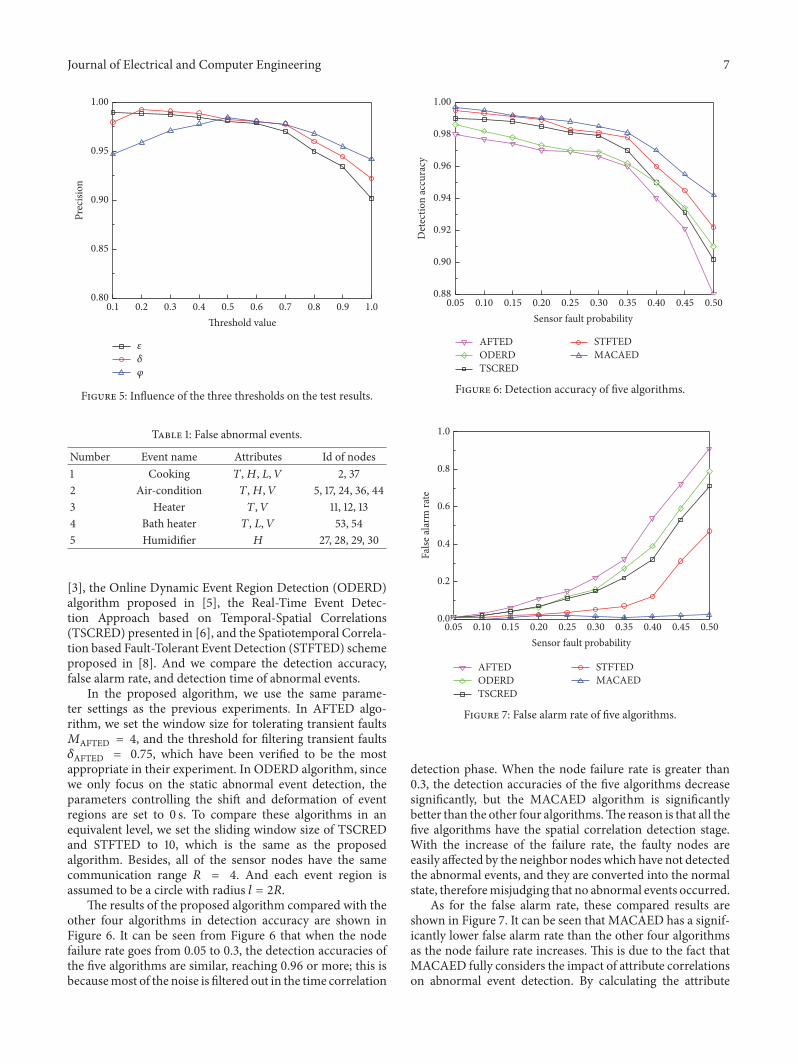
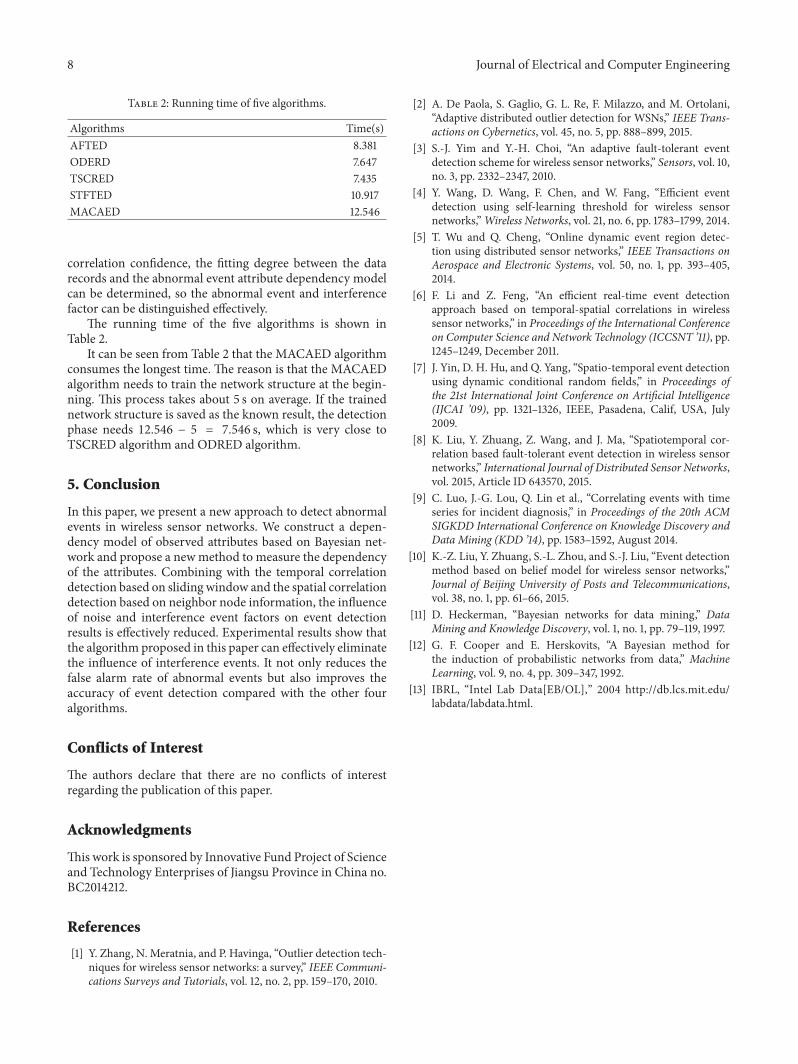